
Effect of Temperature and Wind Speed on Efficiency of Five Photovoltaic Module Technologies for Different Climatic Zones
 ,
,  ,
,  ,
,
Abstract
:1. Introduction
2. Solar Radiation Data
3. Materials and Methods
4. Results
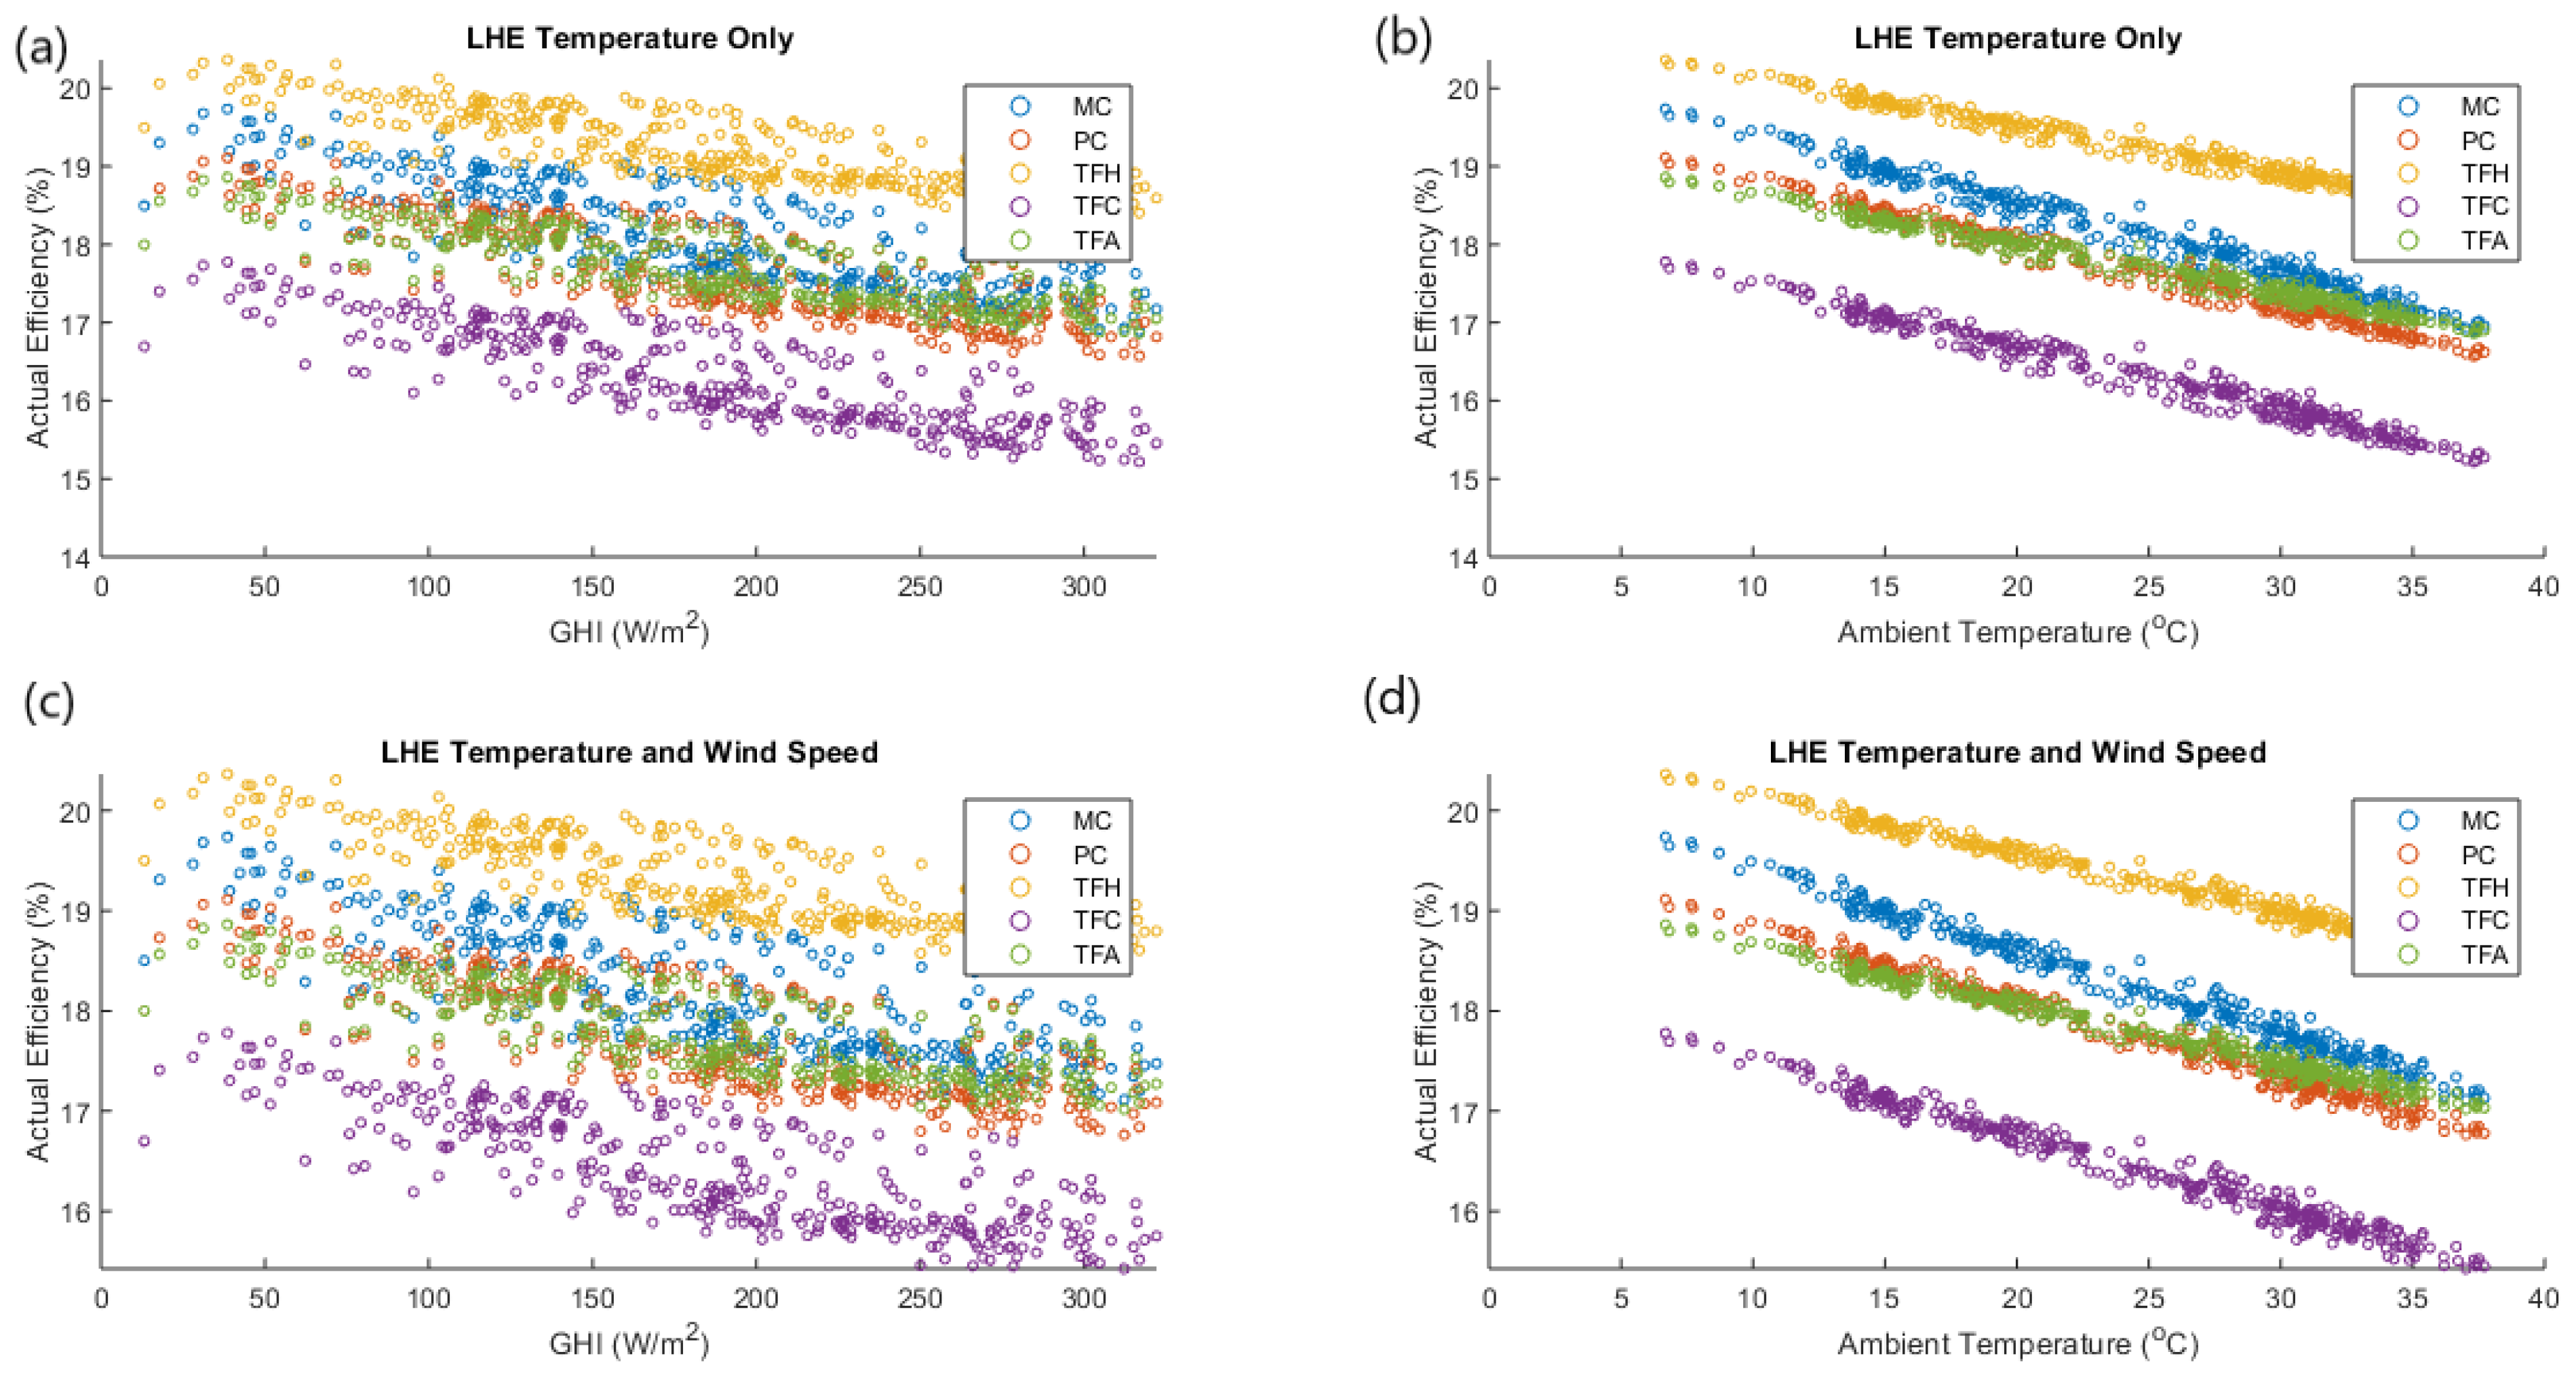
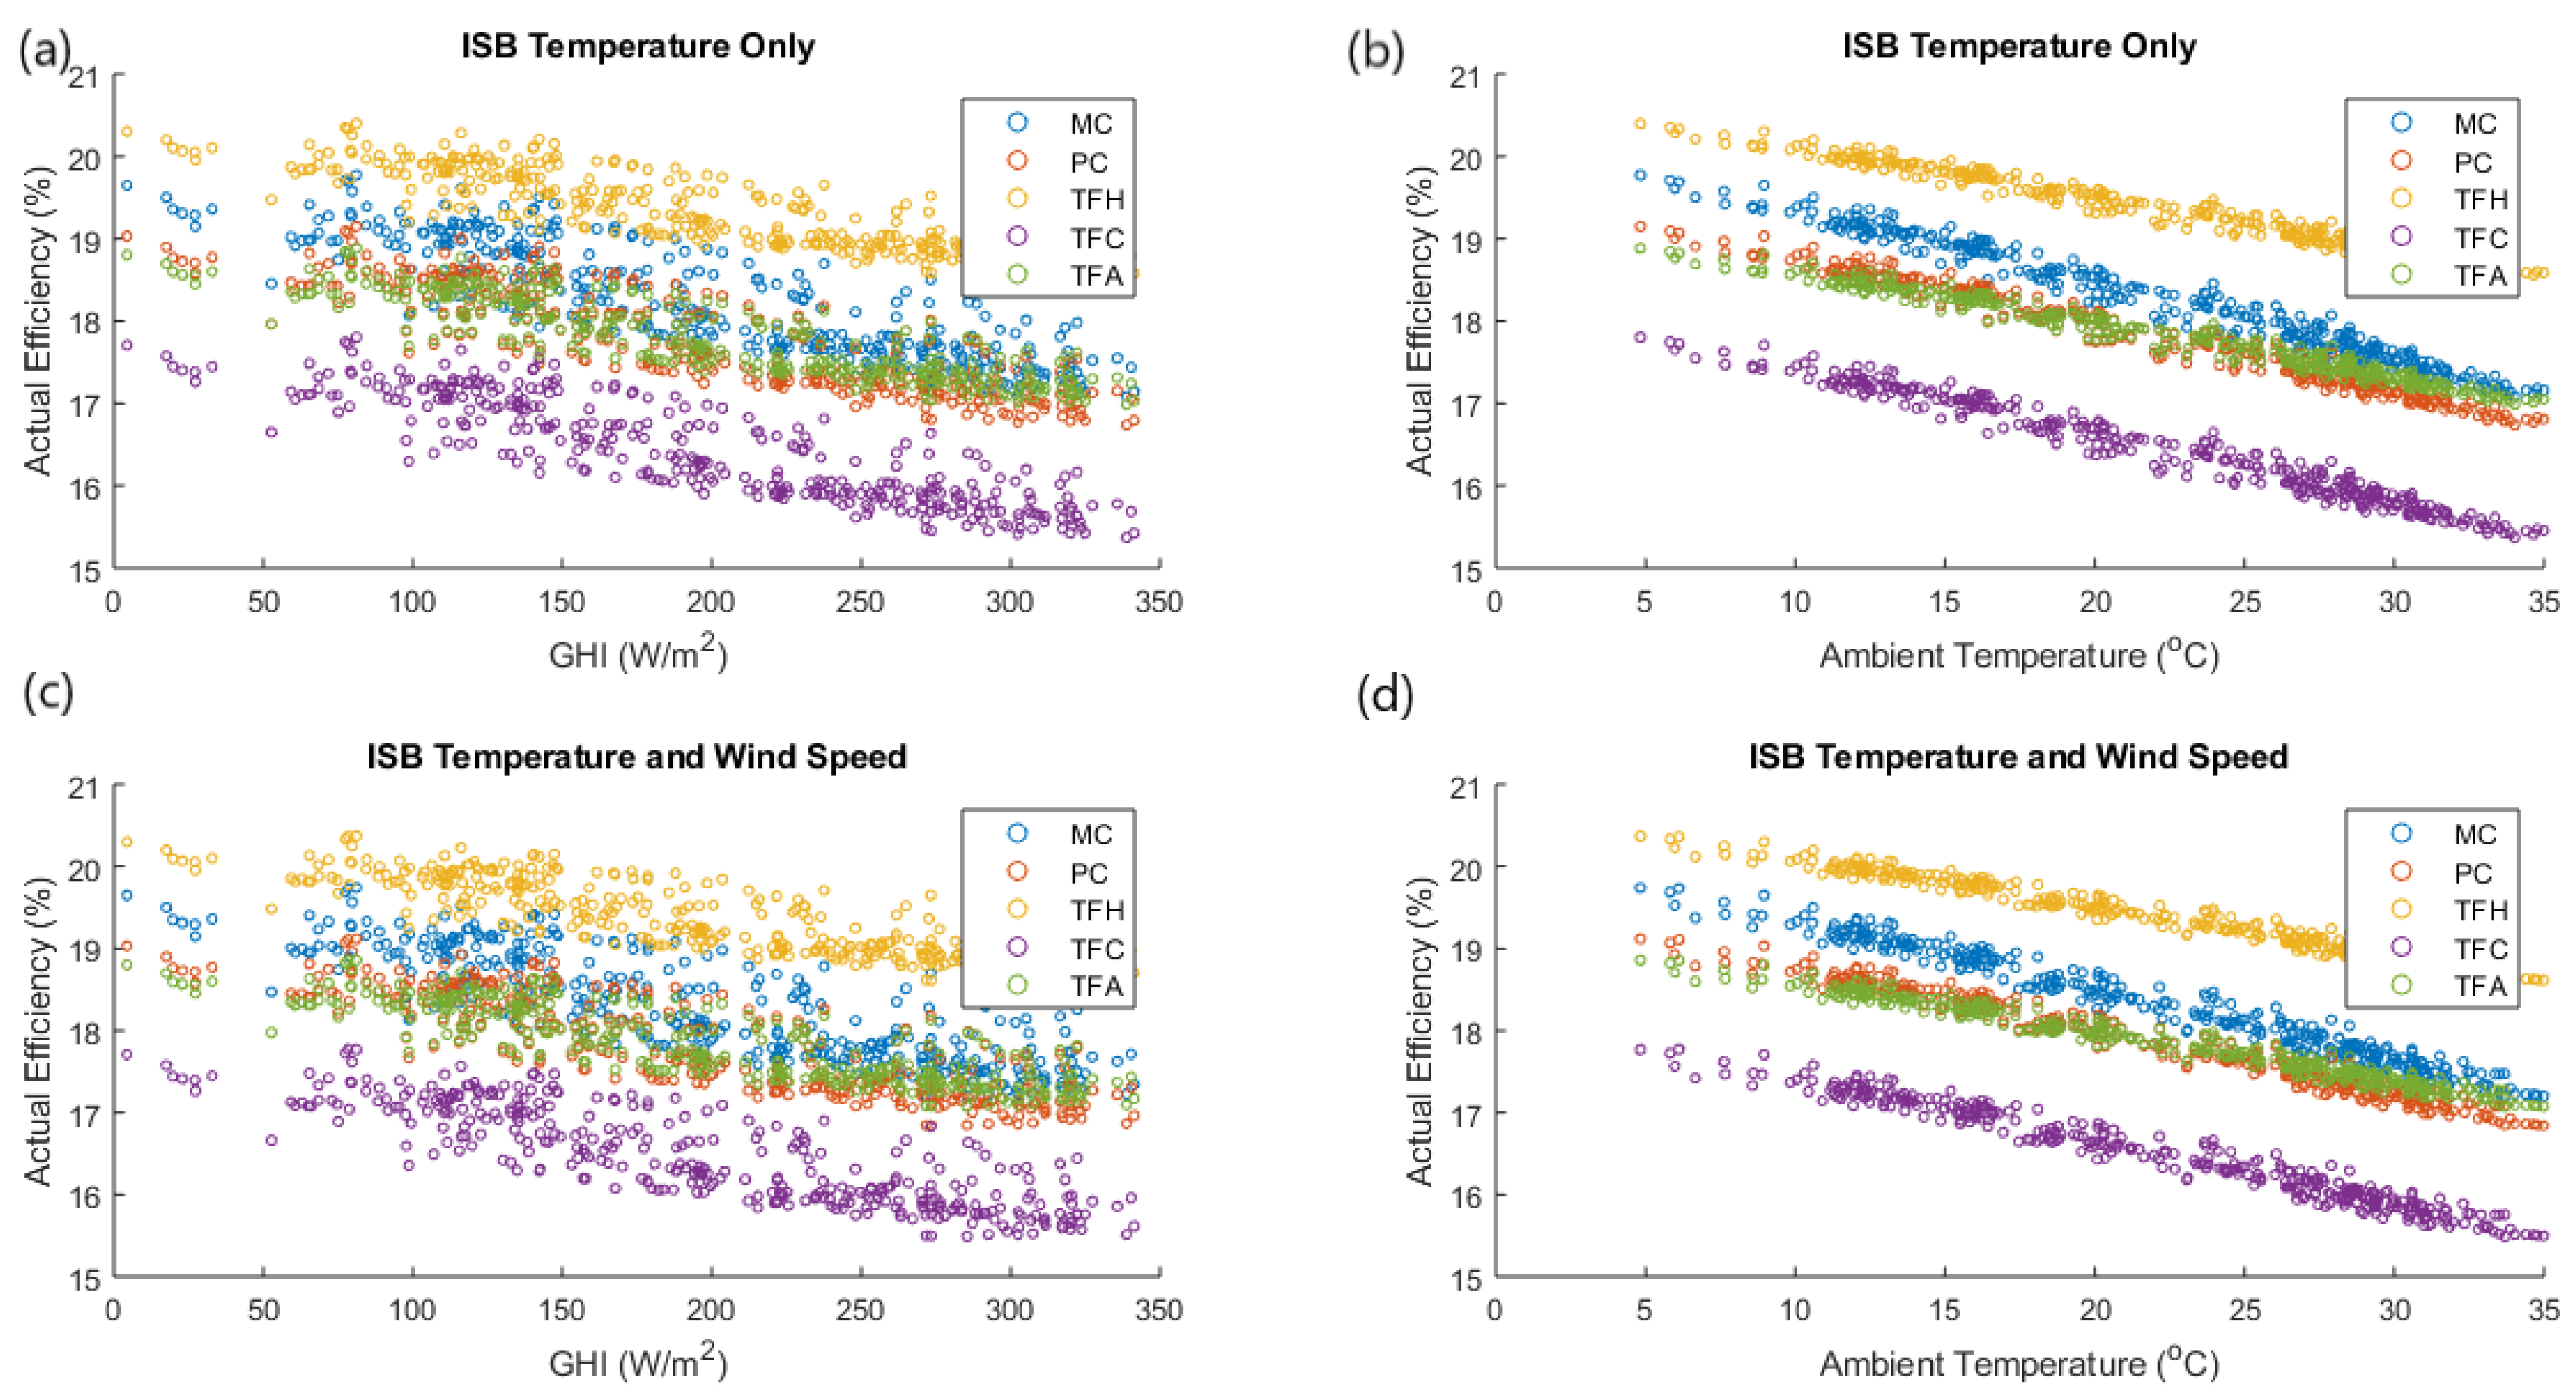
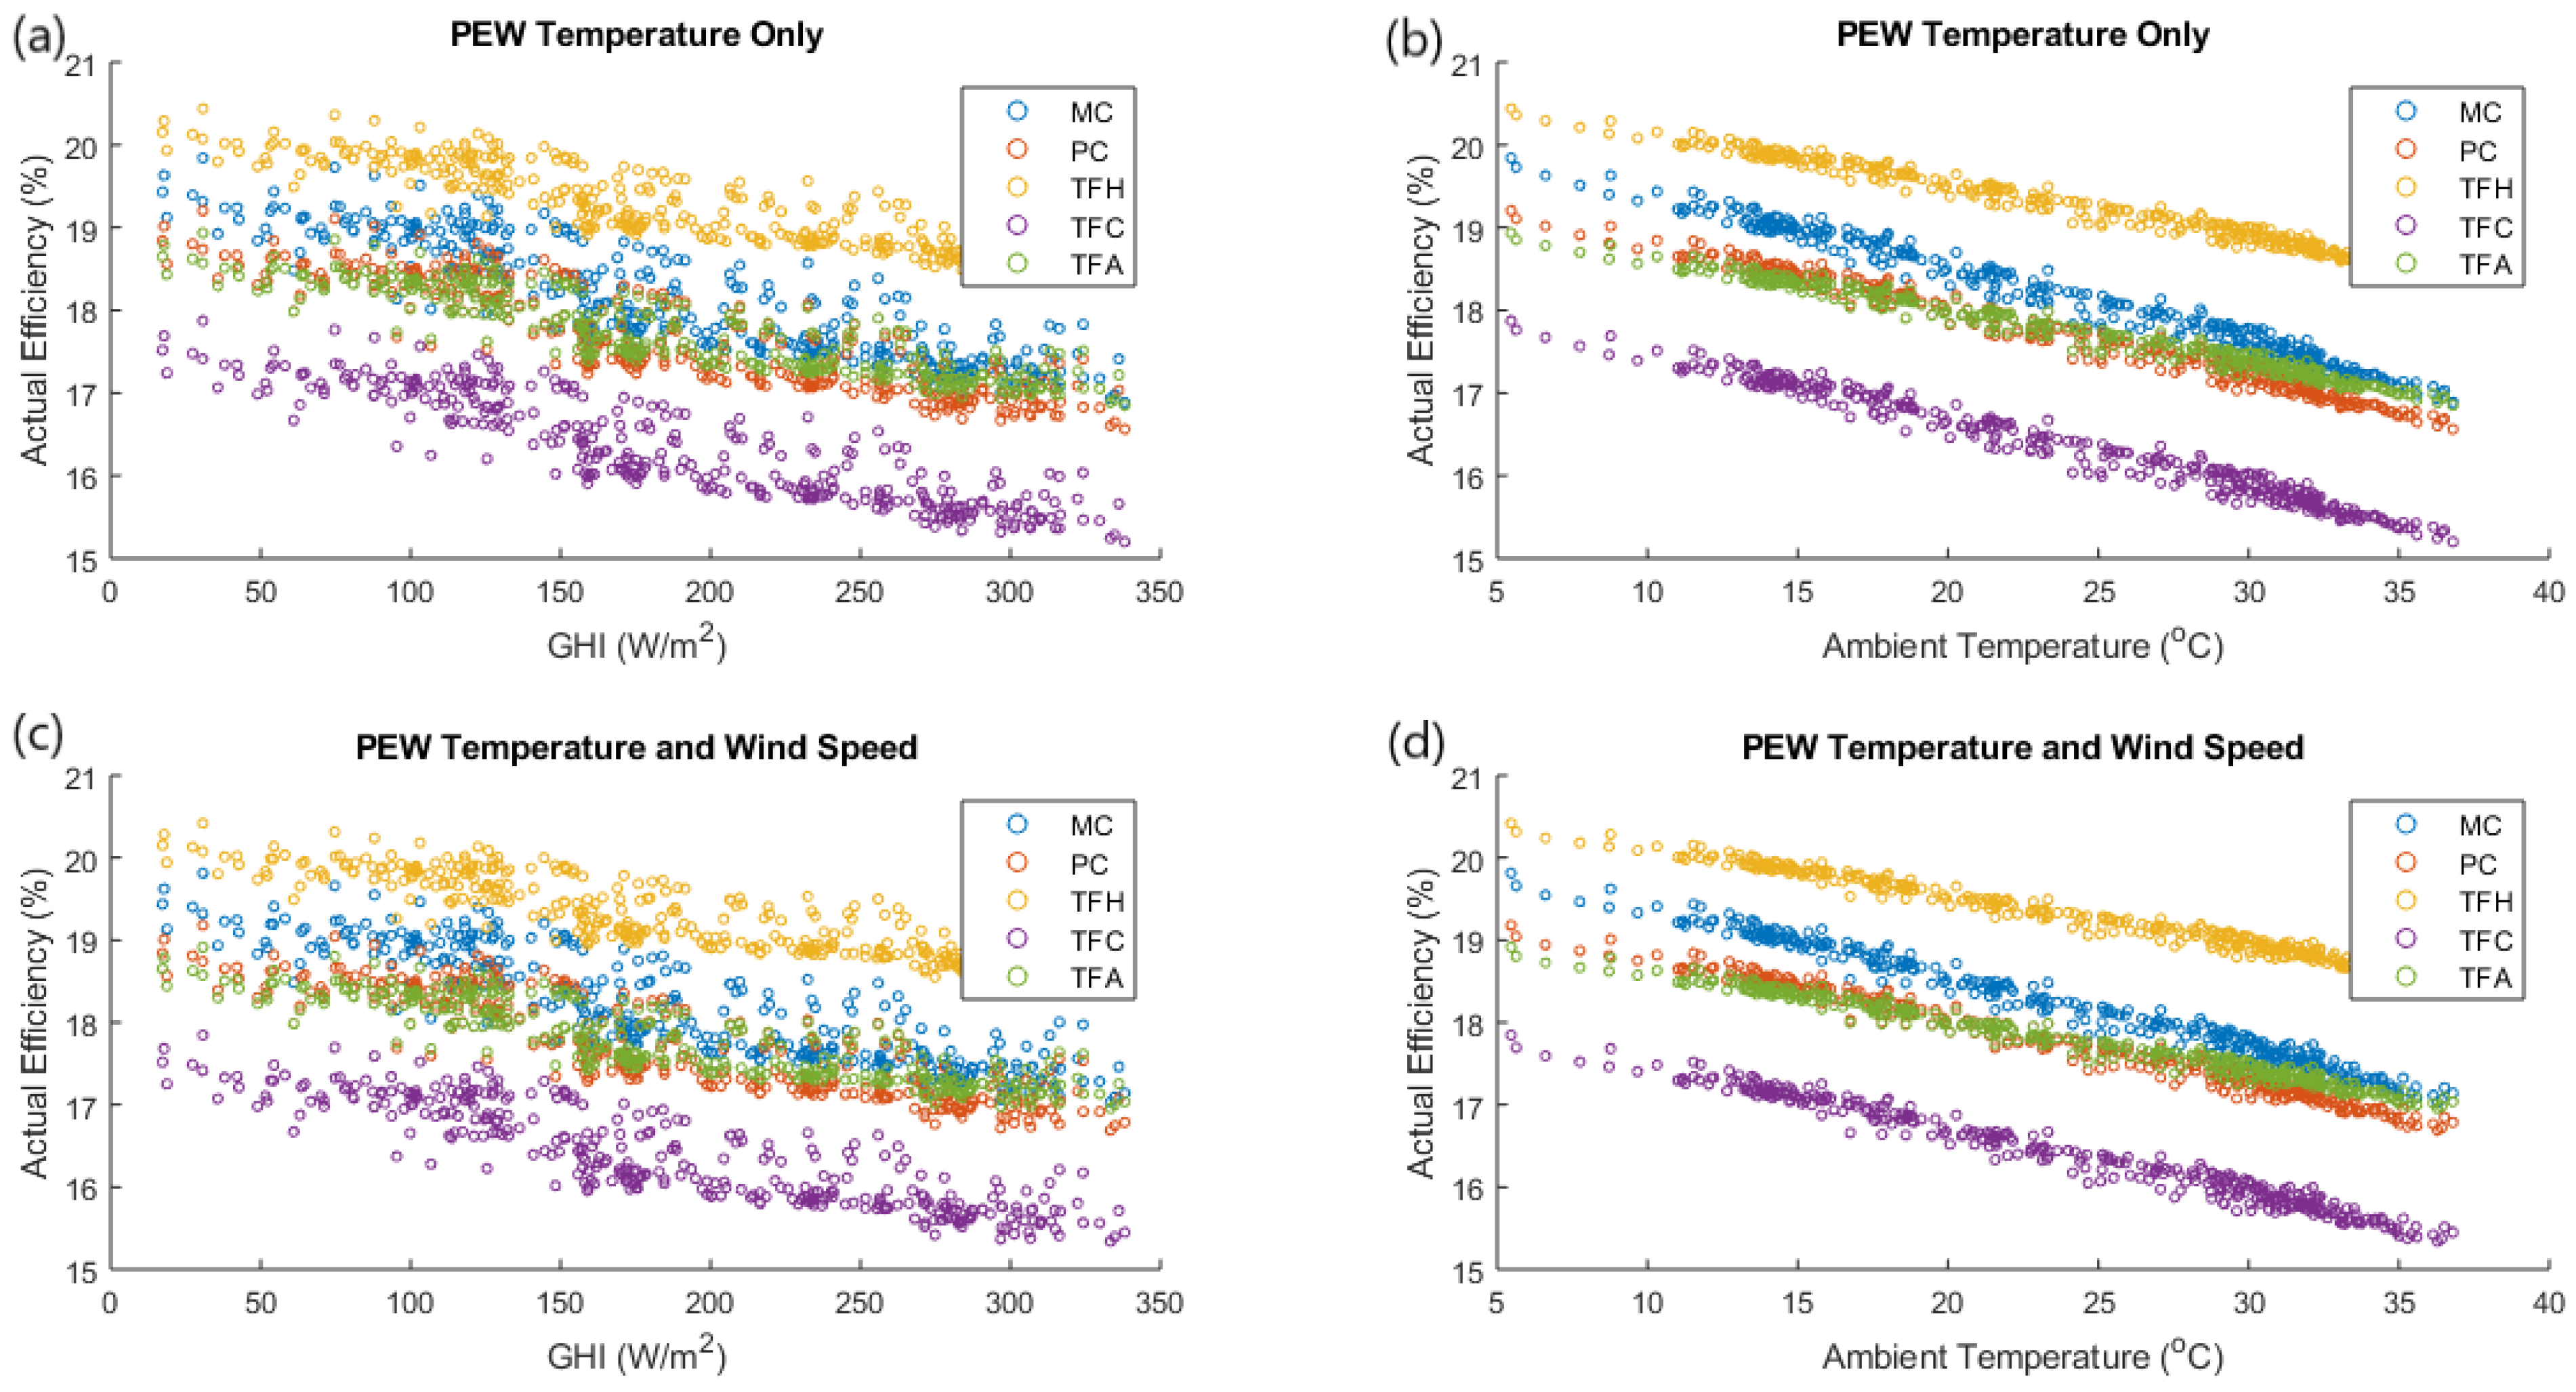
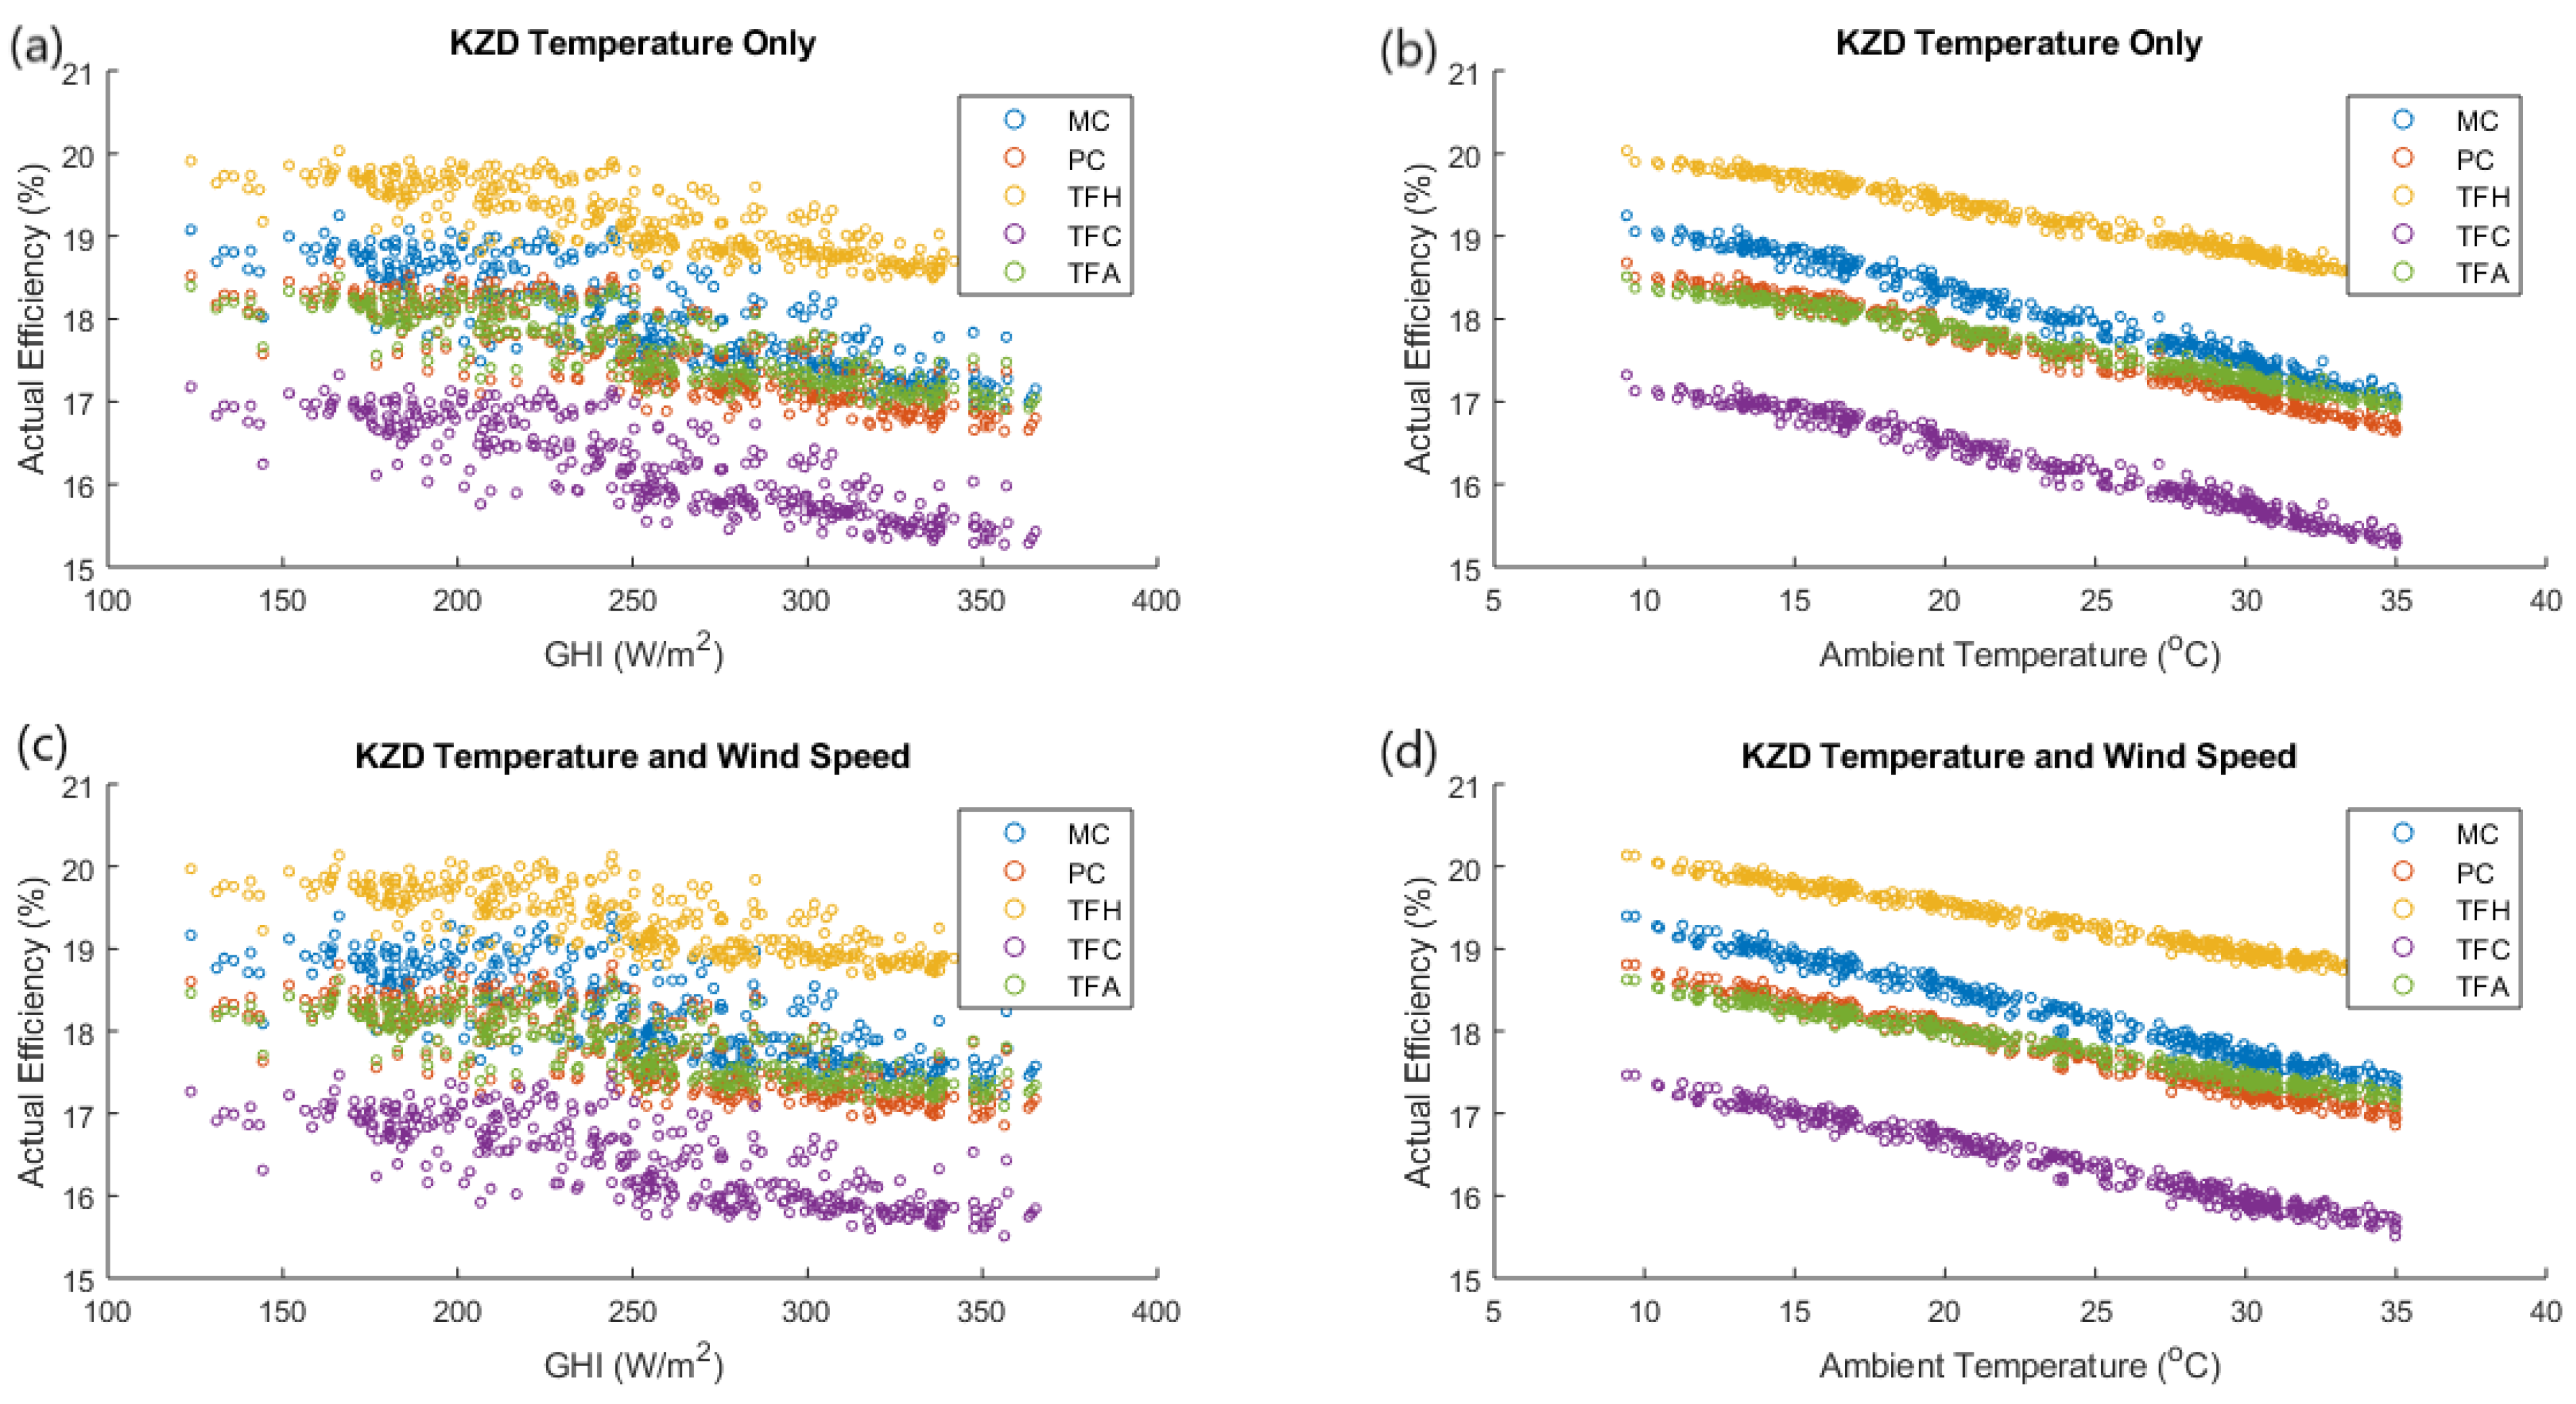
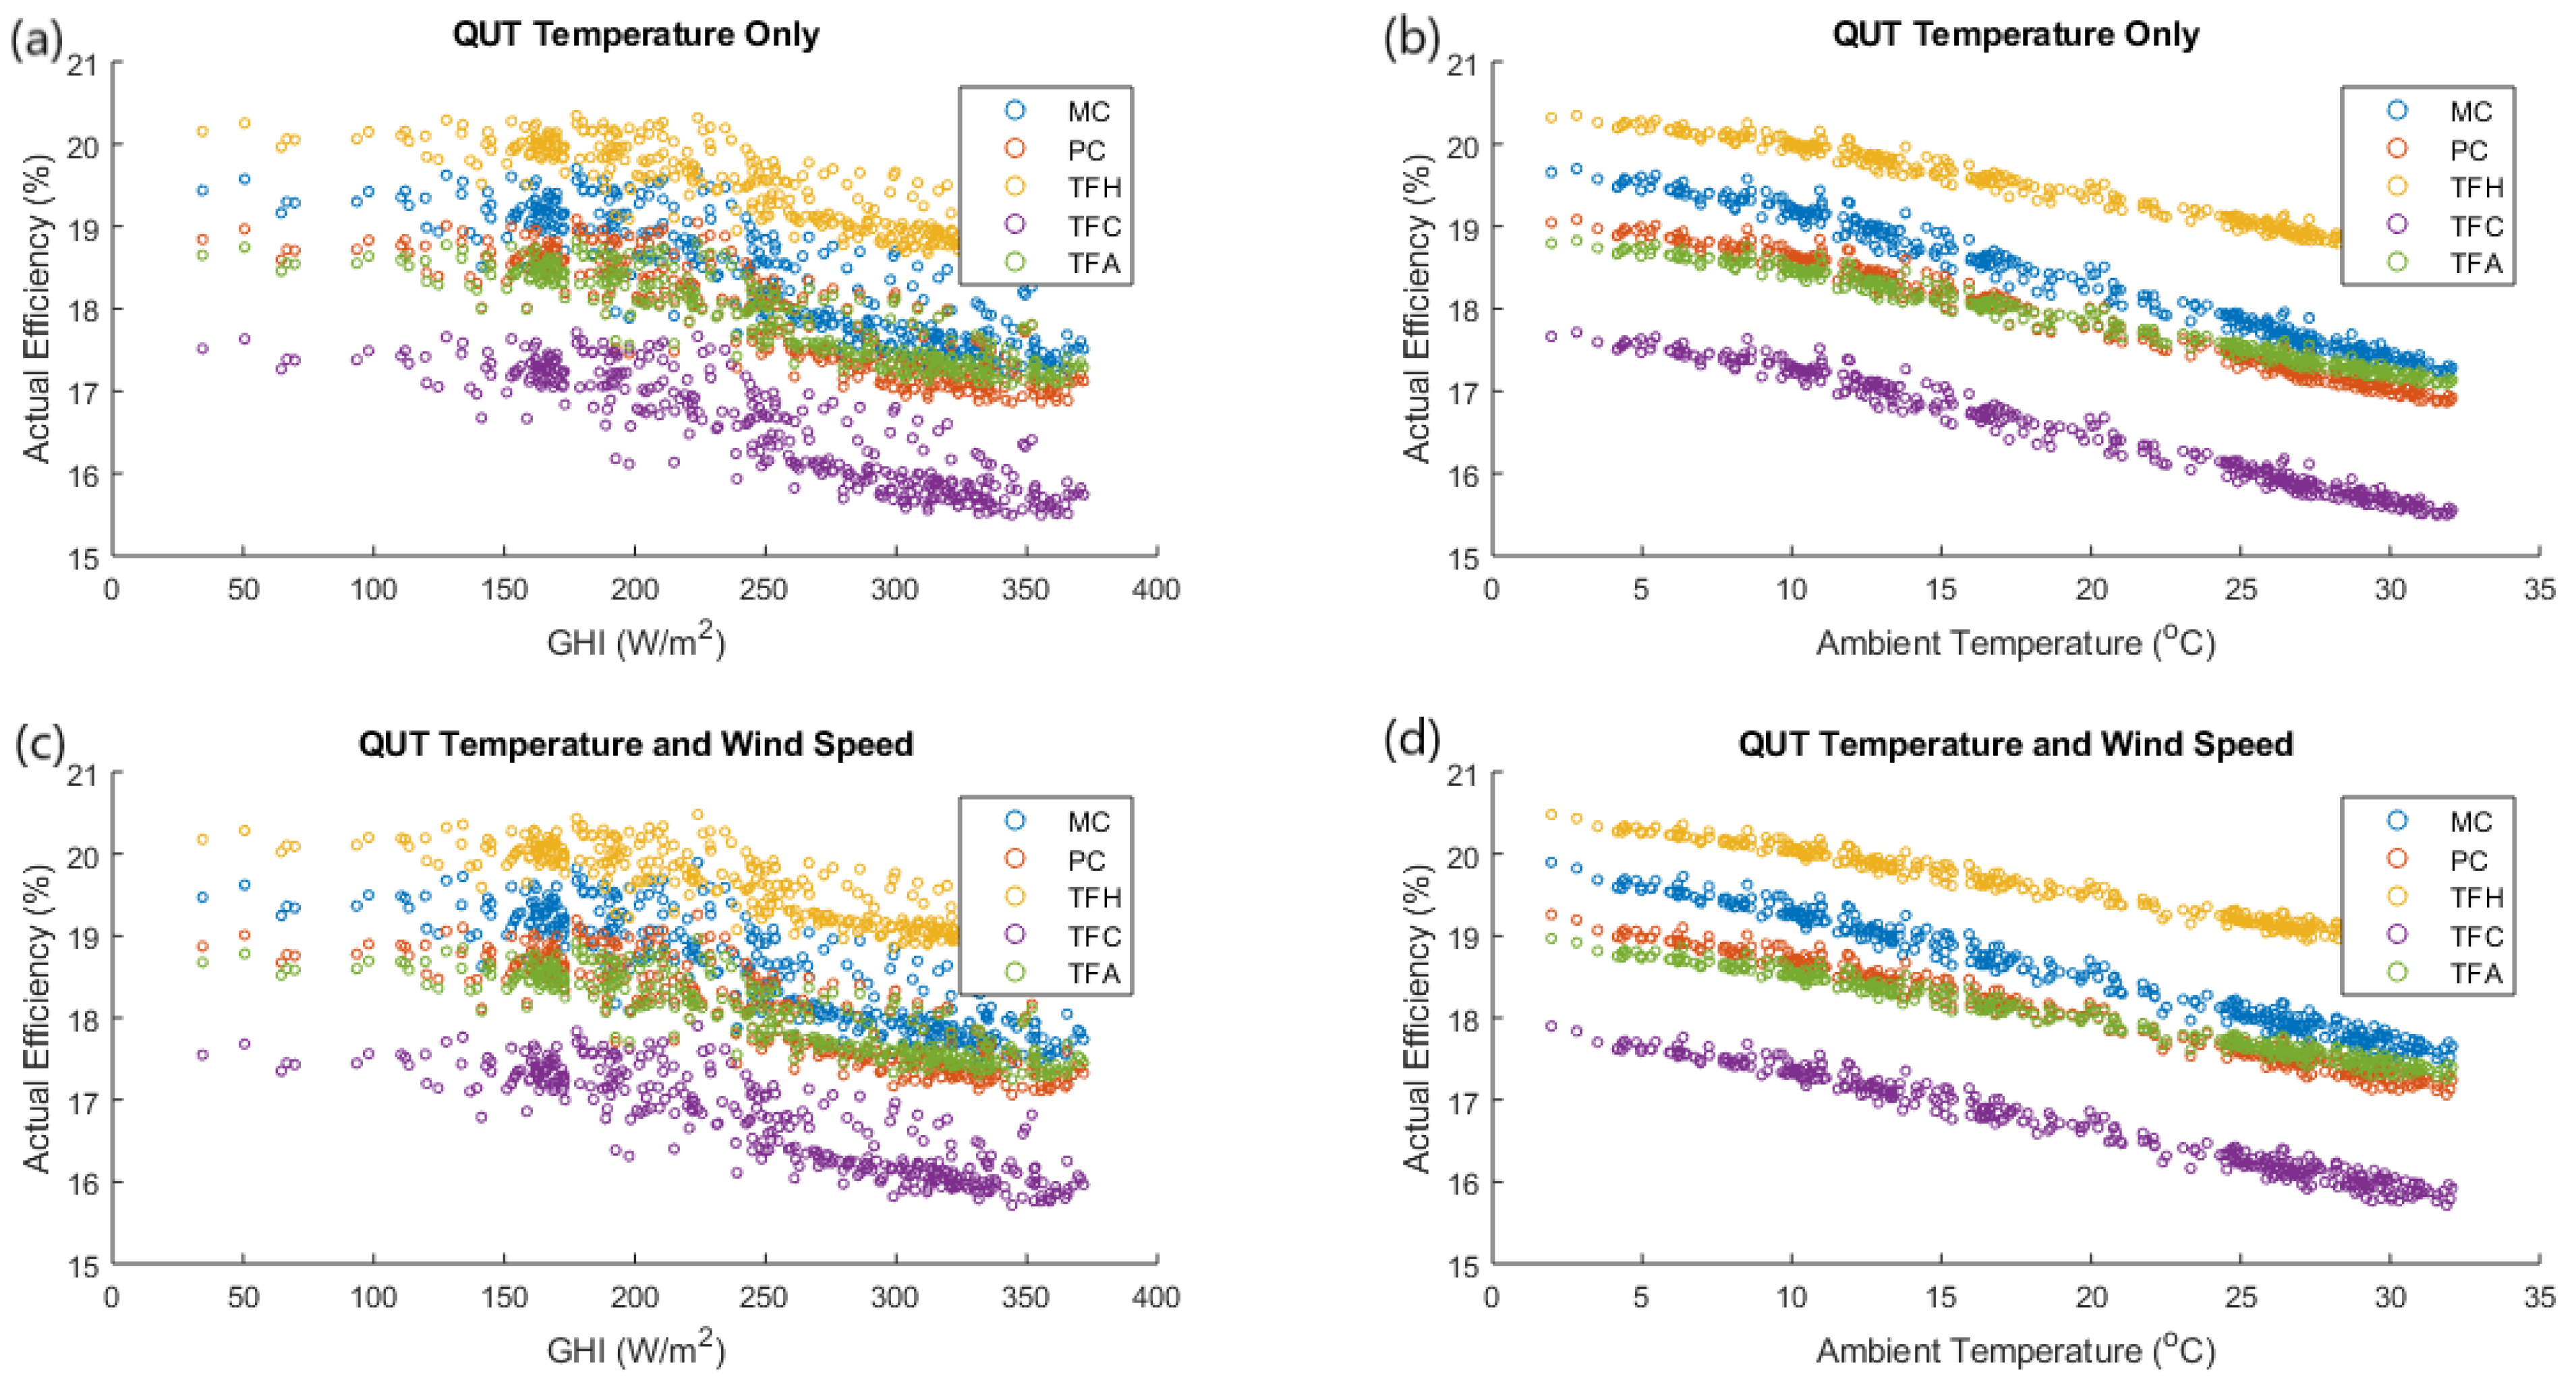
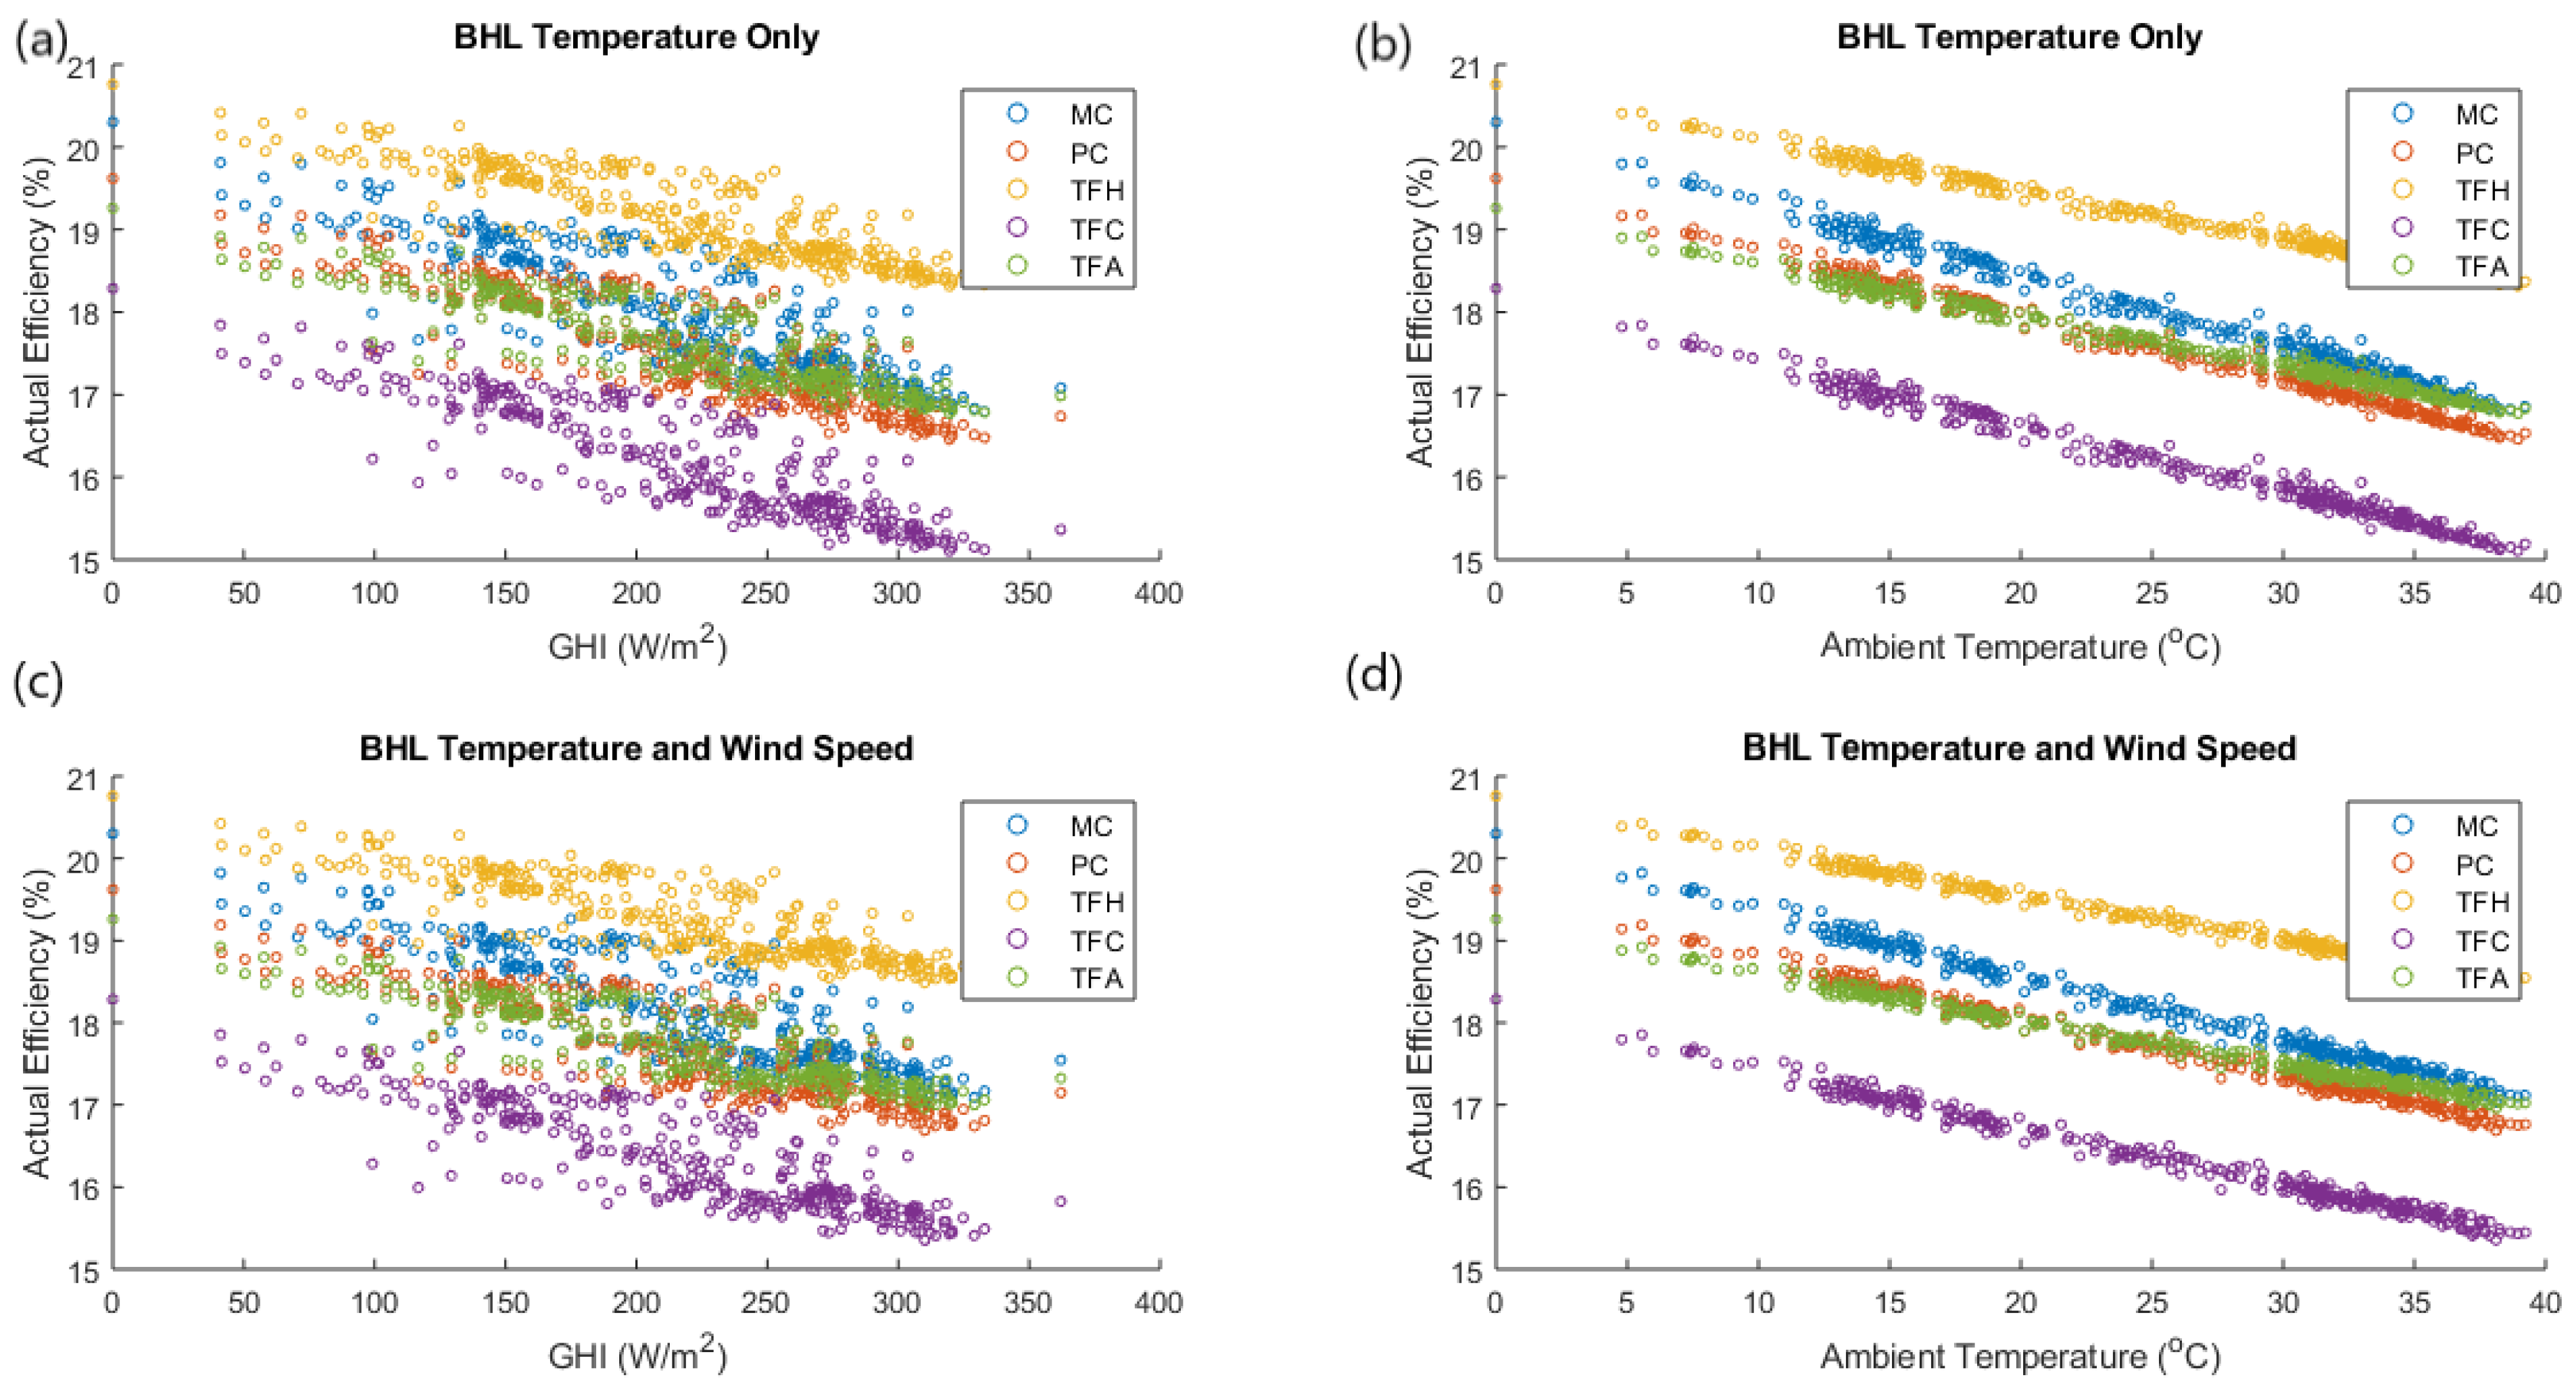
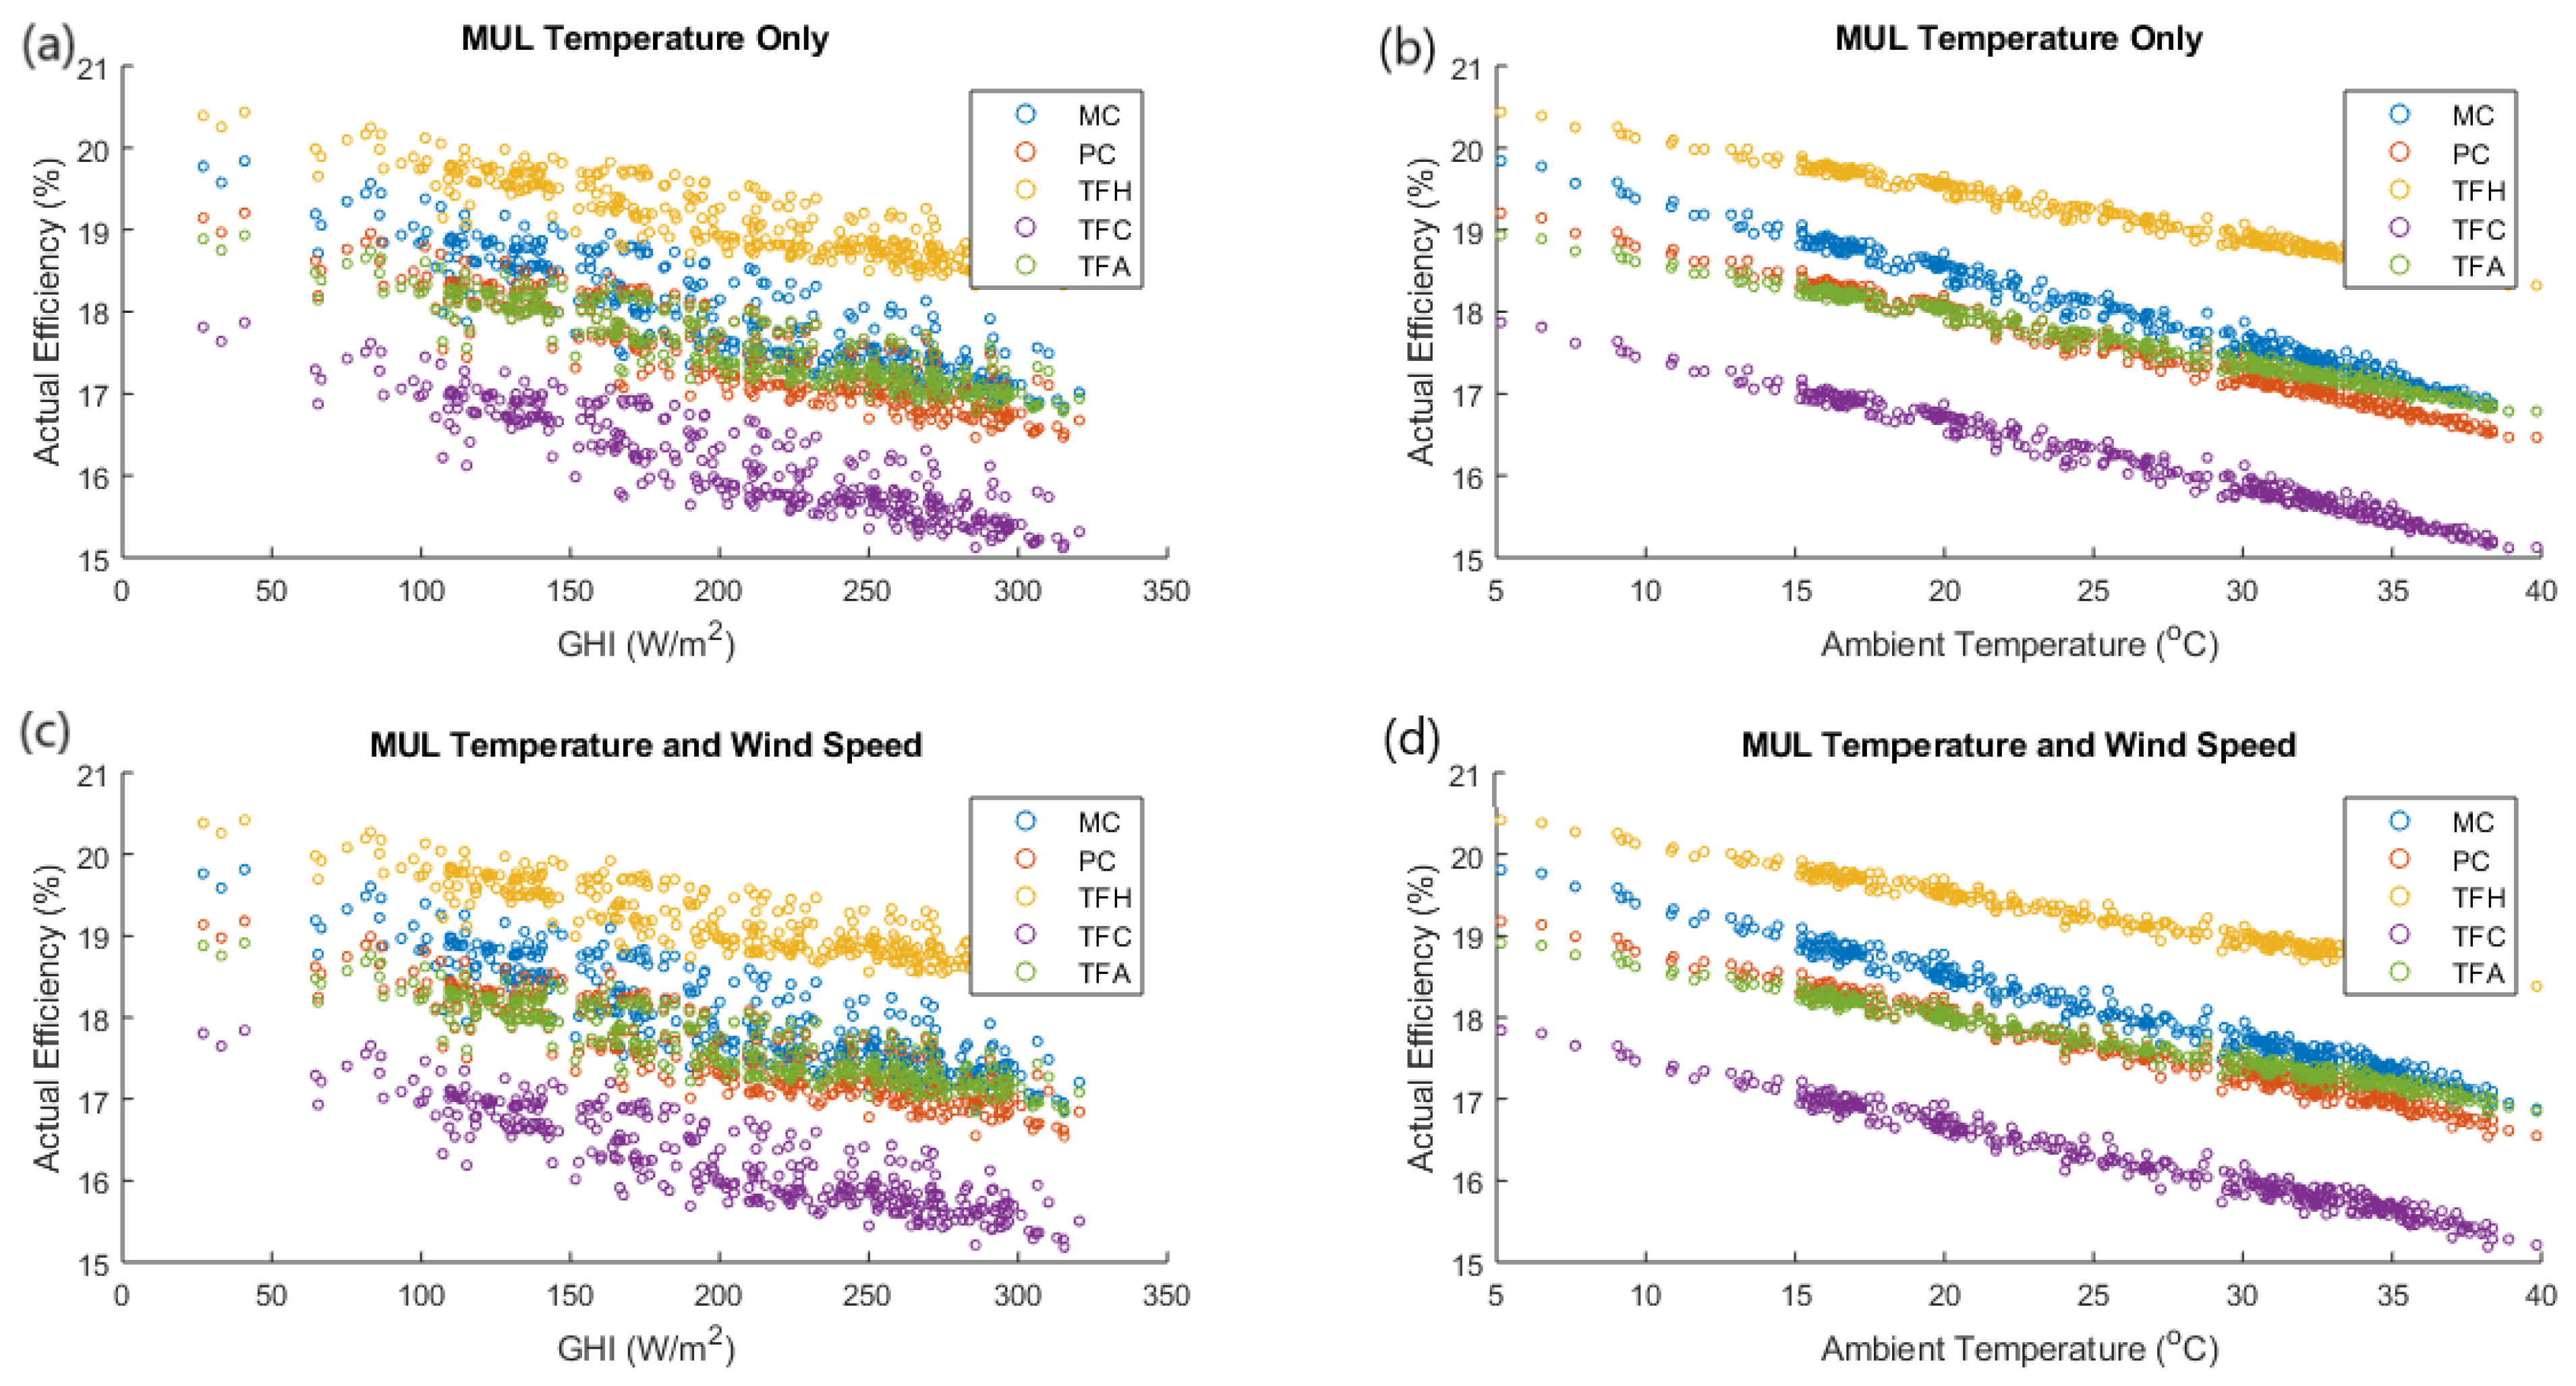
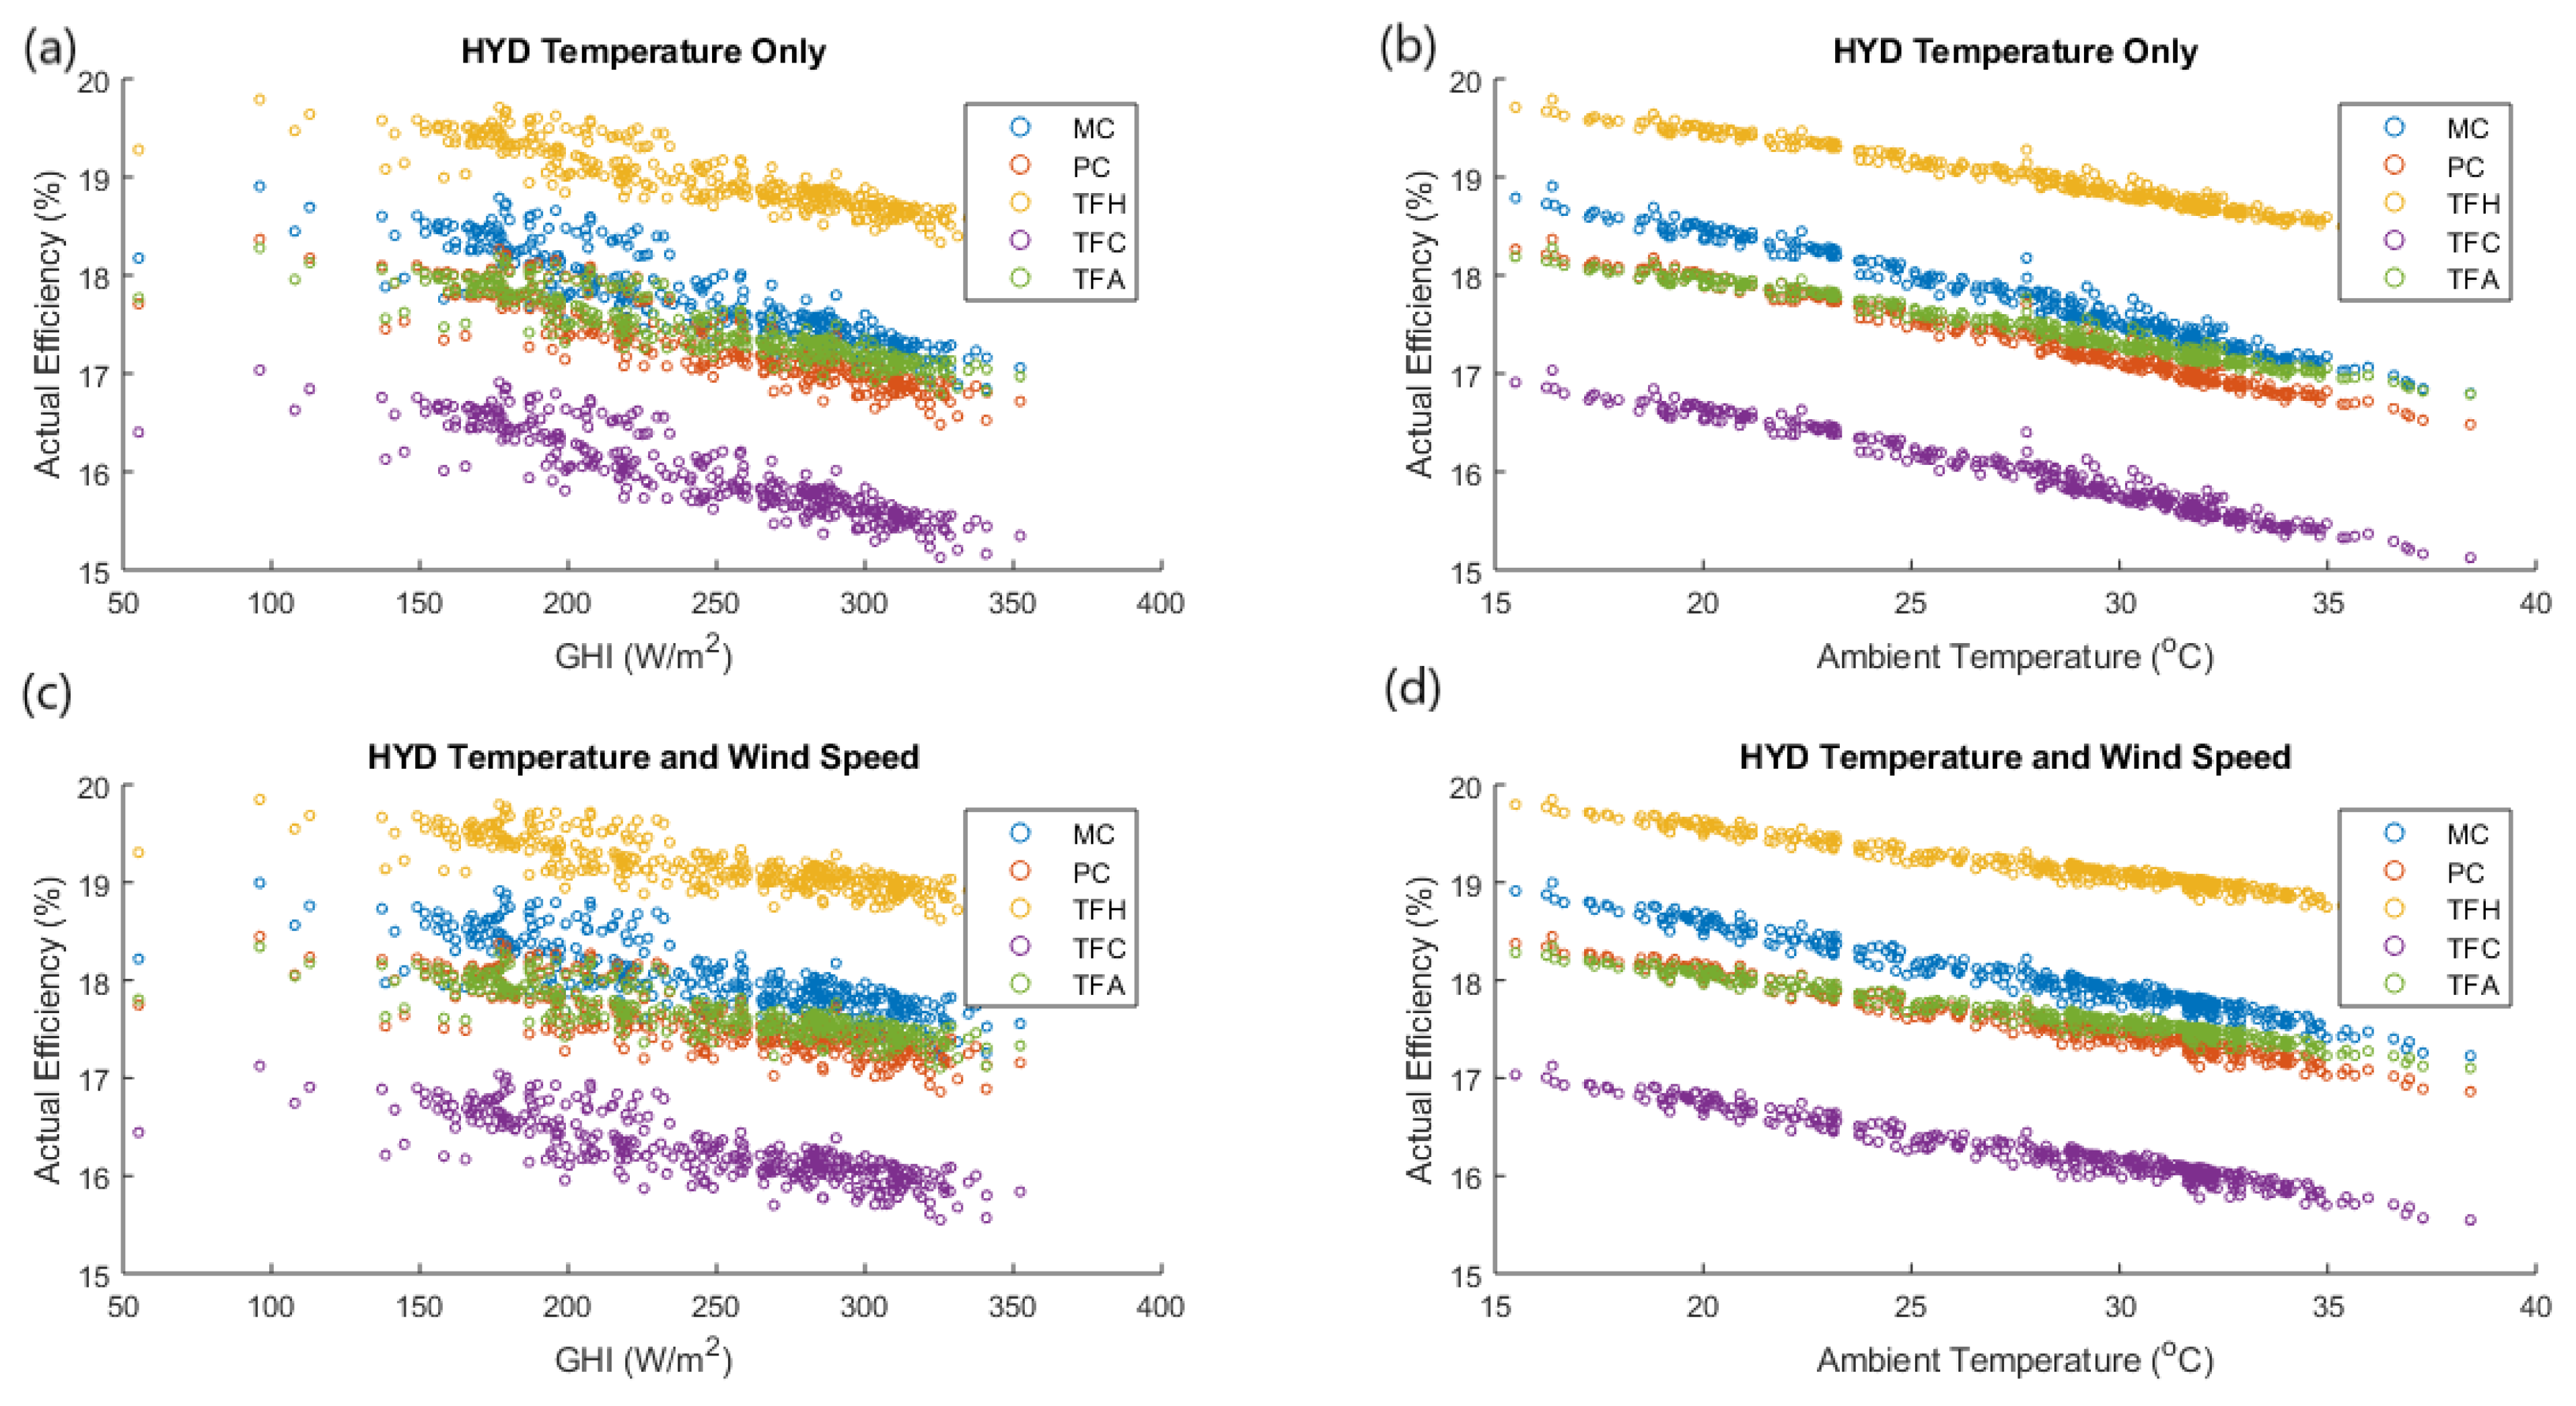
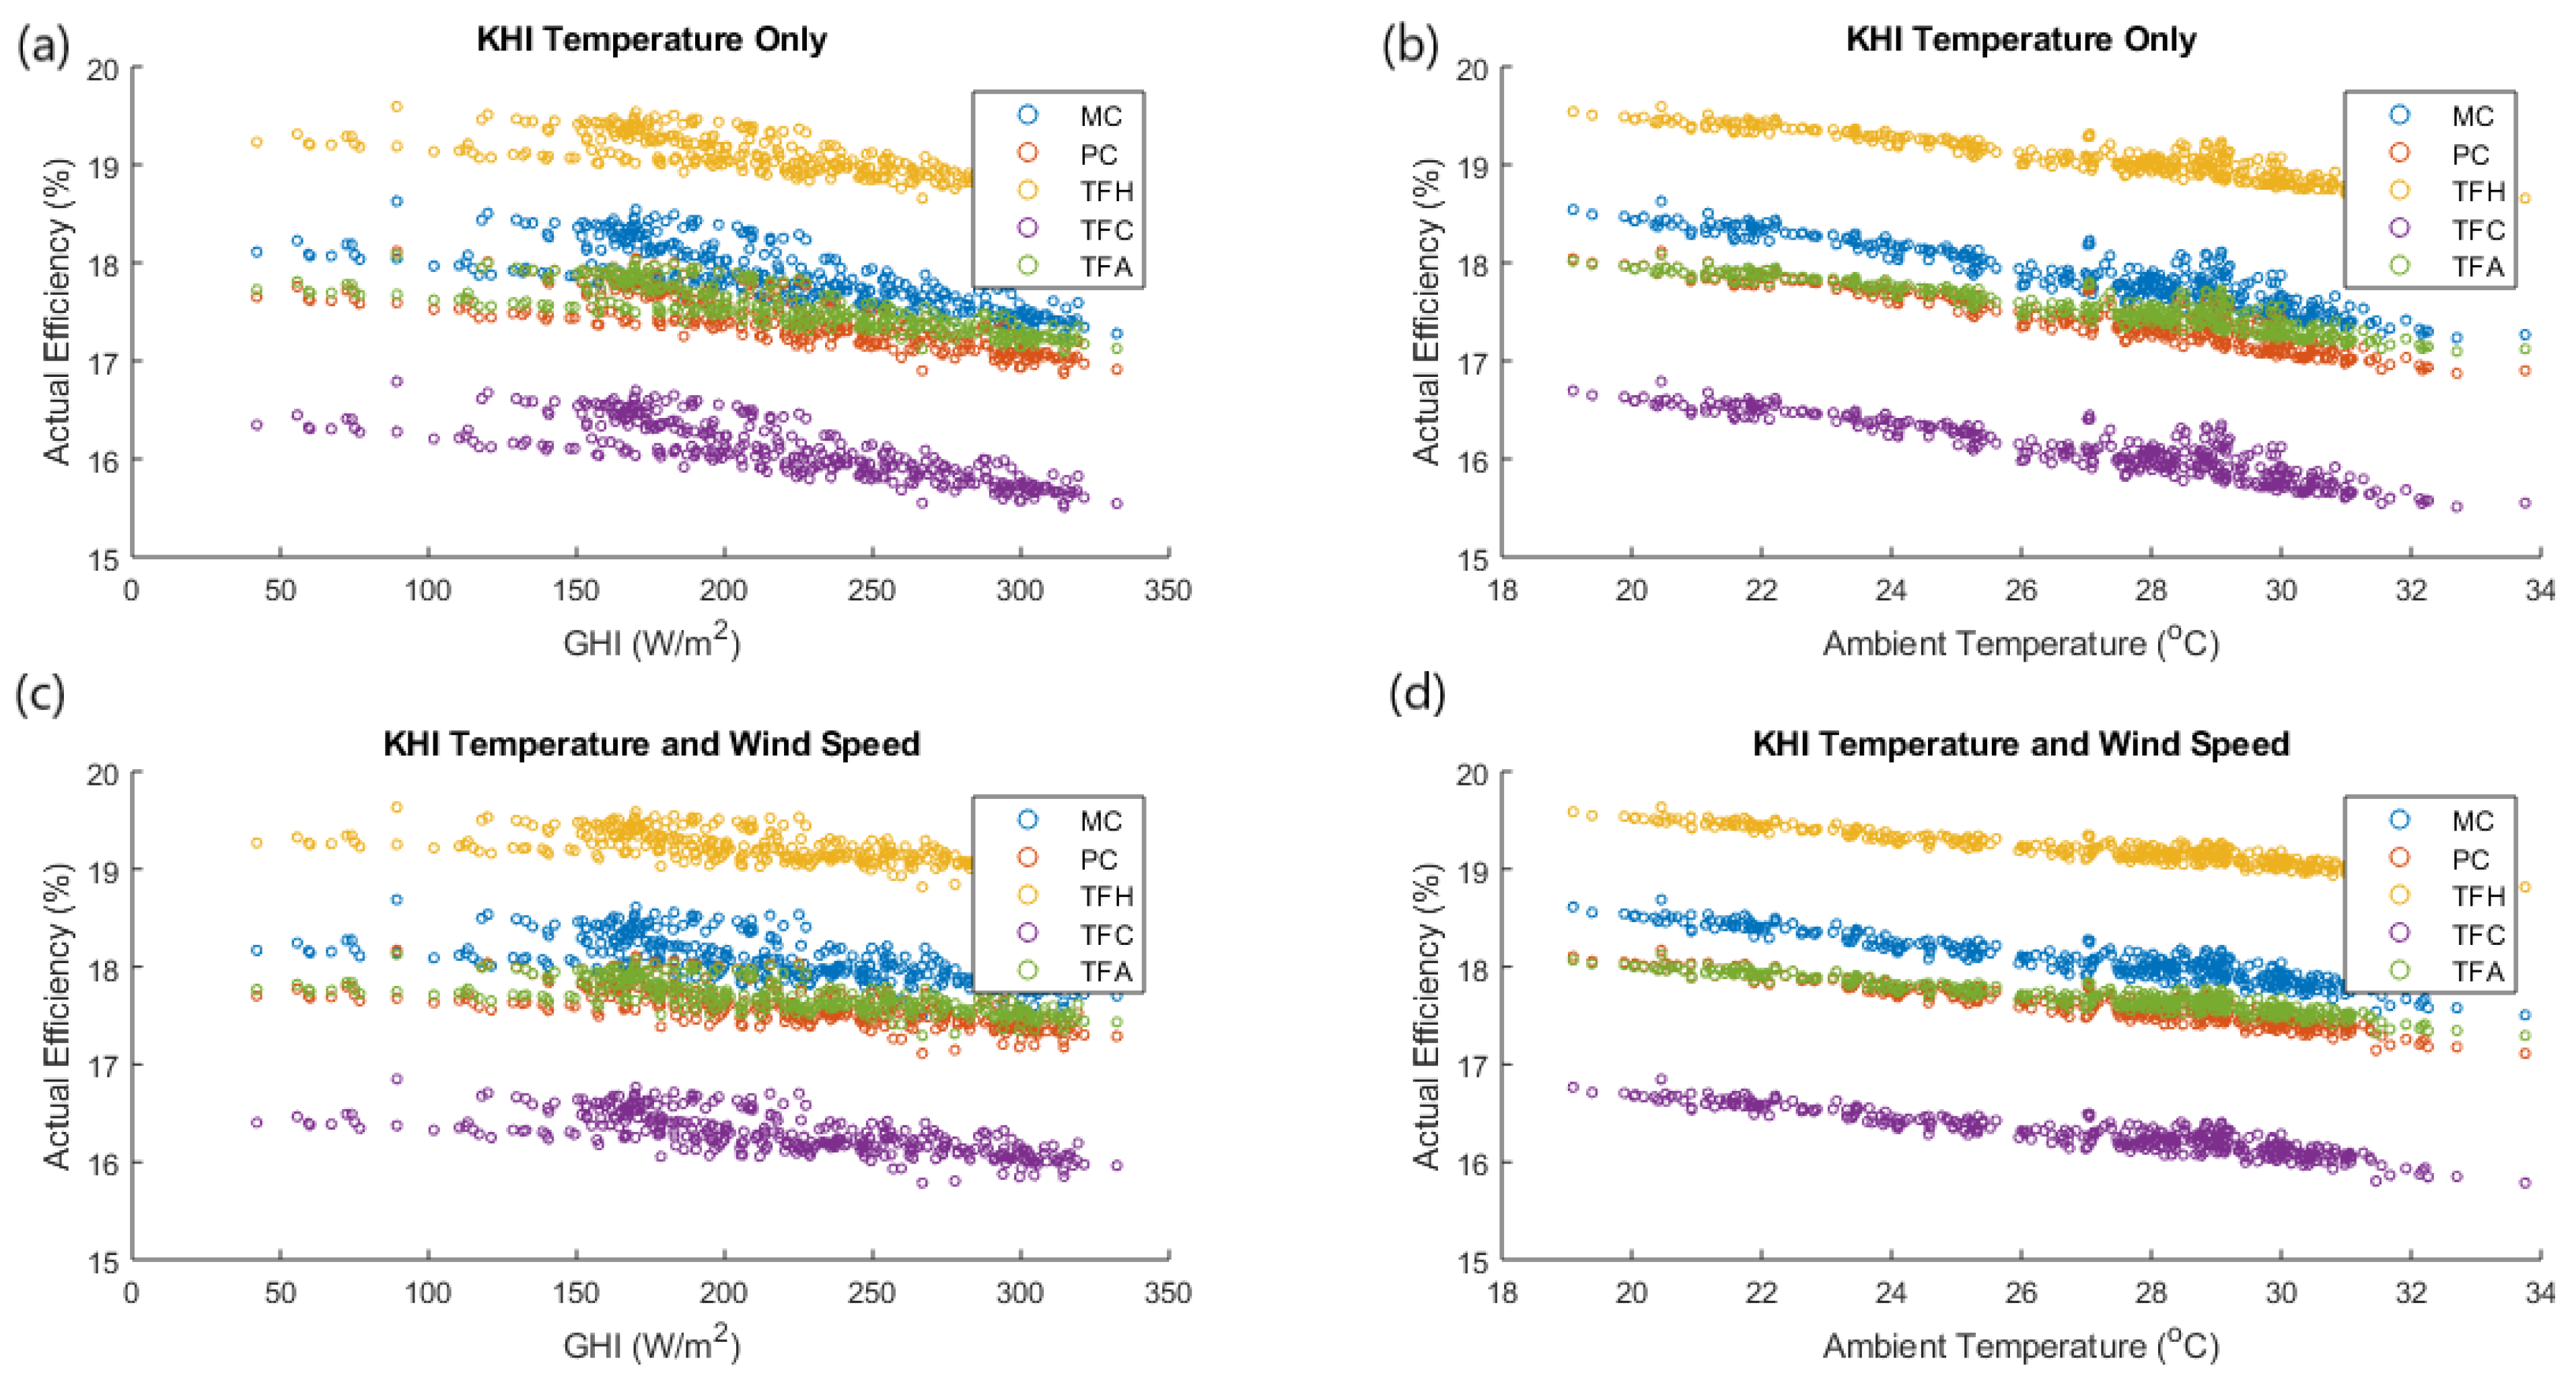
4.1. Effect of Temperature on the Module’s Actual Efficiency
4.2. Effect of Temperature and Wind Speed on Module’s Actual Efficiency
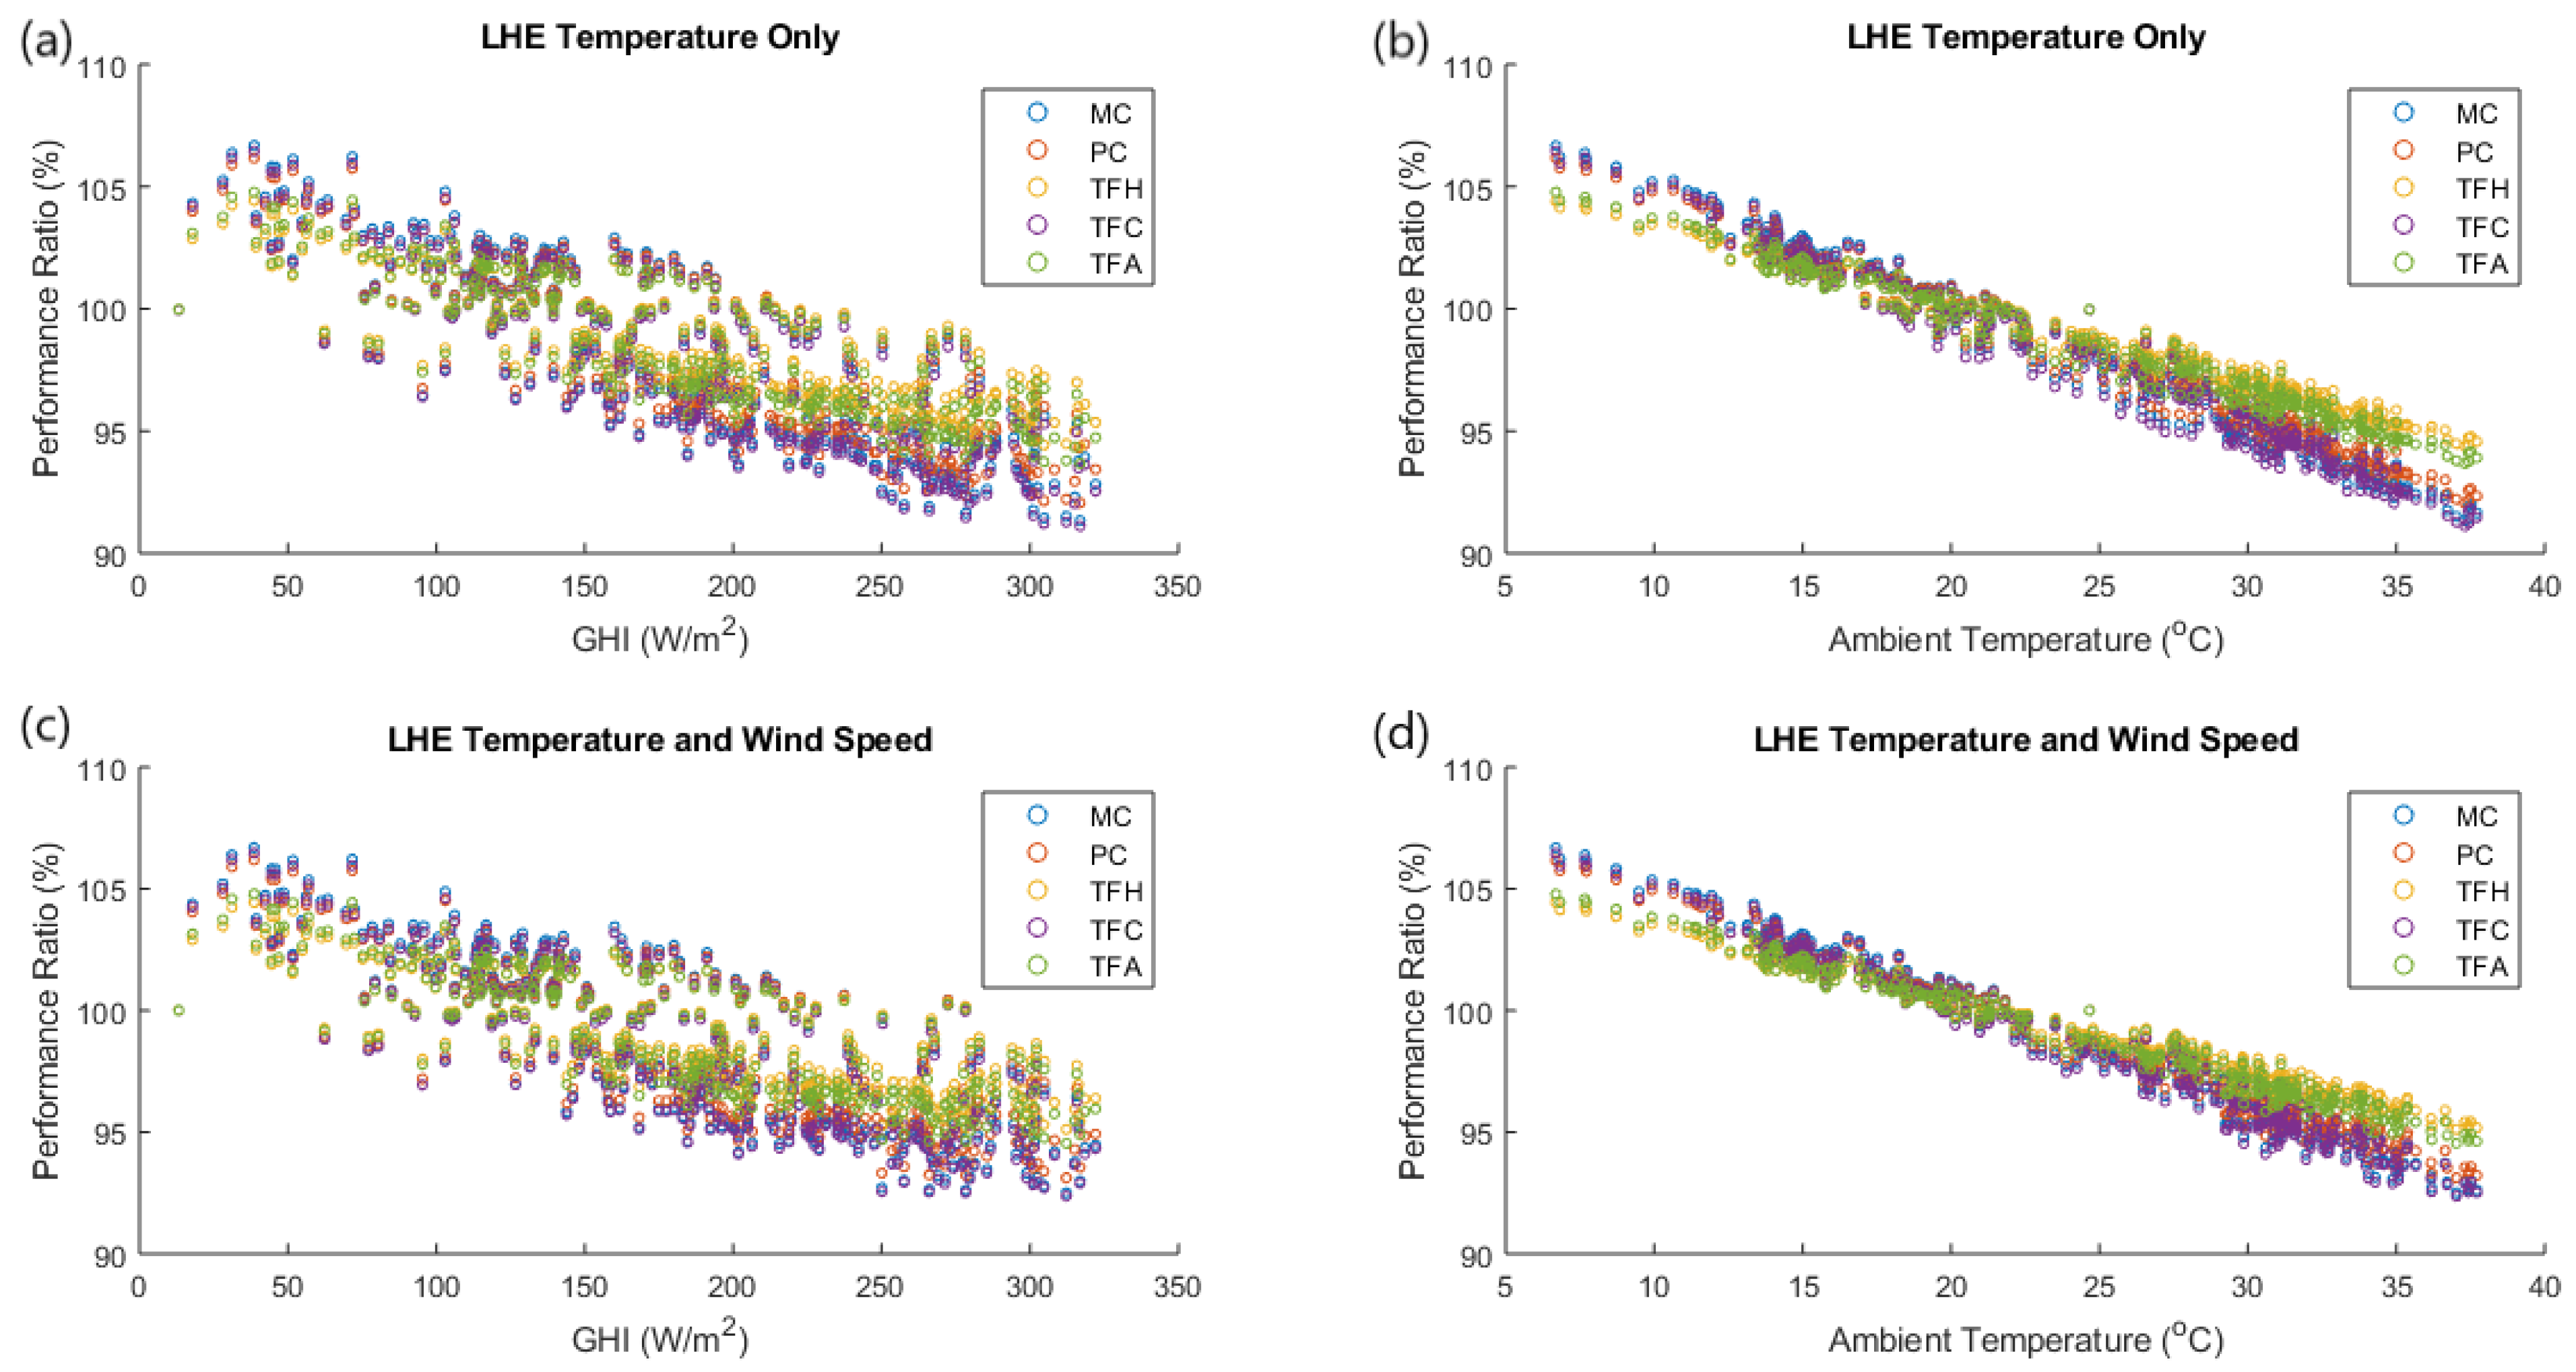
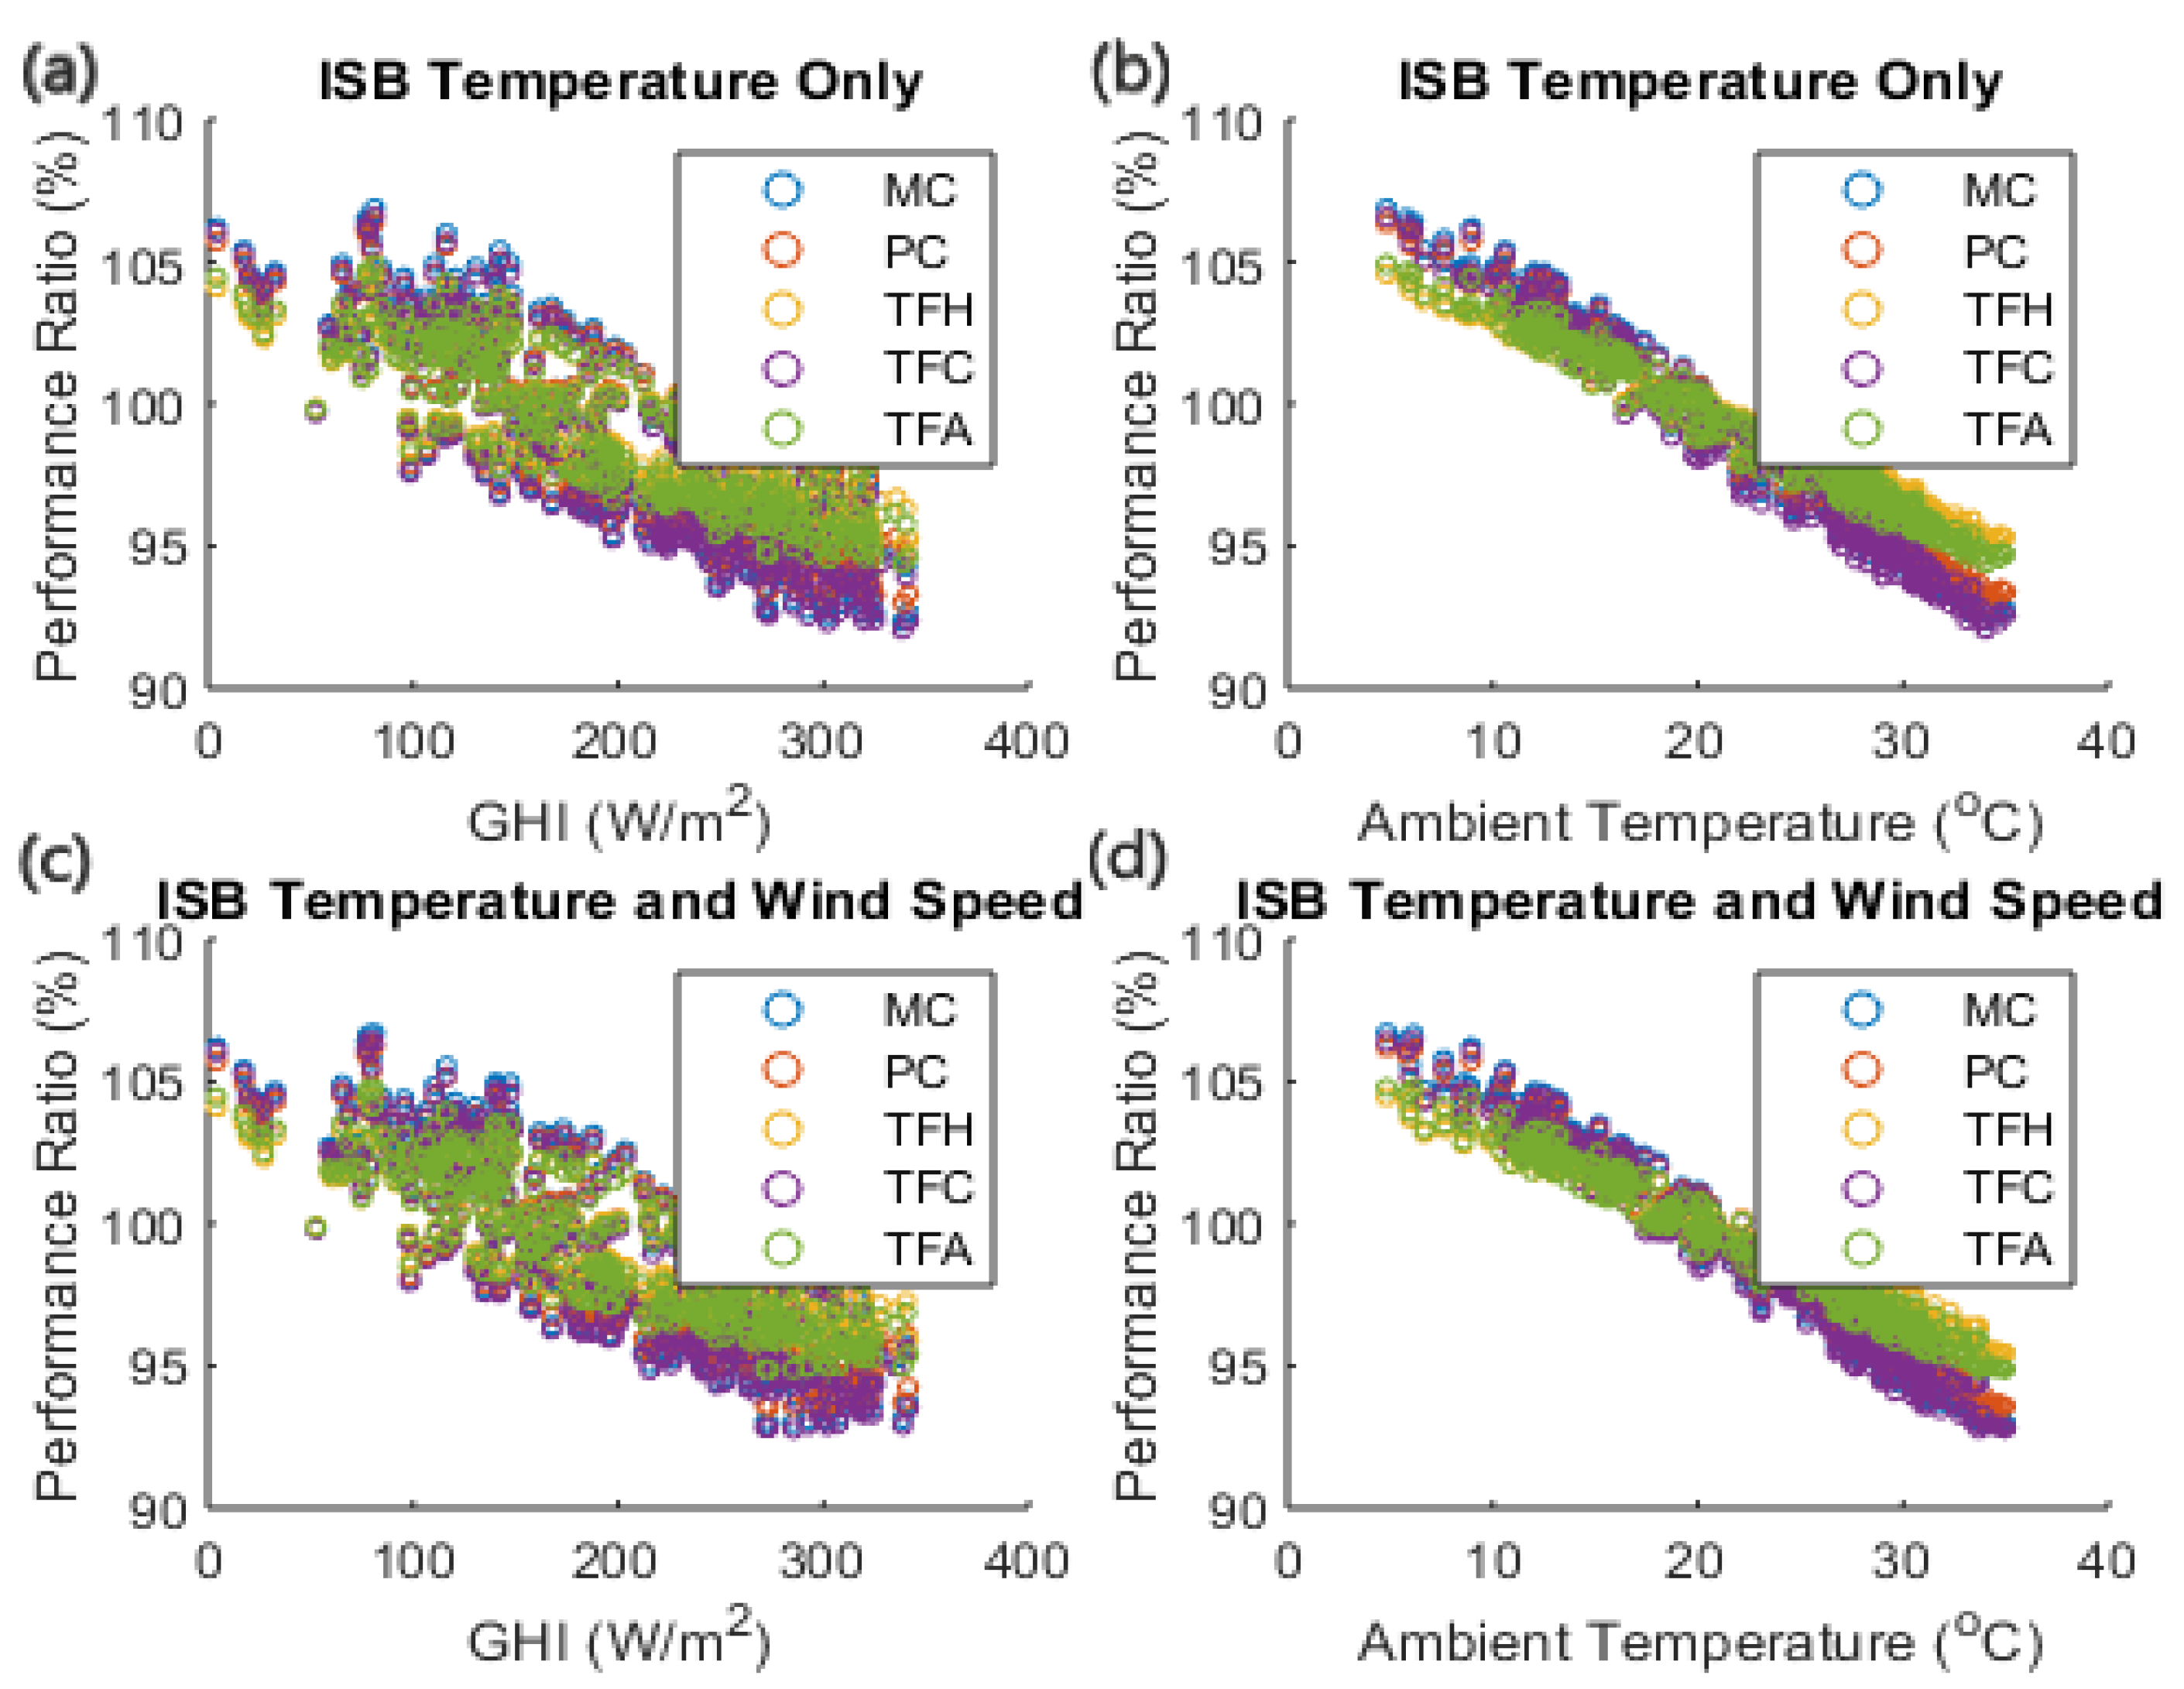
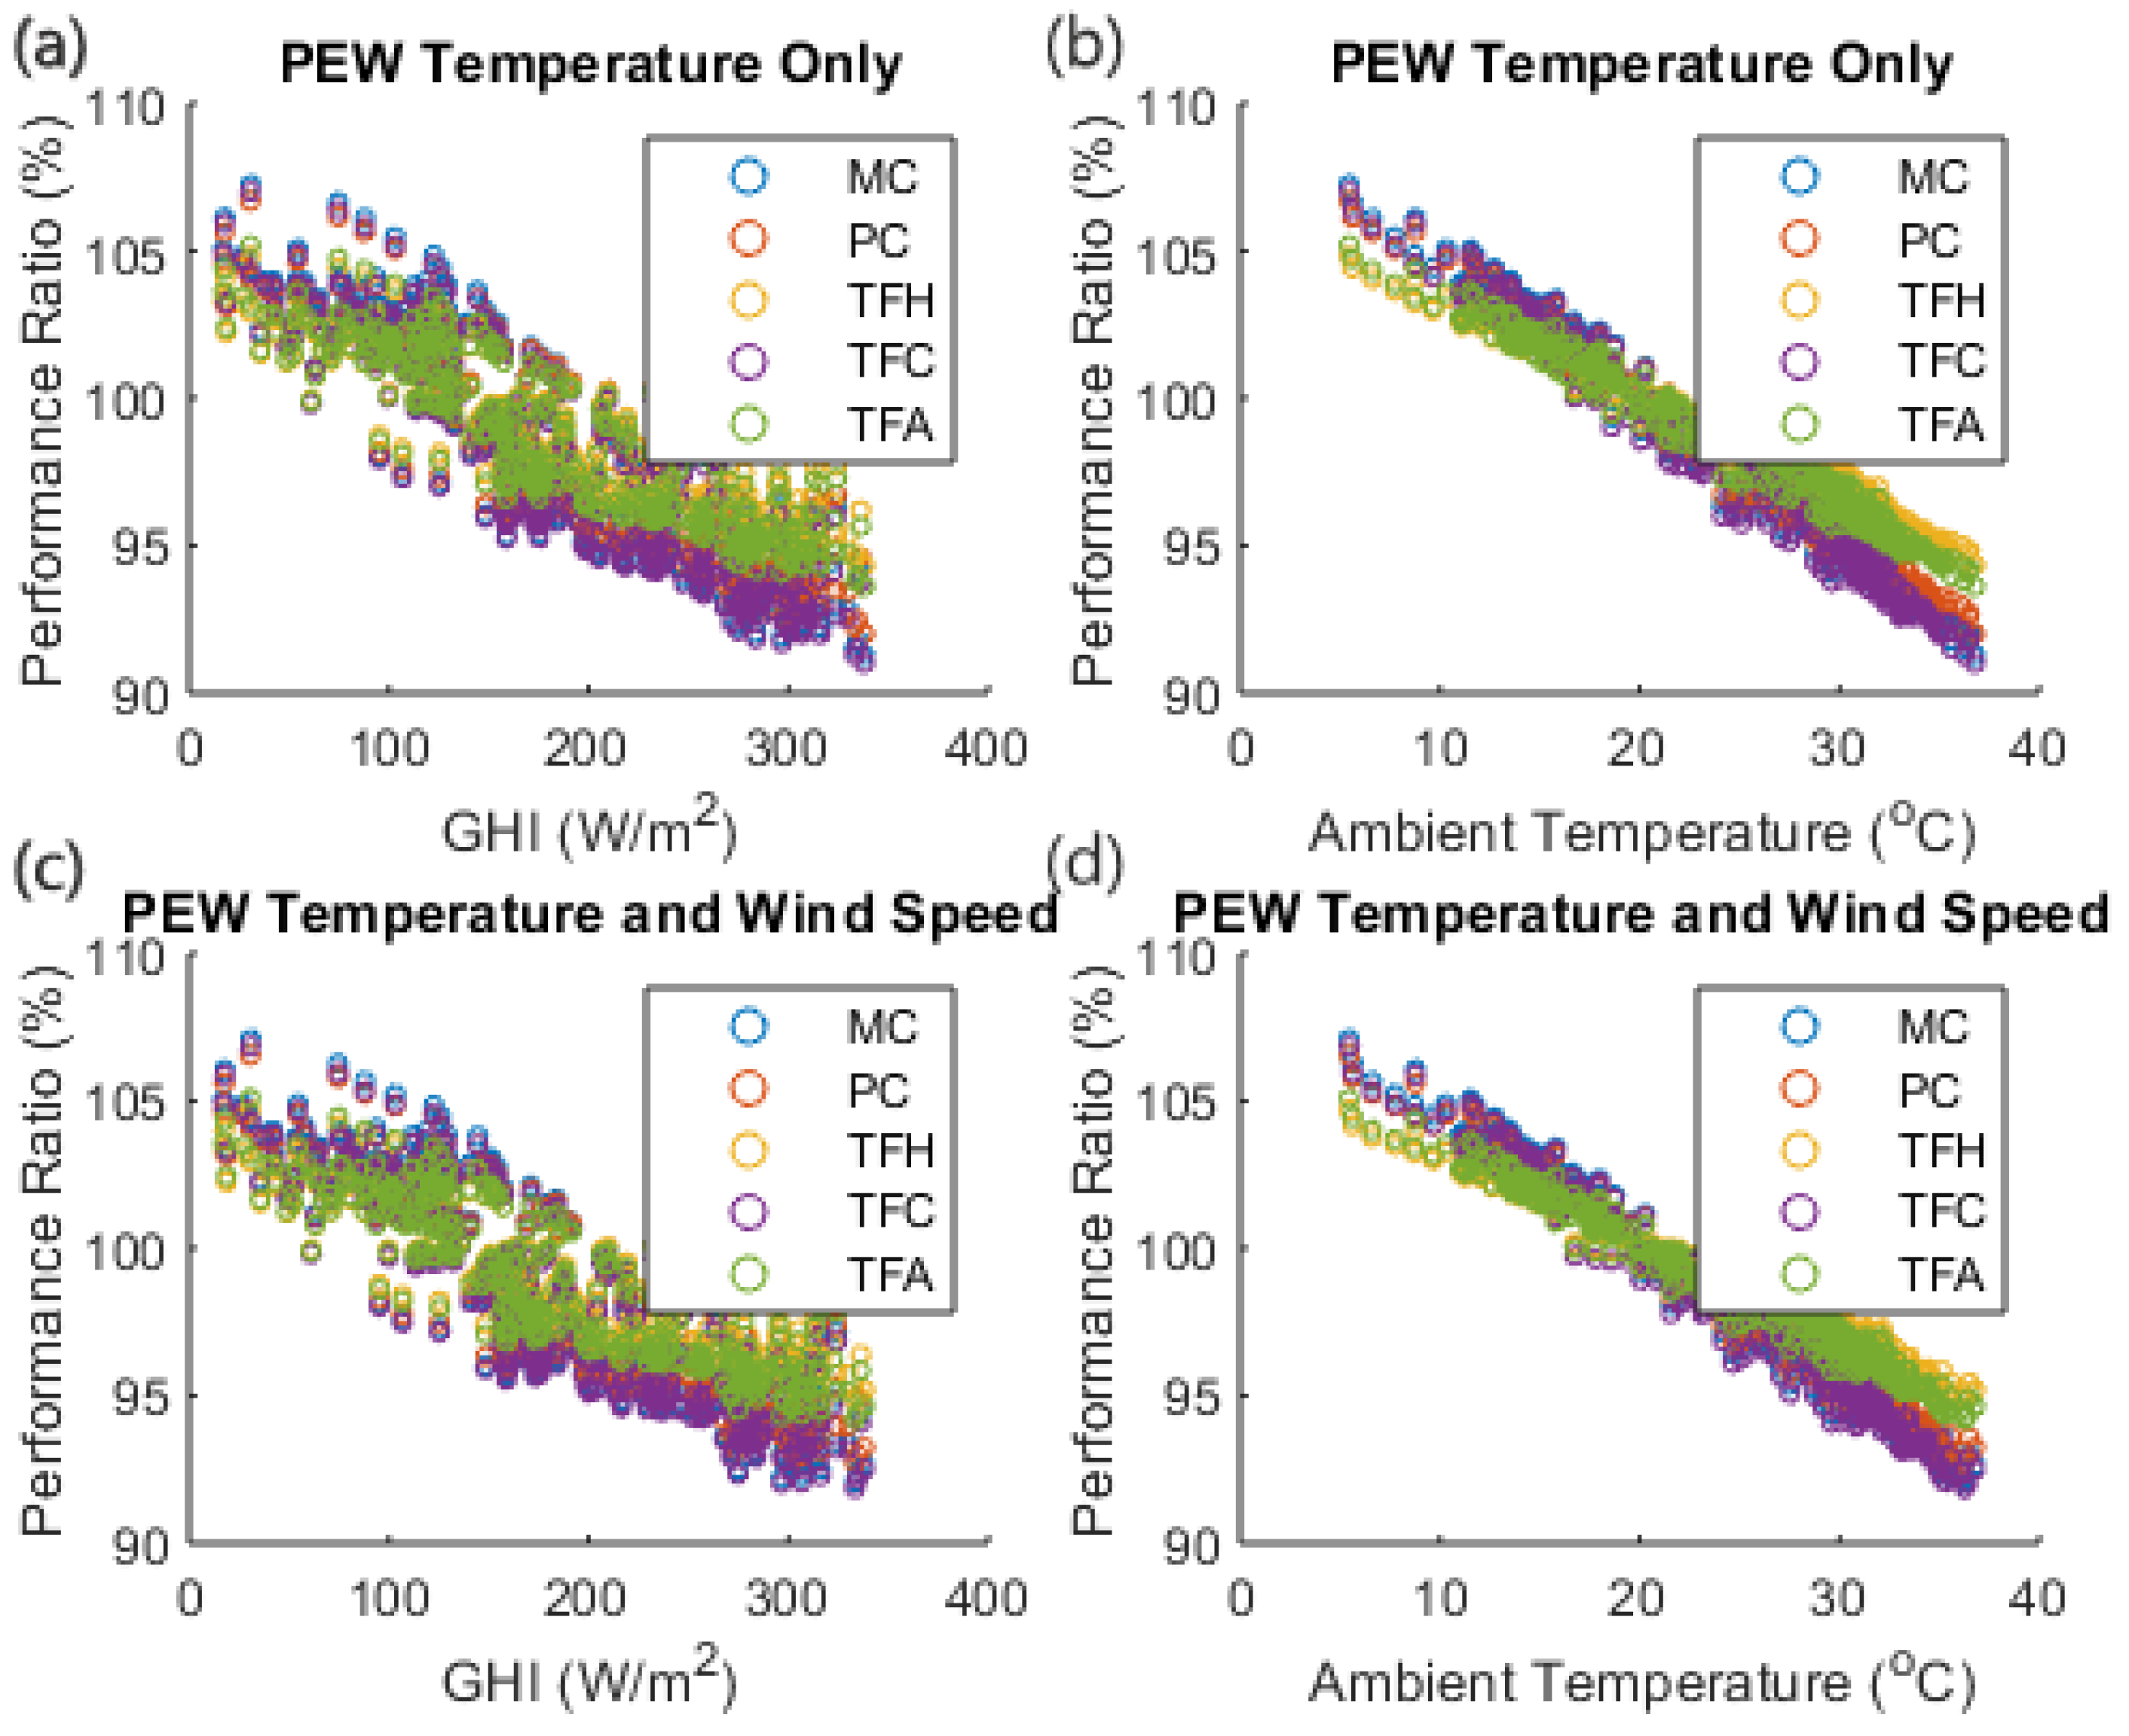
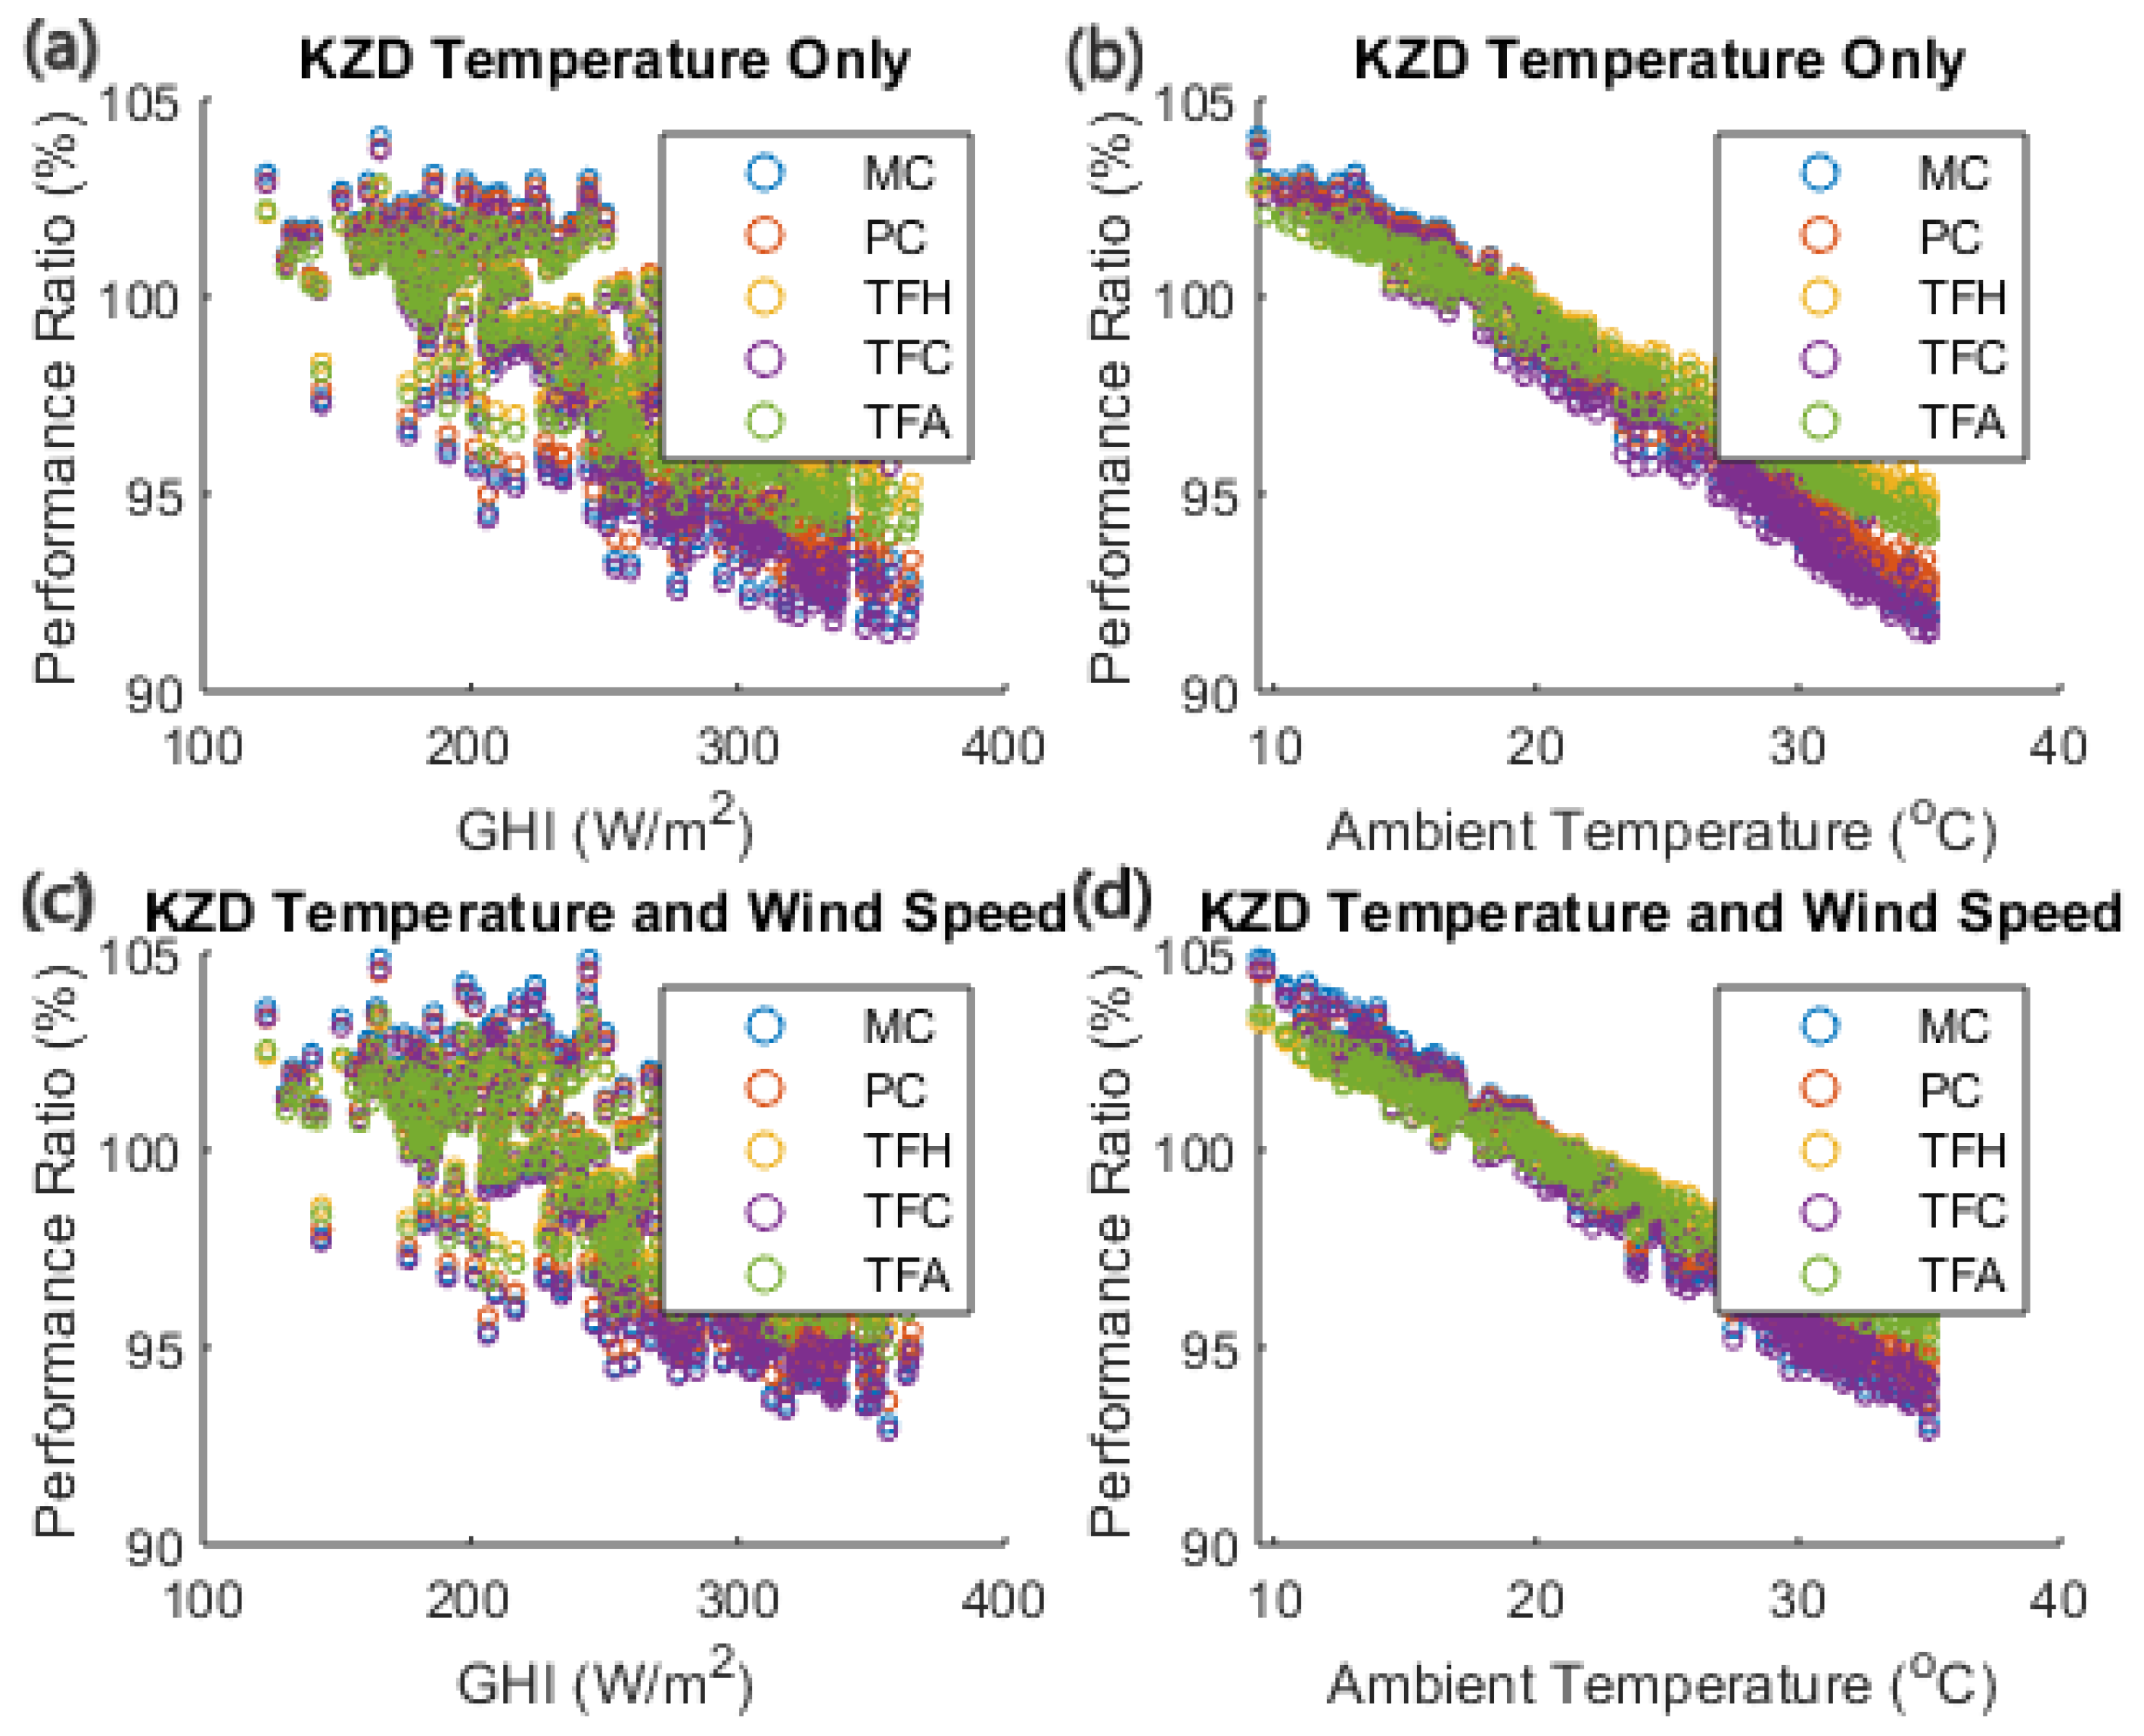
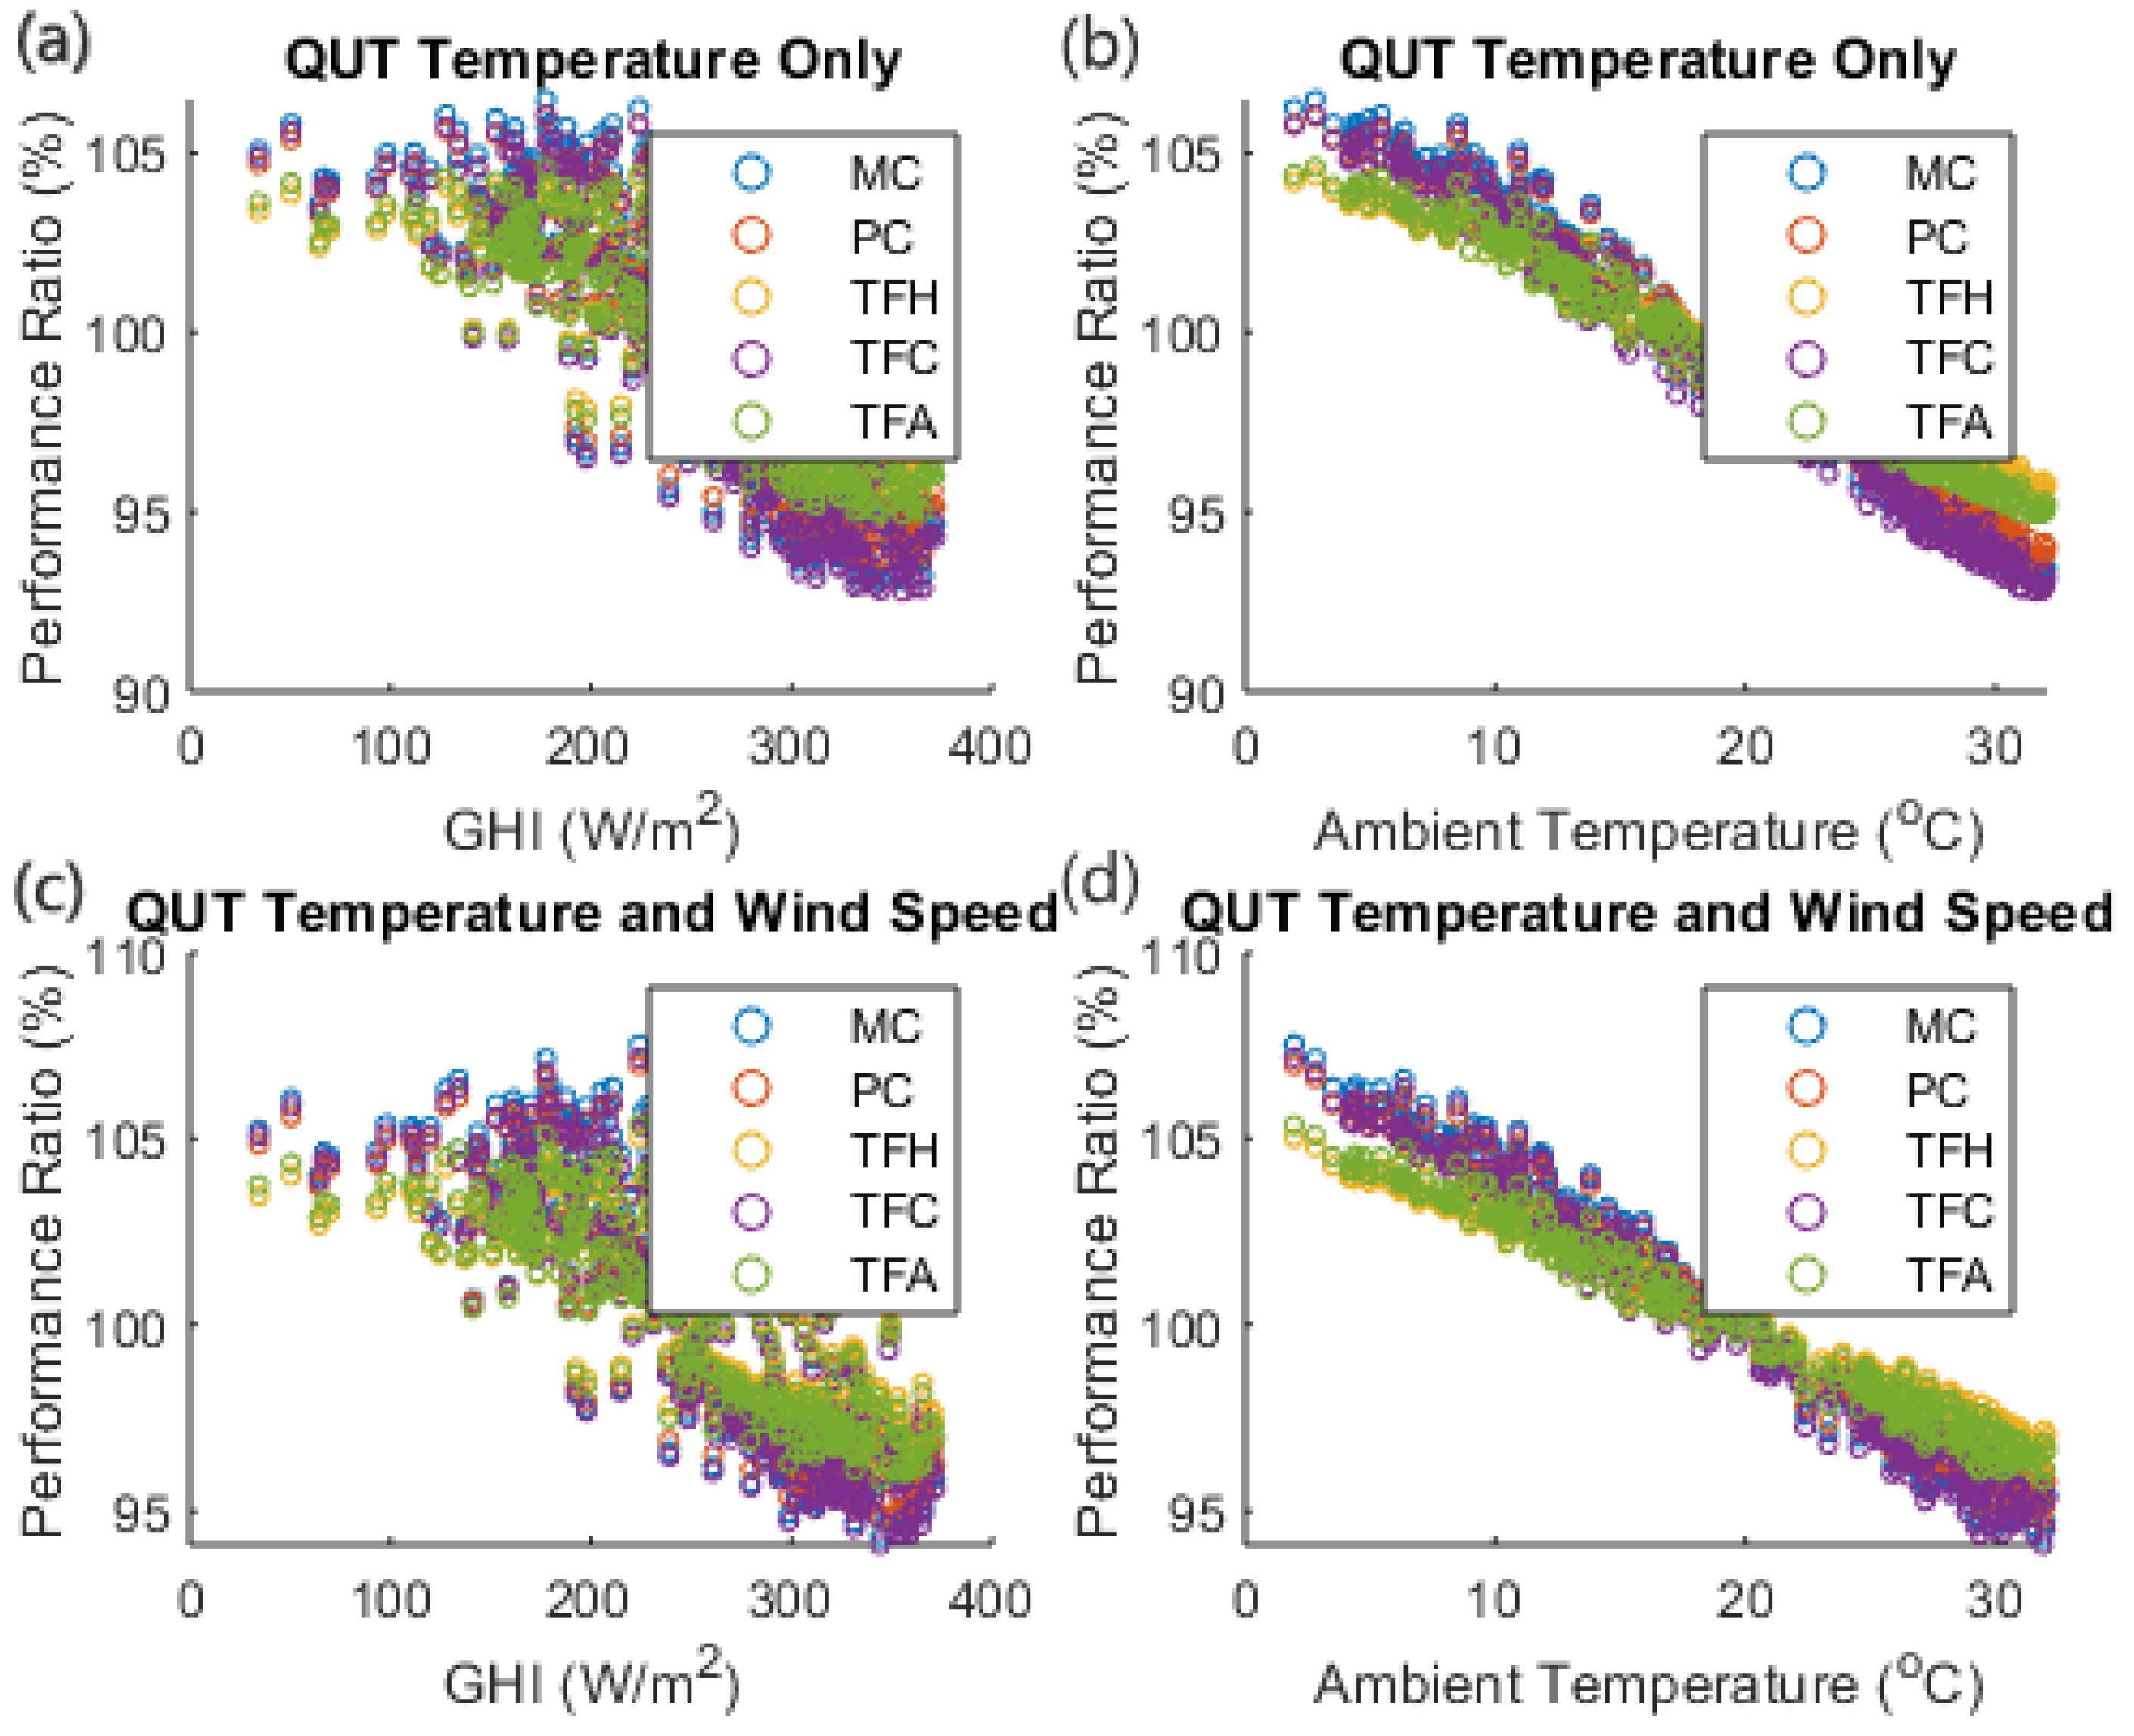
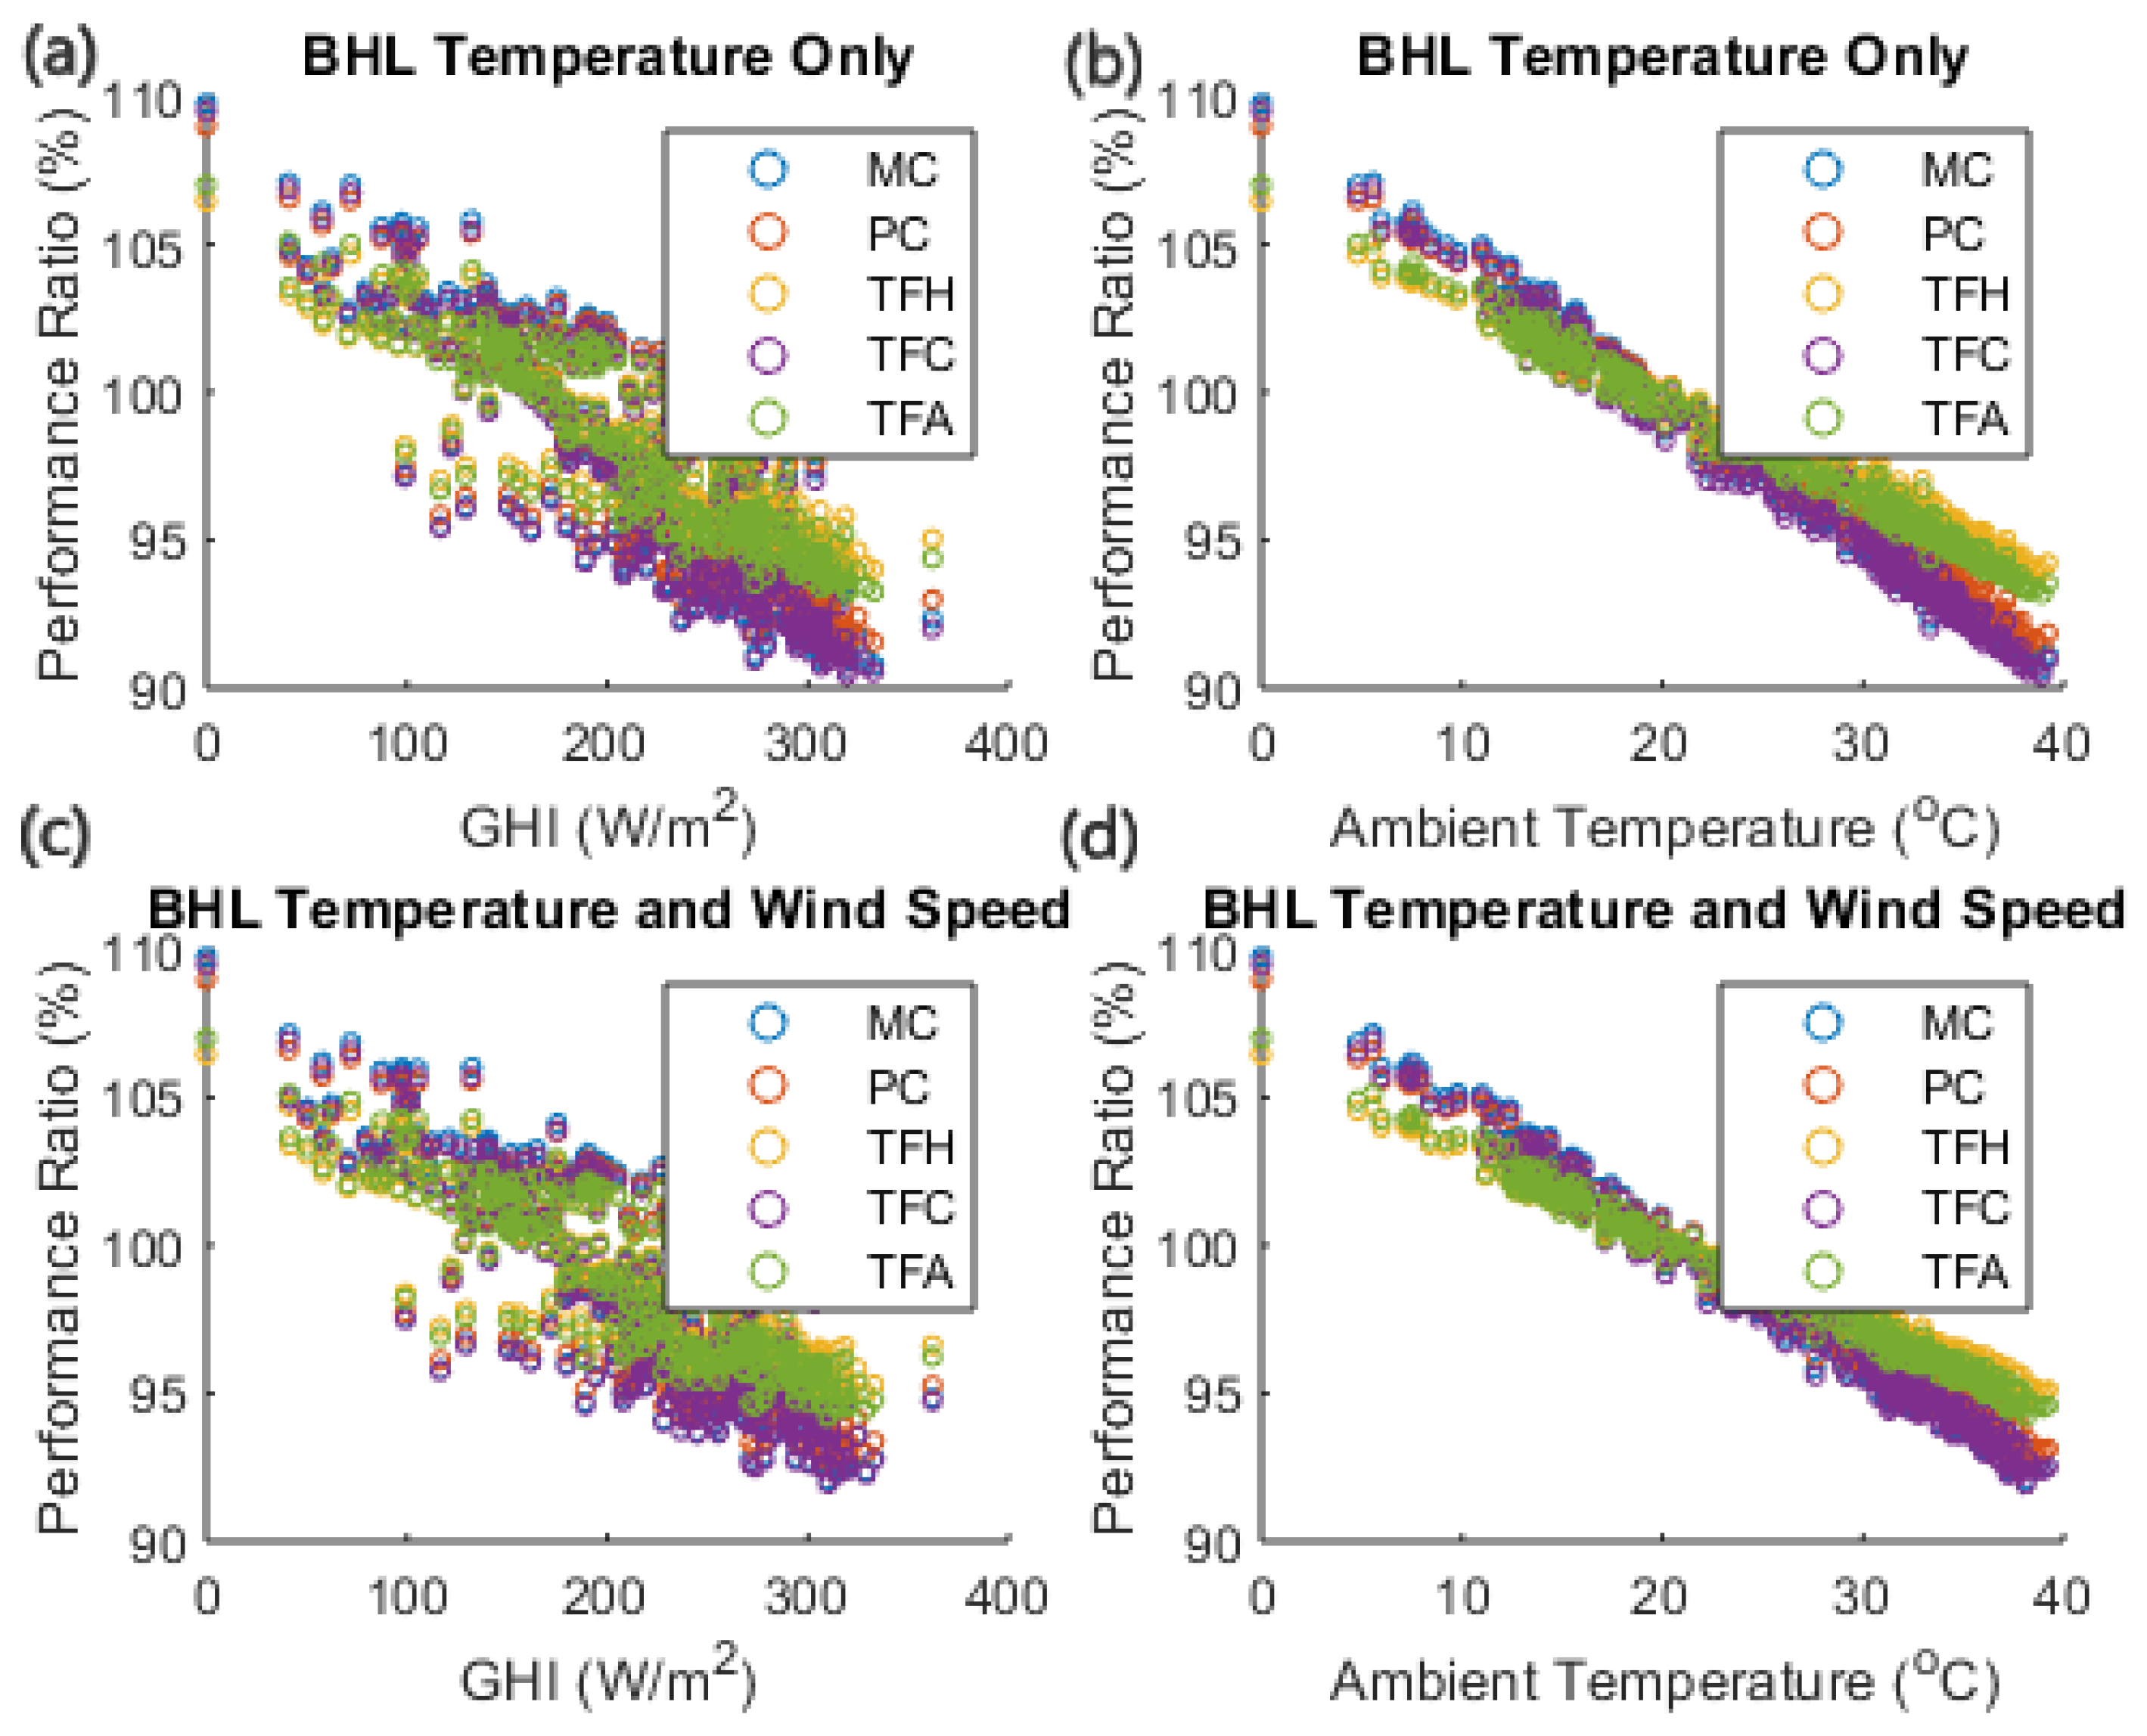
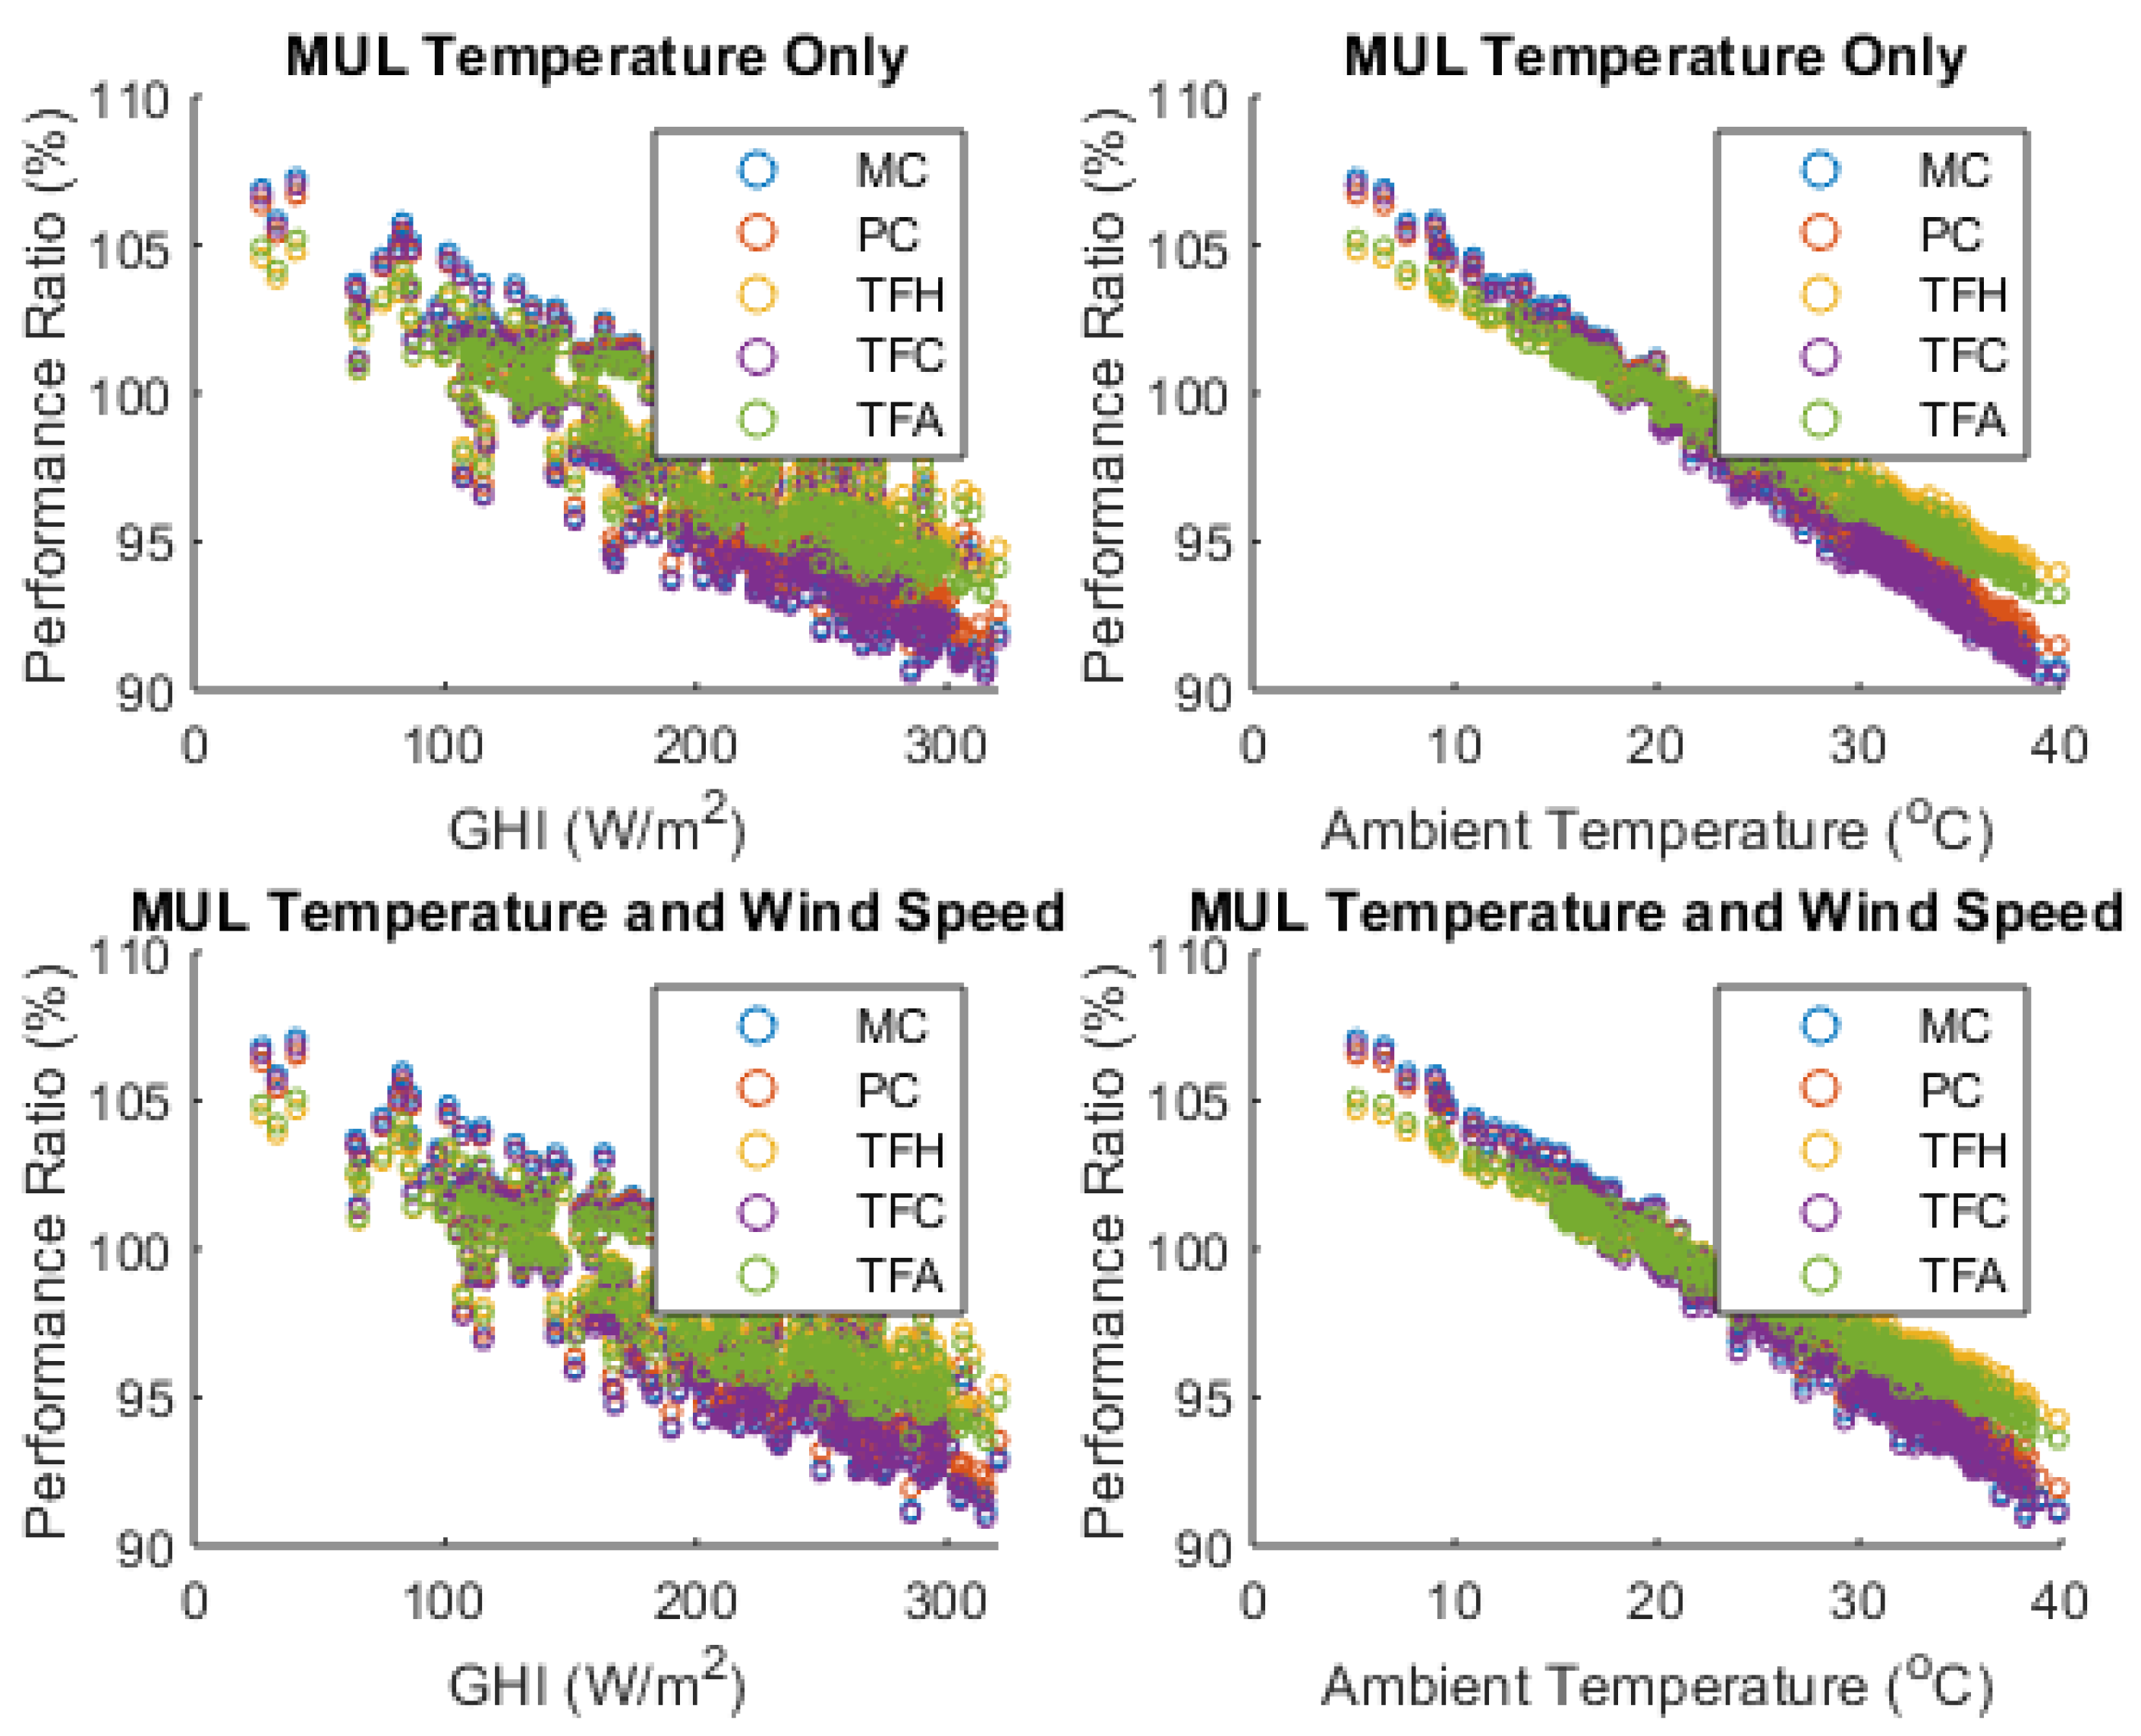
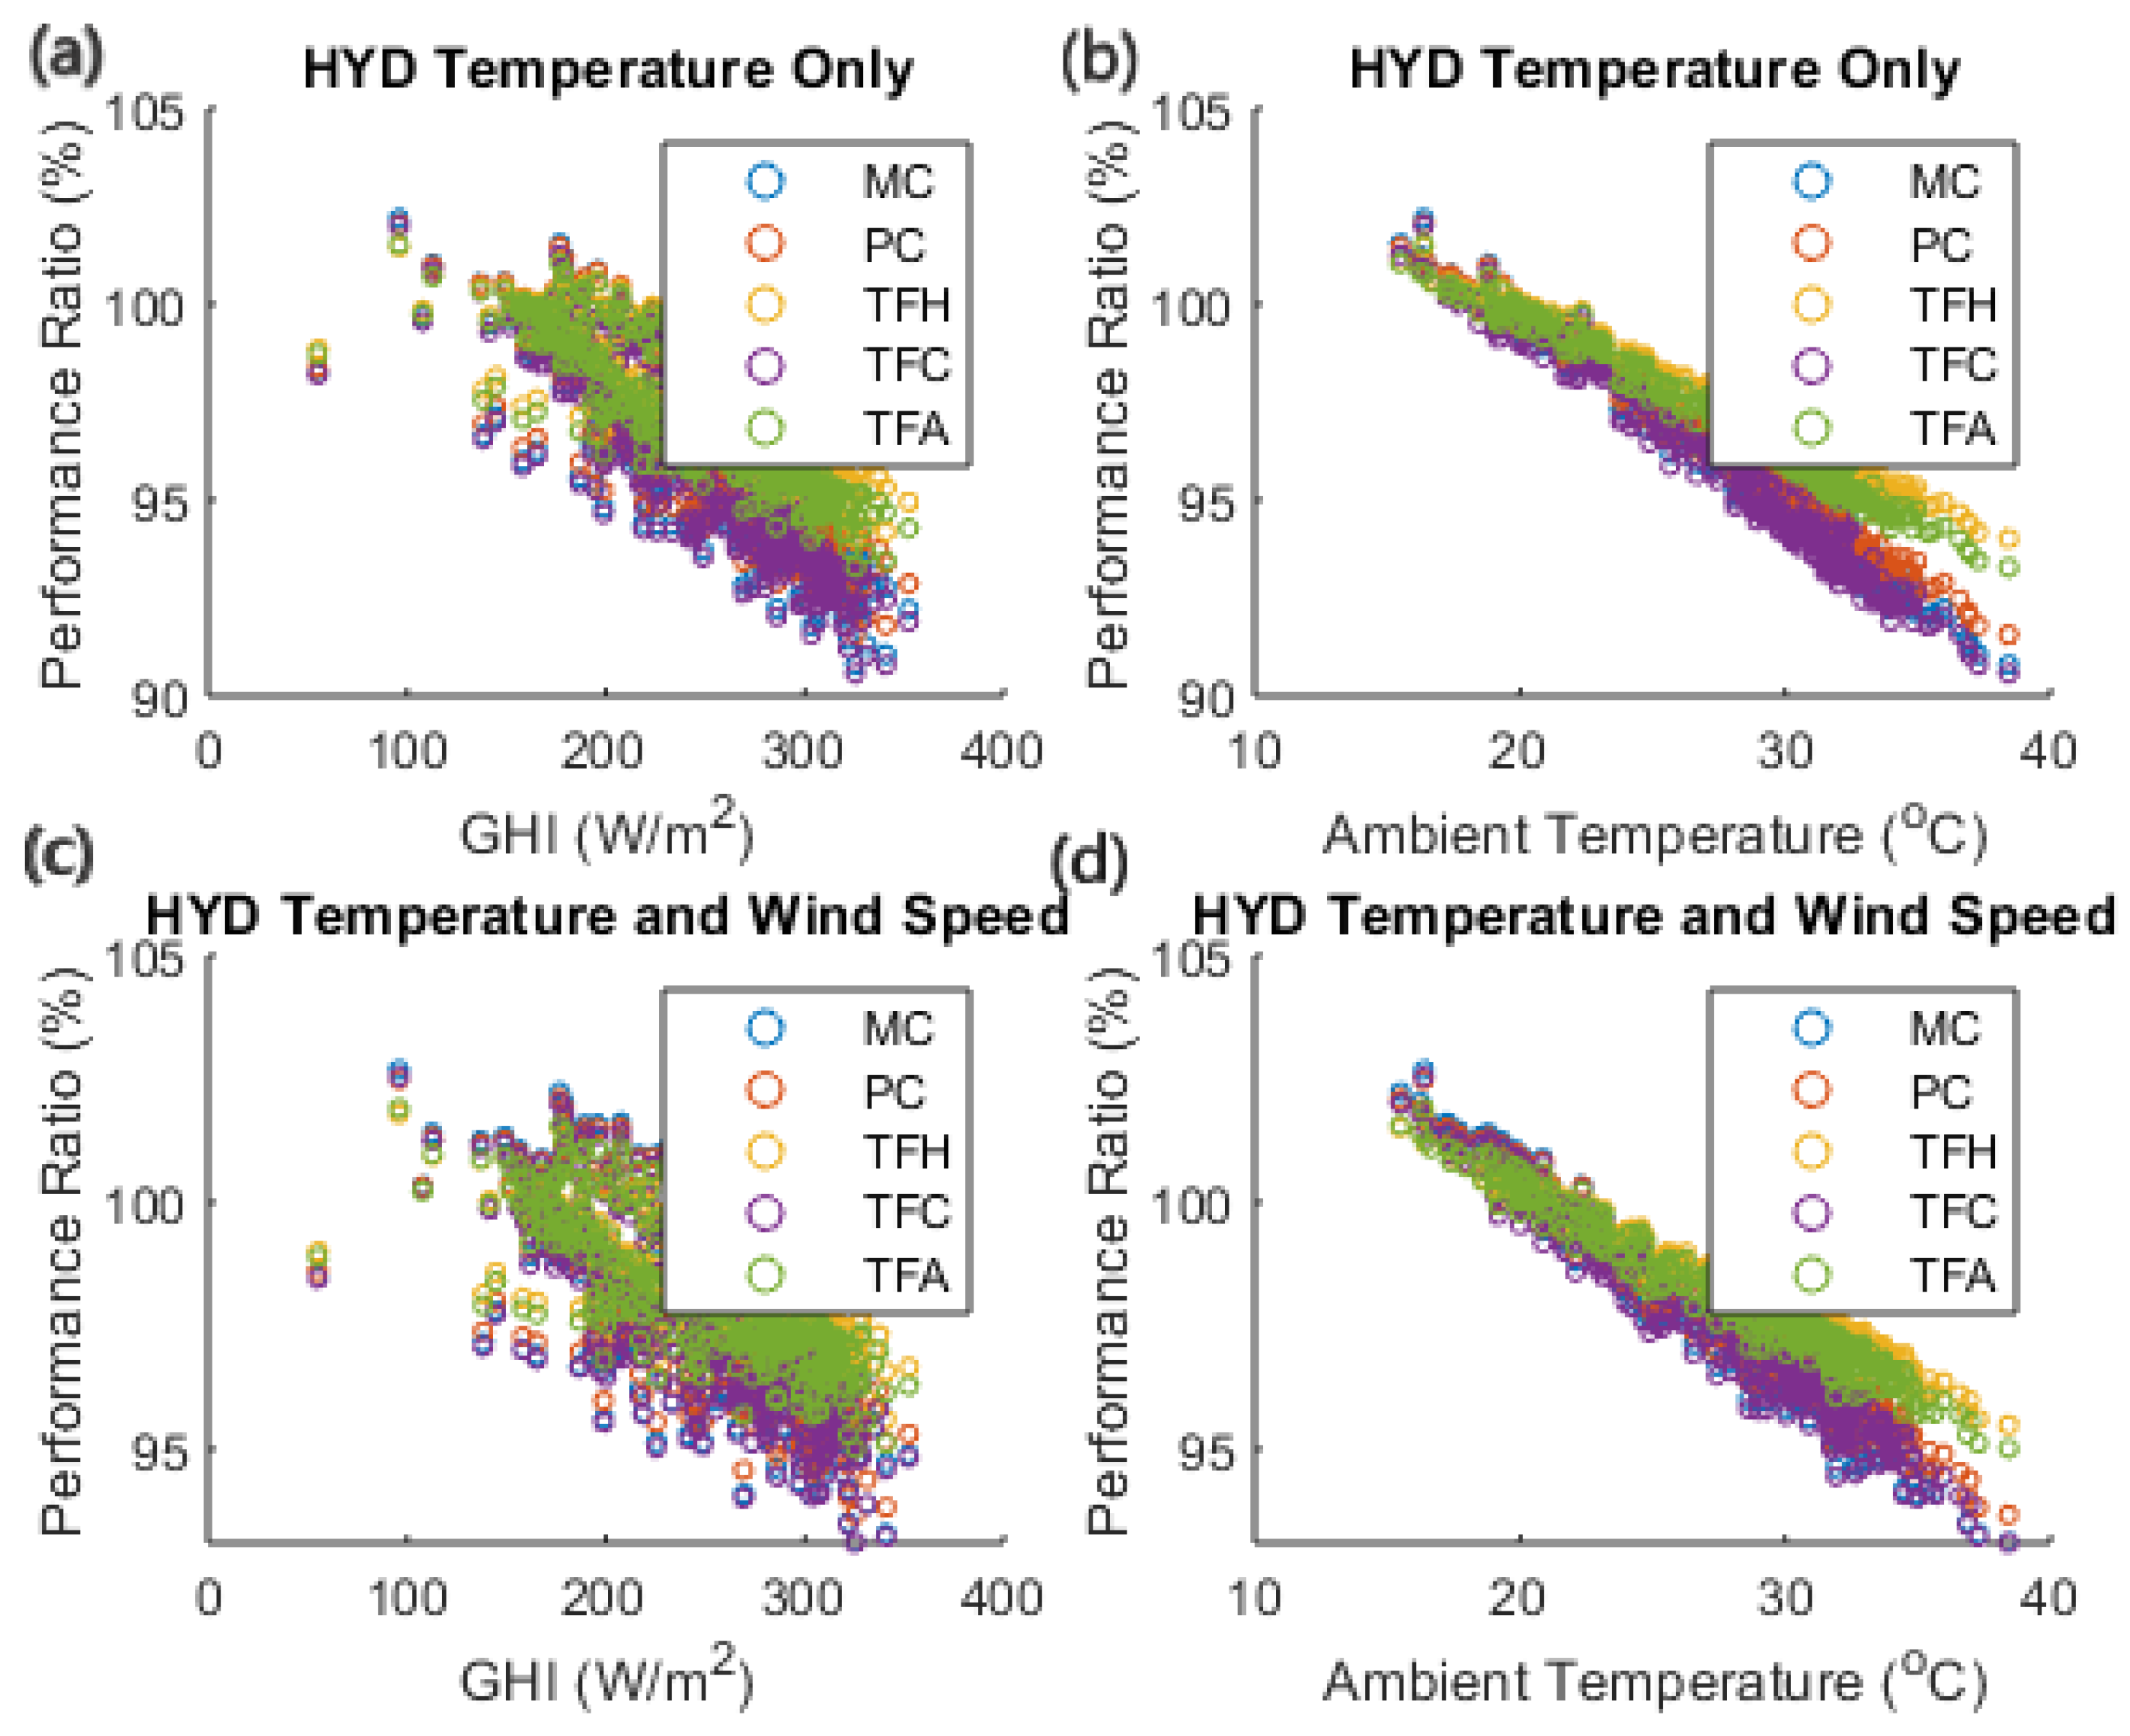
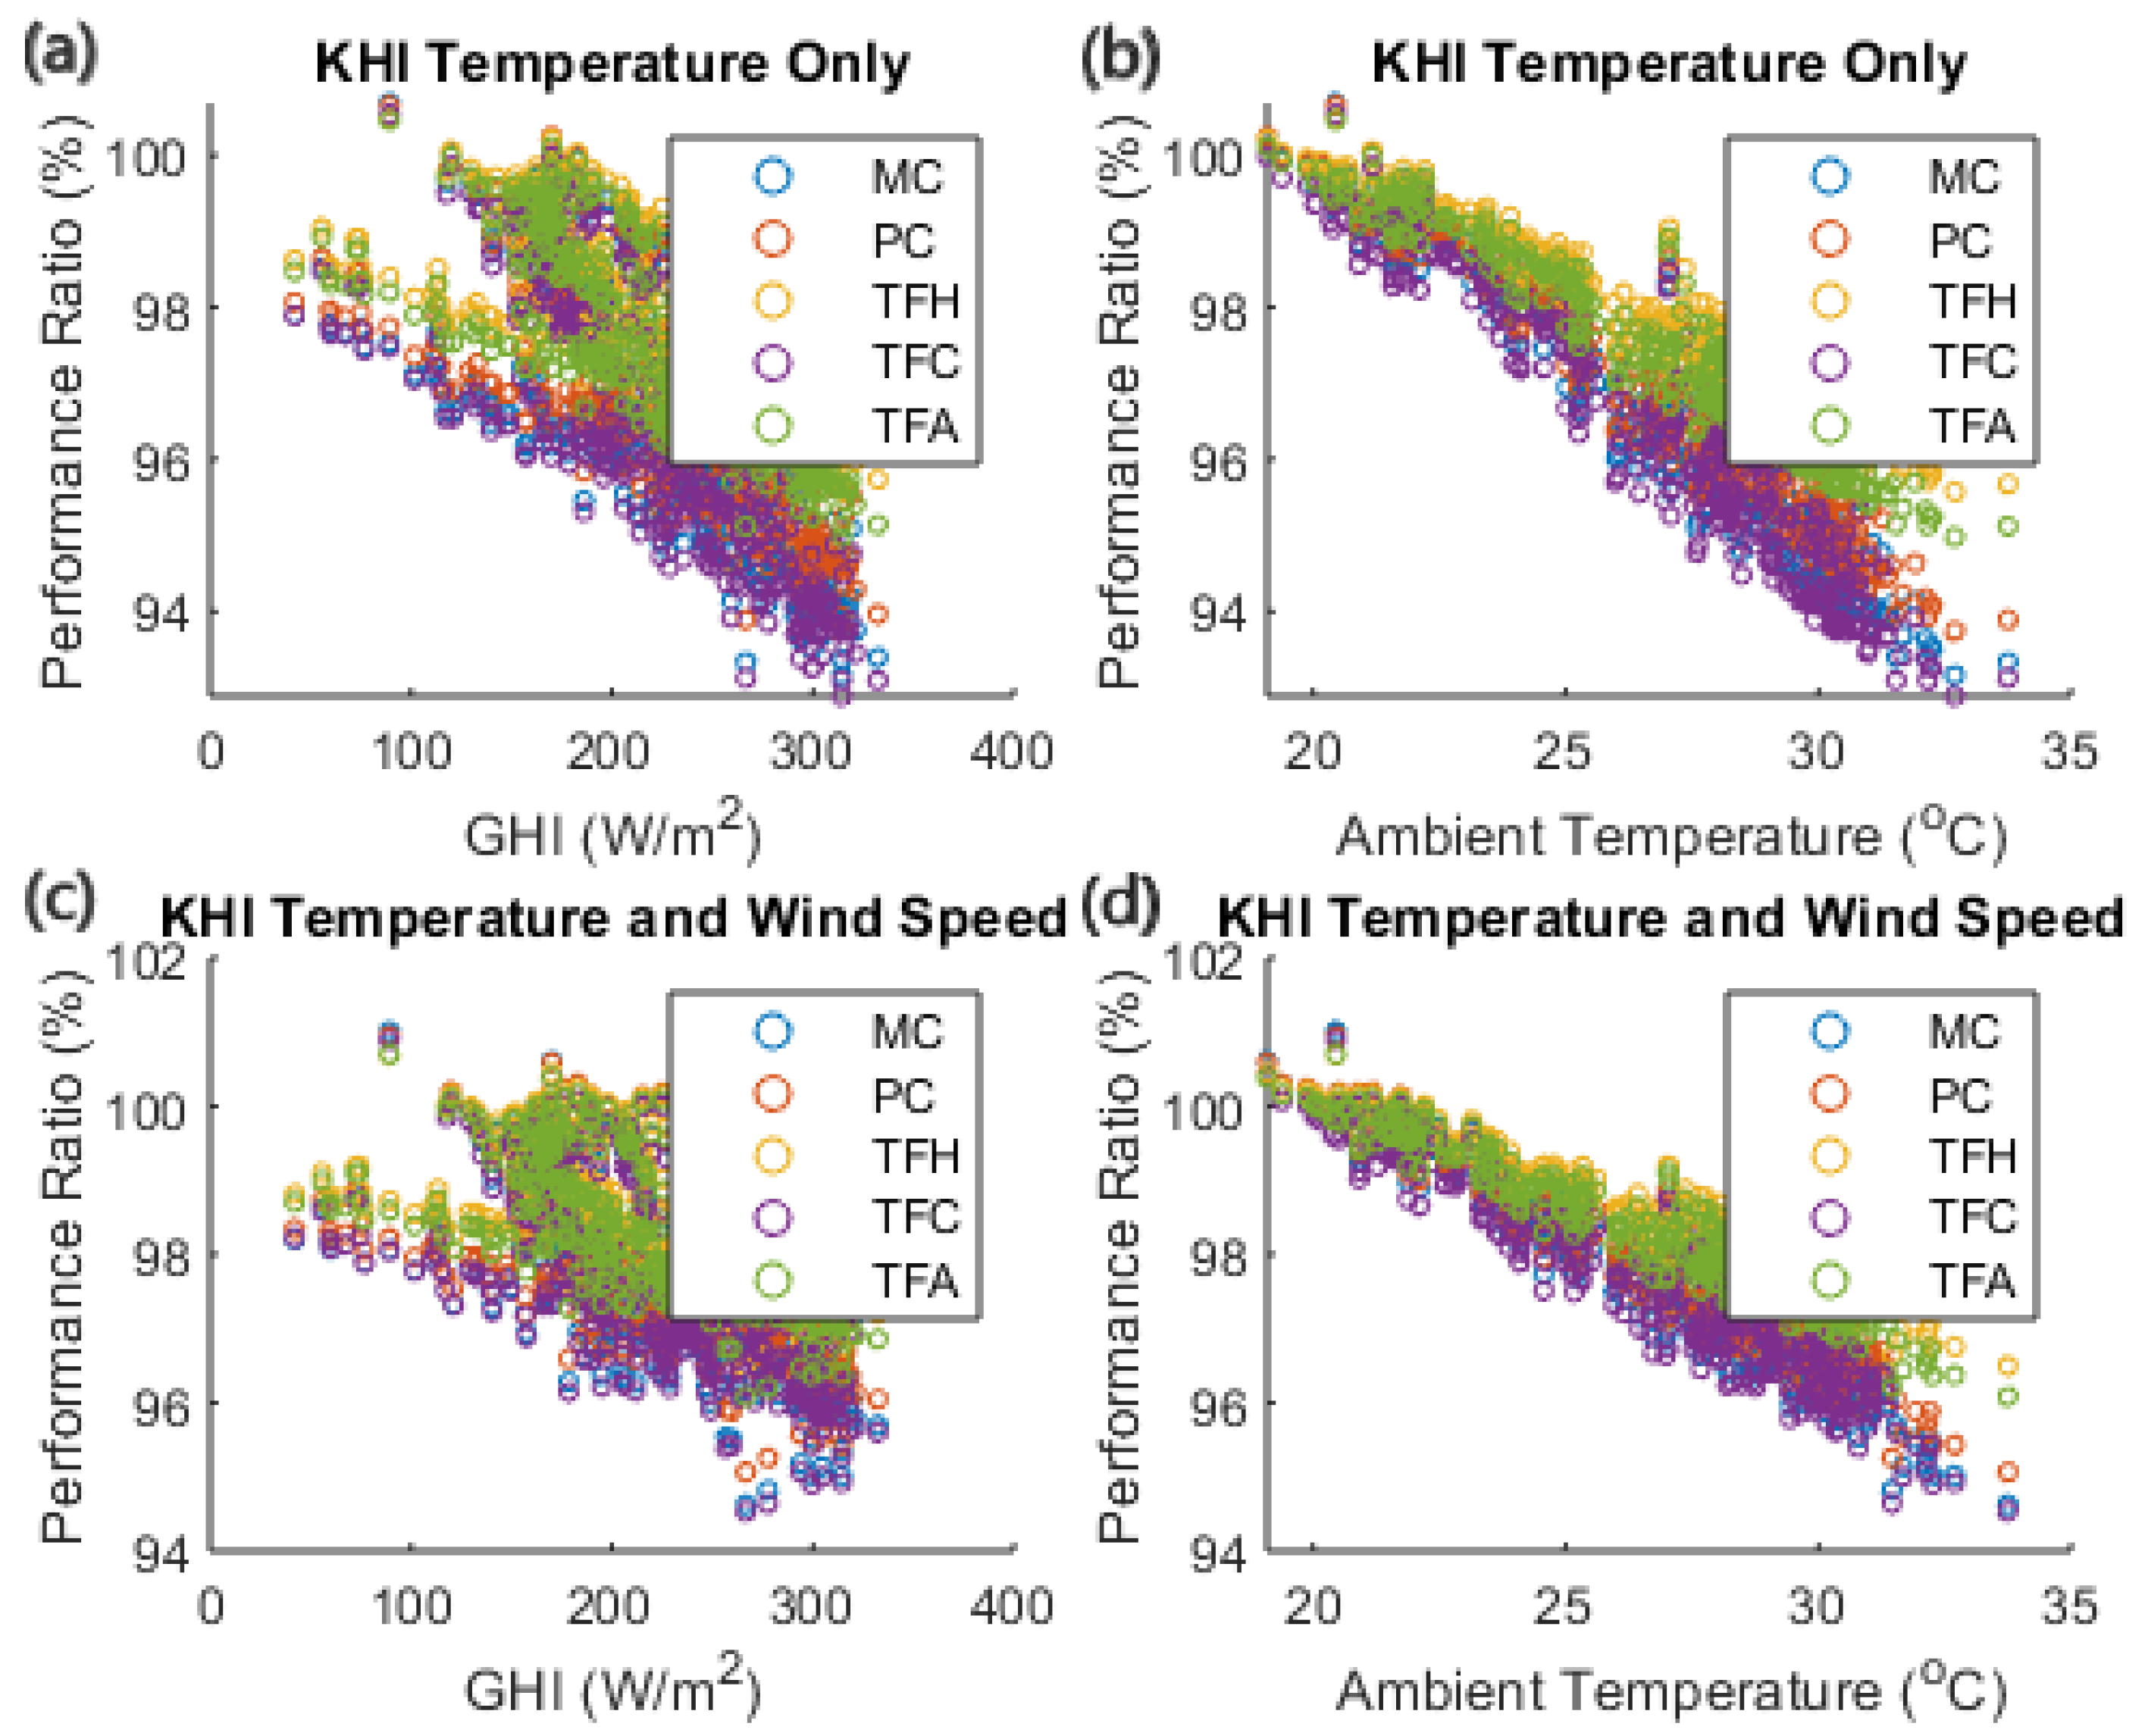
4.3. Effect of Temperature on Performance Ratio
4.4. Effect of Temperature and Wind Speed on Performance Ratio
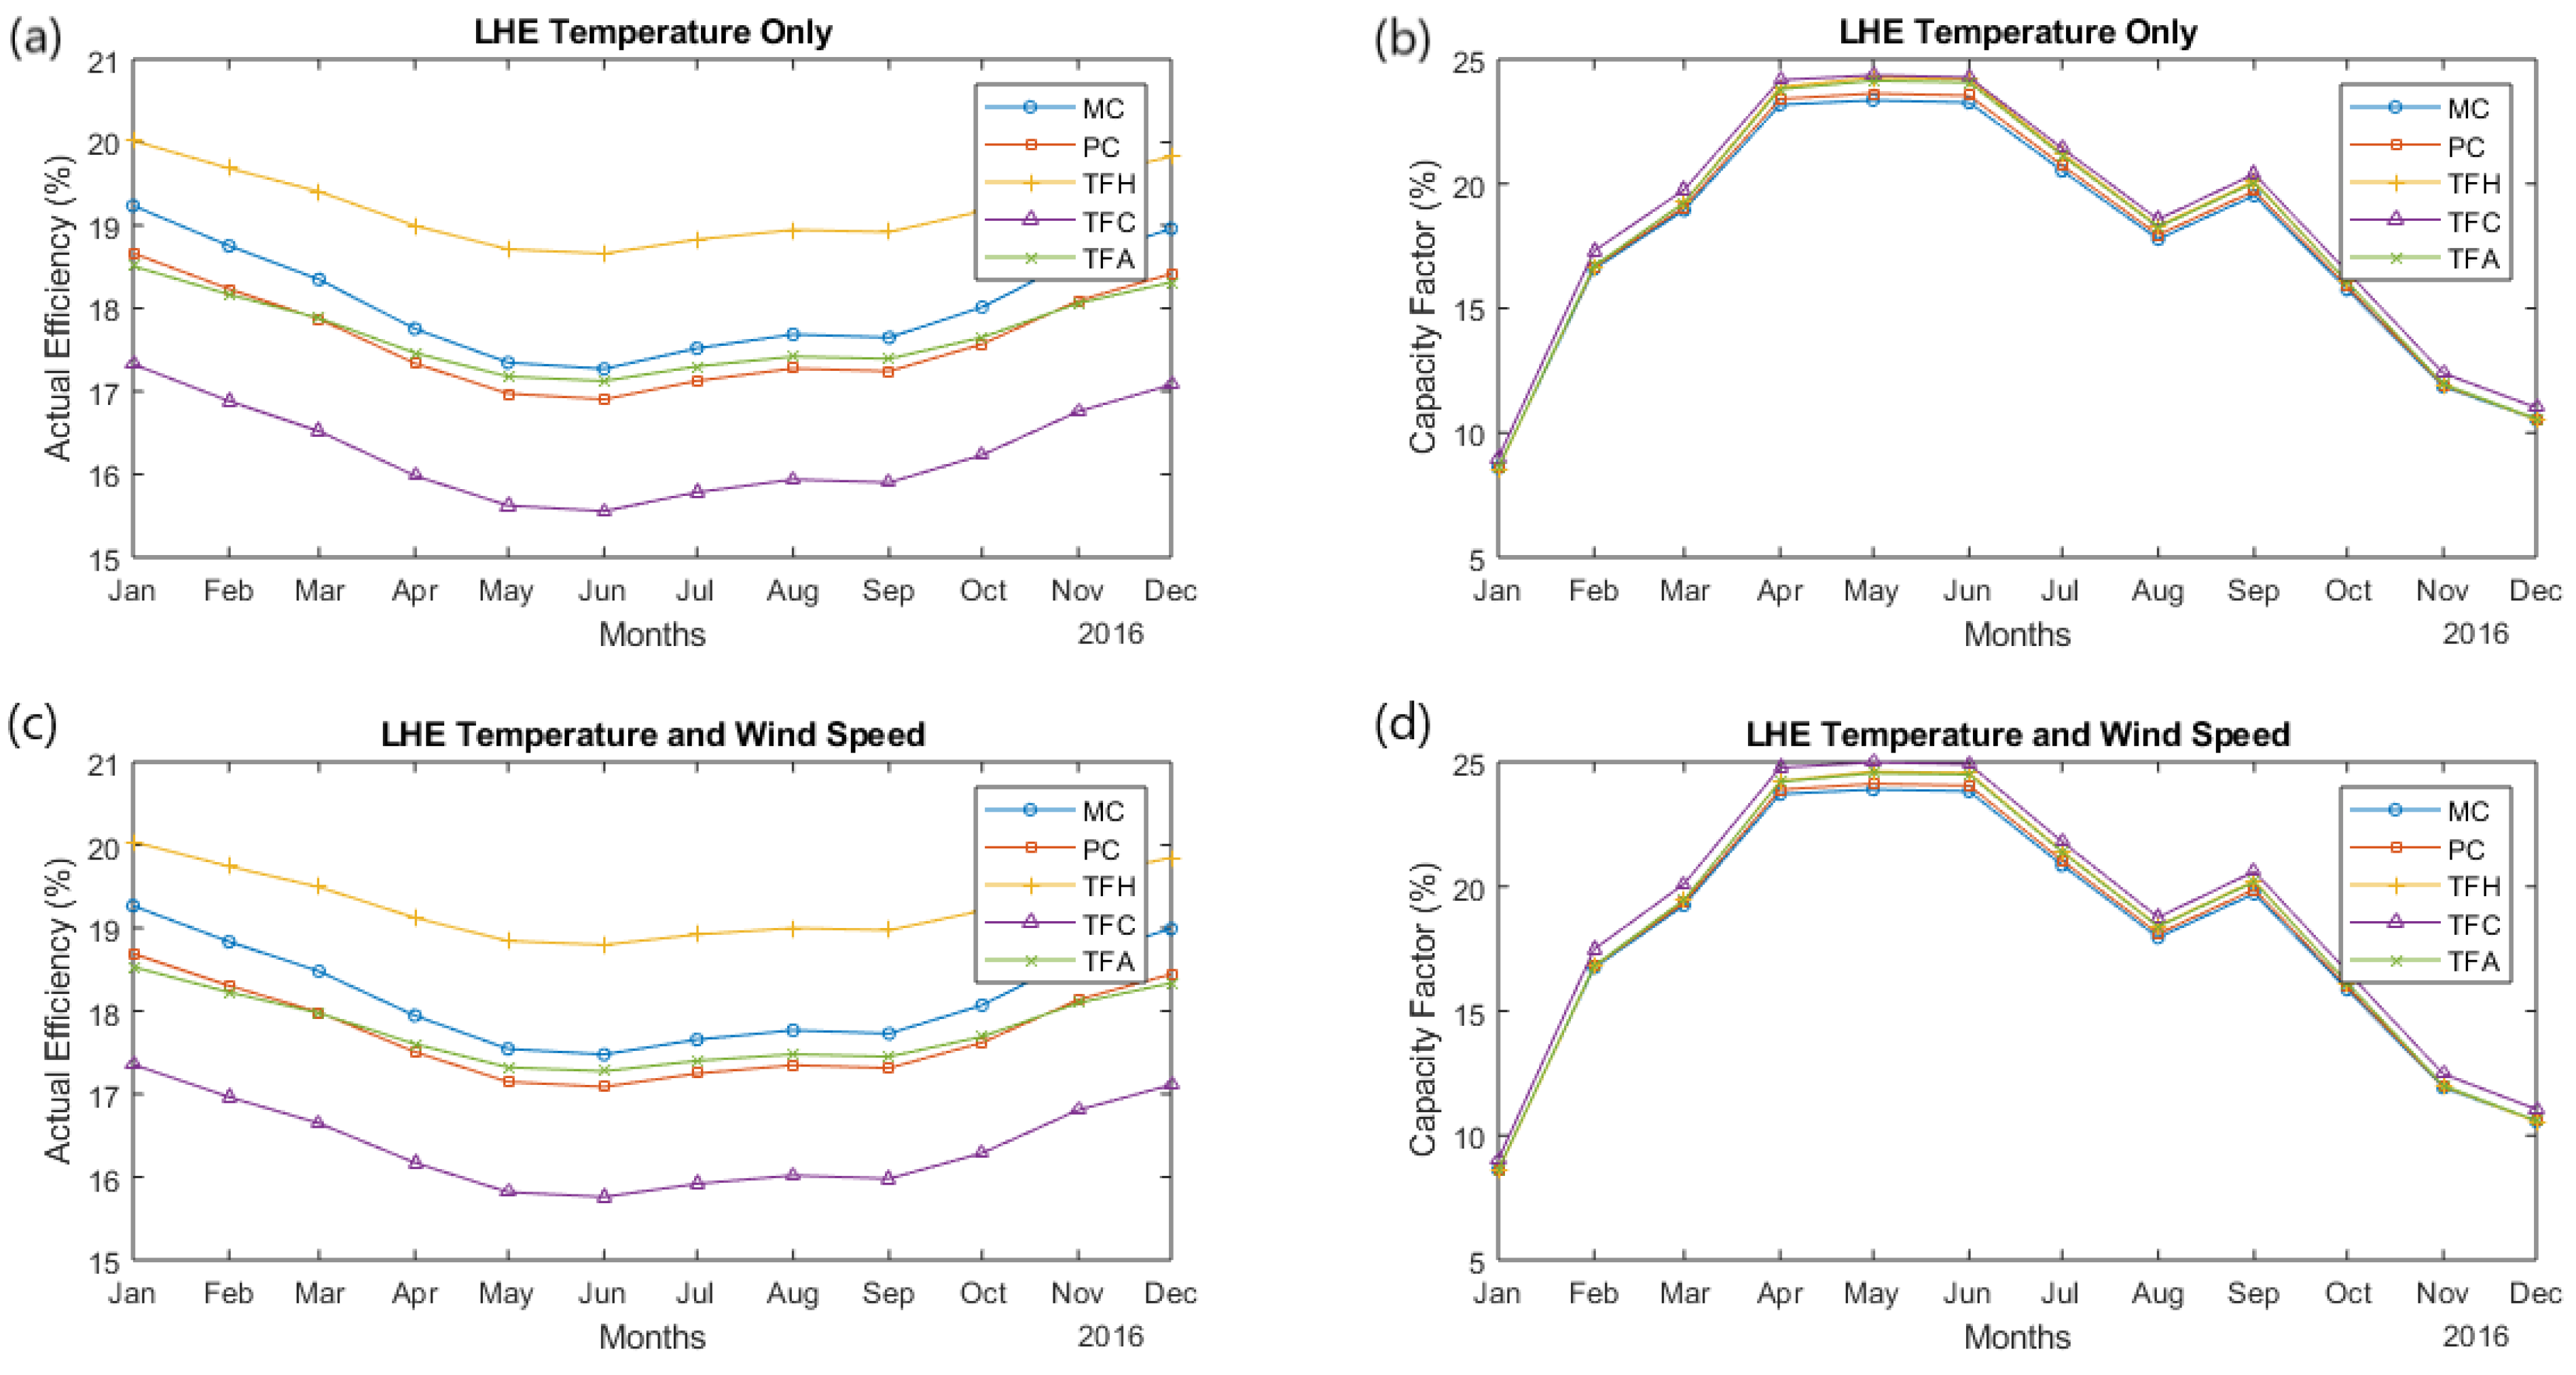
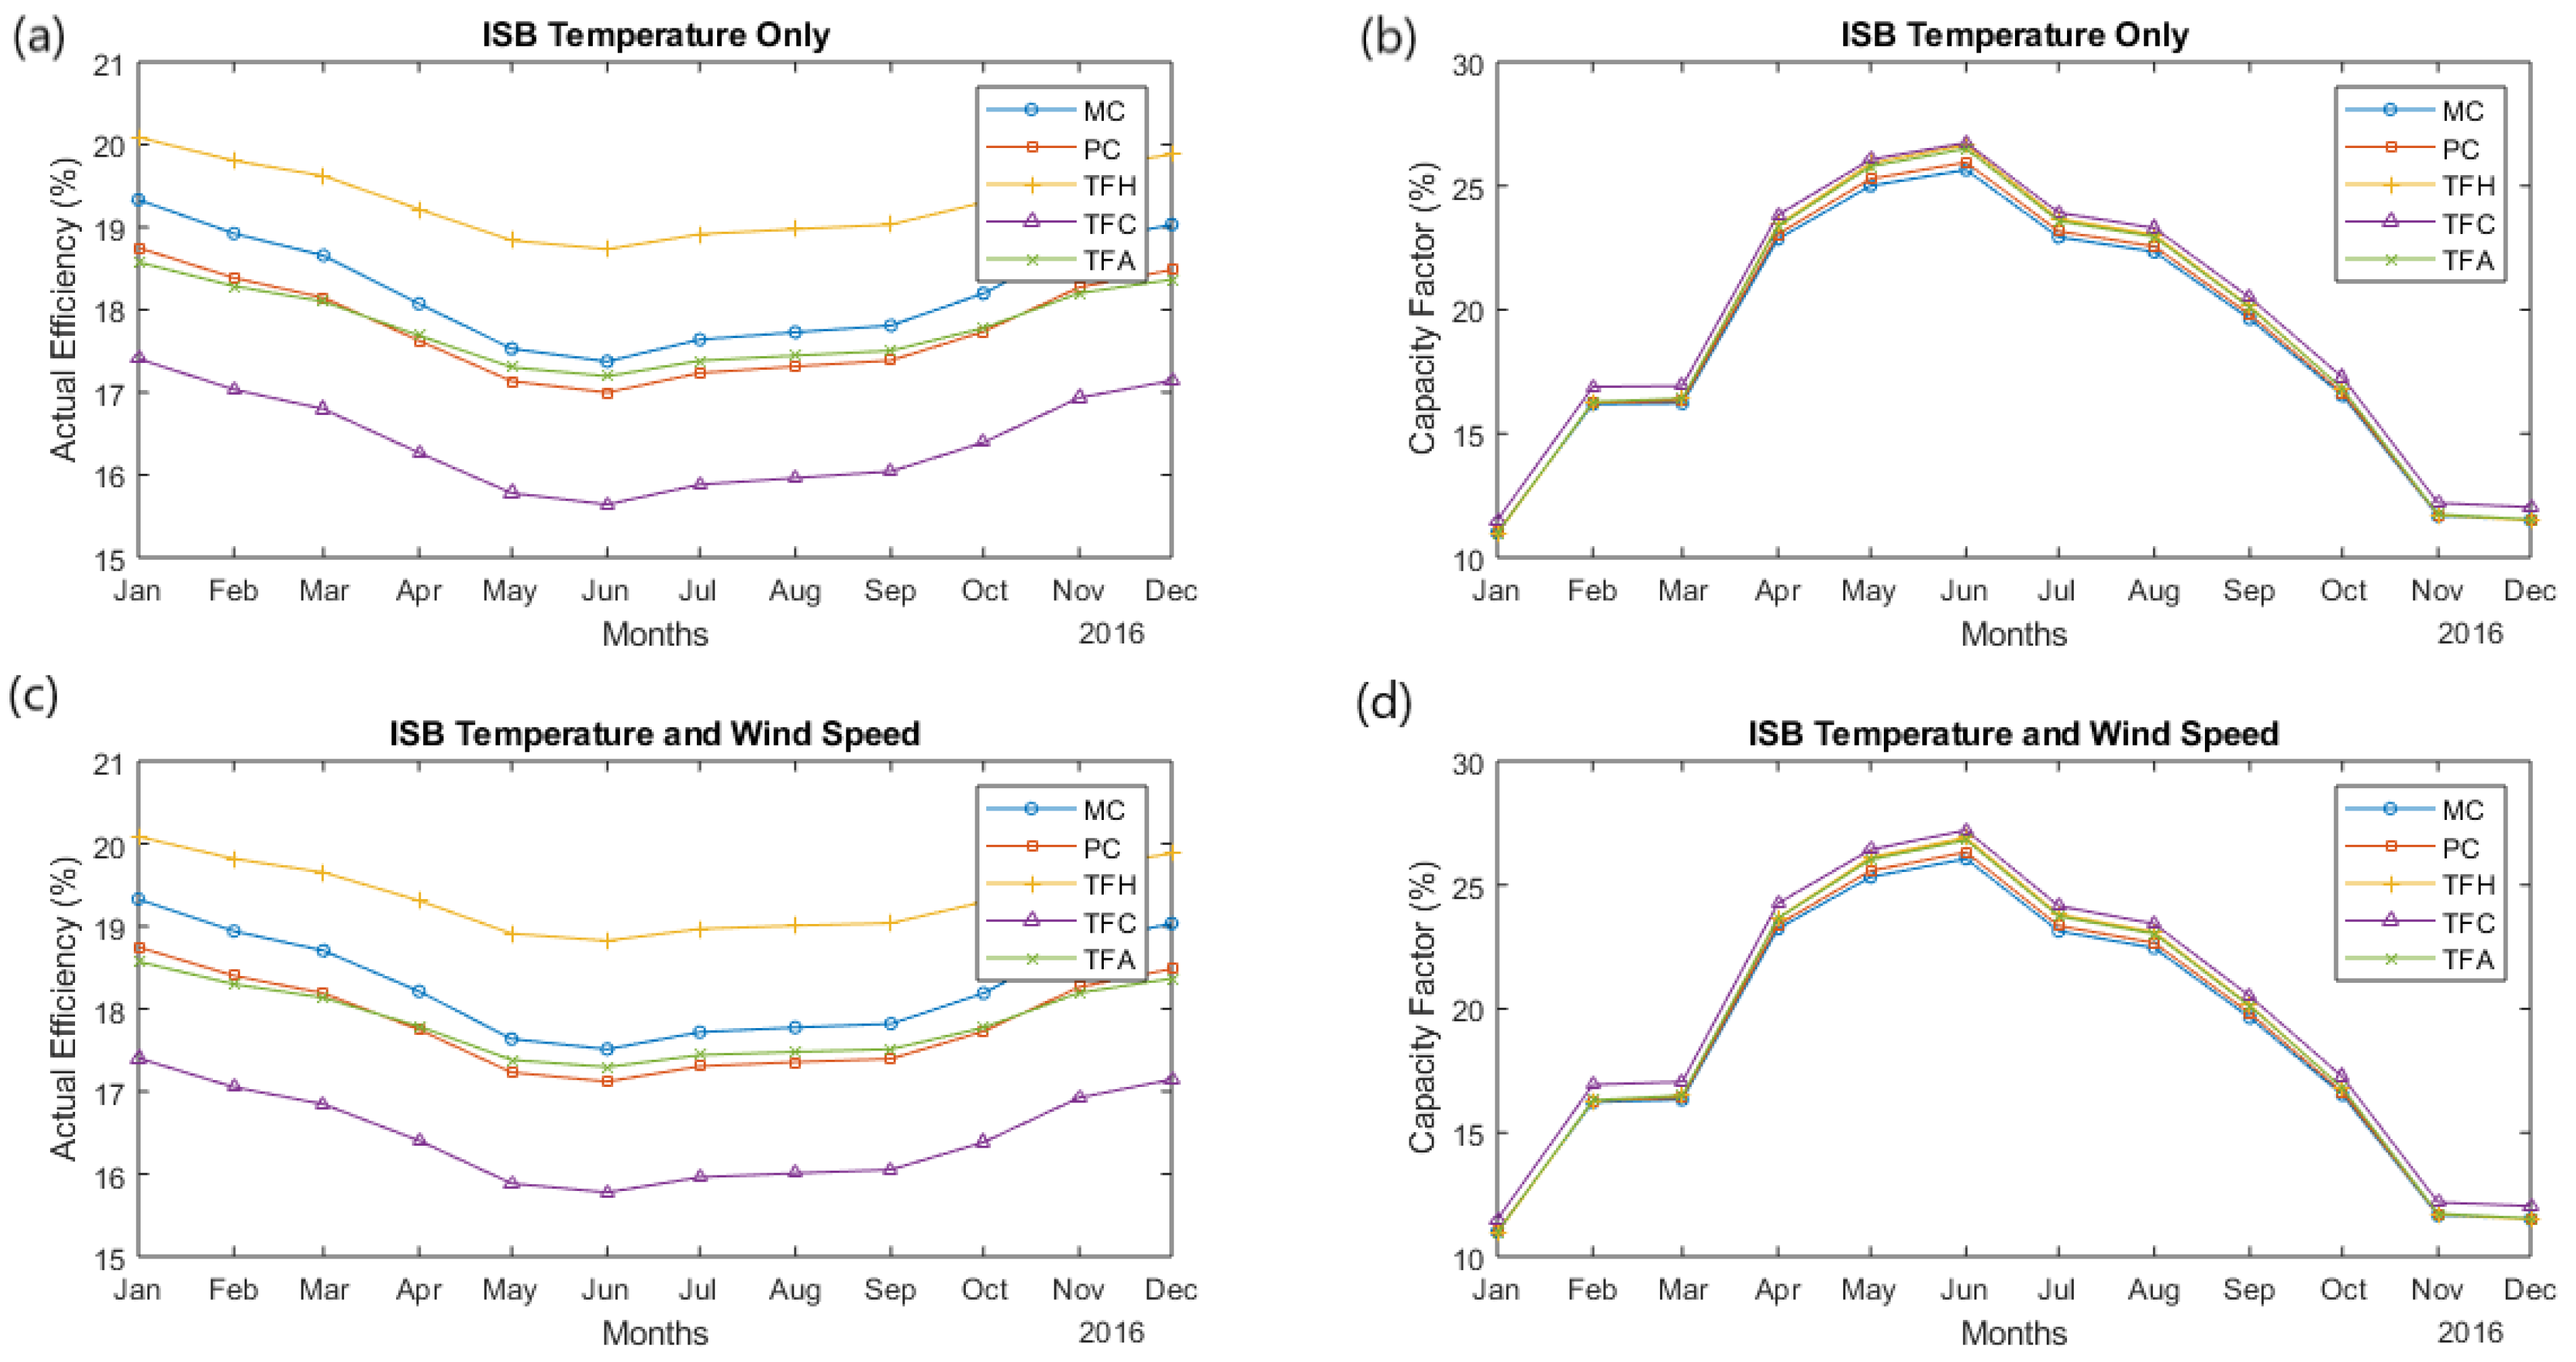
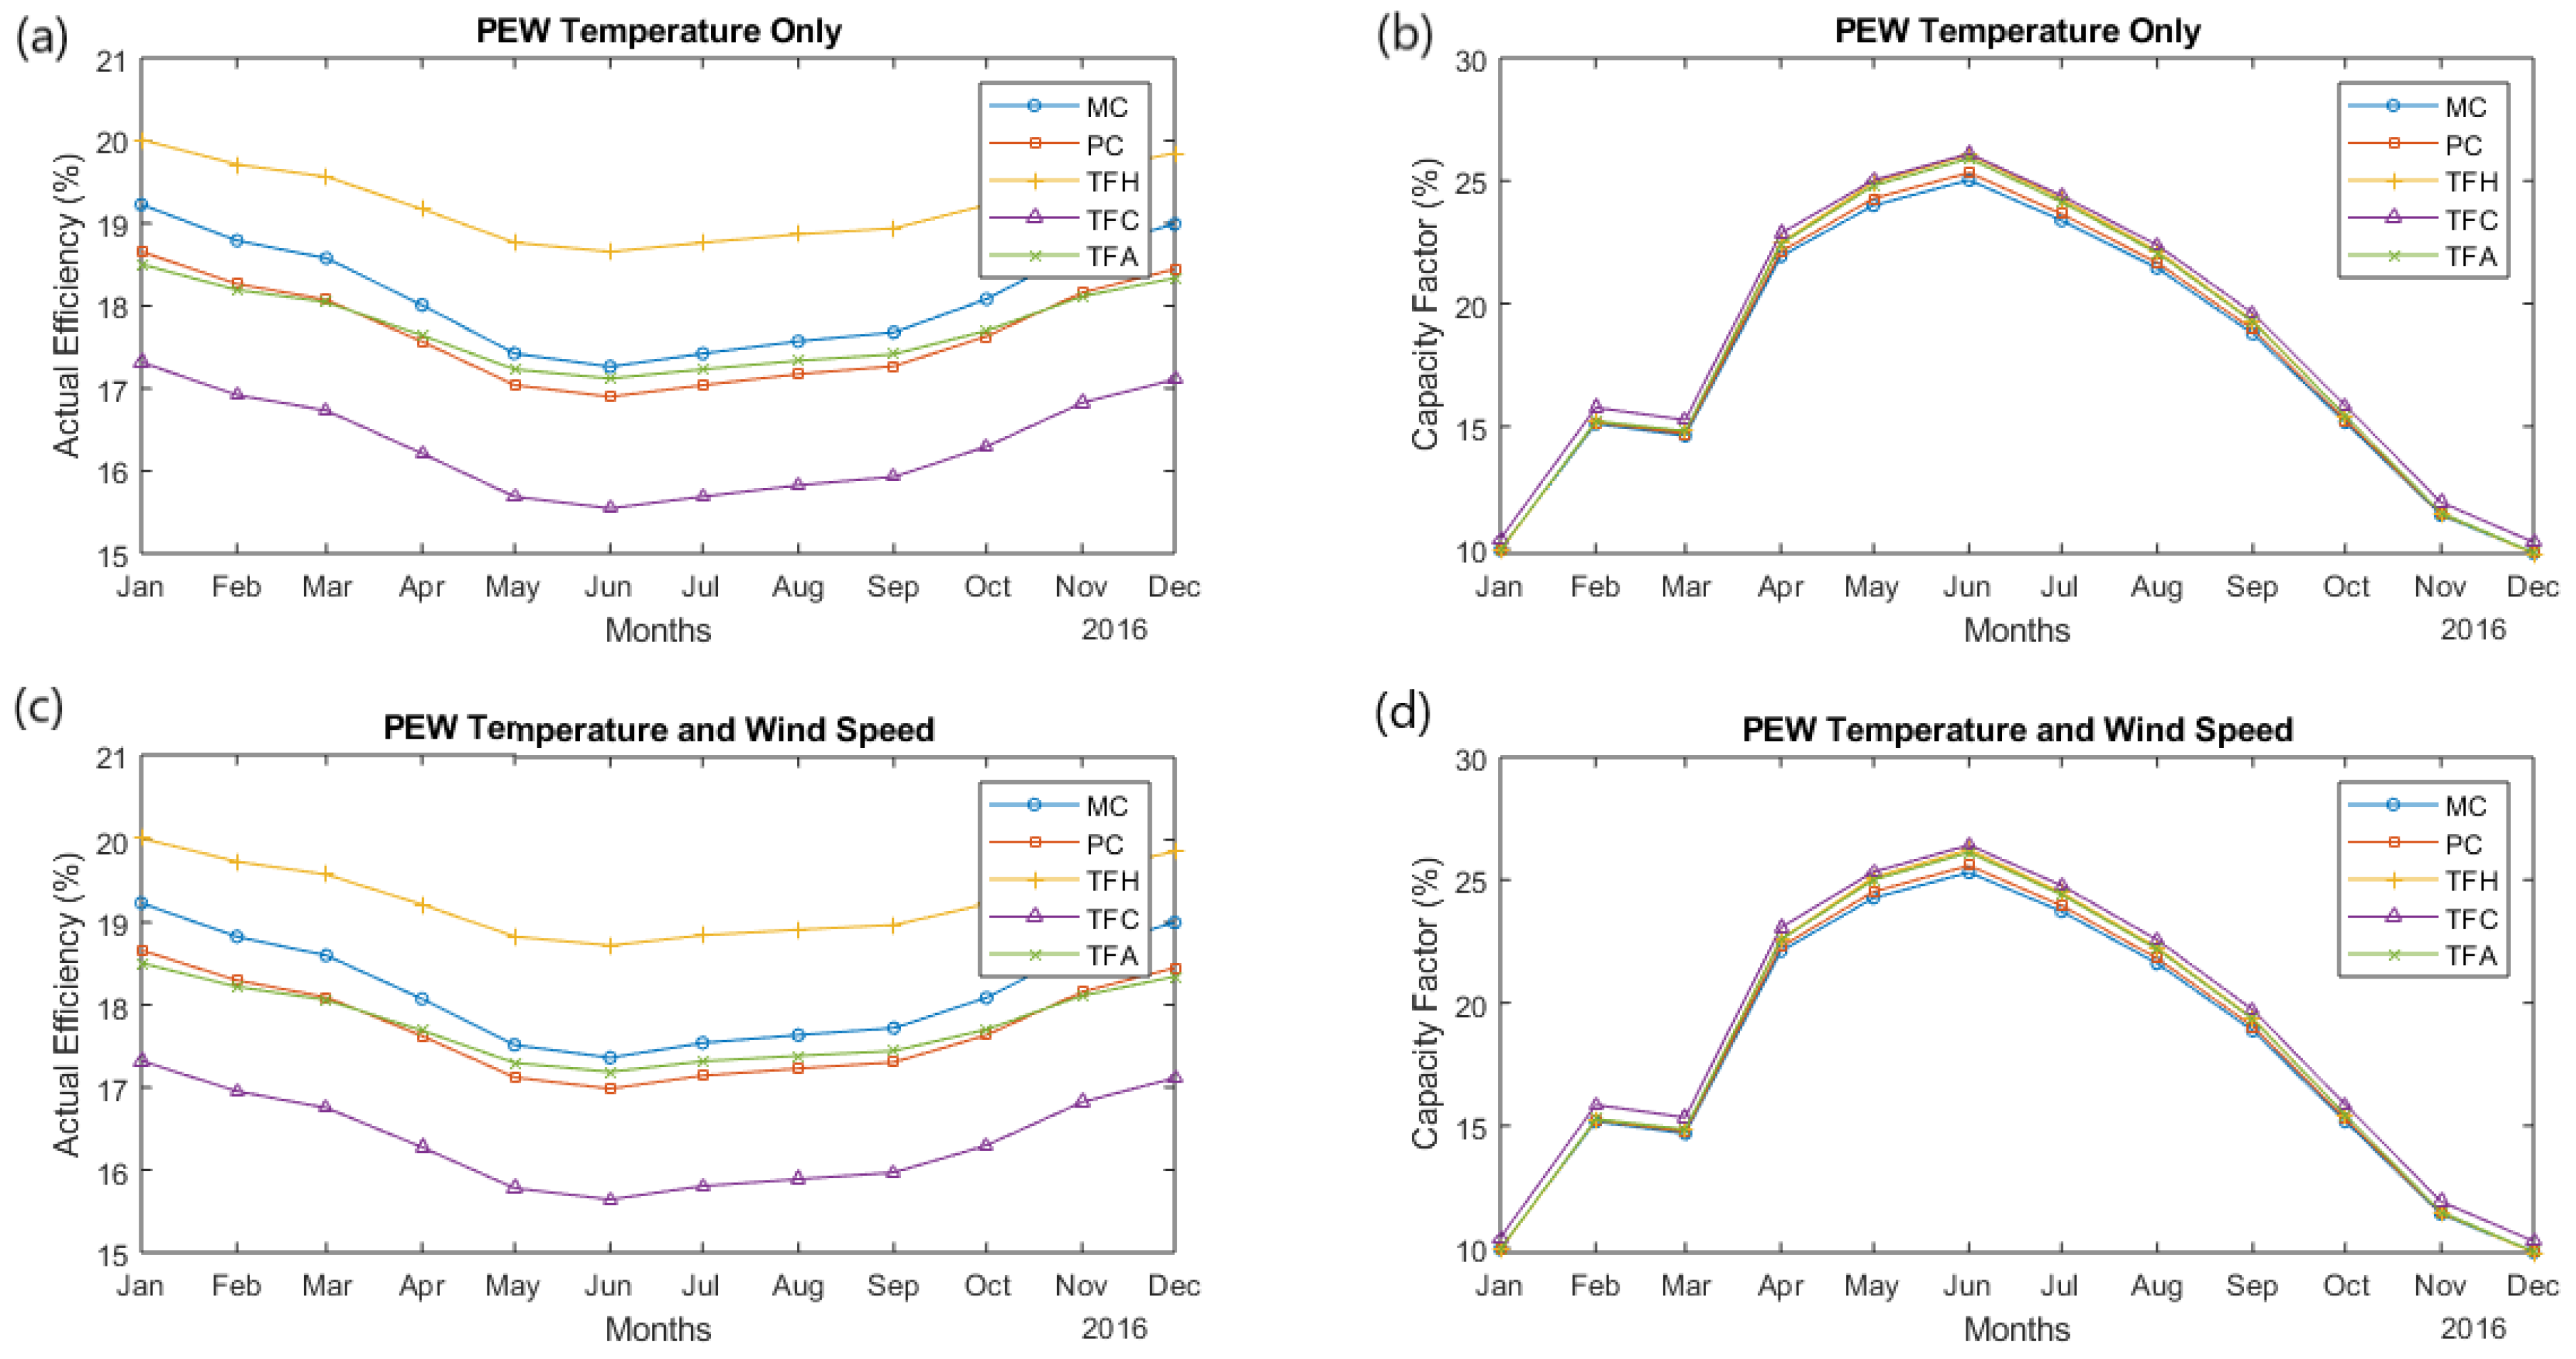
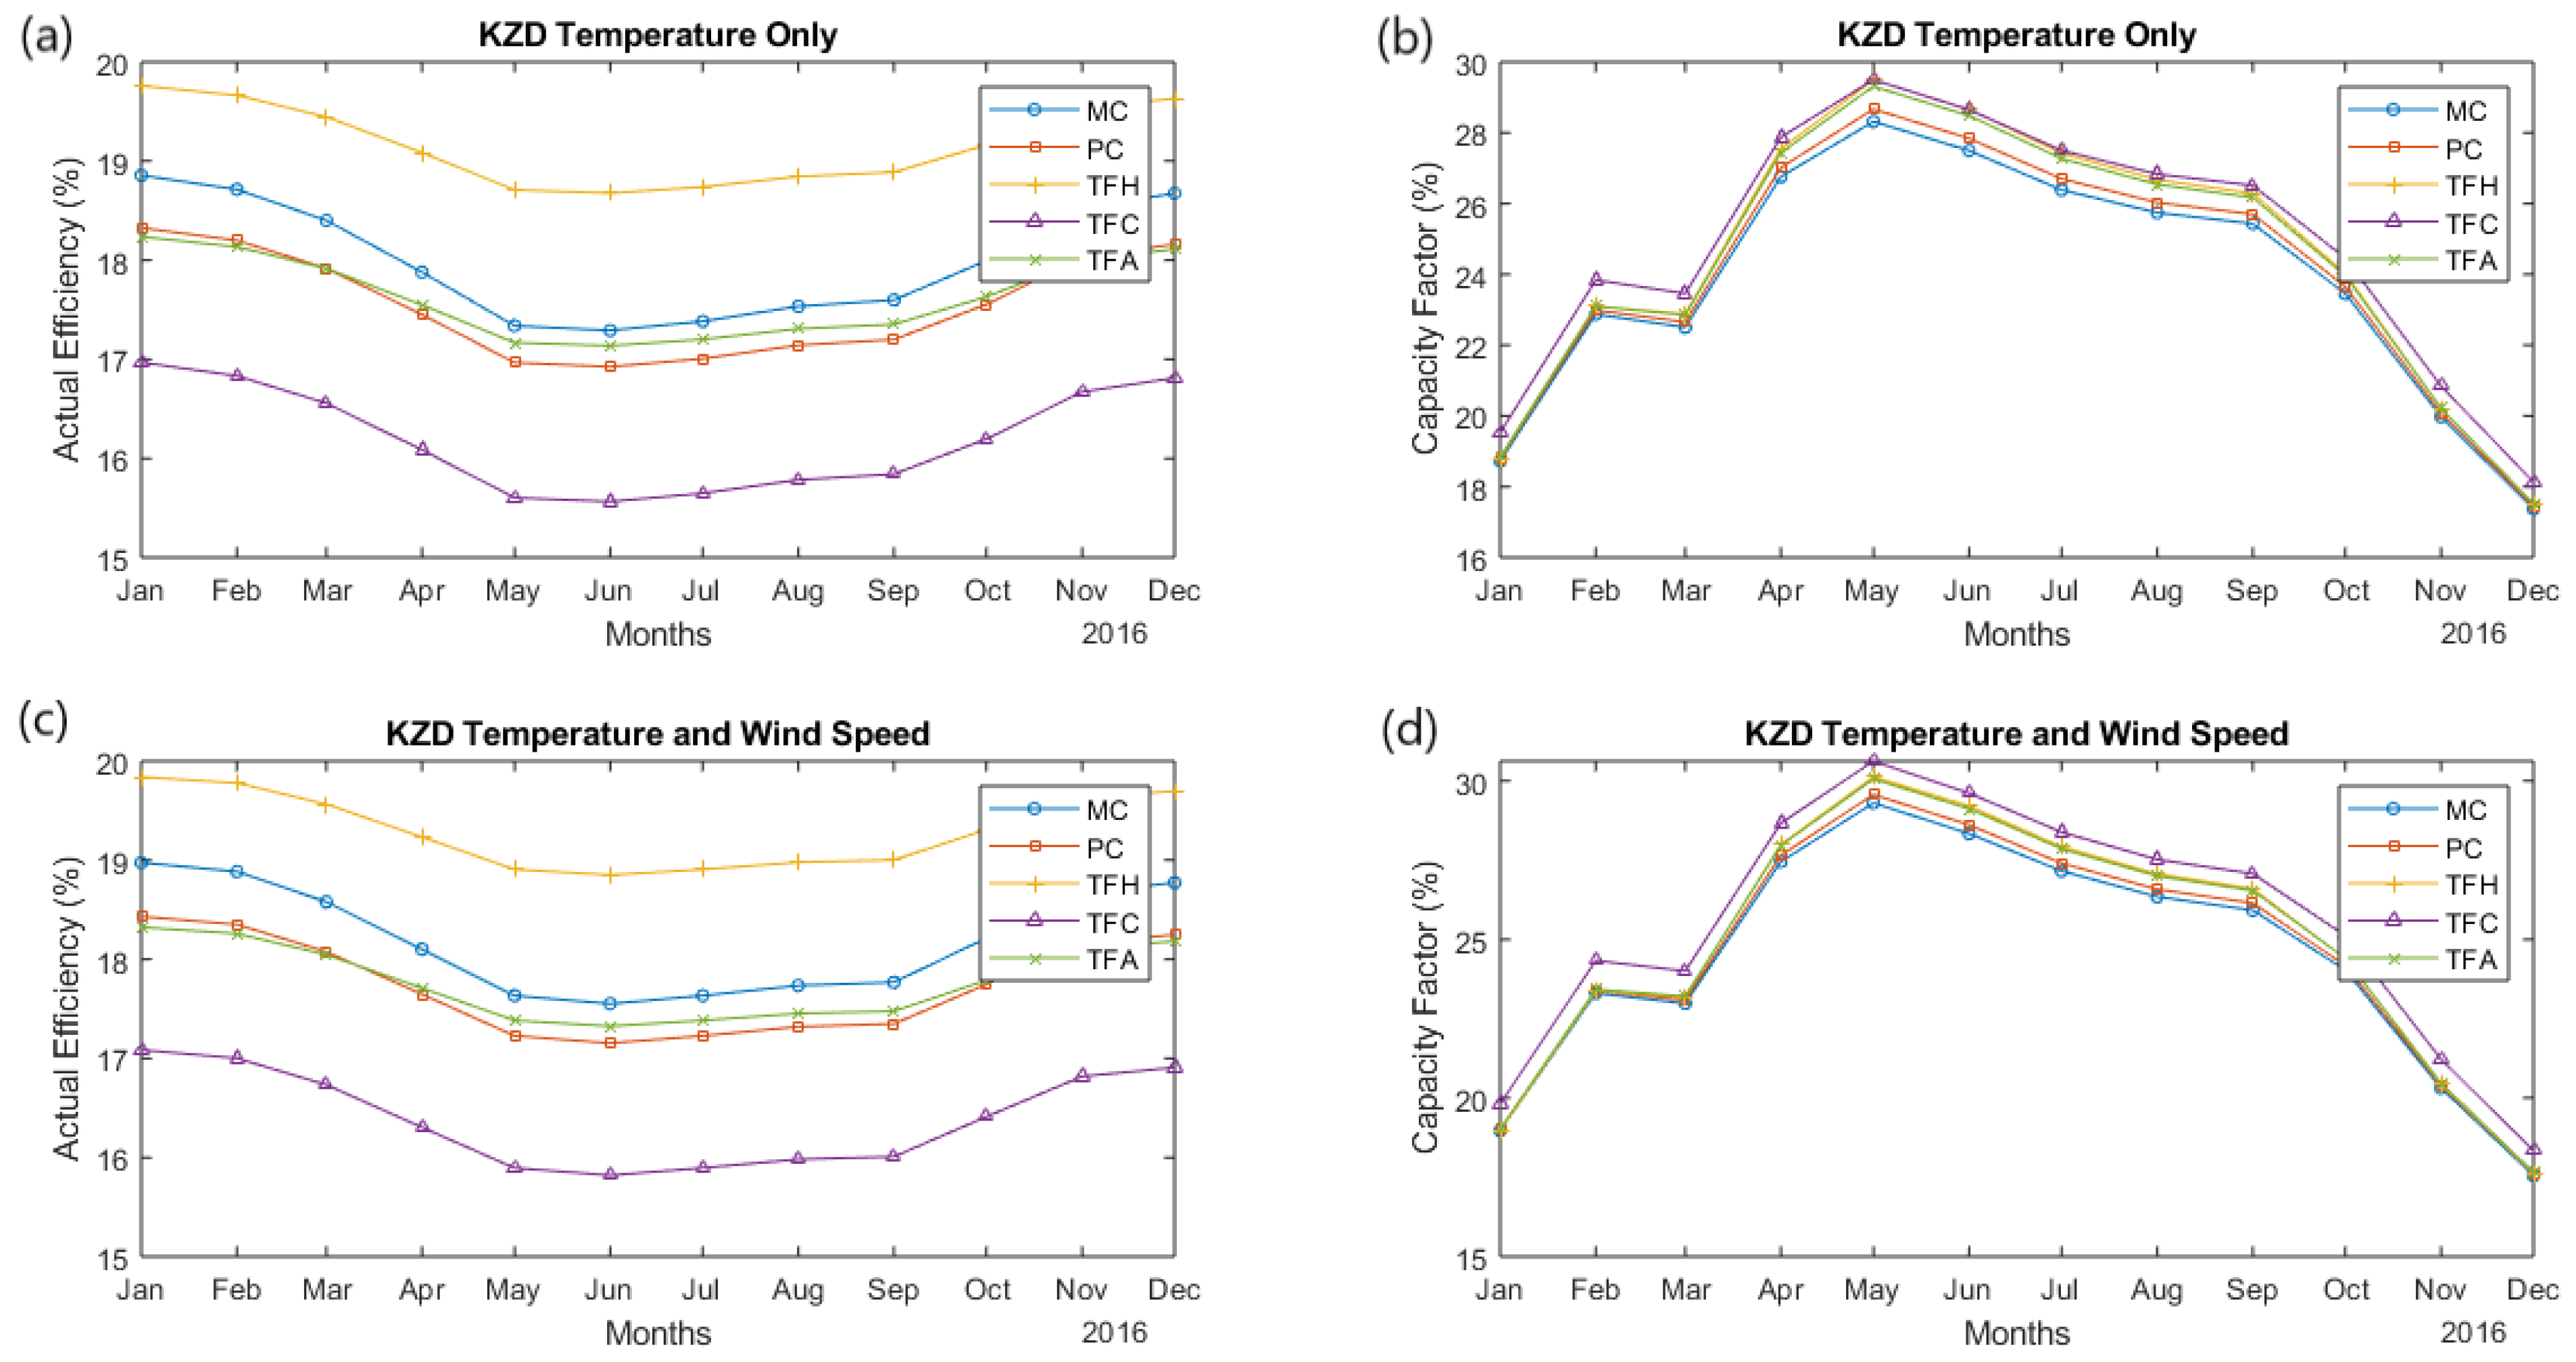
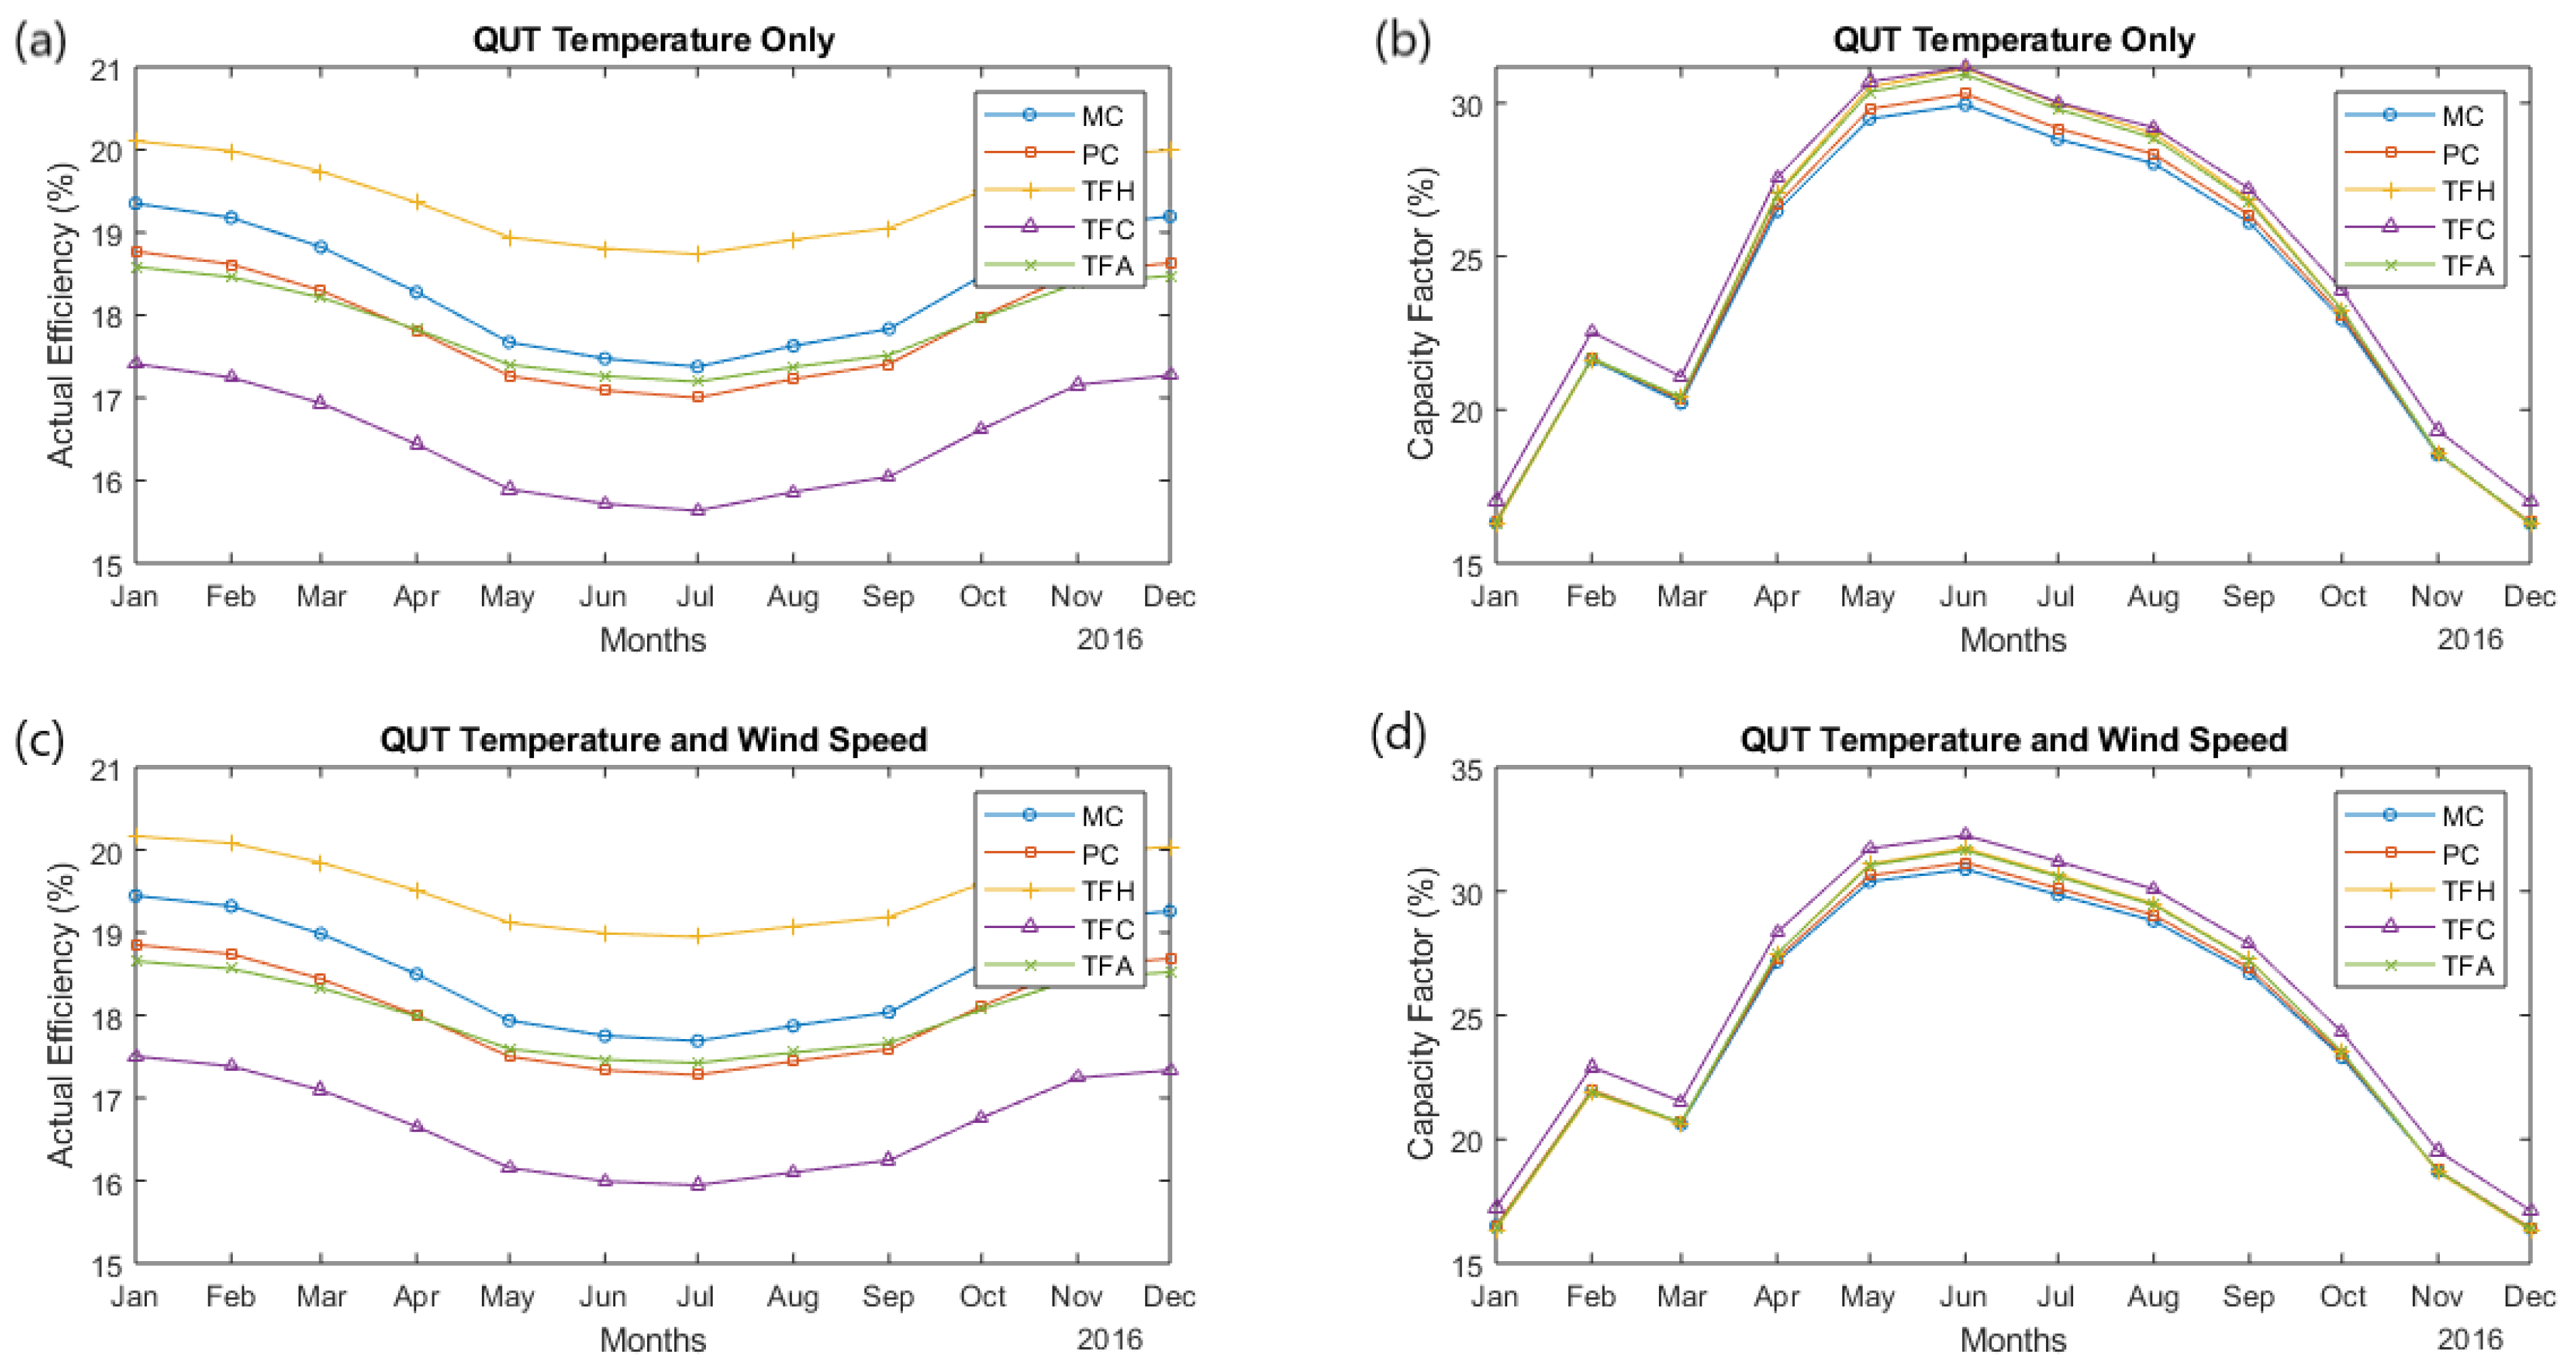
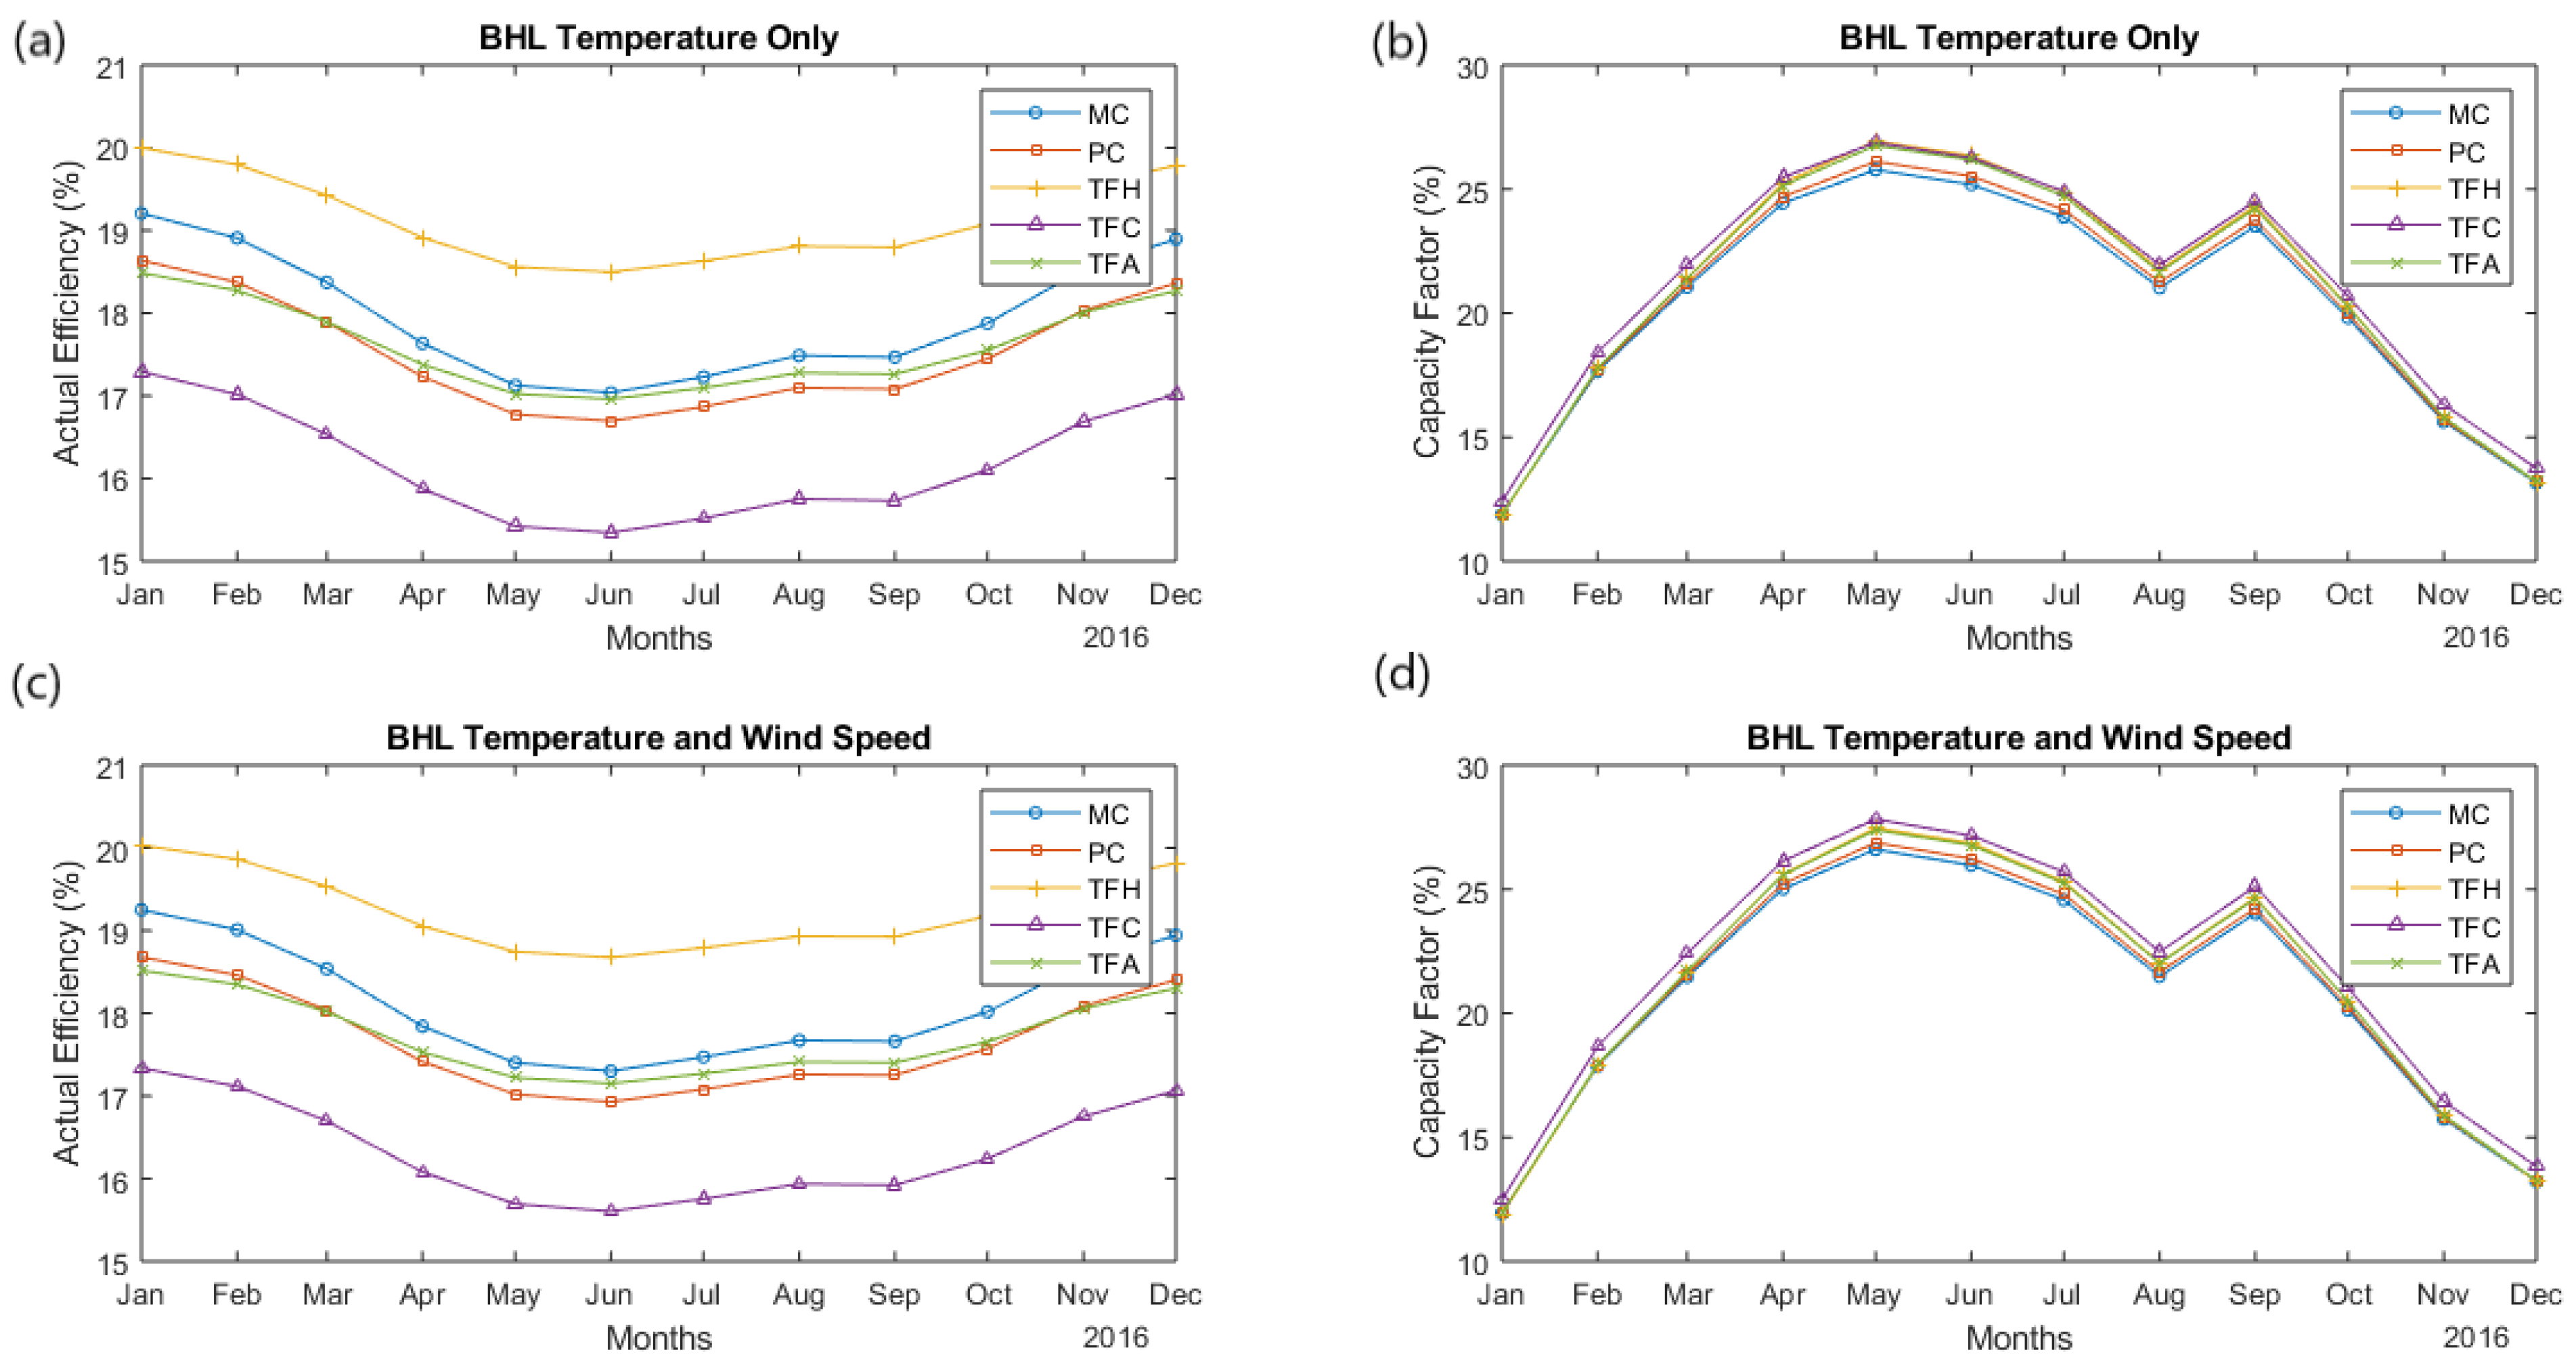
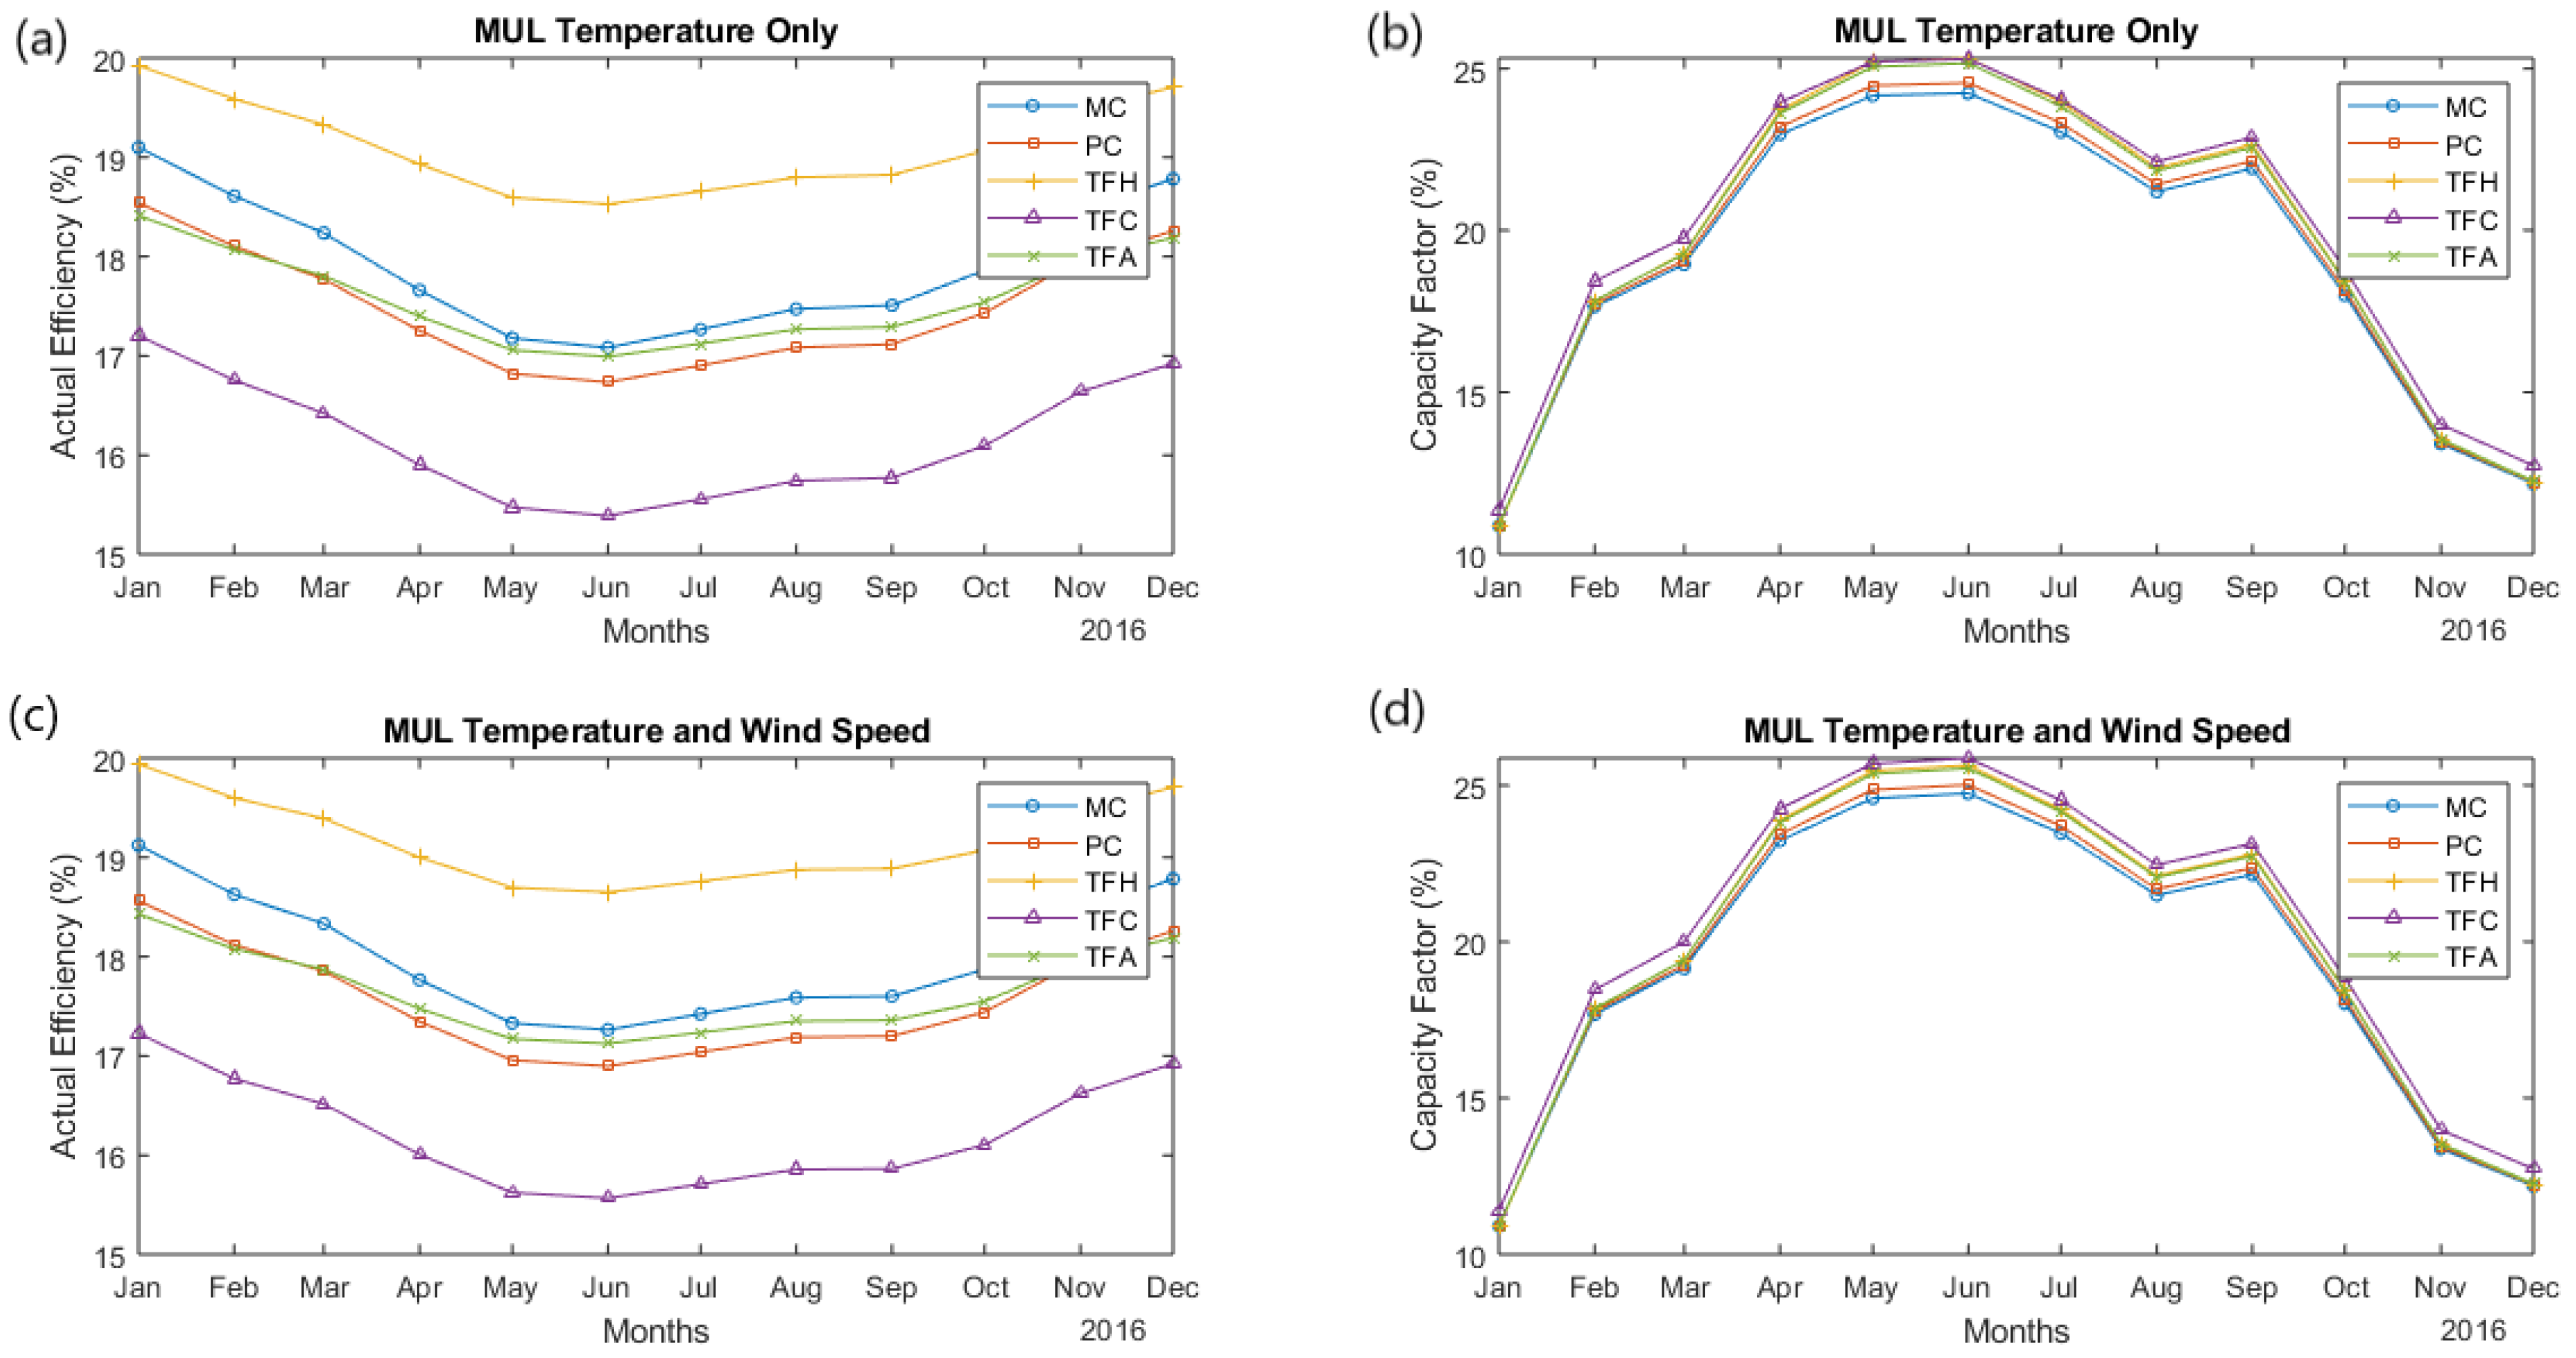
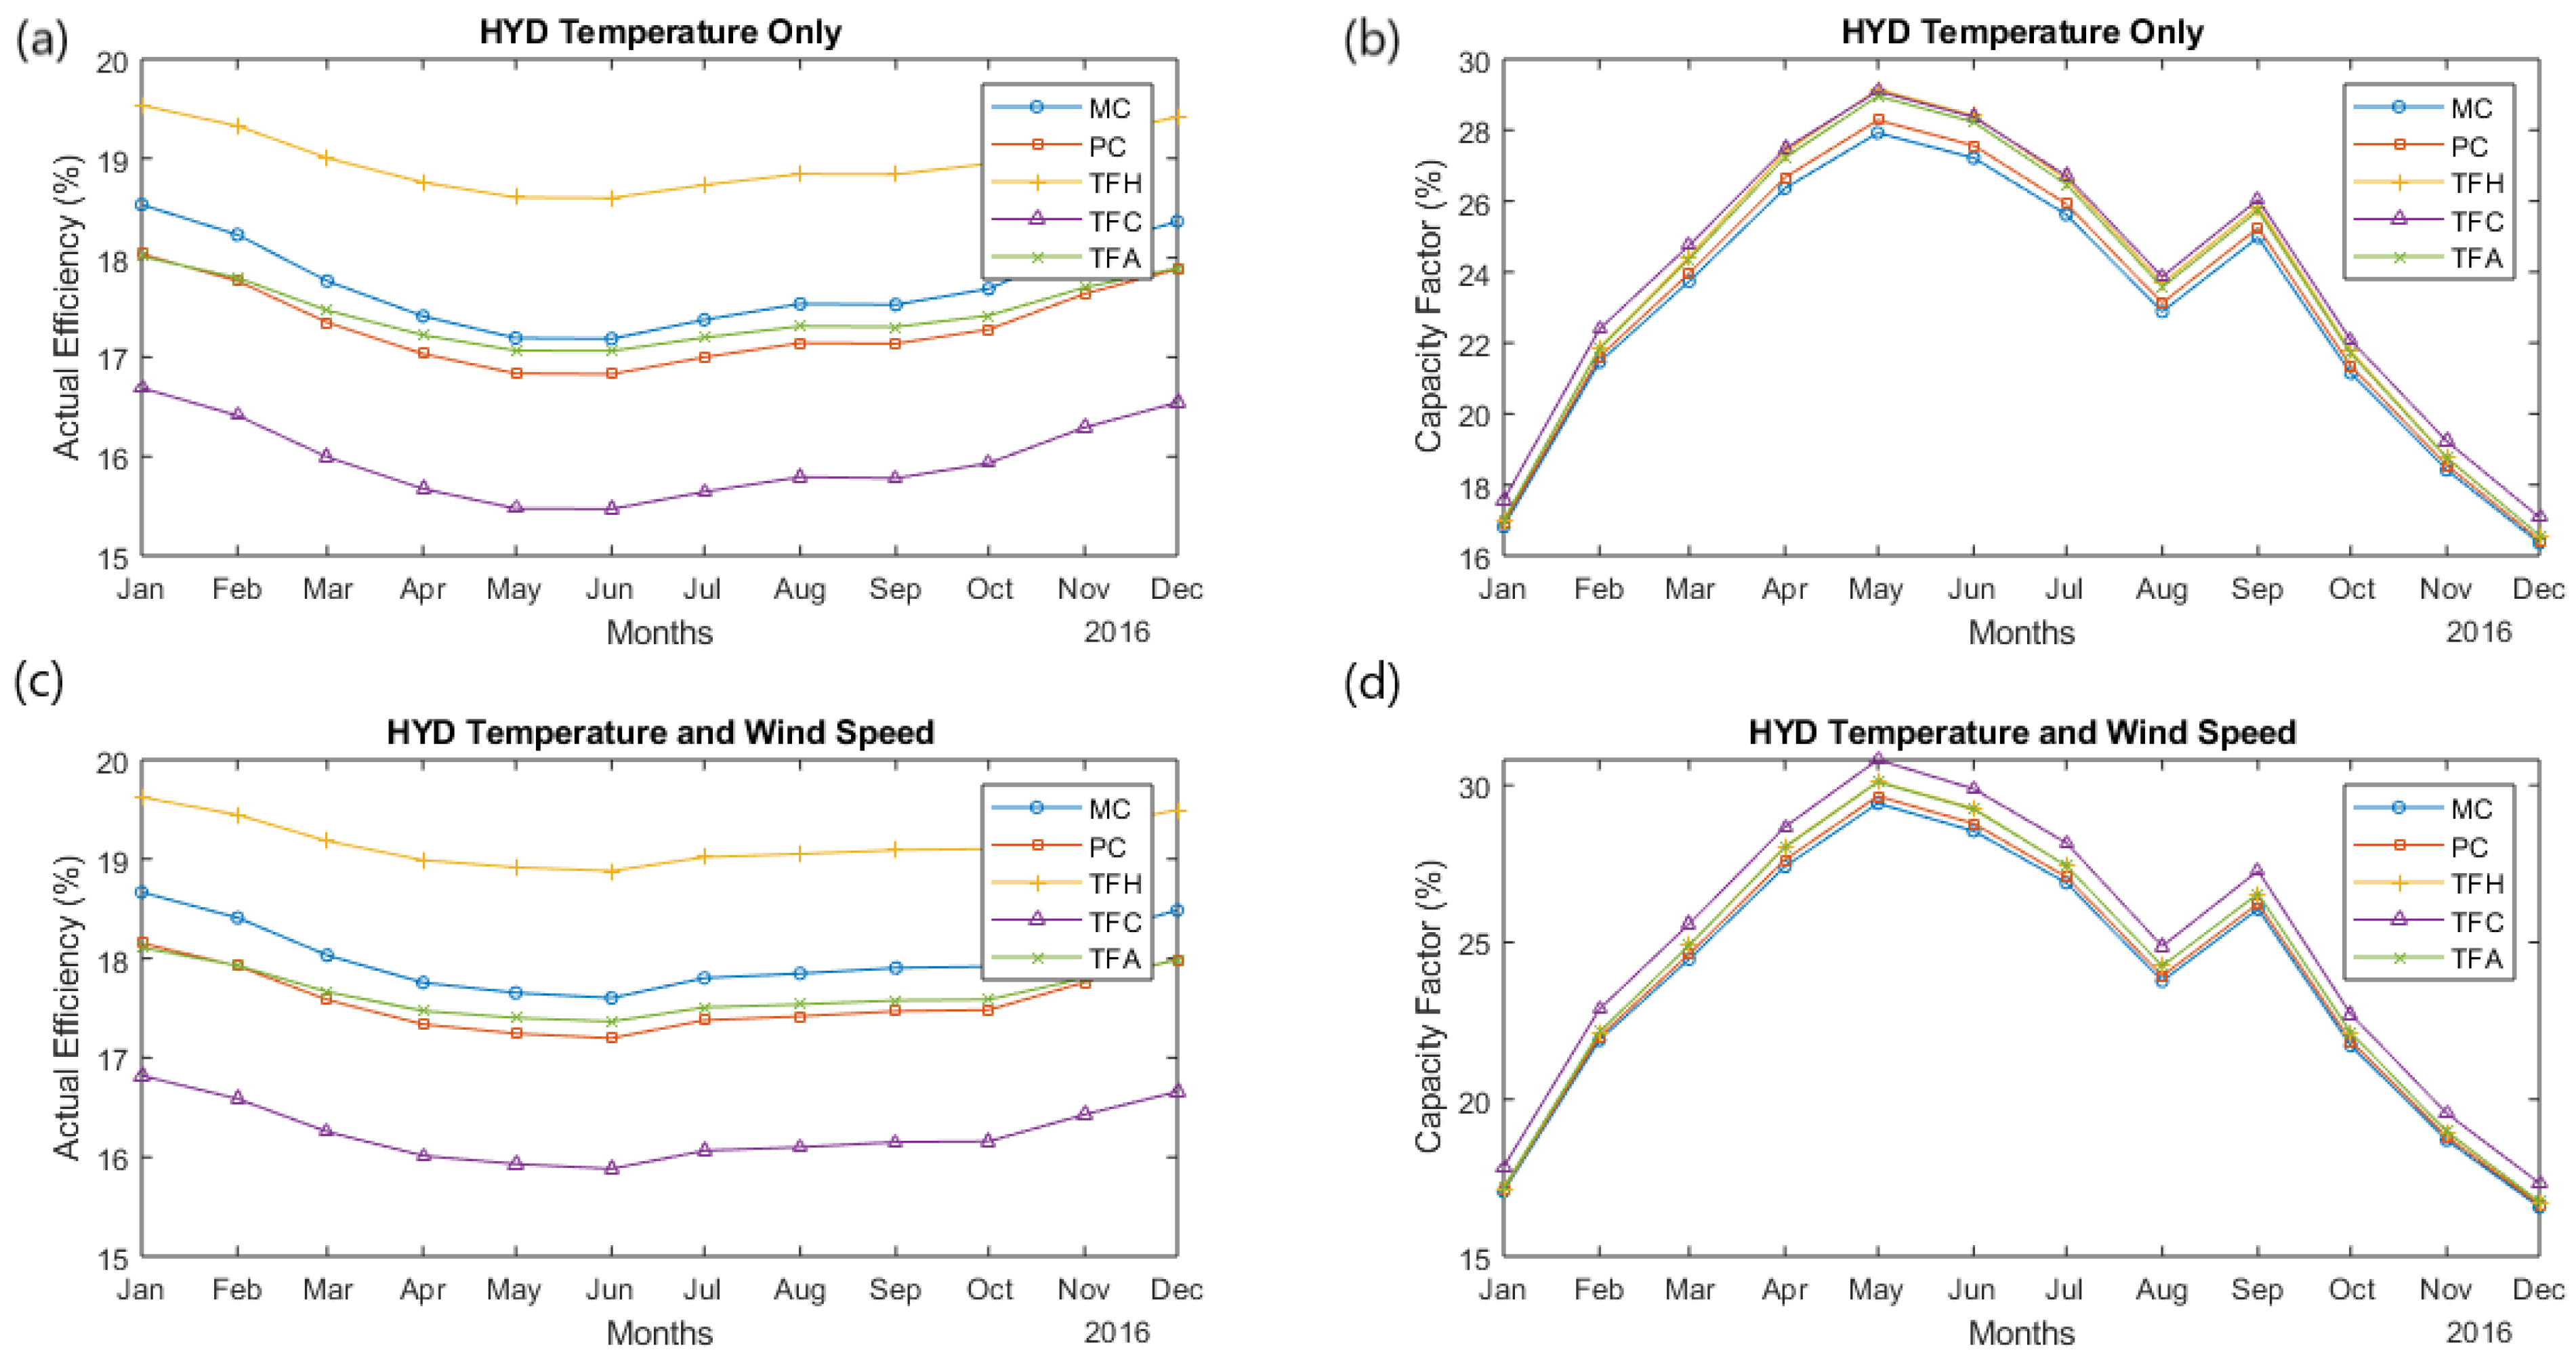
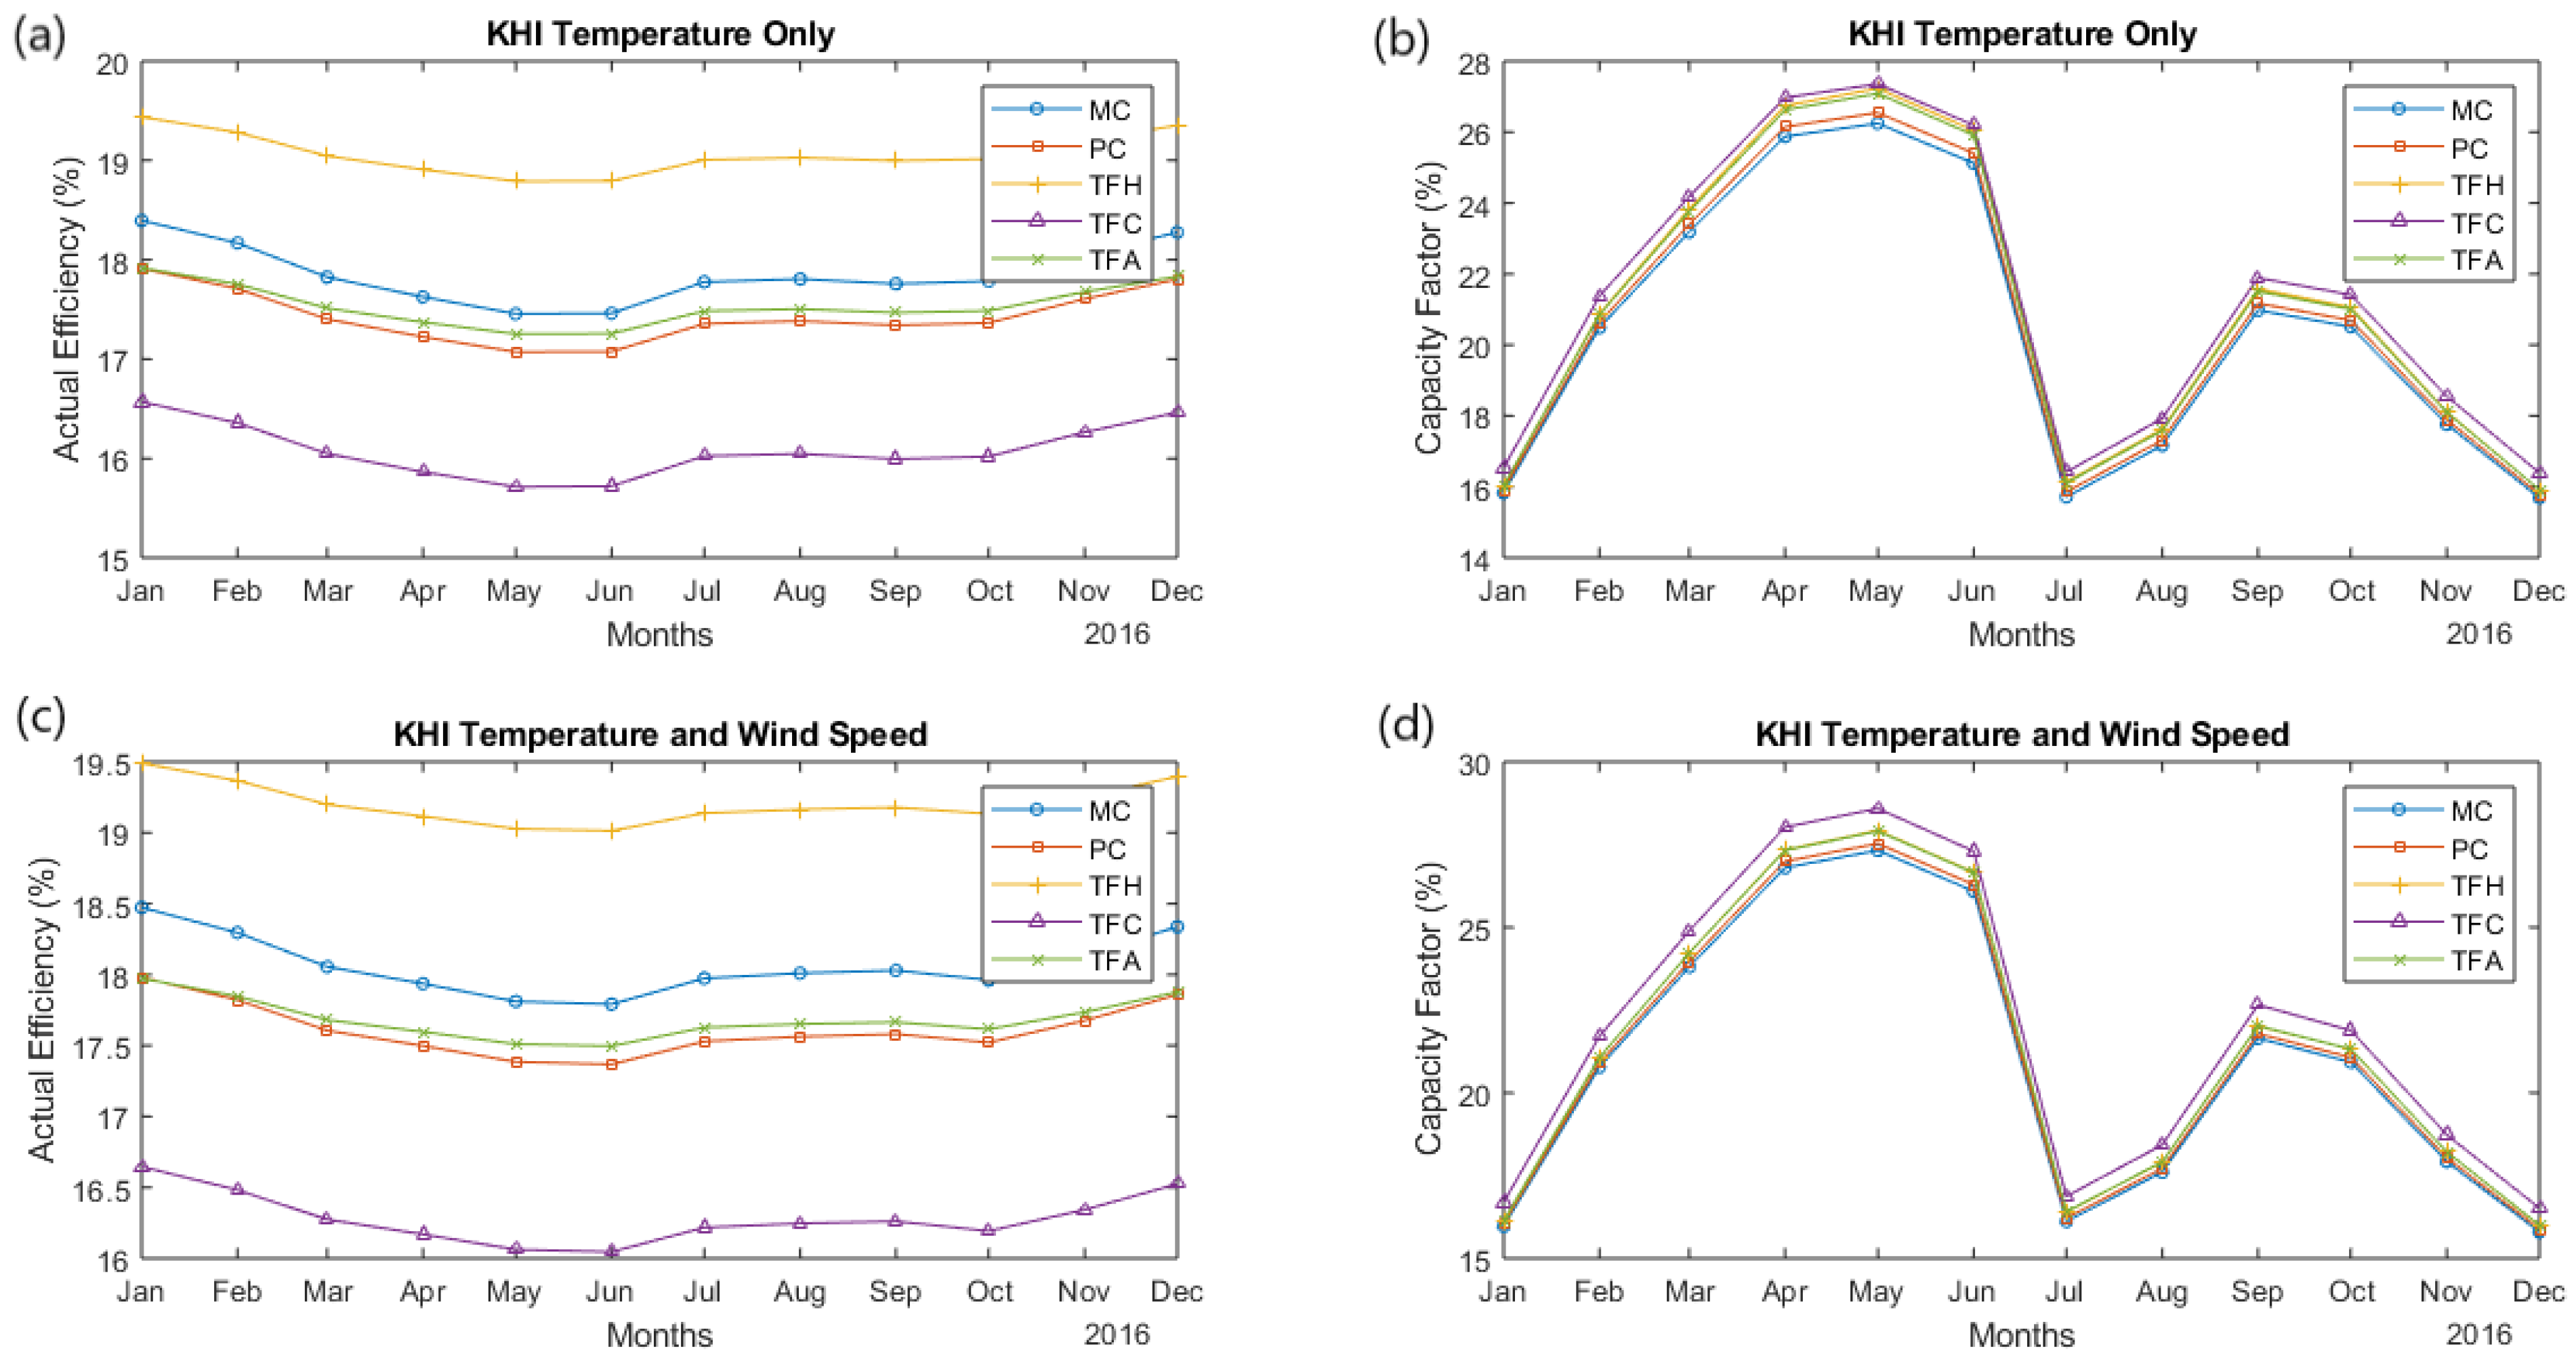
4.5. Monthly Variations in Module’s Actual Efficiency
4.6. Monthly Variations in Capacity Factor
5. Discussion
6. Conclusions
Author Contributions
Funding
Institutional Review Board Statement
Informed Consent Statement
Data Availability Statement
Conflicts of Interest
Abbreviations
| Name | Description |
| PV | Photovoltaic |
| DHI | Diffuse Horizontal Irradiance |
| GHI | Global Horizontal Irradiance |
| DNI | Direct Normal Irradiance |
| MC | Mono-crystalline silicon |
| PC | Poly-crystalline silicon |
| ESMAP | Energy Sector Management Assistance Program |
| TFH | Heterogeneous intrinsic thin-film |
| TFC | Copper–indium–gallium–selenide |
| TFA | Thin-film amorphous silicon |
| STC | Standard Test Conditions |
References
- Pérez, J.C.; González, A.; Díaz, J.P.; Expósito, F.J.; Felipe, J. Climate change impact on future photovoltaic resource potential in an orographically complex archipelago, the Canary Islands. Renew. Energy 2019, 133, 749–759. [Google Scholar] [CrossRef]
- Asim, M.; Usman, M.; Abbasi, M.S.; Ahmad, S.; Mujtaba, M.A.; Soudagar, M.E.M.; Mohamed, A. Estimating the Long-Term Effects of National and International Sustainable Transport Policies on Energy Consumption and Emissions of Road Transport Sector of Pakistan. Sustainability 2022, 14, 5732. [Google Scholar] [CrossRef]
- Masson, V.; Bonhomme, M.; Salagnac, J.-L.; Briottet, X.; Lemonsu, A. Solar panels reduce both global warming and urban heat island. Front. Environ. Sci. 2014, 2, 14. [Google Scholar] [CrossRef]
- Asim, M.; Usman, M.; Hussain, J.; Farooq, M.; Naseer, M.I.; Mujtaba, M.; Almehmadi, F.A. Experimental Validation of Numerical Model to predict the performance of Solar PV cells. Front. Energy Res. 2022, 10, 735. [Google Scholar] [CrossRef]
- International Renewable Energy Agency. Renewable Capacity Highlights; International Renewable Energy Agency: Abu Dhabi, United Arab Emirates, 2021. Available online: https://www.irena.org/-/media/Files/IRENA/Agency/Publication/2021/Apr/IRENA_-RE_Capacity_Highl (accessed on 25 August 2022).
- Asim, M.; Muhammad, S.; Amjad, M.; Abdullah, M.; Mujtaba, M.A.; Kalam, M.A.; Mousa, M.; Soudagar, M.E.M. Design and Parametric Optimization of the High-Speed Pico Waterwheel for Rural Electrification of Pakistan. Sustainability 2022, 14, 6930. [Google Scholar] [CrossRef]
- Kanan, S.; Dewsbury, J.; Lane-Serff, G.F.; Asim, M. The Effect of Ground Conditions under a Solar Pond on the Performance of a Solar Air-conditioning System. Energy Procedia 2016, 91, 777–784. [Google Scholar] [CrossRef]
- Asim, M.; Milano, J.; Khan, H.I.; Hanzla Tahir, M.; Mujtaba, M.A.; Shamsuddin, A.H.; Abdullah, M.; Kalam, M.A. Investigation of Mono-Crystalline Photovoltaic Active Cooling Thermal System for Hot Climate of Pakistan. Sustainability 2022, 14, 10228. [Google Scholar] [CrossRef]
- Saleem, M.W.; Abbas, A.; Asim, M.; Uddin, G.M.; Chaudhary, T.N.; Ullah, A. Design and cost estimation of solar powered reverse osmosis desalination system. Adv. Mech. Eng. 2021, 13. [Google Scholar] [CrossRef]
- Pathak, S.K.; Sharma, P.O.; Goel, V.; Bhattacharyya, S.; Aybar, H.Ş.; Meyer, J.P. A detailed review on the performance of photovoltaic/thermal system using various cooling methods. Sustain. Energy Technol. Assess. 2022, 51, 101844. [Google Scholar] [CrossRef]
- Mussard, M.; Amara, M. Performance of solar photovoltaic modules under arid climatic conditions: A review. Sol. Energy 2018, 174, 409–421. [Google Scholar] [CrossRef]
- Zdyb, A.; Gulkowski, S. Performance assessment of four different photovoltaic technologies in Poland. Energies 2020, 13, 196. [Google Scholar] [CrossRef] [Green Version]
- Huld, T.; Amillo, A.M.G. Estimating PV module performance over large geographical regions: The role of irradiance, air temperature, wind speed and solar spectrum. Energies 2015, 8, 5159–5181. [Google Scholar] [CrossRef] [Green Version]
- Ameur, A.; Sekkat, A.; Loudiyi, K.; Aggour, M. Performance evaluation of different photovoltaic technologies in the region of Ifrane, Morocco. Energy Sustain. Dev. 2019, 52, 96–103. [Google Scholar] [CrossRef]
- Aly, S.P.; Ahzi, S.; Barth, N. Effect of physical and environmental factors on the performance of a photovoltaic panel. Sol. Energy Mater. Sol. Cells 2019, 200, 109948. [Google Scholar] [CrossRef]
- Rahman, M.M.; Hasanuzzaman, M.; Rahim, N.A. Effects of various parameters on PV-module power and efficiency. Energy Convers. Manag. 2015, 103, 348–358. [Google Scholar] [CrossRef]
- Amelia, A.; Irwan, Y.; Leow, W.; Irwanto, M.; Safwati, I.; Zhafarina, M. Investigation of the effect temperature on photovoltaic (PV) panel output performance. Int. J. Adv. Sci. Eng. Inf. Technol. 2016, 6, 682–688. [Google Scholar]
- Mekhilef, S.; Saidur, R.; Kamalisarvestani, M. Effect of dust, humidity and air velocity on efficiency of photovoltaic cells. Renew. Sustain. Energy Rev. 2012, 16, 2920–2925. [Google Scholar] [CrossRef]
- Bora, B.; Kumar, R.; Sastry, O.S.; Prasad, B.; Mondal, S.; Tripathi, A.K. Energy rating estimation of PV module technologies for different climatic conditions. Sol. Energy 2018, 174, 901–911. [Google Scholar] [CrossRef]
- Radziemska, E. The effect of temperature on the power drop in crystalline silicon solar cells. Renew. Energy 2003, 28, 1–12. [Google Scholar] [CrossRef]
- Akhmad, K.; Kitamura, A.; Yamamoto, F.; Okamoto, H.; Takakura, H.; Hamakawa, Y. Outdoor performance of amorphous silicon and polycrystalline silicon PV modules. Sol. Energy Mater. Sol. Cells 1997, 46, 209–218. [Google Scholar] [CrossRef]
- Gxasheka, A.R.; van Dyk, E.E.; Meyer, E.L. Evaluation of performance parameters of PV modules deployed outdoors. Renew. Energy 2005, 30, 611–620. [Google Scholar] [CrossRef]
- Eke, R.; Demircan, H. Performance analysis of a multi crystalline Si photovoltaic module under Mugla climatic conditions in Turkey. Energy Convers. Manag. 2013, 65, 580–586. [Google Scholar] [CrossRef]
- Asim, M.; Qamar, A.; Kanwal, A.; Uddin, G.M.; Abbas, M.M.; Farooq, M.; Kalam, M.A.; Mousa, M.; Shahapurkar, K. Opportunities and Challenges for Renewable Energy Utilization in Pakistan. Sustainability 2022, 14, 10947. [Google Scholar] [CrossRef]
- Tahir, Z.u.R.; Hafeez, S.; Asim, M.; Amjad, M.; Farooq, M.; Azhar, M.; Amjad, G.M. Estimation of daily diffuse solar radiation from clearness index, sunshine duration and meteorological parameters for different climatic conditions. Sustain. Energy Technol. Assess. 2021, 47, 101544. [Google Scholar] [CrossRef]
- Stökler, S.; Schillings, C. ESMAP—Renewable Energy Resource Mapping Initiative—Solar Resource Mapping for Pakistan—Final Model Validation Report; Energy Sector Management Assistance Program; The World Bank: Washington, DC, USA, 2017. [Google Scholar]
- Perez-Astudillo, D.; Bachour, D.; Martin-Pomares, L. Improved quality control protocols on solar radiation measurements. Sol. Energy 2018, 169, 425–433. [Google Scholar] [CrossRef]
- Roesch, A.; Wild, M.; Ohmura, A.; Dutton, E.G.; Long, C.N.; Zhang, T. Assessment of BSRN radiation records for the computtion of monthly means. Atmos. Meas. Tech. 2011, 4, 339–354. [Google Scholar] [CrossRef] [Green Version]
- Tahir, Z.u.R.; Asim, M.; Azhar, M.; Amjad, G.M.; Ali, M.J. Hourly global horizontal irradiance data of three stations in Punjab, Pakistan. Data Brief 2021, 38, 107371. [Google Scholar] [CrossRef]
- Hosseini, S.A.; Kermani, A.M.; Arabhosseini, A. Experimental study of the dew formation effect on the performance of photovoltaic modules. Renew. Energy 2019, 130, 352–359. [Google Scholar] [CrossRef]
- Maftah, A.; Maaroufi, M. Experimental evaluation of temperature effect of two different PV Systems Performances under arid climate. Energy Procedia 2019, 157, 701–708. [Google Scholar] [CrossRef]
- Kurtz, S.R.; Myers, D.; Townsend, T.; Whitaker, C.; Maish, A.; Hulstrom, R.; Emery, K. Outdoor rating conditions for photovoltaic modules and systems. Sol. Energy Mater. Sol. Cells 2000, 62, 379–391. [Google Scholar] [CrossRef]
- Huld, T.; Gottschalg, R.; Beyer, H.G.; Topič, M. Mapping the performance of PV modules, effects of module type and data averaging. Sol. Energy 2010, 84, 324–338. [Google Scholar] [CrossRef]
- Tahir, Z.u.R.; Ahmad, S.U.; Ali, M.J.; Asim, M.; Azhar, M.; Hayat, N.; Hussain, A. Evaluation of Solar Radiation from MERRA, MERRA-2, ERA-Interim and CFSR Reanalysis Datasets Against Surface Observations for Multan, Pakistan. In Proceedings of the ISES EuroSun 2018 Conference–12th International Conference on Solar Energy for Buildings and Industry, Rapperswil, Switzerland, 10–13 September 2018. [Google Scholar]
- Schwingshackl, C.; Petitta, M.; Wagner, J.E.; Belluardo, G.; Moser, D.; Castelli, M.; Zebisch, M.; Tetzlaff, A. Wind effect on PV module temperature: Analysis of different techniques for an accurate estimation. Energy Procedia 2013, 40, 77–86. [Google Scholar] [CrossRef] [Green Version]
- García, M.A.; Balenzategui, J.L. Estimation of photovoltaic module yearly temperature and performance based on nominal operation cell temperature calculations. Renew. Energy 2004, 29, 1997–2010. [Google Scholar] [CrossRef]
- Kichou, S.; Wolf, P.; Silvestre, S.; Chouder, A. Analysis of the behaviour of cadmium telluride and crystalline silicon photovoltaic modules deployed outdoor under humid continental climate conditions. Sol. Energy 2018, 171, 681–691. [Google Scholar] [CrossRef]
- Skoplaki, E.; Palyvos, J. On the temperature dependence of photovoltaic module electrical performance: A review of efficiency/power correlations. Sol. Energy 2009, 83, 614–624. [Google Scholar] [CrossRef]
- Dubey, S.; Sarvaiya, J.N.; Seshadri, B. Temperature dependent photovoltaic (PV) efficiency and its effect on PV production in the world—A review. Energy Procedia 2013, 33, 311–321. [Google Scholar] [CrossRef] [Green Version]
- Bilal, M.; Araya, G.; Birkelund, Y. Preliminary assessment of remote wind sites. Energy Procedia 2015, 75, 658–663. [Google Scholar] [CrossRef] [Green Version]
- Katinas, V.; Gecevicius, G.; Marciukaitis, M. An investigation of wind power density distribution at location with low and high wind speeds using statistical model. Appl. Energy 2018, 218, 442–451. [Google Scholar] [CrossRef]
- Albani, A.; Ibrahim, M.Z. Wind Energy Potential and Power Law Indexes Assessment for Selected Near-Coastal Sites in Malaysia. Energies 2017, 10, 307. [Google Scholar] [CrossRef] [Green Version]
- Kaldellis, J.K.; Kapsali, M.; Kavadias, K.A. Temperature and wind speed impact on the efficiency of PV installations. Experience obtained from outdoor measurements in Greece. Renew. Energy 2014, 66, 612–624. [Google Scholar] [CrossRef]
- Zhou, J.; Yi, Q.; Wang, Y.; Ye, Z. Temperature distribution of photovoltaic module based on finite element simulation. Sol. Energy 2015, 111, 97–103. [Google Scholar] [CrossRef]
- Zhou, J.; Zhang, Z.; Ke, H. PV module temperature distribution with a novel segmented solar cell absorbance model. Renew. Energy 2019, 134, 1071–1080. [Google Scholar] [CrossRef]
- Mattei, M.; Notton, G.; Cristofari, C.; Muselli, M.; Poggi, P. Calculation of the polycrystalline PV module temperature using a simple method of energy balance. Renew. Energy 2006, 31, 553–567. [Google Scholar] [CrossRef]
- Tihane, A.; Boulaid, M.; Elfanaoui, A.; Nya, M.; Ihlal, A. Performance analysis of mono and poly-crystalline silicon photovoltaic modules under Agadir climatic conditions in Morocco. Mater. Today Proc. 2019, 24, 85–90. [Google Scholar] [CrossRef]
- Tossa, A.K.; Soro, Y.M.; Thiaw, L.; Azoumah, Y.; Sicot, L.; Yamegueu, D.; Lishou, C.; Coulibaly, Y.; Razongles, G. Energy performance of different silicon photovoltaic technologies under hot and harsh climate. Energy 2016, 103, 261–270. [Google Scholar] [CrossRef]
- Abdallah, A.; Martinez, D.; Figgis, B.; El Daif, O. Performance of Silicon Heterojunction Photovoltaic modules in Qatar climatic conditions. Renew. Energy 2016, 97, 860–865. [Google Scholar] [CrossRef]
- Martín-Martínez, S.; Cañas-Carretón, M.; Honrubia-Escribano, A.; Gómez-Lázaro, E. Performance evaluation of large solar photovoltaic power plants in Spain. Energy Convers. Manag. 2019, 183, 515–528. [Google Scholar] [CrossRef]
- Elamim, A.; Hartiti, B.; Haibaoui, A.; Lfakir, A.; Thevenin, P. Comparative study of photovoltaic solar systems connected to the grid: Performance evaluation and economic analysis. Energy Procedia 2019, 159, 333–339. [Google Scholar] [CrossRef]
- Polo López, C.S.; Lucchi, E.; Leonardi, E.; Durante, A.; Schmidt, A.; Curtis, R. Risk-Benefit Assessment Scheme for Renewable Solar Solutions in Traditional and Historic Buildings. Sustainability 2021, 13, 5246. [Google Scholar] [CrossRef]


| Station Name | Station Code | Climate Zone | Latitude (°N) | Longitude (°E) | Altitude (m) | Temperature (°C) | GHI (W/m2) | Wind Speed (m/s) | System Type |
|---|---|---|---|---|---|---|---|---|---|
| Lahore | LHE | B | 31.6940 | 74.2440 | 224 | 24.819 | 186.57 | 1.916 | Tier 2 |
| Islamabad | ISB | B | 33.6420 | 72.9840 | 579 | 24.132 | 195.62 | 1.347 | Tier 1 |
| Peshawar | PEW | B | 34.0017 | 71.4854 | 340 | 22.266 | 187.15 | 1.270 | Tier 2 |
| Khuzdar | KZD | C | 27.8178 | 66.6294 | 1220 | 23.782 | 254.66 | 2.397 | Tier 2 |
| Quetta | QUT | C | 30.2708 | 66.9398 | 1682 | 19.091 | 250.72 | 2.289 | Tier 2 |
| Bahawalpur | BHL | D | 29.3250 | 71.8190 | 118 | 24.344 | 217.60 | 2.229 | Tier 1 |
| Multan | MUL | D | 30.1650 | 71.4980 | 129 | 26.432 | 204.86 | 1.559 | Tier 2 |
| Hyderabad | HYD | E | 25.4134 | 68.2595 | 40 | 27.807 | 247.05 | 3.918 | Tier 2 |
| Karachi | KHI | E | 24.9334 | 67.1116 | 38 | 26.973 | 218.93 | 2.933 | Tier 2 |
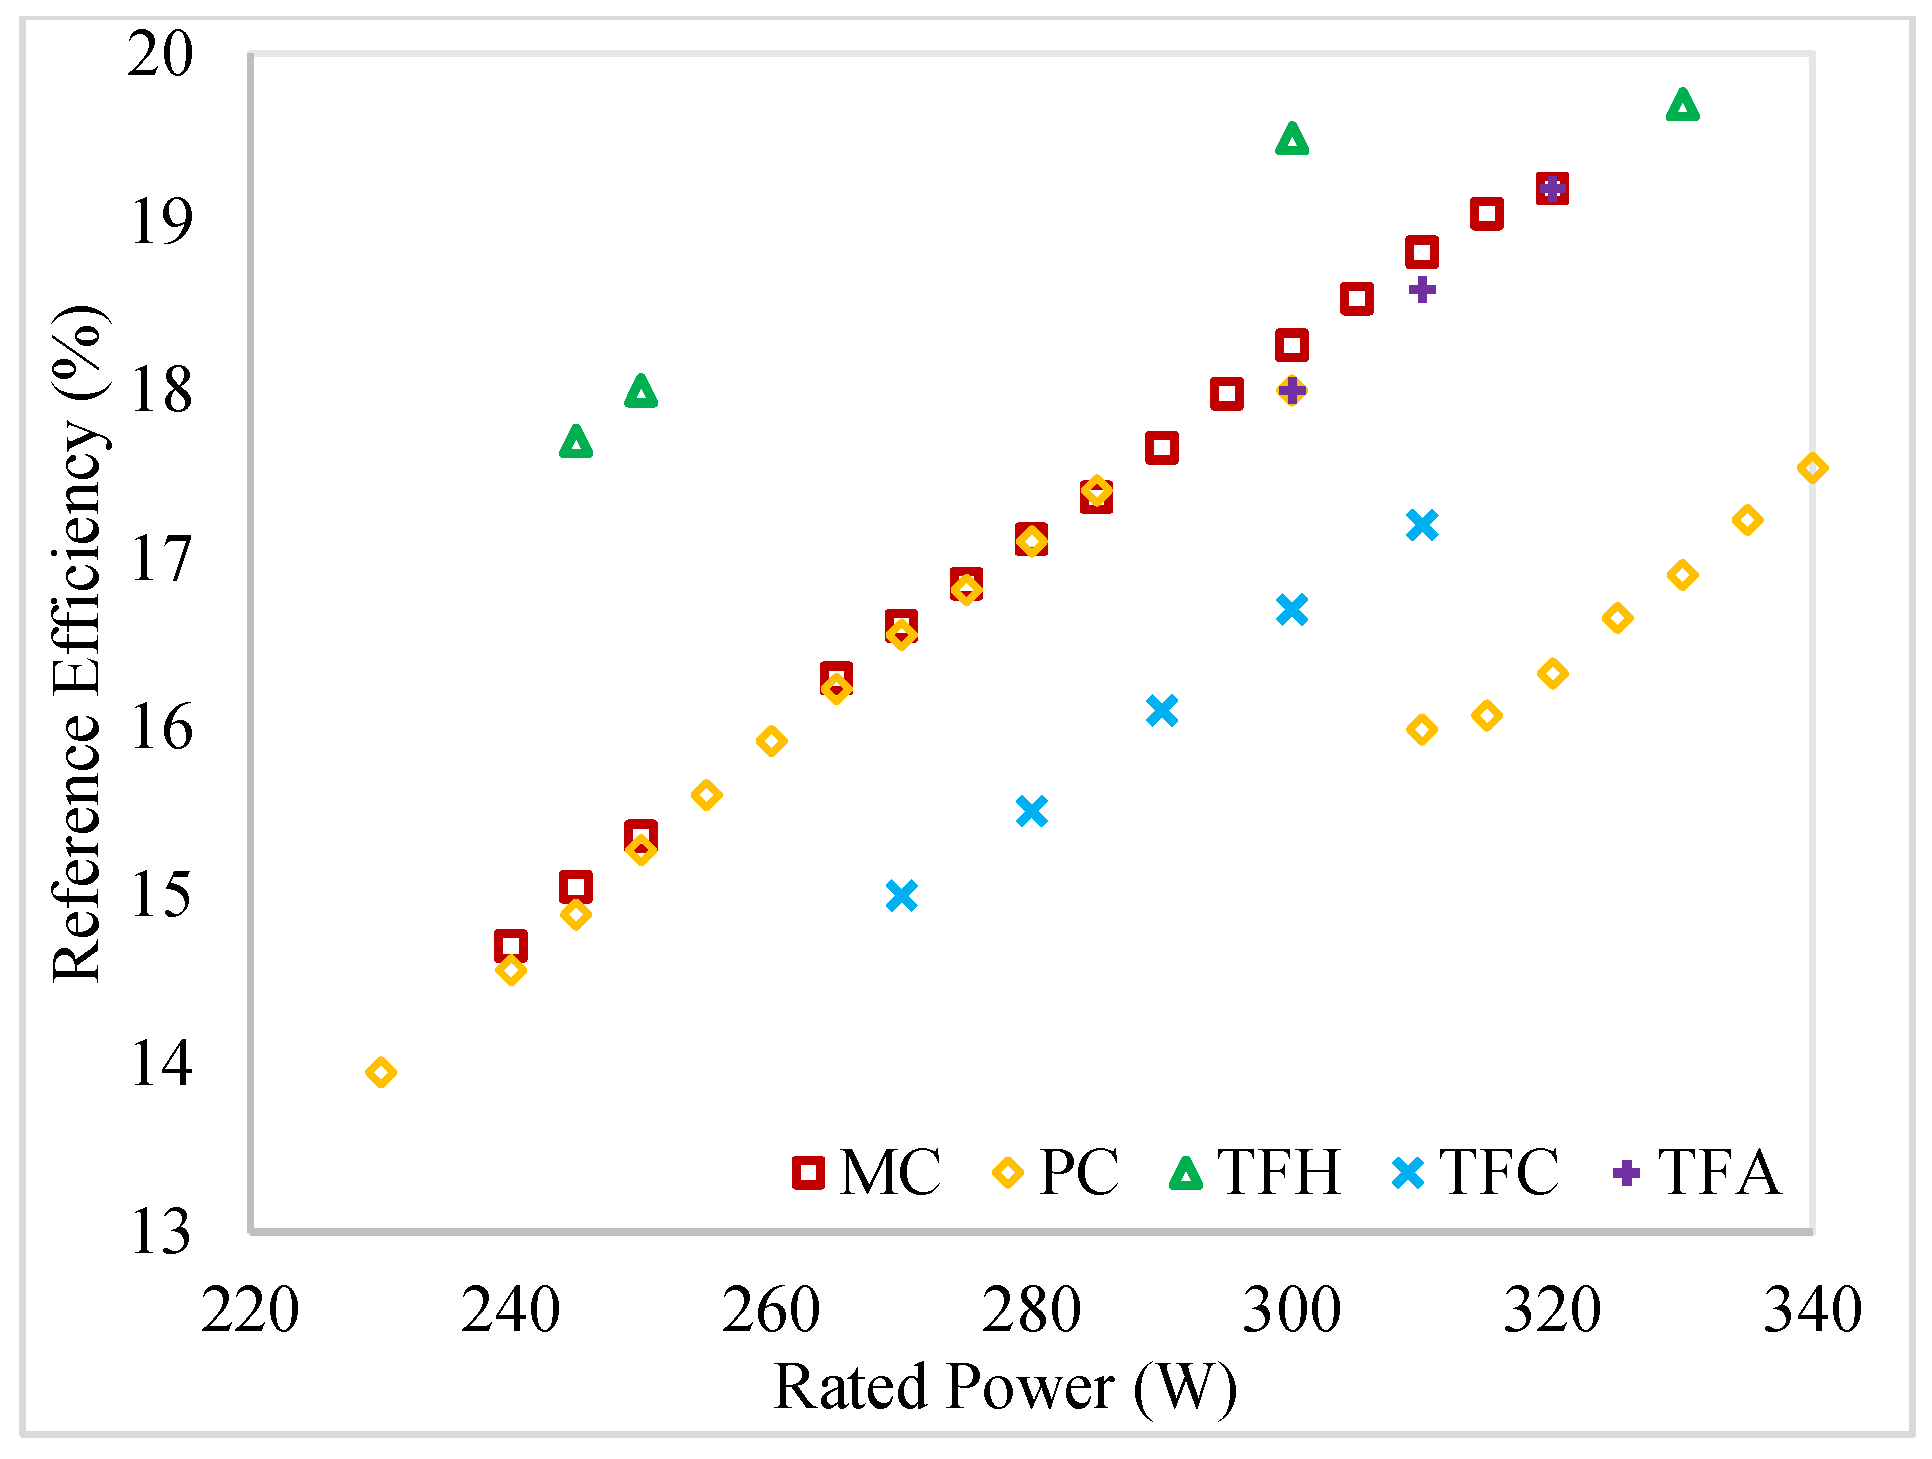
| Module Type | MC | PC | TFH | TFC | TFA |
|---|---|---|---|---|---|
| Manufacturer | SOLUXTEC, Bitburg, Germany | REC Twinpeak, Singapore | Panasonic, Ottobrunn, Germany | Miasole, Santa Clara, CA, USA | Sunpreme, Santa Clara, CA, USA |
| TNOCT (°C) | 45 | 44.6 | 44 | 48 | 46 |
| βSTC (%/°C) | 0.39 | 0.36 | 0.258 | 0.38 | 0.28 |
| ηSTC (%) | 18.5 | 18 | 19.5 | 16.7 | 18 |
| Size (m2) | 1.620325 | 1.669975 | 1.540539 | 1.88268 | 1.675957 |
| Locations, Modules | LHE | ISB | PEW | KZD | QUT | BHL | MUL | HYD | KHI |
|---|---|---|---|---|---|---|---|---|---|
| MC | 18.09 | 18.26 | 18.14 | 18.01 | 18.36 | 17.98 | 17.94 | 17.74 | 17.87 |
| PC | 17.64 | 17.79 | 17.68 | 17.57 | 17.88 | 17.54 | 17.5 | 17.33 | 17.44 |
| TFH | 19.23 | 19.34 | 19.26 | 19.18 | 19.42 | 19.15 | 19.12 | 18.99 | 19.07 |
| TFC | 16.3 | 16.44 | 16.34 | 16.21 | 16.52 | 16.19 | 16.15 | 15.97 | 16.09 |
| TFA | 17.7 | 17.82 | 17.74 | 17.64 | 17.89 | 17.62 | 17.59 | 17.45 | 17.54 |
| Locations, Modules | LHE | ISB | PEW | KZD | QUT | BHL | MUL | HYD | KHI |
|---|---|---|---|---|---|---|---|---|---|
| MC | 18.20 | 18.30 | 18.19 | 18.21 | 18.54 | 18.14 | 18.01 | 18.03 | 18.07 |
| PC | 17.73 | 17.83 | 17.72 | 17.74 | 18.05 | 17.68 | 17.57 | 17.58 | 17.62 |
| TFH | 19.30 | 19.37 | 19.29 | 19.31 | 19.54 | 19.26 | 19.17 | 19.18 | 19.21 |
| TFC | 16.40 | 16.49 | 16.38 | 16.40 | 16.70 | 16.35 | 16.23 | 16.25 | 16.29 |
| TFA | 17.78 | 17.85 | 17.77 | 17.79 | 18.02 | 17.74 | 17.65 | 17.66 | 17.69 |
| Locations, Modules | LHE | ISB | PEW | KZD | QUT | BHL | MUL | HYD | KHI |
|---|---|---|---|---|---|---|---|---|---|
| MC | 0.59 | 0.26 | 0.25 | 1.08 | 0.96 | 0.90 | 0.43 | 1.60 | 1.07 |
| PC | 0.54 | 0.23 | 0.23 | 0.97 | 0.96 | 0.81 | 0.39 | 1.44 | 1.02 |
| TFH | 0.37 | 0.16 | 0.15 | 0.68 | 0.62 | 0.56 | 0.27 | 1.00 | 0.66 |
| TFC | 0.65 | 0.28 | 0.28 | 1.17 | 1.10 | 0.98 | 0.48 | 1.76 | 1.24 |
| TFA | 0.44 | 0.19 | 0.19 | 0.81 | 0.73 | 0.65 | 0.32 | 1.18 | 0.84 |
Publisher’s Note: MDPI stays neutral with regard to jurisdictional claims in published maps and institutional affiliations. |
© 2022 by the authors. Licensee MDPI, Basel, Switzerland. This article is an open access article distributed under the terms and conditions of the Creative Commons Attribution (CC BY) license (https://creativecommons.org/licenses/by/4.0/).
Share and Cite
Tahir, Z.R.; Kanwal, A.; Asim, M.; Bilal, M.; Abdullah, M.; Saleem, S.; Mujtaba, M.A.; Veza, I.; Mousa, M.; Kalam, M.A. Effect of Temperature and Wind Speed on Efficiency of Five Photovoltaic Module Technologies for Different Climatic Zones. Sustainability 2022, 14, 15810. https://0-doi-org.brum.beds.ac.uk/10.3390/su142315810
Tahir ZR, Kanwal A, Asim M, Bilal M, Abdullah M, Saleem S, Mujtaba MA, Veza I, Mousa M, Kalam MA. Effect of Temperature and Wind Speed on Efficiency of Five Photovoltaic Module Technologies for Different Climatic Zones. Sustainability. 2022; 14(23):15810. https://0-doi-org.brum.beds.ac.uk/10.3390/su142315810
Chicago/Turabian StyleTahir, Zia R., Ammara Kanwal, Muhammad Asim, M. Bilal, Muhammad Abdullah, Sabeena Saleem, M. A. Mujtaba, Ibham Veza, Mohamed Mousa, and M. A. Kalam. 2022. "Effect of Temperature and Wind Speed on Efficiency of Five Photovoltaic Module Technologies for Different Climatic Zones" Sustainability 14, no. 23: 15810. https://0-doi-org.brum.beds.ac.uk/10.3390/su142315810