
Novel Sentiment Lexica Derived from User Generating Content by Chinese Tourists in Pacific Islands


1
School of Management, Minzu University of China, Beijing 183001, China
2
College of Management and Economics, Tianjin University, Tianjin 300072, China
3
Greenwich Business School, University of Greenwich, London SE10 9LS, UK
4
S Plus Academy, Shanghai 201306, China
5
Judge Business School, University of Cambridge, Cambridge CB2 1AG, UK
*
Authors to whom correspondence should be addressed.
Sustainability 2022, 14(23), 15833; https://0-doi-org.brum.beds.ac.uk/10.3390/su142315833
Submission received: 30 September 2022
/
Revised: 18 November 2022
/
Accepted: 23 November 2022
/
Published: 28 November 2022
(This article belongs to the Special Issue Emerging Destinations Tourism Economics)
Abstract
:Identification of tourists’ sentiments is relevant to the destination’s planning. Tourists generate extensive User Generated Content (UGC)—embedding their sentiments—in the form of textual data when sharing experiences on the Internet. These UGC tend to influence tourists’ decision-making, thus, representing an important data source for tourism research and planning. By obtaining data from Mafengwo and Ctrip, sentiment analysis was conducted to shed light on the sentiment tendency of Chinese tourists in seven Pacific Island Countries and Territories (PICTs). Eleven thousand two hundred four reviews were obtained between January and March 2021. The data shows that Chinese tourists’ sentiments towards the PICTs are overall positive. Yet, they pay more attention to practical issues such as transportation, visa and fees, and their sentiment orientations are influenced by tourism resources, weather, and perceived safety. Moreover, the study demonstrates that the needs of Chinese tourists in the region are influenced by their physiology, security, self-esteem, belonging, and self-actualisation needs. The study contributes to theory and practice by constructing an exclusive set of Chinese sentiment lexicons for tourism research based on data from the PICTs. This lexicon complements but also contradicts previous studies. In addition to being relevant for the studied region, it can inform similar destinations that may or may not have a relevant Chinese tourism market.
1. Introduction
In the context of big data and smart tourism, consumers express their opinions through online evaluation [1]. As a result, online texts—representing User Generated Contents (UGC)—have become influential in tourists’ decision-making and, therefore, an important information source for tourism planning [2]. Furthermore, tourists’ emotional preference is a significant driving force in tourism decision-making [3], and UGC text can reflect tourists’ sentiments about a destination, which can be positive, neutral, or negative. Nevertheless, while previous tourism research—using UGC—has extensively examined tourist satisfaction and perception of a destination (e.g., [4]), it did not provide an in-depth landscape of tourists’ emotional characteristics. Besides, the existing literature on tourism UGC tends to be concentrated at the hotel level and less distributed at the destination level. This delineates a gap within the research stream of destination-based tourists’ sentiments.
Sentiment analysis helps to judge tourists’ emotional experience of the destination [5,6]. This judgement can inform and translate into destination planning and management strategies, meeting consumer needs and expectations [7] through developing a specific set of tourism sentiment lexica [8]. This is because tourist destinations are often unfamiliar environments to the tourist, and the semantic expression in the tourism context may be different from that of daily life. Therefore, sentiment analysis can inform tourist destinations in balancing economic growth and sustainability while promoting a long-term and quality tourism sector. To this extent, this study focuses on PICTs and the sentiment analysis of their growing Chinese tourism market.
The study contributes both to theory and practice. Firstly, an exclusive set of sentiment lexica for PICTs is developed to expand the existing tourist and general emotional dictionary, contributing to a better understanding of tourists’ sentiments in the PICTs and of other similar tourist destinations where common sectoral patterns may be found. Second, by building on cognitive appraisal theory, the study confirms the multi-level characteristics of the tourist needs in destinations, adding to the broader tourism-related literature on this topic. Thirdly, the study adopts a big data analysis method using Python codes to crawl online textual data from Ctrip and Mafengwo sites automatically. This approach improves the accuracy and efficiency of this research while providing a more effective methodological direction to other researchers seeking to conduct sentiment analysis in tourism and beyond. Lastly, and on a more practical level, the sentimental characteristics of Chinese tourists about the PICTs can help tourism enterprises and destination managers to improve tourism services and marketing strategies, ultimately improving tourists’ experience and satisfaction.
2. Literature Review
2.1. Online Reviews in Tourism Research
“The world of tourism is in constant flux and tourism theory needs to be on the move to capture such changes”, Urry and Larsen [9] wrote in their work The Tourist Gaze 3.0, suggesting tourism as a non-static and evolving sector. These sectoral changes also occur in the way/s tourist perceive the visited destinations (e.g., [10]), how their perceptions differ among tourist clusters (e.g., [11]), and how perceptions affect the likelihood of return visits (e.g., [12]) and tourist priorities such as concerning destination safety [13] and destination innovation [14]. Others have pointed to how tourist demand evolves following political changes, such as in urban destinations in post-communist cities of Central and Eastern Europe [15], how visitors’ perceptions and motives relate to visitors’ past experiences, as highlighted in the study of Light et al. [16] in a memorial museum in Romania. Nonetheless, visitors’ perceptions of tourism and destinations are also evolving in line with increasing public awareness of the environmental effects of tourism activities [17].
Understanding tourist perceptions of destinations through sentiment analysis is essential to build a landscape of tourist preferences and priorities to inform tourism planning and policies in line with constant developments and improvements needed by the sector (e.g., smart destinations) [18]. This effort fits with the call for informed destination planning approaches under the shifting needs not only of the supply but also the demand side of the tourism sector [19,20,21].
To this extent, User Generated Content (UGC) is regularly generated by Internet users through visiting web pages, using search engines and social media [22]. UGC data has been widely used in tourism research, especially in the form of online text and photos [23]. Moreover, GPS and transaction data from mobile devices (e.g., Baidu Index, Google trends) have been employed to predict the number of tourists in destinations (e.g., [24,25]). Thus, UGC is gaining increasing relevance and attention in tourism research (e.g., [26,27]). Online reviews on travel websites effectively reflect consumer behaviour and satisfaction [28]. Users assess the quality and satisfaction of the products and services they consume by publishing UGC and obtain further information from others’ UGC [29]. In line with such discussion, research mainly focuses on using online reviews to understand and evaluate the performance of tourism enterprises and tourists’ perception of the destination image. Yet, there is scope in tourism research to analyse online reviews for purposes that go behind current main research topics to develop theoretical and practical recommendations that inform management actions on balancing destination economic growth and sustainability. By mapping tourists’ emotions through online reviews, researchers can generate recommendations on the destination’s social, environmental, and economic aspects.
2.2. Cognitive Appraisal Theory
Emotion valence and tensity have been relevant research subjects in marketing and tourism studies [30]. Cognitive Appraisal Theory, which originated from Appraisal Theory in psychology, holds that emotion is a state of mind that arises from subjective evaluation and understanding of events in different cognitive dimensions [31]. In other words, subjective evaluation, rather than objective events, determines people’s emotional responses [32]. Evaluation is the decisive mechanism for the generation and differentiation of emotions. Specifically, Roseman [33] believes that five types of appraisals determine positive and negative emotions (goal congruency, goal relevance, certainty, coping feasibility, and attribution of responsibility). According to Roseman [34], generated emotions include hope, fear, relaxation, pleasure, sadness, anxiety, depression, like, disgust, anger, guilt, pride, and regret. The cognitive appraisal theory of emotion can distinguish and explain emotions and why individuals have different opinions and emotional experiences towards the same event [35].
Young and Arnold [36] were two psychologists who first proposed that people evaluate their environments. They believe that the evaluation of events is emotional, and the assessment of situational events determines people’s emotions. Scherer [37] further proposed emotional-based evaluation variables to determine the type of emotion. Moreover, the Ortony, Clore, and Collins (OCC) model of emotion proposed by Ortony et al. [38] is the earliest emotion-cognitive evaluation model that can be used for computer calculation. The model includes variables and functions that affect emotions and help explain the cognitive process that causes emotion.
The OCC emotion-cognitive evaluation theory could be effectively adopted to study consumer sentiments (e.g., [39]). Nyer [40] was the first to use the evaluation theory to understand the determinants of consumer sentiments and demonstrated that emotion plays an intermediary role between word-of-mouth cognitive evaluation and intention to engage in word-of-mouth. More recently, White and Yu [41] studied the relationship between consumer sentiment and consumer satisfaction, service quality, and positive behaviour intention. The results showed that positive sentiment positively affects consumer satisfaction, while negative sentiment negatively affects consumer satisfaction. Similarly, Strizhakova et al. [42] found that the angrier consumers were, the more positive and expressive they would respond rather than avoid it.
These studies show how the OCC theory has become the core of consumer emotion research. However, there is still a wide range of applications in the field of tourism to be explored, mainly to understand tourists’ behaviours. More studies are needed on tourists’ emotions to shed light on their sentiments about their experience in specific destinations.
2.3. Sentiment Analysis in Tourism Research
As discussed in the previous section, analysing tourists’ emotions can inform tourism planning and further the development of cognitive theories. Sentiment analysis is increasingly used for the study of individual emotions and can be applied to the study of online reviews. Sentiment analysis is a method of extracting, transforming, and understanding textual information using language processing techniques and classifying it as positive, negative, and neutral sentiments [43]. Through sentiment analysis, people’s feelings can be evaluated as positive or negative based on opinions, emotions, and sentiments posted on social media [44]. Moreover, based on the level of text used for the analysis, sentiment analysis can be divided into document-level, sentence-level, aspect-based or feature-level, comparative, and sentiment lexicon acquisition [45]. This study adopted sentiment lexicon acquisition. The sentiment orientation can be divided into positive, negative, and neutral [46]. The sentiment dictionary-based analysis method can be applied to textual data of different languages, counting the number of sentimental words, and allowing manual addition or elimination [47]. The analysis aims to build a dedicated sentiment dictionary, adding words according to the research field and based on the existing sentiment dictionary.
Sentiment analysis has demonstrated its utility in several studies as an essential research tool in social science to evaluate consumer satisfaction, service quality, and social media assessment [48]. The study of emotion analysis dates to the 1970s, but it was not until recent years that emotion analysis gained wide attention in academia and industry (e.g., [49]). Notably, studying individual emotions in tourism is relevant to inform management decision-making. Tourists’ emotions manifest throughout the whole tourism experience and can be used to explain tourists’ behaviour [50,51]. The information posted on social media usually expresses emotions such as happiness, frustration, disappointment, and excitement. In addition, the content released by users through mobile internet technology constitutes the information source of tourism big data that contains rich emotions [52]. Therefore, tourists’ emotions strongly influence destination image, satisfaction, and behavioural intention [53].
Although several tourism studies have focused on analysing online tourist reviews to inform destination planning, little has been done from the tourists’ emotional perspective. Research mainly investigates the relationship between online reviews and purchases, tourists’ satisfaction, and motivation for opinion mining and comment publishing of online reviews (e.g., [52]). For instance, Radojevic et al. [53] collected more than 2 million online reviews from 6768 hotels in 47 European cities. They found that the hotel’s star rating is the most significant factor affecting customer satisfaction, along with the room’s air conditioning and bar configuration. Moreover, Yan et al. [54] revealed the relationship between hotel food, cost performance, service quality, hotel atmosphere, and customer repurchase intention.
Additionally, Torres et al. [55] pointed out that hotels can develop training plans based on consumer feedback, improve operational processes, and set new complaints and suggestions. Ye et al. [56] showed that online hotel reviews were related to sales reservations and further pointed out that for every 10% increase in online reviews, online hotel reservations would increase by more than 5%. Differently and by focusing on the destination level, Marine-Roig and Ferrer-Rosell [57] analysed 80,000 tourist reviews of the Mediterranean destination of Catalonia. They found that destination image has three dimensions: space, cognition, and emotion. The study shows how the destination’s image is related to the spatiality within the destination and the visitor’s emotional response. Similar recent studies are such as Gulati [58] shedding light on “vaccine tourism” through public sentiments and emotions based on Twitter’s data; Balasubramanian et al. [59] examining post-COVID-19 tourist concerns; and Park et al. [60] identifying predominant topics and associated emotions about European and Asian destinations during the COVID-19 pandemic.
Instead, some scholars have tried to conduct tourism emotion research, mainly divided into two research perspectives: the tourists and the destination residents [61]. The tourists’ perspective is of primary interest for this study, and only a few scholars directly analysed tourists’ emotions. Mitas et al. [62] analysed tourists’ emotions from the social context perspective, revealing the importance of positive emotions in fostering a sense of community among participants. Gulati [63] provides extensive sentiment analysis of tourists in three main Indian heritage sites (Taj Mahal, Red Fort, and Golden Temple) by extracting 5000 tweets and representing the differences in positive/negative sentiments among the three sites. Cherapanukorn and Sugunnasil [64] comprehensively analysed 40,000 online tourist reviews from 40 tourist attractions in Thailand posted up through TripAdivisor.com between 2010 and 2021. The research allowed the development of a model with six components of the tourist attraction satisfaction model: (1) ambience, (2) hospitality, (3) price, (4) accessibility, (5) cleanliness, and (6) security.
Moreover, by conducting a social network analysis of tourists in Yogyakarta, Miftahuddin et al. [65] show four factors affecting tourists’ perceptions of the image of the city of Yogyakarta: experience, historical culture, recreational services, and tourist destinations. Tucker [66] discusses the role of empathy in tourism as a tourist sentiment mainly present in dark attractions. In line with what was mentioned by Tucker [66], other researchers sought to shed light on tourists’ emotions in visiting dark sites, such as in the case of Isaac and Çakmak [67], who studied visitors’ emotions at Tuol Sleng Genocide Prison Museum (S-21) in Phnom Penh. Moreover, Curnock et al. [68] bring an environmental perspective on how empathy may affect tourists’ sentiments. They documented increased protective sentiments among tourists visiting the Great Barrier Reef region after mass coral bleaching.
There are other examples. Faullant et al. [69] analysed tourists’ emotions in experiential activities, such as mountain climbing, pointing out that positive and negative emotions originate from neuroticism and extraversion, which are combined with cognitive evaluation. Zhang et al. [70] investigated tourist sentiments towards virtual tourism during COVID-19 showing predominant positive sentiments towards this form of tourism. Valdivia et al. [71] used the comments on TripAdvisor to conduct a descriptive sentiment analysis of tourist evaluations in several destination countries and judged the accuracy of the sentiment classification model. Geetha [72] studied the relationship between consumer sentiment and hotel evaluation in hotel online reviews and found that the polarity of emotion can explain those reviews. There is consistency between emotion and evaluation, highlighting the importance of studying online reviews to capture emotions. Claster et al. [73] took Thailand as a case study. They used more than 80 million Twitter data to plot the temporal changes in tourists’ emotional tendencies across Thailand, informing future planning management strategies. Similarly, Wang et al. [74] crawled tourist social media data to explore tourist distribution characteristics and the patterns of tourist sentiment variations with evidence from five scenic areas in China. Most studies of tourists’ emotions analyse textual data except for Kisilevich et al. [75]. They used Flicker’s photos as data sources to demonstrate the correlation between the emotional characteristics of tourists and time geography.
As shown above, social media and tourism-related websites incorporate tourists’ interactions, and many textual and non-textual materials can be used to analyse tourists’ emotions. However, existing research on big data text and tourism is mainly concentrated at the hotel level [76]. Therefore, there is limited empirical attention to online reviews at the destination level [52]. Furthermore, big data studies at the destination level generally focus on the perceived image of the destination, and the subjective emotion mining of tourists from the perspective of tourists is less explored and understood. Therefore, this review concludes that, although demonstrating the empirical effort to inform tourism planning, the study of online reviews remains in its infancy. There is more to be done theoretically and empirically, particularly from the perspective of tourists’ emotions at the destination level.
2.4. Key Outtakes and Research Questions
As online reviews represent most of the User Generated Content (UGC), the literature shows how the analysis of UGC can significantly inform tourism planning. Yet, UGC has been mainly used to support studies at the hotel level, while less is being investigated at the destination level. Moreover, studies that capitalise on online reviews tend to analyse the enterprise’s performance and destination image. However, tourists’ emotional expressions are less explored, even though tourists’ emotions can provide practical recommendations to improve the destination design. Literature on the topic demonstrates how sentiment analysis can be deployed to identify tourists’ emotions and develop a lexicon specific to the sector and selected destinations. To this extent, this study aims to establish a set of tourist sentiment lexica for destinations and inform theories and destination planning. To achieve this objective, the study seeks to answer the following research questions by focusing on the PICTs and their Chinese tourism market.
- What are the Chinese tourist’s sentiments towards the PICTs?
- Do the Chinese tourists’ sentiments differ among the PICTs, and if yes, how?
- What factors influence Chinese tourists’ sentiments toward the PICTs?
- Do the influential factors differ among the PICTs, and if yes, how?
In the following section, we discuss the research context and design.
3. Method
The researchers followed four key methodological steps, as shown in Table 1. The first step of the study was to select the PICTs involved in the study using existing data resources, as elaborated in Section 3.2. The second step involved obtaining online review texts from Chinese OTA platforms (Online Travel Agents) through a Python crawler, as described in Section 3.3. The third step of the study, as detailed in Section 3.4, was to process the original text into analysis units, including operations such as text cleaning, word segmentation, and stopword removal. Then, the word cloud figure was generated to check the processing effectiveness visually. Most importantly, the study’s final step was to develop a tourism-specific Chinese lexicon and calculate sentiment values based on the exclusive sentiment lexicon, as elaborated in Section 3.5.
Regarding the construction of the exclusive sentiment lexicon, the steps include (i) adding new vocabularies to the existing basic sentiment lexicon, (ii) assigning weight to the newly added words, and (iii) setting semantic rules based on negative and degree words in each sentence. This study mainly referred to three existing basic sentiment lexicons: the Hownet sentiment dictionary, the Chinese commendatory and derogatory sentiment dictionary of Tsinghua University, and the NTUSD Chinese sentiment dictionary of Taiwan University. After the sentiment lexicon was constructed, it would be applied to identify Chinese tourists’ sentiments towards the selected PICTs together with Python’s sentiment analysis module SnowNLP.
The methodological steps allowed the researchers to move from selecting the sample to constructing the sentiment lexicon in a structured and accurate manner. These four steps will be described in detail in Section 3.2, Section 3.3 and Section 3.4.
3.1. Chinese Tourists and the Pacific Island Countries and Territories
Drawing from what was discussed in the previous sections, understanding tourists’ sentiments can inform decision-making in destinations. In this study, we opted to focus on island destinations. Tourist sentiment analysis is increasingly needed in these tourism contexts to inform sustainable economic growth. Island destinations are often characterised by a predominantly tourism-related economy (e.g., [77,78]). Hence, the importance of the sector’s long-term financial viability. Moreover, islands are also highly vulnerable to climate change [79] and mass tourism [80] while representing geographical areas with significant sustainable tourism development opportunities (e.g., [81,82]). Therefore, sentiment analysis in island destinations should inform their economic prosperity and sustainable development.
This study selected the PICTs as case studies. The increasing tourism arrivals figure between 2007–2019 [83]—despite a significant decline during the COVID-19 pandemic in 2020–2021—makes the PICTs relevant destinations for this study. This study will also inform their COVID-19 recovery strategies. Furthermore, among the growing tourism market, the Chinese tourism market became a significant slice of the islands’ tourism arrivals [84]. China’s outbound tourism market has grown steadily, with 155 million Chinese citizens travelling abroad in 2019, an increase of 3.3% compared to 2018 [85]. As a result of the COVID-19 pandemic, international travel of Chinese tourists has been suspended, leading to a dramatic decrease in Chinese outbound travel to only 20 million in 2020 [86]. However, as the tourism industry rebounds, China’s outbound tourism will continue to grow.
In April 2019, the “China-Pacific Island Tourism Year” event was officially launched in Samoa, which became a milestone event in tourism cooperation between China and the PICTs, showing how China is rapidly becoming the primary tourist market in the region. Therefore, studying Chinese tourists’ sentiments can aid future tourism development in the PICTs, targeting the market sustainably and strategically. As such, this is supported by the fact that when choosing their destination, Chinese tourists increasingly emphasise high service quality [87] and heterogeneity and diversification of the tourism offer [88]. Moreover, the 2020 tourism trend forecast by Booking.com [89] also shows that more than half of Chinese tourists are inclined to prioritise niche destinations with a positive impact on local communities.
3.2. Data Collection: Sample Selection
The 27 PICTs are a vital transportation hub in the Pacific Ocean. The islands are rich in minerals, forestry, and fishery. The region’s tropical climate allows the cultivation of crops like Kava, the basis for a national alcoholic beverage and a popular food supplement exported worldwide [90]. Many villages of the Pacific Islands still retain their original institution, traditional customs, and religious beliefs that have been passed down a long time ago. Tourism-wise, the islands propose a significantly diverse offer. Notably, the islands are globally recognised as top diving destinations and hot spots for surfing, whale watching, and hiking [91]. The islands host nine world natural and cultural heritage sites. This study selected seven PICTs: Papua New Guinea, Vanuatu, Fiji, Tonga, Samoa, Cook Islands, and Tahiti, which have established diplomatic relationships with China. They tend to prioritise and welcome Chinese tourists.
3.3. Data Collection: Sources
In tourism, textual research data is predominantly obtained by manually screening or web crawler software (e.g., Bazhuayu). However, crawler software can easily lead to errors when data is crawled in batches due to inaccuracy when setting parameters or executing complex logic. Similarly, manual screening may cause unpredictable subjective errors and require substantial time and labour costs. Instead, the automatic crawler program based on Python can mitigate the above shortcomings by following four steps: (1) specifying the URL, (2) initiating a request, (3) obtaining response data, and (4) persistent storage [92].
In this study, data was collected from two leading Chinese Online Travel Agent platforms (OTA): CTrip (https://www.ctrip.com/, accessed on 9 March 2021) and Mafengwo (http://www.mafengwo.cn/, accessed on 15 March 2021), where abundant online reviews regarding attractions, accommodation, food, shopping, and transportation are posted by numerous tourists every day. The authors used Python crawlers based on the Python 3.7 Interpreter to automatically obtain and save the online text. The process was as follows: first, the URLs of the webpage of the seven PICTs were crawled and saved; second, a request using the destinations’ URLs was initiated to obtain the text from webpages; third, irrelevant contents such as ads, empty text, and pictures were excluded. Finally, a total of 1835 valid travel blogs were obtained. Lastly, the removal of duplicates and dividing of the text into paragraphs were performed in Microsoft Excel. As a result, a total of 11,204 reviews were obtained. Data collection was conducted from January to March 2021. The program was compiled and run under the Pycharm Community.
3.4. Data Processing
In this section, we describe how data was processed before analysing it. The data processing steps followed in this study include text cleaning, word segmentation, and removal of stopwords [92], as described in the following sections.
3.4.1. Text Cleaning
In this study, textual elements, including emojis, spaces, Unicode characters, and punctuation marks, were removed from the online reviews based on the Python RE module and regular expressions.
- Text = re.sub(r1, ‘’, file)
- text = text.replace(‘ ‘,’’)
- text = text.replace(‘posted on’, ‘’)
- tmp_str = “”.join(text.split())
- result = ‘ ‘.join(tmp_str.split())
- text = re.sub(“[{}]+”.format(punctuation), “”, text)
The filtered text was rewritten into the original file, summarised, and categorised according to the destination. Overall, the filtered text had about 1,820,000 words.
3.4.2. Word Segmentation
Word segmentation is dividing the sentence into basic units of word sequences according to rules that computers can recognise when scanning the contents for analysis [92]. In this study, the Python Jieba module for word segmentation was used. The textual data contained many nouns, such as cities, scenic spots, festivals, food, currency, and ethnic groups. Directly segmenting text would separate these word categories, resulting in sentiment analysis biases. This study employed Jieba’s load_userdict function for word segmentation to ensure that words with special meanings were not segmented. As shown in Table 2, through manual browsing and extraction of the original text, four types of vocabulary were loaded into the self-defined userdict to implement a word segmentation procedure. The text was then saved in a text file with formats shown in Table 2.
3.4.3. Removal of Stopwords
Stopwords are words that have no analytical meaning for this study’s purpose but occupy a relatively high proportion of the text, such as “me”, “is”, and “a”. The removal of stopwords can improve the accuracy of text classification [93]. This study adopted the three most used Chinese stopword dictionaries from the Harbin Institute of Technology, the Machine Learning Intelligence Laboratory of Sichuan University, and the stopword dictionary of Baidu. A total of 4324 stopwords were summarised to use as a filter in the study.
3.4.4. Word Cloud
To present an overview of the current corpus, we used the Python word cloud module to generate a word cloud map from pre-processed text through graphic visualisation. As shown in Figure 1, the words that were most mentioned are “Fiji”, “Tahiti”, “Vanuatu”, “Nadi”, “beach”, “island”, “diving”, “snorkelling”, “children”, “friend”, “husband” and other travel partners, “destination” and “activities”. To our knowledge, it shows that the effects of text pre-processing are desirable, and the data can be used for further sentiment analysis.
3.5. Data Analysis Methods
There are two classification standards of sentiment dimension: (1) binary classification, which means tourists are either “satisfied” or “dissatisfied”, and (2) ternary classification, which considers sentiment to be positive, negative, or neutral [94]. This research adopted a ternary classification. UGC sentiment analysis mainly utilises sentiment dictionaries and machine learning [95]. Using dictionaries is appealing since word lists are easier to understand and more intuitive to handle than advanced model-based learning approaches. Moreover, sentiment dictionaries can be applied to different datasets relatively quickly and do not need to be re-trained [96]. The sentiment analysis method based on a sentiment dictionary calculates the sentiment orientation of text by extracting the combination of adjectives and adverbs with sentiment orientation according to the semantic orientation of the dictionary.
Data analysis was conducted based on SnowNLP, a natural language processing Python module dedicated to processing Chinese text content. SnowNLP has a trained dictionary that can directly obtain sentiment values by calling tags and sentiment functions. The range of sentiments is [0, 1.0]. Values below 0.4 are classified as negative emotions, and values above 0.6 are classified as positive emotions. The closer the value is to 1, the more positive the sentiment tendency is; the closer the value is to 0, the more negative the sentiment tendency is. Values falling within the interval of [0.4, 0.6] are neutral. Yet, when investigating the sentiment fluctuation, the sentiment interval was converted from [0, 1.0] to [−0.5, 0.5] through Python code. Those above value 0 were considered positive sentiment comments, and those below value 0 were negative sentiment comments. This study first divided the text into lines and used the SnowNLP module to calculate the sentiment value. Finally, the Python Matplotlib and NumPy modules were used to visualise the frequency distribution of the sentiment value.
Considering the Chinese semantic logic, it was necessary to assign different weights to positive and negative emotional words according to the degree of the adverbs. Five index tags (extreme, very, more, -ish, and last) were added to the degree dictionary to slice up the dictionary. Words between every two indexes were cut into one group. The degree dictionary includes four groups from “most” to “slightly”, weighed from 0.5 to 2.0 according to the group’s degree.
The total number of degree words is 240. The implementation process was as follows as well as reported in Table 3:
mostdict = degree_word[degree_word.index(‘extreme’) + 1: degree_word.index(‘very’)]
verydict = degree_word[degree_word.index(‘very’) + 1: degree_word.index(‘more’)]
moredict = degree_word[degree_word.index(‘more’) + 1: degree_word.index(‘ish’)]
ishdict = degree_word[degree_word.index(‘ish’) + 1: degree_word.index(‘last’)]
This study also used ROST Content Mining 6 to conduct sentiment and high-frequency word analysis based on the original text. Rost Content Mining 6 is a Chinese text analysis tool developed by Professor Shenyang of Wuhan University. This tool can perform word segmentation, word frequency statistics, sentiment analysis, and network text semantics on the texture data, allowing for the systematic analysis of the texture content. The process includes (1) converting all the text files encoded in utf-8 of the original text to the ANSI-encoded text format, (2) importing the converted text into ROST Content Mining 6 for word segmentation, and (3) adding proper nouns related to Pacific Island Countries to the customised vocabulary to avoid the separation of special nouns. Finally, the word segmentation is imported into ROST Content Mining 6 for sentiment analysis and word frequency presentation.
3.6. Limitation of Data and Method
This research used texture data obtained from online reviews and online blogs. Despite the feasibility and richness of online text for collection and analysis, the data and method applied to this analysis have several limitations. First, other forms of online data, such as photos and videos, were not considered. Second, the online texts were obtained from OTA platforms, but other online platforms, such as social media, are not included. Third, the analysis method we used was a sentiment lexicon-based approach and lacked a machine learning approach application. Further research could advance our understanding by considering other data types, complementary data sources, and multiple methods.
4. Results and Discussion
4.1. Sentiments Frequency
The study shows a certain degree of polarity in the analysed text. In general, the sentiment values of most tourists fall into the [0.4, 0.6] range, showing that most tourists’ attitudes towards destinations in PICTs are neutral. Nevertheless, some critical differences between the island destination can be highlighted. For example, the countries of Samoa and Tahiti reported higher negative sentiment values, whereas the Cook Islands and Papua New Guinea reported higher positive sentiments among Chinese tourists. Evidence could also be found in the text. For example, a tourist in Papua New Guinea wrote, “A night at Port Moresby is beautiful with good beer, delicious steak, and nice waiter”. Accordingly, the Cook Islands and Papua New Guinea may perform better in the Chinese tourism market. Yet, after reviewing the original text, it was noted that most Chinese tourists visit Papua New Guinea for various purposes other than leisure tourism. For example, a construction assistant on work and business tourism stated, “Six years of work here made me feel the beauty of the paradise”, which exerted more positive emotions. This may be due to China’s close diplomatic relationship with Papua New Guinea (“The friendship between China and Papua New Guinea was witnessed by the fertilizer bag, which was produced in China and became the local fashion”). In Appendix A Figure A1, detailed visualisation of the sentiment frequency is provided by country and in cumulative terms for the seven researched areas.
4.2. Sentiments Fluctuation
After obtaining the sentiment frequency presented in the previous section, this study further analysed sentiment fluctuation through the Python Matplotlib module. In general, the sentiment values of Chinese tourists fluctuate sharply in the range of [−0.5, 0.5], but the range of [0, 0.5] is significantly more than the range of [−0.5, 0]. This finding indicates that Chinese tourists’ sentiments tend to be polarised, but more emphasis is placed on positive emotions. Moreover, after reviewing the original text, we found that positive online texts were often very long and thus were split into separate statements in this data analysis. The countries and territories of Fiji, Tahiti, Vanuatu, and Papua New Guinea appeared to have most of the reviews. However, Papua New Guinea’s original text was significantly less than the other three countries. At the same time, the corresponding sentiment values reflected by the density of lines were much more than Tahiti and Vanuatu. This finding is in line with the conclusion in the sentiment frequency analysis, confirming that Chinese tourists, who travelled to Papua New Guinea, published more online text and presented more positive sentiments under the premise that the absolute number of tourists is not dominant. This is probably due to the positive image of the countries in the media, as they have good diplomatic relationships with China. Appendix A Figure A2 reports a detailed visualisation of sentiment fluctuation in the seven countries cumulatively in all researched areas.
4.3. Sentiment Lexicon Construction
The constructed sentiment lexicon was created based on newly added words and basic sentiment words from existing lexicons, including verbs and adjectives. The semantic expressions in the tourism context are often different from those in daily life. For instance, words usually associated with negative vocabulary in tourism may express positive emotions, such as “regret”. This study, therefore, used the pre-processed text data as the tourism corpus to artificially add some exclusive words that can reflect the positive and negative emotions according to the natural conditions and cultural customs of the PICTs that appear in the text. In general, this study constructed the exclusive tourism sentiment lexicon of the Pacific Islands, which contains 11,045 positive sentiment words and 8496 negative sentiment words, as shown in Table 4.
4.4. Pre-Testing
The above analysis has created a set of sentiment lexica that contains positive and negative sentiment dictionaries, degree dictionary, and negation dictionary. To pre-test this set, we randomly selected three sentences from our datasets (as the tourism context) and three from the Internet (as the daily-life context), which could be clearly differentiated as positive, negative, or neutral sentiment, as shown in Table 5.
These six sentences were first entered as input and then judged by their score: 1 represents positive sentiment, −1 represents negative sentiment, and 0 represents neutral sentiment. As shown in Table 5, the test results showed that the constructed sentiment lexicon could correctly classify both tourism and non-tourism context text. Thus, the sentiment lexicon is applicable to the analysis of all textual data.
4.5. Sentiment Analysis
A total of 6222 reviews were analysed. Out of all processed reviews, 5781 showed positive sentiments (92.9%), 47 showed negative sentiments (0.7%), and 394 were neutral (6.3%). Therefore, Chinese tourists’ sentiments toward the PICTs are generally positive. This observation is especially the case for Tahiti and Tonga, where Chinese tourists have shown the highest rate of positive sentiments. Negative sentiments appeared to be mainly related to Papua New Guinea and Samoa, accounting for 1.9% and 2.6%, respectively. Negative sentiments in Papua New Guinea were mainly expressed concerning social security issues and the status of tourist facilities. In Samoa, negative sentiments were associated with transport (especially air transport). For example, reviews included: I felt like I was in the wolf’s den”, “The windows of the room were a bit dirty”, “I witnessed robbery and theft happening around me”, “It’s so weird that I can only start from Hong Kong and transit flight in Fiji”, “There is no direct flight, it is inconvenient”, and “Sea turtles are for tourists to play with, I don’t like this behaviour very much”.
In Table 6, we provide a breakdown by destination of the number and percentage of positive, negative, and neutral reviews.
Table 6 demonstrates the key similarity among the analysed destinations where most sentiments are positive. However, it also shows that some destinations (e.g., Papua New Guinea, Tonga) are affected by a higher percentage of negative sentiments compared to other sampled destinations, shedding light on these destinations where the Chinese tourists tend to feel particularly negative.
4.6. Sentiment Tendency
The statistical results in Table 7 show that more than half (51.7%) of Chinese tourists expressed positive sentiments toward the PICTs. However, it is worth noting that a considerable proportion of tourists (37.4%) hold a neutral attitude toward the PICTs. Moreover, 10.9% of tourists have a negative attitude toward PICTs. Neutral and negative tourist sentiments accounted together for 48.3%.
4.7. Word Frequency
High-frequency words in tourists’ online reviews can visually show the concerns and needs of Chinese tourists for their travel experience. This study selected Vanuatu and Samoa as representatives of the research area to explore the issues worrying Chinese tourists. It analysed the distribution characteristics of their high-frequency words in detail, as demonstrated in Table 8. Vanuatu and Samoa were selected as they tend to attract lesser research attention than other PICTs, such as Fiji.
Chinese tourists tend to have a positive sentiment toward Vanuatu. Positive descriptions include “beautiful”, “passionate”, and “mysterious”. Moreover, high-frequency words like “Volcanic ash”, “magma”, “beach”, “diving”, and “coral” indicate that Vanuatu’s volcanoes and ocean life are the tourism resources that Chinese tourists sincerely appreciate. Keywords were closely related to the Isur Volcano and the Underwater Post Office, which are Vanuatu’s world-famous tourist attractions, confirming the name of Vanuatu as “the kingdom of flames on the sea”. Moreover, words such as “Coconut”, “lobster”, and other local diets; “hotel”, “resorts”, and other accommodation conditions; and “flight”, “airport”, and different transportation modes, respectively, reflected tourists’ attention to the dimensions of food, accommodation, and transportation. Still in Vanuatu, the high frequency of “visa”, “inbound”, “Hong Kong”, “Australia”, and “New Zealand” also shows that visa and transit issues are at the core of the outbound travel experience. Furthermore, high-frequency words such as “Daka” and “photographing” indicate that taking pictures of and recording memorable moments is an important life and social expression for Chinese tourists. Finally, high-frequency keywords such as “culture”, “primitive”, and “locals” indicate that Chinese tourists have a strong interest in historical and cultural elements.
Samoa’s “beaches” are the country’s high-quality tourism resources, reflected in the Chinese tourists’ reviews. Moreover, “Trench”, “Cave”, “Waterfall”, “Church”, and “Wind Tunnel”, respectively, represent the main tourist attractions of Samoa, including Sua Trench, Plula Cave Pools, and Sopoaga Waterfall. In addition, price is another dominant factor in tourists’ perception. Words like “dollars”, “tickets”, “charges”, and “free” all reflect tourists’ attention to the price elements. Based on the high-frequency vocabularies of the above two countries, the sentiment of the Chinese tends to be influenced by similar issues among the studied destinations. The similarity lies in security, visas, transport routes, fees, and prices.
5. Research Conclusions
In general, Chinese tourists exhibit positive sentiments toward the PICTs. However, there are differences in the sentiment tendencies among the studied destinations. To a certain extent, such differences align with previous studies demonstrating how tourists’ perceptions of destinations differ among tourist clusters [11] and their distribution [74]. In this study and on the destination level, the results from using the SnowNLP algorithm show that Papua New Guinea is the destination with the most positive sentiments of Chinese tourists. In contrast, the results based on the sentiment lexicon show that Fiji takes up the highest percentage of positive sentiments, whilst the destination with the highest percentage of negative sentiment is Papua New Guinea. This finding reflects the polarising emotional tendencies of Chinese tourists. Chinese tourists better appreciate Papua New Guinea because of its good diplomatic relationship with China. Still, its turbulent social security and other unsafe factors perceived by the tourists also have a negative impact. Fiji ranks first on the number of reviews available and the degree of emotional contribution, suggesting its status as the primary destination of PICTs.
Practical problems such as visa application and transportation are of most concern among Chinese tourists. The perceived safety of the destination is another important influencing factor. Although important, natural tourism resources of PICTs (beaches, snorkelling, wind tunnels, volcanoes, trenches, etc.) are given secondary priority. The local cuisine and cultural elements also attract Chinese tourists. Moreover, words about price (free, expensive, etc.) frequently appear throughout the tourism process. Price is, therefore, an important factor affecting the sentiment tendency of Chinese tourists. Liu [52] found that Chinese tourists tend to care about the natural landscape and landmarks significantly, while other tourists focus on the cultural experience and local life. The claim of Liu [52] is based on data from Chinese tourists in ten Australian cities and used the Travel-Career-Ladder motivation theory [97] to suggest that Chinese outbound tourists have remained at a relatively low level of demand for love, belonging, and self-actualisation. However, contrasting Liu’s [52] results, this finding suggests that Chinese tourists in PICTs pursue and enjoy the indigenous culture and experience cultural activities, in line with some of the six components of the tourist attraction satisfaction model developed by Cherapanukorn and Sugunnasil [64], particularly about price and accessibility. Moreover, findings complement Miftahuddin et al. [65] factors affecting tourists’ perceptions of the destination, especially the historical culture.
Therefore, Chinese tourists have a significant perception of the historical and cultural dimensions of their experience, which accords with the demands of love, belonging, and self-realisation as in line with the tourists’ Travel-Career-Ladder motivation theory [97]. This difference can be explained by the heterogeneity between the tourism resources of PICTs and Australia, and the tourists themselves may be different. We can then speculate that Chinese tourists in different outbound destinations show different levels of tourism needs. Thereby, the needs of Chinese tourists cannot simply be defined through standardised approaches.
In broader tourism terms, this study moves away from predominant studies on tourism sentiments that focus on the hotel level (e.g., [56,76,98,99]) by adding to the limited empirical effort that seeks to study tourists’ sentiment at the destination level (e.g., [57]). Moreover, this study contributes to the development of a more contextual understanding of the tourists’ emotional response and response to previous criticisms (e.g., [50]) on studies that focused on tourists’ emotions tend to neglect the tourism environment. Furthermore, the travel career ladder motivations and tourist preferences of PICTs are less focused on in the literature [100]. By comparing the differences in tourists’ sentiments among PICT destinations, the research advances knowledge about the travel preferences of Chinese tourists to the PICTs.
Lastly, the broad generalisation of the findings should be seen behind the scope of this study as sentiments may be expressed based on the destination visited, individual experience, and expectations, as well as tourists’ sentiments being non-static [10]. Yet, it is also worth noting that the tourists’ sentiments that emerged from the PICTs may also apply to similar destinations affected by similar tourism markets and socio-geographical conditions, such as the Philippines, Indonesia, or island destinations in the Indian Ocean. The tourism lexicon developed in this study could be considered a conceptual foundation for investigating tourists’ sentiments in other destinations. The findings complement previous empirical contributions on sentiment analysis focused on Chinese tourists (e.g., [52]). They also broaden tourism literature, such as Cherapanukorn and Sugunnasil [64] and Miftahuddin et al. [65], by adding to their developed models indicating factors affecting tourist sentiments and perceptions of destinations.
5.1. Managerial Implications
This research provides several managerial implications. Implications should be communicated as tourist sentiments in this study reflect tourists’ priorities. These implications call for action—and informed planning [19,20]—on the supply and demand side of the tourism sector of the PICTs. The price and easiness of transportation tend to affect Chinese tourists’ perception of the experience. To this extent, the PICTs should focus on improving the current transportation system. This may include supporting direct flights to central hubs and improving inter-island links and ground transport. Moreover, transport costs, as well as the costs for other tourism services, should be considered in line with market demand. Yet, while it is important to supply tourism services at a price in line with the market, decision-making about costs should not jeopardise community-wellbeing. In some instances, the findings may suggest the need for the PICTs to promote awareness programmes to educate Chinese tourists (as well as other visitor groups) on the impact of their visit, both positive and negative. This might include why costs may be higher in some instances (e.g., promoting community projects through tourism).
Therefore, the findings show shortcomings on the supply and demand side that should be addressed. Furthermore, in more general terms, natural disaster prevention and public security are urgent issues—not only for the local communities—but also to promote a sustainable and safe tourism sector in the region. The analysis of reviews showed that such problems as witnessing theft and robbery affect the emotional orientation and cognition of tourists and then generate negative word-of-mouth, low satisfaction, and revisit intention. Thus, tourism organisations need to work with local government departments and communities to ensure the personal safety of tourists, which will improve the perception of safety and, potentially, a higher return rate.
The analysed text also suggested that the hotel services of PICTs—particularly Papua New Guinea—are far from satisfactory. On the other hand, Chinese tourists to the Pacific Islands pursue novel cultural experiences, comfortable accommodations, and entertaining activities. While the demand of Chinese tourists might evolve as their society evolves [52,100], PICTs and the relevant destination management organisations should remain updated with the preferences and concerns of Chinese tourists. In addition, it should also be emphasised that PICTs would probably experience a significant impact of climate change and sea level rise. This could be an important factor reflected in tourist sentiments. This could be achieved by continuous monitoring by adopting some of the methods of this study.
Therefore, the PICTs can strengthen the construction and renovation of tourism infrastructure—within the local capacity and customs—and services that would benefit the tourists and the local communities. It, however, needs to avoid negative consequences on local communities, ensuring sustainable tourism development in traditional societies [101,102]. The destinations should also have strategies for green tourism and accelerate the adoption of circular economy practices by the operators of the tourism and hospitality sector. The recommendations include the creation of a conducive regulatory environment for a circular economy, facilitating the creation of circular transition communities, engaging pro-actively and providing technical support, enhancing circular economy adoption through innovative financing such as reward-based crowdfunding [103], and celebrating and demonstrating successes [104].
Although tourists’ sentiments may indicate improvements to be made at the destination level, it is also essential to note that some sentiments may be the result of limited tourists’ awareness of the local tourism sector, socio-cultural characteristics, and its economic importance for the local communities. Among the managerial implications, therefore, we should note both hard and soft implications, such as improving infrastructures and educating visitors.
5.2. Limitations and Future Research
The research has several limitations. First, it selected the PICTs as the research area; thereby, its conclusion may not conform to other destinations without further investigation. Yet, subsequent studies can benefit from the lexicon constructed in this study to investigate other destinations, exploring their applicable boundary conditions. Furthermore, this study did not evaluate the model on recall rate, precision, and classification ability. Lastly, while sentiment analysis based on machine learning has become mainstream, future studies can adopt neural network-based machine learning for sentiment analysis.
Author Contributions
Conceptualization, Y.Z., J.S. and J.C.; Methodology, J.S. and J.C.; formal analysis, J.S.; Resources, Y.Z. and X.Q.; writing—original draft preparation, J.S.; writing—review and editing, A.S. and J.C.; visualisation, J.S.; supervision, Y.Z. and J.C.; funding acquisition, Y.Z. and J.C. All authors have read and agreed to the published version of the manuscript.
Funding
This research was funded by the National Social Science Foundation of China, grant number 19BGJ017, and the FACET Project—Interreg 2Seas Programme under the European Regional Development Fund.
Conflicts of Interest
The authors declare no conflict of interest.
Appendix A
Figure A1.
Sentiment Frequency.


Figure A2.
Sentiment Fluctuation.


References
- Lehto, X.; Park, J.K.; Park, O.; Lehto, M.R. Text Analysis of Consumer Reviews: The Case of Virtual Travel Firms. In Human Interface 2007: Human Interface and the Management of Information. Methods, Techniques and Tools in Information Design; Springer: Berlin/Heidelberg, Germany, 2007; p. 4557. [Google Scholar] [CrossRef]
- Chon, K.S. The role of destination image in tourism: A review and discussion. Tour. Rev. 1990, 45, 2–9. [Google Scholar] [CrossRef] [Green Version]
- Dragouni, M.; Filis, G.; Gavriilidis, K.; Santamaria, D. Sentiment, mood and outbound tourism demand. Ann. Tour. Res. 2016, 60, 80–96. [Google Scholar] [CrossRef]
- Liu, Y.; Bao, J.G.; Zhu, Y.L. Exploring emotion methods of tourism destination evaluation: A big data approach. Geogr. Res. 2017, 36, 1091–1105. [Google Scholar] [CrossRef]
- Wang, L.; Kirilenko, A.P. Do tourists from different countries interpret travel experience with the same feeling? Sentiment analysis of TripAdvisor reviews. In Information and Communication Technologies in Tourism 2021; Springer: Cham, Switzerland, 2021; pp. 294–301. [Google Scholar]
- Flores-Ruiz, D.; Elizondo-Salto, A.; Barroso-González, M.D.L.O. Using social media in tourist sentiment analysis: A case study of Andalusia during the COVID-19 pandemic. Sustainability 2021, 13, 3836. [Google Scholar] [CrossRef]
- González-Rodríguez, M.R.; Martínez-Torres, R.; Toral, S. Post-visit and pre-visit tourist destination image through eWOM sentiment analysis and perceived helpfulness. Int. J. Contemp. Hosp. Manag. 2016, 28, 2609–2627. [Google Scholar] [CrossRef]
- Li, W.; Zhu, L.; Guo, K.; Shi, Y.; Zheng, Y. Build a tourism-specific sentiment lexicon via word2vec. Ann. Data Sci. 2018, 5, 1–7. [Google Scholar] [CrossRef]
- Urry, J.; Larsen, J. The Tourist Gaze 3.0.; SAGE Publications: London, UK, 2011. [Google Scholar]
- González-Reverté, F.; Gomis-López, J.; Díaz-Luque, P. Reset or temporary break? Attitudinal change, risk perception and future travel intention in tourists experiencing the COVID-19 pandemic. J. Tour. Futures 2022. ahead of print. [Google Scholar] [CrossRef]
- Weaver, D.B.; Lawton, L.J. Visitor attitudes toward tourism development and product integration in an Australian urban-rural fringe. J. Travel Res. 2004, 42, 286–296. [Google Scholar] [CrossRef]
- Carvache-Franco, M.; Alvarez-Risco, A.; Carvache-Franco, O.; Carvache-Franco, W.; Estrada-Merino, A.; Villalobos-Alvarez, D. Perceived value and its influence on satisfaction and loyalty in a coastal city: A study from Lima, Peru. J. Policy Res. Tour. Leis. Events 2022, 14, 115–130. [Google Scholar] [CrossRef]
- Ding, G.; Wu, J. Influence of Tourism Safety Perception on Destination Image: A Case Study of Xinjiang, China. Sustainability 2022, 14, 1663. [Google Scholar] [CrossRef]
- Lyu, J.; Li, Y.; Mao, Z.; Huang, H. The effect of innovation on tourists’ revisit intention toward tourism destinations. Tour. Rev. 2022. ahead of print. [Google Scholar] [CrossRef]
- Light, D.; Creţan, R.; Voiculescu, S.; Jucu, I.S. Introduction: Changing tourism in the cities of post-communist central and eastern Europe. J. Balk. Near East. Stud. 2020, 22, 465–477. [Google Scholar] [CrossRef]
- Light, D.; Creţan, R.; Dunca, A.M. Transitional justice and the political ‘work’ of domestic tourism. Curr. Issues Tour. 2021, 24, 742–754. [Google Scholar] [CrossRef]
- Becken, S. Tourists’ perception of international air travel’s impact on the global climate and potential climate change policies. J. Sustain. Tour. 2007, 15, 351–368. [Google Scholar] [CrossRef]
- Kim, K.; Park, O.J.; Yun, S.; Yun, H. What makes tourists feel negatively about tourism destinations? Application of hybrid text mining methodology to smart destination management. Technol. Forecast. Soc. Change 2017, 123, 362–369. [Google Scholar] [CrossRef]
- Chatkaewnapanon, Y. Tourist Perceptions of Tourism and its Implications for Sustainable Tourism Planning. In Proceedings of the 4th International Conference on Hospitality and Tourism Management, Bangkok, Thailand, 26–27 May 2016; Volume 4, pp. 109–113. [Google Scholar] [CrossRef]
- Chen, C.M.; Chen, S.H.; Lee, H.T. The destination competitiveness of Kinmen’s tourism industry: Exploring the interrelationships between tourist perceptions, service performance, customer satisfaction and sustainable tourism. J. Sustain. Tour. 2011, 19, 247–264. [Google Scholar] [CrossRef]
- Gössling, S.; Scott, D.; Hall, C.M.; Ceron, J.P.; Dubois, G. Consumer behaviour and demand response of tourists to climate change. Ann. Tour. Res. 2012, 39, 36–58. [Google Scholar] [CrossRef]
- Mariani, M.; Baggio, R.; Fuchs, M.; Höepken, W. Business intelligence and big data in hospitality and tourism: A systematic literature review. Int. J. Contemp. Hosp. Manag. 2018, 30, 3514–3554. [Google Scholar] [CrossRef]
- Zhang, K.; Chen, Y.; Li, C. Discovering the tourists’ behaviors and perceptions in a tourism destination by analyzing photos’ visual content with a computer deep learning model: The case of Beijing. Tour. Manag. 2019, 75, 595–608. [Google Scholar] [CrossRef]
- Park, S.; Lee, J.; Song, W. Short-term forecasting of Japanese tourist inflow to South Korea using Google trends data. J. Travel Tour. Mark. 2016, 34, 357–368. [Google Scholar] [CrossRef]
- Li, H.; Hu, M.; Li, G. Forecasting tourism demand with multisource big data. Ann. Tour. Res. 2020, 83, 102912. [Google Scholar] [CrossRef]
- Huerta-Álvarez, R.; Cambra-Fierro, J.J.; Fuentes-Blasco, M. The Interplay between Social Media Communication, Brand Equity and Brand Engagement in Tourist Destinations: An Analysis in an Emerging Economy. J. Destin. Mark. Manag. 2020, 16, 100413. [Google Scholar] [CrossRef]
- Zhang, Y.; Gao, J.; Cole, S.; Ricci, P. How the Spread of User-Generated Contents (UGC) Shapes International Tourism Distribution: Using Agent-Based Modelling to Inform Strategic UGC Marketing. J. Travel Res. 2021, 60, 1469–1491. [Google Scholar] [CrossRef]
- Guo, Y.; Barnes, S.J.; Jia, Q. Mining meaning from online ratings and reviews: Tourist satisfaction analysis using latent dirichlet allocation. Tour. Manag. 2017, 59, 467–483. [Google Scholar] [CrossRef] [Green Version]
- Xiang, Z.; Schwartz, Z.; Gerdes, J.H.; Uysal, M. What can big data and text analytics tell us about hotel guest experience and satisfaction? Int. J. Hosp. Manag. 2015, 44, 120–130. [Google Scholar] [CrossRef]
- Ukpabi, D.C.; Karjaluoto, H. What drives travelers adoption of user-generated content? A literature review. Tour. Manag. Perspect. 2018, 28, 251–273. [Google Scholar] [CrossRef]
- Ma, J.; Gao, J.; Scott, N.; Ding, P. Customer delight from theme park experiences: The antecedents of delight based on cognitive appraisal theory. Ann. Tour. Res. 2013, 42, 359–381. [Google Scholar] [CrossRef]
- Lazarus, R.S.; Smith, C.A. Knowledge and Appraisal in the Cognition—Emotion Relationship. Cogn. Emot. 1988, 2, 281–300. [Google Scholar] [CrossRef]
- Roseman, I.J. Appraisal determinants of discrete emotions. Cogn. Emot. 1991, 5, 161–200. [Google Scholar] [CrossRef]
- Roseman, I.J.; Spindel, M.S.; Jose, P.E. Appraisals of Emotion-Eliciting Events: Testing a Theory of Discrete Emotions. J. Personal. Soc. Psychol. 1990, 59, 899–915. [Google Scholar] [CrossRef]
- Roseman, I.J. Cognitive determinants of emotion: A structural theory. Rev. Personal. Soc. Psychol. 1984, 5, 11–36. [Google Scholar]
- Young, P.; Arnold, M.B. Emotion and Personality; Columbia University Press: New York, NY, USA, 1960; p. 76. [Google Scholar]
- Scherer, K.R.; Schorr, A.; Johnstone, T. Appraisal Processes in Emotion: Theory, Methods, Research; Oxford University Press: Oxford, UK, 2001. [Google Scholar]
- Ortony, A.; Clore, G.L.; Collins, A. The Cognitive Structure of Emotions; Cambridge University Press: Cambridge, UK, 2003. [Google Scholar] [CrossRef]
- Watson, L.; Spence, M.T. Causes and consequences of emotions on consumer behaviour A review and integrative cognitive appraisal theory. Eur. J. Mark. 2007, 41, 487–511. [Google Scholar] [CrossRef]
- Nyer, P.U. A study of the relationships between cognitive appraisals and consumption emotions. J. Acad. Mark. Sci. 1997, 25, 296–304. [Google Scholar] [CrossRef]
- White, C.; Yu, Y.T. Satisfaction emotions and consumer behavioral intentions. J. Serv. Mark. 2005, 19, 411–420. [Google Scholar] [CrossRef]
- Strizhakova, Y.; Tsarenko, Y.; Ruth, J.A. “I’m mad and I can’t get that service failure off my mind” coping and rumination as mediators of anger effects on customer intentions. J. Serv. Res. 2012, 15, 414–429. [Google Scholar] [CrossRef]
- Wang, C.; Xiao, Z.; Liu, Y.; Xu, Y.; Zhou, A.; Zhang, K. Sentiview: Sentiment analysis and visualization for internet popular topics. IEEE Trans. Hum.-Mach. Syst. 2013, 43, 620–630. [Google Scholar] [CrossRef]
- Bhattacharyya, S.; Snásěl, V.; Gupta, D.; Khanna, A. Hybrid Computational Intelligence: Challenges and Applications; Academic Press: Amsterdam, NY, USA, 2020. [Google Scholar]
- Feldman, R. Techniques and Applications for Sentiment Analysis. Commun. ACM 2013, 56, 82–89. [Google Scholar] [CrossRef]
- Drus, Z.; Khalid, H. Sentiment Analysis in Social-Media and its Application: Systematic Literature Review. Procedia Comput. Sci. 2019, 161, 707–714. [Google Scholar] [CrossRef]
- Ribeiro, F.N.; Araújo, M.; Gonçalves, P.; Gonçalves, M.A.; Benevenuto, F. SentiBench—A benchmark comparison of state-of-the-practice sentiment analysis methods. EPJ Data Sci. 2016, 5, 23. [Google Scholar] [CrossRef] [Green Version]
- Pang, B.; Lee, L.; Vaithyanathan, S. Thumbs up? In Proceedings of the ACL-02 Conference on Empirical Methods in Natural Language Processing—EMNLP 02, Stroudsburg, PA, USA, 6 July 2022. [Google Scholar] [CrossRef] [Green Version]
- Yan, Q.; Zhou, S.; Wu, S. The influences of tourists’ emotions on the selection of electronic word of mouth platforms. Tour. Manag. 2018, 66, 348–363. [Google Scholar] [CrossRef]
- Hosany, S.; Gilbert, D. Measuring tourists’ emotional experiences toward hedonic holiday destinations. J. Travel Res. 2010, 49, 513–526. [Google Scholar] [CrossRef]
- Hosany, S.; Hunter-Jones, P.; McCabe, S. Emotions in tourist experiences: Advancing our conceptual, methodological and empirical understanding. J. Destin. Mark. Manag. 2020, 16, 100444. [Google Scholar] [CrossRef]
- Liu, Y.; Bao, J.G.; Chen, K.Q. Sentimental features of Chinese outbound tourists in Australia: Big-data based content analysis. Tour. Trib. 2017, 32, 46–58. [Google Scholar] [CrossRef]
- Radojevic, T.; Stanisic, N.; Stanic, N. Ensuring positive feedback: Factors that influence customer satisfaction in the contemporary hospitality industry. Tour. Manag. 2015, 51, 13–21. [Google Scholar] [CrossRef]
- Yan, X.; Wang, J.; Chau, M. Customer revisit intention to restaurants: Evidence from online reviews. Inf. Syst. Front. 2015, 17, 645–657. [Google Scholar] [CrossRef]
- Torres, E.N.; Singh, D.; Robertson-Ring, A. Consumer reviews and the creation of booking transaction value: Lessons from the hotel industry. Int. J. Hosp. Manag. 2015, 50, 77–83. [Google Scholar] [CrossRef] [Green Version]
- Ye, Q.; Law, R.; Gu, B. The impact of online user reviews on hotel room sales. Int. J. Hosp. Manag. 2009, 28, 180–182. [Google Scholar] [CrossRef]
- Marine-Roig, E.; Ferrer-Rosell, B. Measuring the gap between projected and perceived destination images of Catalonia using compositional analysis. Tour. Manag. 2018, 68, 236–249. [Google Scholar] [CrossRef]
- Gulati, S. Decoding the global trend of “vaccine tourism” through public sentiments and emotions: Does it get a nod on Twitter? Glob. Knowl. Mem. Commun. 2021, ahead of print. [CrossRef]
- Balasubramanian, S.; Kaitheri, S.; Nanath, K.; Sreejith, S.; Paris, C.M. Examining post COVID-19 tourist concerns using sentiment analysis and topic modeling. In Information and Communication Technologies in Tourism; Wörndl, W., Koo, C., Stienmetz, J.L., Eds.; Springer: Cham, Switzerland, 2021; pp. 564–569. [Google Scholar] [CrossRef]
- Park, E.O.; Kim, W.H.; Kim, S.B. What are salient themes and associated sentiments about tourist destinations shared in online discourse during COVID-19 pandemic? Korea Tour. Assoc. Int. Conf. 2021, 90, 215. Available online: https://papersearch.net/thesis/article.asp?key=3920254 (accessed on 5 October 2022).
- Gao, S.; Hao, J.; Fu, Y. The application and comparison of web services for sentiment analysis in tourism. In Proceedings of the 2015 12th International Conference on Service Systems and Service Management (ICSSSM), Guangzhou, China, 22–24 June 2015; pp. 1–6. [Google Scholar] [CrossRef]
- Mitas, O.; Yarnal, C.; Chick, G. Jokes build community: Mature tourists’ positive emotions. Ann. Tour. Res. 2012, 39, 1884–1905. [Google Scholar] [CrossRef]
- Gulati, S. Tapping public sentiments on Twitter for tourism insights: A study of famous Indian heritage sites. Int. Hosp. Rev. 2021, 36, 244–257. [Google Scholar] [CrossRef]
- Cherapanukorn, V.; Sugunnasil, P. Tourist Attraction Satisfaction Factors from Online Reviews. A Case Study of Tourist Attractions in Thailand. J. Environ. Manag. Tour. 2022, 13, 379–390. [Google Scholar] [CrossRef]
- Miftahuddin, A.; Kumalasari, R.A.D.; Pradana, M. Urban Tourism Destination Image Perception Based on Social Network Analysis: The Example of the Tourist Sites in Yogyakarta. Int. J. Bus. Rev. Jobs Rev. 2022, 5, 117–125. [Google Scholar] [CrossRef]
- Tucker, H. Empathy and tourism: Limits and possibilities. Ann. Tour. Res. 2016, 57, 31–43. [Google Scholar] [CrossRef]
- Isaac, R.K.; Çakmak, E. Understanding the motivations and emotions of visitors at Tuol Sleng genocide prison museum (S-21) in Phnom Penh, Cambodia. Int. J. Tour. Cities 2016, 2, 232–247. [Google Scholar] [CrossRef]
- Curnock, M.I.; Marshall, N.A.; Thiault, L.; Heron, S.F.; Hoey, J.; Williams, G.; Taylor, B.; Pert, P.T.; Goldberg, J. Shifts in tourists’ sentiments and climate risk perceptions following mass coral bleaching of the Great Barrier Reef. Nat. Clim. Chang. 2019, 9, 535–541. [Google Scholar] [CrossRef]
- Faullant, R.; Matzler, K.; Mooradian, T.A. Personality, basic emotions, and satisfaction: Primary emotions in the mountaineering experience. Tour. Manag. 2011, 32, 1423–1430. [Google Scholar] [CrossRef]
- Zhang, S.N.; Li, Y.Q.; Ruan, W.Q.; Liu, C.H. Would you enjoy virtual travel? The characteristics and causes of virtual tourists’ sentiment under the influence of the COVID-19 pandemic. Tour. Manag. 2022, 88, 104429. [Google Scholar] [CrossRef]
- Valdivia, A.; Luzon, M.V.; Herrera, F. Sentiment Analysis in TripAdvisor. IEEE Intell. Syst. 2017, 32, 72–77. [Google Scholar] [CrossRef]
- Geetha, M.; Singha, P.; Sinha, S. Relationship between customer sentiment and online customer ratings for hotels—An empirical analysis. Tour. Manag. 2017, 61, 43–54. [Google Scholar] [CrossRef]
- Claster, W.B.; Cooper, M.; Sallis, P. Thailand—Tourism and Conflict: Modeling Sentiment from Twitter Tweets Using Naïve Bayes and Unsupervised Artificial Neural Nets. In Proceedings of the Computational Intelligence, Modelling and Simulation (CIMSiM), 2010 Second International Conference, Bali, Indonesia, 28–30 September 2010. [Google Scholar] [CrossRef]
- Wang, J.; Xia, Y.; Wu, Y. Sensing Tourist Distributions and Their Sentiment Variations Using Social Media: Evidence from 5A Scenic Areas in China. ISPRS Int. J. Geo-Inf. 2022, 11, 492. [Google Scholar] [CrossRef]
- Kisilevich, S.; Rohrdantz, C.; Keim, D.A. “Beautiful picture of an ugly place>”. Exploring photo collections using opinion and sentiment analysis of user comments. In Proceedings of the International Multiconference on Computer Science and Information Technology—IMCSIT 2010, Wisla, Poland, 18–20 October 2010. [Google Scholar] [CrossRef] [Green Version]
- Kandampully, J.; Zhang, T.; Jaakkola, E. Customer experience management in hospitality: A literature synthesis, new understanding, and research agenda. Int. J. Contemp. Hosp. Manag. 2017, 30, 21–56. [Google Scholar] [CrossRef]
- Seetanah, B. Assessing the dynamic economic impact of tourism for island economies. Ann. Tour. Res. 2011, 38, 291–308. [Google Scholar] [CrossRef]
- Mazzola, F.; Pizzuto, P.; Ruggieri, G. The role of tourism in island economic growth and resilience: A panel analysis for the European Mediterranean countries (2000–2015). J. Econ. Stud. 2019, 46, 1418–1436. [Google Scholar] [CrossRef]
- Barnett, J.; Waters, E. Rethinking the vulnerability of small island states: Climate change and development in the Pacific Islands. In The Palgrave Handbook of International Development; Palgrave Macmillan: London, UK, 2016; pp. 731–748. [Google Scholar] [CrossRef]
- Chong, K.L. The side effects of mass tourism: The voices of Bali islanders. Asia Pac. J. Tour. Res. 2020, 25, 157–169. [Google Scholar] [CrossRef]
- Valls, J.F.; Mota, L.; Vieira, S.C.F.; Santos, R. Opportunities for slow tourism in Madeira. Sustainability 2019, 11, 4534. [Google Scholar] [CrossRef] [Green Version]
- Praptiwi, R.A.; Maharja, C.; Fortnam, M.; Chaigneau, T.; Evans, L.; Garniati, L.; Sugardjito, J. Tourism-based alternative livelihoods for small island communities transitioning towards a blue economy. Sustainability 2021, 13, 6655. [Google Scholar] [CrossRef]
- The World Bank. 2022. International Tourism, Number of Departures—China. Available online: https://data.worldbank.org/indicator/ST.INT.DPRT?end=2020&locations=CN&start=2019 (accessed on 28 October 2022).
- South Pacific Tourism Organisation. Tourist Arrivals in 2016 Summary. Available online: https://southpacificislands.travel/rtrc/ (accessed on 20 June 2020).
- China Tourism Academy. Basic Situation of China Tourism Market 2019. Available online: https://www.mct.gov.cn/whzx/whyw/202003/t20200310_851786.htm (accessed on 19 January 2021).
- The World Bank 2022. International Tourism, Number of Arrivals—Pacific Island Small States. Available online: https://data.worldbank.org/indicator/ST.INT.ARVL?end=2019&locations=S2&most_recent_year_desc=false&start=2007&view=chart (accessed on 28 October 2022).
- Research and Markets. China Tourism Visit and Spending Report 2019. Available online: https://www.prnewswire.com/news-releases/china-outbound-tourists-visit-and-spending-report-2019---forecast-to-2025-for-the-365-billion-industry-300925281.html (accessed on 15 June 2020).
- Patricia, C.J.; Xu, H.; Wolfgang, G. Outbound Chinese tourism: Looking back and looking forward. J. Policy Res. Tour. Leis. Events 2020, 12, 1–7. [Google Scholar] [CrossRef] [Green Version]
- Booking.com. Predicts the Top Travel Trends for 2020. Available online: https://globalnews.booking.com/bookingcom-predicts-the-top-travel-trends-for-2020/ (accessed on 28 October 2022).
- Bilia, A.R.; Gallori, S.; Vincieri, F.F. Kava-kava and anxiety: Growing knowledge about the efficacy and safety. Life Sci. 2022, 70, 2581–2597. [Google Scholar] [CrossRef]
- Lonely Planet. Must See Attractions in Samoa. Available online: https://www.lonelyplanet.com/samoa/attractions (accessed on 28 October 2022).
- Liu, Y.; Huang, K.; Bao, J.; Chen, K. Listen to the voices from home: An analysis of Chinese tourists’ sentiments regarding Australian destinations. Tour. Manag. 2018, 71, 337–347. [Google Scholar] [CrossRef]
- Patel, B.; Shah, D. Significance of stop word elimination in meta search engine. In Proceedings of the International Conference on Intelligent Systems & Signal Processing, Vallabh Vidyanagar, India, 1–2 March 2013; pp. 52–55. [Google Scholar] [CrossRef]
- Alaei, A.R.; Becken, S.; Stantic, B. Sentiment Analysis in Tourism: Capitalizing on Big Data. J. Travel Res. 2017, 58, 175–191. [Google Scholar] [CrossRef]
- Kearney, C.; Liu, S. Textual sentiment in finance: A survey of methods and models. Int. Rev. Financ. Anal. 2014, 33, 171–185. [Google Scholar] [CrossRef] [Green Version]
- Palmer, M.; Roeder, J.; Muntermann, J. Induction of a sentiment dictionary for financial analyst communication: A data-driven approach balancing machine learning and human intuition. J. Bus. Anal. 2021, 5, 1–21. [Google Scholar] [CrossRef]
- Pearce, P.L.; Caltabiano, M.L. Inferring Travel Motivation from Travelers’ Experiences. J. Travel Res. 1983, 22, 16–20. [Google Scholar] [CrossRef]
- Ying, S.; Chan, J.H.; Qi, X. Why are Chinese and North American guests satisfied or dissatisfied with hotels? An application of big data analysis. Int. J. Contemp. Hosp. Manag. 2020, 32, 3249–3269. [Google Scholar] [CrossRef]
- Wang, W.; Ying, S.; Mejia, C.; Wang, Y.; Qi, X.; Chan, J.H. Independent travelers’ niche hotel booking motivations: The emergence of a hybrid cultural society, Int. J. Hosp. Manag. 2020, 89, 102573. [Google Scholar] [CrossRef]
- Guan, J.; Chan, J.H.; Bi, J.; Qi, X. Cultural proximity, destination familiarity and tourists’ sense of away-from-home (SAFH). J. Destin. Mark. Manag. 2022, 1, 100670. [Google Scholar] [CrossRef]
- Chan, J.H.; Chen, S.Y.; Ji, Z.; Zhang, Y.; Qi, X. Self-gentrification as a pro-active response to tourism development: Cases of Indigenous entrepreneurship in mainland China and Taiwan. In Indigenous Wellbeing and Enterprise; Routledge: London, UK, 2020; pp. 165–191. [Google Scholar]
- Chan, J.H.; Iankova, K.; Zhang, Y.; McDonald, T.; Qi, X. The role of self-gentrification in sustainable tourism: Indigenous entrepreneurship at Honghe Hani rice terraces world heritage site, China. J. Sustain. Tour. 2016, 24, 1262–1279. [Google Scholar] [CrossRef]
- Chan, J.H.; Sciacca, A.; Gao, X.; Coles, A.; Roskam, H.; Debruyne, D.; van Malde- gem, A.; Zavala, J.; Mϩtreau, E.; Brutyn, E.; et al. Financing the Circular Economy in the Tourism Sector: How Can Tourism SMEs Use Reward-Based Crowdfunding to Finance Circular Solutions? Interreg 2 Seas Project FACET; University of Greenwich: London, UK, 2022. [Google Scholar]
- Chan, J.; Sciacca, A.; Coles, A.; Roskam, H.; Brutyn, E.; Piterou, A.; van Maldegem, A.; Métreau, E.; Zavala, J.; Debruyne, D.; et al. Circular Tourism and Support from Local Authorities: How Local Authorities Can Support Small-Medium Size Tourism Enterprises in Coastal Destinations in Six Strategic Steps; Interreg 2 Seas project FACET; University of Greenwich: London, UK, 2022. [Google Scholar]
Figure 1.
Translated Word Cloud Map from pre-processed text through graphic visualisation.


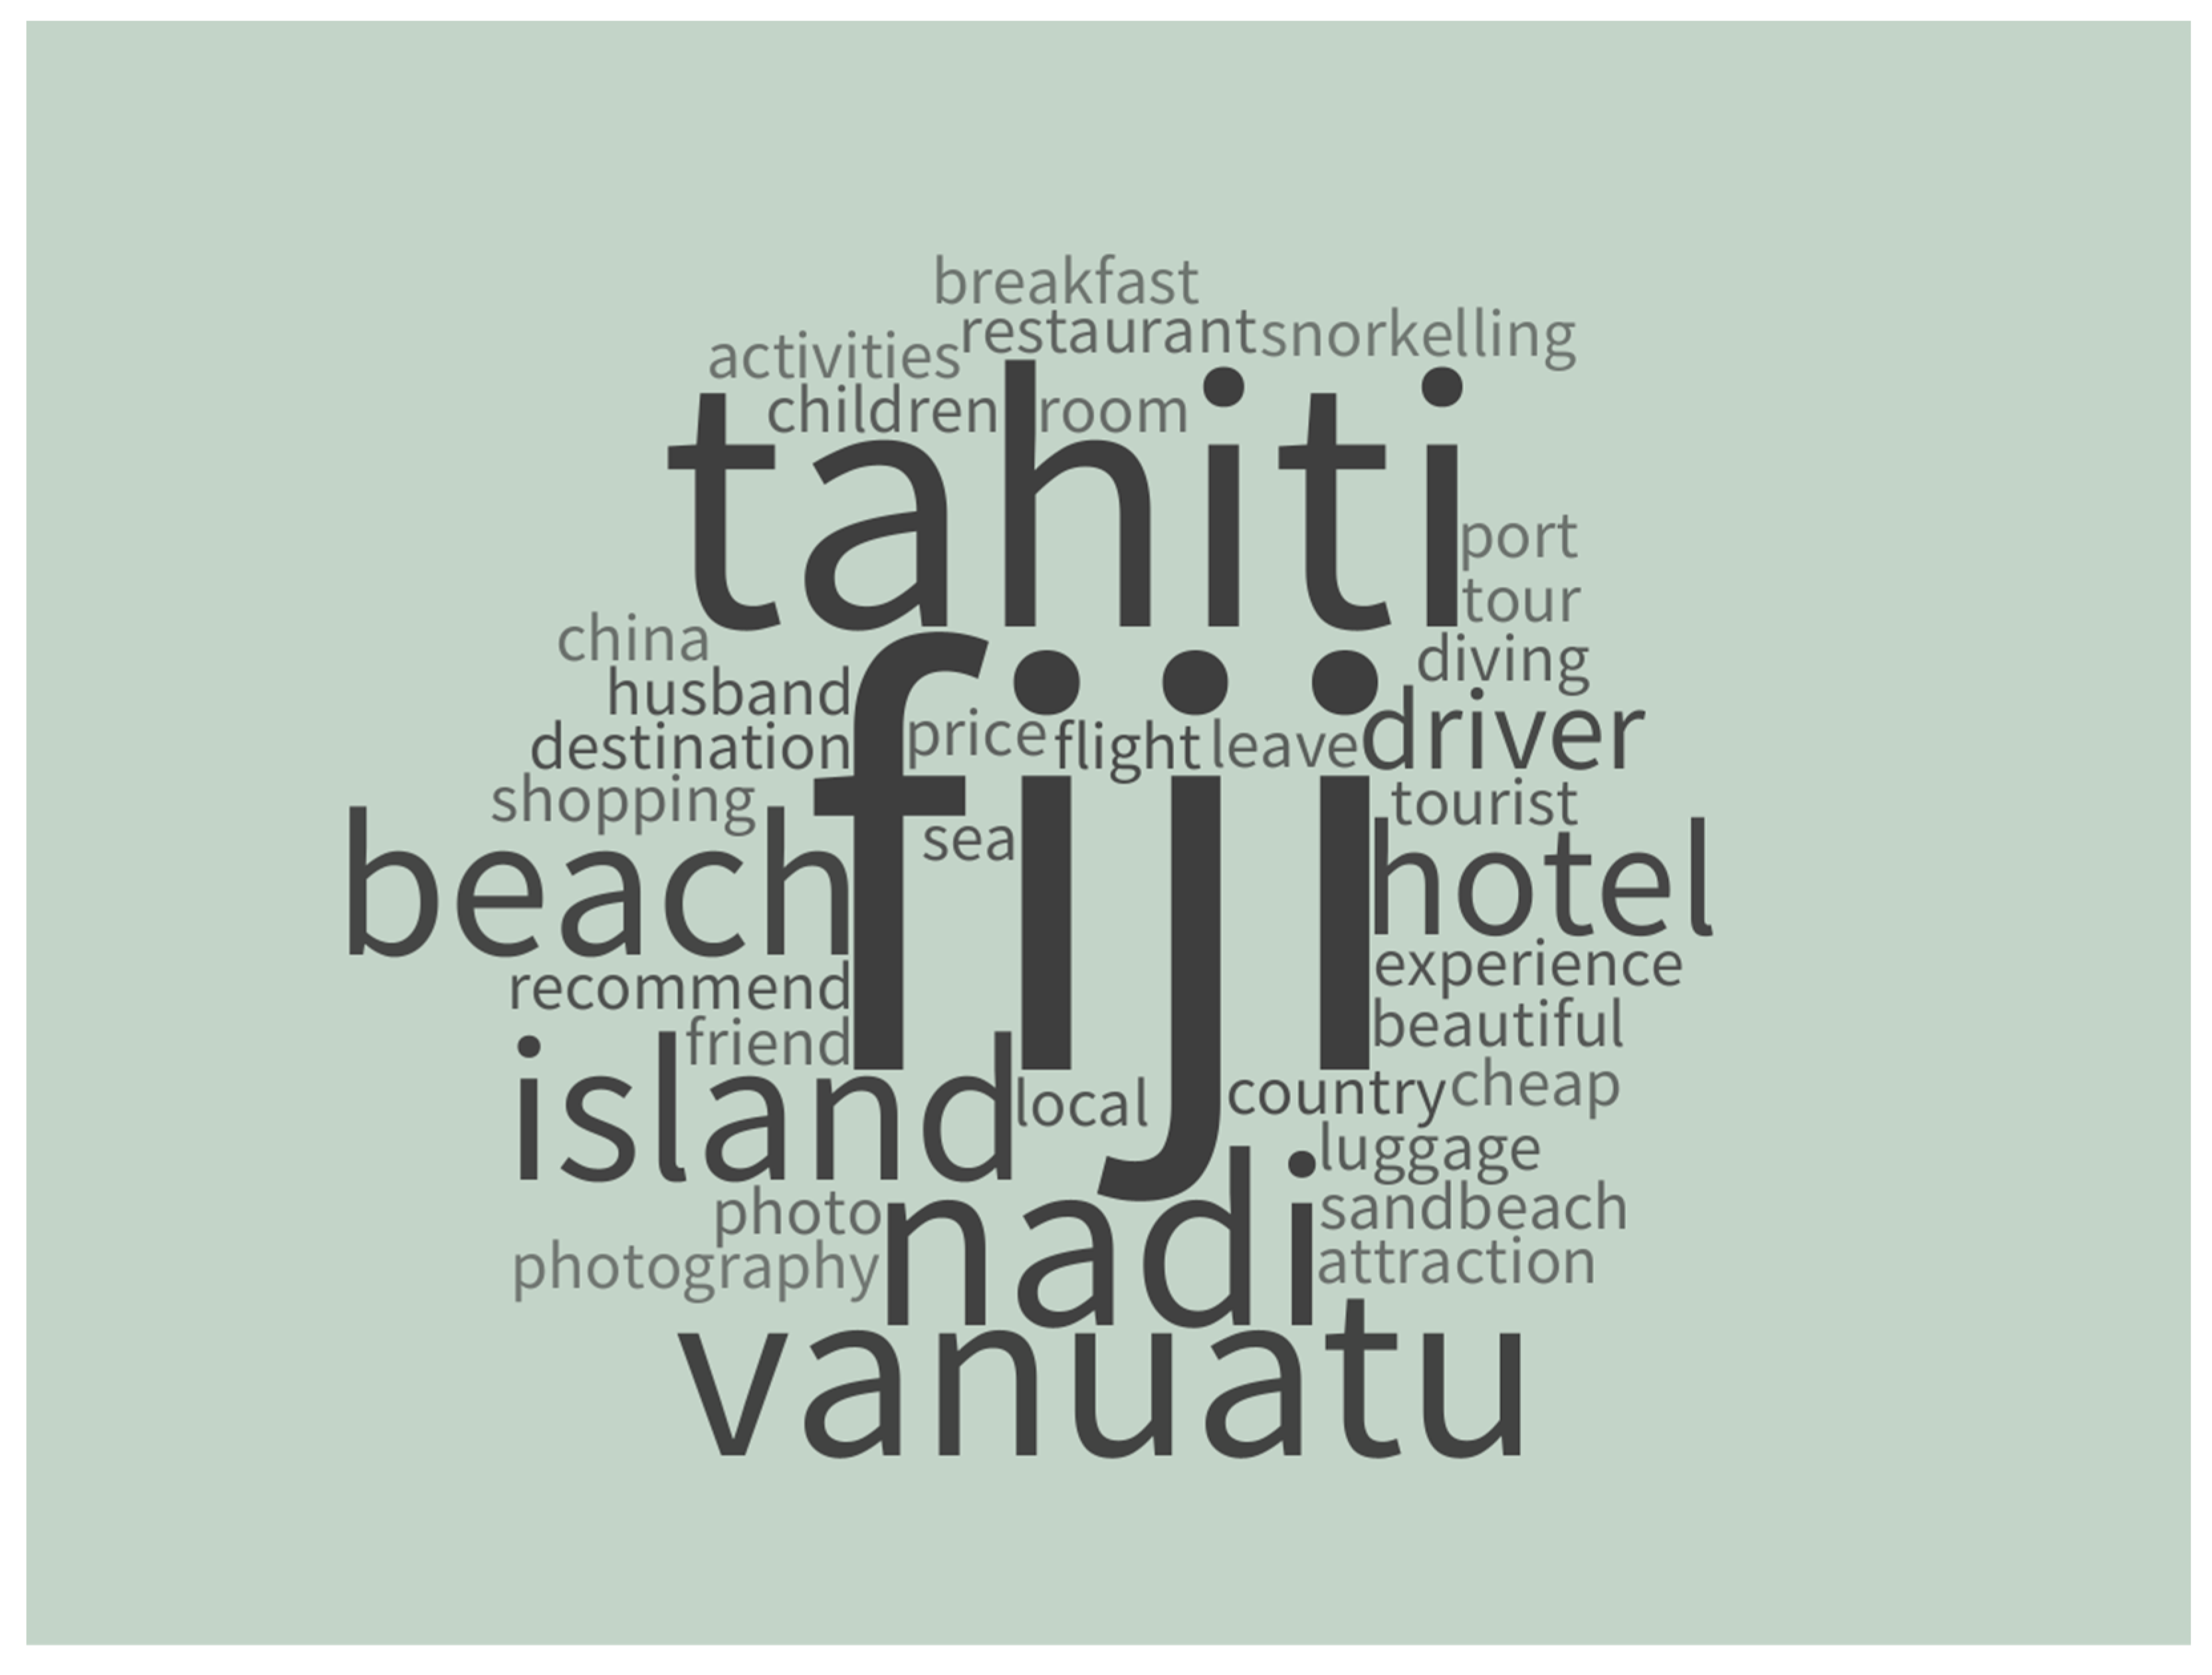
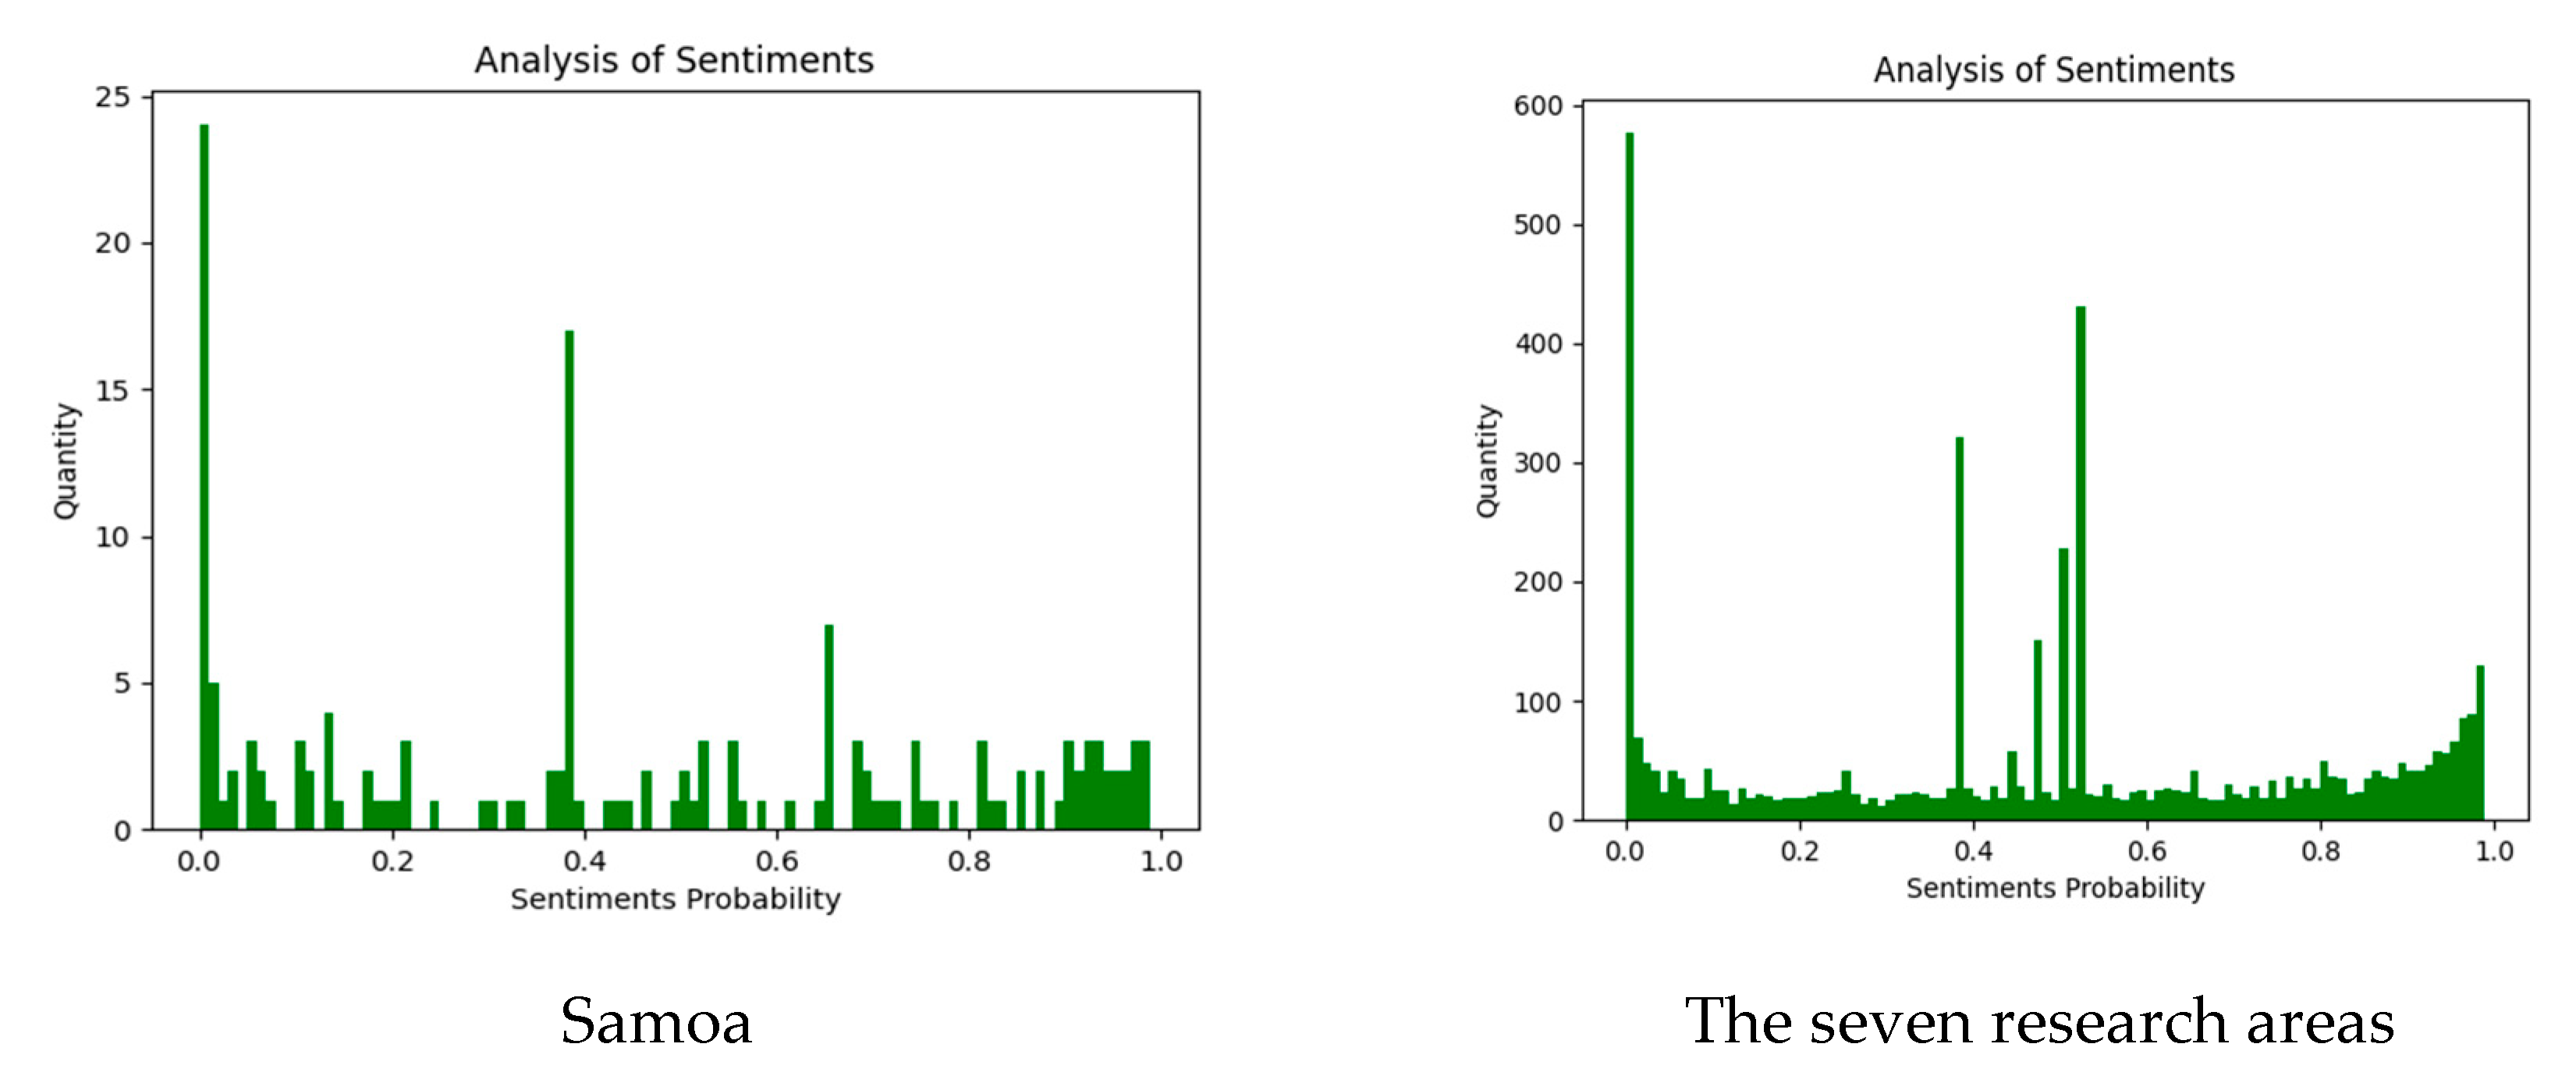
Table 1.
Methodological Steps.
| Step | Aim | Measures |
|---|---|---|
| To select appropriate PICTs | Based on available tourism data |
| To obtain online review text | Through Python crawler |
| To make text data suitable for analysis | (a) text cleaning (b) word segmentation (c) stopwords removal (d) word cloud generation |
| To construct a sentiment lexicon and calculate sentiment values. | (a) sentiment lexicon construction (b) semantic rules setting (c) sentiment analysis based on Python SnowNLP, sentiment lexicon, and word frequency |
Table 2.
Vocabularies of Userdict.
| Types | Examples |
|---|---|
| Locations | South Pacific, Melanesia |
| Attractions | Port Moresby, Denarau, Santo Island |
| Culture | Koroways, Fijian dollar, tattoo |
| Animals and plants | Palm tree, Kava, Manta, Bull shark |
Table 3.
The Degree Words Dictionary.
| Index | Hownet Words (Chinese Sentiment Lexicon) | New Words | Degree | N | Weight |
|---|---|---|---|---|---|
| Mostdict | Most (最), Extreme (极端), Enough (充分), Completely (彻底) | Hundredfold (百倍), Super (爆表) | Most (最) | 75 | 2.5 |
| Verydict | Exceptionally (特别), Really (何止), Indeed (实在) | Remarkably (非凡) Fully (满满, 连连, 十分) Very (敲) | Very (很) | 77 | 2.0 |
| Moredict | More (较为, 不少) | Rather (颇) | More (较) | 42 | 1.5 |
| Ishdict | A little (一点儿), Slightly (些微), A bit (蛮) | Roughly (差不多), Almost (几乎) | Little (稍微) | 46 | 0.5 |
Table 4.
The Constructed Sentiment Lexicon.
| Sentiment Valence | Examples of Basic Sentiment Lexicon Words | Examples of Added Sentiment Lexicon Words | Number |
|---|---|---|---|
| Positive | like, enjoy, immerse | luscious, dazzled, mysterious | 11,045 |
| Negative | grieved, disappointed, gloomy | temperamental, tearless | 8496 |
Table 5.
The Constructed Sentiment Lexicon.
| Sentiment | Tourism Context | Score | Non-Tourism Context | Score |
|---|---|---|---|---|
| positive | On the slow-paced island, there is a sense of leisure and tranquility everywhere. | 1 | The weather is so good today. I’m very happy! | 1 |
| negative | Try not to act alone; the public security environment is very poor. | −1 | You are a big badass. | −1 |
| neutral | Visa can be applied for online. | 0 | He is a physicist at Stanford University. | 0 |
Table 6.
Sentiment Analysis of Chinese Tourists in Pacific Island Countries and Territories.
| Country or Territory | Sentiment Tendency | Sentiment | N | P |
|---|---|---|---|---|
| Papua New Guinea | Positive | Positive (1) | 824 | 77.7% |
| Negative (−1) | 20 | 1.9% | ||
| Neutral (0) | 217 | 20.4% | ||
| Cook Islands | Positive | Positive (1) | 269 | 86.8% |
| Negative (−1) | 3 | 1.0% | ||
| Neutral (0) | 38 | 12.2% | ||
| Fiji | Positive | Positive (1) | 3407 | 97.1% |
| Negative (−1) | 16 | 0.5% | ||
| Neutral (0) | 85 | 2.4% | ||
| Tahiti | Positive | Positive (1) | 617 | 97.9% |
| Negative (−1) | 0 | 0 | ||
| Neutral (0) | 13 | 2.1% | ||
| Tonga | Positive | Positive (1) | 146 | 84.9% |
| Negative (−1) | 0 | 0 | ||
| Neutral (0) | 26 | 15.1% | ||
| Vanuatu | Positive | Positive (1) | 302 | 97.8% |
| Negative (−1) | 2 | 0.6% | ||
| Neutral (0) | 5 | 1.6% | ||
| Samoa | Positive | Positive (1) | 216 | 93.1% |
| Negative (−1) | 6 | 2.6% | ||
| Neutral (0) | 10 | 4.3% | ||
| Seven research areas | Positive | Positive (1) | 5781 | 93.0% |
| Negative (−1) | 47 | 0.7% | ||
| Neutral (0) | 394 | 6.3% |
Table 7.
Sentiment Tendency.
| Sentiment Tendency | N | P (%) |
|---|---|---|
| Positive | 2603 | 51.7% |
| Neutral | 1883 | 37.4% |
| Negative | 550 | 10.9% |
| Total | 5036 | 100% |
Table 8.
Word Frequency of Vanuatu and Samoa.
| Vanuatu | Samoa | ||||||
|---|---|---|---|---|---|---|---|
| Words | Frequency | Words | Frequency | Words | Frequency | Words | Frequency |
| Vanuatu | 410 | postcard | 41 | Samoa | 270 | island | 18 |
| volcano | 248 | shoot | 40 | Visa | 120 | air ticket | 18 |
| hotel | 223 | Australia | 38 | airport | 61 | downtown | 17 |
| Port Vila | 219 | volcanic vent | 36 | China | 56 | harbour | 17 |
| Fiji | 185 | Beijing | 35 | passport | 47 | volcano | 16 |
| local | 149 | transfer | 33 | beach | 43 | port | 16 |
| Underwater Post Office | 103 | New Zealand | 33 | hotel | 37 | sea-island | 16 |
| airport | 101 | inbound | 32 | Sand-beach | 36 | cruise | 16 |
| country | 95 | eager | 32 | Apia | 35 | guide | 16 |
| plane | 86 | coconut | 32 | New Zealand | 33 | culture | 15 |
| photograph | 80 | global | 31 | Fiji | 32 | ticket | 15 |
| flight | 79 | sand-beach | 31 | Visa-free | 30 | wind tunnel | 14 |
| sea-island | 74 | aviation | 31 | church | 29 | wharf | 15 |
| seawater | 64 | dive | 31 | locals | 27 | bus | 15 |
| China | 64 | holiday | 30 | inbound | 27 | people | 15 |
| Pacific island | 63 | sea | 30 | plane | 27 | Pacific | 14 |
| happiness | 61 | beautiful | 29 | on-island | 27 | fruit | 14 |
| capital | 61 | Pacific | 29 | waterfall | 25 | swim | 14 |
| Hong Kong | 60 | lobster | 29 | island-country | 25 | turtle | 13 |
| phone | 57 | island-country | 28 | dollar | 23 | car-rent | 13 |
| isles | 55 | free-of-charge | 28 | USA | 22 | trench | 13 |
| tribe | 53 | wharf | 28 | seawater | 22 | building | 13 |
| erupt | 51 | simple | 28 | free-of-charge | 22 | fee | 13 |
| beach | 49 | smile | 26 | seaside | 21 | supermarket | 13 |
| honour | 48 | package | 26 | cave | 20 | travel | 13 |
| friend | 47 | room | 26 | market | 20 | sunset | 13 |
| island | 47 | traffic | 26 | roundabout | 20 | breakfast | 13 |
| original | 45 | magma | 25 | friend | 19 | resort | 13 |
| easy | 43 | green | 24 | apply | 19 | tropics | 13 |
| locals | 43 | special | 24 | expiry-date | 18 | coconut | 13 |
Publisher’s Note: MDPI stays neutral with regard to jurisdictional claims in published maps and institutional affiliations. |
© 2022 by the authors. Licensee MDPI, Basel, Switzerland. This article is an open access article distributed under the terms and conditions of the Creative Commons Attribution (CC BY) license (https://creativecommons.org/licenses/by/4.0/).
Share and Cite
MDPI and ACS Style
Zhang, Y.; Song, J.; Sciacca, A.; Chan, J.; Qi, X. Novel Sentiment Lexica Derived from User Generating Content by Chinese Tourists in Pacific Islands. Sustainability 2022, 14, 15833. https://0-doi-org.brum.beds.ac.uk/10.3390/su142315833
AMA Style
Zhang Y, Song J, Sciacca A, Chan J, Qi X. Novel Sentiment Lexica Derived from User Generating Content by Chinese Tourists in Pacific Islands. Sustainability. 2022; 14(23):15833. https://0-doi-org.brum.beds.ac.uk/10.3390/su142315833
Chicago/Turabian StyleZhang, Ying, Jiehang Song, Angelo Sciacca, Jin Chan, and Xiaoguang Qi. 2022. "Novel Sentiment Lexica Derived from User Generating Content by Chinese Tourists in Pacific Islands" Sustainability 14, no. 23: 15833. https://0-doi-org.brum.beds.ac.uk/10.3390/su142315833
Note that from the first issue of 2016, this journal uses article numbers instead of page numbers. See further details here.