
Effects of Top-Down Balanced Development Strategies on Regional Balance: Evidence from Public Big Data in Korea

1
Urban Research Division, Korea Research Institute for Human Settlements, 5 Gukchaegyeonguwon-ro, Sejong-si 30147, Republic of Korea
2
Virginia Center for Housing Research, 430 Bishop-Favrao Hall, 1345 Perry St., Blacksburg, VA 24061, USA
*
Author to whom correspondence should be addressed.
Sustainability 2022, 14(23), 16221; https://0-doi-org.brum.beds.ac.uk/10.3390/su142316221
Submission received: 22 September 2022
/
Revised: 14 November 2022
/
Accepted: 25 November 2022
/
Published: 5 December 2022
(This article belongs to the Special Issue Urban Planning for Sustainable Development of Cities in the Geospatial (Big) Data ERA)
Abstract
:The rapid economic growth of Korea was accompanied by the side effect of disproportionate growth between regions. The central government has implemented balanced development strategies by enacting the Special Act on Balanced National Development. For example, central administrative institutions were relocated to Sejong-si, which was built as the administrative capital. This study examines whether the top-down strategy promoted balanced growth between regions using public big data. We use various indicators to pay attention to not only quantitative growth, such as population size and economic growth, but also qualitative growth, such as life satisfaction. The results show that, despite the government’s efforts, the population was concentrated in the major metropolitan areas and the economic gap between regions did not narrow. While metropolitan areas achieved steady growth based on the preemption of spatial competitiveness, non-metropolitan areas did not take advantage of more investment from government. However, it shows a significant increase in job creation in Sejong-si, suggesting it is more efficient to move institutions in groups than to completely disperse public institutions in the balanced development strategy. In terms of the quality of life, Sejong-si had the lowest personal life satisfaction and local life satisfaction, indicating that the top-down strategy has failed to manage the quality of life. We propose that promoting a compact city with multiple functions in the non-metropolitan areas will help balance development. To achieve a better quality of life, centralized power should be transferred to local governments, and policies should be built based on communication with local residents. Innovative and sustainable policies that efficiently utilize the uniqueness and potential of the region are needed for balanced growth.
1. Introduction
As a result of compressed growth centered on the metropolitan area in the process of rapid economic growth since the 1970s, the problem of unbalanced development of the national land has emerged in South Korea: overcrowding in the metropolitan area and widening the gap between the metropolitan area and provinces. Economic activities, gross regional domestic product (GRDP), and social and cultural facilities, are concentrated in the metropolitan areas, despite various efforts made for the balanced development of the country. The main strategy of the Korean central government was to disperse public institutions concentrated in the metropolitan area and relocate central administrative institutions to Sejong-si, which was built as the administrative capital. The government aimed to make each institution an economic hub for the region. The Special Act on Balanced National Development, 2004, was enacted to prepare the legal basis for relocating public institutions to local areas [1].
Since the Special Act on Balanced National Development was enacted in 2004, amendments have been made to reflect changes in the direction of government policy, changes in the socio-economic environment, and changes in policy demands, as a new government has been launched every five years for about 20 years. In the meantime, various policy experiments have been attempted to resolve the problem of concentration in the metropolitan area and regional imbalances through various governments, but the concentration in metropolitan areas is intensifying. The Roh Moo-hyun administration (2003–2008) judged that national competitiveness might deteriorate if the gap between the metropolitan area and local areas widened. Therefore, based on the development strategy that can increase the independence of the provinces, we pursued a win-win strategy that can prosper both the metropolitan area and the provinces at the same time [1,2].
On the other hand, the national development core strategies used by the Lee Myung-bak administration (2008–2013) and the Park Geun-hye administration (2013–2017) are balanced development between regions, mutual cooperation between regions, the revitalization of regional economy, and the strengthening of regional competitiveness in consideration of regional characteristics etc. Additionally, the balanced national development strategy used by the Moon Jae-in government (2017–2022) was the equalization of development opportunities between regions and the strengthening of regional independent development capabilities. The relocation of public institutions in Korea started in 2005, when the Public Institutions Relocation Plan was announced; now, 153 public institutions have been relocated to 150 local innovation cities [3].
However, despite the efforts of the Korean government, the problem of overcrowding in the metropolitan area has not been resolved. There is a lack of cooperation between the relocated public institutions and local governments, and there are complaints by the executives and employees of public institutions about living conditions in the innovative city where the public institutions are located. In addition, as the lack of securing power generation engines in local areas was pointed out as a problem, the need to strengthen supplementary measures was also raised.
The balanced national development policy that has been promoted so far has been pursued in a way that seeks to equalize the level of development among regions. With the goal of suppressing concentration in the metropolitan area and developing regional areas, the central government carried out a proactive and uniform policy. In other words, the main target of policy promotion for balanced national development was the underdeveloped areas or rural areas, and there were many policies to reduce regional disparities in these areas. From this point of view, the paradigm of balanced development policy must shift from strengthening regional competitiveness to sustainable regional development that considers economic, social, and environmental conditions. It also emphasized the need for measures to resolve vertical inequality along with fiscal decentralization [4,5,6].
Shin [7] comparatively analyzed the size of the national subsidy for special accounts supported by the balanced national development policy for regions with special circumstances and regions for growth promotion. Additionally, after identifying the problems in the aspect of balanced national development, he suggested an institutional improvement plan. Kyriacou et al. [8] conducted an empirical study on regional income inequality, fiscal decentralization, and quality of government administration in a panel of 23 countries in the Organization for Economic Cooperation and Development (OECD). The fiscal decentralization process suggested a strategy to reduce regional inequality, along with measures to improve the quality of government administration. Park [9] suggested that the balanced national development policy should be expanded to a social inclusion policy to resolve the problem of regional disparities in quality of life from the perspective of the socially underprivileged, and presented a policy direction to realize it.
Hence, it can be confirmed that the paradigm of the traditional balanced national development policy is changing. The paradigm of balanced development is shifting in a way that can satisfy the basic needs of local members through endogenous development, rather than narrowing the gap between regions.
The importance of quantitative analysis indicators that can accurately judge and diagnose the actual state of the balanced national development policy in the context of a paradigm shift, was further emphasized. A number of research results have been published that can analyze the various current situations caused by the balanced national development policy with a quantitative evaluation method, and various indicators are used in this study [10,11,12]. Song et al. [13] presented a regional development index that evaluates the degree of regional development in order to consider the balanced development aspect in the feasibility analysis of the local financial investment project, and suggested a way to reflect the index in the policy analysis stage.
Previous studies also analyzed indicators related to information and communication facilities, manpower, and knowledge-based activities as causes of regional disparities caused by informatization. In addition, it was pointed out that the evaluation indicator of rural areas for the cause of imbalance in the cultural sector was insufficient. In this respect, the balanced development indicators were developed by the Korea Balanced Development Committee to measure the degree of regional development through an objective and subjective comprehensive diagnosis of the region, and to use it as basic data for balanced development policies to resolve regional disparities. In addition, a method for evaluating the effectiveness of balanced development policies was proposed by using the balanced development indicators to comprehensively diagnose regional conditions, such as the level of development, potential capacity, and the quality of life experienced by residents [14,15].
The Presidential Committee for Balanced National Development of the Korean government announced the background, composition, measurement method, and future plans for the balanced development indicators in the Status of Balanced Development Indicators and Future Plans. Balanced development indicators are indicators for objectively and subjectively measuring and evaluating regional conditions, such as the degree of development, potential capacity, and the quality of life experienced by residents. Therefore, the National Balanced-Development Information System [16] has been established to provide public big data related to balanced development indicators to be used as data to reflect policy demands in local projects of the government and local governments.
Big data is not simply large-scale data, but contains specific information about the activities of individuals and companies. Therefore, it can be usefully used for multidimensional analysis that is difficult with existing statistical data. There is a growing social consensus on the high value of using such big data, and a consensus is also being formed that it can be usefully used in the establishment and implementation of national land planning or balanced national development policies [17,18].
However, quantitative analysis studies on the effects of policies implemented or currently implemented by the Korean government were insufficient. In this regard, the Korea Balanced Development Committee developed the balanced development index for the purpose of measuring the degree of regional development through an objective and subjective diagnosis of the region, and using it as a basic data for a balanced development policy for resolving regional disparities. In other words, through public big data, it is possible to make a comprehensive diagnosis on regional conditions, such as the degree of development, potential capacity, and the lives of residents, and to analyze the effects of balanced development policies.
Therefore, in this study, balanced development indicators based on public big data were extracted and quantitative evaluation was performed on the balanced national development policies promoted by the Korean government. Based on this quantitative analysis, the purpose of this study was to numerically evaluate the policies promoted by the Korean government and to suggest improvement plans (Figure 1).
2. Public Big Data
Unlike existing statistical data, big data exists in the form of raw data, so it must be processed and used in various forms, as needed. In addition, big data has dynamic characteristics, but for practical reasons, in many cases, public institutions aggregate and utilize administrative district units. This can be said to be the use of only a part of the value and advantages of big data, and in order to fully utilize the advantages of big data, it is necessary to use it at a micro level. With the growth of the big data field, various types of big data have been built for several years, and analysis studies of social and economic phenomena using them are also rapidly increasing. Big data can not only provide specific and practical information that cannot be provided by existing statistical data, but it can also be processed into various time and space units, so that it can be usefully used for policy analysis and evaluation in administrative district units. Therefore, it can be usefully used for multidimensional analysis, which is difficult with existing statistical data, and can be usefully used for the establishment and implementation of balanced national development policies [17,18]
There are a huge number of objects connected to the Internet at a tremendous speed around the world, and the various big data generated from them are opening up a rich digital world. The applications of various information and communication technologies, including the Internet of Things (IoT), have increased tremendously, and people are using all kinds of IoT devices in their daily lives, generating huge amounts of big data [17]. Advanced information and communication technologies are transforming common things into ubiquitous and pervasive computing, embedded devices, communication technologies, sensors, and Internet protocols to change people’s lives [19].
The IoT is regarded as a huge prospect for the Internet universe, resulting in interconnected and high-level two-way intelligent mixed media administrations. In these interactive systems, a huge amount of information is generated as big data [20].
Big data can be usefully used for multidimensional analysis and implication, which are difficult with existing statistical data. However, unlike statistical data systematically constructed in the public sector, most big data has limited accessibility, availability, and usability for various reasons, and disclosure is often restricted due to personal information. Therefore, the use of big data to develop a comprehensive index system covering various sectors is still limited. Nevertheless, it is absolutely necessary to gradually create a new measure by using the available big data. The World Economic Forum recently predicted that vast amounts of data are being generated due to the convergence of the digital world and the physical world, and such big data will play an important role in solving various urban problems. In addition, innovative public big data use cases in cities around the world were summarized and presented [21].
Boston is disclosing the government’s performance and progress in real time online by scoring whether targets are being achieved in 23 administrative services, such as emergency call answering, garbage collection, and road maintenance in the city [22].
Melbourne and Dublin are releasing public data such as land use, pedestrian movement, and urban planning. In particular, Melbourne discloses data collected over the years on land use and pedestrian movement, and Dublin has developed a website that discloses 234 big data, including urban planning and land use [23,24].
Amsterdam is disclosing information classified into 12 themes (management, population, culture and recreation, sustainability and environment, economy and tourism, education and science, public order and safety, space and topography, traffic, work and social security, living, care and welfare) through the Data and Information Portal. Additionally, it has a special Interactive Maps Portal, which shows a variety of data displayed under its spatial location in GIS web viewers [25].
New York is implementing various policies such as city data collection, data open law enactment and portal establishment, information communication strategic plan establishment, and governance system, in order to induce urban innovation using big data [26].
Barcelona is considered as one of the best examples of realizing a smart city by using big data and cutting-edge technology. Building an open IoT platform system that deploys IoT sensors throughout the city and manages them, is improving city services such as city lighting and parking. Additionally, the construction of Open Data BCN and Citizen Participation Platform (DECODE) is expanding citizen participation in the use of big data [27]. Singapore is concentrating on building smart cities led by the government as an exemplary case of using big data to promote urban innovation. In particular, since 2014, it has set a smart country as its vision and has been creating new values for cities based on ICT and big data [28].
The Korean government is providing public big data related to balanced development indicators through the National Balanced-Development Information System (NABIS). The balanced development index was developed for the purpose of measuring the degree of regional development through objective and subjective surveys and using it as basic data for balanced development policies. The effect of the balanced development policy on the degree of development, potential capacity, and the lives of residents of the region can be identified through indicators.
3. National Balanced Development Policy and Balanced Development Indicators
3.1. National Balanced Development Policy
The Korean government enacted the Special Act on Balanced National Development in 2004 to realize advancement through localization. The enactment of the Special Act on Balanced National Development has a very important meaning, in that it laid the institutional foundation for win-win development between the provinces and the metropolitan area as the provinces, which had been on the path of decline for the past several years, turned to an upward phase. Although various policy experiments were attempted to resolve the problems of concentration in the metropolitan area and regional imbalances, the concentration in the metropolitan area continued. It is because they knew that the huge market force of the metropolitan area causes a synergistic effect of aggregation, but they did not establish a decentralized macroscopic mechanism to fundamentally block this. Therefore, the Special Act on Balanced National Development promoted four major policies [1,2,29].
First, based on the regional innovative development plan established by local governments, a five-year balanced national development plan that harmonized with the central government’s sectoral plans was established and confirmed. In order to enhance regional innovation capacity and promote specialized development, the central government supported regional innovation development plans based on creativity and participation in autonomously establishing regional planning capabilities and the relevance of plan contents. Local governments ensured the autonomy and rationality of the plan by reaching an agreement through deliberation by the regional innovation council. Second, the region was defined as a concept encompassing both the metropolitan area and the non-metropolitan area to promote regional innovation and balanced regional development. The establishment of an innovation system to strengthen self-reliance capabilities through regional industry-academic-research cooperation and the formation of industrial clusters, fostering of regional strategic industries, fostering local universities, and the development of local human resources was promoted. Third, it changed from a distributed promotion method centered on each central government department to an integrated implementation method, and strengthened the linkage between national balanced development policies. In addition, a dedicated body was established to coordinate inter-ministerial interests to ensure professionalism and systemicity in business promotion. Fourth, for the balanced development project promoted by local governments, the examination and evaluation functions were strengthened from the initial stage to the final completion stage. Additionally, the connectivity and integration of the regional innovative development plan was achieved through transparent and responsible business promotion [1,2].
The Roh Moo-hyun administration (2003–2008) presented a basic framework of establishing a regional innovation system to realize balanced national development.
Based on this, policies were suggested such as: the selection and development of regional strategic industries, the promotion of regional universities, the promotion of regional science and technology, the promotion of local informatization and information communication, the promotion of local cultural tourism, the development of underdeveloped areas and agricultural and fishing villages, the promotion of regional economy activation, local relocation of public institutions, and local relocation of corporations and universities, etc. [30].
The Lee Myung-bak administration (2008–2013) proposed policies centered on the 5 + 2 metropolitan area as major policies to achieve regional development: the diversified development of national land, the expansion of regional development capacity, the promotion of regional economic vitalization such as fostering of local industry, the nurturing of local manpower, the promotion of science and technology, fostering regional development bases, the expansion of transportation and distribution networks, the nurturing of local cultural tourism, regional development to promote growth, and public institutions regional relocation of businesses and universities, etc.
The Park Geun-hye administration (2013–2017) promoted major policies for regional development, centered on local living areas, including: expanding the living base of residents; strengthening local development capabilities; fostering local industries; creating jobs; improving local educational conditions; nurturing talent and promoting science and technology; fostering regional development bases and expanding transportation and logistics networks; fostering local cultural tourism and environmental preservation; regional welfare and health care expansion; growth promotion area development; industrial crisis response special area designation; public institution relocation; and business and university relocation, etc.
The Moon Jae-in administration (2017–2022) proposed measures to realize balanced national development, such as: the establishment of a regional innovation system; the expansion of the living base of residents and strengthening of regional development capabilities; the promotion of regional economic vitalization such as nurturing local industries and job creation; the improvement of local educational conditions and nurturing of talent; the promotion of regional science and technology; the nurturing of bases for balanced national development; the expansion of transportation and logistics networks; the fostering of local cultural tourism and environmental preservation; the expansion of local welfare and health care; the development of growth promotion areas; designation, support, and the cancellation of special areas for responding to industrial crisis; the relocation of public institutions and the revitalization of innovative cities; the designation and fostering of national innovative convergence complexes; the relocation of companies and universities to regions; the signing of regional development investment agreements; the establishment; development and management of regional statistical bases; development and management; international exchange; and cooperation for balanced national development.
Hence, every five years, since the enactment of the special act on balanced national development in 2004, the structure and content of the special law have undergone many changes, reflecting the government’s philosophy and direction, the recognition and response direction to problems with regional differences, changes in social conditions, and policy demands. In particular, among various government policies, for regional innovation and balanced development, the relocation of public institutions to local areas was transferred by creating 10 innovative cities in: Busan, Daegu, Ulsan, Gyeongsangnam-do, Jeju Island, Gwangju/Jeollanam-do, Gangwon-do, Chungcheongbuk-do, Jeollabuk-do, and Gyeongsangbuk-do [1].
After establishing a plan in 2005, the relocation of public institutions started in 2012 and was completed in 2019. In 2005, out of 346 institutions in the metropolitan area at the time, 176 institutions were selected for relocation. Through the consolidation of these institutions, 153 institutions were individually relocated to the innovation city or other cities. However, despite the government’s efforts, the relocated public institutions and local governments have not been able to secure long-term growth engines by cooperating with each other. The lack of public transportation infrastructure, the lack of convenience facilities such as hospitals and banks, the lack of commercial and cultural facilities, and the educational environment were found to be highly dissatisfied by executives and employees of public institutions. In addition, according to the mandatory recruitment of local talents, public institutions relocating to local areas are required to hire local talent at a certain rate or more, but there was a problem due to a shortage of talented people. In addition, the effect of distributing the population to the provinces was also weak as the executives and employees of the relocated institution move alone to work, without their families moving to the provinces.
A representative example of the policies of European countries for balanced national development can be found in the French and British public institution relocation policies. In the 1960s and the 1970s, the cases of public institution relocation in France and the United Kingdom became an exemplary case, and since then, it has been accepted as a policy tool for balanced national development in many European countries. The fact that many European countries were able to promote the relocation of public institutions to the provinces does not impair the efficiency of public service provision, even if public institutions are not located in the metropolitan area, by using advanced information and communication technologies [31].
Another major factor is that in terms of cost reduction, moving to a province, where operating costs are relatively low, is much more effective in terms of opportunity cost at the national level. For the purpose of balanced regional development, public institutions, such as administrative institutions and public corporations, which were newly established along with the relocation of 30,000 people to local areas, were required to be located in the local areas [32,33].
In the late 1960s, the French government promoted a policy of intensively developing regional centers as growth hubs to prevent population concentration in Paris. In the 1990s, strategies were established by linking the development of strategically designated regional metropoles (Metropoles d’equilibres) and major regional central cities in each region with the relocation of public institutions [33].
In other words, rather than relocating all divisions within the same institution at once, it was possible to exert a synergistic effect with the functions of other institutions through the move. Functions within the same institution were separated and distributed to various regions according to regional characteristics. In particular, the technopole, which was created for the strengthening of local science and technology capabilities and industrial development in the 1970s, was linked with the relocation of public institutions to local areas. Therefore, public R&D institutions relocating from the metropolitan area were attracted to Technopol [34,35].
According to the French government’s strategy, the function that creates the greatest ripple effect and synergy effect on the local economy as a result of the relocation of public institutions to the provinces was evaluated as education and research functions. The flow of population migration to Paris in search of educational opportunities was alleviated, and the competitiveness of local enterprises improved, thereby establishing a regional cluster and regional innovation system. In other words, the relocation of education and research institutes to the provinces had the effect of improving the overall R&D level of the relocated area [36].
In 2003, the British government announced the Principles for Local Relocation of Public Institutions, which systematically stipulated the local relocation policy for public institutions, followed by Guidance on Location Choice: Choosing Locations for Government Business, in February 2006 [37]. This guideline provides basic local relocation guidelines for all government ministries and public institutions located in the metropolitan area, and is very comprehensive and compulsory. The guidelines present the basic contents to be included in measuring the ripple effect of these three aspects of the local economy.
In 2020, the UK government announced plans to relocate some 22,000 public sector jobs in London to non-metropolitan areas within the next 10 years. The will to promote related policies was further strengthened through the Prime Minister’s address to the public in July 2021 [38].
In the case of France and the United Kingdom, for the success of the local relocation policy of public institutions, a key function with a large decision-making authority must be transferred. In addition, it is important to transfer the core functions together with a group of high-level decision-makers. In addition, a strategy to pursue economies of scale through aggregation of similar public institutions is required, and public institutions relocating to non-metropolitan areas need to secure functional connectivity with existing downtown areas to reduce costs. Additionally, as the most important thing for the success of the local relocation policy of public institutions, along with the consistent implementation of the policy, it is necessary to have a legal system to strengthen the binding force and execution power of the local relocation policy of public institutions. As a result, the proportion of the population in the Seoul metropolitan area increased from 20% in the 1960s to more than 50% today. However, France maintains the proportion of the population in Paris and surrounding areas below 20%, and the UK maintains the proportion of population in London at 13%. Therefore, it is necessary to check Korea’s balanced national development promotion policy and take innovative improvement measures.
3.2. Balanced Development Indicator
In order to promote balanced national development, it is necessary to identify the level of imbalance between regions and the causes of imbalanced development, and various countermeasures must be prepared and managed continuously. Various indicators have been developed by several researchers to evaluate the level of disparity between these regions. The Balanced Development Indicator was developed by the Presidential Committee for Balanced National Development to measure the degree of regional development through an objective and subjective diagnosis of the region and to use it as basic data for balanced development policies to resolve regional disparities. Through the indicators, it is possible to make a comprehensive diagnosis on the regional conditions such as the degree of development, potential capacity, and the lives of residents, and to understand the effect of balanced development policies. The Presidential Committee for Balanced National Development announced the background, composition, measurement method, and future plans for the balanced development indicators in the Status of Balanced Development Indicators and Future Plans. In addition, when a certain area among the balanced development indexes is weak, it was used as data to reflect the strengthening measures in the regional projects of the government and local governments. To this end, the Korean government is providing public big data related to balanced development indicators through the National Balanced-Development Information System (NABIS).
Balanced development indicators are derived using the indicators of economy (average financial independence over 3 years) and population (rate of population increase and decrease over 40 years), and two key indicators (population and economy) are used to calculate balanced development indicators. Z-score was used for standardization, and the standard score had a mean of 0 and a standard deviation of 1.
Here, assuming that the weights of the two variables are the same, α = 0.5, and collectively add +5 to solve the problem of negative indicators. Balanced development indicators were divided into core indicators and sector indicators, and sector indicators were divided into objective indicators and subjective indicators. The core indicator consists of two indicators related to population and economy (Table 1). Core and sector indicators are calculated using administrative statistical data such as the National Statistical Office and local government integrated finance, and the indicators were calculated using public big data published in 2020. Objective indicators consist of 41 indicators in eight categories to objectively measure and evaluate local living conditions. The eight sectors include housing, transportation, industry/jobs, education, culture/leisure, safety, environment, and health and welfare (Table 2). Objective indicators collect and analyze various administrative statistical data to understand the overall status of 17 metropolitan cities/provinces and 226 basic local governments. The subjective indicators were composed of 28 indicators in 10 categories to understand the subjective quality of life satisfaction experienced by local residents (Table 3). The 10 main subjective indicators are composed of: total, housing, transportation, industry/jobs, education, culture/leisure, safety, environment, health/welfare, and citizen participation/community.
4. Balanced Development Indicator Analysis
Among the balanced development indicators, the core indicators consist of population (average population growth rate over 40 years) and economy (average financial independence for the past three years). Population indicators were calculated using statistical data (1975–2015) published in 2020 by the National Statistical Office in an attempt to understand the increase and decrease of the local population from a long-term perspective. As for economic indicators, the financial independence for 3 years (2016–2018) was selected as an indicator, and there are budget standards and settlement standards for fiscal independence. It was evaluated as a more accurate figure to use the settlement criteria calculated after the actual budget was executed. The public big data sources of statistical data used in the analysis are: the National Statistical Office [39]; the National Geographic Information Center [40]; the Ministry of Public Administration and Security [41]; the Korea Educational Development Institute [42]; the Public Data Portal of the Ministry of Public Administration and Security [43]; and the National Fine Dust Information Center of the Ministry of Environment [44].
The core and sector indicators were analyzed using public big data (published in 2020) published by the National Balanced-Development Information System. As for the sectoral indicators, the objective and subjective indicators for each sector were used to figure out how well the necessary conditions for national happiness are in place. Objective indicators consist of 41 indicators in eight categories to objectively measure and evaluate the living conditions of the region. For objective indicators, various administrative statistical data were collected and analyzed to grasp the overall status of 17 metropolitan cities and provinces and 226 basic local governments. The subjective indicators were composed of 28 indicators in 10 categories, to understand the subjective quality of life satisfaction experienced by local residents. The subjective indicators were collected through a telephone survey related to satisfaction of local residents of the local government, and about 22,100 samples of men and women aged 20 and over were interviewed on the telephone. The number of samples was allocated by region according to the size of the population, and the sampling error was 95% and the confidence level was ±0.7%p. In the case of research through population-proportional allocation, as the number of regional samples was concentrated in regions with large populations such as metropolitan cities and large cities, the number of samples in metropolitan cities was reduced and more samples were differentially allocated to regions by city and county size.
In all, 1000 were allocated to Seoul, and other metropolitan cities were differentiated by population. A total of 160 cities, with a population of 500,000 or more were allocated, and 140 cities with a population of 200,000 to 500,000 were allocated. In addition, 120 cities with a population of less than 200,000 and 100 counties were allocated. Additionally, the spatial scope for the analysis of balanced development indicators was targeted for 17 administrative districts in Korea. Korea’s Nationwide (NW) administrative district consists of one special city, six metropolitan cities, eight provinces, one special self-governing province, and one special autonomous city. A total of 17 administrative districts are classified as regional governments as follows: Seoul (SU), Busan (BS), Daegu (DG), Incheon (IC), Gwangju (GJ), Daejeon (DJ), Ulsan (US), Sejong-si (SJ), Gyeonggi-do (GG), Gangwon-do (GW), Chungcheongbuk-do (CB), Chungcheongnam-do (CN), Jeollabuk-do (JB), Jeollanam-do (JN), Gyeongsangbuk-do (GB), Gyeongsangnam-do (GN), Jeju Island (JJ) (Figure 2).
4.1. Core Indicator Analysis
Balanced development indicators are composed of core indicators and sector indicators. Among them, the core indicators are composed of two indicators related to population and economy (average population growth rate for 40 years, average financial independence for the last 3 years). The core indicators are calculated using public big data for public administration such as the National Statistical Office and local government integrated finance. The population was calculated as 40 years (1975~2015) considering the possibility of using statistical data from the National Statistical Office in order to understand the increase and decrease of the local population from a long-term perspective. For the economy, the financial independence of the last three years (2016–2018) was selected as an indicator. There are budget standards and settlement standards for fiscal independence. Using the settlement standards calculated after the actual budget is executed was evaluated as a more accurate figure. In terms of population indicators, the rate of population change over 40 years (1975 to 2015) was highest in Gyeonggi-do (3.6%) and lowest in Jeollanam-do (−1.5%). Looking at the degree of financial independence for the last three years (2016–2018) of economic indicators, Seoul (86.3%) had the best financial capacity, and Jeollabuk-do (30.3%) had the worst. Considering the national average (55.1%), metropolitan cities including Seoul were good, while regional areas were poor, resulting in an imbalance in terms of financial independence (Table 4).
4.2. Objective Indicator Analysis
Among the objective indicators, dwelling indicators are sub-indicators showing the quality of the residential environment, such as the ratio of aging houses, the ratio of vacant houses, the ratio of households that do not meet the minimum housing standard, the water supply rate, sewage system rate. The water supply and sewerage supply rates in all regions developed in a balanced way with the national average (97.0%, 92.9%). The proportion of households not meeting the minimum housing standard was relatively high in Seoul (8.8%), and the lowest was in Sejong-si and Ulsan (2.9%). As for the vacant house rate, Seoul (3.2%) and Jeollanam-do (15.3%) showed a very high rate of vacancy in the provincial area. The aging housing ratio was found to be poor in most areas except for Sejong-si (6.7%), which was newly built following the recent relocation of public institutions (Table 5).
The traffic indicator consists of road pavement rate (%), highway IC accessibility (km), high-speed/high-speed rail access (km), and population ratio (%) within the parking lot service area (0.75 km). The road pavement rate was the national average of 93.5%, which was uniform and high in all cities. However, in terms of accessibility to highway ICs and high-speed/high-speed rail, Seoul was the best at 3.5 km and 7.4 km. The population ratio within the parking lot service area was 28.5% in Sejong-si, which is judged to be due to the relocation of public institutions and the newly created area (Table 6).
The industry and job indicator consists of the rate of change in the number of businesses in the last 3 years (2016–2018) (%), change in the number of employees in the last three years (2016–2018) (%), 3 annual average of intensity of knowledge-based industry (2016–2018) (%), percentage of regular workers (%), number of patents (cases), R&D expenses per researcher (USD 1.0/R&D personnel 1). Here, the rate of change in the number of businesses in the last three years in Seoul was the lowest at 0.2%, and the national average was 1.9%, so there was an effect of diversifying businesses across the country. The rate of change in the number of employees in the last three years was the highest in Sejong-si at 12.9%, while the national average was 2.3%. The percentage of regular workers was also highest in Sejong-si at 71.7%. Therefore, it can be seen that business dispersion and local job creation were achieved by the relocation of public institutions and the balanced national development policy. However, the three annual average of intensity of knowledge-based industry, the number of patents (cases), and R&D expenses per researcher, showed the highest in Seoul (Table 7).
Educational indicators consist of the number of childcare facilities per 1000 infants (0–5 years old), the number of schools per 1000 school-age population, the ratio of the infants and toddlers within daycare service area, and percentage of school-age population within the service area of elementary schools. Among them, the national average of the number of childcare facilities per 1000 infants, the ratio of the infants and toddlers within daycare service area, percentage of school-age population within the service area of elementary schools was 16.4 opens/1000 people, 70.5%, and 43.6%, respectively, showing a relatively similar value in all regions. However, the number of schools per 1000 school-age population was 1.4 opens/1000 people in Seoul and 4.2 opens/1000 people in Jeollanam-do, with large regional variations (Table 8).
Cultural and leisure indicators include the number of cultural infrastructures per 100,000 people, the number of seats per 1000 people, the number of artistic activities per 100,000 people, the ratio of the population in the performance and cultural facilities service zone, the population ratio in the library service zone, and the population ratio in the public sports facility service zone. In the number of cultural infrastructure per 100,000 population, Jeju Island (20.2) and Gangwon-do (13.9) were higher, and the number of seats per 1000 population was also higher in Jeju Island (27.4) and Gangwon (19.0). In addition, the number of artistic activities per 100,000 population is relatively high in Seoul (144.3), Jeju Island (130.1), and Gangwon-do (116.7), so cultural and leisure indicators are not concentrated in the metropolitan area or metropolitan city, and the characteristics of local culture are well reflected and developed. In addition, the number of artistic activities per 100,000 population is relatively high in Seoul (144.3), Jeju Island (130.1), and Gangwon-do (116.7), so cultural and leisure indicators are not concentrated in the metropolitan area or metropolitan city, and the characteristics of local culture are well reflected and developed. In addition, the national average for proportion of population within the service area of performance and cultural facilities was 87.3%, showing balanced development (Table 9).
Safety indicator consists of the number of residents in charge per rescue and paramedic, number of residents in charge per 911 safety center, access to the fire station, access to the police station. The number of residents in charge per rescue and paramedic and the number of residents in charge per 911 safety center were highest in Seoul (4808, 82,450) and Gyeonggi-do (5701, 72,745), due to the concentration of population in the metropolitan area and metropolitan areas. However, in terms of access to the fire station and access to the police station, Seoul was the best at 2.0 km and 1.5 km, respectively (Table 10).
Environmental indicators have sub-indices of urban park area per thousand people, green area ratio, air pollutant emission per square kilometer, and population ratio within the living park service area. Daegu (9798 m2/1000 people) had the lowest urban park area per 1000 people, and Seoul (38.8%) had the lowest green space rate. On the other hand, the air pollutant emission per square kilometer was the highest in Seoul (404,331 tons/km2·year), and the proportion of the population in the living park service area was the highest in Seoul (76.8%) (Table 11).
Health and welfare indicators include the ratio of single-person households over 65 years old, the ratio of recipients of National Basic Livelihood Security, the share of social welfare and health spending, the number of social welfare facilities per 100,000 people, the number of hospital beds per 1000 people, the ratio of elderly population in the service area of elderly leisure welfare facilities, population ratio in emergency medical facility service areas, and the population ratio in hospital service areas. Jeollanam-do (13.4%) had the highest ratio of single-person households over 65 years old, and Jeollabuk-do (5.5%) had the highest ratio of recipients of National Basic Livelihood Security. Gangwon-do (28.2) had the highest number of social welfare facilities per 100,000 people, Gwangju (27.9) had the highest number of hospital beds per 1000 people, and Seoul was relatively lacking. In addition, the ratio of elderly population in the service area of elderly leisure welfare facilities, the population ratio in emergency medical facility service areas, and the population ratio in hospital service areas were higher in Seoul and metropolitan cities than in rural areas (Table 12).
4.3. Subjective Indicator Analysis
Subjective indicators consisted of 28 indicators in 10 categories to understand subjective satisfaction with the quality of life. Subjective indicators were collected through telephone surveys related to satisfaction among residents. About 22,100 samples of men and women over the age of 20 were interviewed on the telephone. The number of samples was allocated by region according to the size of the population, and the sampling error was 95% and the confidence level was ±0.7%p. In the case of a survey through population-proportional allocation, as the number of regional samples was concentrated in areas with a large population, more samples were allocated to local areas so that the opinions of local residents were well reflected. Among the subjective indicators, the satisfaction of the dwelling indicators (state of residence, basic living conditions) was lowest in Jeju Island and highest in Gwangju. In terms of transportation indicators (the use of public transportation, the use of parking lot), Sejong-si had the lowest, and Gwangju and Gyeongsangnam-do showed the highest. The industrial and job indicators (job opportunities, income creation) were highest in Seoul, and educational indicators (the quality of primary and secondary education, adult liberal arts and hobbies, sufficient childcare facilities, out-of-school education) were relatively high in Gwangju and Busan. Cultural and leisure indicators (convenience of access to cultural facilities, convenience of access to sports facilities, cultural facilities and programs, sports facilities and programs) were found to be higher in Daegu, Gwangju, and Busan, than in other regions.
Safety indicators (the prevention of natural disasters and disasters, public security (safety at night), 911 dispatch) were high in Seoul and Gwangju, while environmental indicators (noise, odor, waste treatment, natural environment conservation, park green spaces, air quality (fine dust)) were high in Busan, Gwangju, and Gyeongsangnam-do. Gwangju had the highest health/welfare indicators (hospital/clinic/pharmacy use, medical service level, social welfare service), and Gwangju and Ulsan had the highest civic participation/community indicators (people around you who can ask for help, resident participation). However, in Sejong-si, only the environmental indicators were higher than the national average, and all other sectors were below the national average. Among the subjective indicators, the overall indicators include personal life satisfaction and local life satisfaction. Compared to other regions, Sejong-si showed the lowest at 3.41 (national average: 3.61) and 3.18 (national average: 3.54). Sejong-si is a newly constructed administrative complex city by relocating government and public institutions for balanced national development, and a more detailed analysis is needed on the cause of the lowest level of personal life and local life satisfaction (Table 13).
4.4. Spatial Relevance of Balanced Development Indicators
The Korean government enacted the Special Act on Balanced National Development in 2004 and has been implementing policies reflecting the government direction and socio-economic changes for about 20 years. In the course of this process, various policies have been implemented to resolve the problem of concentration in the metropolitan area and regional imbalances, but concentration in the metropolitan area and imbalance between regions remains a major problem. In this study, the current status of regional imbalances that have not been resolved despite the efforts of the Korean government for the past 20 years is to be accurately diagnosed through quantitative evaluation by calculating balanced development indicators. It is judged that these quantitative evaluation results will be usefully used in setting the national balanced development policy direction and establishing improvement measures. In the previous analysis process, the core and objective indicators among the balanced development indicators were analyzed. The core and objective indicators are the results of analyzing public big data on various statistical data released by the government, and the subjective indicators were surveyed through telephone interviews with residents. Therefore, to analyze the spatial relevance, core indicators (17 metropolitan areas, 226 basic local governments), which are important indicators among the balanced development indicators, were selected. Here, the average annual population growth rate (1975–2015) and 3-year financial independence (2016–2018) indicators were selected, and GIS spatial analysis techniques Moran’s I and LISA (Local Indicator of Spatial Association) were analyzed.
The reason was to analyze the spatial distribution pattern of balanced development indicators for 17 administrative districts (226 basic local governments) to understand spatial relevance and balanced development patterns between local governments. In addition, the subject indicator used a sample of about 22,100 as an indicator generated through a telephone survey, and was published as a standardized Z-score. However, the subjective indicators were published as public big data using only 17 metropolitan administrative districts as the survey units, and analysis was impossible because the number of spatial analysis units was too small for Moran’s I and LISA analysis. Therefore, the simple spatial distribution of the Z-score was analyzed for the subjective indicator.
The results of Moran’s I [45] and LISA [46] analysis on the annual average population growth rate (1975–2015) and 3-year fiscal independence (2016–2018) indicators in the core indicators, are shown in Figure 3 and Figure 4.
Global Moran’s I is a summary of the overall clustering tendency of similar values within the study area as one indicator, and local Moran’s I can analyze the spatially clustering pattern of similar values around a specific area. Therefore, the global Moran’s I cannot identify the local structure of spatial relevance within the region because it cannot distinguish between large values (hot spots) and small values (cold spots) clustering. Accordingly, LISA is analyzed to measure spatial association at the local level [47].
Moran’s I values representing the global cluster status of the annual average population growth rate indicator and the 3-year fiscal independence indicator were 0.710 and 0.693, respectively. Therefore, the population growth rate indicator showed a stronger overall spatial clustering than the fiscal independence indicator. In other words, it can be seen that the increase and decrease of the population is strongly centered on a specific region, indicating that the government policy for balanced development is not evenly distributing the population throughout the country. As a result of local autocorrelation analysis through LISA analysis, clusters of regions with high population growth (HH) occurred in some areas of Gyeonggi-do, Incheon, and Seoul, showing strong population concentration in the metropolitan area. On the other hand, cluster areas (LL) where population decline occurs are occurring in some areas, such as Gangwon-do, Chungcheongbuk-do, Gyeongsangbuk-do, Jeollabuk-do, Jeollanam-do, and Gyeongsangnam-do. Therefore, the concentration of the population in the metropolitan area and the decrease in the population in the provincial area were clearly shown. In the financial independence indicator for 3 years, high areas (HH) existed in the metropolitan area and low areas (LL) existed in the provincial areas, just like the population growth rate indicator. Financial independence was also experiencing difficulties in local areas.
As a result of analyzing personal life satisfaction and local life satisfaction through subjective indicators (Figure 5 and Figure 6), in the case of personal life satisfaction, Gyeongsangnam-do, Ulsan, and Gwangju were high, and Gyeongsangbuk-do, Sejong-si, and Jeju Island were low. The metropolitan area (Seoul, Gyeonggi-do, Incheon) was also relatively low. In other words, personal life satisfaction was not limited to a specific area, regardless of the metropolitan area or regional area. Local life satisfaction showed a similar pattern. Gyeongsangnam-do, Busan, and Gwangju showed relatively high satisfaction with local life, and Gyeongsangbuk-do, Chungcheongnam-do, and Sejong-si were low. In other words, while population growth, financial independence, and objective indicators are high in the metropolitan area or metropolitan city, the survey results on the life satisfaction of citizens show that the satisfaction is high in the provinces as well.
Here, Sejong-si had the lowest personal life satisfaction (3.41, national average (3.61)) and local life satisfaction (3.18, national average (3.54)). Within objective indicators: the ratio of aging houses (6.7%); highway IC accessibility (10.6 km); high-speed/high-speed rail access (17.7 km); the number of childcare facilities per 1000 infants (13.4); the number of artistic activities per 100,000 population (46.8); the ratio of single-person households over 65 years old (3.8%); the number of social welfare facilities per 100,000 people; and population ratio in the emergency medical facility service area (5.2%), were lower than the national average. As a new city construction, Sejong-si had high population growth and financial independence in core indicators, and the increase in businesses and number of employees in objective indicators were higher than the national average, but showed poor results in the evaluation of the overall balanced development indicators.
Sejong-si is a Multifunctional Administrative City, newly built in 2012 by the Korean government by relocating 22 central administrative agencies and 21 affiliated agencies out of 52 central administrative agencies for balanced national development. Initially, the entire city of Sejong-si was planned to be newly built, but the plan has been changed and the indigenous people are currently living in some areas. Therefore, hierarchical, age, cultural, and economic conflicts are emerging between the old downtown area where indigenous people live and the newly developed new downtown area. These conflicts lead to division of the community and become an obstacle to integration. For the balanced development of Sejong-si, it is necessary to solve the problem of urban regeneration in declining areas, solving the housing problem for young people, and the problem of the marginalized elderly due to the influx of young people. In addition, the rapid growth of Sejong-si due to the construction of a new city is also causing a population concentration problem that sucks the population of the neighboring administrative districts, Chungcheongnam-do, Chungcheongbuk-do, and Daejeon.
Hence, the problems in the case of Sejong-si were described, but similar problems occurred because the relocation of public institutions in other regions was also moved adjacent to the existing city. Therefore, the balanced development indicators extracted in this study show the quantitative status of balanced development, so it is judged that they will be used as key data for discovering various policies and finding solutions.
4.5. Implications and Improvement Plan
The results of the balanced development indicators are divided into core indicators, objective indicators, and subjective indicators. First, as for the population in the key indicator, Gyeonggi-do, which belongs to the metropolitan area, showed the highest rate of population increase/decrease at 3.6% over the past 40 years (1975~2015). Jeollanam-do showed the lowest rate of −1.5% among the local areas. In other words, the population growth rate was high in the metropolitan area or metropolitan city, and relatively low in the local area, so the population was concentrated in the metropolitan area or metropolitan city. The economic indicator shows the degree of financial independence for the last three years (2016–2018), and Seoul, the metropolitan area, was the highest at 86.3%, and Jeollabuk-do was the lowest at 30.3% among the local area. Considering the national average (55.1%), the metropolitan area and metropolitan areas were good, while the local areas were poor. Among the objective indicators calculated based on the government’s statistical data, the ratio of vacant houses was 3.2% in Seoul, the metropolitan area, while Jeollanam-do in the provincial area was 15.3%. appeared high.
The rate of change in the number of employees in the last three years was the highest at 12.9% for Sejong-si, which was newly constructed due to relocation of public institutions, while the national average was 2.3%. Sejong-si showed the highest percentage of regular workers at 71.7%. Therefore, it can be seen that Sejong-si, a new city newly constructed by relocation of public institutions according to the balanced national development policy, has the effect of dispersing businesses and creating jobs in the provinces. In addition, the ratio of elderly population in the service area of elderly leisure welfare facilities, population ratio in emergency medical facility service area, and hospital service area, the population ratio in hospital service area was higher in the metropolitan area than in the rural area.
Lastly, among the subjective indicators calculated based on the survey, the industrial and job indicators (job opportunities, income creation) were the highest in the metropolitan area, and educational indicators (quality of elementary, middle, and high school education, adult culture and hobbies, sufficient childcare facilities, and out-of-school education) is relatively high in Gwangju and Busan, which are regional metropolitan cities. In the evaluation of individual life satisfaction and local life satisfaction as a subjective indicator (composite indicator), Sejong-si showed the lowest scores of 3.41 (national average: 3.61) and 3.18 (national average: 3.54) compared to other regions. Although Sejong-si is a new city newly constructed by relocating government and public institutions for balanced national development, the satisfaction with individual life and local life was the lowest. These results are the results of analysis for a single year, and continuous monitoring is necessary in the future.
As shown in the balanced development index, it can be seen that, despite the balanced national development policy, economic, cultural, and social factors are still concentrated in the metropolitan area along with population concentration in the metropolitan area. This means that the metropolitan area still has competitiveness as a space, and it can be seen that the provinces do not have space competitiveness. This phenomenon shows that the balanced national development policy does not deviate from the establishment of a physical foundation and political ideology. In addition, a factor that makes balanced regional development difficult is the weakening of human resources in underdeveloped local areas. A society with 14% or more of the population aged 65 and over is defined as an aged society. In rural areas, the aging society is progressing more rapidly. In addition, even in the face of such a population decline and the crisis of an aging society, regional development expanded the space and was operated individually by diversifying investment in the form of small-scale businesses, so the connectivity was insufficient. In the state where population and industry were concentrated in the metropolitan area, development and investment were paralleled in the metropolitan area and non-metropolitan area. The effectiveness of the balanced development policy was weakened as the suction power of the metropolitan area was strengthened [48]. Therefore, it is necessary to secure a compressed-type base city with complex functions in the provinces rather than growth through spatial expansion in consideration of the local conditions in consideration of population reduction.
5. Conclusions
As a result of Korea’s rapid economic growth in the metropolitan area, overcrowding in the metropolitan area widened the gap with the provinces and resulted in unbalanced development of the land. In order to resolve this imbalance, various balanced development policies have been implemented for about 20 years since the Special Act on Balanced National Development was enacted in 2004. However, despite the efforts of the Korean government, the problem of imbalance due to overcrowding in the metropolitan area has not been resolved. Therefore, it was necessary to prepare improvement measures for the regional balance. Therefore, the importance of developing and using quantitative analysis indicators that can accurately analyze and judge the effectiveness of national policies has emerged.
The Korean government regards various administrative information as public big data, builds and discloses the National Balanced-Development Information System (NABIS), and supports the development of various evaluation indicators using it. Balanced development indicators are indicators for objectively and subjectively measuring and evaluating the degree of development, potential capacity, and quality of life experienced by residents. In this regard, this study uses public big data to analyze and evaluate the effects of balanced national development policies that have been promoted so far, and present the effects of balanced development policies and improvement plans.
First, as a result of analyzing the average annual population growth rate and 3-year fiscal independence indicator in the core indicator (population, economy) analysis, the Moran’s I value representing the global cluster status of the average annual population growth rate indicator and the 3-year fiscal independence indicator was 0.710 and 0.693, respectively. Therefore, the population growth rate indicator showed a stronger overall spatial clustering than the fiscal independence indicator. As a result of local autocorrelation analysis through LISA analysis, the concentration of population in the metropolitan area was strong. On the other hand, a significant decrease in the population occurred in provincial areas except for the metropolitan area. In addition, in the 3-year fiscal independence indicator, it was found that the degree of self-reliance in the local area was lower than in the metropolitan area like the population increase/decrease rate indicator. In other words, despite the government’s balanced development policy, there was still a large gap between the metropolitan area and the provinces in population and economy indicators.
Second, among the objective indicators calculated based on government statistical data, the ratio of vacant houses was low in the metropolitan area, and Jeollanam-do showed the highest ratio of vacant houses, in the provincial area. The rate of change in the number of employees in the last 3 years was the highest in Sejong-si, which was newly constructed due to relocation of a public institution. Sejong-si showed the highest percentage of regular workers. Therefore, it can be seen that Sejong-si, a new city newly constructed by relocation of public institutions according to the balanced national development policy, has the effect of dispersing businesses and creating jobs in the provinces. In addition, ratio of elderly population in the service area of elderly leisure welfare facilities, population ratio in emergency medical facility service area, and hospital service area, the population ratio in hospital service area was higher in the metropolitan area than in the rural area. In the objective indicators, most of the indicators were found to be high in the metropolitan area and relatively low in the rural areas.
Third, among the subjective indicators calculated based on the survey, the metropolitan area had the highest industry and job indices, and the education-related indicators were relatively high in the provincial metropolitan cities, Gwangju and Busan. In the evaluation of individual life satisfaction and local life satisfaction as subjective indicators (composite indicators), Sejong-si showed the lowest level compared to other regions. Although Sejong-si is a new city newly constructed by relocating government and public institutions for balanced national development, the satisfaction with individual life and local life was the lowest. These results are the results of analysis for a single year. Therefore, the quantitative and qualitative evaluation of the economic, social, and cultural aspects of a new city recently constructed by the government policy is required, and complementary measures through continuous monitoring must be prepared to develop as a sustainable city.
Finally, despite the balanced development policy, demographic and economic factors are concentrated in the metropolitan area. This shows that the metropolitan area still has spatial competitiveness, and the regional competitiveness is relatively low. The results of this analysis require a multifaceted review of the balanced national development policy. In this aspect, in terms of population, human resources in local areas are weakening and an aging society is being formed more rapidly. In addition, the linkage was insufficient as the development of local areas expanded the space and distributed investment in the form of small businesses and operated individually. In the state where population and industry were concentrated in the metropolitan area, development and investment were paralleled in the metropolitan area and non-metropolitan area. The effectiveness of the balanced development policy was weakened as the suction power of the metropolitan area was strengthened. Therefore, it is necessary to secure a compressed-type base city with complex functions in the provinces rather than growth through spatial expansion in consideration of the local conditions in consideration of population reduction. The transfer of authority from the center to the provinces should be strongly promoted, and autonomous innovation projects should be promoted that efficiently utilize the regional characteristics and potential.
Author Contributions
Conceptualization, S.C.; methodology, Y.Y.; validation, S.C.; formal analysis, Y.Y.; investigation, Y.Y.; data curation, Y.Y.; writing—original draft preparation, Y.Y.; writing—review and editing, S.C.; supervision, S.C.; project administration, S.C.; funding acquisition, S.C.; All authors have read and agreed to the published version of the manuscript.
Funding
This research received no external funding.
Institutional Review Board Statement
Not applicable.
Informed Consent Statement
Not applicable.
Data Availability Statement
Data sharing not applicable.
Acknowledgments
This research was supported by Virginia Tech Libraries Open Access Subvention Fund Program.
Conflicts of Interest
The author declares no conflict of interest.
References
- OECD, Regional Development. Available online: https://www.oecd.org/country/korea/thematic-Focus/Regional-Development-09ee28a8/ (accessed on 2 January 2022).
- Song, W. Changes and Development Direction of the Special Act on Balanced National Development; Korea Institute for Industrial Economics and Trade: Sejong-si, Republic of Korea, 2018; pp. 1–87. (In Korean) [Google Scholar]
- National Assembly Legislative Investigation Office. Available online: https://www.nars.go.kr/report/view.do?cmscode=CM0156&brdSeq=24113 (accessed on 3 January 2022).
- Yang, K.S. A Study on Balanced National Development Policy Considering Regional Sustainability. JKRDA 2018, 4, 27–42. [Google Scholar]
- Digdowiseiso, K.; Murshed, S.M.; Bergh, S.I. How Effective Is Fiscal Decentralization for Inequality Reduction in Developing Countries? Sustainability 2022, 14, 505. [Google Scholar] [CrossRef]
- Martinez-Vazquez, J.; McNab, R.M. Fiscal Decentralization and Economic Growth. World Dev. 2003, 31, 1597–1616. [Google Scholar] [CrossRef] [Green Version]
- Shin, M.J. Analysis of Supporting System for Lagging Regions in Terms of Balanced Development. Knowl. Converg. 2019, 2, 29–38. [Google Scholar]
- Kyriacou, A.P.; Muinelo-Gallo, L.; Roca-Sagalés, O. Regional Inequalities, Fiscal Decentralization and Government Quality. Reg. Stud. 2017, 51, 945–957. [Google Scholar] [CrossRef]
- Park, I.K. The Life of the Socially Underprivileged and Balanced Regional Development: Analyzing the Interregional Disparity in Capabilities (in Korean). Space Environ. 2018, 28, 71–114. [Google Scholar] [CrossRef]
- Lu, S.; Guan, X.; Yu, D.; Deng, Y.; Zhou, L. Multi-Scale Analysis of Regional Inequality Based on Spatial Field Model: A Case Study of China from 2000 to 2012. Int. J. Geo-Inf. 2015, 4, 1982–2003. [Google Scholar] [CrossRef] [Green Version]
- Wang, Y.; Fang, C.; Xiu, C.; Liu, D. A New Approach to Measurement of Regional Inequality in Particular Directions. Chin. Geogr. Sci. 2012, 22, 705–717. [Google Scholar] [CrossRef]
- Li, G.; Fang, C. Analyzing the Multi-Mechanism of Regional Inequality in China. Ann. Reg. Sci. 2014, 52, 155–182. [Google Scholar] [CrossRef]
- Song, J.Y.; Yeo, K.D. An Improvement on the Feasibility Study for Local Investment Projects Considering Balanced Regional Development (in Korean); Korea Research Institute for Local Administration: Wonju-si, Republic of Korea, 2020; pp. 1–241. [Google Scholar]
- Kim, D.; Kim, D.; Byeon, P.; Ahn, J. A Study on the Development and Application of a Big Data-Based Balanced National Land Development Analysis Model (in Korean); Korea Research Institute for Human Settlements: Sejong-si, Republic of Korea, 2019; pp. 1–134. [Google Scholar]
- Kim, S.R. A Study on Setting Weighted Values for the Balanced National Development Index. J. Resid. Environ. Inst. Korea 2022, 18, 295–304. [Google Scholar] [CrossRef]
- NABIS, National Balanced-Development Information System. Available online: https://www.nabis.go.kr (accessed on 1 January 2022).
- Shah, S.; Modi, P.; Shah, H. Big Data Analysis in Urban Planning. Int. J. Eng. Res. 2019, 8, 5. [Google Scholar]
- Ivanov, N.; Gnevanov, M. Big Data: Perspectives of Using in Urban Planning and Management. MATEC Web Conf. 2018, 170, 01107. [Google Scholar] [CrossRef]
- Rathore, M.M.; Ahmad, A.; Paul, A.; Rho, S. Urban Planning and Building Smart Cities Based on the Internet of Things Using Big Data Analytics. Comput. Netw. 2016, 101, 63–80. [Google Scholar] [CrossRef]
- Silva, B.N.; Khan, M.; Seo, J.; Muhammad, D.; Yoon, Y.; Han, J.; Han, K. Exploiting Big Data Analytics for Urban Planning and Smart City Performance Improvement. In Proceedings of the 2018 12th International Conference on Signal Processing and Communication Systems (ICSPCS), Cairns, Australia, 17–19 December 2018; IEEE: Cairns, Australia, 2018; pp. 1–4. [Google Scholar]
- World Economic Forum, Data Driven Cities 20 Stories of Innovation. 2017. Available online: https://www3.weforum.org/docs/Top20_Global_Data_Stories_report_2017.pdf (accessed on 2 February 2022).
- CITYSCORE. Available online: https://www.boston.gov/cityscore (accessed on 5 January 2022).
- City of Melbourne. Available online: https://data.melbourne.vic.gov.au (accessed on 8 January 2022).
- Smart Dublin. Available online: https://smartdublin.Ie/dublinked (accessed on 8 January 2022).
- Gemeente Amsterdam. Available online: https://data.amsterdam.nl (accessed on 2 January 2022).
- NYC OpenData. Available online: https://opendata.cityofnewyork.us (accessed on 4 January 2022).
- OpenData BCN. Available online: https://opendata-ajuntament.barcelona.cat (accessed on 2 January 2022).
- Smart Nation Singapore. Available online: https://www.smartnation.gov.sg/ (accessed on 12 January 2022).
- Han, P. Enactment of the Special Act on Balanced National Development and Coprosperity Development Strategy; National Land: London, UK, 2004; pp. 6–15. [Google Scholar]
- Korea Ministry of Government Legislation. Available online: https://www.moleg.go.kr/ (accessed on 7 January 2022).
- Richardson, R.; Gillespie, A. The Call of the Wild: Call Centers and Economic Development in Rural Areas: CALL CENTERS IN RURAL AREAS. Growth Chang. 2003, 34, 87–108. [Google Scholar] [CrossRef]
- Métropole d’Equilibre et Dynamique Territoriale: Concept, Réalités et Perspectives Dans l’espace UEMOA | European Scientific Journal, ESJ. Available online: https://eujournal.org/index.php/esj/article/view/14248 (accessed on 26 June 2022).
- Fauré, B. L’équilibre du développement du territoire à l’épreuve des métropoles. Civitas Europa 2019, 43, 79–87. [Google Scholar] [CrossRef]
- Comité Pour l’implantation Territoriale Des Emplois Publics. Available online: https://www.senat.fr/questions/base/2002/QSEQ020238267.Html (accessed on 18 January 2022).
- La Politique de Délocalisation des Emplois Publics. Available online: http://www.senat.fr/rap/R02-241/R02-24172.html (accessed on 15 January 2022).
- PIPAME, Relocalisations d’activités Industrielles En France. 2013. Available online: https://www.entreprises.gouv.fr/files/files/directions_services/etudes-et-statistiques/etudes/industrie/2013-12-Relocalisation-Revue-Litterature.pdf (accessed on 21 January 2022).
- Smith, I.R.; Britain, G. Relocation: Transforming Where and How Government Works; HM Treasury: London, UK, 2010; ISBN 978-1-84532-712-5. [Google Scholar]
- The Prime Minister’s Levelling Up Speech. Available online: https://www.gov.uk/government/speeches/the-prime-ministers-levelling-up-speech-15-july-2021 (accessed on 14 January 2022).
- National Statistical Office. Available online: https://kosis.kr/statHtml/statHtml.do?orgId=101&tblId=DT_1JU1512&conn_path=I3 (accessed on 3 February 2022).
- National Geographic Information Institute. Available online: https://www.ngii.go.kr/ (accessed on 3 February 2022).
- The Ministry of Public Administration and Security. Available online: https://lofin.mois.go.kr/portal/main.do (accessed on 1 February 2022).
- Korea Educational Development Institute. Available online: https://kess.kedi.re.kr/ (accessed on 2 February 2022).
- Public Data Portal of the Ministry of Public Administration and Security. Available online: https://www.data.go.kr/data/15048243/fileData.do (accessed on 3 February 2022).
- National Fine Dust Information Center of the Ministry of Environment. Available online: https://www.air.go.kr (accessed on 5 February 2022).
- Moran, P. Notes on Continuous Stochastic Phenomena. Biometrika 1950, 37, 17–23. [Google Scholar] [CrossRef] [PubMed]
- Anselin, L. Local Indicators of Spatial Association: LISA. Geogr. Anal. 1995, 27, 93–115. [Google Scholar] [CrossRef]
- Seo, S.B. A Study on the Spatial Autocorrelation of Land Price Variation and Trading Volume. J. Korea Plan. Assoc. 2014, 49, 21–34. [Google Scholar] [CrossRef]
- Lim, H.B. The Process and Results of Balanced Regional Development Policy of Korea,1972–2012. J. Korean Urban Manag. Assoc. 2013, 26, 315–339. [Google Scholar]
Figure 1.
Study flow chart.

Figure 2.
Seventeen administrative divisions in Korea.

Figure 3.
Moran’s I and LISA of core indicators (population).

Figure 4.
Moran’s I and LISA of core indicators (economy).

Figure 5.
Subjective indicators (personal life satisfaction).

Figure 6.
Subjective indicators (local life satisfaction).


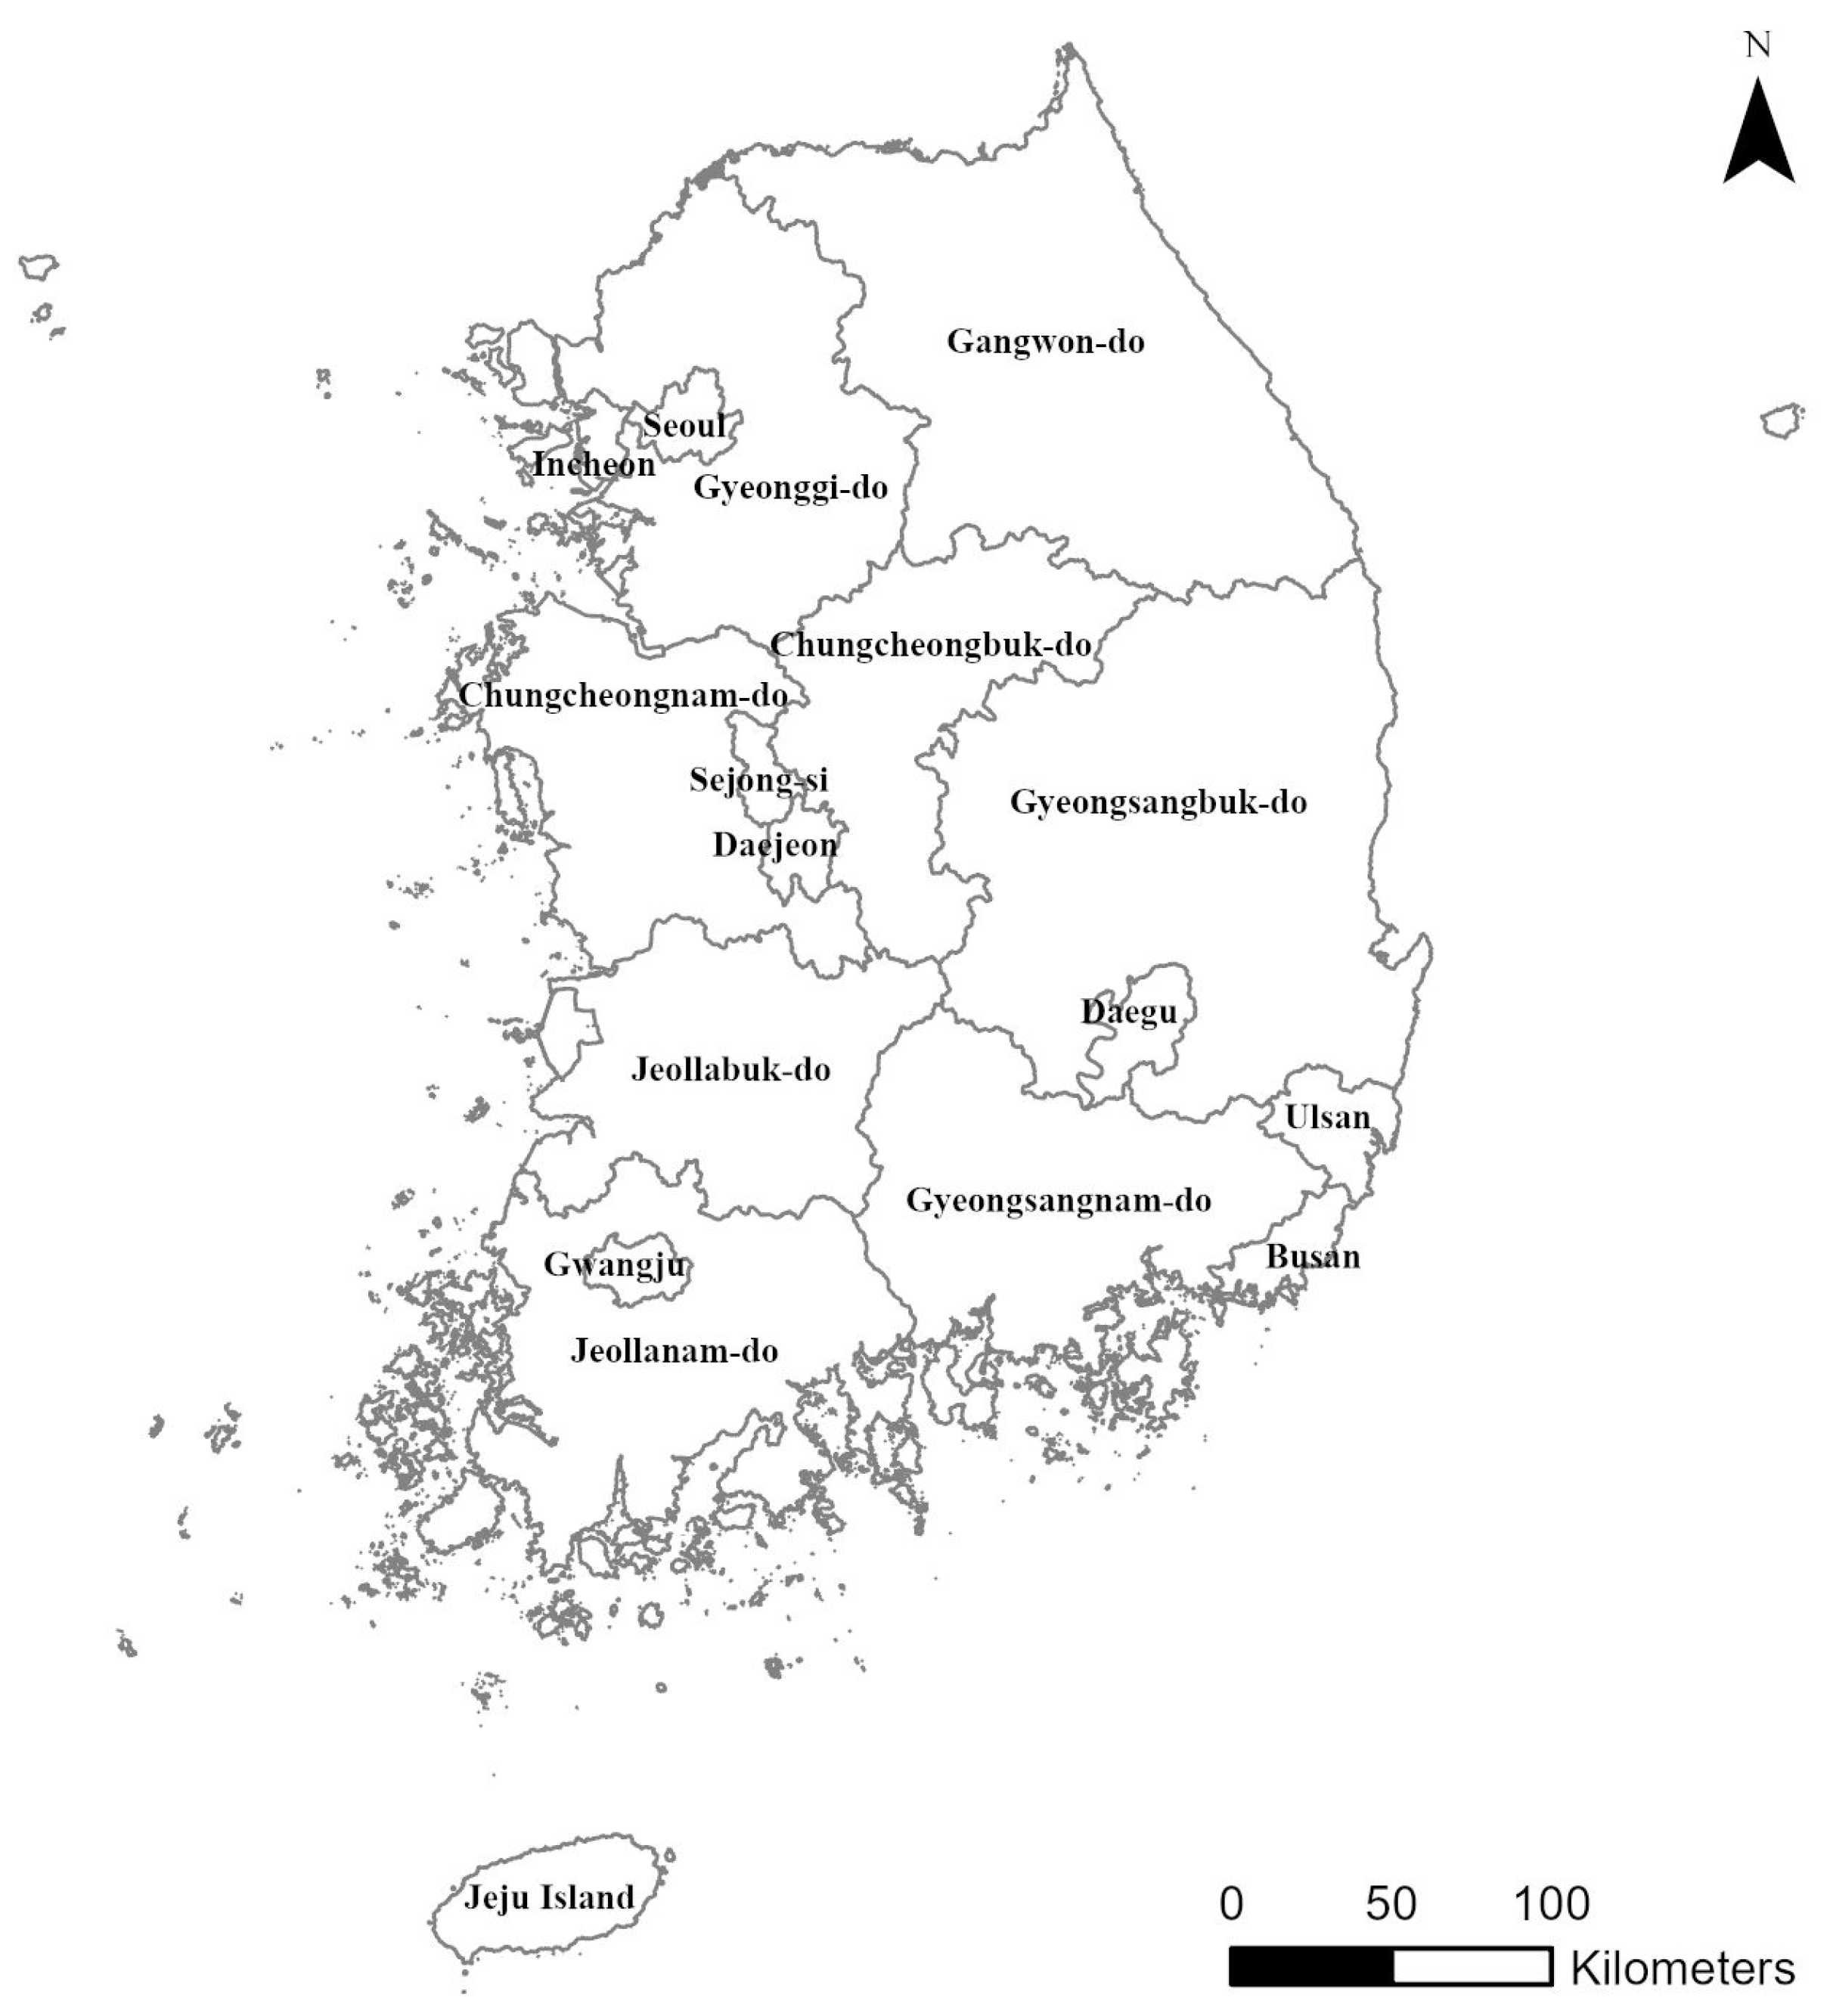
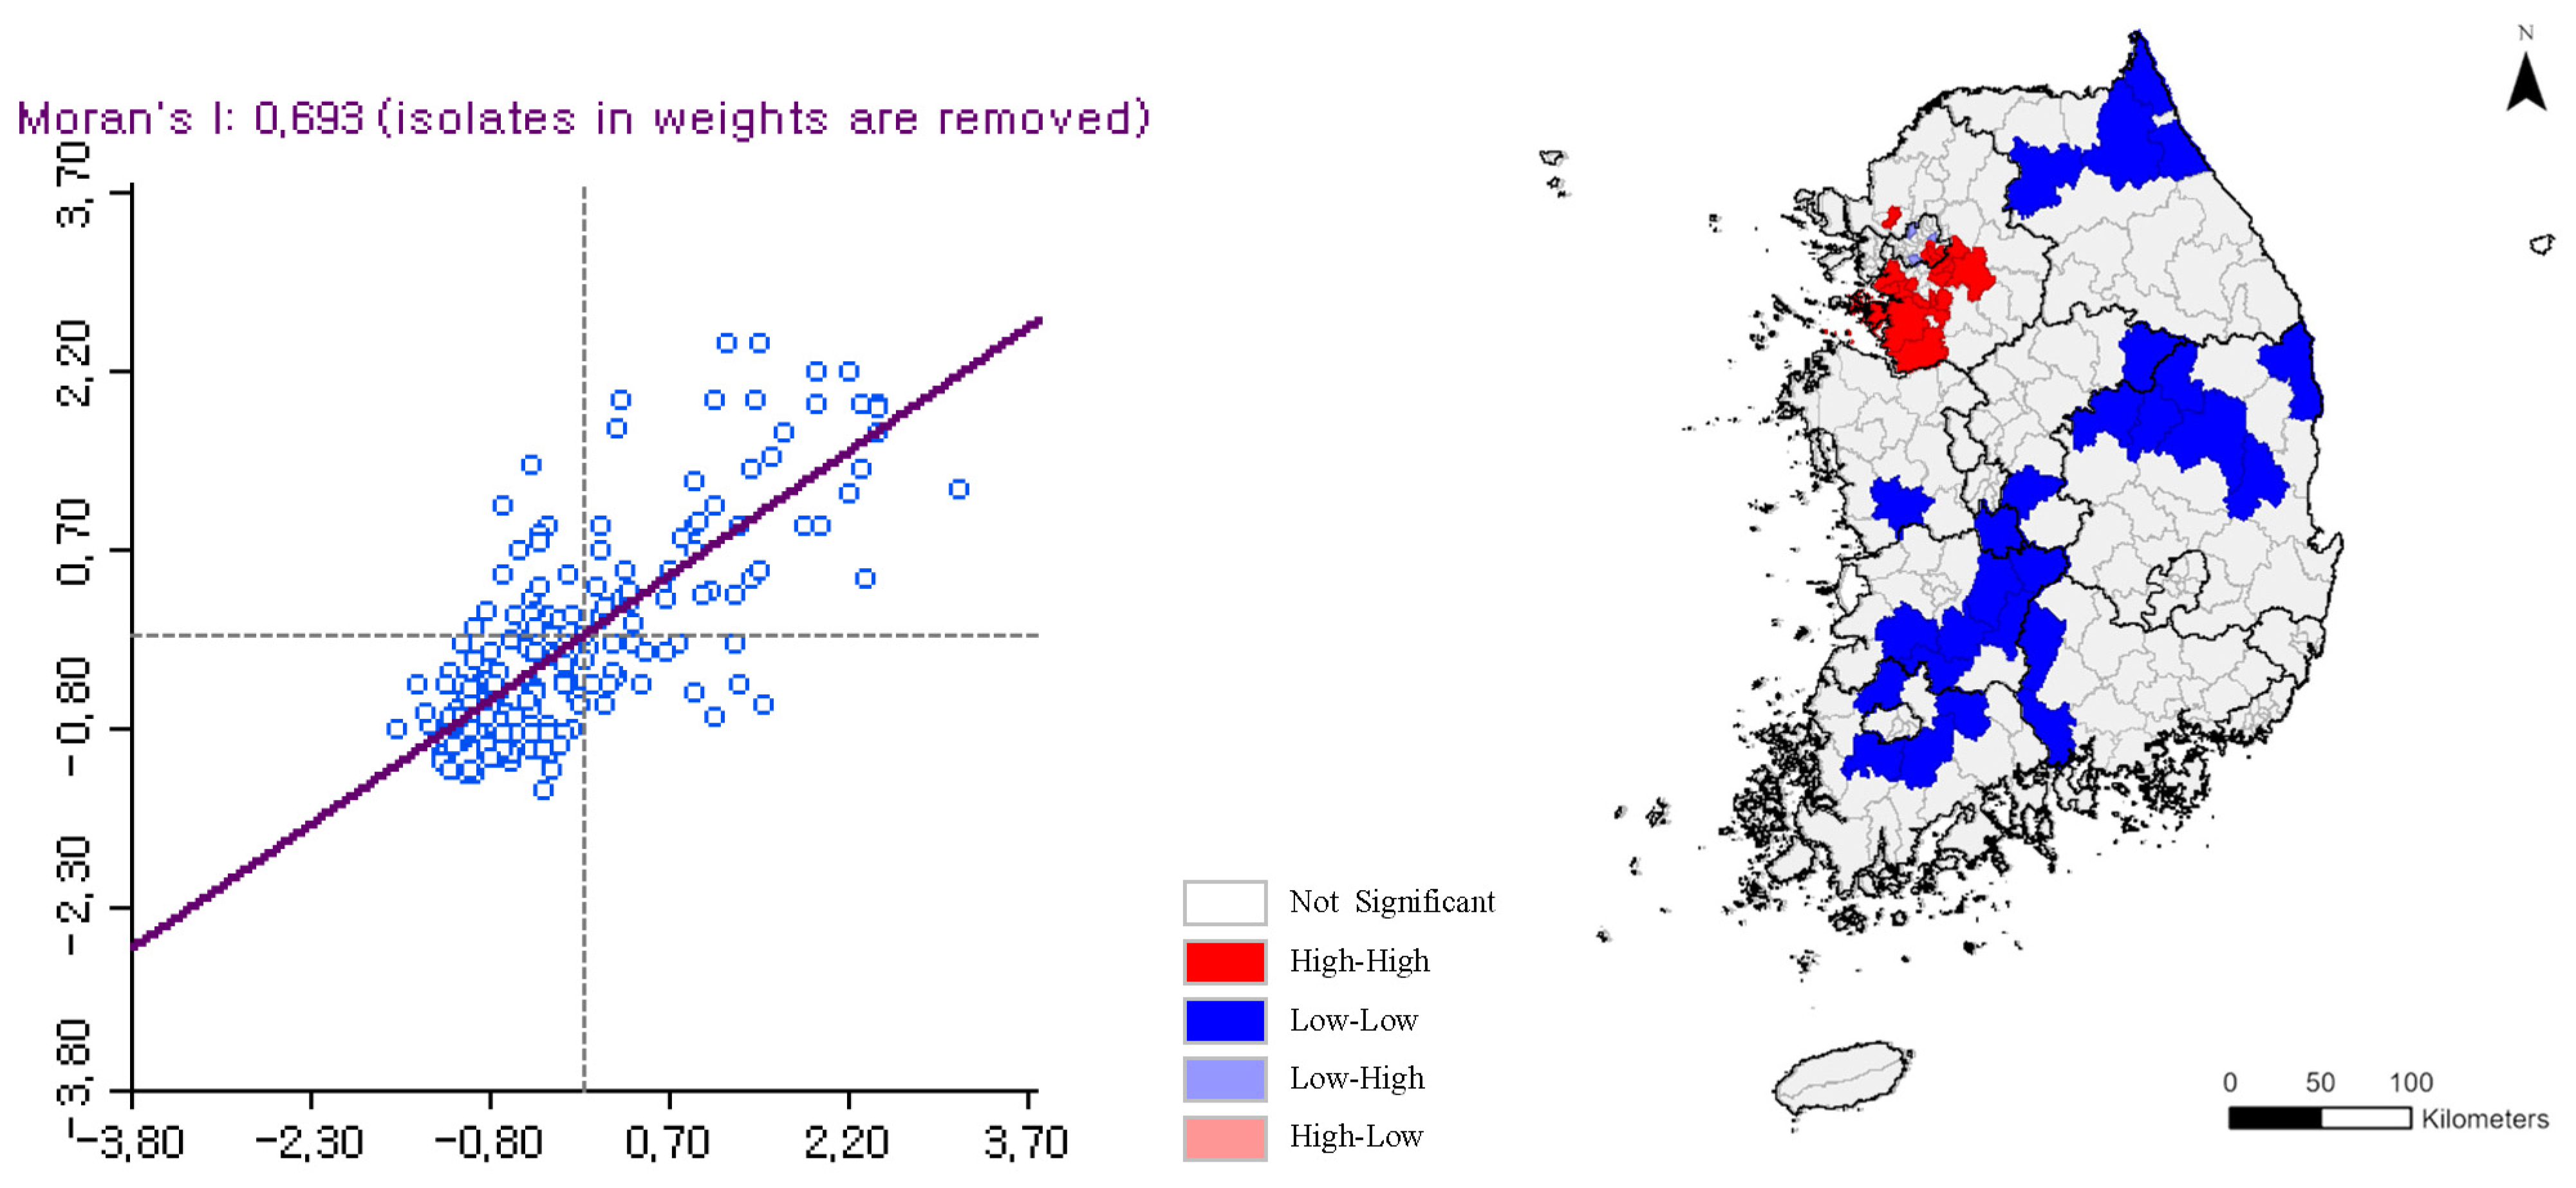
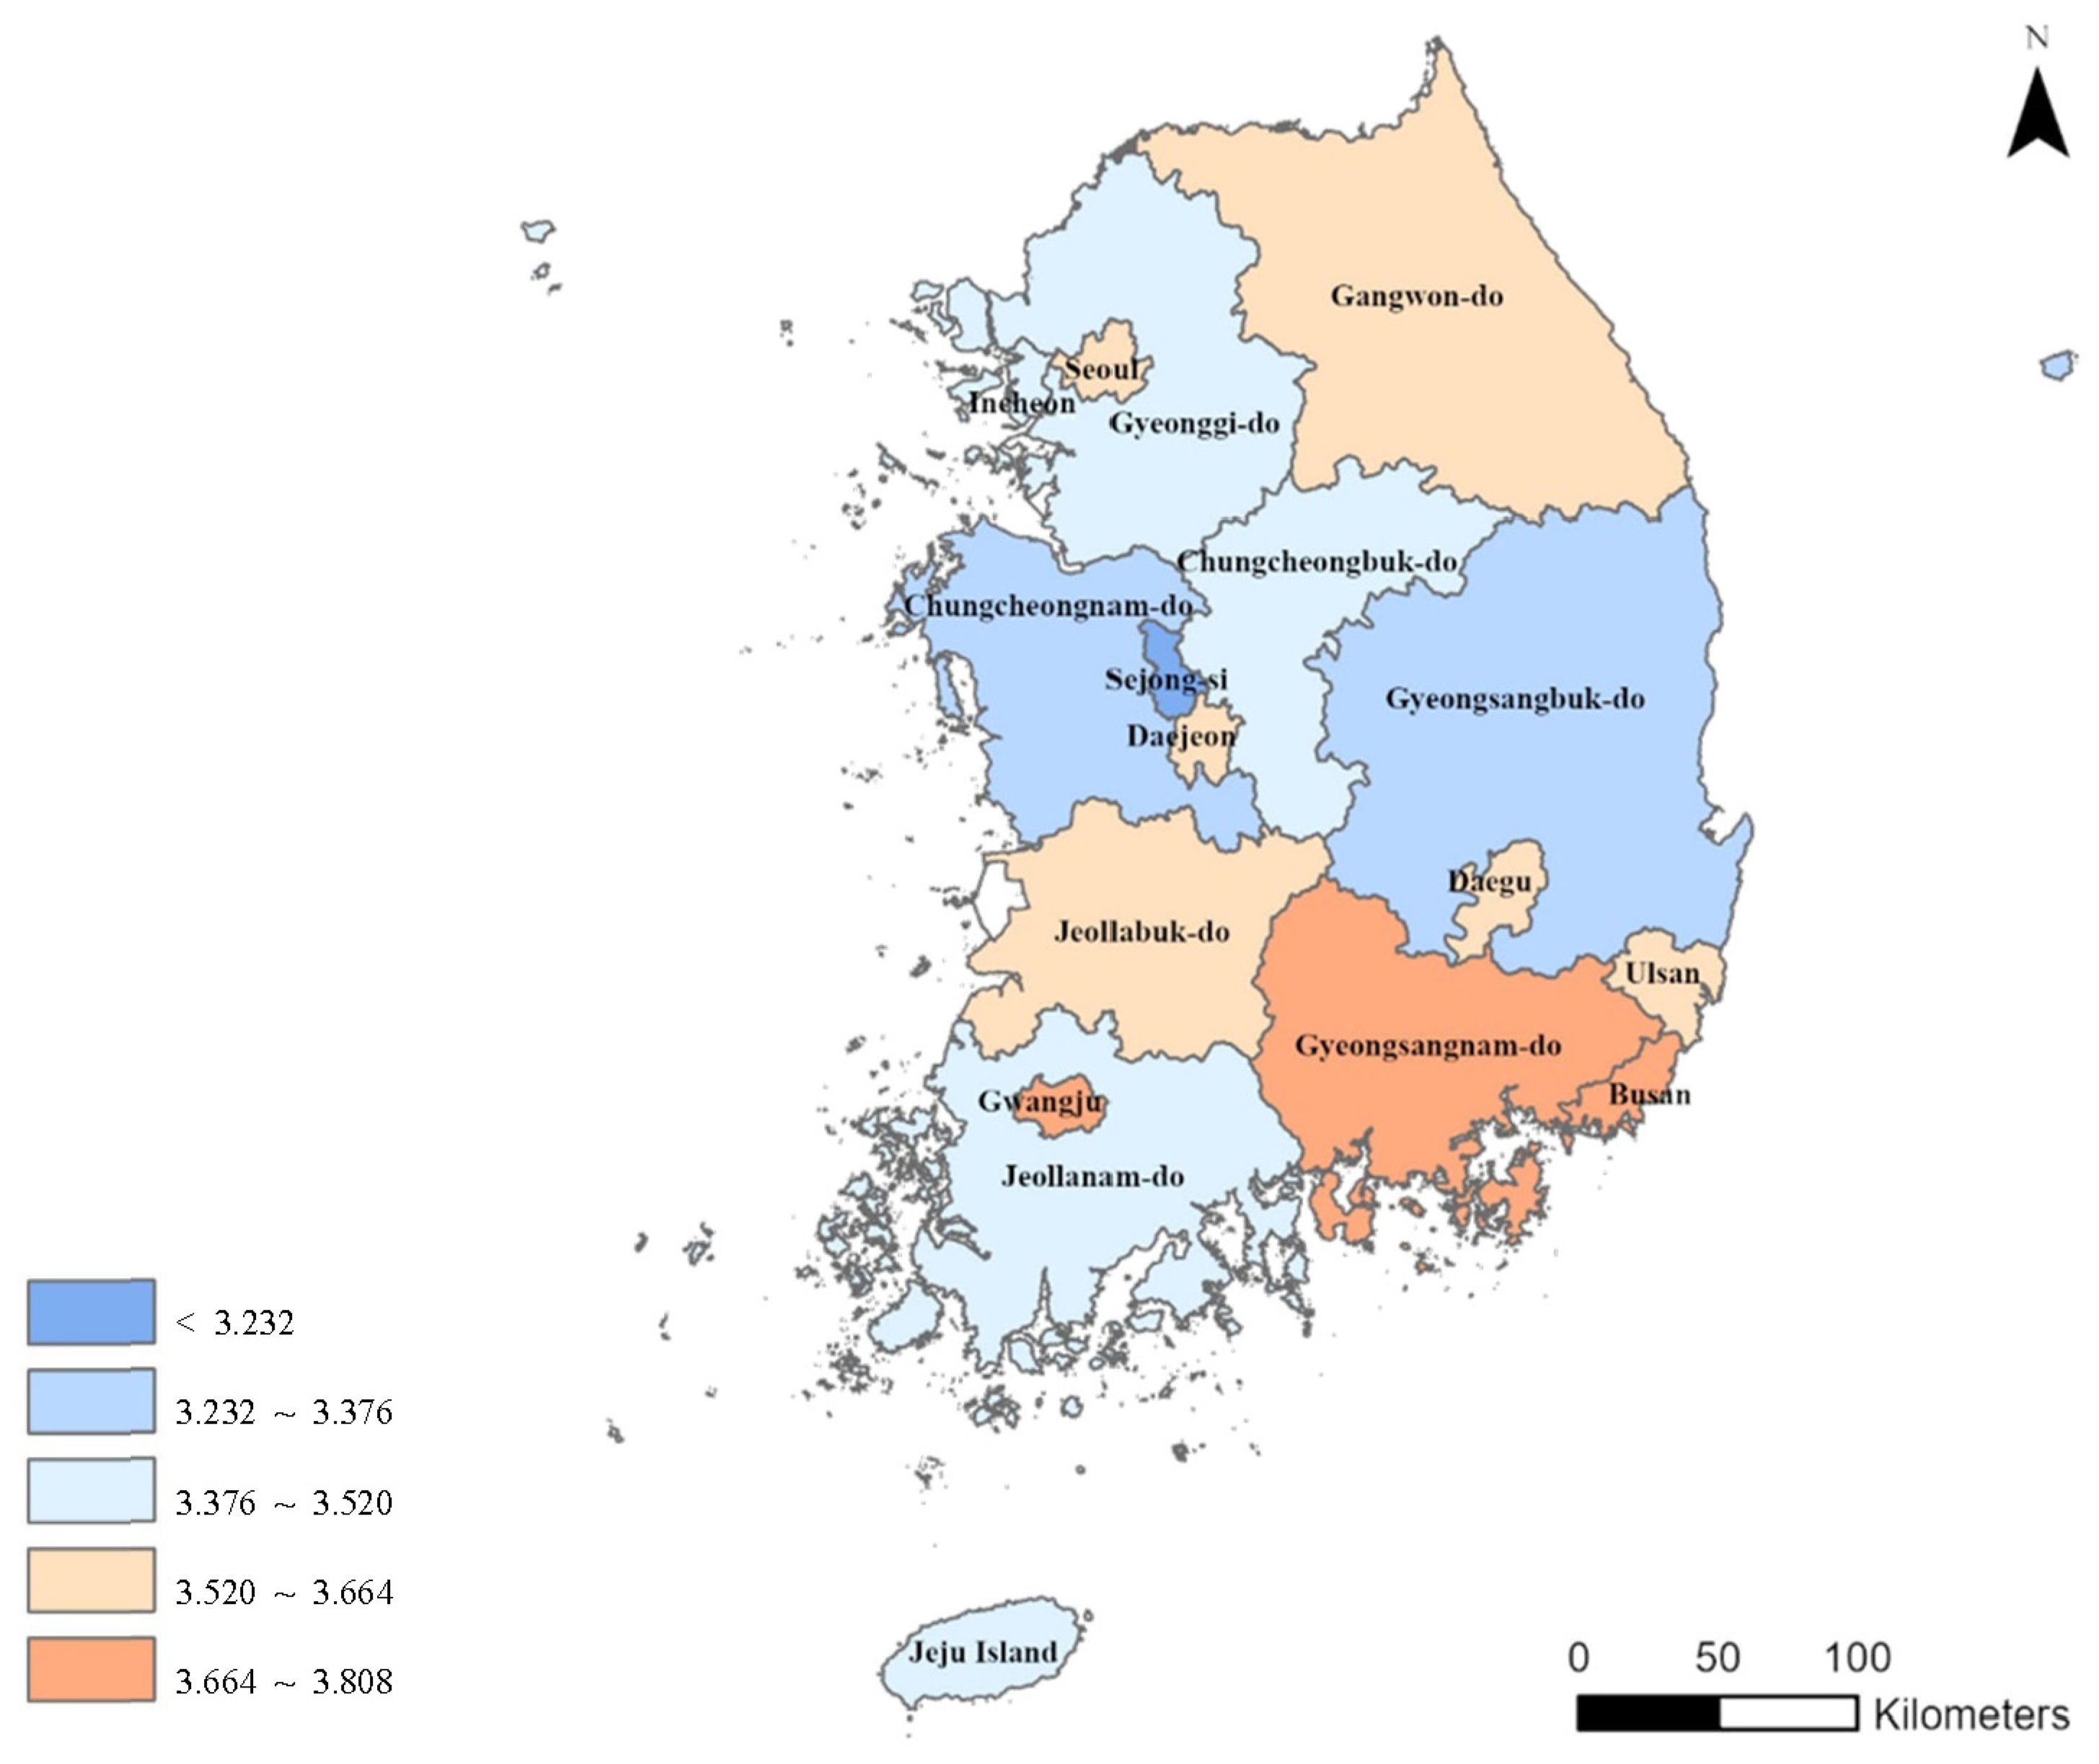
Table 1.
Core indicators.
| Spc. | Core Indicators |
|---|---|
| Population | population growth rate (1975–2015) (%) |
| Economy | financial independence (2016–2018) (%) |
Table 2.
Objective indicators.
| Spc. | Objective Indicators |
|---|---|
| Dwelling | ratio of old houses (%), ratio of vacant houses (%), ratio of households that do not meet the minimum housing standard (%), water supply rate (%), sewage supply rate (%) |
| Traffic | road pavement rate (%), highway IC accessibility (km), high-speed/high-speed rail access (km), population ratio within the parking lot service area (0.75 km) (%) |
| Industry and jobs | change in the number of businesses in the last three years (2016–2018) (%), change in the number of employees in the last three years (2016–2018) (%), 3 annual average of intensity of knowledge-based industry (2016–2018) (%), percentage of regular workers (%), number of patents (cases), R&D expenses per researcher (USD 1.0/R&D personnel 1) |
| Education | number of childcare facilities per 1000 infants (0–5 years old) (opens/1000 people), number of schools per 1000 school-age population (elementary, middle, and high schools) (opens/1000 people), ratio of infants and toddlers within daycare service area (%), percentage of school-age population within the service area of elementary schools (%) |
| Culture and leisure | number of cultural infrastructure per 100,000 population (number of establishments/100,000 people), number of seats per 1000 population (number of seats/1000 people), number of artistic activities per 100,000 population (number of cases/100,000 people), proportion of population within the service area of performance and cultural facilities (%), proportion of population within the service area of libraries (%), proportion of population within the service area of public sports facilities (%) |
| Safety | number of residents in charge per rescue and paramedic (Number of residents/1 rescue worker), number of residents in charge per 911 safety center (Number of residents/one 911 safety center), access to fire station (km), access to police station (km) f libraries (%), proportion of population within the service area of public sports facilities (%) |
| Environment | urban park area per 1000 people (m2/1000 people), green space ratio (%), air pollutant emissions per 1 km2 (ton/km2/year), percentage of population within the living park service area (%) |
| Health and welfare | ratio of single-person households over 65 years old (%), ratio of recipients of National Basic Livelihood Security (%), share of social welfare and health spending (%), number of social welfare facilities per 100,000 people (opens/100,000 people), number of hospital beds per 1000 people (beds/1000 people), ratio of elderly population in the service area of elderly leisure welfare facilities (%), population ratio in emergency medical facility service area (%), population ratio in hospital service area (%) |
Table 3.
Subjective indicators.
| Spc. | Subjective Indicators |
|---|---|
| Overall | personal life satisfaction; local life satisfaction |
| Dwelling | state of residence; basic living conditions |
| Transportation | use of public transportation; use of parking lot |
| Industry and jobs | job opportunities; income creation |
| Education | quality of primary and secondary education; adult liberal arts and hobbies; sufficient childcare facilities; out-of-school education |
| Culture and leisure | convenience of access to cultural facilities; convenience of access to sports facilities; cultural facilities and programs; sports facilities and programs |
| Safety | prevention of natural disasters and disasters; public security (safety at night); 911 dispatch |
| Environment | noise, odor, waste treatment; natural environment conservation; park green space; air quality (fine dust, etc.) |
| Health and welfare | hospital/clinic/pharmacy use; medical service level; social welfare service |
| Participation and Community | people around you who can ask for help; resident participation |
Table 4.
Core indicator analysis.
| Spc. | SU | BS | DG | IC | GJ | DJ | US | SJ | GG |
| P | 0.9 | 0.7 | 1.2 | 2.8 | 1.8 | 2.2 | 2.9 | 1.7 | 3.6 |
| E | 86.3 | 59.1 | 58.0 | 66.7 | 53.6 | 55.8 | 65.7 | 70.5 | 70.7 |
| Spc. | GW | CB | CN | JB | JN | GB | GN | IJ | NW |
| P | −0.5 | 0.1 | 0.0 | −0.7 | −1.5 | −0.5 | 0.5 | 1.0 | 1.0 |
| E | 31.2 | 40.4 | 41.3 | 30.3 | 31.3 | 35.1 | 45.8 | 44.7 | 55.1 |
P: population (growth rate (1975–2015)) (%), E: economy (financial independence (2016–2018)) (%) [16].
Table 5.
Objective indicator (dwelling) analysis.
| Spc. | SU | BS | DG | IC | GJ | DJ | US | SJ | GG |
| D-1 | 17.6 | 22.8 | 17.0 | 13.5 | 15.8 | 15.2 | 12.2 | 6.7 | 8.5 |
| D-2 | 3.2 | 8.1 | 5.2 | 6.5 | 7.2 | 6.1 | 7.7 | 12.0 | 6.0 |
| D-3 | 8.8 | 5.3 | 4.5 | 4.8 | 3.9 | 3.4 | 2.9 | 2.9 | 5.4 |
| D-4 | 100.0 | 100.0 | 100.0 | 98.8 | 98.7 | 99.9 | 98.3 | 93.1 | 98.3 |
| D-5 | 100.0 | 99.3 | 98.5 | 97.0 | 98.7 | 97.1 | 99.0 | 92.5 | 94.1 |
| Spc. | GW | CB | CN | JB | JN | GB | GN | IJ | NW |
| D-1 | 23.4 | 20.5 | 19.9 | 25.8 | 33.7 | 26.9 | 20.7 | 20.5 | 17.5 |
| D-2 | 12.0 | 12.3 | 12.7 | 12.2 | 15.3 | 12.9 | 10.7 | 14.0 | 8.1 |
| D-3 | 4.2 | 3.5 | 4.3 | 3.1 | 3.4 | 5.0 | 3.5 | 5.2 | 5.3 |
| D-4 | 91.1 | 92.2 | 88.4 | 96.7 | 88.0 | 91.5 | 94.0 | 100.0 | 97.0 |
| D-5 | 87.1 | 86.3 | 78.0 | 84.9 | 76.8 | 79.5 | 88.5 | 92.4 | 92.9 |
D-1: ratio of aging houses (%), D-2: ratio of vacant houses (%), D-3: ratio of households that do not meet the minimum housing standard (%), D-4: water supply rate (%), D-5: sewage supply rate (%) [16].
Table 6.
Objective indicator (dwelling) analysis.
| Spc. | SU | BS | DG | IC | GJ | DJ | US | SJ | GG |
| T-1 | 100.0 | 98.3 | 99.1 | 98.1 | 100.0 | 100.0 | 99.0 | 100.0 | 98.1 |
| T-2 | 3.5 | 6.6 | 6.5 | 20.1 | 5.2 | 6.1 | 9.1 | 10.6 | 10.1 |
| T-3 | 7.4 | 17.6 | 18.5 | 41.8 | 12.9 | 10.0 | 23.6 | 17.7 | 30.1 |
| T-4 | 68.0 | 83.3 | 74.2 | 71.1 | 59.6 | 74.4 | 64.1 | 28.5 | 46.2 |
| Spc. | GW | CB | CN | JB | JN | GB | GN | IJ | NW |
| T-1 | 89.9 | 92.3 | 92.6 | 87.6 | 89.8 | 88.1 | 91.0 | 99.0 | 93.5 |
| T-2 | 21.8 | 13.0 | 14.8 | 12.8 | 20.9 | 18.9 | 16.1 | 33.4 | 12.5 |
| T-3 | 54.3 | 50.4 | 47.5 | 27.5 | 39.4 | 62.6 | 37.6 | 0.0 | 31.9 |
| T-4 | 53.1 | 48.1 | 33.9 | 55.0 | 48.4 | 41.0 | 66.1 | 68.9 | 52.3 |
T-1: road pavement rate (%), T-2: highway IC accessibility (km), T-3: high-speed/high-speed rail access (km), T-4: population ratio within the parking lot service area (%) [16].
Table 7.
Objective indicator (industry and jobs) analysis.
| Spc. | SU | BS | DG | IC | GJ | DJ | US | SJ | GG |
| I-1 | 0.2 | 0.9 | 1.3 | 2.8 | 1.5 | 1.9 | 1.6 | 15.7 | 3.0 |
| I-2 | 1.3 | 1.2 | 2.0 | 3.2 | 2.6 | 1.8 | 0.4 | 12.9 | 3.8 |
| I-3 | 1.26 | 0.80 | 0.71 | 0.96 | 0.74 | 1.08 | 0.65 | 0.96 | 1.23 |
| I-4 | 68.8 | 59.5 | 57.1 | 66.0 | 60.3 | 63.1 | 67.7 | 71.7 | 65.5 |
| I-5 | 47,123 | 6172 | 4619 | 6236 | 3431 | 10,767 | 2347 | 811 | 47,175 |
| I-6 | 249,208 | 188,616 | 139,036 | 217,394 | 105,494 | 279,405 | 136,840 | 193,969 | 444,738 |
| Spc. | GW | CB | CN | JB | JN | GB | GN | IJ | NW |
| I-1 | 2.5 | 2.0 | 3.2 | 1.2 | 2.4 | 2.1 | 2.3 | 4.3 | 1.9 |
| I-2 | 3.5 | 3.4 | 2.7 | 1.4 | 2.8 | 1.4 | 0.3 | 3.6 | 2.3 |
| I-3 | 0.59 | 0.98 | 0.98 | 0.62 | 0.54 | 0.83 | 0.68 | 0.60 | 1.00 |
| I-4 | 55.9 | 66.0 | 66.9 | 61.7 | 59.6 | 63.3 | 64.1 | 59.2 | 64.6 |
| I-5 | 2666 | 3509 | 6482 | 3995 | 3223 | 6634 | 6521 | 837 | 162,561 |
| I-6 | 103,737 | 161,426 | 252,669 | 168,600 | 121,228 | 279,335 | 353,384 | 105,410 | 235,724 |
I-1: change in the number of businesses in the last three years (2016–2018) (%), I-2: change in the number of employees in the last three years (2016–2018) (%), I-3: 3 annual average of intensity of knowledge-based industry (2016–2018) (%), I-4: percentage of regular workers (%), I-5: number of patents (cases), I-6: R&D expenses per researcher (USD 1.0/R&D personnel 1) [16].
Table 8.
Objective indicator (education) analysis.
| Spc. | SU | BS | DG | IC | GJ | DJ | US | SJ | GG |
| E-1 | 15.4 | 13.8 | 12.9 | 15.4 | 16.6 | 19.4 | 14.6 | 13.4 | 17.4 |
| E-2 | 1.4 | 1.9 | 1.7 | 1.6 | 1.7 | 1.7 | 1.8 | 1.7 | 1.5 |
| E-3 | 90.3 | 87.3 | 89.9 | 88.7 | 84.8 | 89.6 | 84.7 | 82.2 | 83.0 |
| E-4 | 59.4 | 58.5 | 59.1 | 61.4 | 60.9 | 62.8 | 57.4 | 54.7 | 50.4 |
| Spc. | GW | CB | CN | JB | JN | GB | GN | IJ | NW |
| E-1 | 17.5 | 15.9 | 18.2 | 17.9 | 15.2 | 16.7 | 18.0 | 15.0 | 16.4 |
| E-2 | 4.0 | 2.7 | 2.9 | 3.8 | 4.2 | 3.4 | 2.5 | 2.2 | 2.1 |
| E-3 | 73.0 | 78.0 | 75.9 | 77.8 | 68.3 | 73.9 | 80.7 | 72.8 | 70.5 |
| E-4 | 35.6 | 48.4 | 40.5 | 51.8 | 41.9 | 41.1 | 49.3 | 40.8 | 43.6 |
E-1: number of childcare facilities per 1000 infants (0–5 years old) (opens/1000 people), E-2: number of schools per 1000 school-age population (elementary, middle and high schools) (opens/1000 people), E-3: ratio of infants and toddlers within daycare service area (%), E-4: percentage of school-age population within the service area of elementary schools (%) [16].
Table 9.
Objective indicator (culture and leisure) analysis.
| Spc. | SU | BS | DG | IC | GJ | DJ | US | SJ | GG |
| C-1 | 4.1 | 3.1 | 3.2 | 3.5 | 4.3 | 3.7 | 3.7 | 6.0 | 4.1 |
| C-2 | 16.3 | 7.8 | 8.8 | 5.8 | 8.7 | 11.0 | 6.6 | 3.6 | 6.3 |
| C-3 | 144.3 | 81.7 | 90.3 | 51.7 | 104.4 | 86.2 | 70.2 | 46.8 | 35.5 |
| C-4 | 100.0 | 99.3 | 98.6 | 98.0 | 99.6 | 99.1 | 95.4 | 98.7 | 98.2 |
| C-5 | 74.0 | 58.7 | 54.3 | 61.2 | 74.4 | 66.1 | 61.0 | 47.4 | 54.7 |
| C-6 | 19.5 | 25.8 | 7.5 | 23.7 | 27.8 | 14.6 | 23.6 | 30.7 | 11.1 |
| Spc. | GW | CB | CN | JB | JN | GB | GN | IJ | NW |
| C-1 | 13.9 | 8.1 | 7.8 | 8.6 | 10.9 | 7.5 | 6.1 | 20.2 | 5.5 |
| C-2 | 19.0 | 7.7 | 12.3 | 16.7 | 12.4 | 11.6 | 9.6 | 27.4 | 10.6 |
| C-3 | 116.7 | 55.2 | 52.4 | 92.9 | 67.7 | 47.0 | 57.7 | 130.1 | 77.0 |
| C-4 | 87.3 | 90.9 | 88.2 | 90.0 | 79.1 | 85.2 | 88.5 | 99.7 | 87.3 |
| C-5 | 34.5 | 44.0 | 36.9 | 47.4 | 37.0 | 29.4 | 44.7 | 44.3 | 43.9 |
| C-6 | 15.9 | 46.5 | 15.8 | 10.9 | 12.9 | 12.0 | 12.9 | 39.7 | 18.7 |
C-1: number of cultural infrastructure per 100,000 population (number of establishments/100,000 people), C-2: number of seats per 1000 population (number of seats/1000 people), C-3: number of artistic activities per 100,000 population (number of cases/100,000 people), C-4: proportion of population within the service area of performance and cultural facilities (%), C-5: proportion of population within the service area of libraries (%), C-6: proportion of population within the service area of public sports facilities (%) [16].
Table 10.
Objective indicator (safety) analysis.
| Spc. | SU | BS | DG | IC | GJ | DJ | US | SJ | GG |
| S-1 | 4808 | 4063 | 3568 | 3955 | 3695 | 3850 | 3865 | 3205 | 5701 |
| S-2 | 82,450 | 58,859 | 50,792 | 56,866 | 60,686 | 56,726 | 45,921 | 37,842 | 72,745 |
| S-3 | 2.0 | 3.7 | 4.6 | 5.5 | 4.7 | 4.6 | 6.8 | 5.8 | 6.9 |
| S-4 | 1.5 | 2.9 | 3.7 | 3.5 | 2.8 | 4.7 | 4.8 | 5.2 | 4.5 |
| Spc. | GW | CB | CN | JB | JN | GB | GN | IJ | NW |
| S-1 | 1343 | 2412 | 2181 | 2472 | 1837 | 2070 | 2537 | 2098 | 3391 |
| S-2 | 21,410 | 38,095 | 27,227 | 35,665 | 30,141 | 27,202 | 34,312 | 27,958 | 48,594 |
| S-3 | 11.4 | 10.0 | 7.5 | 9.6 | 11.1 | 11.1 | 9.6 | 5.9 | 6.7 |
| S-4 | 8.7 | 6.8 | 6.0 | 4.9 | 5.5 | 6.5 | 6.0 | 5.7 | 4.5 |
S-1: number of residents in charge per rescue and paramedic (Number of residents/1 rescue worker), S-2: number of residents in charge per 911 safety center (Number of residents/one 911 safety center), S-3: access to fire station (km), S-4: access to police station (km) [16].
Table 11.
Objective indicator (environment) analysis.
| Spc. | SU | BS | DG | IC | GJ | DJ | US | SJ | GG |
| E-1 | 13,757 | 12,880 | 9798 | 13,921 | 12,885 | 21,126 | 30,134 | 56,013 | 11,226 |
| E-2 | 38.8 | 58.1 | 77.4 | 49.6 | 74.7 | 81.3 | 68.2 | 69.2 | 77.3 |
| E-3 | 404,331 | 206,096 | 110,054 | 210,637 | 99,525 | 112,292 | 235,427 | 50,302 | 67,451 |
| E-4 | 76.8 | 53.7 | 66.9 | 74.4 | 71.1 | 73.7 | 70.7 | 57.4 | 65.1 |
| Spc. | GW | CB | CN | JB | JN | GB | GN | IJ | NW |
| E-1 | 21,745 | 16,404 | 13,514 | 22,676 | 30,362 | 25,554 | 22,908 | 14,163 | 16,129 |
| E-2 | 77.2 | 77.0 | 65.0 | 68.6 | 68.4 | 73.1 | 73.4 | 82.6 | 71.0 |
| E-3 | 14,457 | 30,329 | 61,476 | 30,801 | 37,506 | 27,058 | 33,269 | 33,536 | 45,648 |
| E-4 | 41.9 | 59.5 | 47.2 | 51.8 | 43.1 | 47.7 | 57.0 | 44.5 | 48.3 |
E-1: urban park area per 1000 people (m2/1000 people), E-2: green space ratio (%), E-3: air pollutant emissions per 1 km2 (ton/km2/year), E-4: percentage of population within the living park service area (%) [16].
Table 12.
Objective indicator (health and welfare) analysis.
| Spc. | SU | BS | DG | IC | GJ | DJ | US | SJ | GG |
| H-1 | 5.6 | 8.5 | 7.4 | 5.6 | 6.3 | 5.7 | 5.1 | 3.8 | 5.0 |
| H-2 | 3.0 | 4.6 | 4.5 | 3.7 | 5.0 | 3.8 | 2.0 | 1.5 | 2.3 |
| H-3 | 39.6 | 44.5 | 44.6 | 42.4 | 46.6 | 44.7 | 33.9 | 24.6 | 34.9 |
| H-4 | 7.8 | 6.5 | 14.7 | 16.5 | 10.5 | 11.5 | 7.9 | 7.5 | 16.9 |
| H-5 | 8.9 | 20.5 | 15.0 | 11.5 | 27.9 | 16.0 | 13.4 | 4.0 | 10.2 |
| H-6 | 100.0 | 99.2 | 96.9 | 95.1 | 98.4 | 95.1 | 95.3 | 38.5 | 89.4 |
| H-7 | 100.0 | 94.8 | 95.0 | 95.2 | 99.4 | 98.4 | 95.5 | 5.2 | 91.2 |
| H-8 | 23.3 | 21.4 | 25.8 | 19.6 | 21.1 | 12.6 | 19.7 | 0.0 | 13.5 |
| Spc. | GW | CB | CN | JB | JN | GB | GN | IJ | NW |
| H-1 | 9.7 | 8.4 | 8.6 | 10.8 | 13.4 | 10.9 | 8.9 | 6.3 | 7.0 |
| H-2 | 4.3 | 3.7 | 3.1 | 5.5 | 4.5 | 4.0 | 3.3 | 3.5 | 3.4 |
| H-3 | 26.8 | 29.9 | 27.6 | 30.6 | 25.4 | 26.3 | 30.3 | 21.7 | 34.0 |
| H-4 | 28.2 | 24.9 | 20.3 | 18.8 | 23.3 | 18.5 | 9.9 | 14.9 | 14.4 |
| H-5 | 11.6 | 14.1 | 13.4 | 21.9 | 22.1 | 16.6 | 19.1 | 7.4 | 13.6 |
| H-6 | 63.2 | 70.5 | 50.2 | 68.7 | 55.2 | 48.5 | 62.0 | 54.2 | 68.3 |
| H-7 | 73.4 | 72.7 | 69.0 | 81.1 | 72.8 | 68.6 | 78.1 | 71.7 | 72.2 |
| H-8 | 7.5 | 10.0 | 8.8 | 13.9 | 12.1 | 7.0 | 17.0 | 3.2 | 12.7 |
H-1: ratio of single-person households over 65 years old (%), H-2: ratio of recipients of National Basic Livelihood Security (%), H-3: share of social welfare and health spending (%), H-4: number of social welfare facilities per 100,000 people (opens/100,000 people), H-5: number of hospital beds per 1000 people (beds/1000 people), H-6: ratio of elderly population in the service area of elderly leisure welfare facilities (%), H-7: population ratio in emergency medical facility service area (%), H-8: population ratio in hospital service area (%) [16].
Table 13.
Subjective indicator analysis.
| Spc. | SU | BS | DG | IC | GJ | DJ | US | SJ | GG |
| O-1 | 3.66 | 3.71 | 3.62 | 3.57 | 3.75 | 3.66 | 3.75 | 3.41 | 3.53 |
| O-2 | 3.64 | 3.69 | 3.57 | 3.48 | 3.74 | 3.55 | 3.61 | 3.18 | 3.45 |
| D-1 | 3.84 | 3.87 | 3.91 | 3.85 | 3.99 | 3.75 | 3.88 | 3.76 | 3.79 |
| D-2 | 4.05 | 4.00 | 3.93 | 3.98 | 4.22 | 3.90 | 4.00 | 3.59 | 3.87 |
| T-1 | 3.98 | 3.84 | 3.87 | 3.70 | 4.05 | 3.64 | 3.68 | 3.01 | 3.43 |
| T-2 | 3.36 | 3.43 | 3.32 | 3.17 | 3.29 | 3.00 | 3.46 | 2.70 | 3.12 |
| I-1 | 3.13 | 3.06 | 2.89 | 2.99 | 3.13 | 2.76 | 3.25 | 2.79 | 2.90 |
| I-2 | 3.13 | 3.05 | 2.94 | 2.96 | 3.08 | 2.79 | 3.26 | 2.82 | 2.93 |
| Ed-1 | 3.69 | 3.79 | 3.68 | 3.61 | 4.12 | 3.60 | 3.69 | 3.36 | 3.45 |
| Ed-2 | 3.65 | 3.74 | 3.57 | 3.52 | 3.75 | 3.58 | 3.69 | 3.03 | 3.33 |
| Ed-3 | 3.64 | 3.75 | 3.79 | 3.56 | 4.12 | 3.67 | 3.72 | 3.31 | 3.36 |
| Ed-4 | 3.45 | 3.61 | 3.56 | 3.21 | 3.90 | 3.36 | 3.55 | 2.95 | 3.16 |
| C-1 | 3.64 | 3.62 | 3.67 | 3.34 | 3.85 | 3.38 | 3.41 | 2.71 | 3.36 |
| C-2 | 3.63 | 3.70 | 3.69 | 3.53 | 3.79 | 3.34 | 3.52 | 2.83 | 3.36 |
| C-3 | 3.48 | 3.50 | 3.44 | 3.22 | 3.56 | 3.25 | 3.42 | 2.68 | 3.15 |
| C-4 | 3.43 | 3.52 | 3.55 | 3.31 | 3.49 | 3.24 | 3.38 | 2.70 | 3.16 |
| S-1 | 3.81 | 3.81 | 3.67 | 3.59 | 3.90 | 3.75 | 3.75 | 3.57 | 3.57 |
| S-2 | 3.58 | 3.75 | 3.55 | 3.49 | 3.74 | 3.57 | 3.74 | 3.38 | 3.36 |
| S-3 | 4.04 | 3.89 | 3.96 | 3.66 | 4.01 | 3.88 | 3.82 | 3.79 | 3.68 |
| En-1 | 3.63 | 3.84 | 3.54 | 3.61 | 3.82 | 3.62 | 3.74 | 3.62 | 3.48 |
| En-2 | 3.51 | 3.72 | 3.67 | 3.55 | 3.70 | 3.51 | 3.62 | 3.62 | 3.40 |
| En-3 | 3.40 | 3.58 | 3.61 | 3.51 | 3.69 | 3.45 | 3.56 | 3.31 | 3.32 |
| En-4 | 2.92 | 3.40 | 3.40 | 2.92 | 3.21 | 2.98 | 3.38 | 2.30 | 2.88 |
| H-1 | 3.96 | 3.93 | 3.96 | 3.63 | 4.29 | 3.82 | 3.69 | 3.28 | 3.67 |
| H-2 | 3.89 | 3.87 | 3.83 | 3.41 | 4.21 | 3.64 | 3.64 | 2.96 | 3.45 |
| H-3 | 3.63 | 3.68 | 3.69 | 3.38 | 3.74 | 3.54 | 3.61 | 3.16 | 3.36 |
| P-1 | 3.57 | 3.71 | 3.79 | 3.51 | 3.82 | 3.67 | 3.78 | 3.37 | 3.55 |
| P-2 | 3.24 | 3.56 | 3.37 | 3.33 | 3.45 | 3.31 | 3.66 | 3.15 | 3.16 |
| Spc. | GW | CB | CN | JB | JN | GB | GN | IJ | NW |
| O-1 | 3.63 | 3.57 | 3.61 | 3.66 | 3.64 | 3.42 | 3.78 | 3.46 | 3.61 |
| O-2 | 3.56 | 3.50 | 3.36 | 3.56 | 3.50 | 3.31 | 3.69 | 3.45 | 3.54 |
| D-1 | 3.77 | 3.79 | 3.63 | 3.77 | 3.74 | 3.65 | 3.93 | 3.57 | 3.81 |
| D-2 | 3.64 | 3.76 | 3.53 | 3.96 | 3.57 | 3.66 | 3.87 | 3.46 | 3.88 |
| T-1 | 3.36 | 3.52 | 3.21 | 3.49 | 3.38 | 3.48 | 3.66 | 3.40 | 3.64 |
| T-2 | 3.31 | 3.28 | 3.17 | 3.34 | 3.52 | 3.28 | 3.48 | 3.03 | 3.27 |
| I-1 | 2.61 | 2.94 | 3.00 | 2.54 | 2.77 | 2.48 | 2.89 | 2.51 | 2.92 |
| I-2 | 2.60 | 2.92 | 3.05 | 2.60 | 2.85 | 2.58 | 2.90 | 2.58 | 2.94 |
| Ed-1 | 3.34 | 3.40 | 3.29 | 3.51 | 3.27 | 3.26 | 3.60 | 3.34 | 3.55 |
| Ed-2 | 3.35 | 3.33 | 3.25 | 3.46 | 3.03 | 3.13 | 3.54 | 2.90 | 3.45 |
| Ed-3 | 3.44 | 3.46 | 3.32 | 3.52 | 3.34 | 3.21 | 3.56 | 3.09 | 3.52 |
| Ed-4 | 3.29 | 3.10 | 2.89 | 3.28 | 2.84 | 3.06 | 3.30 | 2.97 | 3.29 |
| C-1 | 3.35 | 3.34 | 2.99 | 3.37 | 2.94 | 3.09 | 3.34 | 2.90 | 3.41 |
| C-2 | 3.42 | 3.32 | 3.09 | 3.52 | 3.20 | 3.20 | 3.51 | 3.17 | 3.46 |
| C-3 | 3.26 | 3.22 | 2.88 | 3.23 | 2.89 | 2.97 | 3.32 | 2.81 | 3.26 |
| C-4 | 3.27 | 3.26 | 2.90 | 3.28 | 3.00 | 3.07 | 3.36 | 2.90 | 3.28 |
| S-1 | 3.65 | 3.79 | 3.63 | 3.72 | 3.45 | 3.36 | 3.72 | 3.16 | 3.66 |
| S-2 | 3.43 | 3.55 | 3.46 | 3.78 | 3.44 | 3.45 | 3.69 | 3.02 | 3.52 |
| S-3 | 3.85 | 3.50 | 3.67 | 3.89 | 3.85 | 3.74 | 3.93 | 3.57 | 3.83 |
| En-1 | 3.65 | 3.75 | 3.31 | 3.48 | 3.54 | 3.44 | 3.81 | 3.34 | 3.59 |
| En-2 | 3.60 | 3.70 | 3.45 | 3.61 | 3.60 | 3.56 | 3.74 | 3.16 | 3.54 |
| En-3 | 3.47 | 3.68 | 3.32 | 3.51 | 3.59 | 3.54 | 3.68 | 3.20 | 3.46 |
| En-4 | 3.11 | 2.84 | 2.83 | 3.18 | 3.31 | 3.04 | 3.52 | 3.06 | 3.05 |
| H-1 | 3.55 | 3.63 | 3.28 | 3.73 | 3.49 | 3.39 | 3.67 | 3.47 | 3.73 |
| H-2 | 3.33 | 3.42 | 3.05 | 3.67 | 3.13 | 3.19 | 3.52 | 3.24 | 3.57 |
| H-3 | 3.41 | 3.44 | 3.28 | 3.57 | 3.29 | 3.20 | 3.56 | 3.09 | 3.48 |
| P-1 | 3.73 | 3.78 | 3.57 | 3.80 | 3.82 | 3.62 | 3.78 | 3.58 | 3.64 |
| P-2 | 3.31 | 3.46 | 3.40 | 3.45 | 3.40 | 3.40 | 3.59 | 3.15 | 3.33 |
Overall (O): personal life satisfaction (O-1), local life satisfaction (O-2), Dwelling (D): state of residence (D-1), basic living conditions (D-2), Transportation (T): use of public transportation (T-1), use of parking lot (T-2), Industry and Jobs (I): job opportunities (I-1), income creation (I-2), Education (Ed): quality of primary and secondary education (Ed-1), adult liberal arts and hobbies (Ed-2), sufficient childcare facilities (Ed-3), out-of-school education (Ed-4), Culture and leisure (C): convenience of access to cultural facilities (C-1), convenience of access to sports facilities (C-2), cultural facilities and programs (C-3), sports facilities and programs (C-4), Safety (S): prevention of natural disasters and disasters (S-1), public security (safety at night) (S-2), 911 dispatch (S-3), Environment (En): noise, odor, waste treatment (En-1), natural environment conservation (En-2), park green space (En-3), air quality (fine dust, etc.) (En-4), Health and Welfare (H): hospital/clinic/pharmacy use (H-1), medical service level (H-2), social welfare service (H-3), Participation and Community (P): people around you who can ask for help (P-1), resident participation (P-2) [16].
Publisher’s Note: MDPI stays neutral with regard to jurisdictional claims in published maps and institutional affiliations. |
© 2022 by the authors. Licensee MDPI, Basel, Switzerland. This article is an open access article distributed under the terms and conditions of the Creative Commons Attribution (CC BY) license (https://creativecommons.org/licenses/by/4.0/).
Share and Cite
MDPI and ACS Style
Yoo, Y.; Choi, S. Effects of Top-Down Balanced Development Strategies on Regional Balance: Evidence from Public Big Data in Korea. Sustainability 2022, 14, 16221. https://0-doi-org.brum.beds.ac.uk/10.3390/su142316221
AMA Style
Yoo Y, Choi S. Effects of Top-Down Balanced Development Strategies on Regional Balance: Evidence from Public Big Data in Korea. Sustainability. 2022; 14(23):16221. https://0-doi-org.brum.beds.ac.uk/10.3390/su142316221
Chicago/Turabian StyleYoo, Yejin, and Seungbee Choi. 2022. "Effects of Top-Down Balanced Development Strategies on Regional Balance: Evidence from Public Big Data in Korea" Sustainability 14, no. 23: 16221. https://0-doi-org.brum.beds.ac.uk/10.3390/su142316221
Note that from the first issue of 2016, this journal uses article numbers instead of page numbers. See further details here.