Article

Spatial Accessibility Assessment of Emergency Response of Urban Public Services in the Context of Pluvial Flooding Scenarios: The Case of Jiaozuo Urban Area, China

1
School of Emergency Management, Henan Polytechnic University, Jiaozuo 454000, China
2
School of Business Administration, Henan Polytechnic University, Jiaozuo 454000, China
*
Author to whom correspondence should be addressed.
Sustainability 2022, 14(24), 16332; https://0-doi-org.brum.beds.ac.uk/10.3390/su142416332
Submission received: 6 November 2022 / Revised: 29 November 2022 / Accepted: 4 December 2022 / Published: 7 December 2022

Abstract

:
Urban pluvial flooding has become an important factor in urban casualties and economic losses, thus, there is an urgent need to strengthen urban emergency management research and improve emergency response capabilities to flooding. The SCS–CN hydrological model combined with GIS spatial analysis were used to assess the spatial accessibility of the emergency response to key urban public services (medical and fire) for different pluvial flooding scenarios of the Jiaozuo urban area. The results show that the coverage area of the public service department (medical and fire) emergency response decreases as the period of pluvial flooding recurrence increases. The accessibility of the public service department (medical and fire services) emergency response shows a gradual decline from the center of the Jiaozuo urban area to the periphery. The depth and area of water accumulation in the northern part of the Zhongzhan District, the northeastern part of the Macun District, and the southwestern part of the Shanyang District gradually increased as the heavy rainfall recurrence period increased. Emergency response from public services (medical and fire services) could not arrive within 15 min.

1. Introduction

Floods are the world’s most frequent, widespread, and costly natural disasters, and have caused 142,088 deaths and 656 billion dollars in economic losses between 1998 and 2017 [1]. Floods are also the most serious natural disasters in China. According to the Ministry of Emergency Management of the People’s Republic of China, floods affected 59.01 million people, accounting for 55.15% of the total number of people affected by natural disasters nationwide. They caused direct economic losses of 245.89 billion yuan, accounting for 73.62% of the direct ecological and economic losses from natural disasters nationwide. The disasters caused 590 deaths and disappearances, accounting for 68.05% of the total number of deaths and disappearances from natural disasters in China in 2021. Pluvial flooding is the result of flash flooding or the rise of surface water. Its main cause is urban drainage systems becoming overwhelmed causing water to flow into the streets and nearby properties causing loss of life or property. Therefore, prevention and mitigation, risk management, and emergency management of pluvial flooding have received widespread attention from scholars [2,3,4,5].
According to the results of the seventh national population census, the population of urban areas in China has reached 63.89%; the urban built-up area in China reached 62,000 square kilometers by 2021, and large cities and megacities emerged. With the proceeding flooding of urbanization, on the one hand, the frequency and intensity of urban pluvial flooding is exacerbated as a result of the continuous expansion of urban impervious areas. On the other hand, the losses caused by urban pluvial flooding are also increasing due to the constant concentration of urban population and social wealth. Moreover, the impact of urban flooding is accelerating in the context of climate change [6]. For example, on 18 July 2007 exceptionally heavy rainfall and flooding in Jinan, Shandong Province, caused 34 deaths and direct economic losses of 1.25 billion yuan. A rainstorm in Beijing on 21 July 2012 claimed the lives of 79 people [7]. On 20 July 2021, extraordinarily heavy rainfall and flooding occurred in Zhengzhou, Henan Province, resulting in the death or disappearance of 380 people and direct economic losses of 40.9 billion yuan. Therefore, it is urgent to comprehensively strengthen the study of urban pluvial flooding disaster emergency management with the rapid advancement of urbanization and the frequent occurrence of urban pluvial flood disasters in China [4,8,9,10].
The frequency of extreme weather in response to global warming has major socio-economic impacts [
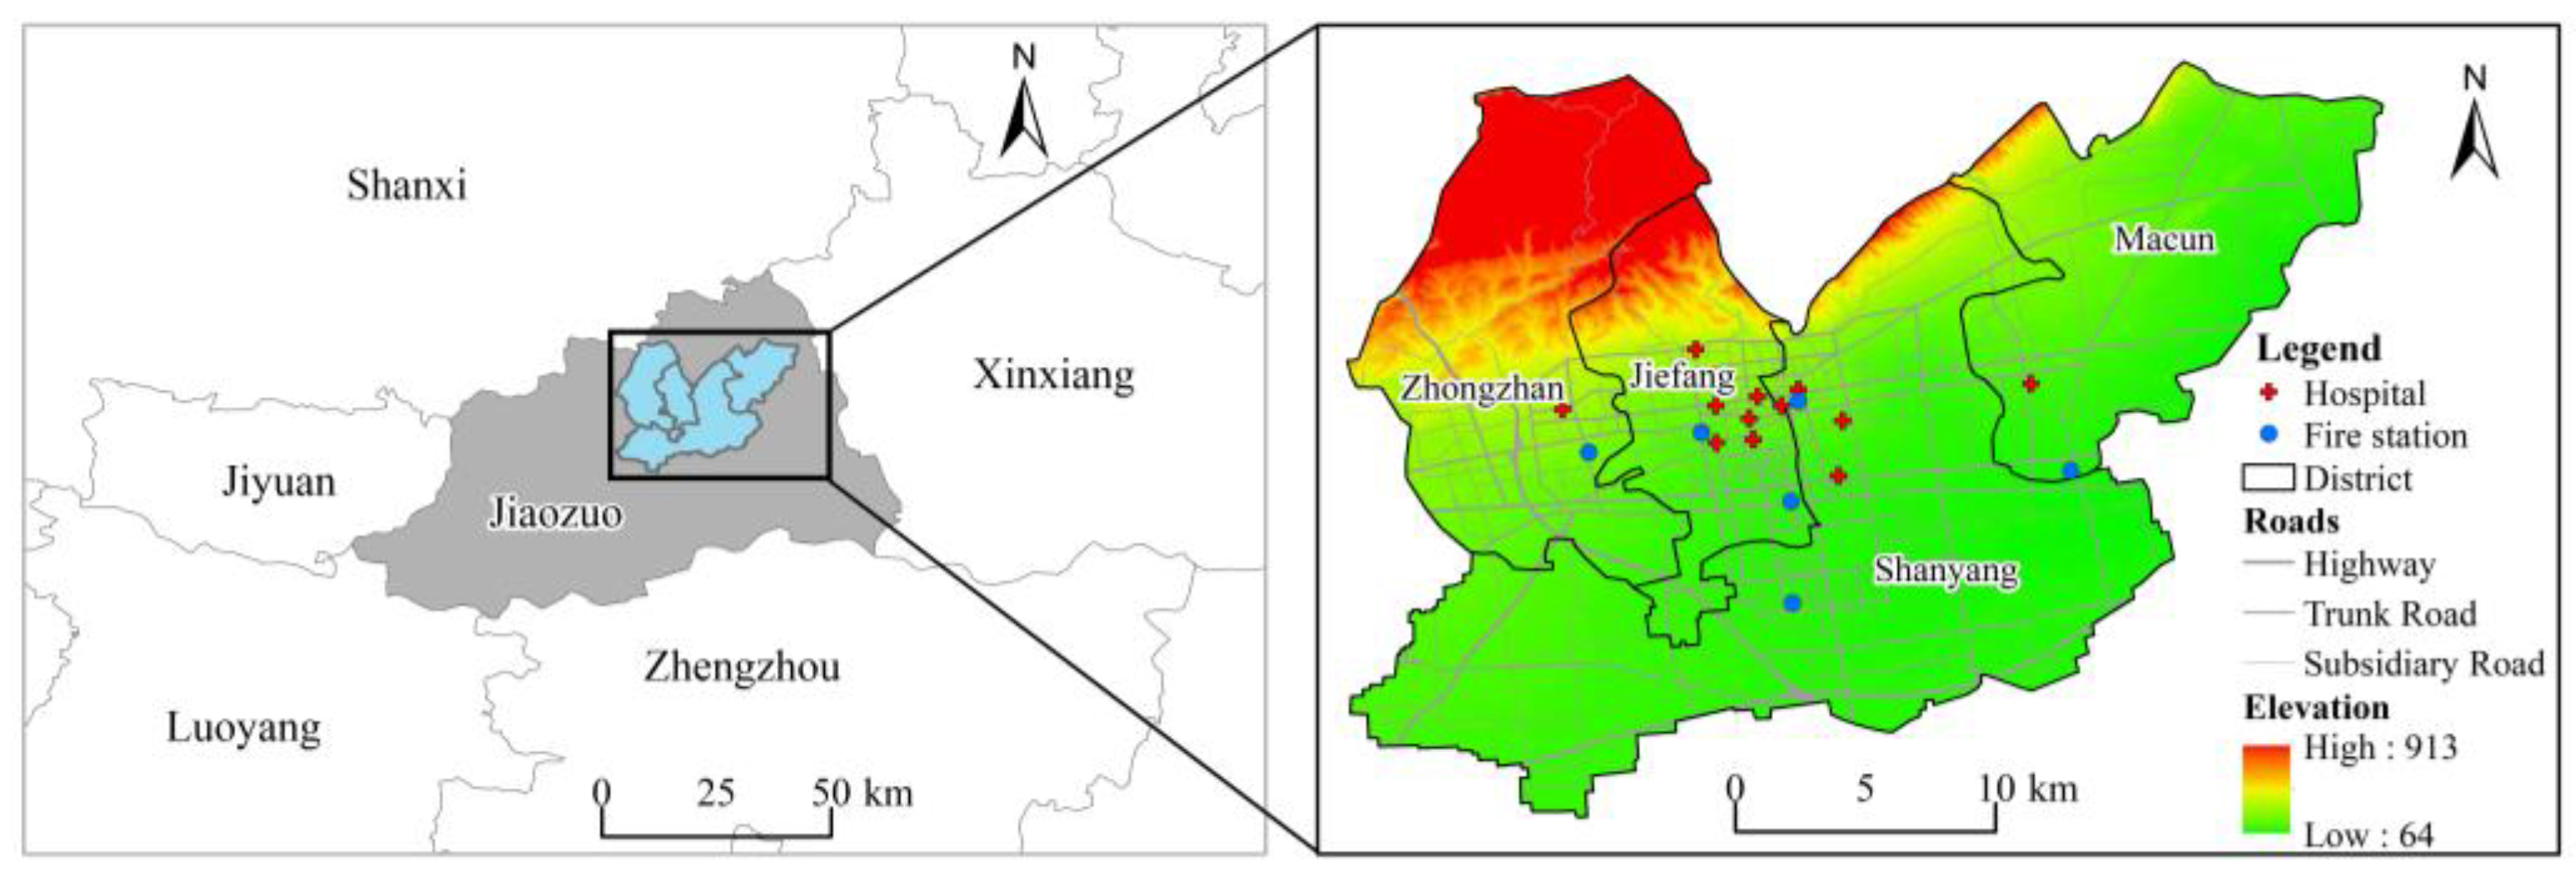
11,12]. Jiaozuo, a medium-sized city in central China, has frequently experienced extreme weather events in recent years, which have caused serious losses. For example, during a major rainstorm weather process in Jiaozuo from 18 July to 23 July in 2021 the precipitation in the Jiaozuo urban area was 574.9 mm, accounting for 102.6% of the multi-year annual average precipitation (560 mm) in the Jiaozuo urban area. This extreme precipitation affected 147,000 people, and 46,000 people were relocated urgently. A total of 1018 houses collapsed, and 1393 houses were severely damaged. A total of 205.38 km of roads were damaged, and 50.26 km was blocked. The direct economic losses were about 3.34 billion yuan. Emergency response to urban pluvial flooding, especially in sudden-onset pluvial flooding scenarios, is the most direct and effective measure to reduce casualties. It can be observed that urban flooding not only causes great damage to urban transportation infrastructure, but also causes some roads with deep water, which impacts the accessibility of roads [13], causing major difficulties for emergency evacuation and the rescue of affected people [4,14,15]. Therefore, it is necessary to simulate flooding and study the accessibility of public emergency services in the Jiaozuo urban area.
Spatial accessibility refers to the extent to which the spatial distribution of service resources facilitates access to services to the target population, with the main indicators being the spatial distance, travel time and economic costs to be overcome for service delivery. Spatial accessibility is considered to evaluate the configuration of urban public facilities services. The accessibility research methods mainly include network analysis, buffer analysis, cost-weighted distance method, minimum proximity distance method, gravitational potential energy simulation method, and two-step mobile search method (2SFCA). Many scholars have studied the spatial accessibility of medical emergency or fire rescue services in recent years. For example, Gu et al. evaluated the spatial accessibility to healthcare services of 203 villages and neighborhoods based on the two-step floating catchment area (2SFCA) method by ArcGIS software [16]. Chen et al. used real-time travel time to extend an existing spatial accessibility method to measure the spatiotemporal accessibility of fire services in a case study of Nanjing, China [17]. Moreover, a small number of scholars still study spatial accessibility and emergency response capacity under different flooding scenarios [18,19,20]: (1) The study of flood scenarios and the emergency responses with a single factor (such as pluvial flooding or fluvial flooding). For example, Alabbad et al. assessed the disruption of transportation networks on the accessibility to critical amenities (e.g., hospitals) under 100- and 500-year flood scenarios [21]. Yang et al. simulated fluvial flooding events by the flood inundation model FloodMap, and optimized the location of emergency healthcare services in Minhang District, Shanghai [22]. (2) The study of urban pluvial flooding scenarios and the emergency response in the context of multifactor overlap. For example, Yin et al. simulated urban pluvial flooding scenarios (100-year event and 500-year event) in the context of sea-level rise and heavy rainfall overlap, and evaluated the spatial accessibility of three major emergency response agencies (New York Police Department, Fire Department New York and Emergency Medical Service) [15]. Green et al. quantified road accessibility under different flood scenarios (one in 20-year, one in 100-year and one in 1000-year recurrence intervals) with both surface water and fluvial flood conditions [14]. (3) The simulation of historical extreme precipitation scenarios. For example, Tahvildari et al. used a hydrodynamic storm surge model coupled with a two-dimensional hydrodynamic model of rainfall-driven flow to simulate road inundation scenarios and medical service accessibility during the simultaneous occurrence of extreme precipitation and storm surge triggered by Hurricane Irene in 2011 [23]. Coles et al. simulated inundation scenarios of the 2014 flash flood event and the 2015 river floods event in York, UK using a hydrodynamic flood inundation model (FloodMap) and assessed the vulnerability of nursing homes and shelters during the flood [24].
Flood inundation simulation is very intuitive and practical, which can provide support for flood prevention and mitigation, flood emergency preparedness, emergency decision-making, emergency rescue, etc. However, there is still a lack of in-depth and systematic research in this field. For example, the STORM model, SWMM model, and MIKE model can provide more accurate simulations of stormwater flooding when data are available but they require more parameters to build the model and the calculation process is cumbersome. It is more difficult to apply to areas without complete data. In addition, urban pluvial flooding scenarios, road accessibility and the capacity of public rescue services vary widely owing to the natural environment, extreme precipitation characteristics, current urban land use, the layout of public rescue services and other human factors. Thus, it is necessary to strengthen the study of flood simulation and rescue ability under different scenarios [14,22,25].
The extent and depth of inundation under different scenarios is a key factor in assessing and analyzing the emergency response capacity of public services, and the most straightforward way to obtain the extent and depth of inundation is to use existing flood inundation maps or datasets [14,15,22,25]. However, because the datum update of atlases often has a certain lag time, it will affect the actual evaluation effect. To improve the accuracy of urban flooding simulations, previous studies used the regional storm intensity formula in calculating rainfall, then a hydrological model is used to simulate urban flooding scenarios [26]. Nevertheless, storm intensity formulas for a region often cannot objectively reflect current extreme precipitation conditions owing to the shortage of meteorological data used and/or untimely revision, and the frequency and intensity of extreme precipitation that are increasing with global climate change [11,12]. There is a great deviation in the calculation of extreme precipitation with the storm intensity formula. In terms of spatial accessibility analysis, firstly, most studies have not considered the impact of specific disaster scenarios on the spatial accessibility of urban emergency public services. Secondly, most of the previous studies conducted spatial accessibility analysis with one of the emergency response agencies, either medical or fire services, whereas in real life both medical emergency and fire services are important for the urban emergency response.
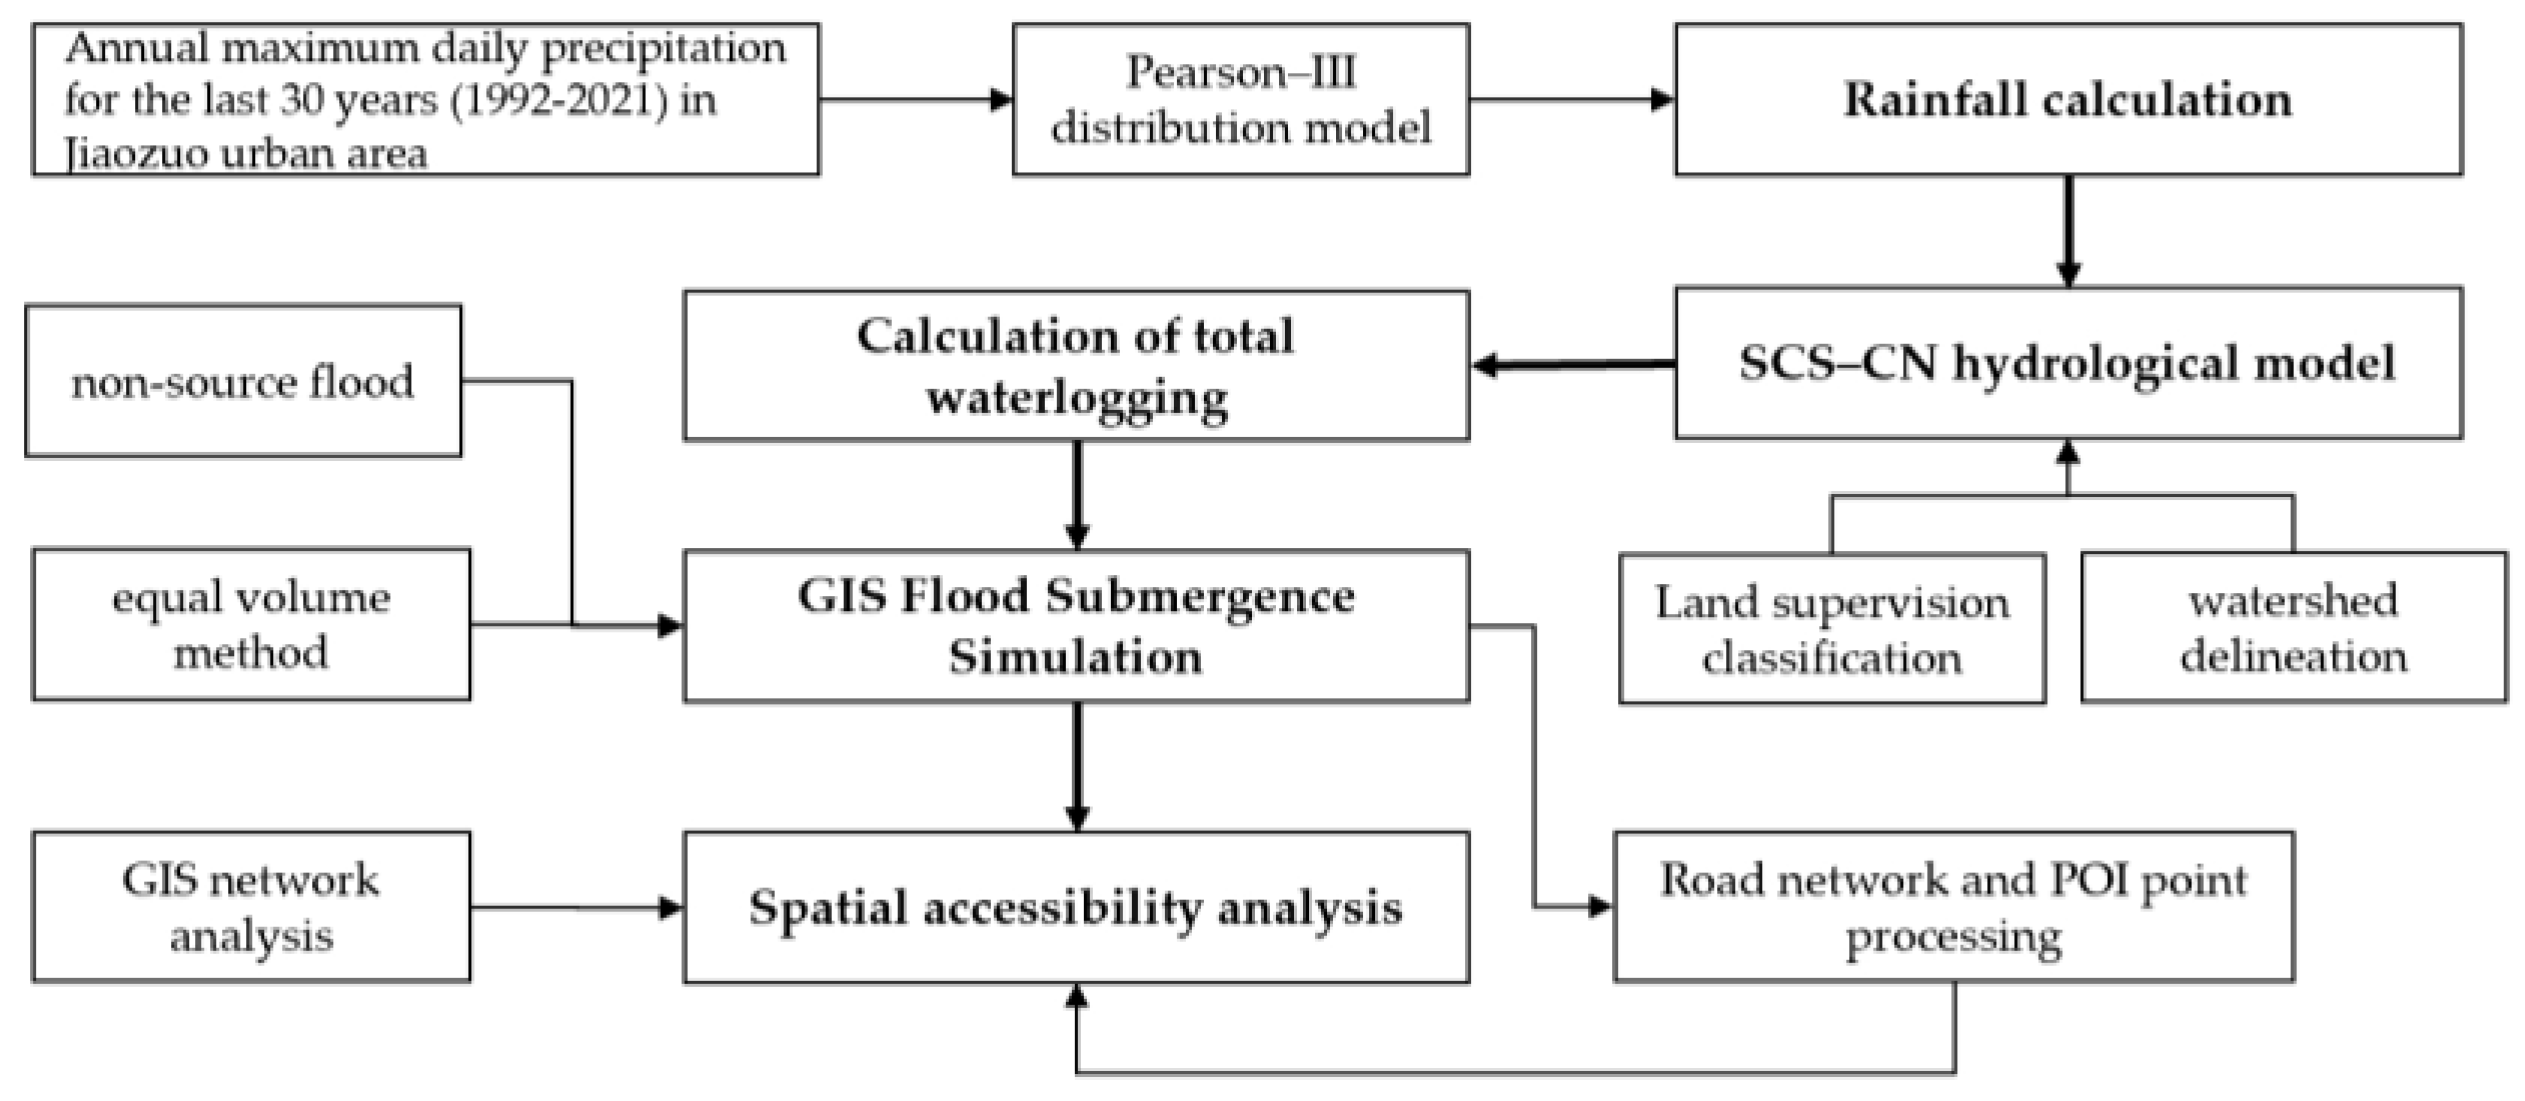
Based on the above analysis in this paper, in order to improve the simulation accuracy, the annual 1 h maximum precipitation data of the last 30 years in the Jiaozuo urban area are used to calculate the extreme precipitation (100-year pluvial flooding scenario, 200-year pluvial flooding scenario, and 1000-year pluvial flooding scenario) under different pluvial flooding scenarios using the most commonly used distribution model in China, Pearson-Type III [27].Then, the inundation extent and inundation depth of urban flooding of the Jiaozuo urban area are simulated by coupling the SCS-CN hydrological model with the GIS spatial analysis. The spatial accessibility of public emergency services is assessed at last. The spatial accessibility assessment mainly uses the service area analysis in the GIS network analysis method. The urban road network and POI points are processed based on the inundation results, the inundated roads and POI points are removed, and speed limits are set for different classes of roads with reference to national regulations and other research results. The spatial accessibility of medical emergency and fire rescue is measured and analyzed, respectively. The study provides a new idea for emergency response capability assessment. On the one hand, the results can optimize the layout of firefighting and general hospitals, and, on the other hand, they can provide decision support for flood prevention and mitigation, and emergency flood response in Jiaozuo city, minimizing disaster damage and impact.
The remainder of this paper is organized as follows. Section 2 outlines the geographical area of the study and the data sources, and describes the proposed method. The results of the study are analyzed in Section 3. Section 4 provides a discussion. Finally, Section 5 presents the conclusions.

2. Methods

The methodology of this study is divided into the following four parts: (1) Calculating rainfall for different return periods used by the Pearson-Type III distribution model. (2) The SCS-CN hydrological model was used to calculate the total runoff for different return periods with the help of Excel 2021 software. (3) The inundation extent and inundation depth of the Jiaozuo urban area were simulated based on a passive inundation algorithm with the aid of ArcMap 10.2 and MATLAB R2021b. (4) Using GIS network analysis to measure the spatial accessibility of public services for medical and fire protection in Jiaozuo city. The technical route and specific research methods are shown in Figure 1. Relevant data in the flood simulation process are shown in Table 1.

2.1. Overview of the Study Area

Jiaozuo is located in the central region of China and belongs to Henan Province, with the Taihang Mountains to the north and the Yellow River to the south. The Jiaozuo urban area is located in the northeastern part of Jiaozuo and the southern foot of the Taihang Mountains. It is the political economic and cultural center of Jiaozuo, with an area of about 547 square kilometers and a resident population of 1,086,000. The terrain is high in the north and low in the south, high in the west and low in the east, with an average altitude of 110 m. Jiaozuo belongs to the warm temperate continental monsoon climate with four distinct seasons, hot and rainy summers and cold and dry winters. The average annual precipitation in the Jiaozuo urban area is about 560 mm, which is unevenly distributed throughout the year. The annual precipitation is mainly concentrated in the flood season (June to September) with frequent heavy rainfall, which accounts for about 68% of the annual precipitation. Due to the topography and monsoonal climate, the city of Jiaozuo is highly susceptible to urban flooding, which has had a serious impact on people’s lives, property and economic development in Jiaozuo. Jiaozuo has experienced heavy rainfall and flooding many times in its history. For example, on 18 July 2021, heavy rainfall caused flooding in Jiaozuo, which resulted in a total of 744,500 people being affected in 110 towns and counties in 11 counties (cities), 709 industrial enterprises were affected and 13,613 Acres of agricultural land was damaged in the city. The Jiaozuo urban area suffered economic losses of about 3.34 billion yuan, 147,000 people were affected and 46,000 emergency relocations were effectuated (Figure 2).

2.2. Data Source and Processing

Urban pluvial flooding inundation simulation data include administrative boundary data, Digital Elevation Model (DEM) data, Enhanced Thematic Mapper (ETM) imagery data, and meteorological precipitation data. The administrative boundary data of the study area are obtained from the 1:250,000 national basic geographic database of the National Catalogue Service for Geographic Information (https://www.webmap.cn, 6 May 2022). The DEM data are downloaded from The Earth Science Data Systems (https://earthdata.nasa.gov, 6 May 2022) with a spatial resolution of 12.5 m, and the DEM data were filled with depressions to eliminate abnormal elevation values. The ETM data come from The Earth Science Data Systems (https://earthdata.nasa.gov, 6 May 2022), satellite image taken on 30 September 2021 with a resolution of 30 m. The image data is clear with low cloudiness. Supervised land classification of ETM data with the help of ENVI 5.3 software after pre-processing include radiometric calibration, atmospheric correction, geometric correction, etc. Meteorological precipitation data come from the Henan Provincial Meteorological Bureau.
Spatial accessibility data for public service emergency response include urban road networks, fire stations, and hospital distribution. The urban road network data are taken from the OpenStreetMap website (https://www.openhistoricalmap.org, 18 May 2022), excluding roads with poor or impassable vehicle access, such as internal community roads, urban trails and laneways, highways, trunk and subsidiary roads, as well as correcting the urban road network data with reference to the latest road maps. Referring to the “Technical Standards for Highway Engineering of the People’s Republic of China (JTG B01-2003)” and the impact of urban pluvial flooding on the speed of traffic, the maximum speed limit of roads is set according to the type of road as follows: 60 km/h for highways, 45 km/h for trunk roads, and 30 km/h for subsidiary roads.
Major urban emergency rescues include emergency response agencies and public services. Fire and medical services have become important rescue forces in urban emergency response. The fire service is a militarized standing rescue team under the direct leadership of the government. It has the advantages and characteristics of being well organized, densely distributed, fast acting, and experienced in rescue compared to other rescue forces. In case of emergency tasks, the government can directly and quickly mobilize them, and they can rush to the scene at the fastest speed to win valuable time for all types of rescue work in the city. Medical services are able to treat sick or injured people to reduce casualties. Public general hospitals are in a leading position in terms of medical technology. Therefore, hospitals and fire stations, the two most critical public services for an emergency response to urban flooding, were chosen as the objectives of this paper. Hospitals are retained as general hospitals of level two or above, and the fire services selected are the city (district) fire rescue brigades. Fire stations and hospital distribution data are obtained from the Baidu map API and checked manually, and then the BD-09 coordinate system of Baidu is transformed into the WGS-84 coordinate system through QGIS 3.14.16 software.

2.3. Urban Pluvial Flooding Simulation

2.3.1. Rainfall Calculation

The Pearson-Type III distribution model was used to calculate the precipitation information for 100a, 200a, and 1000a recurrence periods, and the data was obtained from the annual one-day maximum precipitation for the last 30 years (1992–2021) in the Jiaozuo urban area. The Pearson-Type III curve equation is:
y = β α Γ ( α ) ( x α 0 ) α 1 e β ( x α 0 )   α > 0 , α 0 < x <
where α = 4 / c s 2 ; β = 2 / ( x c v c s ) ; α 0 = x ( 1 2 c v c s ) ; c v is coefficient of variation; c s is deviation coefficient; x is mean; Γ ( α ) is complete gamma function; Γ ( α ) = 0 x α 1 e x d x .
Integration of Equation (1) yields a cumulative frequency equal to or greater than x p :
p = β α Γ ( α ) x p ( x α 0 ) α 1 e β ( x α 0 ) d x   α > 0 , α 0 < x <
Let t = β ( x a 0 ) , Equation (2) changes to:
p = 1 1 Γ ( α ) x p t p t α 1 e t d x   t 0 , α > 0
In order to avoid problems, such as the slow convergence of the algorithm, the loss of effective numbers and the distortion of results, the divisional integration method is used to transform Equation (3) into Equation (4):
p = 1 1 α Γ ( α ) e t p t p α 1 α Γ ( α ) 0 t p t α e t d t
The detailed procedure of this algorithm can be referenced in the literature [28].

2.3.2. The Soil Conservation Service-Curve Number (SCS–CN) Model

The SCS-CN model is a small-scale surface runoff model developed by the former USDA Soil Conservation Service in the 1950s [29]. The model considers the influence of subsurface conditions on runoff, with a simpler structure, fewer parameters required, higher simulation accuracy, and can be used in areas without information. It is widely used in many fields, such as rainfall surface runoff prediction, municipal planning, soil and water conservation, and flood simulation domestically and overseas [30,31].
The basic principle of the SCS-CN model is based on the water balance approach and two proportional assumptions in which the ratio of infiltration to potential maximum retention is equal to the ratio of actual runoff to potential maximum runoff, as equated by
P = F + Q + I a
F S = Q P I a
I a = λ S
where P is the rainfall (mm); F is the actual infiltration (mm); I a is the initial loss volume (mm); Q is the actual runoff volume (mm); S is the potential maximum retention volume (mm); λ is the initial loss coefficient, which is often taken as 0.2. Finally, the equation of productivity flow is obtained:
{ Q = ( P 0.2 S ) ^ 2 / ( P + 0.8 S )   ( P λ S ) Q = 0   ( P < λ S )  
The potential maximum retention S is a variable, which is used to reflect the storage capacity of the study area, and the magnitude of change is large and inconvenient to take, so a dimensionless parameter C N (runoff curve number) is introduced to obtain S . The conversion relationship between S and C N values is shown in the following equation:
S = 25 , 400 / C N 254
Runoff curve number C N is a comprehensive parameter that accurately reflects the relationship between runoff before rainfall, and its value is related to topography, geology, vegetation, slope, soil type, wetness, etc. The larger the C N value, the higher surface flow production capacity and the smaller surface water storage in the study area [32]. The SCS-CN model provides four groups of soil types with different flow-producing capacities (Table 2). The soil types of the Jiaozuo urban area are mainly tidal and brown soils with sandy-clay loam soil texture and moderate permeability, corresponding to group C C N values [33,34].
The influence of urban drainage systems on runoff should be considered in the calculation of total waterlogging. According to the Outdoor Drainage Design Code GB50014-2006 (2016 version) and the actual situation of Jiaozuo, the actual flooding capacity of the urban drainage network in Jiaozuo is set to 35 mm/h, and the spatial distribution and drainage capacity of the drainage network in the study area are assumed to be the same. The formula for calculating the total amount of internal flooding is
W = ( Q V ) × S
where W is the volume of waterlogging (m3); Q is the surface runoff volume (mm); V is the drainage volume (mm/h) and S is the catchment area (m2).

2.3.3. GIS Locality Volume Equation Method

The locality volume equation method is based on the equal volume method that divides the study area into several catchment areas, only considers the obstructive effect of urban topography on surface runoff, performs equal volume calculations for each catchment area separately, simulates the inundation range and inundation depth of each area with the help of GIS spatial analysis, and, finally, combines all catchment areas [35]. This method treats urban pluvial flooding as a passive inundation state without considering the surface confluence process and the connectivity of the inundation area, where all points with elevations below a given water level are counted as inundation areas [34].
The basic principle of the equal volume method is that the total amount of runoff at a given time step is equal to the total amount of inundation at that time step [36]. The calculation formula is as below
W = A   [ E w ( x , y ) E g ( x , y ) ] d δ
where W is the total accumulated water in the flooded area; A is the flooded areas. E w ( x , y ) is the accumulated water surface elevation. E g ( x , y ) is the ground elevation. d δ is the unit flooded area.
Considering the slow rate of urban waterlogging, the water surface is approximately simplified to a plane, and the ground elevation is expressed by DEM data, which simplifies Equation (11) to Equation (12)
W = i = 1 N [ E w E g ( i ) ] Δ δ
where N is total number of grids in the flooded area.   Δ δ is the cell grid area.   E g ( i ) is the elevation of the i -th grid. E w indicates waterlogged elevation values. Solving for E w using the dichotomous idea [37].

2.4. Emergency Response Analysis

Under the urban pluvial flooding disaster scenario, it is possible to submerge the exhaust pipe when the road water reaches 30 cm (the general vehicle exhaust port height from the ground is about 25~35 cm, which is also the standard for some cities of closing the road), and vehicles cannot pass safely or are prohibited from passing, leading to the emergency response service not being able to reach the road or delaying reaching the road. Consequently, the spatial accessibility and service scope of road network becomes the most significant influencing factor of the emergency response capability of urban public service agencies [22]. The fastest route calculation based on GIS network analysis is adopted in this study without considering the constraints of urban traffic rules, and the road water depth of 30 cm (medical) and 50 cm (fire) are taken as the upper limit of vehicle traffic. Referring to the ‘Code for transport planning on urban road (GB50220-95)’ and the impact of flooding disasters on the speed of vehicles. It is assumed that the speed of vehicles is consistent at different time periods, and the driving speed limit is set according to the road grade: 60 km/h for highways, 45 km/h for trunk roads, and 30 km/h for subsidiary roads. The spatial coverage of 5 min, 10 min, 15 min and inaccessibility to medical emergencies and fire rescue under 100-year, 200-year, and1000-year three kinds of pluvial flooding return periods are calculated, respectively.

3. Results and Analysis

3.1. Pluvial Flood Inundation Analysis

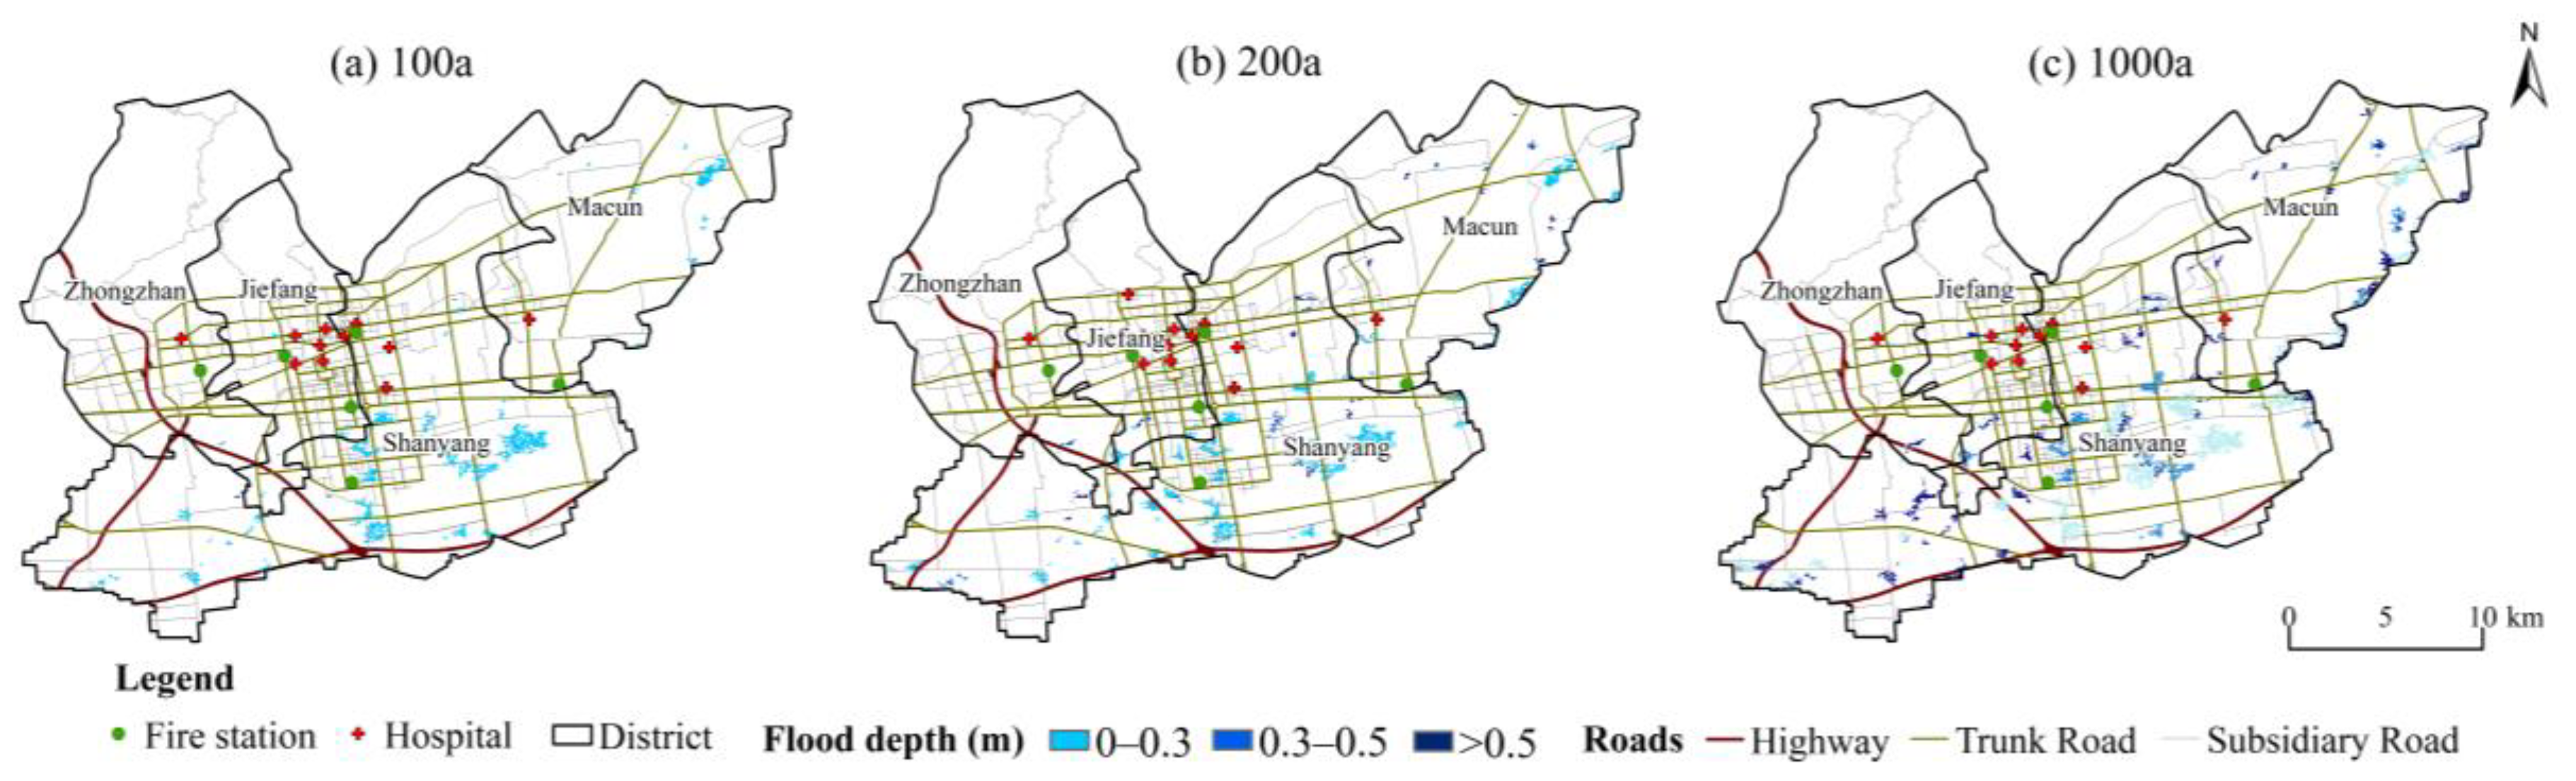
The results of the urban pluvial flooding simulation are displayed in Figure 3. Under the once-in-100a pluvial flooding scenario, the inundation area with a water depth of less than 30 cm is 7.03 km2, accounting for the 1.307% of the total area of the study area, mainly in the southwestern part of Shanyang District. The inundation area with a water depth of 30–50 cm is0.13 km2 (accounting for 0.024%), and only has a 0.09 km2 area with a water depth of more than 50 cm, accounting for 0.0016%. From the length of road inundation, the length of the road with less than 30 cm water depth is 14.6 km, accounting for 1.64% of the total road length in the study area. The length of the road with 30–50 cm and more than 50 cm water depth is 0.38 km and 0.2 km, respectively. As for the type of road inundation, the inundation lengths of the highway, the urban trunk road, and the subsidiary road are 0.71 km, 8.22 km, and 21.15 km, respectively. Nevertheless, in the once-in-100a pluvial flooding scenario, the inundation range is relatively small and the depth of water in most areas (road sections) is below 30 cm, which has less impact on the accessibility of urban emergency response.
Under the once-in-200a pluvial flooding scenario, the inundated area with a water depth of less than 30 cm increases to 9.33 km2, accounting for 1.736% of the total study area, largely distributed in the central and southern part of Shanyang District and the northeastern part of Macun District. The inundated area with 30–50 cm water depth is 0.46 km2; the spot distribution in the western and central part of Shanyang District, the northern part of Macun District, and the area of water depth of over 50 cm is 1.42 km2, mainly concentrated in Shanyang District and Macun District. The lengths of the road with water depth below 30 cm, 30–50 cm, and over 50 cm are 21.48 km, 0.6 km, and 2.57 km, respectively. Maximum length of inundation on the trunk road(13.3 km). The inundated roads began to spread along Yingbin Road and Zhongyuan Road to the north of the city compared to the one in 100a recurrence period.
Under the once-in-1000a pluvial flooding scenario. The inundation region with a water depth of less than 30 cm is mainly located in the south of Shanyang District with an area of 10.68 km2. The inundation area with a water depth of 30–50 cm is 4.59 km2, mainly located on both sides of Zhongyuan Road, the east section of Century Road, and the west area of the middle section of Yingbin Road in Shanyang District. The inundation area with a water depth of over 50 cm is 5.84 km2, concentrated in the northeast of Macun District and the west of Shanyang District. The length of inundation roads was significantly higher compared to the ones in 100a and 200a pluvial flooding scenarios.
Roads with a depth of less than 30 cm are 16.27 km, accounting for 1.83%, the length of road with a submerged depth of 30–50 cm is 10.71 km., and the length of road with water depth greater than 50 cm reaches 10.61 km. Among them, the highway inundation length is 3.53 km, the trunk road inundation length is 21.15 km and the subsidiary road inundation length is 12.91 km. The inundated sections are mainly located in the south of the city, with deep water in the south section of South Democracy Road, the east section of Century Road, the south section of Zhongyuan Road, the east section of Fengcai Road, the east section of Nanyang Road, and the intersection of Zhongyuan Road and Renmin Road, which have a greater impact on the traffic accessibility in the south of the city.
In conclusion, the flooded areas of the Jiaozuo urban area are located in relatively low-lying and poorly drained areas. The inundation scope and depth of flooding show an overall decreasing trend from southeast to northwest, which is related to the overall topography of the Jiaozuo urban area with a high north, a low south, a high west and a low east. The inundation area of water depths are less than 30 cm, 30–50 cm, and more than 50 cm, also, the inundation length of the road in general gradually increased with the increase of the pluvial flood recurrence period, and the inundation range began to gradually extend from the southern part of the urban area to the northern part.

3.2. Medical Service Accessibility Analysis

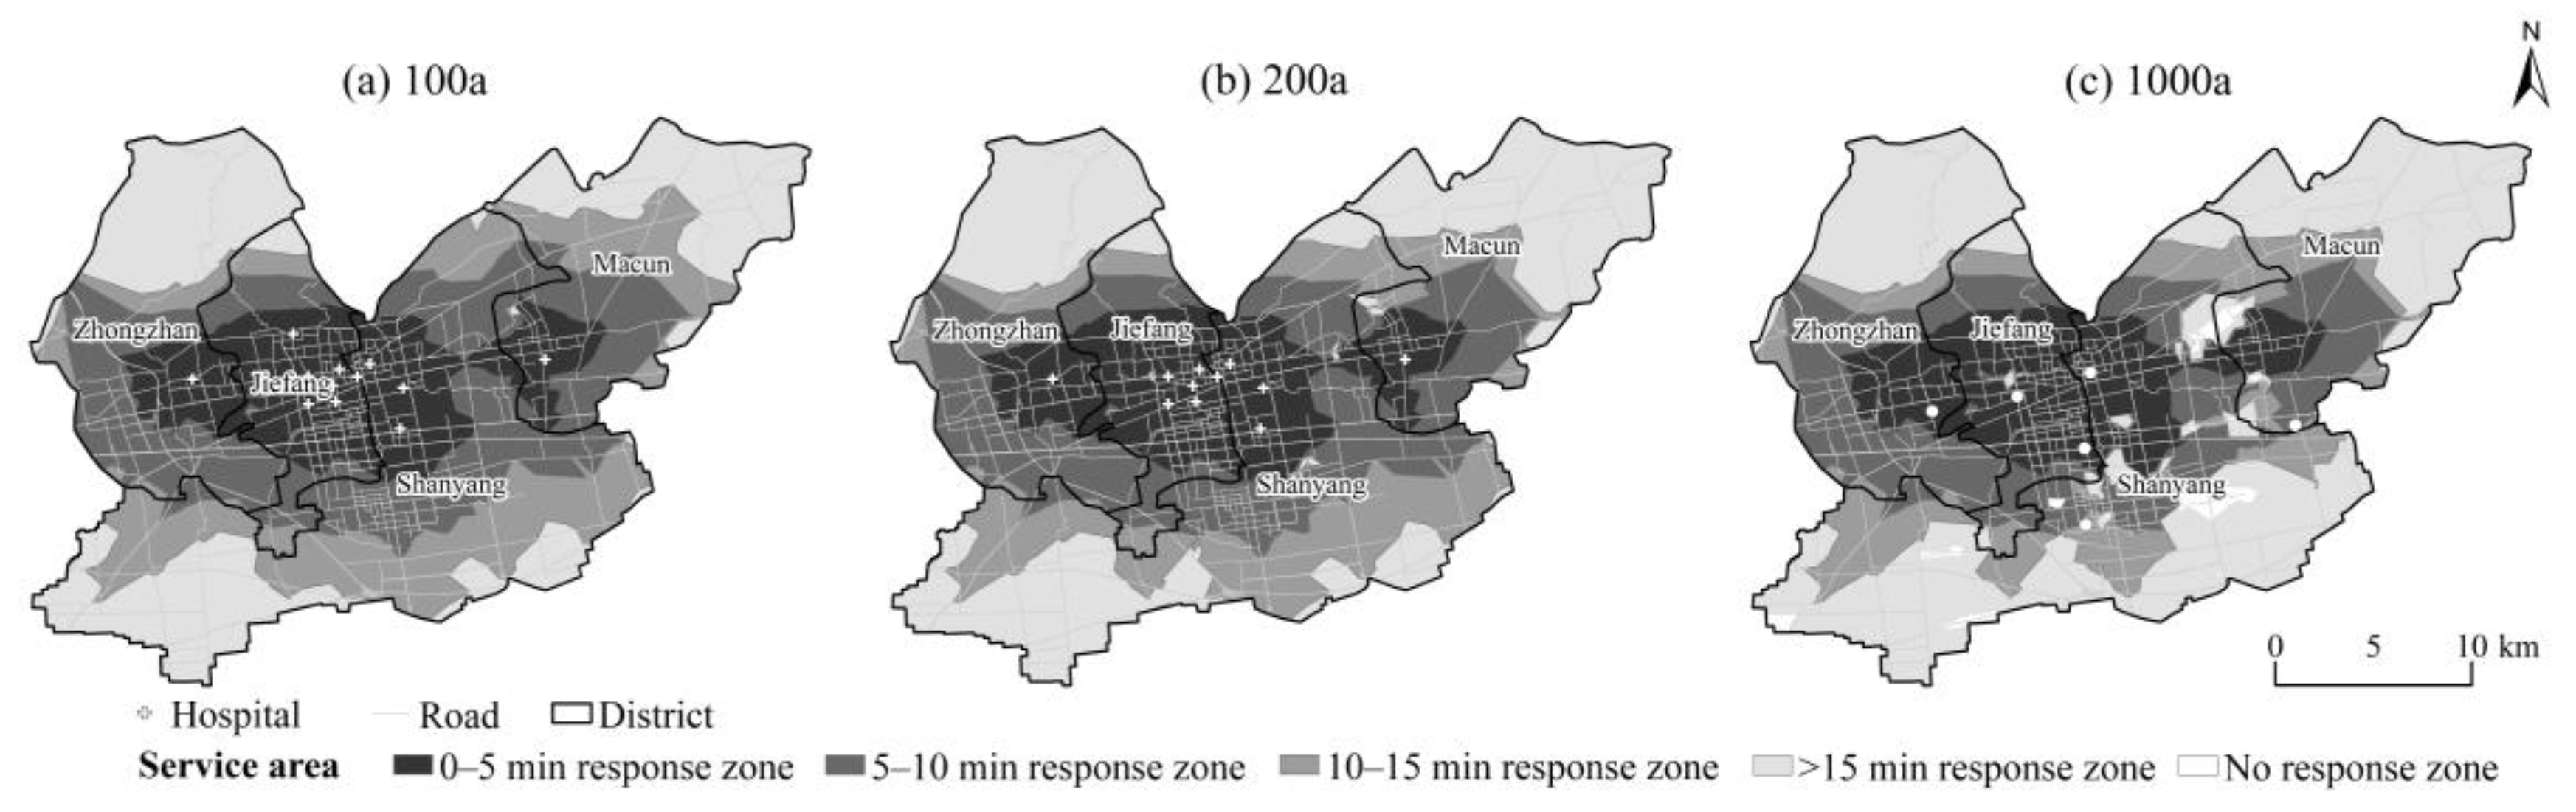
The hospitals with emergency response capability in the Jiaozuo urban area are concentrated in Jiefang District and the northern part of Shanyang District, and there are no hospitals in the inundation zone under three kinds of pluvial flooding scenarios. In general, the accessibility of medical emergency response showed a decreasing trend from the center to the periphery (Figure 4). Under the once-in-100a pluvial flooding scenario, medical rescue vehicles can reach 19.88% of the urban area in 5 min, 48.2% of the area in 10 min, and 70.69% of the area in 15 min. A total of 29.28% of the area cannot receive medical emergency services in 15 min, and the unreachable site is only 0.03%, which has a negligible impact on the reachability of the medical emergency response.
Under the once-in-200a pluvial flood scenario, the 5 min medical emergency response range has little change compared to the 100a pluvial flooding scenario, which can reach 19.69% of the urban area. A total of 45.68% of the urban area can be reached in 10 min, and 66.06% of the urban area in 15 min, which reduces significantly compared to the once-in-100a pluvial flooding scenario. Moreover, 33.88% of the area cannot access medical emergency services within 15 min, and 0.06% of the area was seriously affected by floods and could not obtain medical emergency services. From the spatial distribution, compared to the 100a pluvial flooding scenario, the 10 min, and 15 min of medical emergency response service decreased in areas mainly in northeastern Shanyang District and central Macun District.
Under the once-in-1000a pluvial flooding scenario, the road network interruption caused by floods in the south and northeast of the city has a great impact on medical emergency services. The 5 min, 10 min, and 15 min medical emergency response service areas were reduced to different degrees compared with the 100a and 200a pluvial flooding scenarios. Specifically, the coverage of 5 min 10 min, and 15 min decreased to 18.06%, 40.29%, and 56.08% of the urban area, respectively. A total of 42.10% of the urban area, cannot obtain medical emergency service within 15 min; this area is mainly located in the southwest of Shanyang District. In addition, 1.82% of the urban area is inaccessible to medical emergency services; this area is mainly located at the intersection of Zhongyuan Road and Century Road and the northeast area of Zhongyuan Road and Jiaohui Road.
In summary, the 5 min emergency response coverage area of medical institutions has not decreased significantly with the increase of the pluvial flooding recurrence period, mainly because the medical institutions are located in the urban center (Figure 3), the terrain in this area is relatively high and is barely impacted by pluvial flooding. The 10 min and 15 min medical emergency response service areas gradually decreased with the increase of the pluvial flooding recurrence period. In addition, conversely, the area beyond the reach of5 min gradually increased. The reason is that the inundation scope, inundation depth, and inundation length of water roads increased with the increase of the pluvial recurrence period, which decreases the medical emergency response coverage area. A high level of spatial accessibility and timeliness of medical services are needed to ensure the safety of urban residents. The distribution characteristics of the emergency response service capacity in the Jiaozuo urban area is high in the middle and low around under the heavy rainfall scenario, and the spatial accessibility of medical emergency services for 10 min and 15 min gradually shrink toward the center as the pluvial flooding recurrence period increases. On one hand, affected by the terrain of Jiaozuo (high in the north and west, low in the south and east), the southwest and northeast of the city were seriously flooded under the pluvial flooding scenarios, especially under the pluvial flooding scenario of 1000a return period (Figure 4). On the other hand, the northern part of the Jiaozuo urban area is a low hilly area, similar to the northern part of Zhongzhan District and the northeastern part of Macun District, where the network of urban trunk and secondary roads is very sparse and susceptible to flooding compared to the central area.

3.3. Fire Rescue Accessibility Analysis

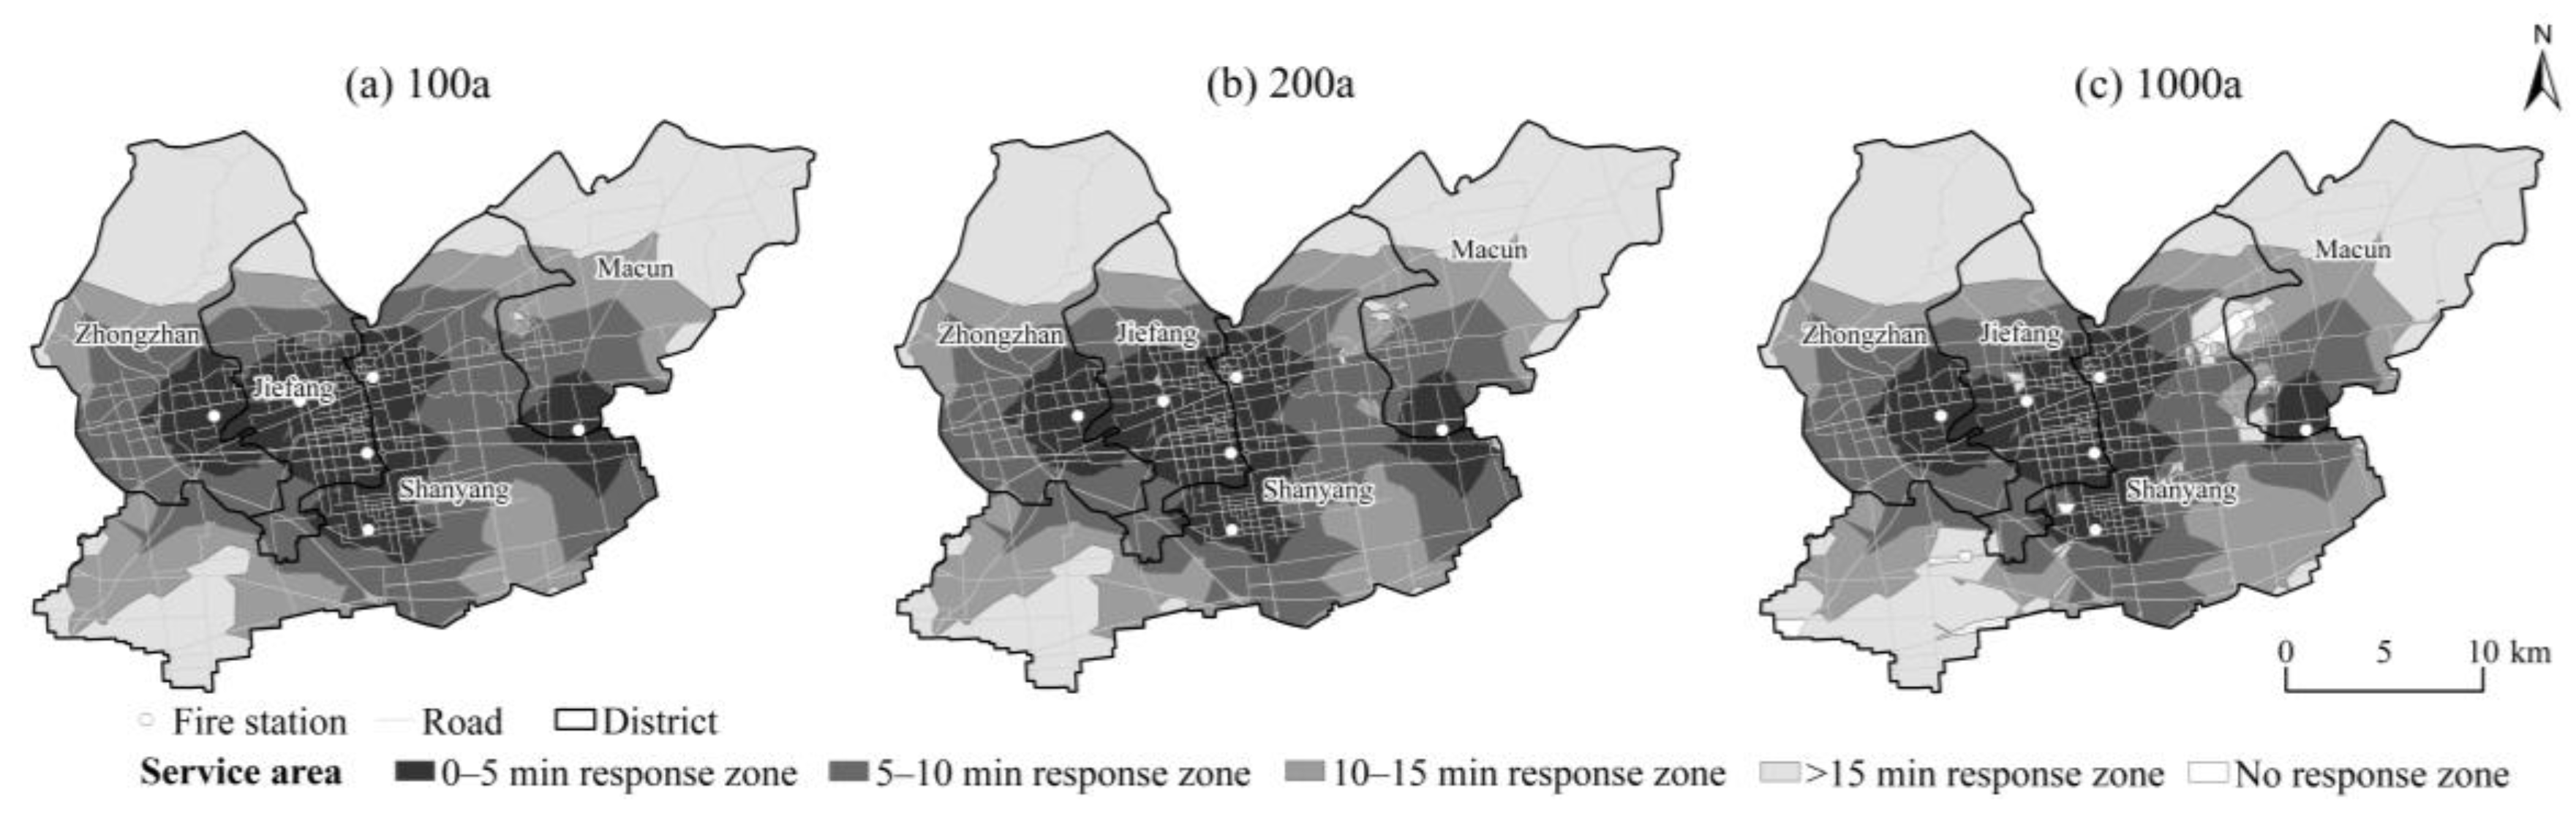
The spatial distribution of the fire rescue emergency response service scope of the Jiaozuo urban area (Figure 5) is roughly similar to the spatial distribution of the medical emergency response, which shows a trend of decreasing public service institutions (medical and fire) from the center outward. China’s fire regulations stipulate that there are 15 min of fire time, and more than 15 min may lead to increased disaster losses and casualties.
Under the once-in-100a pluvial flooding scenario, 5 min of fire rescue emergency response covers 19.65% of the Jiaozuo urban area. The 10 min and 15 min fire rescue emergency responses cover 49.73% and 70.06% of the region, respectively, and 29.39% of the districts received fire rescue services for more than 15 min.
For the once-in-200a pluvial flooding scenario, 5 min, 10 min, and 15 min fire rescue emergency responses cover 19.08%, 48.18%, and 69.51% of the Jiaozuo urban area, respectively. A total of 30.44% of the regions received fire rescue service for more than 15 min. In addition, the fire rescue service is not available in 0.05% of the area. Compared with the 100a pluvial flooding scenario, the fire rescue service scope of 5 min, 10 min, and 15 min is reduced, and the reduced area is mainly located in the northeast of Zhongyuan Road and Jiefang East Road.
Under the once-in-1000a pluvial flooding scenario, the range of 5 min, 10 min, and 15 min fire rescue emergency response coverage continues to shrink, covering an area of 16.93%, 43.66%, and 65.11%, respectively. A total of 33.82% of the area cannot receive fire rescue service within 15 min, and the unreachable area increased to 1.06%, which is mainly concentrated in the northeast area of Zhongyuan Road and Jiaohui Road and the west of Qinquan Lake Park. Compared to the 100a and 200a recurrence periods, the reduction in fire emergency response coverage is mainly concentrated in the eastern and southwestern parts of Shanyang District and the southwestern part of Macun District, while there is less change in other regions.

3.4. Emergency Measures

The emergency response capacity of medical and fire rescue agencies decreases gradually along the location of the agency to the surrounding area (Figure 4 and Figure 5), indicating that the layout of public services plays an important role in emergency response. Therefore, the government management needs to rationalize the layout of emergency response departments and public service agencies in Jiaozuo, especially to increase the layout of the Shanyang district in the south of the Jiaozuo urban area, with the main purpose of improving the emergency response capacity of public service agencies. The main reason is that the Jiaozuo urban area has developed to the south and the Shanyang district carries more industries and population transfer as well as economic development momentum. Because of the serious impact of flooding on the emergency response capability of public service facilities, Jiaozuo municipal departments should focus on the southwest and northeast areas of the Jiaozuo urban area and take scientific and reasonable measures to construct urban pipe networks, flood discharge channels, flood prevention projects, etc. City emergency management departments should take effective measures to ensure the accessibility of key nodes of the road network and the accessibility of public emergency services. Emergency management and public service departments should first be equipped with a few special vehicles and other rescue equipment (e.g., hovercraft) with good waterproofing or wading performance, which can ensure that emergency rescue tasks can be completed in deep water, and also stockpile high-powered drainage equipment to drain critical waterlogged roads in time to ensure smooth road access. Secondly, they should stockpile high-powered drainage equipment to drain key waterlogged sections in time to ensure the smooth flow of roads. Finally, in order to further enhance the spatial accessibility of the city’s public emergency services they should, on the one hand, improve the city’s intelligent traffic real-time early warning system to provide navigation for emergency rescue vehicles, and on the other hand, accurately obtain information on the implementation of traffic status and water distribution, so as to avoid emergency rescue vehicles mistakenly entering heavily congested or deeply waterlogged road sections resulting in interruptions or delays in rescue.

4. Discussion

4.1. Impact of Flooding on the Accessibility of Public Services

In this study, three different re-occurrence periods of pluvial flooding scenarios were simulated using the annual one-day maximum precipitation data of the Jiaozuo urban area over the past three decades, and the spatial accessibility of medical emergency and fire rescue services in the Jiaozuo urban area was measured. The intensity of the flooding, the condition of the road network, and the location and number of emergency services together determine the scope and response time of medical emergency and fire rescue services in the Jiaozuo urban area under flooding scenarios. In general, the spatial accessibility of medical emergency and fire rescue services tends to decrease from the urban center to the periphery. The flooded areas are mainly located in the northeastern and southern parts of the city, and the emergency response agencies are located outside the flooded areas. The flooding has a large impact on the urban road network, and the accessibility of public services in the northeastern and southern parts of the city deteriorate as the return period increases.

4.2. Comparison of the Results with Other Studies

Chen, Yang, and Ma used a combination of SCS-CN and GIS to simulate flood inundation in a watershed within the city of Wuhan, China [34]. Chen, Li, Du et al. simulated urban flooding in Wuhan, China under different return periods by combining the storm intensity equation and the SCS-CN model [38]. These studies all use the storm intensity formula to calculate rainfall for different return periods. The accuracy of the data is low because the storm intensity formulae often do not objectively reflect the current extreme precipitation conditions due to the short time span of the meteorological data used or the untimely revision. This study uses the Pearson-Type III distribution model to calculate rainfall based on the annual maximum daily precipitation information about the last 30 years, which can improve the accuracy of flood simulation. In turn, it can improve the reliability of the spatial accessibility assessment of emergency response services.

4.3. Limitation of the Proposed Method

Although the combination of the SCS-CN hydrological model and GIS spatial analysis used in the study has powerful advantages that make it better suited to the spatial accessibility of public emergency services in areas without adequate information, certain limitations still remain. For example, the study only considers urban storm flooding and does not address river flooding, which may cause more severe urban flooding when river flooding and storm flooding are combined in the event of widespread extreme precipitation. Moreover, there is a need to consider that urban road traffic flows have significant spatial and temporal variations, such as peak commuter traffic flow scenarios. Extreme precipitation may also increase traffic congestion and, thus, affect road accessibility and the response time of public emergency services.

5. Conclusions

The inundation extent and depth of different pluvial flooding scenarios in the Jiaozuo urban area were simulated based on SCS-CN and GIS spatial analysis methods, and the emergency response capabilities of medical and fire rescue agencies under different pluvial flooding scenarios were evaluated. The results show that: (1) The inundation scope under the three pluvial flood scenarios is mainly distributed in the southwest and northeast of the Jiaozuo urban area, and the inundation coverage and depth are increase with the increase of the storm recurrence period. (2) The coverage of medical and fire rescue emergency response for 5 min, 10 min, and 15 min gradually decreases with the increase of rainfall recurrence period, and the areas that cannot be reached by 15 min gradually increases; these areas are mainly located in the north of Zhongzhan District, southwest of Shanyang District and northeast of Macun District. (3) The emergency response capacity of medical and fire rescue agencies in the Jiaozuo urban area shows a general trend of decreasing from the center to the periphery. The emergency response capability of individual public service organizations shows a trend of gradual decay from the location of the organization to the periphery. The research methodology can be used as a reference for cities affected by flooding and the research results could provide support for flood prevention and mitigation, flood emergency response decisions, and the scientific layout of public emergency service agencies in the Jiaozuo urban area.
In general, this study measures the spatial accessibility of medical emergency and fire rescue services in the Jiaozuo urban area based on flooding scenarios and makes important recommendations for optimizing the spatial configuration of public emergency services. In addition, the research methodology used in this paper can serve as an important reference for measuring the accessibility of public services in other cities without sufficient research data. In the future, the next step will be an in-depth study in the following aspects: (1) The strengthening of the study of urban flooding scenarios in the context of superimposed pluvial floods and fluvial floods, not only considering the depth and extent of inundation but also incorporating the effects of flood duration and water velocity into the flood risk study. (2) The introduction of urban traffic data combined with real-time precipitation forecasts and warnings, while taking into account the impact of precipitation, surface flooding, and traffic congestion on the capacity of emergency service vehicles, which can effectively improve the objectivity of road accessibility metrics. (3) Under the condition of fully considering the matching of supply and demand and road accessibility, the emergency response capacity of public service institutions will be scientifically evaluated by introducing emergency service capacity data of public service institutions, such as medical and fire services.

Author Contributions

Conceptualization, Y.Z., X.L. and N.K.; Data curation, X.L., M.Z. and X.Z.; Formal analysis, Y.Z. and X.L.; Funding acquisition, Y.Z.; Methodology, X.L. and M.Z.; Software, X.L. and M.Z.; Supervision, Y.Z. and N.K.; Validation, Y.Z., N.K. and X.Z.; Visualization, X.L. and X.Z.; Writing—original draft, X.L.; Writing—review & editing, Y.Z., X.L. and N.K. All authors have read and agreed to the published version of the manuscript.

Funding

(1) National Natural Science Foundation of China: U1904210. (2) National Social Science Foundation of China: 20BDJ030. (3) the Philosophy and Social Science Innovation Team of Colleges in Henan Province: 2023-CXTD-06.

Institutional Review Board Statement

Not applicable.

Informed Consent Statement

Not applicable.

Data Availability Statement

Not applicable.

Conflicts of Interest

The authors declare no conflict of interest.

References

  1. Silva, L.B.L.d.; Humberto, J.S.; Alencar, M.H.; Ferreira, R.J.P.; de Almeida, A.T. GIS-based multidimensional decision model for enhancing flood risk prioritization in urban areas. Int. J. Disaster Risk Reduct. 2020, 48, 15. [Google Scholar] [CrossRef]
  2. Lwin, K.K.; Pal, I.; Shrestha, S.; Warnitchai, P. Assessing social resilience of flood-vulnerable communities in Ayeyarwady Delta, Myanmar. Int. J. Disaster Risk Reduct. 2020, 51, 10. [Google Scholar] [CrossRef]
  3. Zhang, Y.L.; You, W.J. Social vulnerability to floods: A case study of Huaihe River Basin. Nat. Hazards 2014, 71, 2113–2125. [Google Scholar] [CrossRef]
  4. Chen, P.; Zhang, J.Q.; Sun, Y.Y. Research on Emergency Rescue of Urban Flood Disaster Based on Wargame Simulation. J. Indian Soc. Remote Sens. 2018, 46, 1677–1687. [Google Scholar] [CrossRef] [Green Version]
  5. Zachos, L.G.; Swann, C.T.; Altinakar, M.S.; McGrath, M.Z.; Thomas, D. Flood vulnerability indices and emergency management planning in the Yazoo Basin, Mississippi. Int. J. Disaster Risk Reduct. 2016, 18, 89–99. [Google Scholar] [CrossRef]
  6. Jha, A.K.; Bloch, R.; Lamond, J. Cities and Flooding: A Guide to Integrated Urban Flood Risk Management for the 21st Century; World Bank Publications: Washington, DC, USA, 2012. [Google Scholar]
  7. Yin, J.; Ye, M.W.; Yin, Z.; Xu, S.Y. A review of advances in urban flood risk analysis over China. Stoch. Environ. Res. Risk Assess. 2015, 29, 1063–1070. [Google Scholar] [CrossRef]
  8. Chen, Z.Y.; Kong, F.; Zhang, M. A Case Study of the “7–20” Extreme Rainfall and Flooding Event in Zhengzhou, Henan Province, China from the Perspective of Fragmentation. Water 2022, 14, 2970. [Google Scholar] [CrossRef]
  9. Yang, H.Y.; Chen, G.; Chong, Y.; Jin, J.C.; Shi, W. Quantitative Prediction of Outburst Flood Hazard of the Zhouqu “8.8” Debris Flow-Barrier Dam in Western China. Water 2021, 13, 639. [Google Scholar] [CrossRef]
  10. Yang, H.; Zhao, L.S.; Chen, J. Metro System Inundation in Zhengzhou, Henan Province, China. Sustainability 2022, 14, 9292. [Google Scholar] [CrossRef]
  11. IPCC. Climate Change 2013: The Physical Science Basis; Cambridge University Press: Cambridge, UK, 2013. [Google Scholar]
  12. IPCC. Climate Change 2021: The Physical Science Basis; Cambridge University Press: Cambridge, UK, 2021. [Google Scholar]
  13. Lu, X.; Chan, F.K.S.; Chen, W.-Q.; Chan, H.K.; Gu, X. An overview of flood-induced transport disruptions on urban streets and roads in Chinese megacities: Lessons and future agendas. J. Environ. Manag. 2022, 321. [Google Scholar] [CrossRef]
  14. Green, D.; Yu, D.P.; Pattison, I.; Wilby, R.; Bosher, L.; Patel, R.; Thompson, P.; Trowell, K.; Draycon, J.; Halse, M.; et al. City-scale accessibility of emergency responders operating during flood events. Nat. Hazards Earth Syst. Sci. 2017, 17, 1–16. [Google Scholar] [CrossRef] [Green Version]
  15. Yin, J.; Yu, D.P.; Lin, N.; Wilby, R.L. Evaluating the cascading impacts of sea level rise and coastal flooding on emergency response spatial accessibility in Lower Manhattan, New York City. J. Hydrol. 2017, 555, 648–658. [Google Scholar] [CrossRef] [Green Version]
  16. Gu, X.K.; Zhang, L.F.; Tao, S.Y.; Xie, B.M. Spatial Accessibility to Healthcare Services in Metropolitan Suburbs: The Case of Qingpu, Shanghai. Int. J. Environ. Res. Public Health 2019, 16, 225. [Google Scholar] [CrossRef] [PubMed] [Green Version]
  17. Chen, Y.H.; Li, Y.Y.; Wu, G.H.; Zhang, F.Y.; Zhu, K.X.; Xia, Z.L.; Chen, Y. Exploring Spatiotemporal Accessibility of Urban Fire Services Using Real-Time Travel Time. Int. J. Environ. Res. Public Health 2021, 18, 4200. [Google Scholar] [CrossRef]
  18. Yadav, N.; Chatterjee, S.; Ganguly, A.R. Resilience of Urban Transport Network-of-Networks under Intense Flood Hazards Exacerbated by Targeted Attacks. Sci. Rep. 2020, 10, 14. [Google Scholar] [CrossRef]
  19. Loreti, S.; Ser-Giacomi, E.; Zischg, A.; Keiler, M.; Barthelemy, M. Local impacts on road networks and access to critical locations during extreme floods. Sci. Rep. 2022, 12, 15. [Google Scholar] [CrossRef]
  20. Zhu, L.; Gong, Y.M.; Xu, Y.S.; Gu, J. Emergency relief routing models for injured victims considering equity and priority. Ann. Oper. Res. 2019, 283, 1573–1606. [Google Scholar] [CrossRef]
  21. Alabbad, Y.; Mount, J.; Campbell, A.M.; Demir, I. Assessment of transportation system disruption and accessibility to critical amenities during flooding: Iowa case study. Sci. Total Environ. 2021, 793. [Google Scholar] [CrossRef]
  22. Yang, Y.; Yin, J.; Ye, M.; She, D.; Yu, J. Multi-coverage optimal location model for emergency medical service (EMS) facilities under various disaster scenarios: A case study of urban fluvial floods in the Minhang district of Shanghai, China. Nat. Hazards Earth Syst. Sci. 2020, 20, 181–195. [Google Scholar] [CrossRef] [Green Version]
  23. Tahvildari, N.; Aad, M.A.; Sahu, A.; Shen, Y.W.; Morsy, M.; Murray-Tuite, P.; Goodall, J.L.; Heaslip, K.; Cetin, M. Quantification of Compound Flooding over Roadway Network during Extreme Events for Planning Emergency Operations. Nat. Hazards Rev. 2022, 23, 18. [Google Scholar] [CrossRef]
  24. Coles, D.; Yu, D.P.; Wilby, R.L.; Green, D.; Herring, Z. Beyond ‘flood hotspots’: Modelling emergency service accessibility during flooding in York, UK. J. Hydrol. 2017, 546, 419–436. [Google Scholar] [CrossRef] [Green Version]
  25. Yin, J.; Jing, Y.; Yu, D.; Ye, M.; Yang, Y.; Liao, B. A Vulnerability Assessment of Urban Emergency in Schools of Shanghai. Sustainability 2019, 11, 349. [Google Scholar] [CrossRef] [Green Version]
  26. Yin, J.; Yu, D.P.; Yin, Z.; Liu, M.; He, Q. Evaluating the impact and risk of pluvial flash flood on intra-urban road network: A case study in the city center of Shanghai, China. J. Hydrol. 2016, 537, 138–145. [Google Scholar] [CrossRef] [Green Version]
  27. Mei, C.; Liu, J.; Wang, H.; Xiang, C.; Zhou, J. Review on urban design rainstorm. Chin. Sci. Bull. 2017, 62, 3873–3884. [Google Scholar] [CrossRef] [Green Version]
  28. Liu, J.Z.; Ma, X.G.; Fu, J.X.; Li, F.M.; Li, G.F. Rapid and convenient algorithm of P-Ⅲ distribution curve. J. Shenyang Inst. Archit. Eng. (Nat. Sci. ) 2004, 20, 60–62. [Google Scholar]
  29. Xiao, B.; Wang, Q.H.; Fan, J.; Han, F.P.; Dai, Q.H. Application of the SCS-CN Model to Runoff Estimation in a Small Watershed with High Spatial Heterogeneity. Pedosphere 2011, 21, 738–749. [Google Scholar] [CrossRef]
  30. Chaplot, V.A.M.; Le Bissonnais, Y. Runoff features for interrill erosion at different rainfall intensities, slope lengths, and gradients in an agricultural loessial hillslope. Soil Sci. Soc. Am. J. 2003, 67, 844–851. [Google Scholar] [CrossRef]
  31. Al-Ghobari, H.; Dewidar, A.; Alataway, A. Estimation of Surface Water Runoff for a Semi-Arid Area Using RS and GIS-Based SCS-CN Method. Water 2020, 12, 1924. [Google Scholar] [CrossRef]
  32. Yao, L.; Wei, W.; Yu, Y.; Xiao, J.; Chen, L. Rainfall-runoff risk characteristics of urban function zones in Beijing using the SCS-CN model. J. Geogr. Sci. 2018, 28, 656–668. [Google Scholar] [CrossRef]
  33. Wang, D.D.; Sheng, K.; Zhao, W.D.; Li, L.T.; Zhang, Q.; Wang, Y.L. Dominance of archaeal ammonia-oxidizers in soil nitrification across different soil types and fertilities in North China plain. Eur. J. Soil Biol. 2021, 106. [Google Scholar] [CrossRef]
  34. Chen, S.; Yang, S.M.; Ma, K. Simulation of Rainstorm Waterlogging Process in Urban Areas Based on Soil Conservation Service Model and Geographic Information System. J. Yangtze River Sci. Res. Inst. 2019, 36, 16–20. [Google Scholar]
  35. Xie, S.; Liu, W.; Yuan, Z.; Zhang, H.Y.; Lin, H.; Wang, Y.Q. Integrated Risk Assessment of Waterlogging in Guangzhou Based on Runoff Modeling, AHP, GIS and Scenario Analysis. Water 2022, 14, 2899. [Google Scholar] [CrossRef]
  36. Meng, X.; Zhang, M.; Wen, J.; Du, S.; Xu, H.; Wang, L.; Yang, Y. A Simple GIS-Based Model for Urban Rainstorm Inundation Simulation. Sustainability 2019, 11, 2830. [Google Scholar] [CrossRef] [Green Version]
  37. Wang, K.; Wu, Y.; Fan, Q.D. Construction of rainstorm security pattern based on waterlogging prevention and control: A case study on Zhengzhou City. Alex. Eng. J. 2022, 61, 8911–8918. [Google Scholar] [CrossRef]
  38. Chen, Z.; Li, K.; Du, J.; Chen, Y.; Liu, R.; Wang, Y. Three-dimensional simulation of regional urban waterlogging based on high-precision DEM model. Nat. Hazards 2021, 108, 2653–2677. [Google Scholar] [CrossRef]
Figure 1. Technology route map.
Sustainability 14 16332 g001
Figure 2. Schematic diagram of the study area.
Sustainability 14 16332 g002
Figure 3. Inundation simulation results for different pluvial flooding scenarios.
Sustainability 14 16332 g003
Figure 4. Spatial accessibility and service scope of emergency response for medical institutions.
Sustainability 14 16332 g004
Figure 5. Spatial accessibility and service scope of emergency response of fire rescue institutions.
Sustainability 14 16332 g005
Table 1. Urban Flood Simulation Data.
Category100a200a1000a
Rainfall (mm)83.1991.53110.9
Runoff volume (mm)35.6542.1157.84
Total waterlogging (104 m3)25.03 273.79 879.53
Average submerged elevation (m)79.4580.2880.96
Table 2. Comparison table of CN values for soil types.
Land Use TypeCN Values for Each Soil Group
ABCD
Industrial land37434749
Forest land25557077
Grassland30587178
Water98989898
Urban land72818588
Road76859494
Publisher’s Note: MDPI stays neutral with regard to jurisdictional claims in published maps and institutional affiliations.

