
Long-Term Nitrogen and Phosphorus Outflow from an Instream Constructed Wetland under Precipitation Variability
 ,
,  ,
,
Abstract
:1. Introduction
2. Data and Method
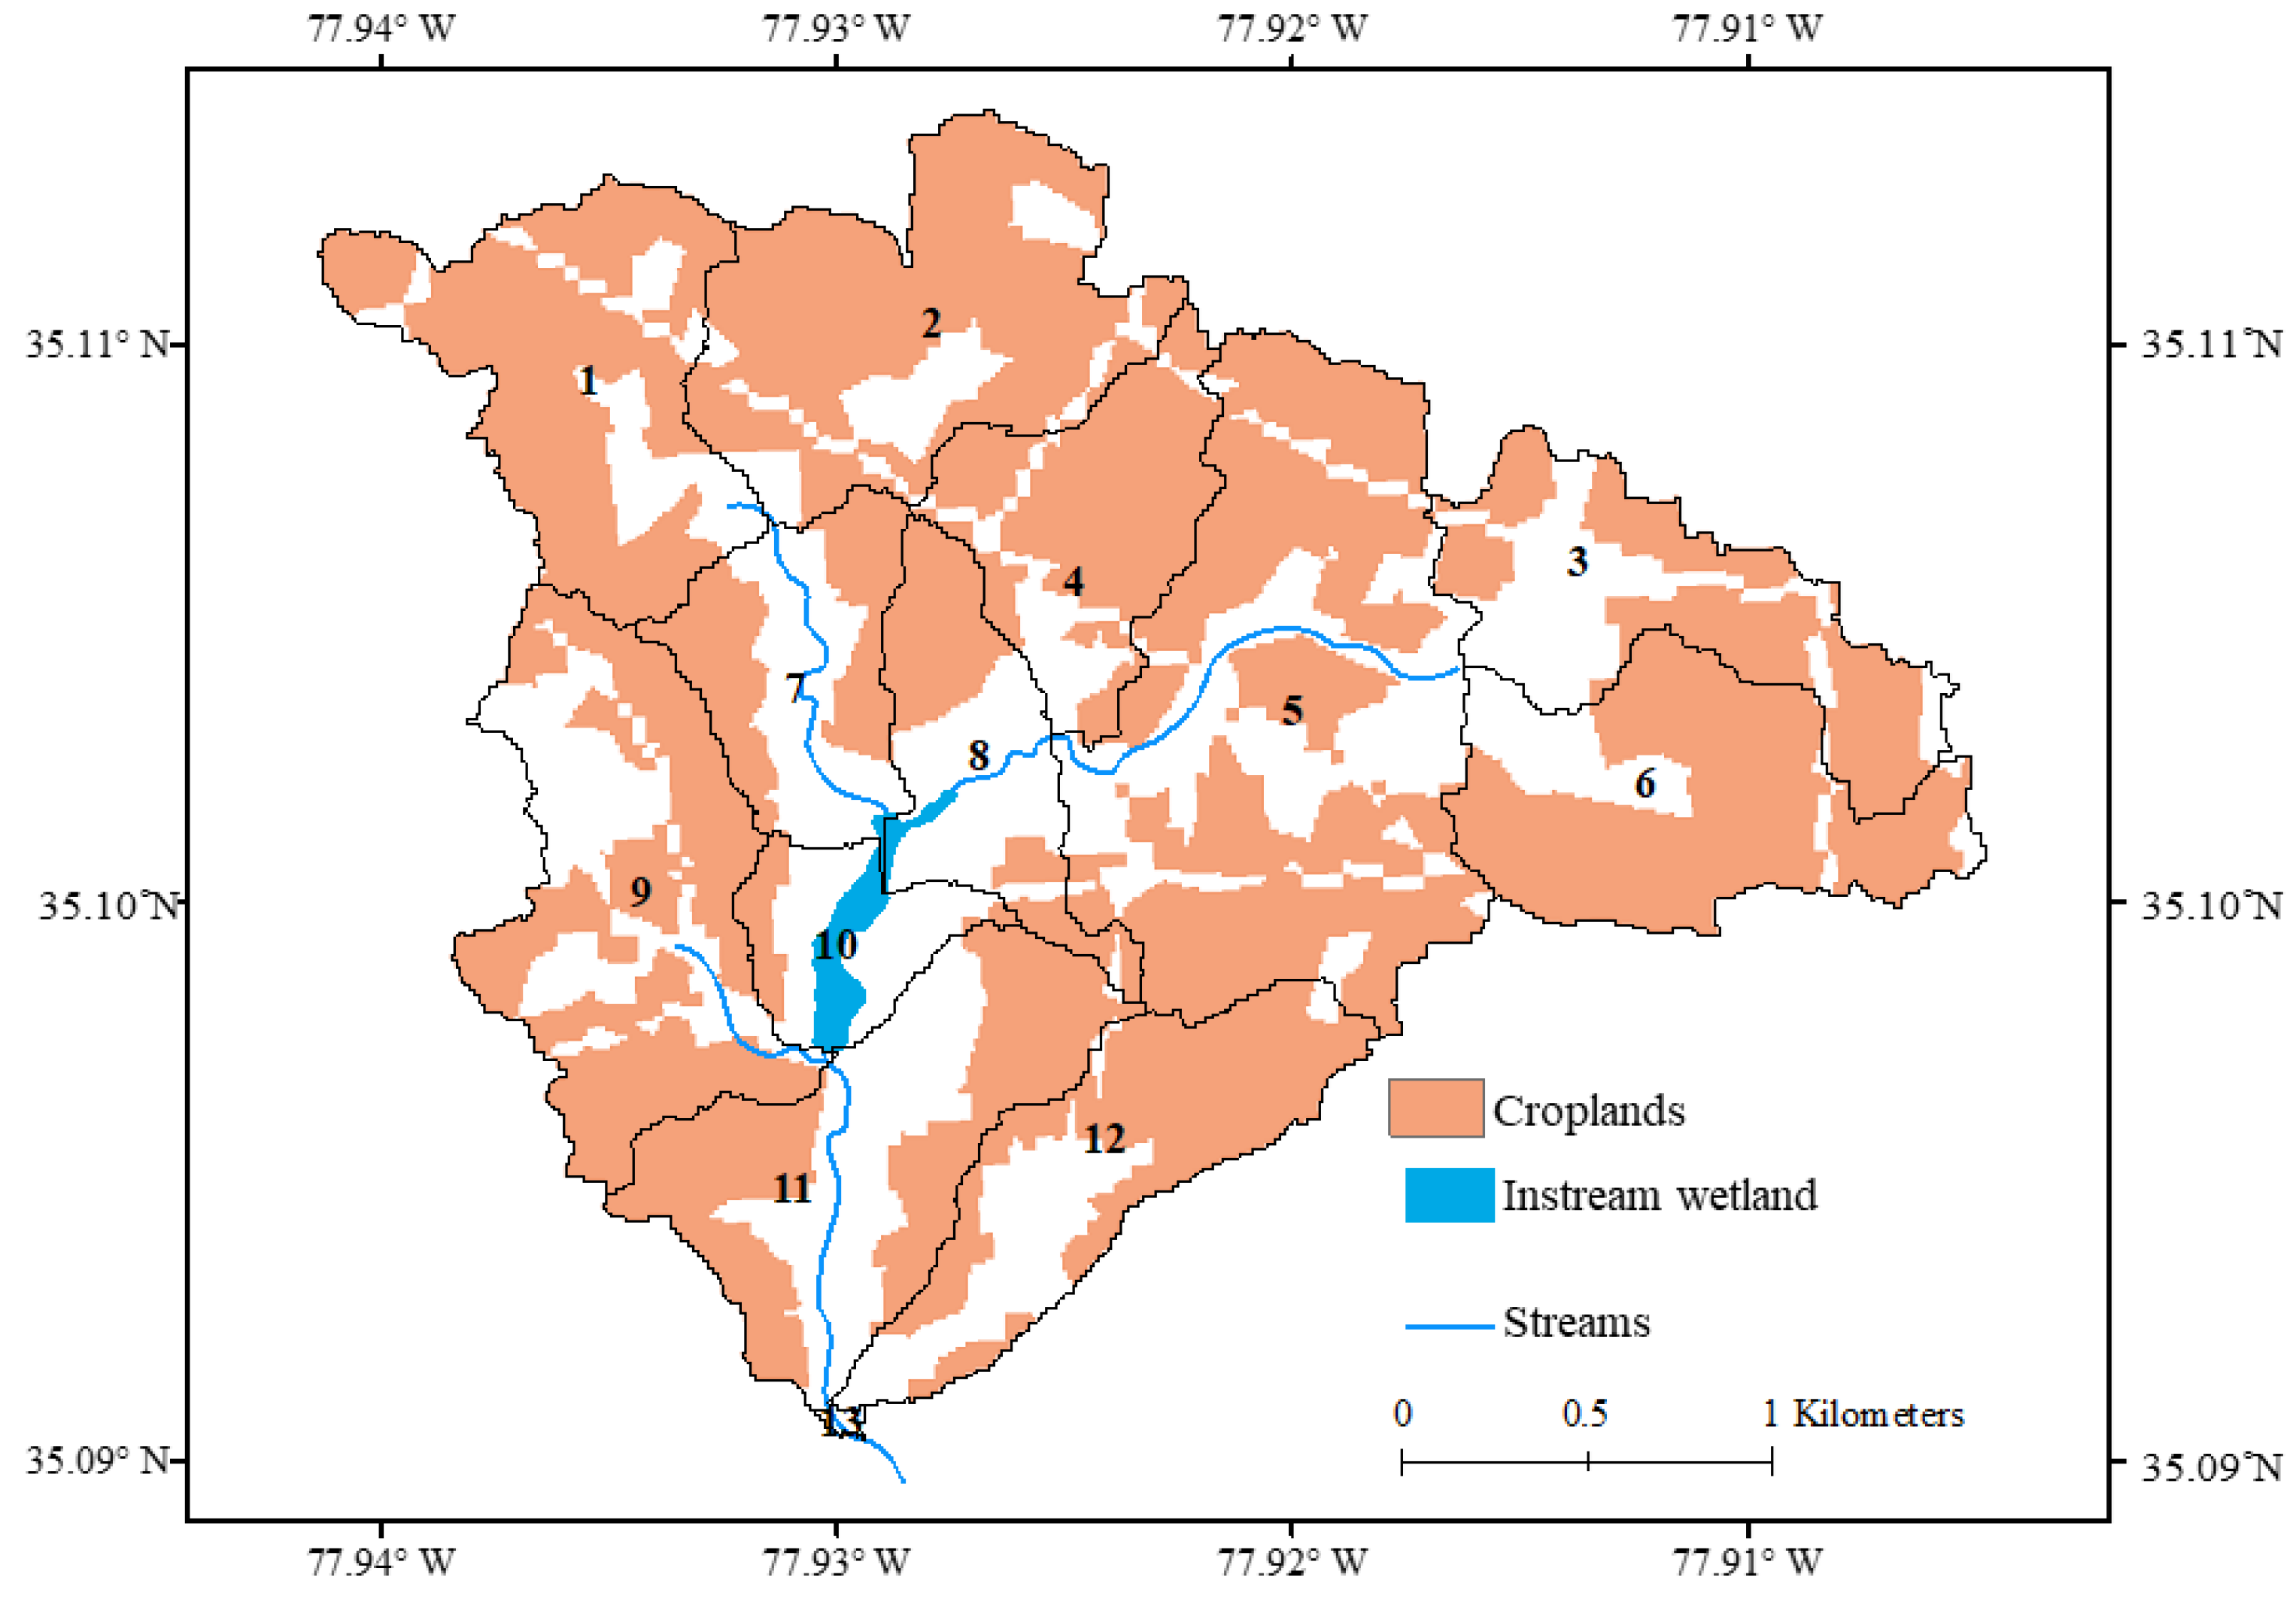
2.1. Data
2.2. Setting SWAT Model: Crop Management, ICW Inputs, and Performance Indicators
3. Results
3.1. SWAT Model Performance
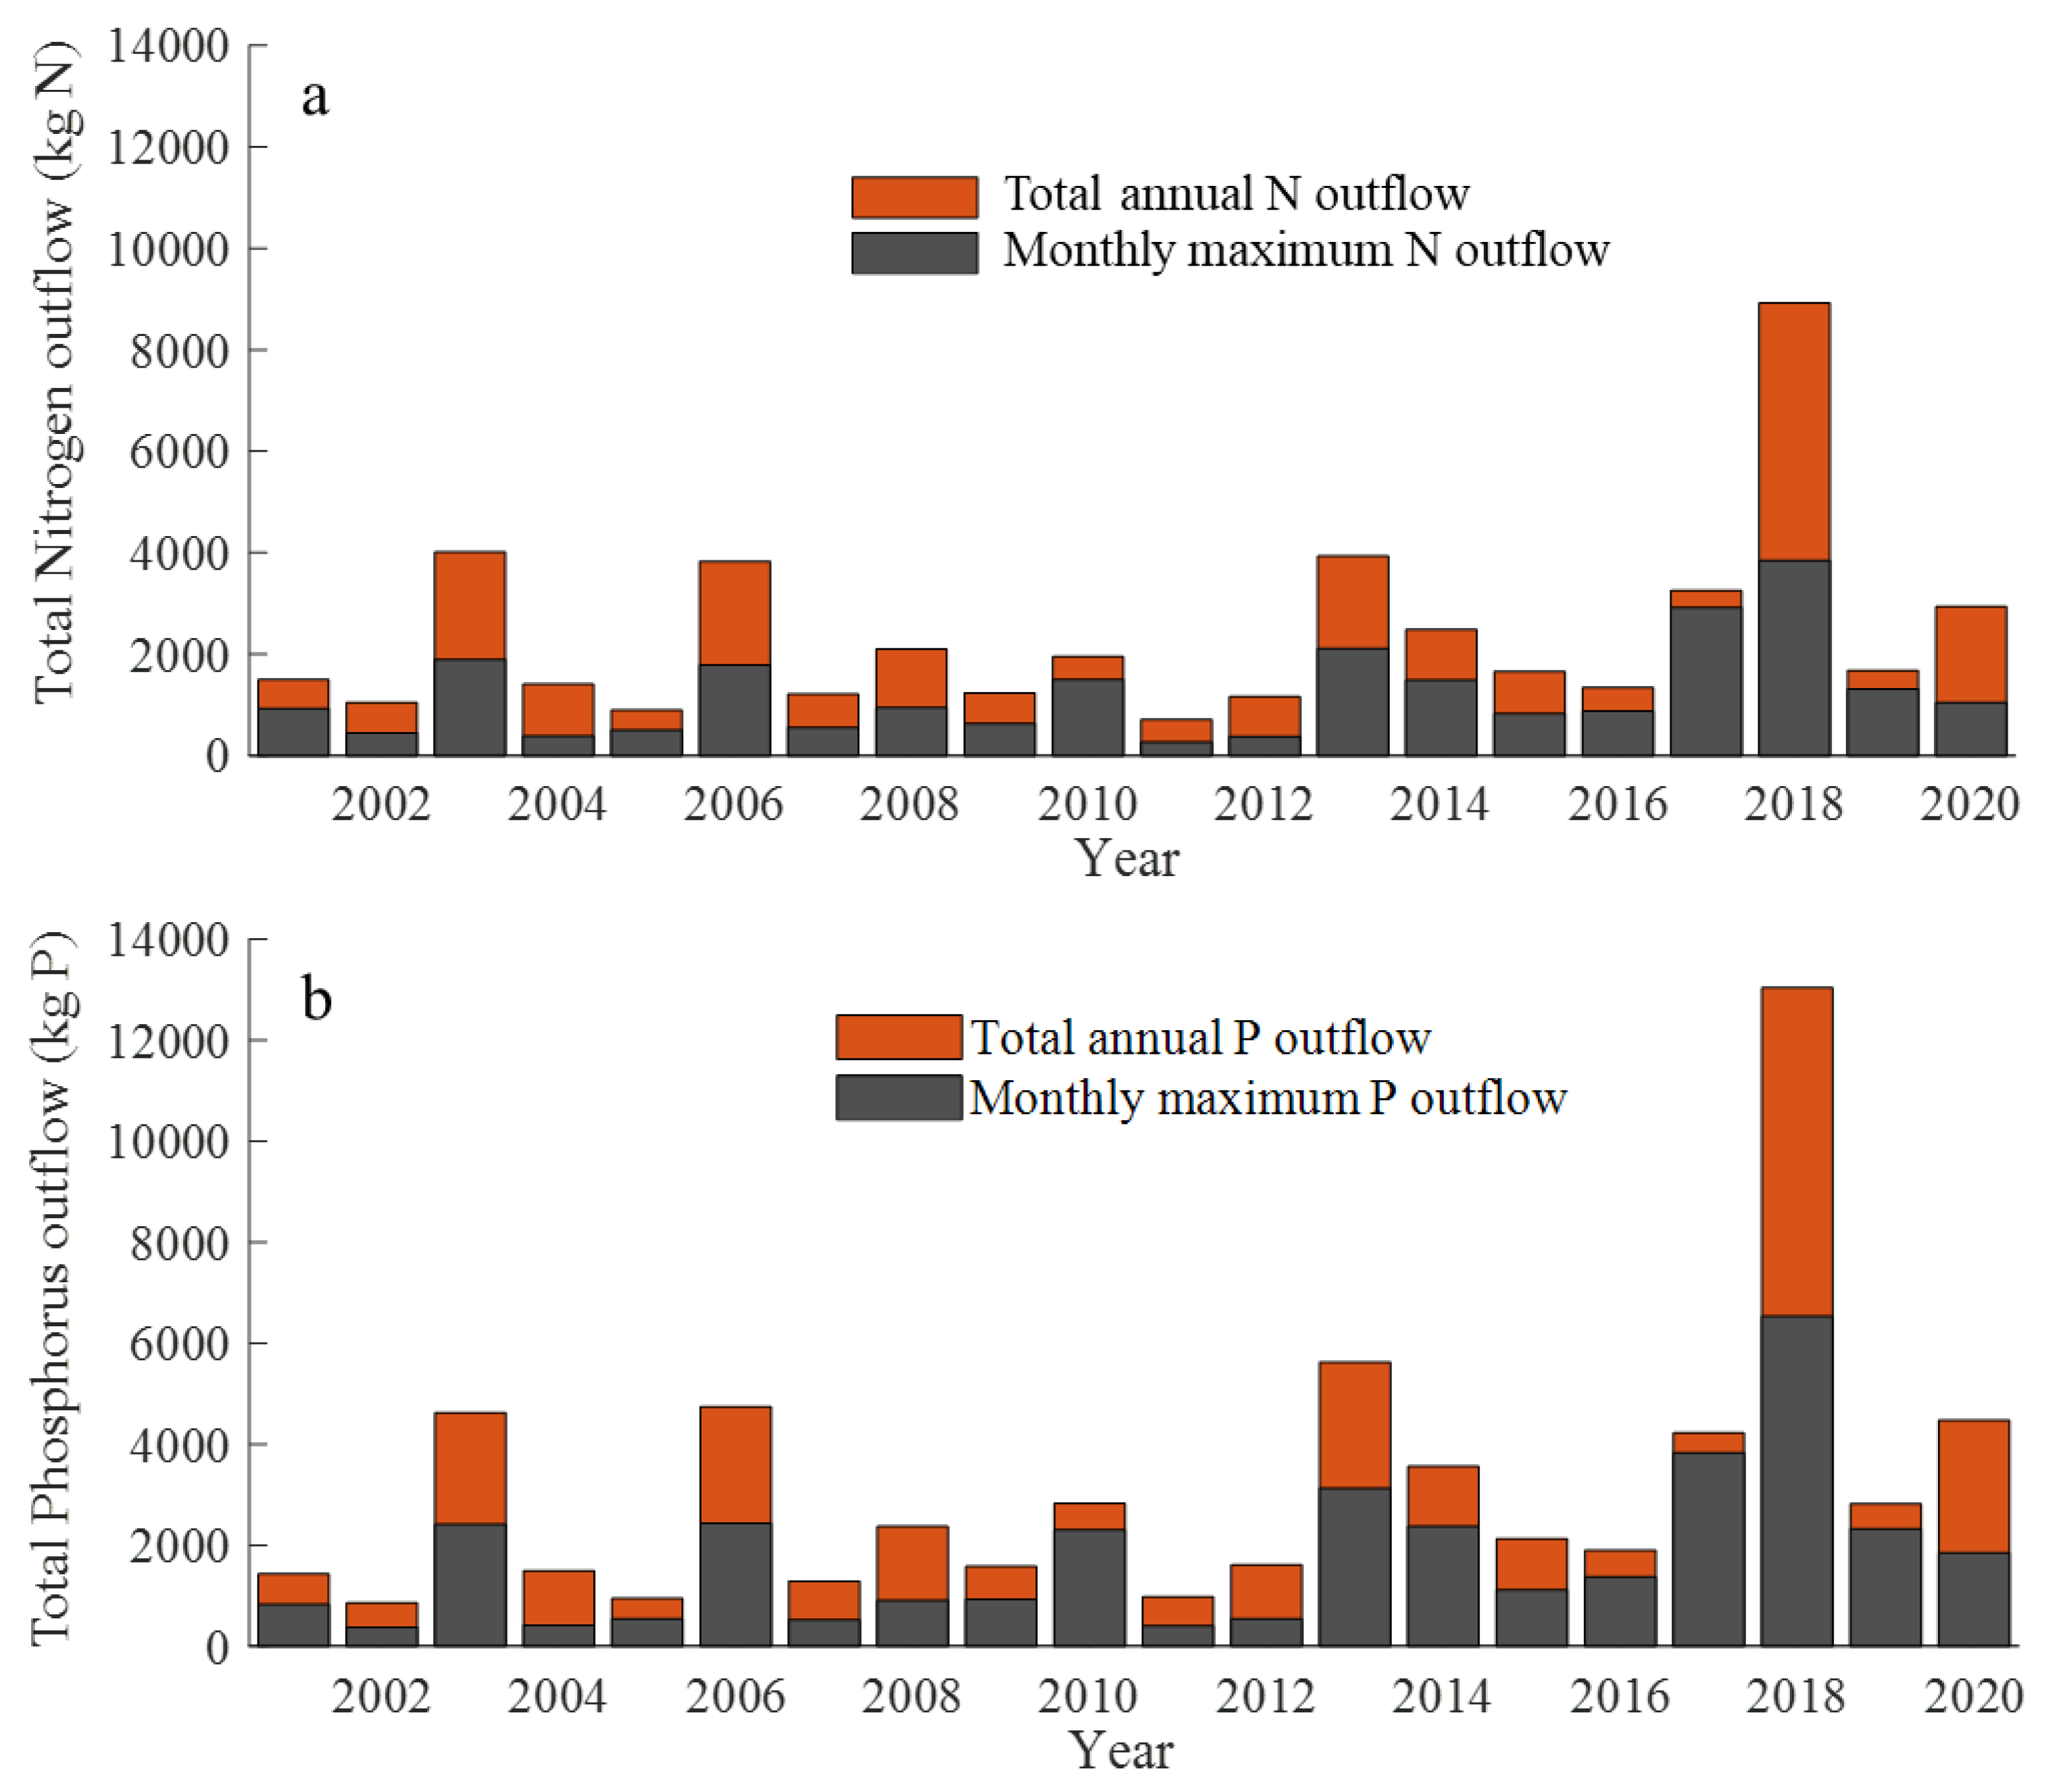
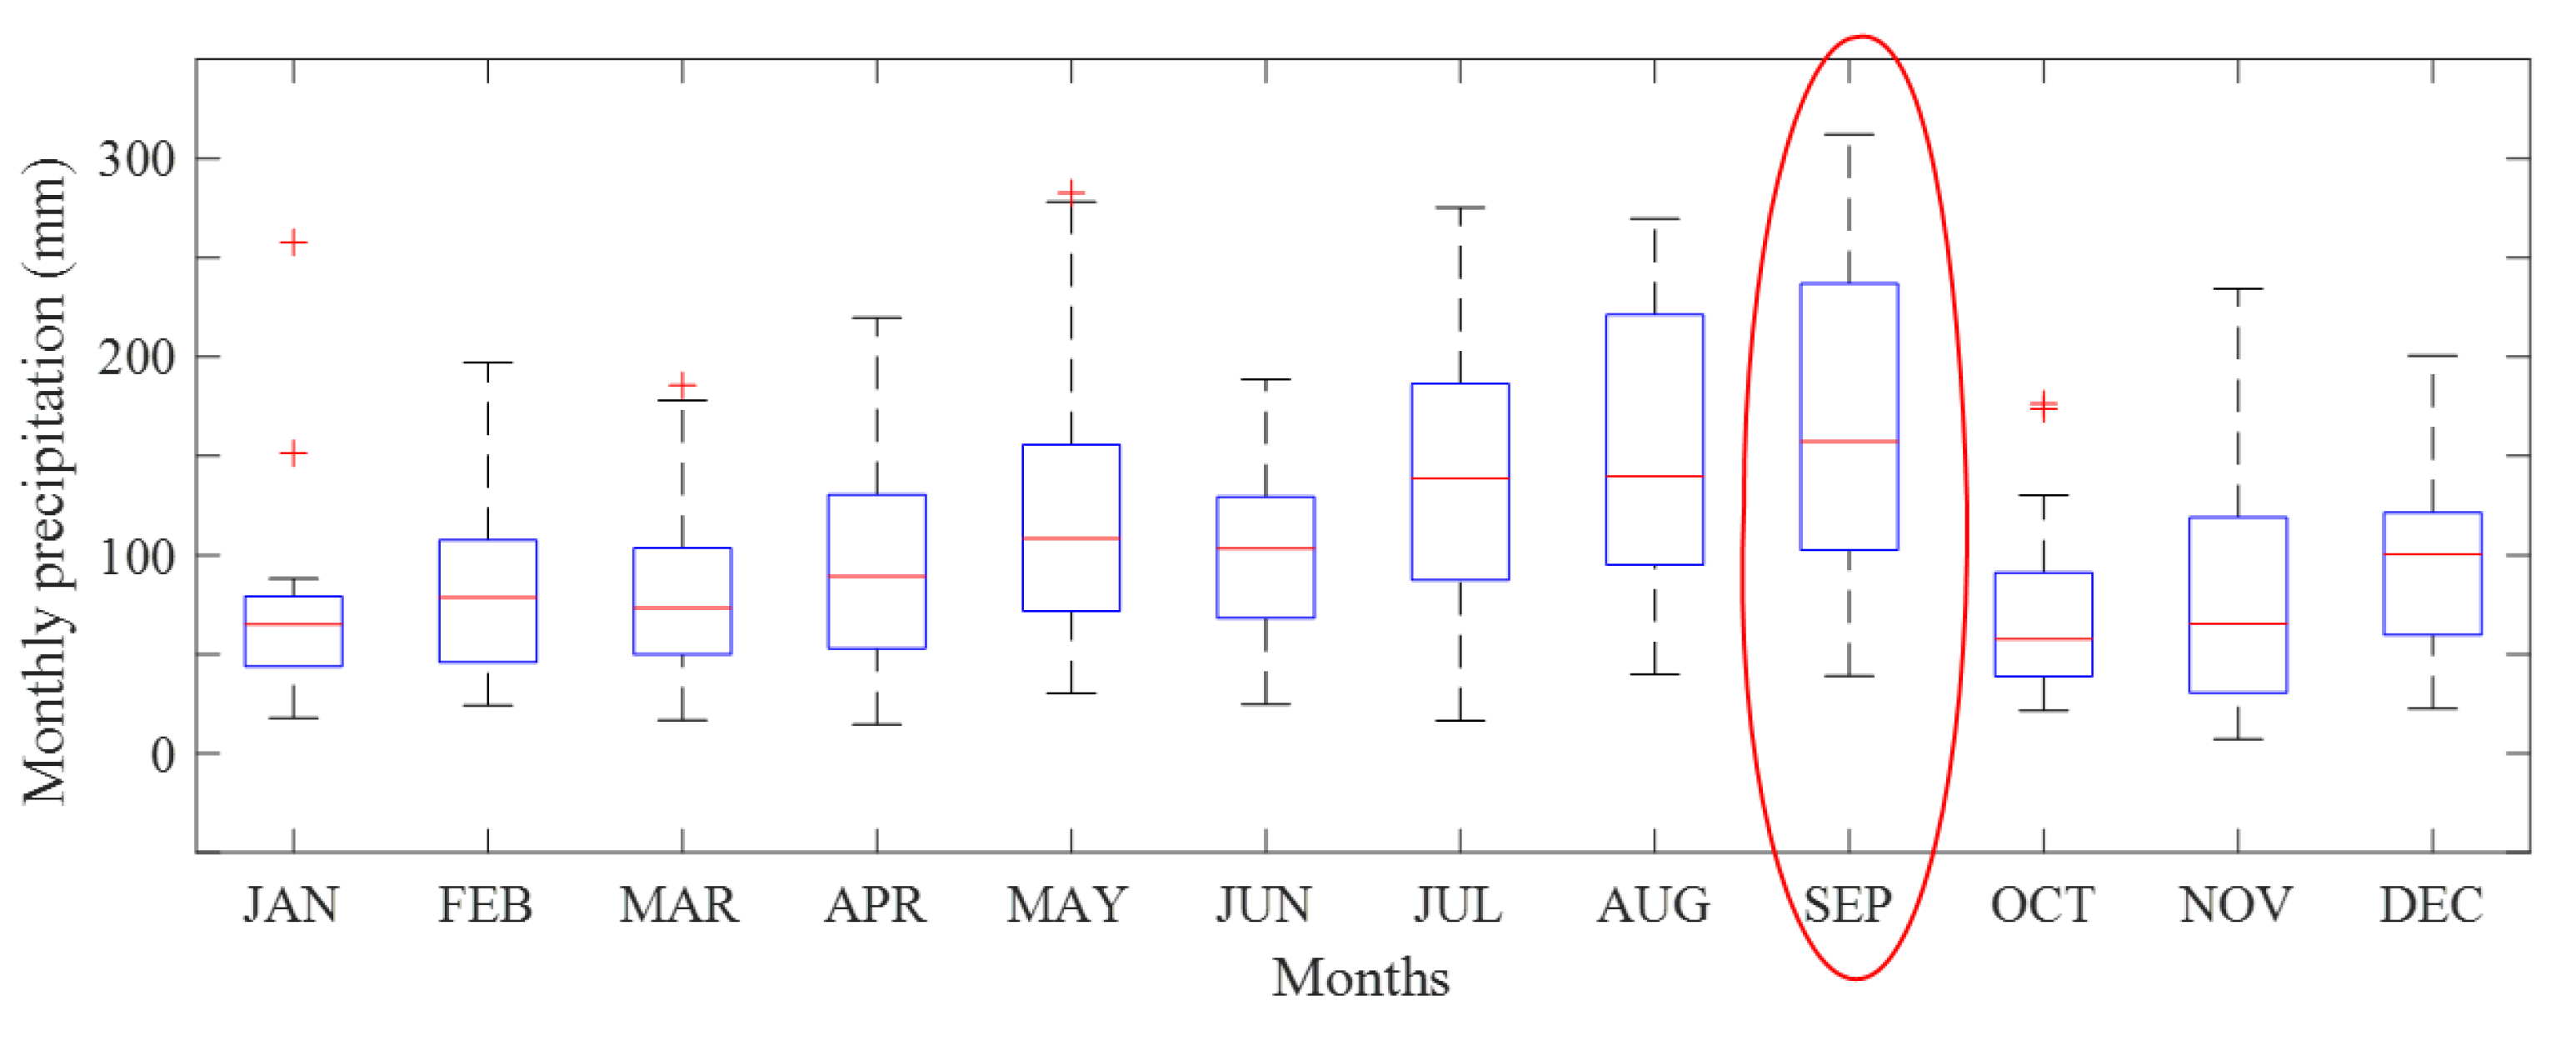
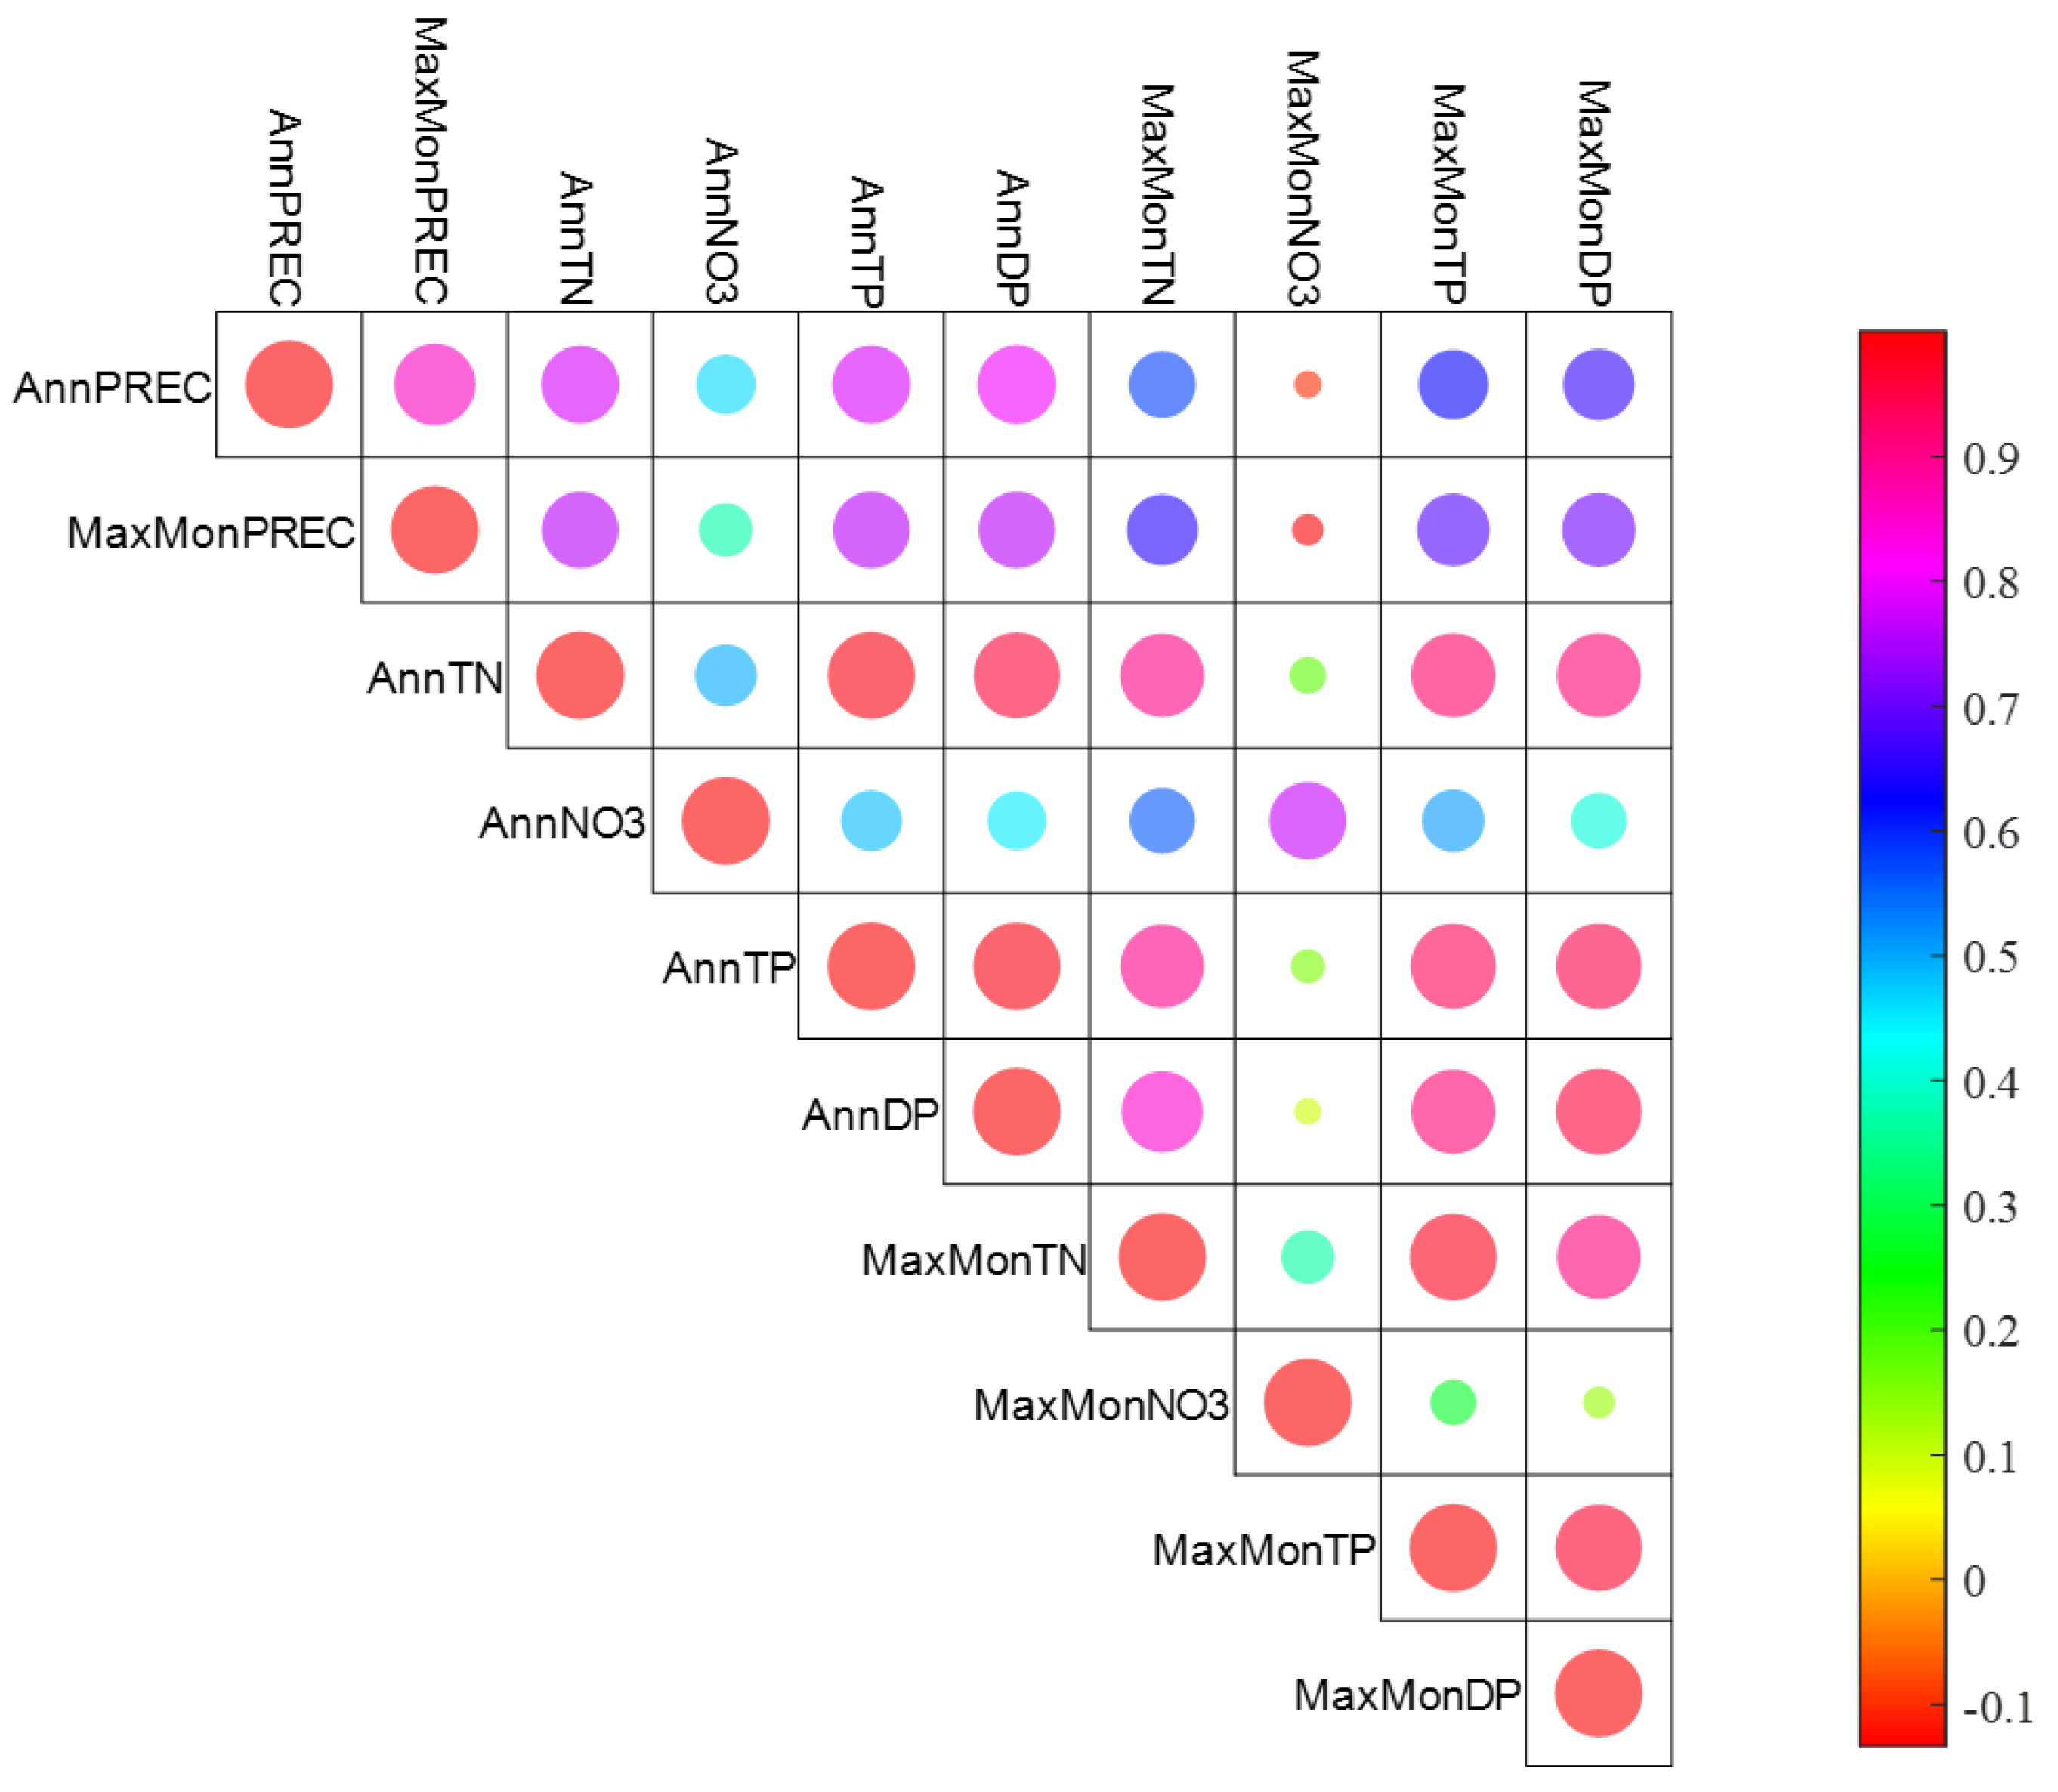
3.2. Signals of Precipitation Variability and ICW’s N and P Outflow
3.3. Effect of Precipitation Variability on ICW’s N and P Outflow
4. Synthesis and Discussion
5. Conclusions
Author Contributions
Funding
Informed Consent Statement
Data Availability Statement
Conflicts of Interest
Disclaimer
References
- Vadas, P.A.; Owens, L.B.; Sharpley, A.N. An empirical model for dissolved phosphorus in runoff from surface-applied fertilizers. Agric. Ecosyst. Environ. 2008, 127, 59–65. [Google Scholar] [CrossRef]
- Kadlec, R.; Knight, R.; Vymazal, J.; Brix, H.; Cooper, P.; Haberl, R. Constructed Wetlands for Pollution Control: Processes, Performance, Design and Operation; IWA Publishing: London, UK, 2000. [Google Scholar]
- Mogollón, J.M.; Beusen, A.H.W.; Van Grinsven, H.J.M.; Westhoek, H.; Bouwman, A.F. Future agricultural phosphorus demand according to the shared socioeconomic pathways. Glob. Environ. Chang. 2018, 50, 149–163. [Google Scholar] [CrossRef]
- Kunhikrishnan, A.; Rahman, M.A.; Lamb, D.; Bolan, N.S.; Saggar, S.; Surapaneni, A.; Chen, C. Rare earth elements (REE) for the removal and recovery of phosphorus: A review. Chemosphere 2022, 286, 131661. [Google Scholar] [CrossRef]
- Watson, J.T.; Reed, S.C.; Kadlec, R.H.; Knight, R.L.; Whitehouse, A.E. Performance expectations and loading rates for constructed wetlands. In Constructed Wetlands for Wastewater Treatment; CRC Press: Boca Raton, FL, USA, 2020; pp. 319–351. [Google Scholar]
- Kadlec, R.H.; Knight, R.L. Treatment Wetlands; Lewis Publishers: Boca Raton, FL, USA, 1996; p. 893. [Google Scholar]
- Paerl, H.W.; Hall, N.S.; Hounshell, A.G.; Rossignol, K.L.; Barnard, M.A.; Luettich, R.A.; Rudolph, J.C.; Osburn, C.L.; Bales, J.; Harding, L.W. Recent increases of rainfall and flooding from tropical cyclones (TCs) in North Carolina (USA): Implications for organic matter and nutrient cycling in coastal watersheds. Biogeochemistry 2020, 150, 197–216. [Google Scholar] [CrossRef]
- Song, K.Y.; Zoh, K.D.; Kang, H. Release of phosphate in a wetland by changes in hydrological regime. Sci. Total Environ. 2007, 380, 13–18. [Google Scholar] [CrossRef]
- Novak, J.M.; Szogi, A.A.; Stone, K.C.; Watts, D.W.; Johnson, M.H. Dissolved phosphorus export from an animal waste impacted in-stream wetland: Response to tropical storm and hurricane disturbance. JEQ 2007, 36, 790–800. [Google Scholar] [CrossRef] [Green Version]
- Bevacqua, E.; Zappa, G.; Lehner, F.; Zscheischler, J. Precipitation trends determine future occurrences of compound hot–dry events. Nat. Clim. Chang. 2022, 12, 350–355. [Google Scholar] [CrossRef]
- Yin, J.; Slater, L.; Gu, L.; Liao, Z.; Guo, S.; Gentine, P. Global Increases in Lethal Compound Heat Stress-Hydrological Drought Hazards under Climate Change. Geophys. Res. Lett. 2022, 49, e2022GL100880. [Google Scholar] [CrossRef]
- Sohoulande Djebou, D.C.; Singh, V.P. Impact of climate change on precipitation patterns: A comparative approach. Int. J. Climatol. 2016, 36, 3588–3606. [Google Scholar] [CrossRef] [Green Version]
- Sohoulande, D.D.C.; Szogi, A.A.; Stone, K.C.; Novak, J.M. Watershed Scale Nitrate-N Abatement of Instream Wetlands: An Appraisal Using the Soil and Water Assessment Tool. Appl. Eng. Agric. 2020, 36, 387–397. [Google Scholar] [CrossRef]
- Stone, K.C.; Hunt, P.G.; Novak, J.M.; Johnson, M.H.; Watts, D.W.; Humenik, F.J. Stream nitrogen changes in an eastern Coastal Plain watershed. JSWC 2004, 59, 66–72. [Google Scholar]
- Stone, K.C.; Hunt, P.G.; Novak, J.M.; Johnson, M.H. In-stream wetland design for non-point source pollution abatement. Appl. Eng. Agric. 2003, 19, 171. [Google Scholar] [CrossRef]
- Homer, C.G.; Dewitz, J.A.; Yang, L.; Jin, S.; Danielson, P.; Xian, G.; Coulston, J.; Herold, N.; Wickham, J.; Megown, K. Completion of the 2011 national land cover database for the conterminous United States: Representing a decade of land cover change information. Photogramm. Eng. Remote Sens. 2015, 81, 345–354. [Google Scholar]
- USDA-NASS. Quick Stats Database. United States Department of Agriculture, National Agricultural Statistics Service USDA-NASS. Available online: https://quickstats.nass.usda.gov/ (accessed on 10 November 2022).
- Clemson University. Fertility Recommendations. Clemson University Regulatory Services, Agricultural Service Laboratory, Clemson SC. Available online: https://www.clemson.edu/public/regulatory/ag-srvc-lab/soil-testing/pdf/agronomic_crops.pdf (accessed on 10 November 2022).
- Spackman, J.A.; Fernandez, F.G.; Coulter, J.A.; Kaiser, D.E.; Paiao, G. Soil texture and precipitation influence optimal time of nitrogen fertilization for corn. Agron. J. 2019, 111, 2018–2030. [Google Scholar] [CrossRef]
- Abbaspour, K.C. SWAT-CUP 2012 SWAT Calibration and Uncertainty Program—A User Manual. 2013. Available online: https://swat.tamu.edu/media/114860/usermanual_swatcup.pdf (accessed on 11 April 2022).
- Arnold, J.G.; Moriasi, D.N.; Gassman, P.W.; Abbaspour, K.C.; White, M.J.; Srinivasan, R.; Santhi, C.; Harmel, R.D.; Van Griensven, A.; Van Liew, M.W.; et al. SWAT: Model use, calibration, and validation. Trans. ASABE 2012, 55, 1491–1508. [Google Scholar] [CrossRef]
- Teshager, A.D.; Gassman, P.W.; Secchi, S.; Schoof, J.T.; Misgna, G. Modeling agricultural watersheds with the soil and water assessment tool (swat): Calibration and validation with a novel procedure for spatially explicit hrus. Environ. Manag. 2016, 57, 894–911. [Google Scholar] [CrossRef] [Green Version]
- Willmott, C.J.; Ackleson, S.G.; Davis, R.E.; Feddema, J.J.; Klink, K.M.; Legates, D.R.; O’donnell, J.; Rowe, C.M. Statistics for the evaluation and comparison of models. J. Geophys. Res. Ocean. 1985, 90, 8995–9005. [Google Scholar] [CrossRef] [Green Version]
- Moriasi, D.N.; Arnold, J.G.; Van Liew, M.W.; Bingner, R.L.; Harmel, R.D.; Veith, T.L. Model evaluation guidelines for systematic quantification of accuracy in watershed simulations. Trans. ASABE 2007, 50, 85–900. [Google Scholar] [CrossRef]
- Moriasi, D.N.; Gitau, M.W.; Pai, N.; Daggupati, P. Hydrologic and water quality models: Performance measures and evaluation criteria. Trans. ASABE 2015, 58, 1763–1785. [Google Scholar] [CrossRef] [Green Version]
- Summers, J.K.; Lamper, A.; McMillion, C.; Harwell, L.C. Observed Changes in the Frequency, Intensity, and Spatial Patterns of Nine Natural Hazards in the United States from 2000 to 2019. Sustainability 2022, 14, 4158. [Google Scholar] [CrossRef]
- Cardwell, J.; Konrad, C.E. Trends in recovery aid concentration following Hurricane Florence in North Carolina: Exploring the role of physical damage, community vulnerability, and Hurricane Matthew. Environ. Hazards 2022, 1–23. [Google Scholar] [CrossRef]
- Conway, G.R.; Pretty, J.N. Unwelcome Harvest: Agriculture and Pollution; Routledge: London, UK, 2013. [Google Scholar] [CrossRef]
- Vymazal, J. Constructed wetlands for wastewater treatment. Water 2010, 2, 530–549. [Google Scholar] [CrossRef] [Green Version]
- Novak, J.M.; Watts, D.W. Increasing the phosphorus sorption capacity of southeastern Coastal Plain soils using water treatment residuals. Soil Sci. 2004, 169, 206–214. [Google Scholar] [CrossRef]
- Sohoulande, D.D.C.; Ma, L.; Szogi, A.A.; Sigua, G.C.; Stone, K.C.; Malone, R.W. Evaluating Nitrogen Management for Corn Production with Supplemental Irrigation on Sandy Soils of the Southeastern Coastal Plain Region of the US. Trans. ASABE 2020, 63, 731–740. [Google Scholar] [CrossRef]


| Efficiency Criteria | Discharge (m3/s) | Dissolved Phosphorus Outflow (kg P) | Nitrate-N Outflow (kg N) | |||
|---|---|---|---|---|---|---|
| Calibration | Validation | Calibration | Validation | Calibration | Validation | |
| NSE | 0.70 * | 0.83 | 0.46 | 0.38 | 0.80 | 0.61 |
| d1 | 0.67 * | 0.71 | 0.66 | 0.76 | 0.69 | 0.65 |
| R2 | 0.80 * | 0.90 | 0.48 | 0.52 | 0.81 | 0.76 |
| RMSE | 13.03 * | 0.05 | 48.80 | 17.35 | 0.50 | 0.57 |
| Variable | Annual Total | Maximum Monthly | ||
|---|---|---|---|---|
| Kendall’s Tau | p-Value | Kendall’s Tau | p-Value | |
| Precipitation | 0.19 | 0.26 | 0.33 * | 0.04 |
| TN outflow | 0.21 | 0.21 | 0.25 | 0.13 |
| NO3-N outflow | 0.18 | 0.29 | 0.17 | 0.32 |
| TP outflow | 0.39 * | 0.02 | 0.39 ** | 0.02 |
| DP outflow | 0.47 ** | 0.00 | 0.51 ** | 0.00 |
Publisher’s Note: MDPI stays neutral with regard to jurisdictional claims in published maps and institutional affiliations. |
© 2022 by the authors. Licensee MDPI, Basel, Switzerland. This article is an open access article distributed under the terms and conditions of the Creative Commons Attribution (CC BY) license (https://creativecommons.org/licenses/by/4.0/).
Share and Cite
Sohoulande, C.D.D.; Szogi, A.A.; Novak, J.M.; Stone, K.C.; Martin, J.H.; Watts, D.W. Long-Term Nitrogen and Phosphorus Outflow from an Instream Constructed Wetland under Precipitation Variability. Sustainability 2022, 14, 16500. https://0-doi-org.brum.beds.ac.uk/10.3390/su142416500
Sohoulande CDD, Szogi AA, Novak JM, Stone KC, Martin JH, Watts DW. Long-Term Nitrogen and Phosphorus Outflow from an Instream Constructed Wetland under Precipitation Variability. Sustainability. 2022; 14(24):16500. https://0-doi-org.brum.beds.ac.uk/10.3390/su142416500
Chicago/Turabian StyleSohoulande, Clement D. D., Ariel A. Szogi, Jeffrey M. Novak, Kenneth C. Stone, Jerry H. Martin, and Don W. Watts. 2022. "Long-Term Nitrogen and Phosphorus Outflow from an Instream Constructed Wetland under Precipitation Variability" Sustainability 14, no. 24: 16500. https://0-doi-org.brum.beds.ac.uk/10.3390/su142416500