

Contextualizing Visualizations of Digital Health Information among Young and Older Adults Based on Eye-Tracking

1
Academy of Medical Engineering and Translational Medicine, Tianjin University, Tianjin 300072, China
2
School of Design, The Hong Kong Polytechnic University, Hong Kong
3
Institute of Human Factors and Ergonomics, College of Mechatronics and Control Engineering, Shenzhen University, Shenzhen 518061, China
*
Author to whom correspondence should be addressed.
Sustainability 2022, 14(24), 16506; https://0-doi-org.brum.beds.ac.uk/10.3390/su142416506
Submission received: 31 October 2022
/
Revised: 3 December 2022
/
Accepted: 6 December 2022
/
Published: 9 December 2022
(This article belongs to the Special Issue Digital Technology in Healthcare: Opportunities Offered by a Sustainable Relational Ecosystem)
Abstract
:Visualizations have been found to be a promising solution to aid individuals’ comprehension of digital health information. However, how visualizations can be better contextualized remains unclear. This study aimed to examine the effects of visualizations of digital health information with various contextual cues and age on comprehension through eye-tracking techniques. A two-way mixed design was employed, with visualization (basic, color, color + text, and color + text + personalized statement) and age (young and older adults) as independent variables. Forty-one participants attended an experiment where they were asked to perform verbatim comprehension and value interpretation tasks in response to varied visualizations of digital health information. The results indicated that the four visualizations yielded comparable task completion time and accuracy. Older adults had longer task completion time and more errors compared with their counterparts. While eye movement measures were comparable across different visualizations, they were mostly affected by age and areas of interests. Different visualizations might attract different patterns of visual attention and yield varied effectiveness across age groups. Future research should focus on how to better visualize digital health information for older adults. Design practitioners should carefully consider how to attract patients’ visual attention to important information to improve comprehension.
1. Introduction
In the past two decades, it has been increasingly emphasized that chronically ill patients should not rely solely on their physicians for disease management but should be actively engaged in their own disease management, which is well-known as self-management [1,2]. One of the core elements in patients’ self-management could be self-monitoring [3], which includes a set of self-help activities to monitor one’s own health status, such as measuring, tracking, interpreting, and responding to quantitative health indicators (e.g., blood glucose, blood pressure) [4]. Previous evidence has shown that self-monitoring is an effective approach for improving patients’ health care awareness and coping with their diseases [5], leading to patients’ enhanced disease management and quality of life [6,7].
With the development of consumer health information technologies (CHITs), digital technologies have been increasingly applied in health care, which enables patients to more conveniently get access to and use self-monitoring results [8,9,10,11]. Recent evidence also indicated that there has been a heavy reliance on such technologies during the COVID-19 pandemic [12,13]. However, CHITs that have poor interface design may induce misunderstanding of health information and even lead to inappropriate health care decision-making for patients [8,14,15]. Most relevant to the self-monitoring context, poor visual presentation of digital health information makes the understanding of numeric health information challenging for users as they usually lack basic medical knowledge to interpret the quantitative information [16,17]. The situation is particularly serious for patients with low numeracy and literacy skills [18,19] and for older adults with deteriorated sensory function (e.g., visual acuity) and information processing capacity (e.g., working memory) [15,20]. Previous literature indicated that misunderstanding of self-monitoring results can impede patient interpretation of their health status and lead to confusion, frustration, and disruptions in health care processing [15,21].
One of the effective solutions to this problem is the use of visualizations to present digital health information [15,22,23,24,25]. Visualization, which refers to graphical representation of information, has been validated as an effective strategy for presenting quantitative data to improve information comprehension [23,26]. This approach is favorable in the health care context because it minimizes patients’ cognitive load and reduces the reliance on their high literacy and numeracy [23,27]. Additionally, appropriate visualization design can alert patients to their susceptibility to a health threat and, thus, support better decision-making [15,22].
Although visualizations provide some advantages for better comprehension, several unique questions remain unsolved and warrant further examination [28,29,30]. First, how visualizations can be better contextualized remains unclear. In recent years, substantial efforts have been spent on applying various contextual cues, such as colors [22,28,31,32], texts [22,28,31], imagery [22], and interpretive statements [22,28], to underscore the meaning of health information in medical test results and facilitate patients’ comprehension of the information. For instance, Arcia et al. [22] designed a reference range number line (RRNL) visualization with text, color, and imagery as contextual cues to display Asthma Control Questionnaire (ACQ) scores for asthma patients and found that the patients can better understand the questionnaire information. Morrow et al. [22] used facial icons and color in the RRNL design to facilitate patients’ understanding of their cholesterol and blood glucose test results. However, optimal use of contextual cues warrants further examination [22,27], which requires rigorously designed experiments to evaluate the effects of different visual designs on viewers’ information comprehension. In addition, the underlying mechanism on how contextual cues can attract and guide viewers’ visual attention and, subsequently, facilitate their information comprehension has rarely been examined [33,34]. Without knowing the underlying mechanism, researchers and practitioners may be unable to explain the reason why certain visual designs lead to different interpretation performance, and thus, optimal visual designs of health information appear unavailable. To solve this problem, eye-tracking techniques can be used to provide more detailed and valuable sources of objective data on where and how viewers’ eyes move when they are exposed to visualized information [35,36,37]. As eye-tracking hardware and algorithms mature, an eye-tracking technique has been widely applied to a range of research fields, including neuroscience/psychology, industrial engineering/human factors, marketing/advertising, and computer science [38]. For instance, Ares et al. [39] evaluated designs of food labels using an eye-tracking technique and demonstrated that the technique can be a useful tool to measure individuals’ visual attention and information acquisition. Arslan et al. [40] employed an eye-tracking technique to evaluate the usability of a component of a ships’ bridge navigation system and contribute to research on eye-tracking in marine transportation. Cho et al. [41] adopted an eye-tracking retrospective think-aloud method to identify critical interface design issues of a mobile health app.
More importantly, older adults are in urgent need of understanding their own health information. Although some studies have examined this group [28,42,43], they presented little evidence on the comparison of comprehension of visualized health information between older and younger adults. Understanding how people in different age groups process visualized health information is necessary for both researchers and practitioners to improve visualization design for specific age groups.
To fill the research gap, we conducted an exploratory study to investigate the effects of visualizations with various contextual cues on users’ comprehension of self-monitoring results and to examine how different visualization designs affect users’ visual attention during the comprehension of the information with eye-tracking techniques. In addition, this study also aimed to understand how users’ information comprehension and visual attention would differ by age in the comprehension of visualized self-monitoring results.
2. Materials and Methods
Chronically ill patients are usually required to self-interpret their self-monitoring results presented on their health management systems (e.g., m-health app, health management portal). To facilitate individuals’ comprehension of digital health information, we proposed four visualizations and tested their effectiveness among two age groups. Our study focused on the design of RRNLs, which have been widely used for presenting personal health information [22,27,31,42,44].
2.1. Experimental Design
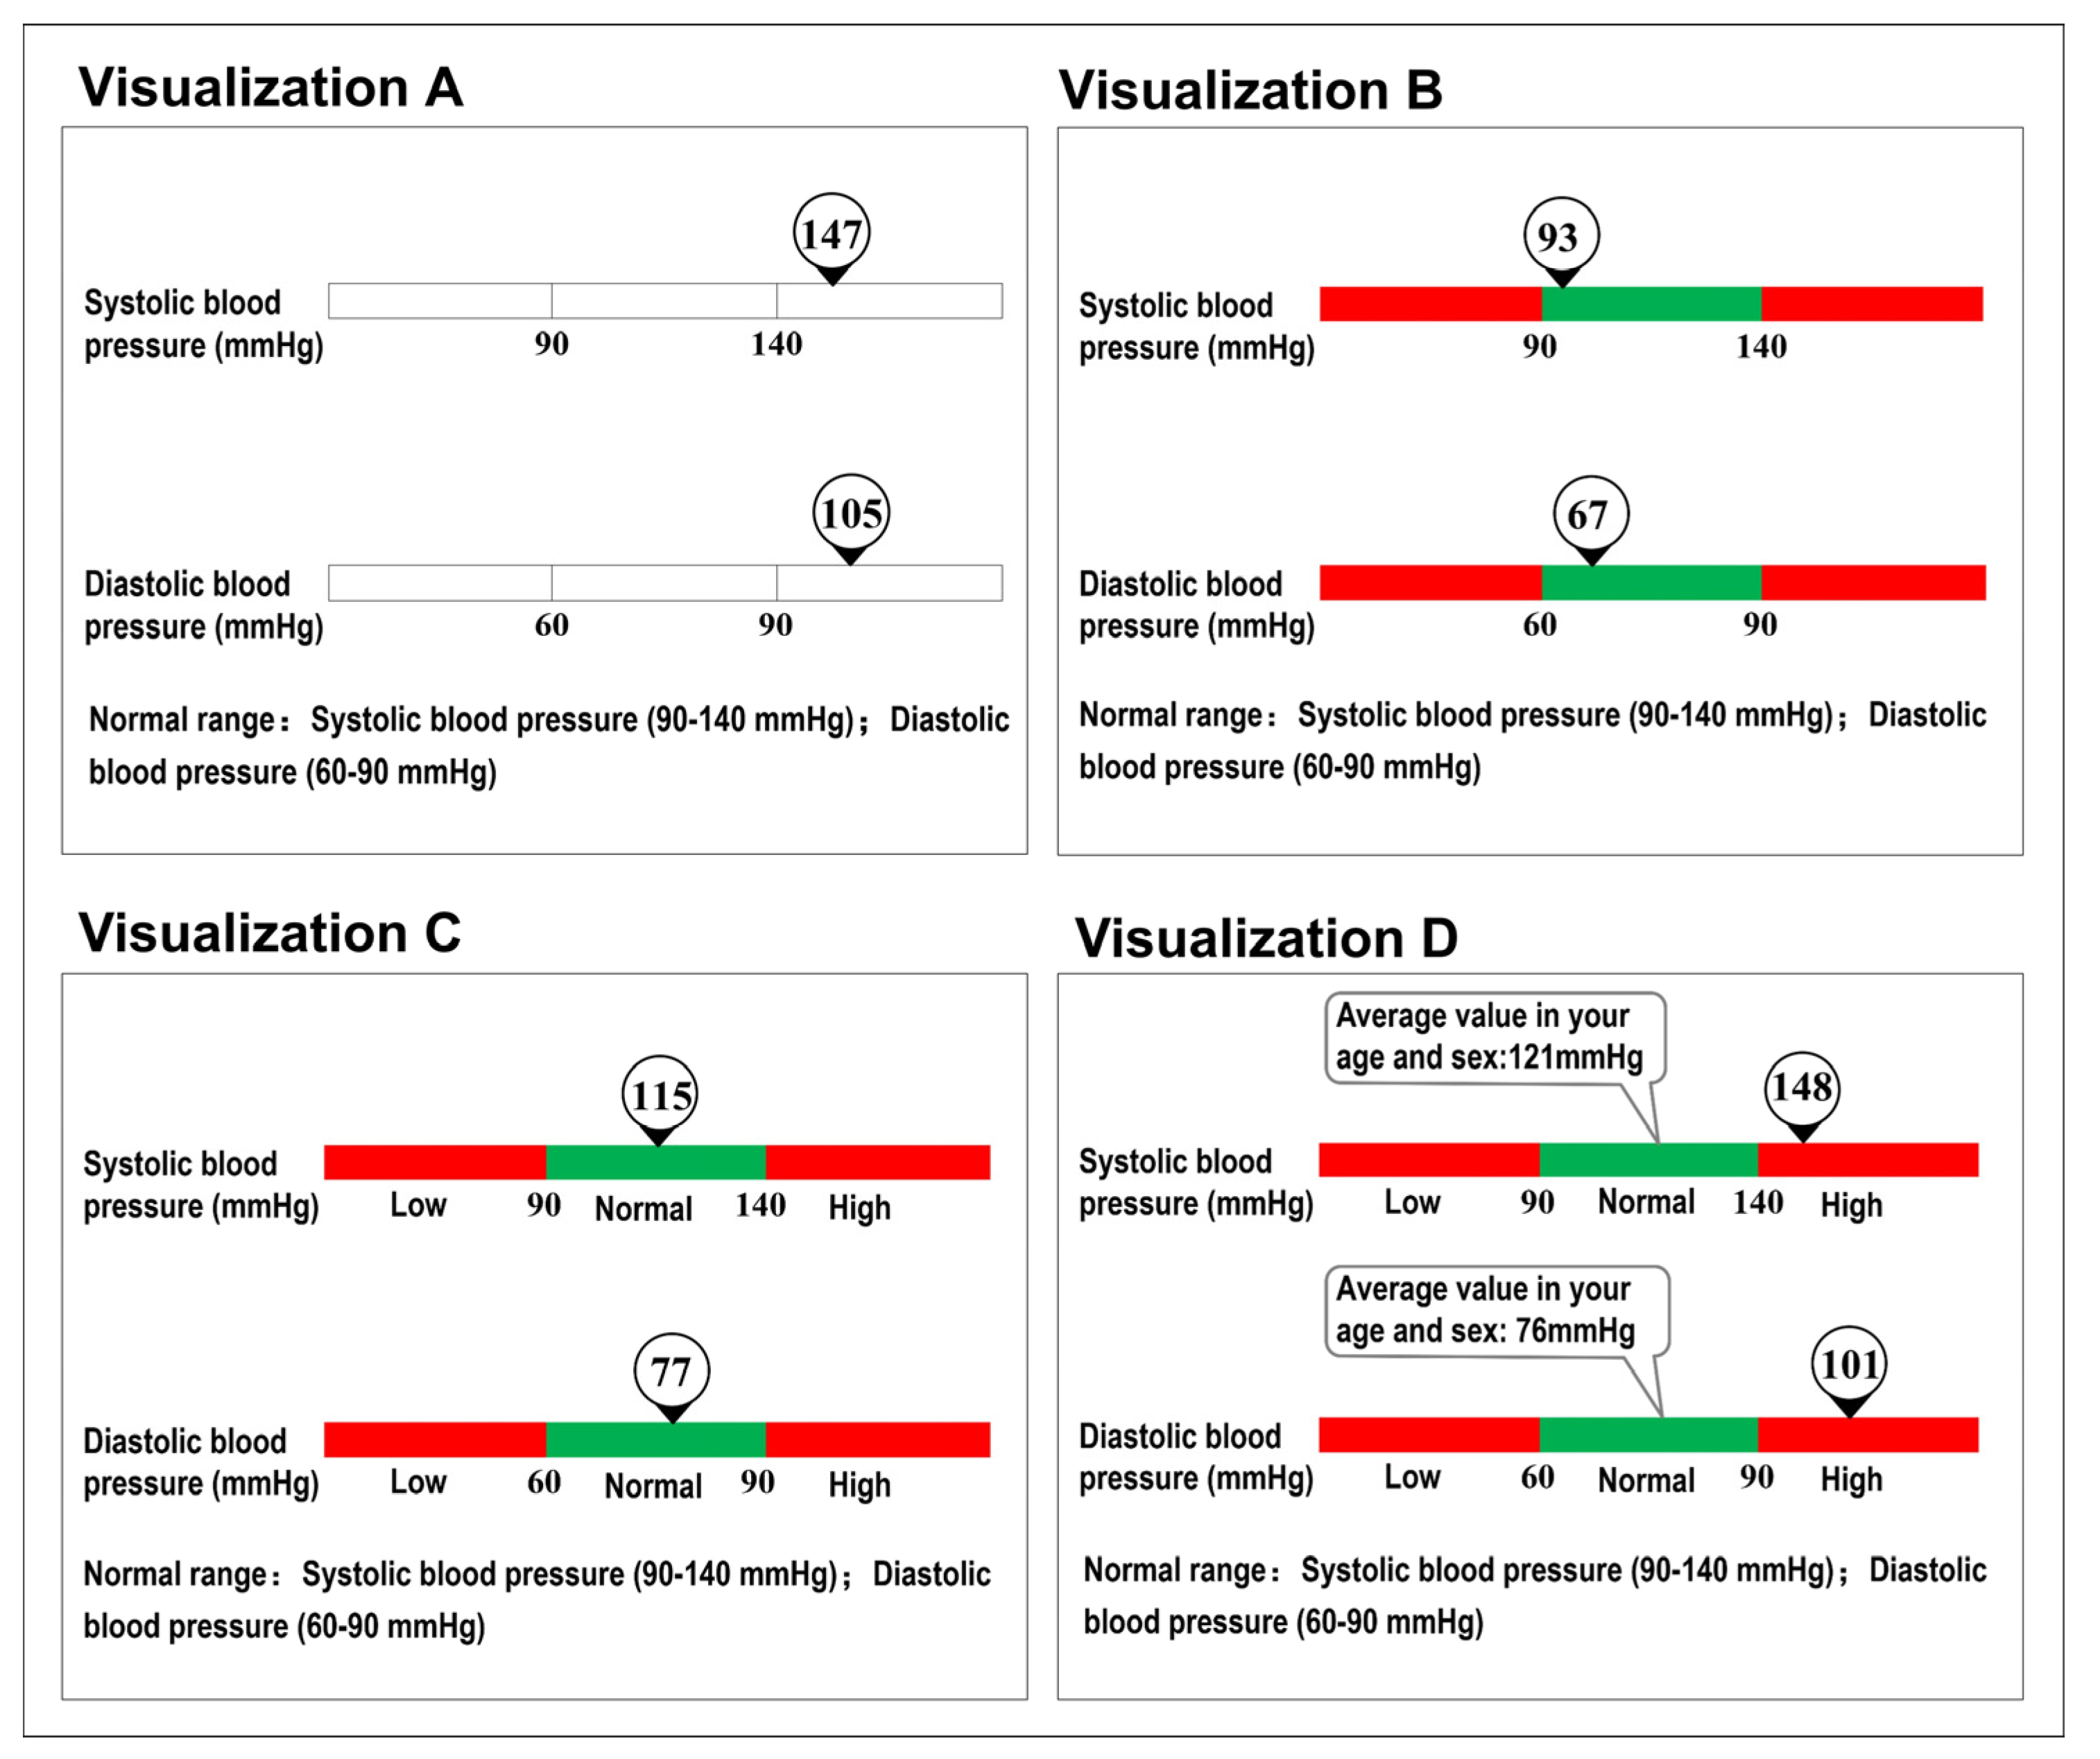
The experiment employed a two-way (4 × 2) mixed design, with visualization and age as independent variables. We designed visualizations based on RRNLs that have been commonly used in previous studies, and deliberately introduced redundancies to the RRNLs by utilizing different combinations of contextual cues (e.g., color, text, and personalized statement). Previous literature has indicated that presenting multiple contextual cues was favorable because it improved patient confidence of interpretation, and reduced the risk of stripping away valuable meaning [22,27]. Four visualizations with various contextual cues were examined, including basic type (Visualization A), basic type plus color (Visualization B), basic type plus color and text (Visualization C), and basic type plus color, text, and personalized statement (Visualization D) (as shown in Figure 1; for details, see Stimuli). Two typical age groups were examined, including young (i.e., aged 18–40 years) and older adults (i.e., aged 60 years and above).
2.2. Stimuli
Stimuli in this present experiment were images presenting visualized digital health information from self-monitoring tests on blood glucose and blood pressure, two typical self-monitoring tests that people with chronic diseases (in particular, diabetic and/or hypertension patients) would usually perform in their self-management activities. These images were used to simulate interfaces that they would usually see on their health management system (e.g., m-health app, health management portal). For images presenting testing results for blood pressure, both systolic (top of the image) and diastolic blood pressure (bottom of the image) results, were presented. For images presenting testing results for blood glucose, both fasting blood glucose (top of the image) and two hours postprandial blood glucose (bottom of the image) results, were presented. The self-monitoring results were presented in both normal and abnormal scenarios. According to published health care guidelines for hypertension and diabetes [45,46], the normal ranges of blood pressure and blood glucose levels shown in the images were as follows: systolic blood pressure (90–140 mmHg), diastolic blood pressure (60–90 mmHg), fasting blood glucose (3.6–6.9 mmol/L), and two hours postprandial blood glucose (3.9–11.0 mmol/L). Test results that were beyond normal range were determined as abnormal.
Specifically, Visualization A employed a non-color RRNL only. Visualization B applied stoplight colors on Visualization A with green and red indicating normal and abnormal testing results, respectively, to facilitate value judgements. Visualization C was designed based on Visualization B by providing text explanations for the colors. Visualization D, based on Visualization C, provided an additional personalized statement regarding the average value from the population with the same sex and age as the participants.
In the experiment, participants were presented with images with varied visualizations on self-monitoring tests and were asked to complete two experimental tasks regarding each of the images. The experimental tasks were created based on typical health care activities during patients’ self-monitoring processes, and included verbatim comprehension tasks (i.e., indicating the exact test values presented on the images) and value interpretation tasks (i.e., determining whether the test values were within the normal range).
2.3. Apparatus
The participants performed the experimental tasks on a Dell 23-inch all-in-one touch screen computer (resolution: 1024 × 768 pixels). The viewing distance between participants’ eyes and the computer monitor was about 50 cm. E-prime software was used to present stimuli and record participants’ responses. Participants’ eye movements were monitored using a Tobii X-120 system operating at 120 Hz.
2.4. Participants
Initially, this study recruited 36 young adults and 36 older adults via poster announcement. However, the sampling proportions on eye movement data were lower than 70% for 8 young adults and 23 older adults due to either astigmatism symptoms or head movement during the experiment, which made the data less qualified for analysis. Thus, they were excluded from our data analysis. The final sample comprised 28 young adults (16 males and 12 females; mean age = 22.75, SD = 2.52) and 13 older adults (5 males, 8 females; mean age = 65.38, SD = 3.95). While our study was considered as exploratory, the sample size was still able to detect a medium effect size of 0.35 in a two-way mixed design repeated-measures analysis of variance (ANOVA) with recommended statistical power (β = 80%) and significance level (α = 0.05). The participants reported that they had normal color vision, received primary school education or above, and had normal mobility and mental alertness. None of the young adults had chronic diseases, while all the older adults had chronic disease (one (7.7%) had diabetes and 12 (92.3%) had hypertension). All the participants provided informed consent prior to the experiment.
2.5. Procedures
Upon arrival at the laboratory, participants were briefed by a researcher regarding the objectives and procedures of the experiment. They were then asked to complete a standardized eye-tracker calibration and then to perform a series of practice trials to ensure that they were familiar with the device and procedures. In the formal experiment, participants were presented with images that showed varied visualizations of self-monitoring results and were asked to indicate the exact test values (i.e., the verbatim comprehension task) presented on the image and to determine whether the test values were within the normal range or not (i.e., value interpretation task). Participants needed to complete a total of 32 trials (one image per trial: four visualizations × four types of test measures (i.e., systolic and diastolic blood pressure, fasting blood glucose, and two hours postprandial blood glucose) × two health status (i.e., normal and abnormal)). The images under varied experimental conditions were presented in a fully randomized order. The experiment consisted of two 20 min sessions, with 5 min rest between them.
2.6. Measures
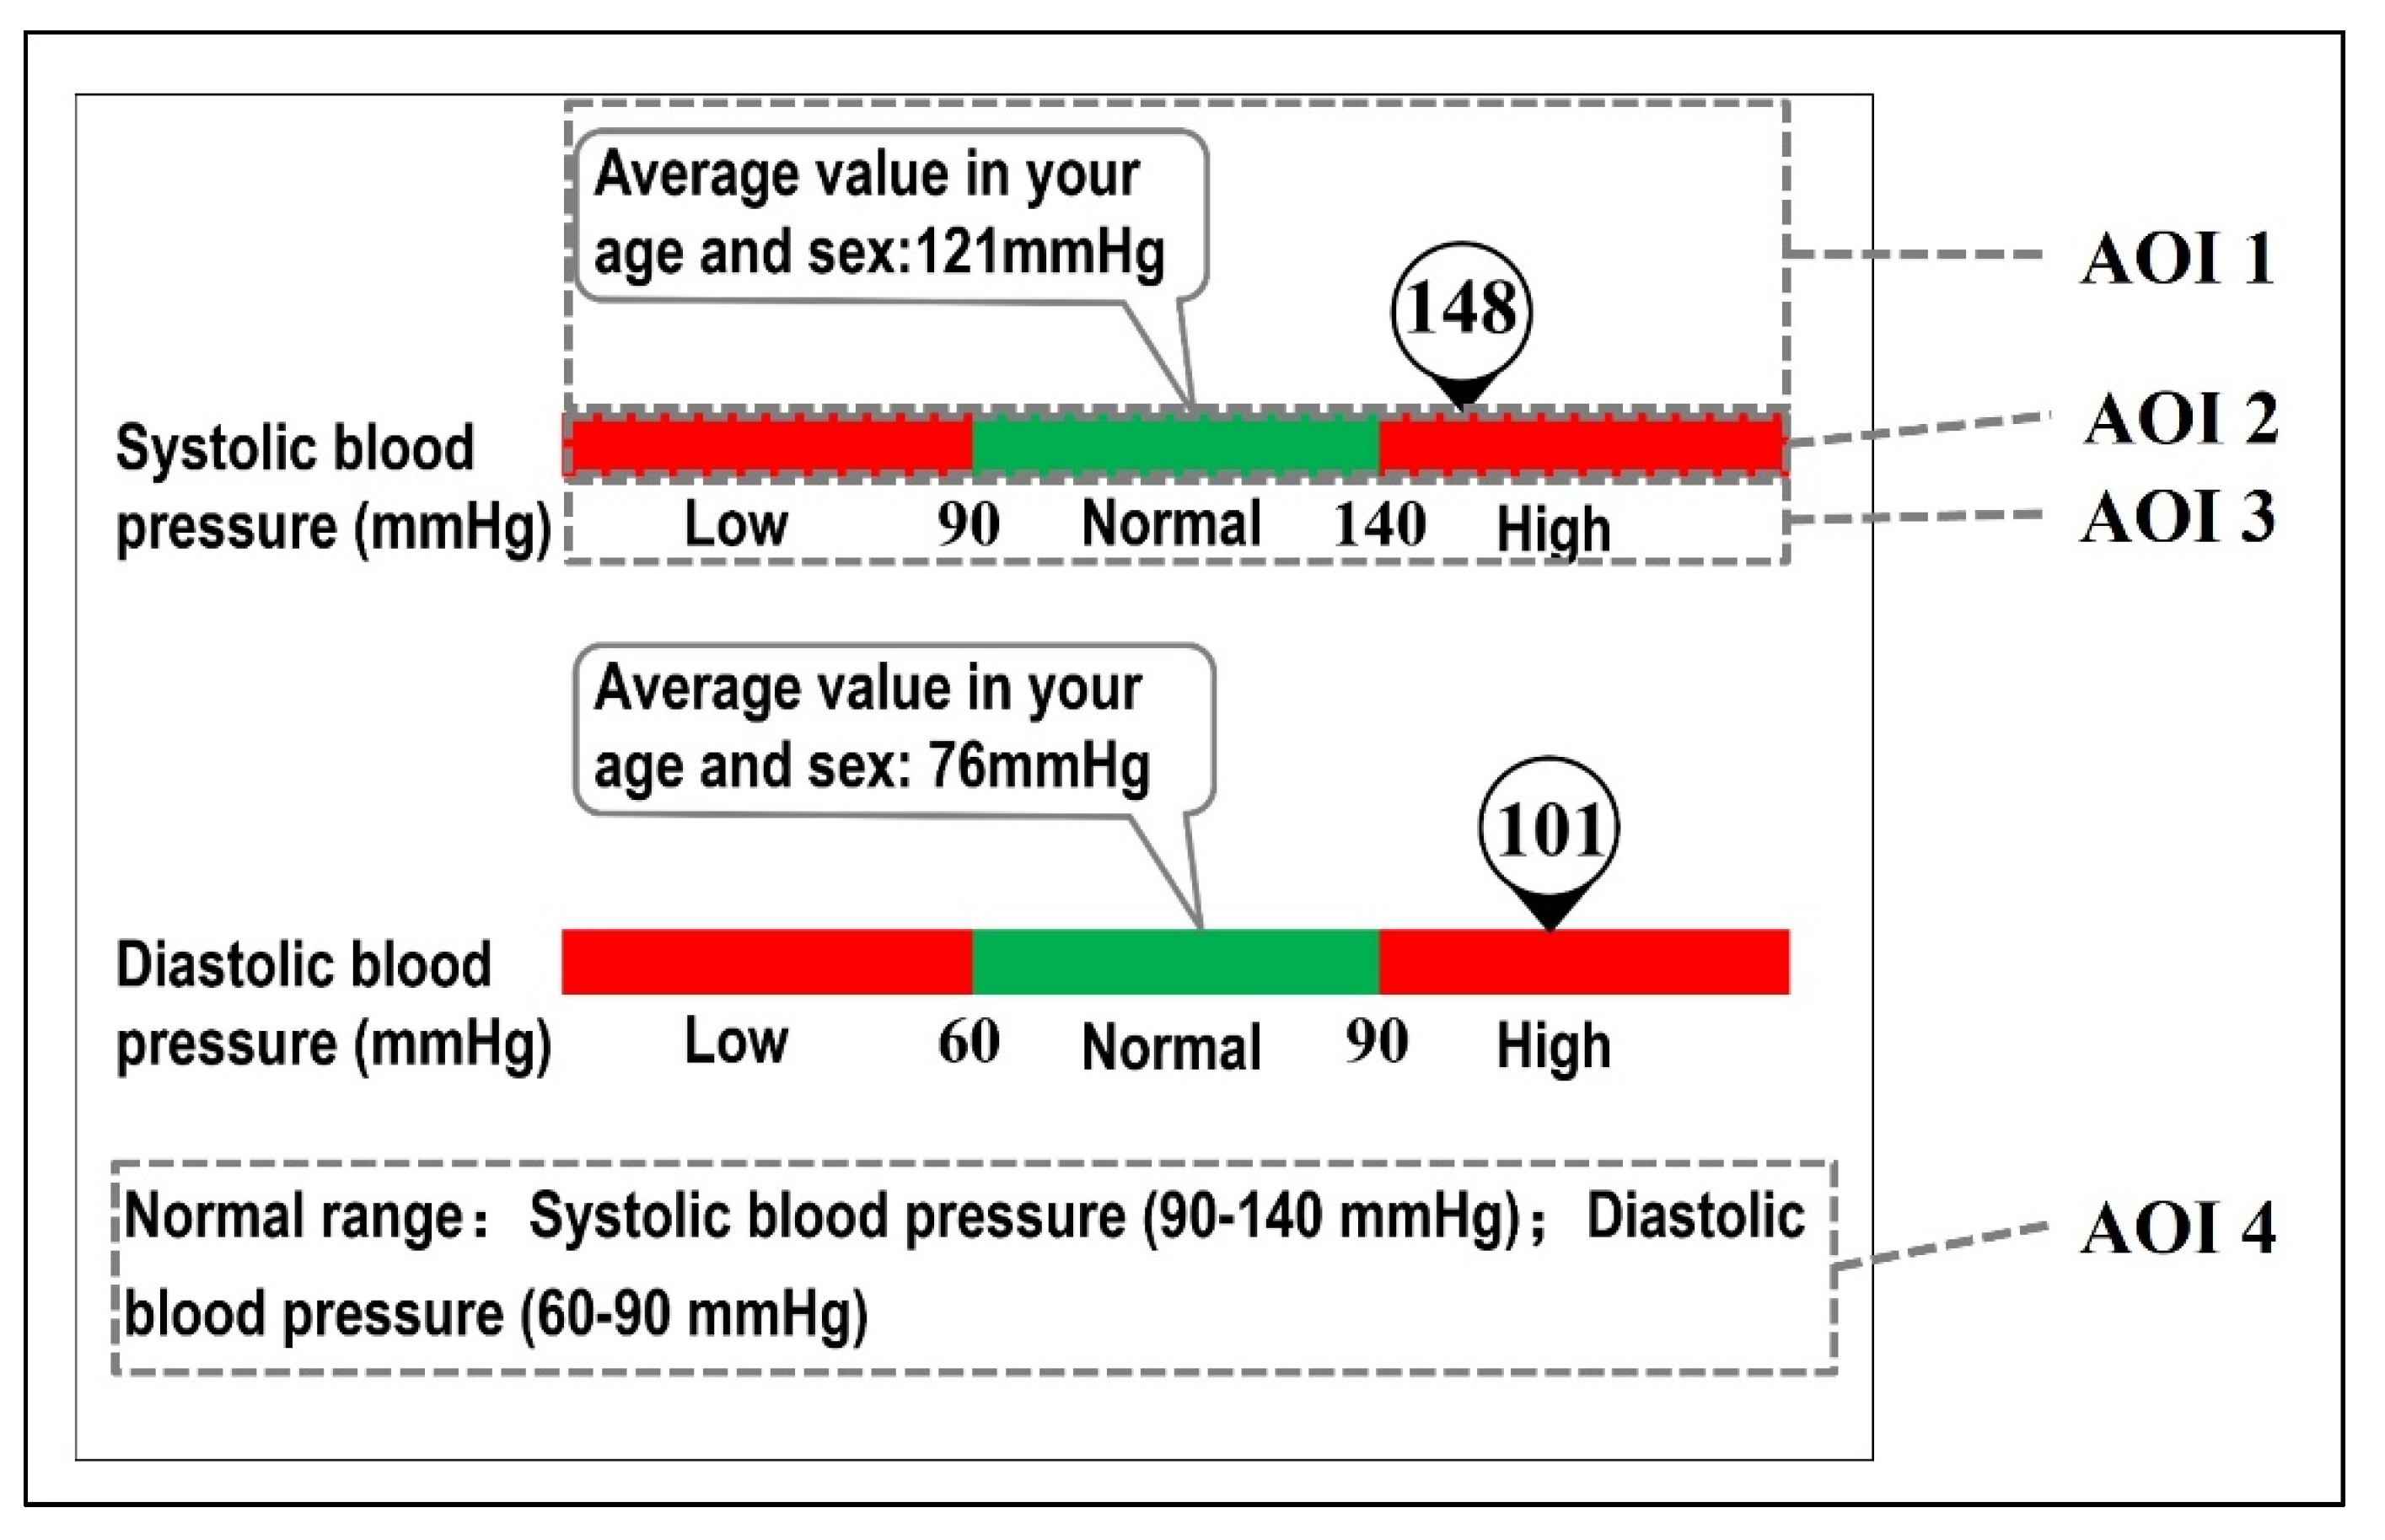
We measured participants’ task completion time, accuracy rate, and eye movement during the experiment. Task completion time was measured as the total time required to complete the tasks. Accuracy rate was calculated as the proportion of correct responses. To analyze participants’ visual attention, we defined four areas of interests (AOIs) on the images (Figure 2). For each AOI, eye movement measures included time to first fixation (time from the start of the stimuli present until the participant fixated on the AOI for the first time), first fixation duration (duration of the first fixation within an AOI), total fixation duration (duration of all fixations within an AOI), fixation count (number of times a participant fixated on an AOI), total visit duration (duration of all visits within an AOI), and visit count (number of times a participant visited an AOI). These fundamental eye movement metrics were selected according to previous literature [39]. Time to first fixation and first fixation duration represent what grabs participants’ attention first. The AOI that yield the shortest time to first fixation may have attention-attracting properties [47]. Fixation count can indicate the importance of information in a specific AOI, with more fixation counts indicating higher importance of the AOI. Total fixation duration can indicate the duration of cognitive processing on information, with longer fixation duration representing longer cognitive processing [48]. Visit count and duration represent participants’ interest or ease of understanding with information presented in a specific AOI.
2.7. Data Analysis
Mixed-design repeated-measures ANOVAs, validated with Mauchly’s sphericity test, were performed to investigate the effects of visualization, AOI, and age on dependent measures. The violation of the sphericity assumption led to the use of Greenhouse–Geisser adjusted degree of freedom and p-values. Post hoc multiple comparisons were performed with Bonferroni adjustments.
3. Results
3.1. Performance Measures
Age showed a significant effect on accuracy rate (F(1, 39) = 13.63, p = 0.001) and task completion time (F(1, 39) = 56.07, p < 0.001) in the verbatim comprehension task. Age also yielded a significant effect on accuracy rate (F(1, 39) = 13.03, p = 0.001) and task completion time (F(1, 39) = 27.04, p < 0.001) in the value interpretation task. Older adults yielded lower accuracy rate and longer task completion time compared to younger adults in the two tasks (Table 1). Comparable accuracy rate and task completion time were observed across the four visualizations in the two tasks. Moreover, there was no significant interaction effect between age and visualization (Figure 3).
3.2. Eye Movement Measures
3.2.1. Time to First Fixation and First Fixation Duration
AOI showed a significant effect on time to first fixation (F(1.37, 23.22) = 8.32, p = 0.005). AOI 1 resulted in shorter time to first fixation than that for AOIs 2 and 4 (see Table 2). Age showed a significant effect on time to first fixation (F(1, 17) = 27.24, p < 0.001). Shorter time to first fixation was observed among younger adults compared with older adults. Moreover, there was a significant interaction between AOI and age (F(1.37, 23.22) = 11.66, p = 0.001). AOI 4 yielded significantly longer time to first fixation than the other three AOIs among older adults, whereas the four AOIs yielded similar time to first fixation among younger adults (Figure 4). There was no effect of visualization on time to first fixation duration. No other significant interaction was observed.
AOI showed a significant effect on first fixation duration (F(3, 33) = 6.40, p = 0.002). AOI 1 resulted in longer first fixation duration than AOIs 3 and 4. Visualization and age did not have a significant effect on first fixation duration. No significant interaction was observed.
3.2.2. Total Fixation Duration and Fixation Count
The four visualizations achieved similar total fixation duration and fixation count. AOI showed a significant main effect on total fixation duration (F(1.70, 28.87) = 9.17, p = 0.001) and fixation count (F(1.60, 27.16) = 6.09, p = 0.01). AOI 4 yielded the shortest total fixation duration than other AOIs (see Table 3). Moreover, AOI 2 achieved significantly shorter total fixation duration than AOI 1. AOIs 1 and 3 yielded more fixations than AOI 4. Age had significant effects on total fixation duration (F(1, 17) = 16.57, p = 0.001) and fixation count (F(1, 17) = 11.41, p = 0.04). Older adults achieved longer total fixation duration and more fixations than younger adults. The interaction between visualization and AOI was significant for both total fixation duration (F(2.20, 37.40) = 4.65, p = 0.01) and fixation count (F(2.65, 44.97) = 3.90, p = 0.02). AOI 3 in visualizations B and C yielded longer total fixation duration and more fixations than it in Visualization A, and AOI 1 in Visualization B yielded longer total fixation duration than it in Visualization A. Additionally, a significant interaction between AOI and age was observed for total fixation duration (F(1.70, 28.87) = 5.43, p = 0.01) and fixation count (F(1.60, 27.16) = 5.63, p = 0.01). AOI 4 yielded significantly longer total fixation duration and fewer fixations than other three AOIs among elderly participants, whereas the four AOIs yielded similar total fixation duration and fixation count among younger adults (see Figure 5). No other significant interaction was observed.
3.2.3. Total Visit Duration and Visit Count
Comparable total visit duration and visit count were yielded across visualizations. AOI showed a significant main effect on total visit duration (F(1.42, 22.65) = 6.56, p = 0.01) and visit count (F(1.48, 25.23) = 13.59, p = 0.001). AOI 1 yielded significantly longer total visit duration than AOIs 2 and 4, and AOI 3 led to significantly longer total visit duration than AOI 4 (see Table 4). AOI 4 yielded the fewest visit counts compared with the other three AOIs. Age had significant effects on total visit duration (F(1, 16) = 10.90, p = 0.005) and visit count (F(1, 17) = 8.29, p = 0.01). Older adults achieved longer total visit duration and more visits than younger adults. Moreover, a significant interaction between AOI and age was observed for total visit duration (F(1.42, 22.65) = 4.00, p = 0.045) and visit count (F(1.48, 25.23) = 5.90, p = 0.01). AOI 2 yielded significantly longer total visit duration than other AOIs for elderly adults, whereas no significant difference in total visit duration was observed among the four AOIs for young adults (see Figure 6). AOI 4 yielded fewer visits than the other three AOIs among older adults, whereas no significant difference was observed among the four AOIs for young adults. No other significant interaction was observed.
4. Discussion
Inappropriate presentation of personalized digital health information may hinder patients’ understanding of their health status and their subsequent health care decision-making [15], stressing the need to examine how patients’ self-monitoring data should be better visualized. Consistent with previous studies [24,31,49], our results indicated that different visualizations of health information affected viewers’ comprehension. Compared with previous relevant studies, our study had the following advantages: (1) our study was one of the pioneer studies that dig deep into how visualizations with varied contextual cues (i.e., color, texts, and personalized statement) would affect viewers’ comprehension of digital health information; (2) we explored the underlying mechanism of how different visual designs influenced viewers’ visual attention using eye-tracking techniques; and (3) we examined how people in different age groups process visualized health information when different contextual cues were employed.
4.1. Main Findings
4.1.1. Performance Measures
We found that the four visualizations achieved comparable task performance, probably because they were all designed based on an RRNL graph. These visualizations in general shared the same layout, with limited differences in what and how the information cues were presented. Therefore, the differences in the four visualizations may be not able to significantly affect participants’ performance. This result indicated that the introduction of contextual cues would not induce additional workload and contextual cues could be used to improve information richness [27].
In addition, we observed significant effects of age on task performance in health information cognition, a finding consistent with previous literature [21]. In particular, older adults yielded longer task completion time and made more errors in comprehension of the self-monitoring results. This may be that older adults may have suffered from considerable difficulties when interpreting their health data due to the deterioration of their cognitive abilities. In addition, older adults have lower health literacy and graph literacy compared with young adults [19]. In contrast, the finding that younger adults had better task performance could be that they were more familiar with health data visualization, as they were more likely to use self-monitoring tools (e.g., fitness trackers) compared with older adults.
Moreover, it is important to note that, when assessing the effectiveness of visualization, we should put more weight on accuracy in relation to efficiency, because misunderstanding of health information may lead to inappropriate decision-making. In this case, it is favorable to employ more contextual cues (as this may not induce additional workload) to aid patients’ comprehension, even though this may sacrifice efficiency to a certain extent.
4.1.2. Eye Movement Metrics
Our results showed that AOI and age yielded significant effects on eye movement metrics. In particular, AOI 1 (presenting the number of test results) had the shortest time to first fixation and the longest first fixation duration. This finding is probably due to the good attention-attracting property that the large font size owns in the presentation of test result numbers [39]. In addition, it was also observed that AOIs 1 and 3 yielded more fixations. It indicated that these two AOIs contained important information for task completion, so that the participants paid more attention to these AOIs. The significant interaction between visualization and AOI indicated that AOI 3 yielded more fixations for visualizations B and C than A. The reason may be that visualizations B and C contained information cues for explaining the cut-off points compared with Visualization A. It is likely that the additional information cues in AOI 3 have successfully attracted more visual attention and could be an effective way to present important information. Besides, we observed that AOI 1 yielded the longest total fixation duration, indicating that participants took more time to understand the information presented in AOI 1. A possible explanation is that the information in AOI 1 was different across trials; therefore, participants need more time to process the novel stimulus.
The results regarding visit measures indicated that AOI 4 yielded fewer visits than for the remaining areas. It indicated that participants have seldom examined this area in their task performance. One explanation may be that AOI 4 was in a peripheral area compared with other AOIs and was easy to be ignored. Another reason could be that the information presented in AOI 4, in fact, conveyed the same meaning as in AOI 3. It is likely that the participants have already been able to comprehend the self-monitoring results by reading the visualized information in AOI 3, and thus they did not need to visit AOI 4 again. Overall, the result indicates that visualization could be an effective way to guide users’ visual attention to important information. Results of the total visit duration indicated that AOIs 1 and 3 yielded the longest total visit time, which is consistent with the results on total fixation duration. This consistency is probably because the two AOIs contained the most important information. However, it should be noted that, in addition to the content, total visit duration may also be influenced by the size, complexity, color, and layout of the area.
Our results also indicated that older adults spent a longer amount of time to fixate on a specific AOI at the first time compared with younger adults. The interaction effect between AOI and age demonstrated that older adults spend the longest amount of time to first fixate their gaze on AOI 4, probably because the AOI was at the bottom of the image and the font size used in this AOI was relatively small, making older adults less likely to notice this area. In addition, older adults yielded longer total fixation duration and more fixations than younger adults. As for the interactions between AOI and age, the results illustrated that the area (AOI 4) with fewer fixations and shorter total fixation duration for older adults was also the one that older adults fixated their gaze on last, indicating that AOI 4 did not catch participants’ attention.
4.2. Implications
Our study provides both theoretical and practical implications for the presentation of digital health information. Theoretically, our work explains how different contextual cues influenced comprehension of digital health information and attracted visual attention. We also examined age-related differences in this process. Such contributions could be important, considering the lack of understanding of the underlying mechanisms in digital health information comprehension and the lack of theoretical guidance for the optimal design and visualization of such information for specific age groups. Moreover, our study demonstrated that an eye-tracking technique could be an effective tool in revealing the underlying mechanisms on how visual attention was affected by different visualizations.
Practically, our study provides important implications regarding how numeric health information could be better presented. First, although our findings may not be able to indicate an optimal design of visualizations, practitioners should be aware of the advantages and disadvantages of different visualizations. For example, the four visualizations could yield comparable efficiency and effectiveness in information comprehension. While the basic type owns a concise interface, other visualizations are featured with redundancy designs (e.g., use of color, text, and personalized information) that represent additional information cues. Those cues may help facilitate viewers’ confidence in their information comprehension without sacrificing efficiency and effectiveness [15].
Second, the observed age-related differences in information comprehension suggest that data visualizations that achieve high levels of comprehension performance for younger adults could not achieve equal performance for older adults. On one hand, additional assistance should be provided for older adults if current visualizations are to be employed in electronic health portals, so as to ensure that older adults are able to make appropriate health care decisions based on correct comprehension of their health data; on the other hand, it appears urgent to explore tailored design for older adults that can achieve comparable efficiency and effectiveness with younger adults. Participatory design [27,49,50] and usability evaluation [27,51] targeting older adults are two recognized user-centered design methods that can help achieve such purposes, and thus are recommended in future design of digital health information interfaces.
Finally, in line with many other studies [52], our results indicated that attention to visualized health information can be affected by both human (e.g., age) and interface (e.g., color, text, and location) characteristics. For example, older adults are more likely to ignore peripheral and less salient information (e.g., reference information located at the bottom of the image) compared with young adults. These results suggest that practitioners should consider better ways to present, position and configure information elements to facilitate viewers’ effective use of visual attention resources (e.g., attract, guide, and maintain viewers’ visual attention). For instance, salient information cues can attract and maintain more visual attention and could be used to present important information that MUST be noted by viewers. This is an especially effective design solution for older adults.
4.3. Limitations and Future Work
Similar to many other studies [21,22,24], our study was conducted in the context of hypothetical scenarios. The participants were asked to imagine that the presented health information was their own self-monitoring results, potentially resulting in a lack of personal relevance. Moreover, our experiments only asked participants to perform verbatim and comprehension tasks. However, for chronically ill patients, in addition to caring about the numbers, it is more important for them to know what they need to accomplish to deal with their health issues. Future studies could examine how information presentation would influence patients’ decision-making regarding their preferred course of action [21,31,42].
5. Conclusions
Visualizations are a promising tool to make digital health information easily comprehensible for chronically ill patients and help them engage with their own health information. The present study provides insights into how young and older adults comprehend numeric health information from graphs and how eye-tracking techniques could be used to reveal visual attention and information acquisition during the information comprehension process. Knowledge regarding the effects of contextual cues and age on task performance and visual attention provides important implications for the design and presentation of digital health information.
Author Contributions
Conceptualization, D.T.; methodology, D.T.; formal analysis, K.L. and P.S.; investigation, D.T.; writing—original draft preparation, K.L. and P.S.; writing—review and editing, K.L., D.T. and H.W.; visualization, K.L. and P.S.; project administration, D.T.; funding acquisition, D.T., K.L. and H.W. All authors have read and agreed to the published version of the manuscript.
Funding
This work was partly supported by the Foundation of Shenzhen Science and Technology Committee (Grant No. 20200813225029002), the National Natural Science Foundation of China (Grant No. 72101161, 72104176, 72101225), and the Departmental Start-up Fund at the Polytechnic University of Hong Kong (Grant No. P0034701).
Institutional Review Board Statement
The study was conducted in accordance with the Declaration of Helsinki, and the protocol was approved by the Ethics Committee of Shenzhen University (72101161).
Informed Consent Statement
Informed consent was obtained from all subjects involved in the study.
Data Availability Statement
Data are available on request from the corresponding author.
Acknowledgments
The authors thank Juan Yuan for her assistance in data collection.
Conflicts of Interest
The authors declare no conflict of interest.
References
- Kennedy, A.; Rogers, A.; Bower, P. Support for self care for patients with chronic disease. BMJ 2007, 335, 968–970. [Google Scholar] [CrossRef] [PubMed] [Green Version]
- Bodenheimer, T.; Lorig, K.; Holman, H.; Grumbach, K. Patient self-management of chronic disease in primary care. JAMA 2002, 288, 2469–2475. [Google Scholar] [CrossRef] [PubMed]
- Barlow, J.; Wright, C.; Sheasby, J.; Turner, A.; Hainsworth, J. Self-management approaches for people with chronic conditions: A review. Patient Educ. Couns. 2002, 48, 177–187. [Google Scholar] [CrossRef] [PubMed]
- McBain, H.; Shipley, M.; Newman, S. The impact of self-monitoring in chronic illness on healthcare utilisation: A systematic review of reviews. BMC Health Serv. Res. 2015, 15, 565. [Google Scholar] [CrossRef] [PubMed] [Green Version]
- Wilde, M.H.; Garvin, S. A concept analysis of self-monitoring. J. Adv. Nurs. 2007, 57, 339–350. [Google Scholar] [CrossRef]
- Richard, A.A.; Shea, K. Delineation of self-care and associated concepts. J. Nurs. Scholarsh. 2011, 43, 255–264. [Google Scholar] [CrossRef]
- Tao, D.; Wang, T.; Wang, T.; Liu, S.; Qu, X. Effects of consumer-oriented health information technologies in diabetes management over time: A systematic review and meta-analysis of randomized controlled trials. J. Am. Med. Inform. Assoc. 2017, 24, 1014–1023. [Google Scholar] [CrossRef] [Green Version]
- Liu, K.; Xie, Z.; Or, C.K. Effectiveness of mobile app-assisted self-care interventions for improving patient outcomes in type 2 diabetes and/or hypertension: Systematic review and meta-analysis of randomized controlled trials. JMIR Mhealth Uhealth 2020, 8, e15779. [Google Scholar] [CrossRef]
- Tao, D.; Wang, T.; Wang, T.; Zhang, T.; Zhang, X.; Qu, X. A systematic review and meta-analysis of user acceptance of consumer-oriented health information technologies. Comput. Hum. Behav. 2020, 104, 106147. [Google Scholar] [CrossRef]
- Wang, H.; Zhang, J.; Luximon, Y.; Qin, M.; Geng, P.; Tao, D. The determinants of user acceptance of mobile medical platforms: An investigation integrating the TPB, TAM, and patient-centered factors. Int. J. Environ. Res. Public Health 2022, 19, 10758. [Google Scholar] [CrossRef]
- Liu, K.; Tao, D. The roles of trust, personalization, loss of privacy, and anthropomorphism in public acceptance of smart healthcare services. Comput. Hum. Behav. 2022, 127, 107026. [Google Scholar] [CrossRef]
- Kapoor, A.; Guha, S.; Das, M.K.; Goswami, K.C.; Yadav, R. Digital healthcare: The only solution for better healthcare during COVID-19 pandemic? Indian Heart J. 2020, 72, 61–64. [Google Scholar] [CrossRef] [PubMed]
- Hollander, J.E.; Carr, B.G. Virtually perfect? Telemedicine for COVID-19. N. Engl. J. Med. 2020, 382, 1679–1681. [Google Scholar] [CrossRef] [PubMed]
- Liu, K.; Or, C.K.; So, M.; Cheung, B.; Chan, B.; Tiwari, A.; Tan, J. A longitudinal examination of tablet self-management technology acceptance by patients with chronic diseases: Integrating perceived hand function, perceived visual function, and perceived home space adequacy with the TAM and TPB. Appl. Ergon. 2022, 100, 103667. [Google Scholar] [CrossRef] [PubMed]
- Tao, D.; Yuan, J.; Qu, X. Presenting self-monitoring test results for consumers: The effects of graphical formats and age. J. Am. Med. Inform. Assoc. 2018, 25, 1036–1046. [Google Scholar] [CrossRef] [Green Version]
- Khaleel, I.; Wimmer, B.C.; Peterson, G.M.; Zaidi, S.T.R.; Roehrer, E.; Cummings, E.; Lee, K. Health information overload among health consumers: A scoping review. Patient Educ. Couns. 2020, 103, 15–32. [Google Scholar] [CrossRef]
- Trevena, L.J.; Bonner, C.; Okan, Y.; Peters, E.; Gaissmaier, W.; Han, P.K.; Ozanne, E.; Timmermans, D.; Zikmund-Fisher, B.J. Current challenges when using numbers in patient decision aids: Advanced concepts. Med. Decis. Mak. 2021, 41, 834–847. [Google Scholar] [CrossRef]
- Zikmund-Fisher, B.J.; Exe, N.L.; Witteman, H.O. Numeracy and literacy independently predict patients’ ability to identify out-of-range test results. J. Med. Internet Res. 2014, 16, e3241. [Google Scholar] [CrossRef]
- Smith, S.G.; Curtis, L.M.; O’Conor, R.; Federman, A.D.; Wolf, M.S. ABCs or 123s? The independent contributions of literacy and numeracy skills on health task performance among older adults. Patient Educ. Couns. 2015, 98, 991–997. [Google Scholar] [CrossRef] [Green Version]
- Morrow, D.; Chin, J. Decision making and health literacy among older adults. In Aging and Decision Making: Empirical and applied perspectives; Elsevier: Amsterdam, The Netherlands; Academic Press: San Diego, CA, USA, 2015; pp. 261–282. [Google Scholar]
- Bar-Lev, S.; Beimel, D. Numbers, graphs and words–do we really understand the lab test results accessible via the patient portals? Isr. J. Health Policy Res. 2020, 9, 58. [Google Scholar] [CrossRef]
- Morrow, D.; Azevedo, R.F.L.; Garcia-Retamero, R.; Hasegawa-Johnson, M.; Huang, T.; Schuh, W.; Gu, K.; Zhang, Y. Contextualizing numeric clinical test results for gist comprehension: Implications for EHR patient portals. J. Exp. Psychol. Appl. 2019, 25, 41. [Google Scholar] [CrossRef] [PubMed]
- Turchioe, M.R.; Myers, A.; Isaac, S.; Baik, D.; Grossman, L.V.; Ancker, J.S.; Creber, R.M. A systematic review of patient-facing visualizations of personal health data. Appl. Clin. Inform. 2019, 10, 751–770. [Google Scholar] [CrossRef]
- Tao, D.; Yuan, J.; Qu, X. Effects of presentation formats on consumers’ performance and perceptions in the use of personal health records among older and young adults. Patient Educ. Couns. 2019, 102, 578–585. [Google Scholar] [CrossRef] [PubMed]
- Bonner, C.; Trevena, L.J.; Gaissmaier, W.; Han, P.K.; Okan, Y.; Ozanne, E.; Peters, E.; Timmermans, D.; Zikmund-Fisher, B.J. Current best practice for presenting probabilities in patient decision aids: Fundamental principles. Med. Decis. Mak. 2021, 41, 821–833. [Google Scholar] [CrossRef]
- Grossman, L.V.; Feiner, S.K.; Mitchell, E.G.; Creber, R.M.M. Leveraging patient-reported outcomes using data visualization. Appl. Clin. Inform. 2018, 9, 565–575. [Google Scholar] [CrossRef] [PubMed] [Green Version]
- Arcia, A.; Suero-Tejeda, N.; Bales, M.E.; Merrill, J.A.; Yoon, S.; Woollen, J.; Bakken, S. Sometimes more is more: Iterative participatory design of infographics for engagement of community members with varying levels of health literacy. J. Am. Med. Inform. Assoc. 2016, 23, 174–183. [Google Scholar] [CrossRef] [PubMed] [Green Version]
- Turchioe, M.R.; Grossman, L.V.; Myers, A.C.; Baik, D.; Goyal, P.; Creber, R.M.M. Visual analogies, not graphs, increase patients’ comprehension of changes in their health status. J. Am. Med. Inform. Assoc. 2020, 27, 677–689. [Google Scholar] [CrossRef]
- Snyder, C.F.; Smith, K.C.; Bantug, E.T.; Tolbert, E.; Blackford, A.L.; Brundage, M.D. What do these scores mean? Presenting patien” reported outcomes data to patients and clinicians to improve interpretability. Cancer 2017, 123, 1848–1859. [Google Scholar] [CrossRef] [Green Version]
- Tolbert, E.; Brundage, M.D.; Bantug, E.T.; Blackford, A.L.; Smith, K.C.; Snyder, C.F. Picture this: Presenting longitudinal patient-reported outcome research study results to patients. Med. Decis. Mak. 2018, 38, 1005–1994. [Google Scholar] [CrossRef]
- Zikmund-Fisher, B.J.; Scherer, A.M.; Witteman, H.O.; Solomon, J.B.; Exe, N.L.; Tarini, B.A.; Fagerlin, A. Graphics help patients distinguish between urgent and non-urgent deviations in laboratory test results. J. Am. Med. Inform. Assoc. 2017, 24, 520–528. [Google Scholar] [CrossRef]
- Tao, D.; Wang, T.; Wang, T.; Qu, X. Influence of drug colour on perceived drug effects and efficacy. Ergonomics 2018, 61, 284–294. [Google Scholar] [CrossRef] [PubMed]
- Houts, P.S.; Doak, C.C.; Doak, L.G.; Loscalzo, M.J. The role of pictures in improving health communication: A review of research on attention, comprehension, recall, and adherence. Patient Educ. Couns. 2006, 61, 173–190. [Google Scholar] [CrossRef] [PubMed]
- Antúnez, L.; Giménez, A.; Maiche, A.; Ares, G. Influence of interpretation aids on attentional capture, visual processing, and understanding of front-of-package nutrition labels. J. Nutr. Educ. Behav. 2015, 47, 292–299.e291. [Google Scholar] [CrossRef] [PubMed]
- Maughan, L.; Gutnikov, S.; Stevens, R. Like more, look more. Look more, like more: The evidence from eye-tracking. J. Brand Manag. 2007, 14, 335–342. [Google Scholar] [CrossRef]
- Wang, J.; Antonenko, P.D. Instructor presence in instructional video: Effects on visual attention, recall, and perceived learning. Comput. Hum. Behav. 2017, 71, 79–89. [Google Scholar] [CrossRef] [Green Version]
- Brunyé, T.T.; Drew, T.; Weaver, D.L.; Elmore, J.G. A review of eye tracking for understanding and improving diagnostic interpretation. Cogn. Res. Princ. Implic. 2019, 4, 7. [Google Scholar] [CrossRef]
- Duchowski, A.T. Eye Tracking Methodology: Theory and Practice, 3rd ed.; Springer International Publishing AG: Cham, Switzerland, 2017. [Google Scholar]
- Ares, G.; Giménez, A.; Bruzzone, F.; Vidal, L.; Antúnez, L.; Maiche, A. Consumer visual processing of food labels: Results from an eye tracking study. J. Sens. Stud. 2013, 28, 138–153. [Google Scholar] [CrossRef]
- Arslan, O.; Atik, O.; Kahraman, S. Eye tracking in usability of electronic chart display and information system. J. Navig. 2021, 74, 594–604. [Google Scholar] [CrossRef]
- Cho, H.; Powell, D.; Pichon, A.; Kuhns, L.M.; Garofalo, R.; Schnall, R. Eye-tracking retrospective think-aloud as a novel approach for a usability evaluation. Int. J. Med. Inform. 2019, 129, 366–373. [Google Scholar] [CrossRef] [PubMed]
- Brewer, N.T.; Gilkey, M.B.; Lillie, S.E.; Hesse, B.W.; Sheridan, S.L. Tables or bar graphs? Presenting test results in electronic medical records. Med. Decis. Mak. 2012, 32, 545–553. [Google Scholar] [CrossRef]
- Damman, O.C.; Hendriks, M.; Rademakers, J.; Spreeuwenberg, P.; Delnoij, D.M.; Groenewegen, P.P. Consumers’ interpretation and use of comparative information on the quality of health care: The effect of presentation approaches. Health Expect. 2012, 15, 197–211. [Google Scholar] [CrossRef] [PubMed] [Green Version]
- Scherer, A.M.; Witteman, H.O.; Solomon, J.; Exe, N.L.; Fagerlin, A.; Zikmund-Fisher, B.J. Improving the understanding of test results by substituting (not adding) goal ranges: Web-based between-subjects experiment. J. Med. Internet Res. 2018, 20, e11027. [Google Scholar] [CrossRef] [PubMed]
- Leung, A.A.; Nerenberg, K.A.; Daskalopoulou, S.S.; McBrien, K.A.; Zarnke, K.; Dasgupta, K.; Cloutier, L.; Gelfer, M.; Lamarre-Cliche, M.; Milot, A.; et al. Hypertension Canada’s 2016 Canadian hypertension education program guidelines for blood pressure measurement, diagnosis, assessment of risk, prevention, and treatment of hypertension. Can. J. Cardiol. 2016, 32 5, 569–588. [Google Scholar] [CrossRef]
- American Diabetes Association. Standards of medical care in diabetes 2019. Diabetes Care 2019, 42, S81–S89. [Google Scholar] [CrossRef] [PubMed] [Green Version]
- Byrne, M.D.; Anderson, J.R.; Douglass, S.; Matessa, M. Eye tracking the visual search of click-down menus. In Proceedings of the SIGCHI Conference on Human Factors in Computing Systems, Pittsburgh, PA, USA, 15–20 May 1999; pp. 402–409. [Google Scholar]
- Cooke, L. Is eye tracking the next step in usability testing? In Proceedings of the 2006 IEEE International Professional Communication Conference, Saragota Springs, NY, USA, 23–25 October 2006; pp. 236–242. [Google Scholar]
- Arcia, A.; George, M.; Lor, M.; Mangal, S.; Bruzzese, J.-M. Design and Comprehension Testing of Tailored Asthma Control Infographics for Adults with Persistent Asthma. Appl. Clin. Inform. 2019, 10, 643–654. [Google Scholar] [CrossRef]
- Reading Turchioe, M.; Grossman, L.V.; Baik, D.; Lee, C.S.; Maurer, M.S.; Goyal, P.; Safford, M.M.; Masterson Creber, R.M. Older adults can successfully monitor symptoms using an inclusively designed mobile application. J. Am. Geriatr. Soc. 2020, 68, 1313–1318. [Google Scholar] [CrossRef]
- Barros, I.M.; Alcantara, T.; Mesquita, A.R.; Bispo, M.L.; Rocha, C.E.d.; Moreira, V.P.; Lyra Junior, D.P.d. Understanding of pictograms from the United States Pharmacopeia Dispensing Information (USP-DI) among elderly Brazilians. Patient Prefer. Adherence 2014, 8, 1493–1501. [Google Scholar] [CrossRef] [Green Version]
- Graham, D.J.; Jeffery, R.W. Location, location, location: Eye-tracking evidence that consumers preferentially view prominently positioned nutrition information. J. Am. Diet. Assoc. 2011, 111, 1704–1711. [Google Scholar] [CrossRef]
Figure 1.
Examples of the four examined visualizations.

Figure 2.
The four areas of interest (AOIs) for each type of visualization (using Visualization D as an example: AOI 1 covered areas for presenting the numbers of blood pressure/blood glucose, AOI 2 covered areas for the color cue, AOI 3 covered areas for the text cue, and AOI 4 covered area presenting the reference information of the normal range).

Figure 3.
Interaction effects of visualization and age on accuracy rate and task completion time for the verbatim comprehension task (a,b) and the value interpretation task (c,d). Error bars show standard errors. Notes: V-A: basic, V-B: color, V-C: color + text, V-D: color + text + personalized statement.

Figure 4.
Interaction effects of visualization, age, and AOI on time to first fixation (a,b) and first fixation duration (c,d). Error bars show standard errors. Notes: V-A: basic, V-B: color, V-C: color + text, V-D: color + text + personalized statement.
Figure 4.
Interaction effects of visualization, age, and AOI on time to first fixation (a,b) and first fixation duration (c,d). Error bars show standard errors. Notes: V-A: basic, V-B: color, V-C: color + text, V-D: color + text + personalized statement.

Figure 5.
Interaction effects of visualization, age, and AOI on total fixation duration (a,b) and fixation count (c,d). Error bars show standard errors. Notes: V-A: basic, V-B: color, V-C: color + text, V-D: color + text + personalized statement.
Figure 5.
Interaction effects of visualization, age, and AOI on total fixation duration (a,b) and fixation count (c,d). Error bars show standard errors. Notes: V-A: basic, V-B: color, V-C: color + text, V-D: color + text + personalized statement.

Figure 6.
Interaction effects of visualization, age, and AOI on total visit duration (a,b) and visit count (c,d). Error bars show standard errors. Notes: V-A: basic, V-B: color, V-C: color + text, V-D: color + text + personalized statement.
Figure 6.
Interaction effects of visualization, age, and AOI on total visit duration (a,b) and visit count (c,d). Error bars show standard errors. Notes: V-A: basic, V-B: color, V-C: color + text, V-D: color + text + personalized statement.


Table 1.
Task completion time and accuracy rate by visualizations and age.
| Accuracy Rate (%) | Task Completion Time (s) | |||||||
|---|---|---|---|---|---|---|---|---|
| Descriptive Analysis | ANOVA | Descriptive Analysis | ANOVA | |||||
| Mean | SD | F Value | p Value | Mean | SD | F Value | p Value | |
| Verbatim comprehension task | ||||||||
| Visualization (V) | 0.83 | 0.46 | 1.28 | 0.29 | ||||
| V-A | 78.2 | 0.3 | 19.5 | 7.3 | ||||
| V-B | 74.8 | 0.3 | 23.0 | 16.9 | ||||
| V-C | 77.3 | 0.3 | 22.9 | 12.2 | ||||
| V-D | 73.6 | 0.4 | 24.1 | 10.8 | ||||
| Age | 13.63 | 0.001 | 56.07 | <0.001 | ||||
| Young | 91.3 | 0.2 | 13.8 | 6.8 | ||||
| Old | 60.6 | 0.2 | 31.0 | 6.8 | ||||
| Value interpretation task | ||||||||
| Visualization (V) | 0.84 | 0.48 | 0.29 | 0.77 | ||||
| V-A | 86.7 | 0.2 | 4.0 | 1.8 | ||||
| V-B | 87.2 | 0.2 | 4.3 | 3.2 | ||||
| V-C | 84.9 | 0.2 | 4.0 | 2.9 | ||||
| V-D | 83.0 | 0.2 | 4.3 | 2.5 | ||||
| Age | 13.03 | 0.001 | 27.04 | <0.001 | ||||
| Young | 94.0 | 0.1 | 2.9 | 1.4 | ||||
| Old | 76.9 | 0.1 | 5.4 | 1.4 | ||||
Notes: V-A: basic, V-B: color, V-C: color + text, V-D: color + text + personalized statement.
Table 2.
Time to first fixation and first fixation duration by visualizations, age and AOIs.
| Time to First Fixation (s) | First Fixation Duration (s) | |||||||
|---|---|---|---|---|---|---|---|---|
| Descriptive Analysis | ANOVA | Descriptive Analysis | ANOVA | |||||
| Mean | SD | F Value | p Value | Mean | SD | F Value | p Value | |
| Visualization (V) | 1.26 | 0.30 | 0.53 | 0.57 | ||||
| V-A | 3.36 | 1.50 | 0.20 | 0.11 | ||||
| V-B | 4.35 | 3.06 | 0.23 | 0.14 | ||||
| V-C | 3.26 | 1.32 | 0.21 | 0.09 | ||||
| V-D | 3.76 | 2.06 | 0.21 | 0.08 | ||||
| AOI | 8.32 | 0.005 | 6.40 | 0.002 | ||||
| AOI1 | 2.34 | 0.65 | 0.26 | 0.16 | ||||
| AOI2 | 3.34 | 1.19 | 0.21 | 0.10 | ||||
| AOI3 | 3.27 | 1.56 | 0.20 | 0.07 | ||||
| AOI4 | 5.77 | 4.12 | 0.17 | 0.07 | ||||
| Age | 27.24 | <0.001 | <0.001 | 0.99 | ||||
| Young | 2.15 | 1.24 | 0.21 | 0.07 | ||||
| Old | 5.22 | 1.24 | 0.21 | 0.05 | ||||
Notes: V-A: basic, V-B: color, V-C: color + text, V-D: color + text + personalized statement.
Table 3.
Total fixation duration and fixation count by visualizations, age and AOIs.
| Total Fixation Duration (s) | Fixation Count | |||||||
|---|---|---|---|---|---|---|---|---|
| Descriptive Analysis | ANOVA | Descriptive Analysis | ANOVA | |||||
| Mean | SD | F Value | p Value | Mean | SD | F Value | p Value | |
| Visualization (V) | 1.69 | 0.21 | 1.51 | 0.24 | ||||
| V-A | 0.83 | 0.35 | 4.26 | 2.56 | ||||
| V-B | 1.52 | 0.98 | 6.57 | 3.97 | ||||
| V-C | 1.34 | 0.97 | 5.44 | 3.15 | ||||
| V-D | 1.75 | 2.31 | 7.73 | 9.76 | ||||
| AOI | 9.17 | 0.001 | 6.09 | 0.01 | ||||
| AOI1 | 2.02 | 1.56 | 7.94 | 6.81 | ||||
| AOI2 | 1.25 | 1.05 | 5.59 | 4.15 | ||||
| AOI3 | 1.53 | 0.77 | 6.85 | 2.62 | ||||
| AOI4 | 0.63 | 0.36 | 3.61 | 2.34 | ||||
| Age | 16.57 | 0.001 | 11.41 | 0.04 | ||||
| Young | 0.67 | 0.71 | 3.44 | 3.18 | ||||
| Old | 2.05 | 0.71 | 8.56 | 3.18 | ||||
Notes: V-A: basic, V-B: color, V-C: color + text, V-D: color + text + personalized statement.
Table 4.
Total visit duration and visit count by visualizations, age, and AOIs.
| Total Visit Duration (s) | Visit Count | |||||||
|---|---|---|---|---|---|---|---|---|
| Descriptive Analysis | ANOVA | Descriptive Analysis | ANOVA | |||||
| Mean | SD | F Value | p Value | Mean | SD | F Value | p Value | |
| Visualization (V) | 1.31 | 0.28 | 1.79 | 0.16 | ||||
| V-A | 1.35 | 0.79 | 2.63 | 1.40 | ||||
| V-B | 2.42 | 1.58 | 4.07 | 2.31 | ||||
| V-C | 2.01 | 1.59 | 2.96 | 1.39 | ||||
| V-D | 2.94 | 4.56 | 4.25 | 4.87 | ||||
| AOI | 6.56 | 0.01 | 13.59 | 0.001 | ||||
| AOI1 | 3.44 | 3.31 | 4.61 | 3.18 | ||||
| AOI2 | 1.85 | 1.61 | 3.68 | 2.31 | ||||
| AOI3 | 2.33 | 1.23 | 3.76 | 1.42 | ||||
| AOI4 | 1.09 | 0.83 | 1.85 | 0.85 | ||||
| Age | 10.90 | 0.005 | 8.29 | 0.01 | ||||
| Young | 1.10 | 1.36 | 2.31 | 1.71 | ||||
| Old | 3.26 | 1.35 | 4.65 | 1.71 | ||||
Notes: V-A: basic, V-B: color, V-C: color + text, V-D: color + text + personalized statement.
Publisher’s Note: MDPI stays neutral with regard to jurisdictional claims in published maps and institutional affiliations. |
© 2022 by the authors. Licensee MDPI, Basel, Switzerland. This article is an open access article distributed under the terms and conditions of the Creative Commons Attribution (CC BY) license (https://creativecommons.org/licenses/by/4.0/).
Share and Cite
MDPI and ACS Style
Liu, K.; Su, P.; Wang, H.; Tao, D. Contextualizing Visualizations of Digital Health Information among Young and Older Adults Based on Eye-Tracking. Sustainability 2022, 14, 16506. https://0-doi-org.brum.beds.ac.uk/10.3390/su142416506
AMA Style
Liu K, Su P, Wang H, Tao D. Contextualizing Visualizations of Digital Health Information among Young and Older Adults Based on Eye-Tracking. Sustainability. 2022; 14(24):16506. https://0-doi-org.brum.beds.ac.uk/10.3390/su142416506
Chicago/Turabian StyleLiu, Kaifeng, Pengbo Su, Hailiang Wang, and Da Tao. 2022. "Contextualizing Visualizations of Digital Health Information among Young and Older Adults Based on Eye-Tracking" Sustainability 14, no. 24: 16506. https://0-doi-org.brum.beds.ac.uk/10.3390/su142416506
Note that from the first issue of 2016, this journal uses article numbers instead of page numbers. See further details here.