

Multifunctional Design of Vibrational Energy Harvesters in a Bridge Structure
Department of Civil & Environmental Engineering, Clarkson University, Potsdam, NY 13699, USA
*
Author to whom correspondence should be addressed.
Sustainability 2022, 14(24), 16540; https://0-doi-org.brum.beds.ac.uk/10.3390/su142416540
Submission received: 30 June 2022
/
Revised: 21 September 2022
/
Accepted: 6 October 2022
/
Published: 9 December 2022
(This article belongs to the Special Issue Architectural, Civil, and Infrastructure Engineering in View of Sustainability)
Abstract
:This paper aims to integrate vibrational energy harvesters into bridge structures in a holistic fashion that can lessen energy demands for safe bridge operation thus potentially increasing their sustainability. Computationally efficient methodologies, that target the locality of the connection of the harvesters, are utilized to determine optimal harvester frequencies that maximize the total power generation of installed vibrational energy harvesters. Previous findings from the authors indicate that a distributed configuration of harvesters can generate equal or more power than one traditional large harvester when attached to a building structure with total equivalent harvester mass. This paper investigates whether those findings also apply to bridge structures. Results from a cable-stayed bridge model equipped with two or more harvesters along its deck are presented and discussed. Distributed gardens are investigated as a means to integrate the harvester mass with the pre-existing bridge structure. It is found that an equivalent, slightly larger, amount of power is captured by the distributed garden design compared to a single pair of large harvesters placed near the center of the bridge. This performance is very promising as the distributed garden design would enable the enhancement of the structure’s aesthetics while also potentially creating ecological and environmental benefits.
1. Introduction
Vibrations are present in nature and in all man-made infrastructures. Civil infrastructure, such as buildings and bridges, is constantly exposed to a variety of vibration input sources, including ambient vibrations [1,2,3,4,5,6,7,8], human and vehicular traffic [4,9,10]. These motion-based vibrations can be more significant under seismic activity or earthquakes [8,11]. The vibrations caused by these energy sources are very attractive targets for infrastructure scale vibrational energy harvesters with the dual purpose of alleviating the deleterious effects caused by the vibrations and also as a source of energy capture and reuse.
Modern and economically driven architecture has based its structural design and construction techniques on the implementation of taller and lighter structures achieved through the use of less materials and with the aid of new technologies that target greater efficiency [12]. These construction techniques, that develop lighter structures, have created a secondary, but still of great importance, problem: human discomfort. The implementation of this harvesting technology in buildings and bridges, can both improve the comfort of structural occupants, by mitigating structural vibrations, while harvesting and storing the energy in a reusable electrical form.
In general, civil infrastructure systems are exposed to environmental hazards, fatigue, material aging and earthquakes; this is particularly so for bridges, which continue to degrade with the passage of time [13]. These dynamic loadings have the potential to offer sustainable energy sources that can be harvested to power electronic devices.
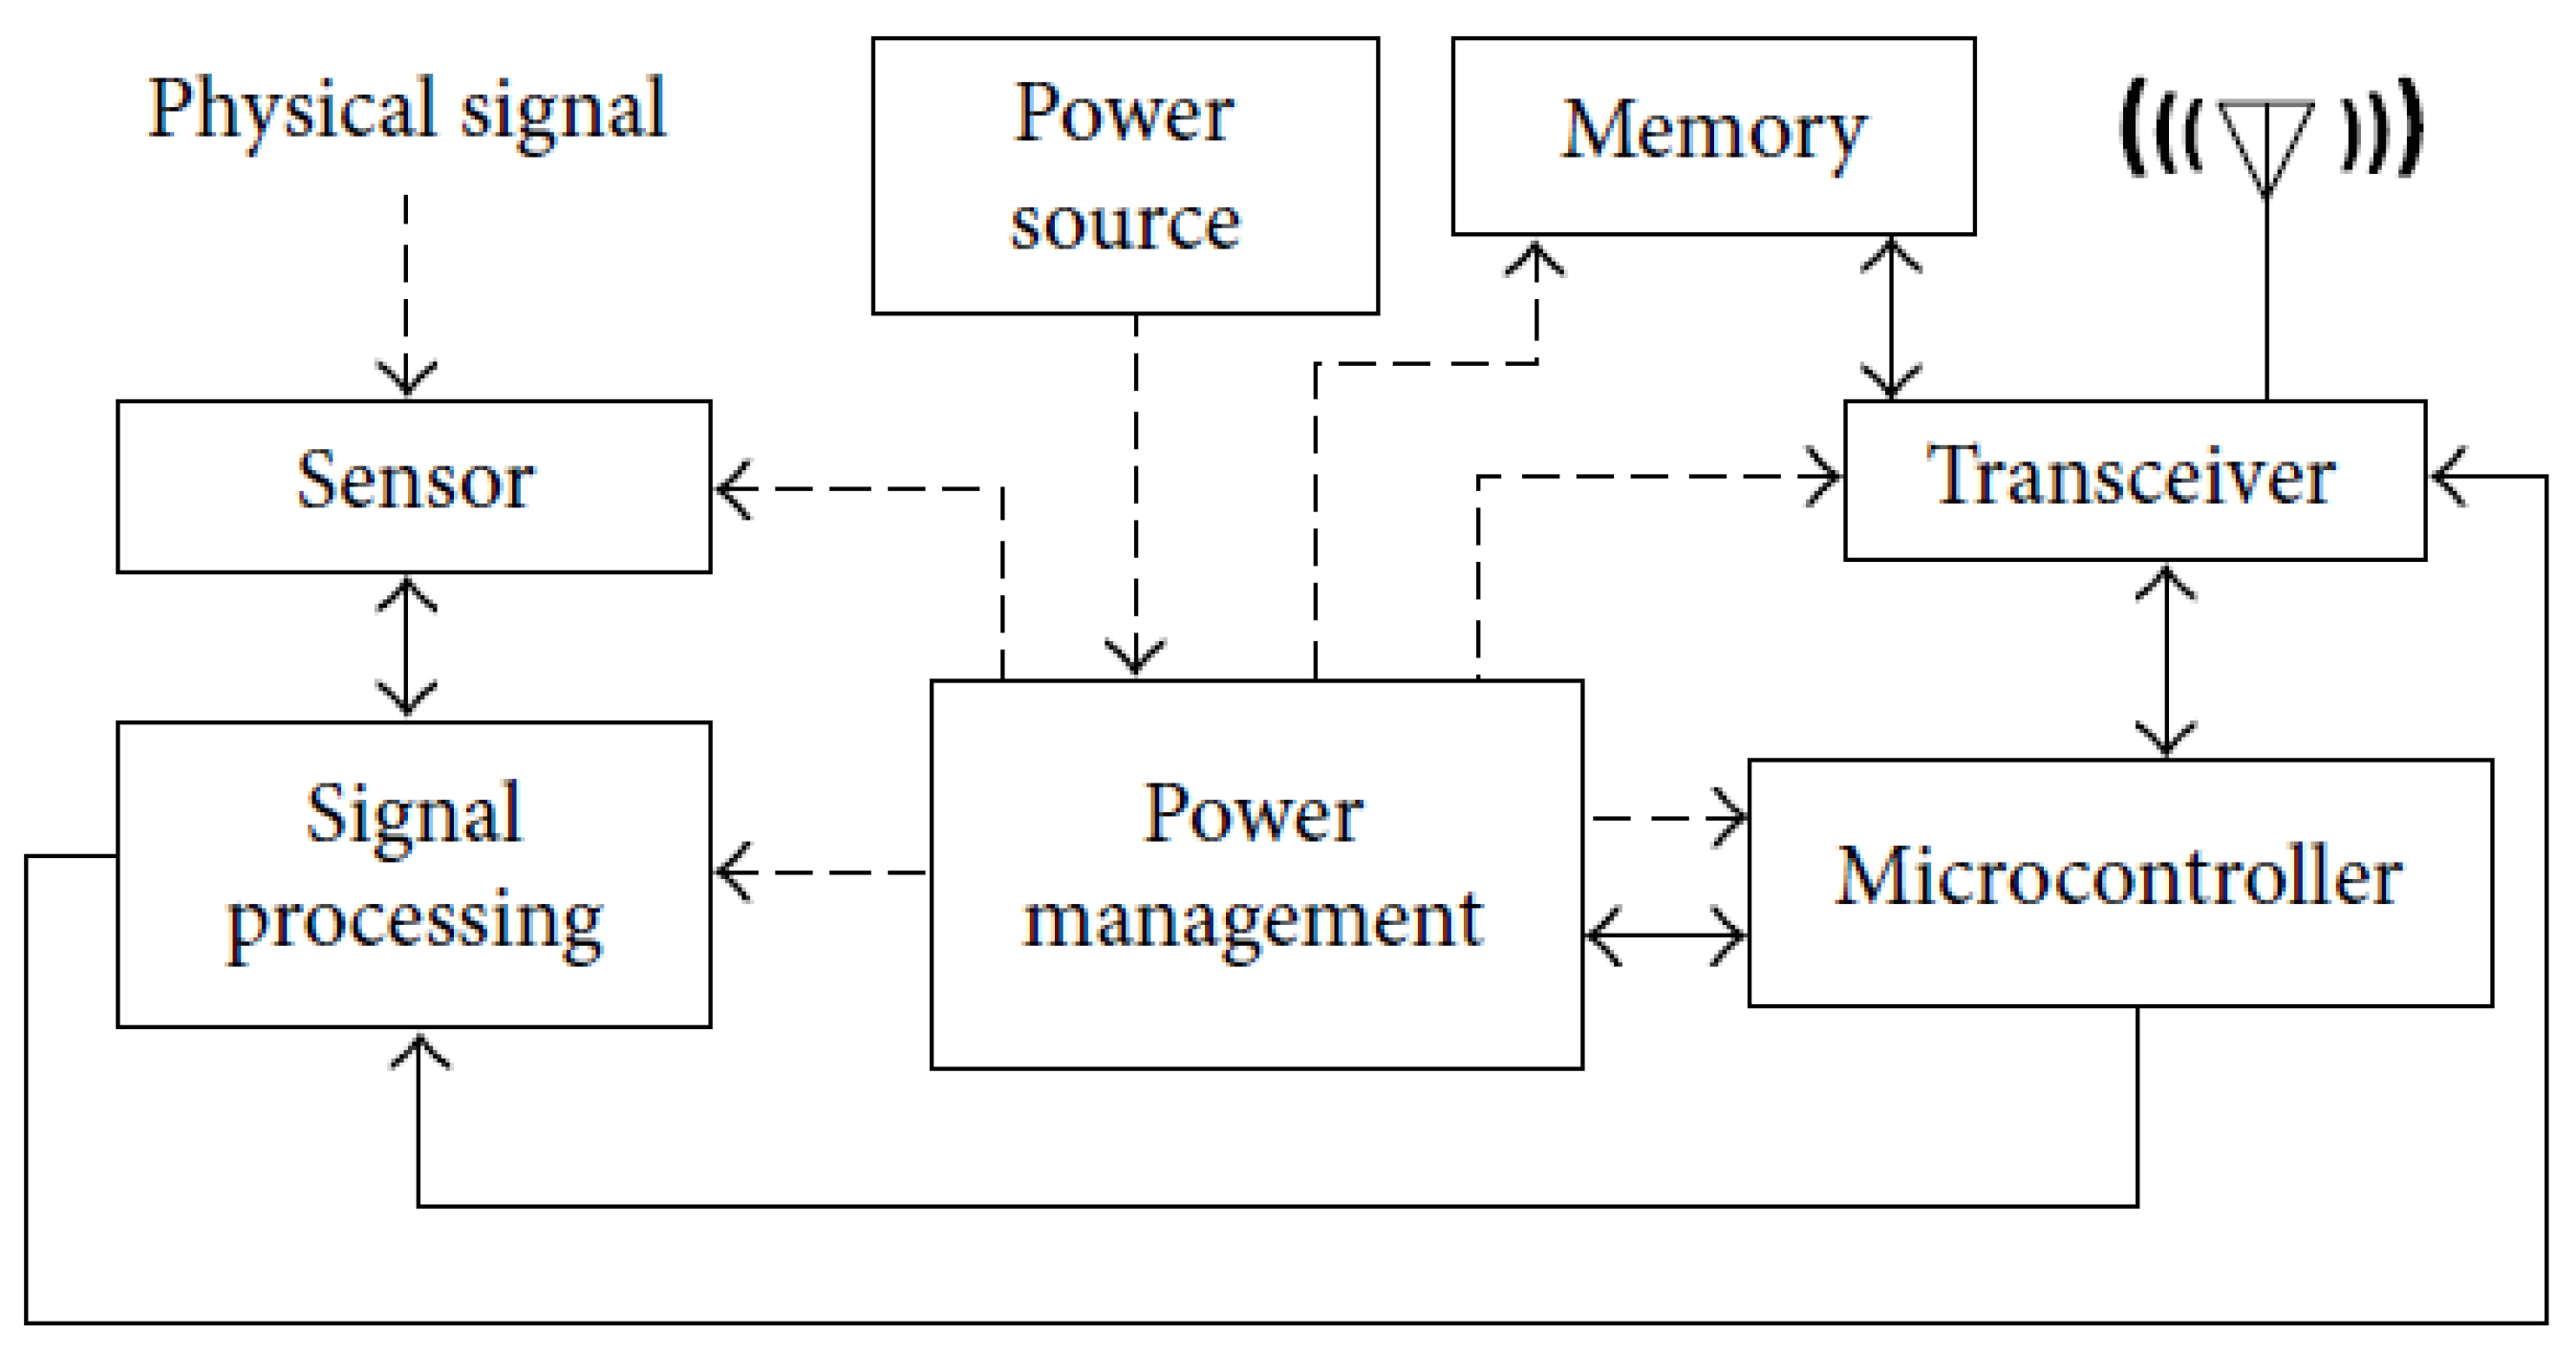
Bridges have become primary targets of structural health monitoring implementation due to their constant deterioration and their particular susceptibility to damage from their exposure to intermittent dynamic loadings [14]. Recently, wireless sensor node (WSN) technology has been utilized for health monitoring applications [15]. WSNs have many practical uses in environmental sensing and monitoring such as detecting vibration levels in structures [16]. These devices are made of different components as presented in [17] and shown in Figure 1.
WSNs utilize battery power making their implementation challenging when they are applied at the infrastructure scale, particularly when they are spread over a large area. For this reason, their implementation in structural health monitoring applications for bridges is based on energy harvesting principles that create autonomy and self-powered capabilities for these devices [16]. Commercially available WSNs require 0.09 to 128 mW [18] of power for data transmission, however, this power requirement is on a sharp decline due to the continuing development of components. Because of this low power requirement, WSNs are very attractive for implementation in bridges, which are regularly exposed to ambient vibrations from traffic and wind loads that can, on average, generate power on the order of hundreds of microwatts with proof masses on the order of tens of grams. However, when devices require larger power, large proof masses are also required since these are proportional to the energy harvester’s output power capabilities [14].
Many studies on the application of vibrational energy harvesting to bridge structures have been conducted, considering mostly vibration based electromagnetic [19,20,21] and piezoelectric [22] harvester types. Recently, some researchers have also investigated the effects of multifunctional composite materials combined with energy harvesting for various applications including health monitoring in bridge infrastructure [23]. However, most of these studies have been limited to very small harvesters with proof masses on the order of tens of grams. The literature reports piezoelectric energy harvesters for bridge applications with average power generation capabilities in the ranges of 30 W to 10 mW for acceleration excitations on the order of 0.1 g to 4.4 g [1,2,3,24]. Bridge electromagnetic harvesters have also been reported to provide average power values in the range of 2 W to 26 mW under accelerations from 8 mg to 3 mg [4,5,6,7].
The ratio of harvester mass to structural mass has oftentimes been found to be the most important parameter to consider when determining the efficiency of vibrational energy harvesters when augmenting a real, large-scale structure, with a larger mass ratio dictating better performance [25]. However, as civil structures often possess masses in the order of thousands of tons, a multifunctional harvester mass should be contemplated to avoid adding huge inert masses to a building or bridge.
Motivated by these considerations, this paper investigates the impact of multiple, smaller vibrational energy harvesters distributed throughout a cable-stayed bridge versus the traditional design of a single vibrational energy harvester attached to the structure. Also, to account for the problem of the large among of mass required, a multifunctional harvester mass will be considered.
In order to accomplish that, first the locality of the harvester relative to the cable-stayed bridge example is exploited to reduce the complexity of the system in order to perform design optimization to maximize power generation. This is achieved by implementing the computationally efficient methodology described in [25] to optimally design the frequencies of the devices augmenting the bridge example shown.
The green garden concept is incorporated as the potential multifunctional design for the vehicular cable-stayed bridge. This multifunctional feature can provide both environmental and aesthetic advantages. In the particular case of vehicular bridge structures, green gardens can help decrease the environmental pollution by absorbing carbon dioxide emissions as typical passenger vehicles emit about 4.6 metric tons of carbon dioxide per year [26]. This multifunctional design solution would also be beneficial for the ecology since they can facilitate habitat provisions for birds and other species [27].
Incorporating the greenery concept within the structural design can alleviate the climatic issue created by solar gain, since plants have the ability to absorb heat and cool the environment [12]. The implementation of the garden concept into the harvester design will have the added benefit of increasing the environmental comfort of the structure.
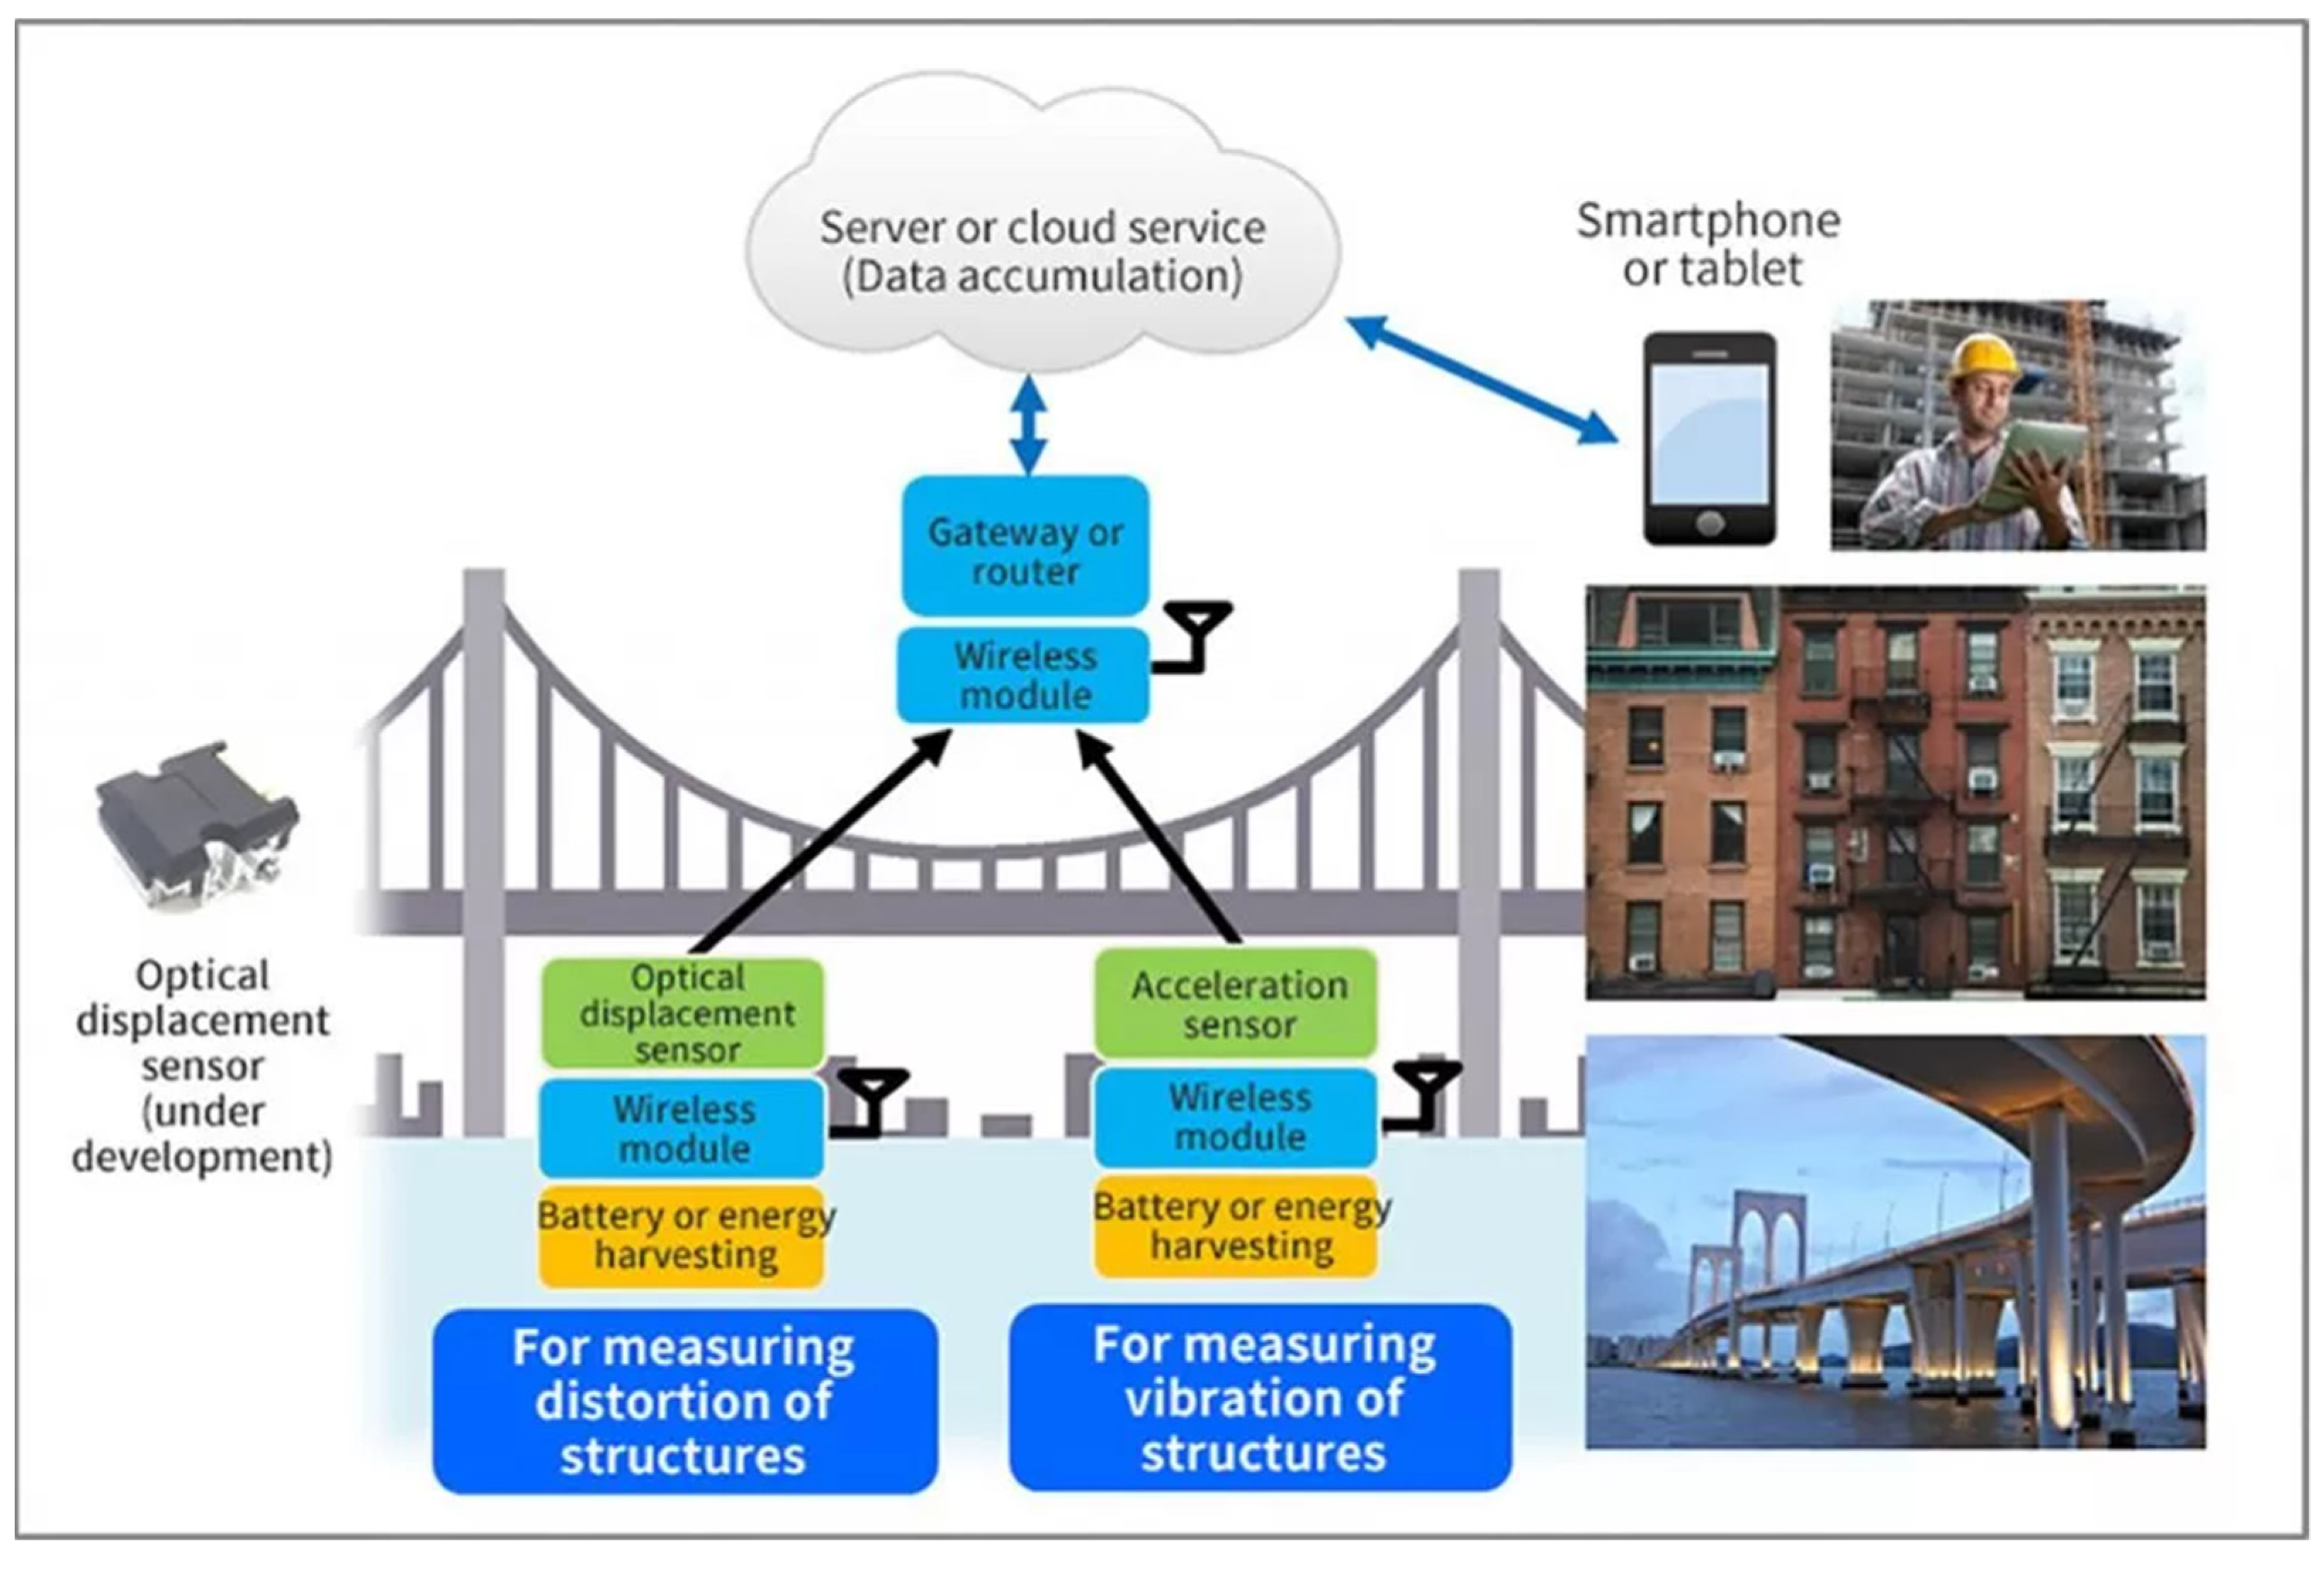
More specifically, implementing the green garden concept as the multifunctional harvester’s mass in the example presented will guarantee significant power generation under different levels of vibration-based input loads considering that the proof mass in this case would be on the order of thousands of kilograms. This potential amount of power will not only guarantee implementation of more complex structural health monitoring technologies as schematically shown in Figure 2, but will also serve as a potential source to the power grid, lighting, traffic devices and more complex wireless sensing and communication systems.
2. Problem Formulation
The efficient computational methodology [29] adapted and described in [25] to perform analysis and design optimization of electromagnetic vibrational energy harvesters at the infrastructure scale was applied to design and optimize two and more devices attached to a cable-stayed bridge example. The equations of motion for the nominal (without harvesters) and modified (with harvesters) systems are defined by (1) and (2) in [25], with vectors and , of size , representing the system’s response in relative coordinates without and with the connection of the devices, respectively. and , of size , represent the response of the harvester(s), in the two cases.
The system’s degrees of freedom are defined by , where is the number of degrees of freedom of the superstructure and is the number of harvesters attached.
The electrical properties of the harvesters are defined by the diagonal matrix containing the magnetic flux of each harvester and and , which are also diagonal matrices of size containing the ratio of individual magnetic flux to inductance and resistive load to inductance, of each harvester, respectively. These matrices are assembled as explained in Equations (11)–(17) in [25].
The nominal system can be represented in state space form as defined by (1)–(4), with the response written in terms of the nominal system’s impulse response in the pattern of the matrix with initial conditions as shown in (5) with .
The state vector of size consists of the displacements and velocities of each DOF of the superstructure and harvester along with the current generated by each harvester, with . Desired system outputs, can be represented as linear combination of the states , and .
The modified system is represented by Equations (6)–(8) in state space with the system states defined by of size . and represent the stiffness and damping matrices arising from connections of the harvester(s) to the system.
Using the superposition principle, the modified states, , can be calculated using (9) with the nominal states, , and the convolution of the pseudoforce vector, of size , arising from the connection of the harvester(s) to the structure and the impulse response, of size , in the pattern of the modification, where the modification is given by the addition of the harvesters to the superstructure.
The modification can be compactly written as shown in Equations (10)–(13), where matrix , of size , maps which superstructure degree of freedom each harvester is connected to and where is the identity matrix of size .
The pseudoforce can be efficiently computed [29] as given in (14), where and are diagonal matrices containing the stiffness and damping of the harvesters, respectively.
In the results reported here, the low dimensional pseudoforce was calculated using trapezoidal rule and fast Fourier transforms as presented in [29]. The outputs of interest for the modified system, of size , can be computed by the sum of the outputs of interest of the nominal system, of size , and the convolution of the corresponding portion of the impulse response to the outputs of interest, of size , in the pattern of the modification, and the low order pseudoforce, .
Optimization
The efficient approach to solve for the modified system outputs of interest previously described allows one to exploit the locality of the harvester(s) and considerably reduce the cable-stayed bridge example presented in order to repeat the required analysis to perform design optimization.
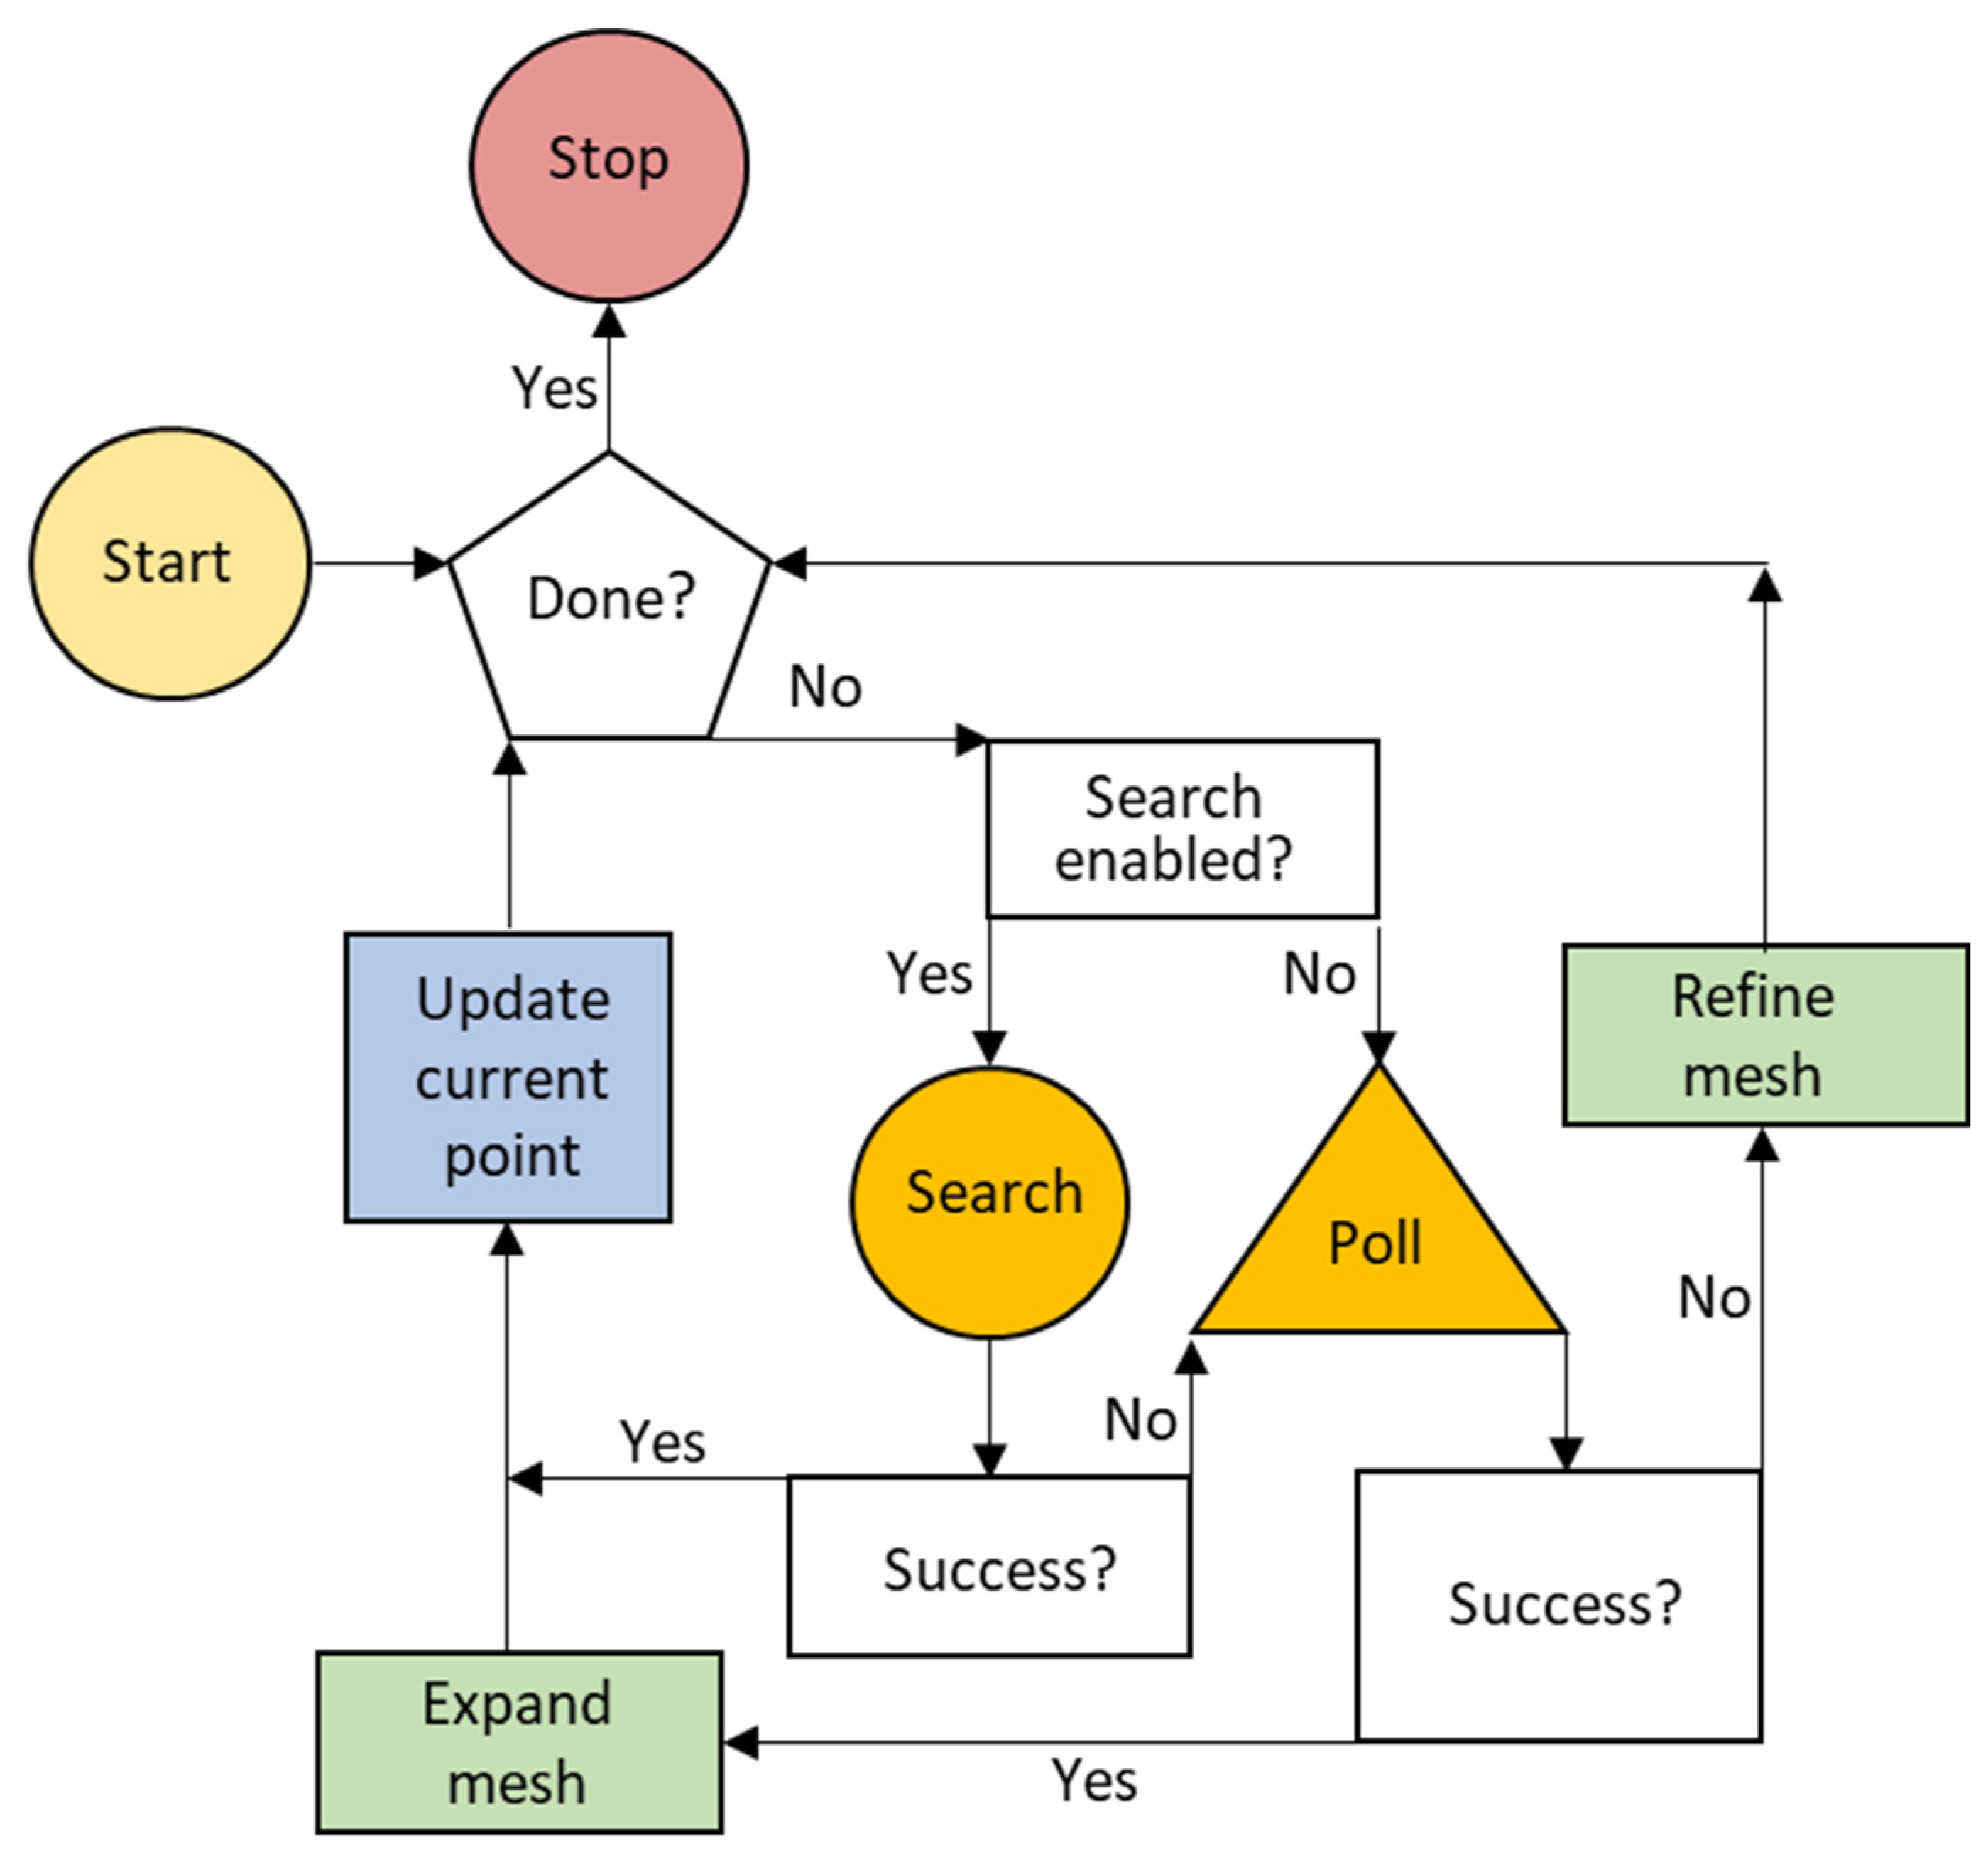
The optimization was performed using the patternsearch algorithm in MATLAB. Figure 3 schematically represents the patternsearch optimization algorithm flowchart as described in [30]. The algorithm uses an adaptative mesh of design points to find a specified function’s minimum value. A sequence of approximation points that approach an optimal solution is located by the algorithm, by comparing the objective function from a point in the sequence to the next as its value either decreases or remains the same.
In this paper, the objective function to minimize was chosen to be the negative of the total energy extracted from all the different harvester(s) configurations and defined in (24), where is a vector of currents generated by the harvesters calculated using the efficient approach described in the problem formulation, and is a diagonal matrix containing each resistive load of the harvester(s).
The design variable was chosen to be a vector containing the frequencies of the harvesters, , with prescribed lower and upper bounds that were selected after an initial parameter screening. An initial value of 1 rad/s was selected for the design variables for all results reported.
For this particular example, the damping of the harvesters was neglected and not included as a design variable. In order to do this, maximum structure and harvester displacements were assessed after each optimization run to guarantee that they were within acceptable and safe values.
3. Example: Cable-Stayed Bridge
3.1. Model Description
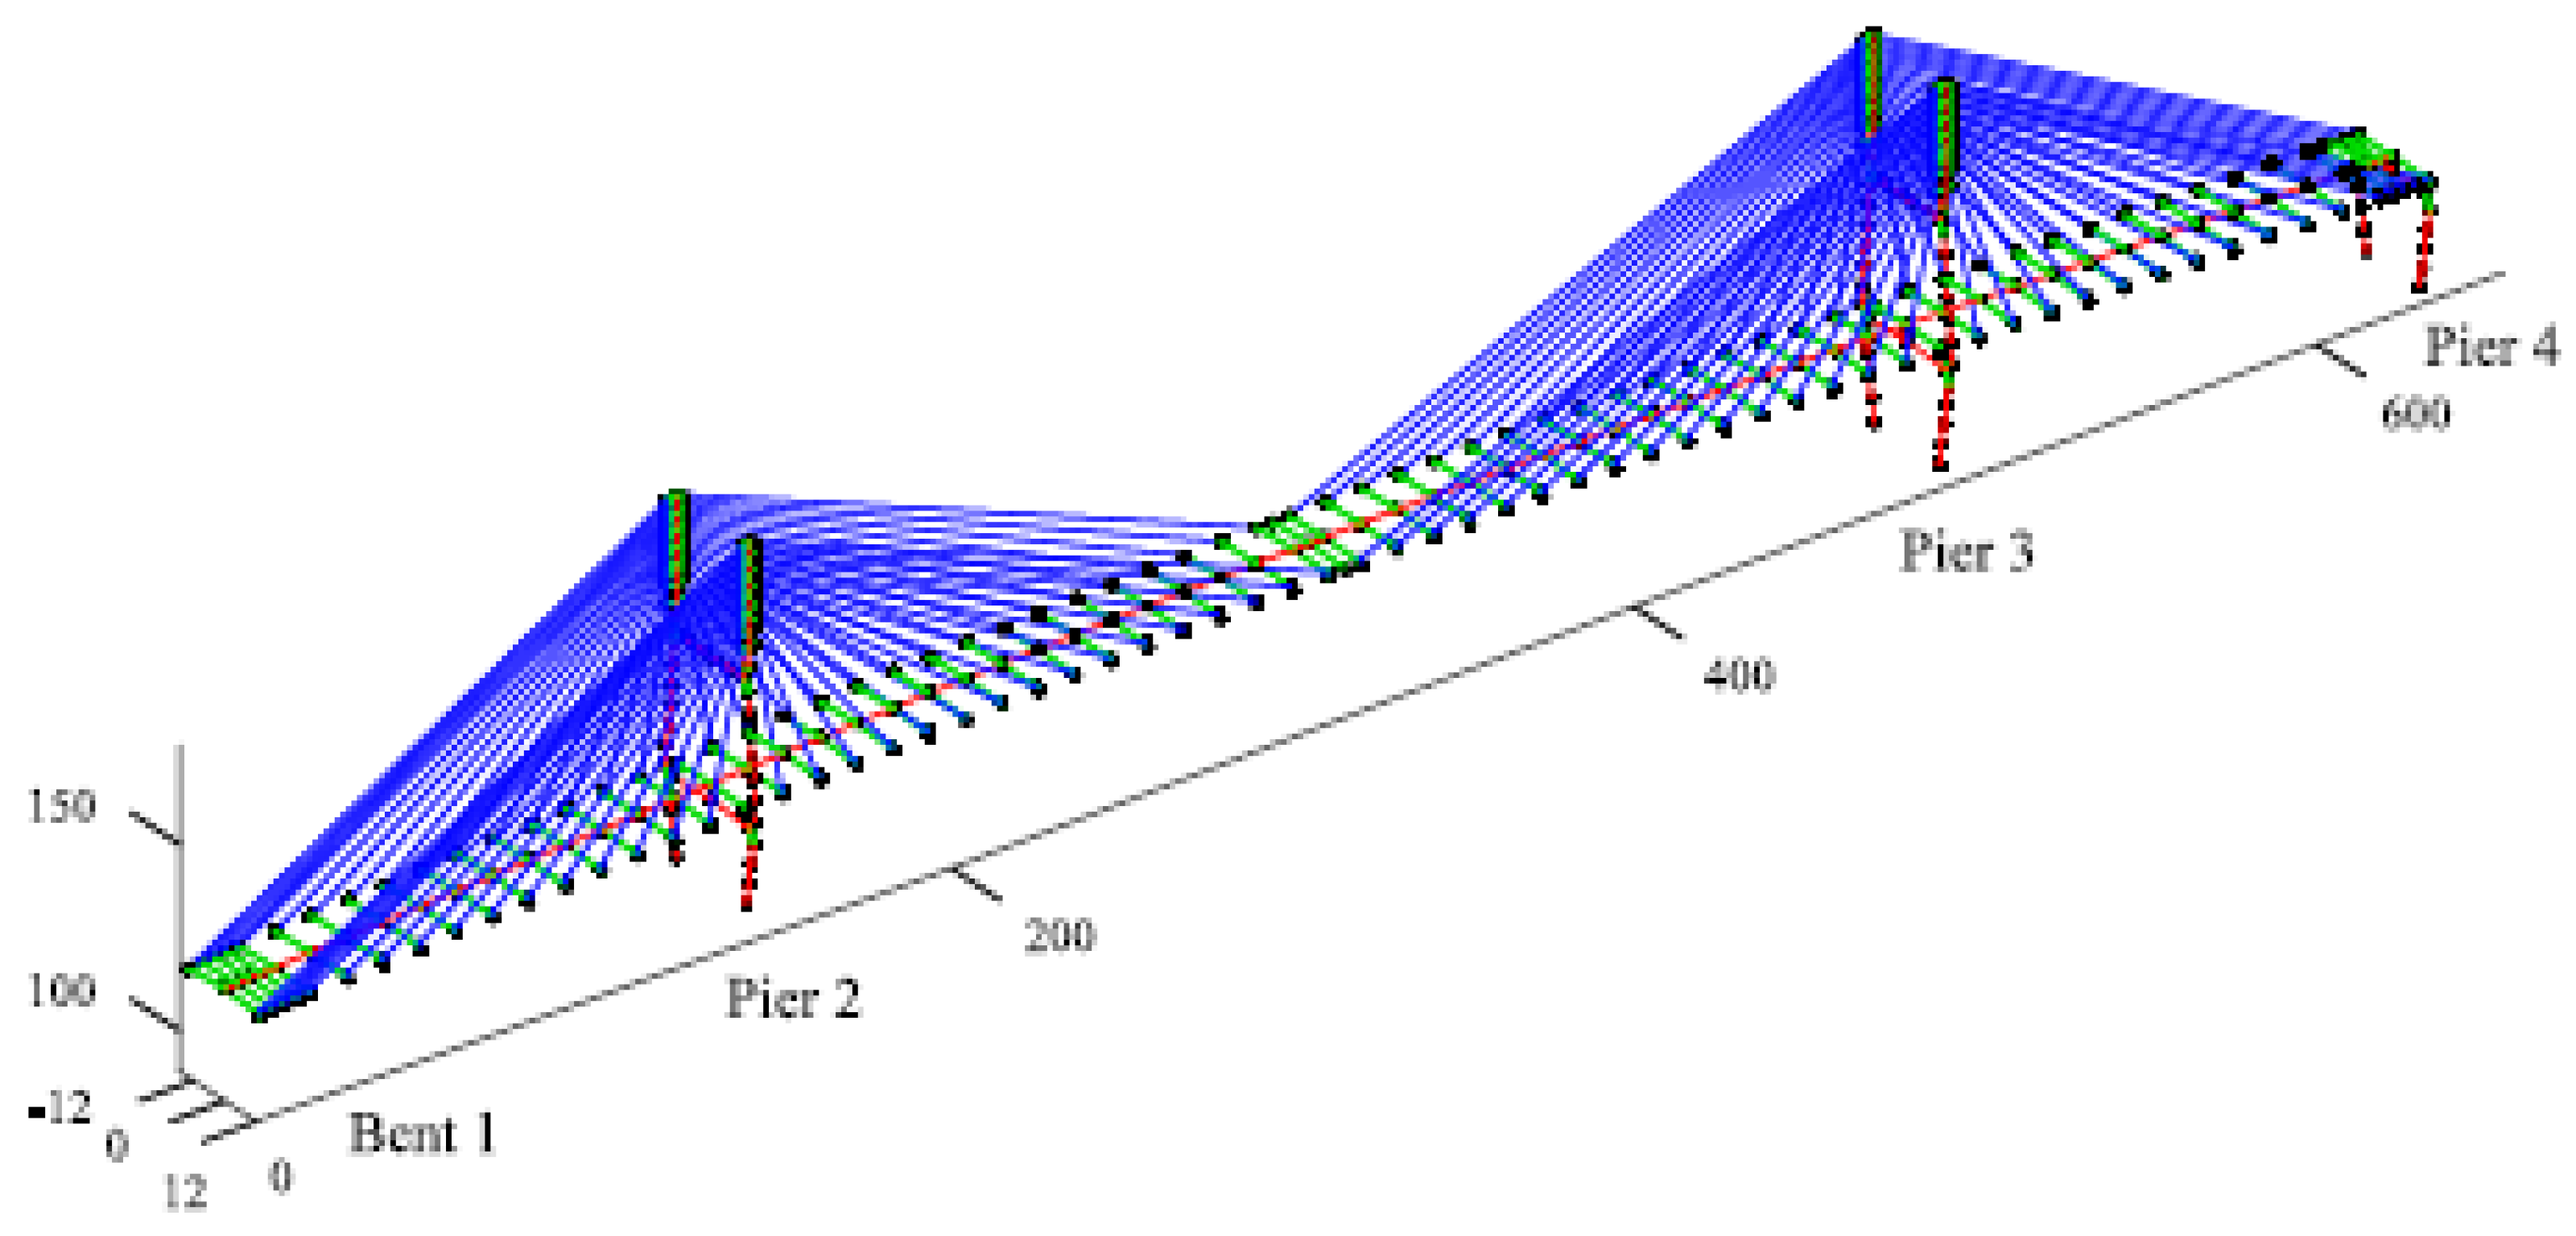
The example considered herein consists of the cable-stayed Bill Emerson Memorial Bridge (2003) located between Cape Girardeau, Missouri and East Cape Girardeau, Illinois, spanning the Mississippi river. The bridge model, adapted from [31], consists of 579 nodes, 128 cable elements, 162 beam elements, 420 rigid links and 134 nodal masses. The structure has a total of 3474 degrees of freedom and a total mass of 51,987,767.58 kg. The fundamental frequency of the bridge is 1.0172 rad/s and the second modal frequency is 1.765 rad/s. Dyke et al. [32] developed a finite element model of the bridge as shown in Figure 4. In the model, the connections between the bridge deck and the tower are purely through the cables, this allows one to place energy dissipation devices between the deck and the tower. The initial model consisting of 3474 DOFs was reduced by imposing boundary conditions, removing slave DOFs and applying a static condensation to eliminate DOFs with a small contribution to the global system response. The resulting reduced model, consisting of 419 degrees of freedom as presented in [31] and further described in [32], will be used for the remainder of this section. The model was cast in the form of Equations (1) and (2) with vectors and representing the system’s response in relative coordinates. In order to maintain the symmetry of the structure with respect to the main longitudinal axis, X, of the deck span, two different scenarios were considered: (1) two harvesters attached at two symmetric joints of the bridge and (2) sets of two harvesters attached at symmetric joints of the bridge with identical equivalent total harvester mass. Each harvester was considered to be a uniaxial device oriented along the X-axis. Table 1 summarizes the details for both scenarios.
The electrical properties of the harvester(s) were scaled using an existing electromagnetic vibrational energy harvester as explained in [25] and as shown in Table 2. The total harvester mass was considered to be 1% of the total structure mass, or more specifically 519,877.67 kg, and was kept constant for both cases in order to more accurately compare the performance of the system in all different configurations.
3.2. Input Load
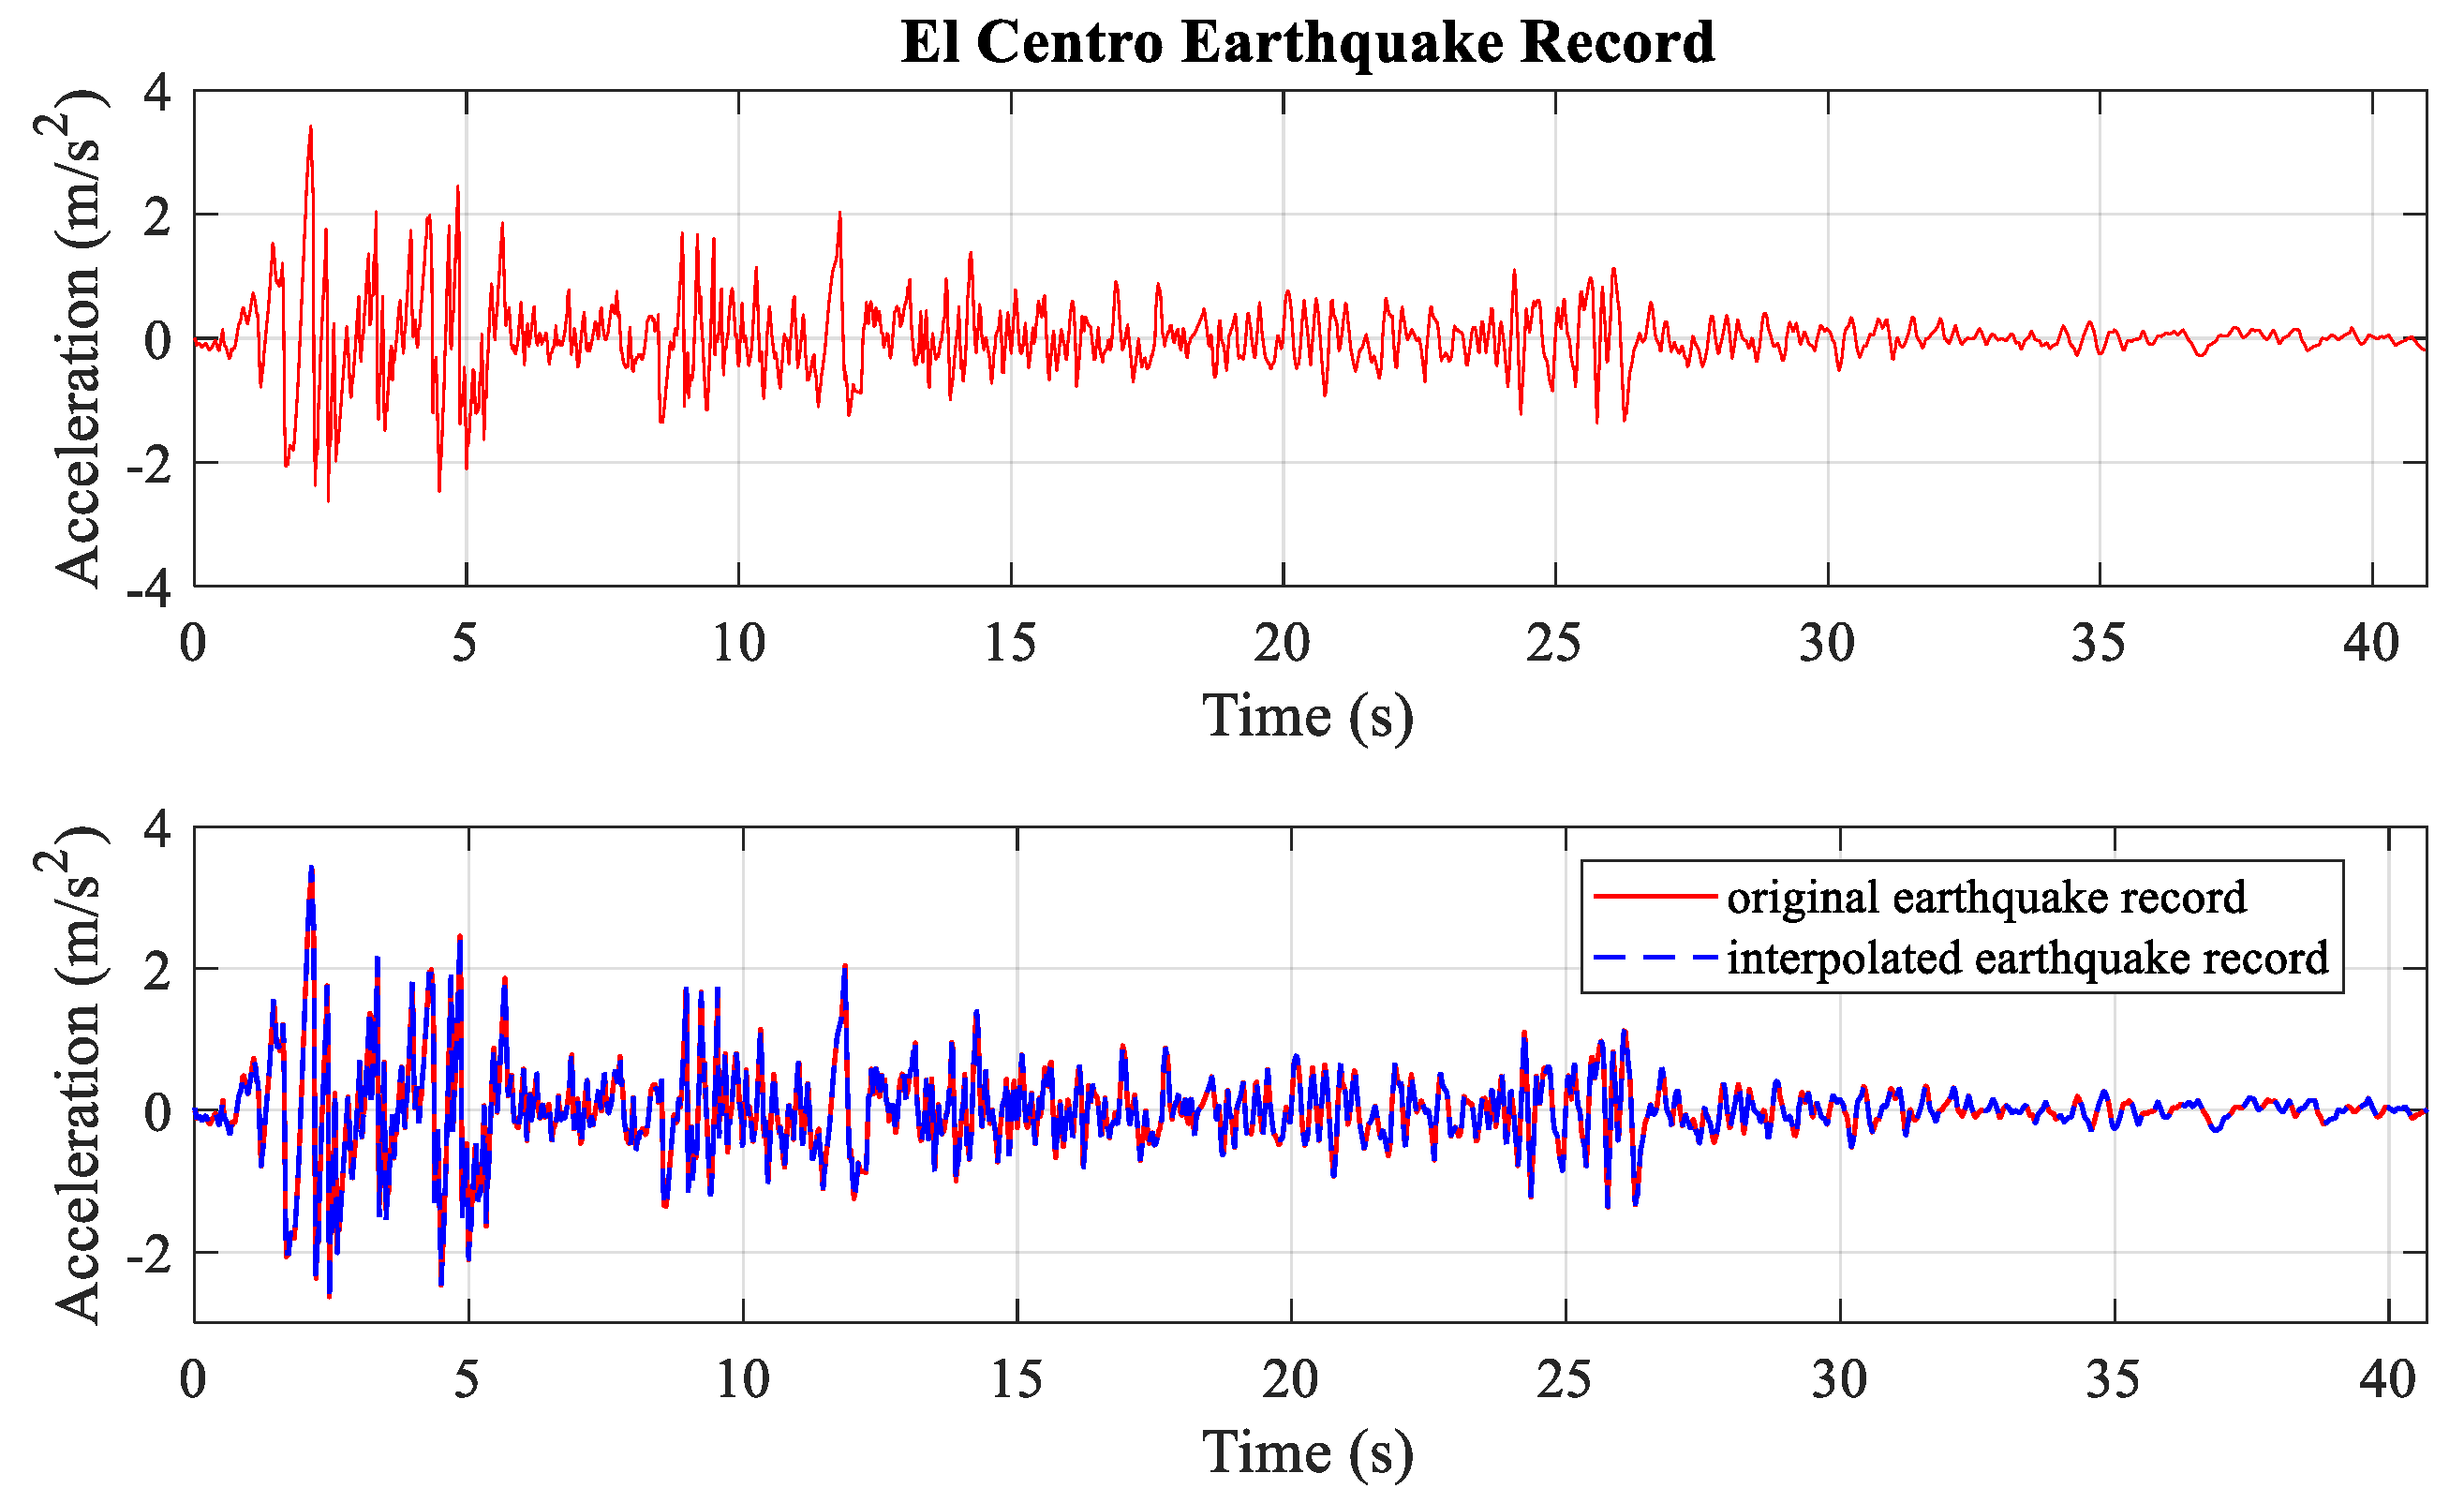
To more realistically assess the power generation capabilities of the harvester(s) when augmenting a realistic bridge model, the El Centro earthquake record was utilized as the ground excitation in the longitudinal direction for a duration of 40 s. This loading was recorded at the Imperial Valley Irrigation District substation of the North-South component in El Centro, California in 18 May 1940. There are some limitations associated with the earthquake record for the analyses since the loading record has a sampling time of 0.02 s. In order to address this limitation, and to more accurately compute the response of the system, a subsequent linear interpolation of the earthquake record was performed, reducing the sampling time to 0.0013 s, but still maintaining a realistic loading history without loss of accuracy. Figure 5 contains the original and interpolated sample El Centro earthquake record. The load was applied in the reduced bridge model at the kept X-direction degrees of freedom.
Given that the Bill Emerson Memorial Bridge is located in the New Madrid seismic zone and constitutes the principal crossing of the Mississippi River, its design strongly accounts for seismic activity [32]. Under this consideration, the El Centro input load was selected as a good representation to assess the structure’s performance when augmented with vibrational energy harvesters and exposed to moderate seismic loads.
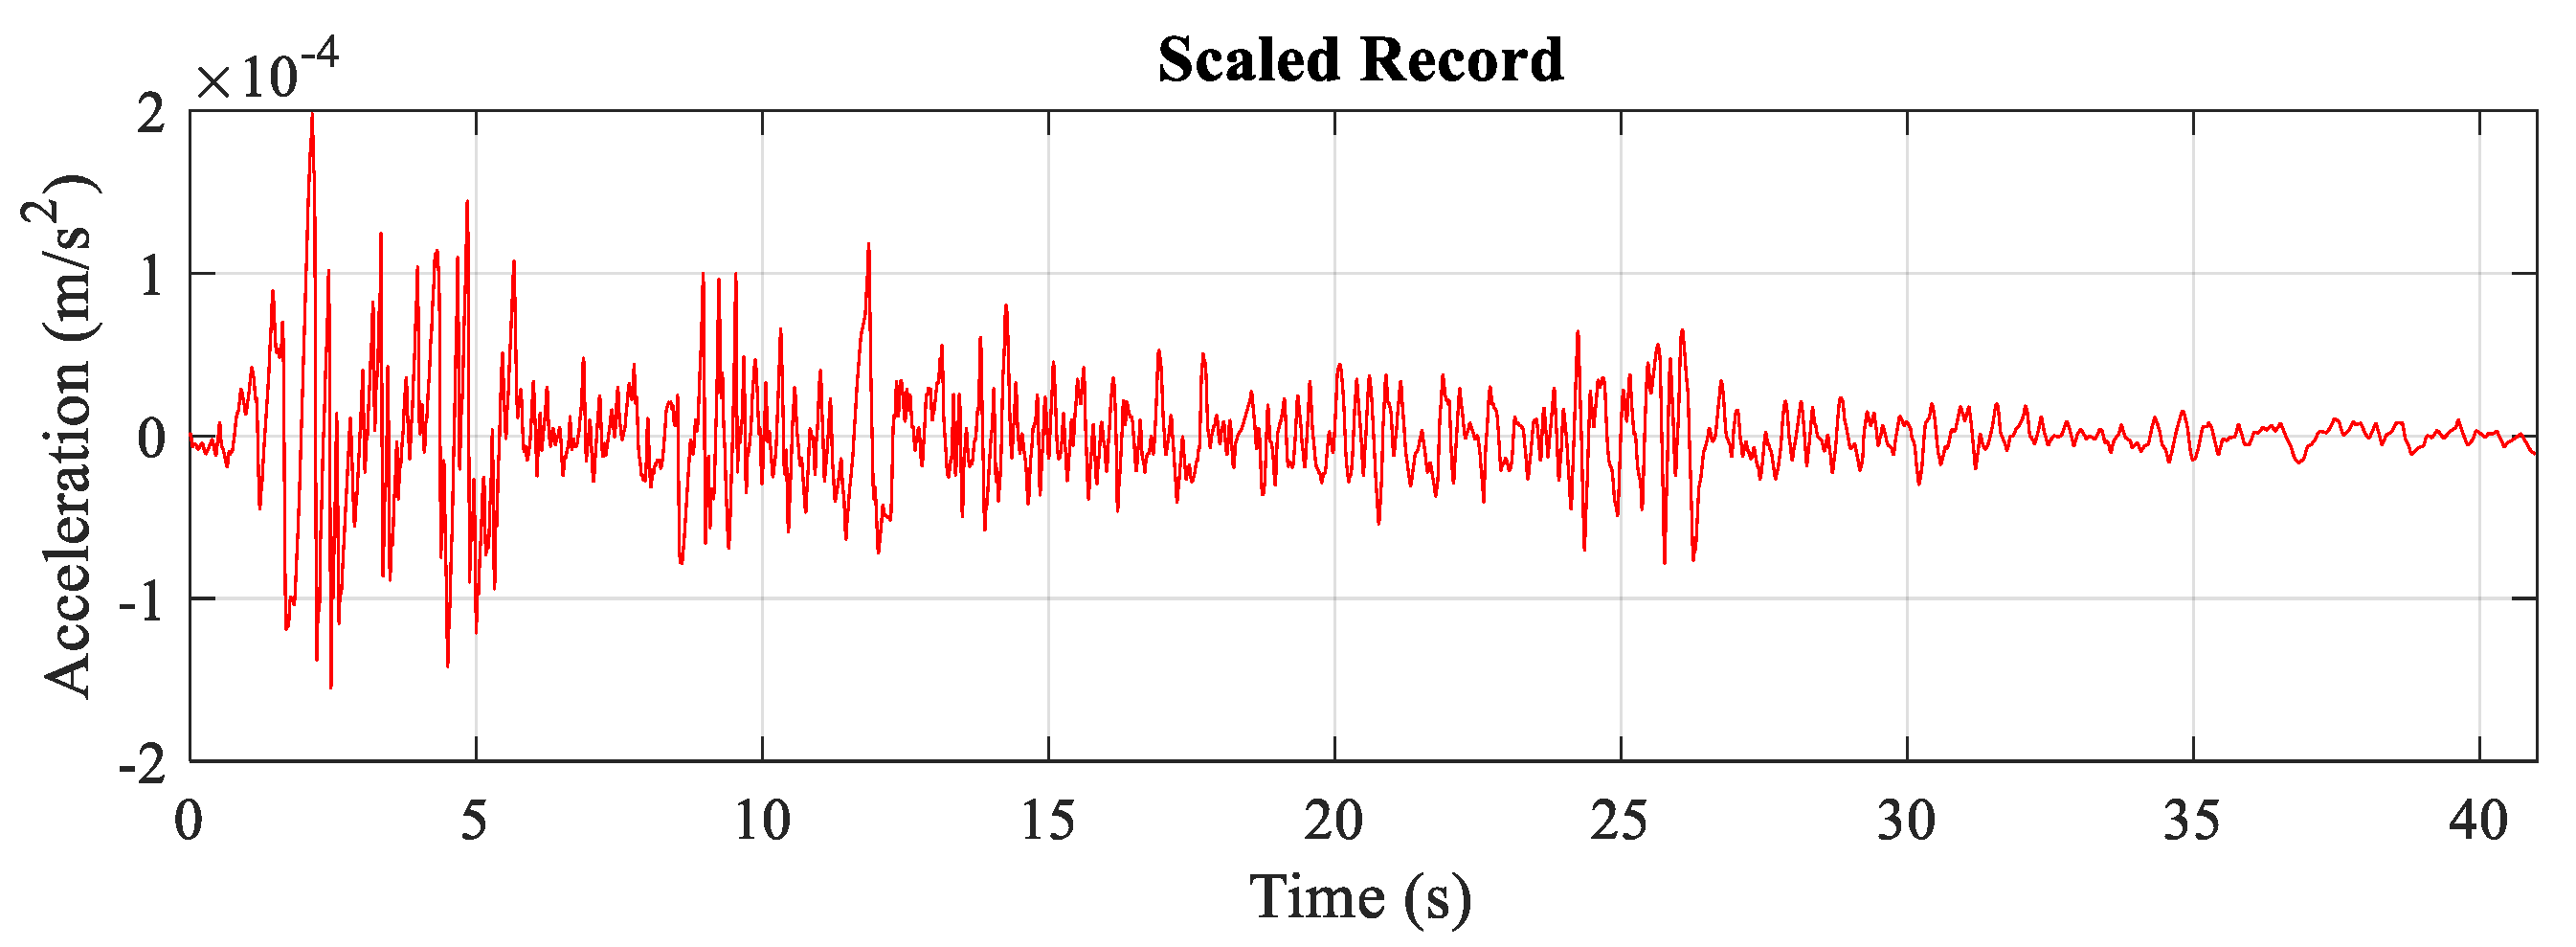
A second loading was employed to better assess the power generation capabilities of the vibrational energy harvesters under more common loads. In this particular case, a loading possessing the magnitude of typical traffic loads was utilized to more realistically predict the amount of power and possible applications from the implementation of these devices. The literature reports maximum peak acceleration values of about at the Bill Emerson Bridge due to ambient/traffic induced vibrations [33,34]. Based on these considerations, the El Centro earthquake record was scaled to a peak acceleration value of and used as the input load to optimize the power generation capabilities of the harvesters under loads of magnitude of the daily, realistic loads. Figure 6 shows the scaled loading for a duration of 40 s.
4. Results and Discussion
4.1. Optimization Design
Multiple studies were performed to determine the optimal location of different harvester(s) configurations under the El Centro earthquake and the scaled input loads. These were conducted by optimizing the frequencies of the devices to maximize the total power generation from implementation of 2, 4 and 8 harvesters, with harvester frequency bounds set from 0.9 to 25 rad/s, which were chosen after an initial parameter screening. In all cases, the devices were placed symmetrically about the main bridge axis (X) to maintain the structure’s symmetry. For the sake of brevity, in this paper, only the results for the 8-harvester configuration are provided. Details of all results for all configurations can be found in [35].
De et al. in [31] reported optimal locations for the implementation of pairs of passive control devices, including viscous dampers and TMDs, on the Bill Emerson Bridge. Based on the tabulated results, the optimal joint combinations reported in [31] were chosen as the initial set of potential locations for the 8-harvester configuration. Additionally, locations were also investigated taking into consideration the desired multifunctionality of the harvester masses and also keeping in mind the goal of an overall aesthetic bridge design. For this reason, different joint combinations, selected to perform design optimization, outside those reported in [31], were considered where harvesters were attached at locations corresponding to the outer deck on both sides of the bridge.
The optimal power generation for the 2, 4 and 8-harvester configurations was found to be 1489 kW, 1613.6 kW and 1623.8 kW under El Centro input and 4.914 mW, 5.325 mW and 5.359 mW under the scaled input, respectively. From the resulting optimal power generation for all three configurations, one can note that four or more harvesters can generate more power than a single harvester pair of equivalent total mass, supporting the assertion that multiple smaller devices result in better performance and ease of implementation.
Results from the optimization of the total power generation as a function of location are presented in Table 3 and Table 4 for the 8-harvester configuration under both input loads, respectively. In this particular case, the optimal harvester’s location consisted of a combination of joints as found in [31] with additional harvesters on the outer deck of the bridge.
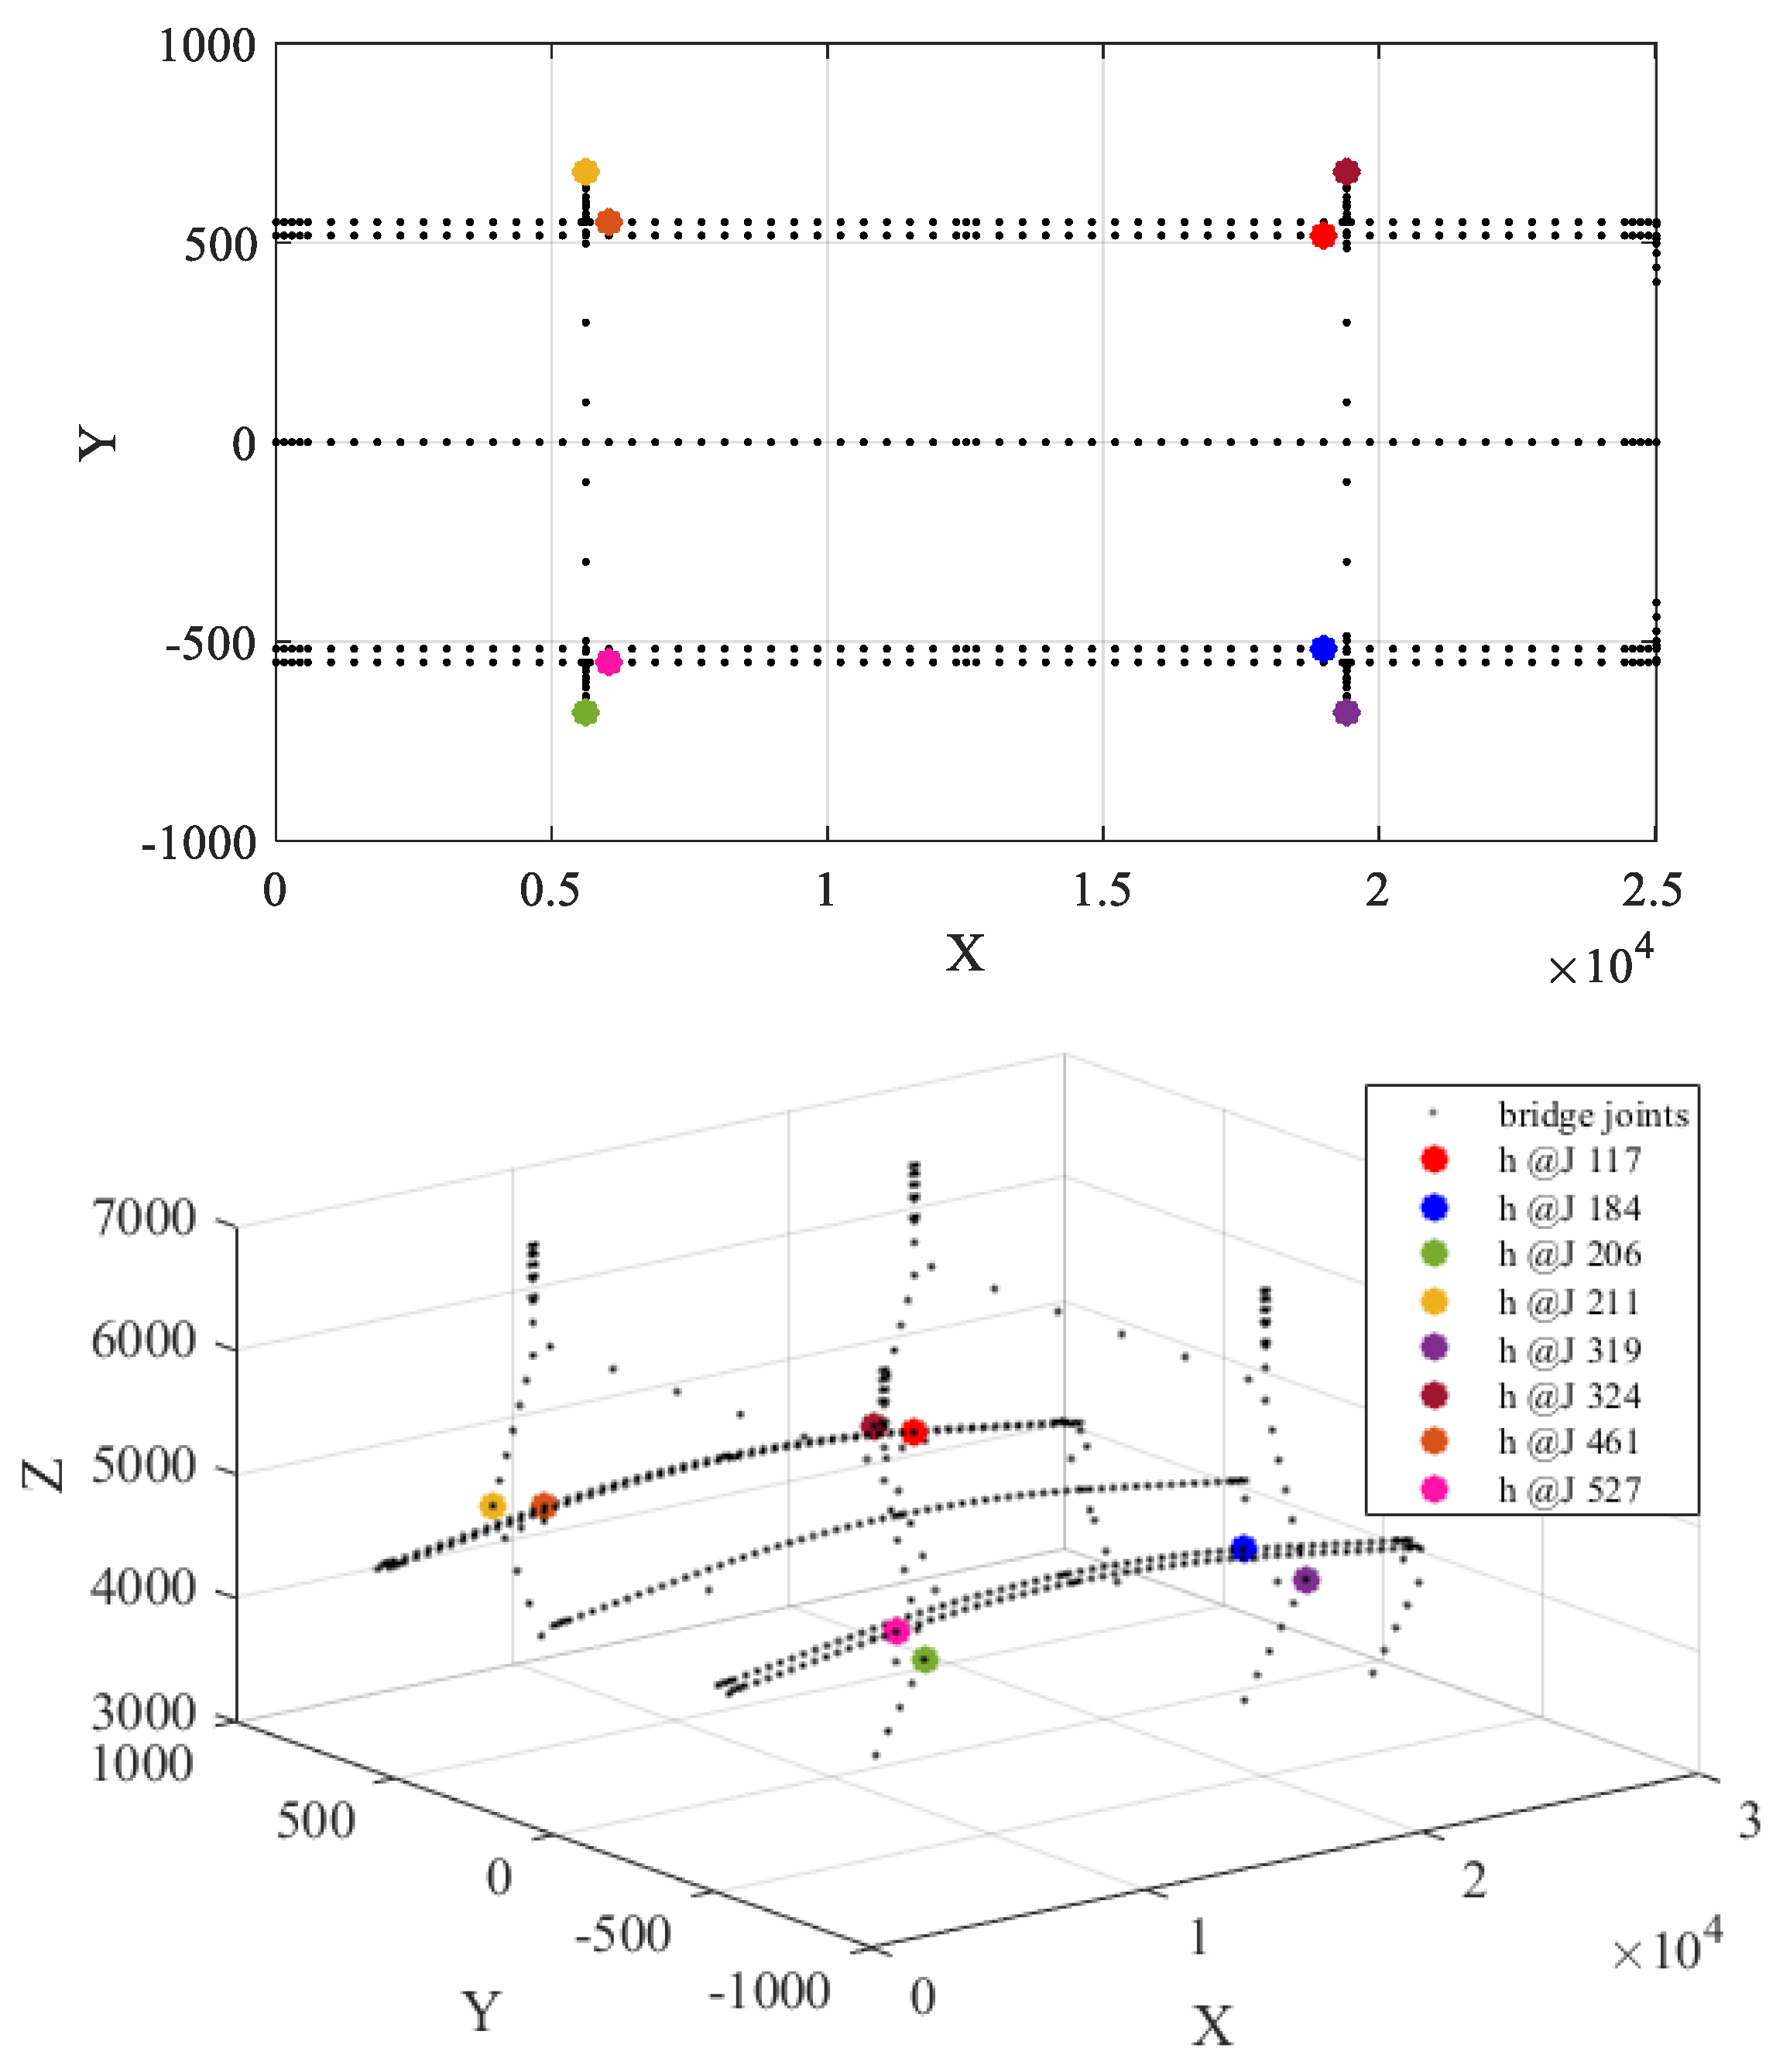
The optimal configuration is shown in Figure 7. It is important to note that from all selected joints for all different configurations, only the optimal locations for the 8-harvester scenario considered connecting the devices at joints on both Piers 2 and 3, specifically the ones located at deck level. The strategic placement of these devices along the outer deck not only maximizes the potential power generation but also allows for flexibility of implementation for the multifunctional harvester masses or more specifically gardens on each side of the structure.
Since damping was not included in the optimization process for all different configurations, maximum structure displacements and accelerations were computed to guarantee they were within acceptable values as shown in Table 5.
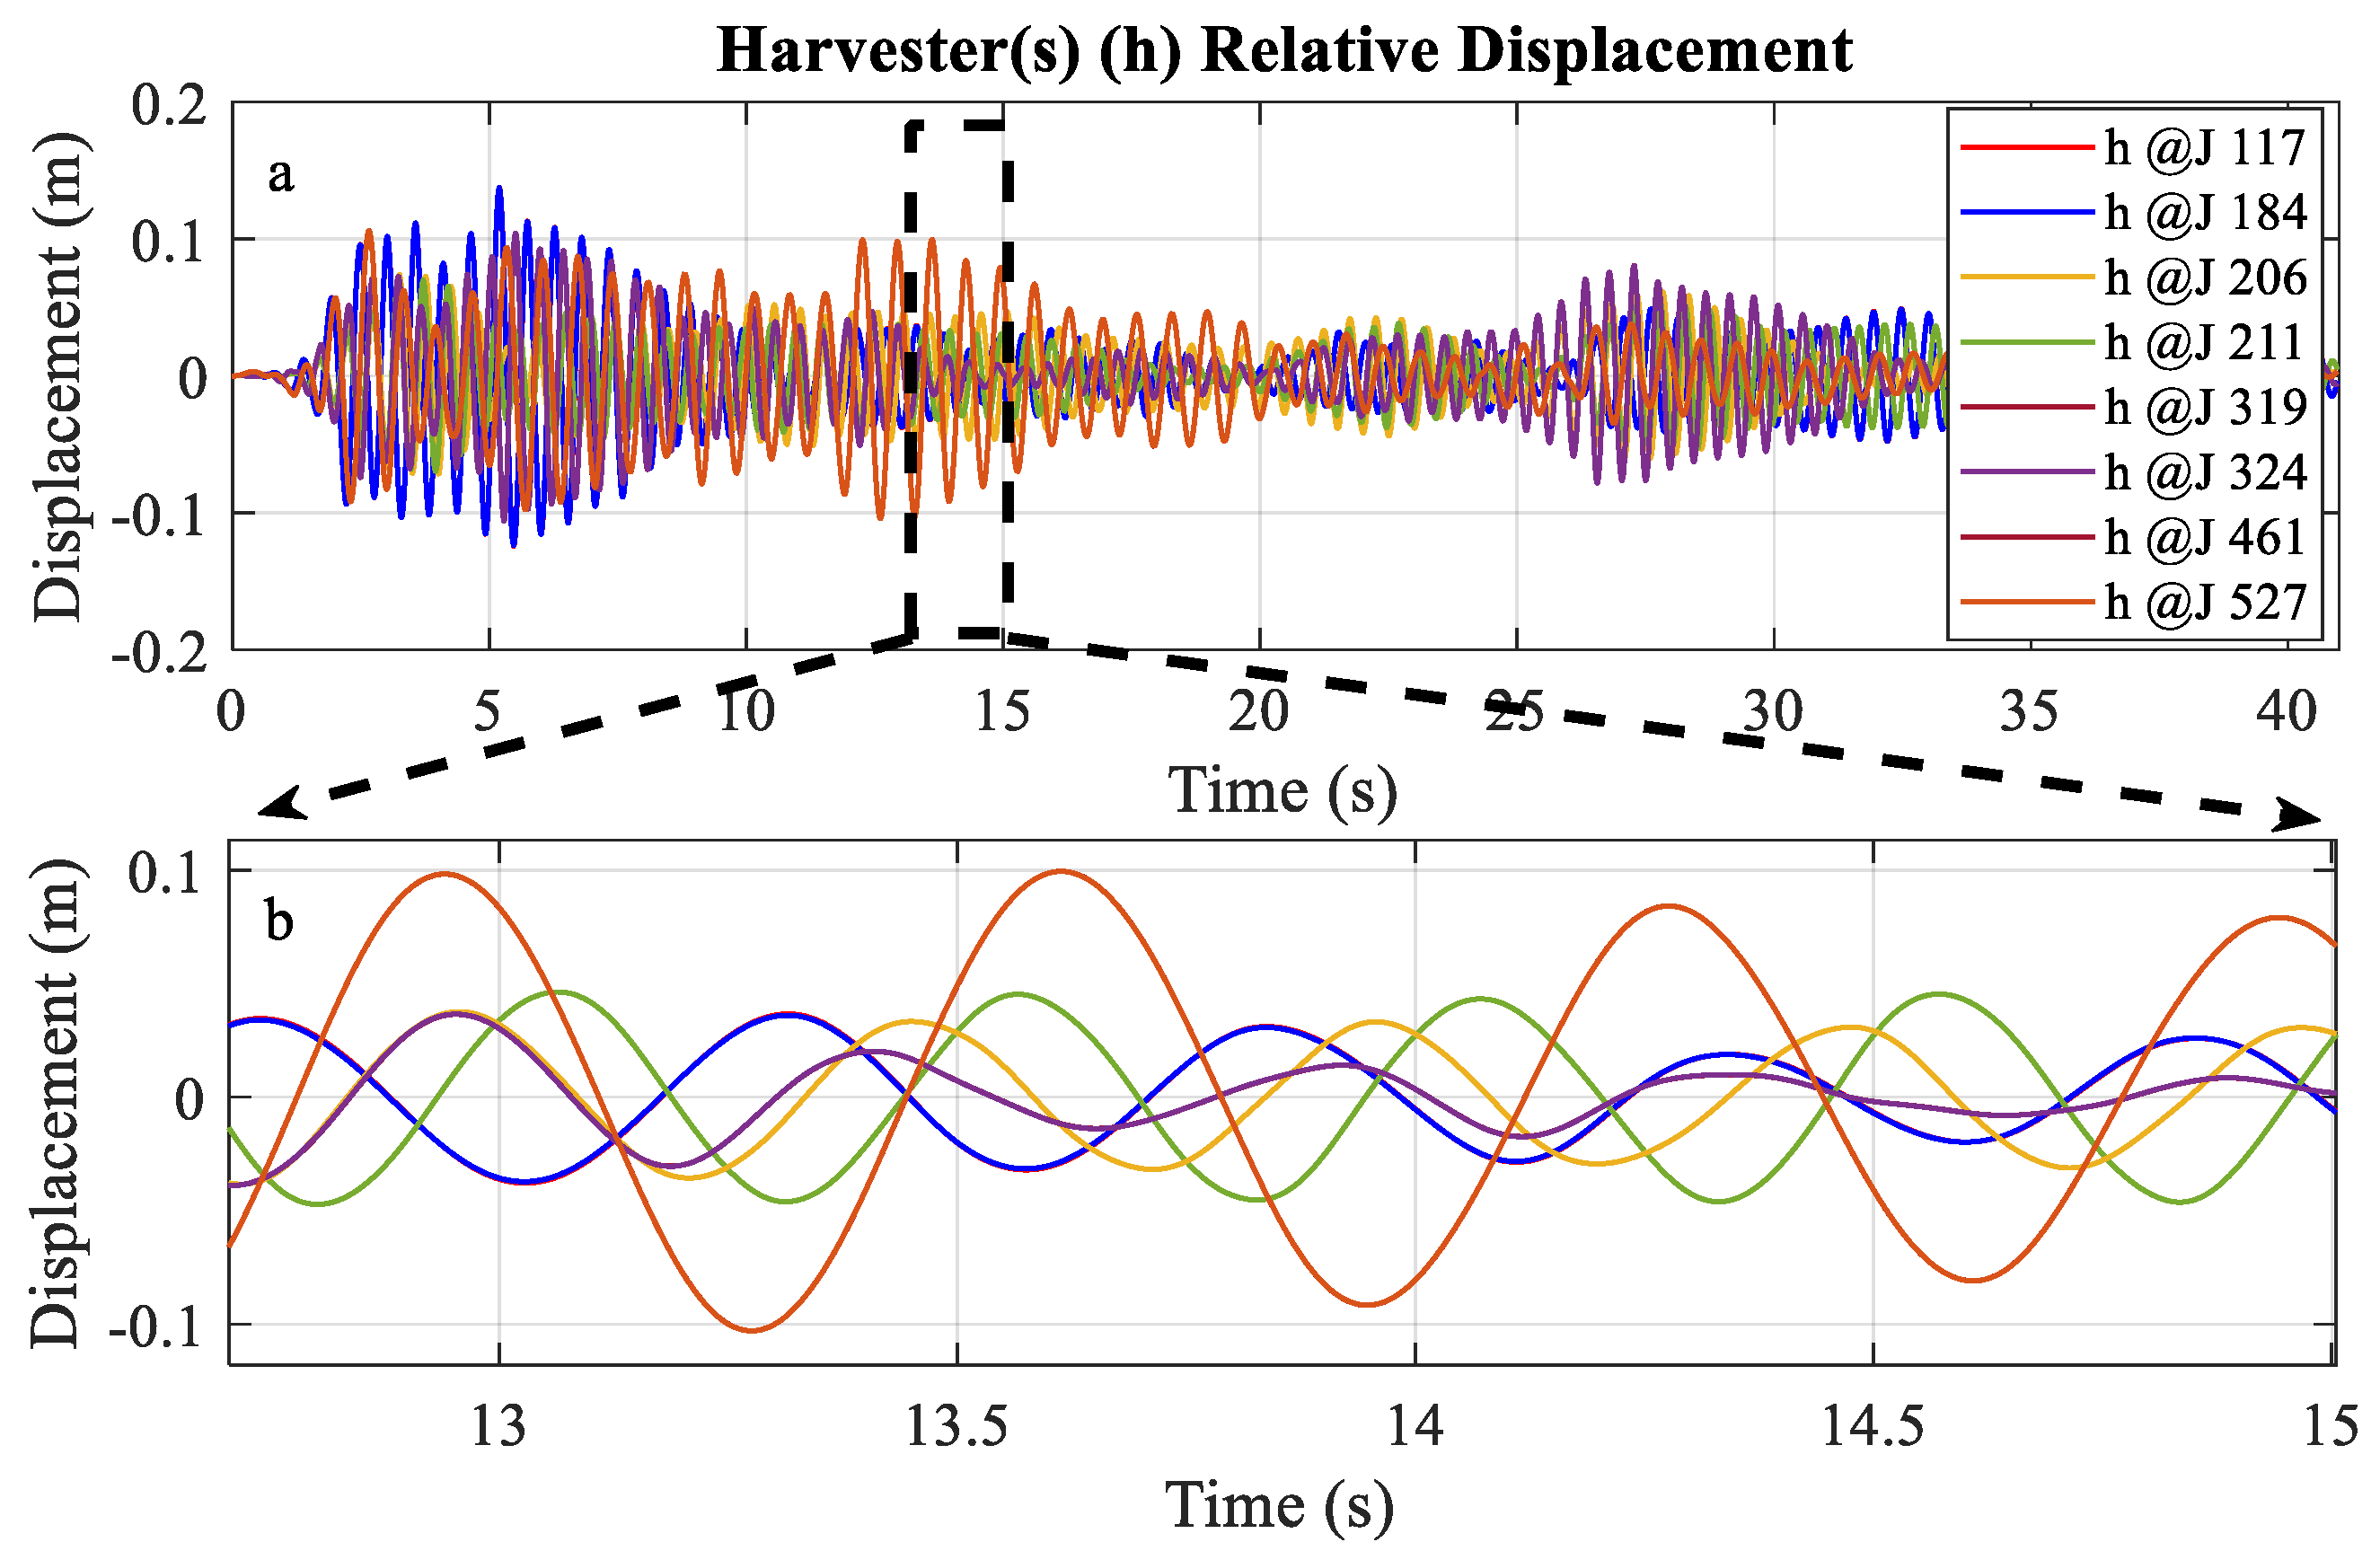
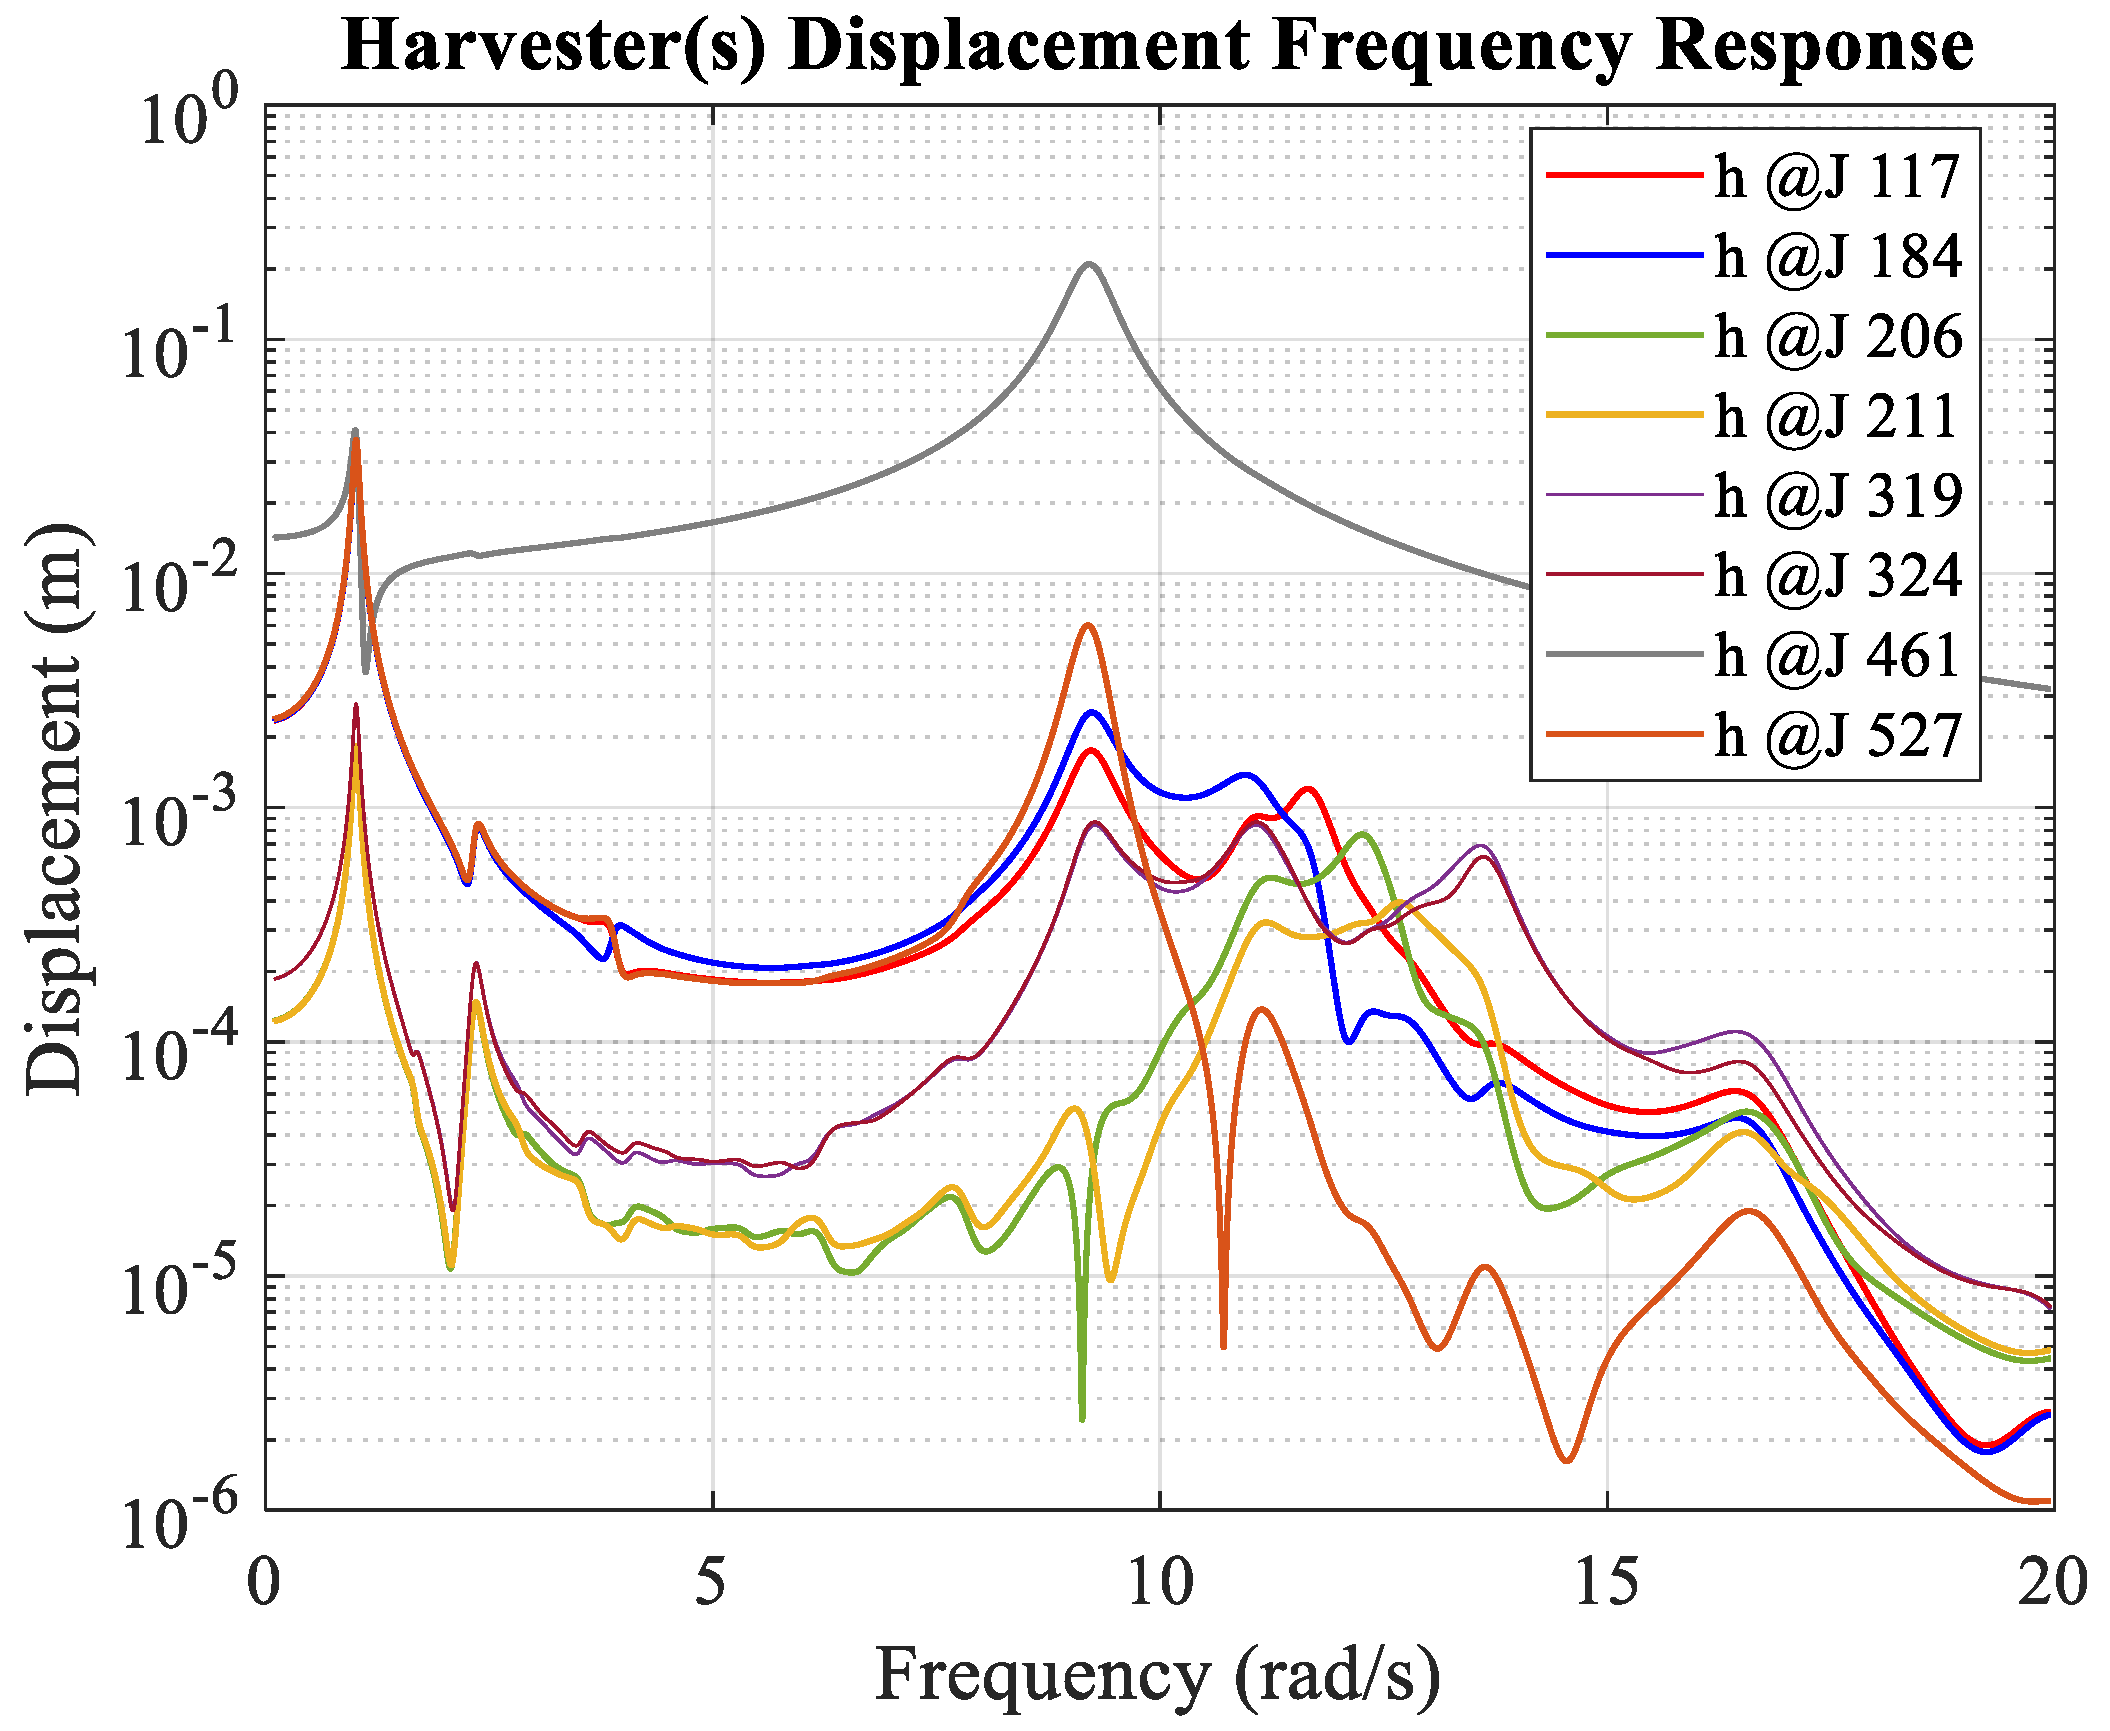
Figure 8 shows the displacement time history for the 8-harvester configuration while Figure 9 shows the corresponding displacement frequency response functions. The resulting optimal frequencies display a wide distribution since multiple local frequency peaks are observed in this case, as shown in Figure 9.
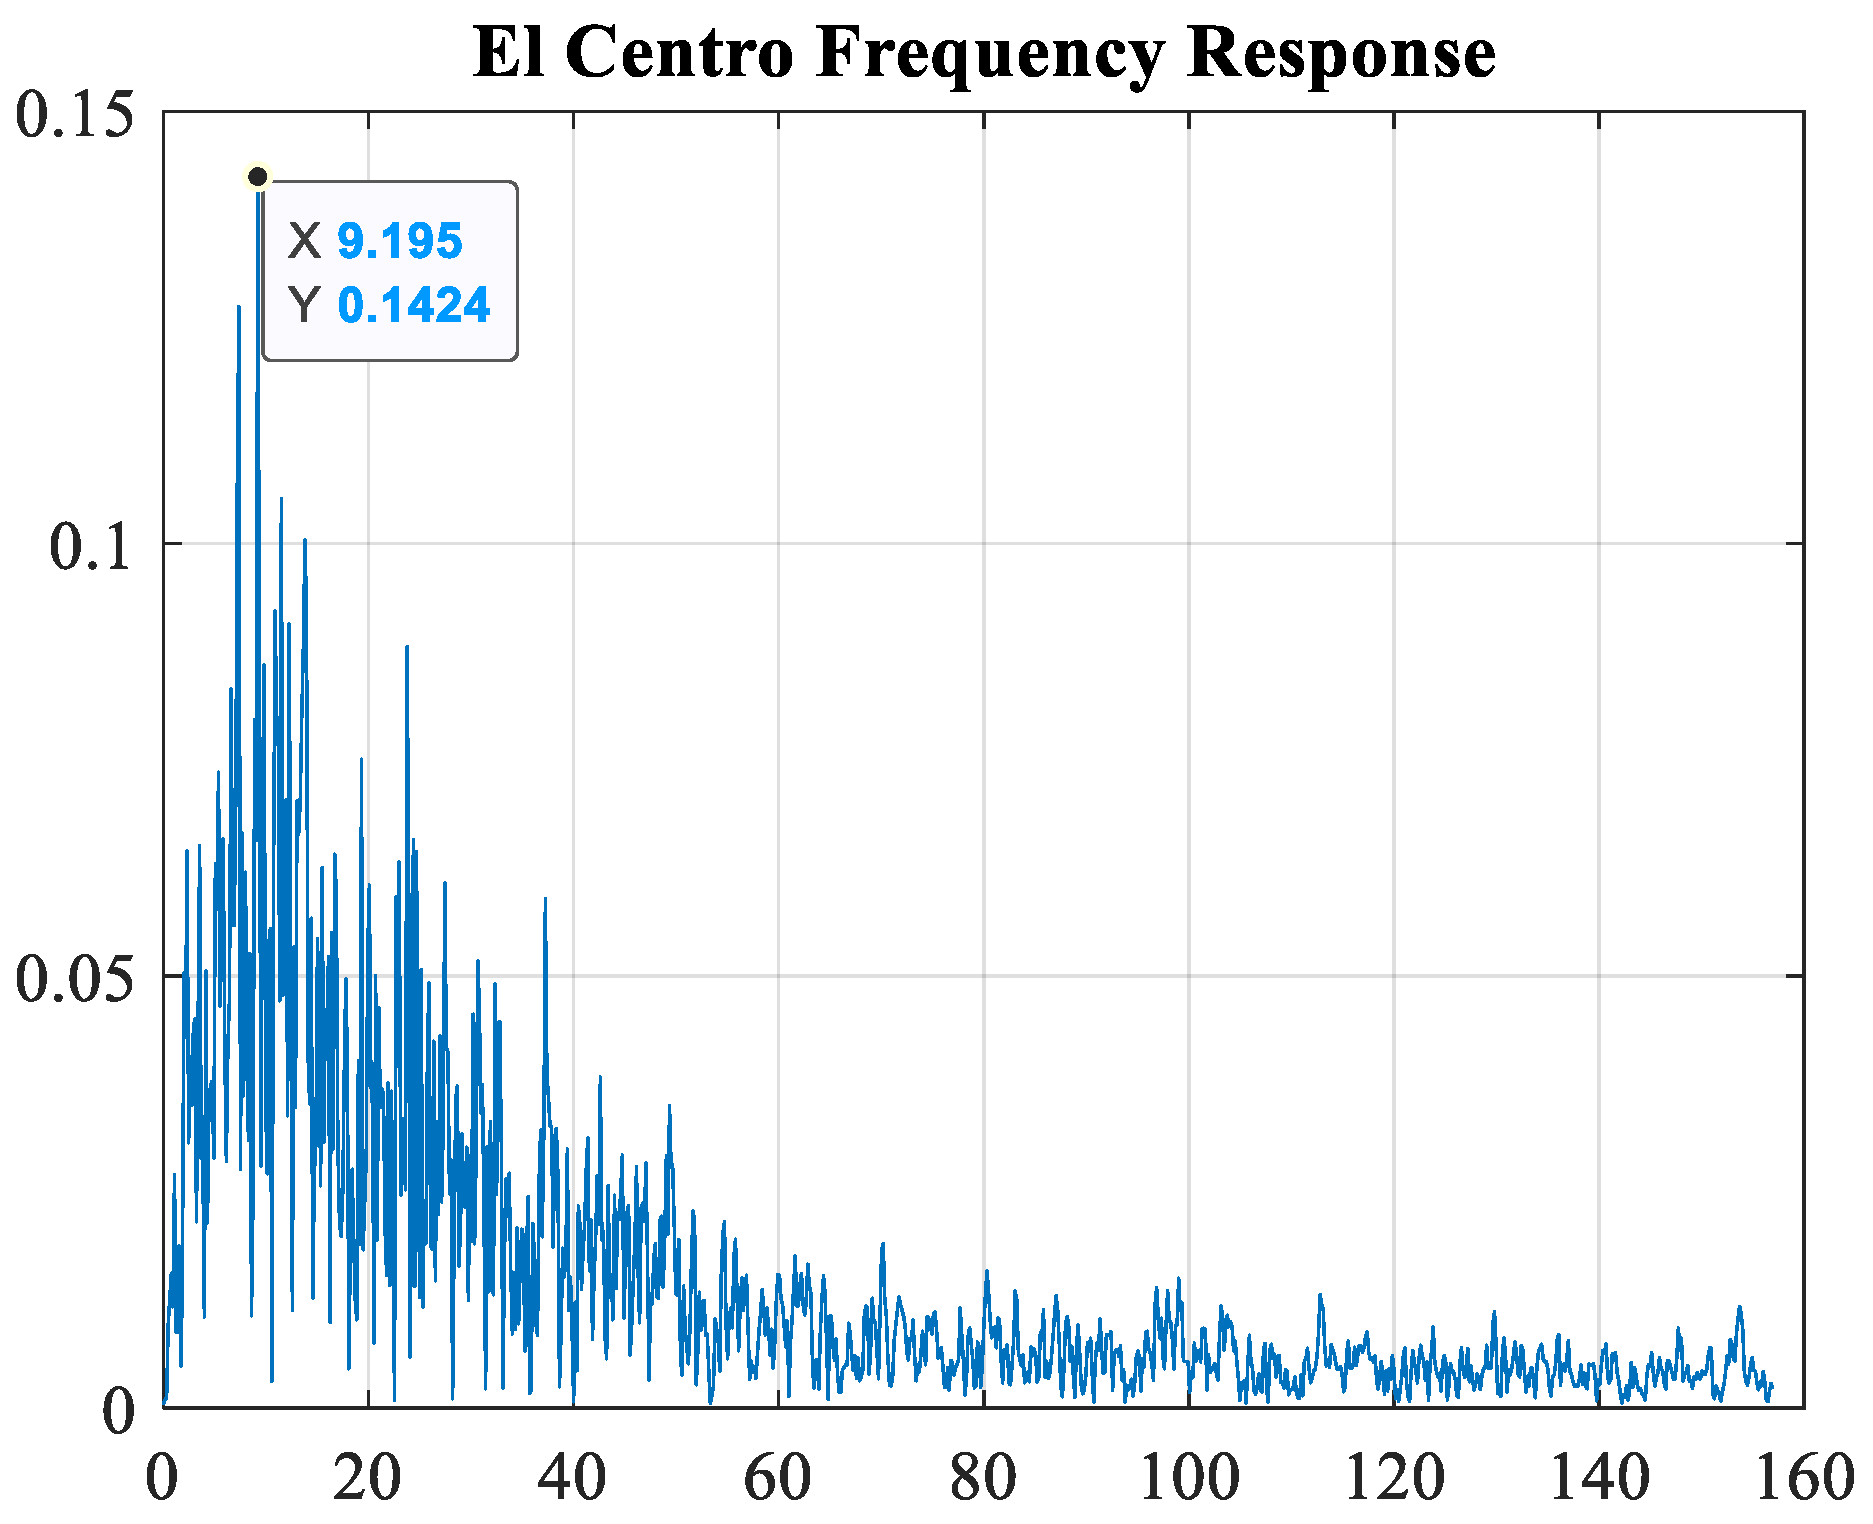
To further investigate the behavior of the resulting optimized frequencies, the frequency content of the input load was determined and shown in Figure 10. We can clearly observe that the highest frequency happens around 9.19 rad/s with some high peaks in the orders of 12 to 13 rad/s and hence, the tuning of all harvesters in that range.
The amount of power extracted under seismic excitation and shown in Table 3 is considerable and is sufficient to potentially power wireless communication devices that can alert or prevent structural damage during catastrophic events. The applications of this technology and the potential energy extracted are significant for implementation of structural health monitoring in bridges. Although the energy obtained from the scaled load is significantly smaller in this example, it is still sufficient to power WSNs, considering that their power requirements for data transmission are on the order of 0.09 to 128 mW [18]. In this particular example under this load, the potential power generation is on the order of 5 mW in all cases.
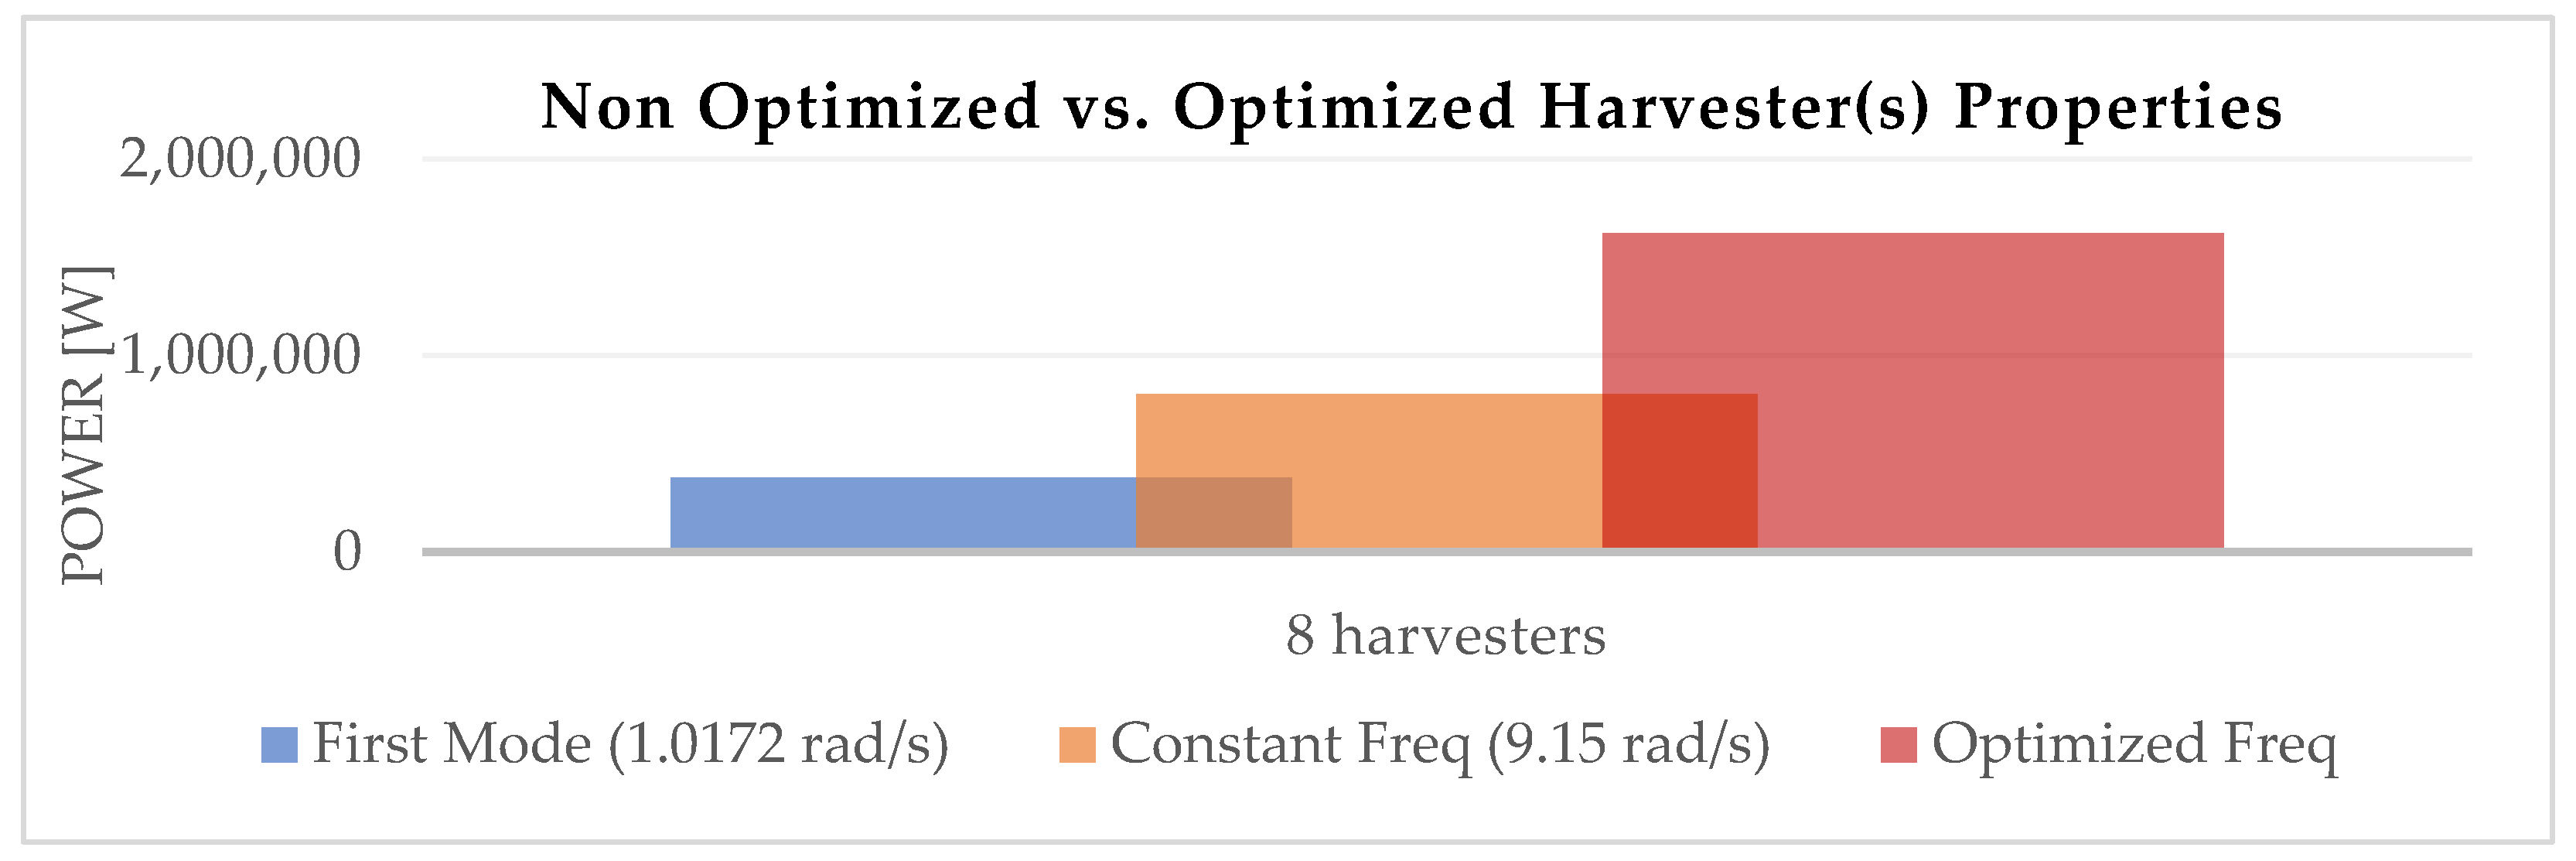
After the optimized frequencies and the associated energy harvested were found, further analyses were conducted to compare the optimum power generation of the 8-harvester configuration to two other scenarios, when the harvester(s) was tuned to the fundamental bridge frequency of 1.0172 rad/s and also to the scenario where they were tuned to different constant values selected from the optimal results or more specifically 9.15 rad/s in this case. The El Centro earthquake record was selected as the input load to perform this comparison.
The results are shown in Figure 11. One can clearly observe that tuning the devices to the fundamental bridge frequency underestimates the power generation capabilities in this configuration. The power is increased by 76% when optimizing each individual frequency for all harvesters with respect to tuning the devices to the fundamental frequency of the structure. The difference between the results from optimizing each individual device versus fixing a close to optimal value represents a 50% increase considering that, for this particular configuration, there is a wide distribution of optimized frequencies. The same comparison for 2, 4 and 16-harvester configurations can be found in [35].
Table 6 contains a comparison of required computational times including up-front costs and the required number of function evaluations for the bridge example. The computational times were calculated using the cputime command in MATLAB on a computer with two 3.20 GHz Intel(R) Xeon(R) CPU E5-2667 v4 processors, 256 GB RAM, Windows 10 and running MATLAB 2019b with parallel pool and 12 workers. The computational speed increase was compared with the projected cost of the conventional method using lsim in MATLAB for the number of function evaluations required for the proposed approach for each harvester configuration. For this particular example, the computational efficiency was increased two to three orders of magnitude. It is important to note that as the number of harvesters increases so does the required number of function evaluations which causes an increase in the computational efficiency of the proposed method. In particular, the design optimization process for the 8-harvester case was computed in approximately 11 min using the proposed method versus the approximate 3 days that it would have taken to completely replicate the process using conventional methods.
4.2. Multifunctional Concept Design
Green gardens were considered as the multifunctional design concept to be implemented as the harvester’s mass for the cable-stayed bridge model. For ease of analysis, roof gardens were adapted and implemented in this example. These types of gardens can be categorized as shallow (ultra-extensive), medium depth (extensive) and deep (intensive) systems [36]. The first refers to gardens that have an approximate growth media depth of 2.5″ to 4″ and require little maintenance; they are suitable for implementation at inaccessible areas and can accommodate sedums, herbs and grasses. Extensive gardens have a growth media depth of 5″ to 8″ and also require relatively low maintenance. They can include sedum, herbs grasses and other types of vegetation. Irrigation systems may be required for this category to support more diverse plants and when installed in semi-arid climates. Intensive gardens typically exceed a growth media depth of 8″ to accommodate planting systems that require deeper media. This type of system requires high maintenance such as watering, fertilizing, mowing/weeding, needs to incorporate an irrigation system and they also impose the greatest dead load.
Under these considerations, extensive gardens were selected for implementation in the cable-stayed bridge model, considering their low maintenance requirements and their potential to accommodate different types of vegetation. A schematic representation including different components of the green garden can be found in [36].
This concept, when applied to bridge structures, would have significant impact on the environment since it would improve and reduce the pollution created by traffic carbon dioxide emissions considering the ability of plants to absorb carbon emissions, and can reduce the urban heat island effect since sunlight is used for growth as it is absorbed by vegetation instead of becoming heat energy [36]. The concept would also improve the aesthetics of the structure as well as creating ecological habitats for birds and other species. One conceptual garden implementation for bridge infrastructure is shown in Figure 12. The Friedrich Bayer Bridge in Brazil is another example of incorporating the garden concept into bridge infrastructure [37].
As previously mentioned, green gardens were selected as the multifunctional concept to implement for the Bill Emerson cable-stayed bridge. The solution considered connecting the garden mass to joints located towards the center of the bridge deck to maximize the power generation, maintain the symmetry of the structure and strategically improve the bridge’s aesthetics in general. Recent experimental studies on piezoelectric energy harvesting from vehicle–bridge coupling vibration show that higher energy harvesting efficiency can be achieved when the harvester is installed at the center of the structure [39]. These results validate the approach of implementing the proposed multifunctional vibrational energy harvesting concept at the center of the Bill Emerson cable-stayed bridge.
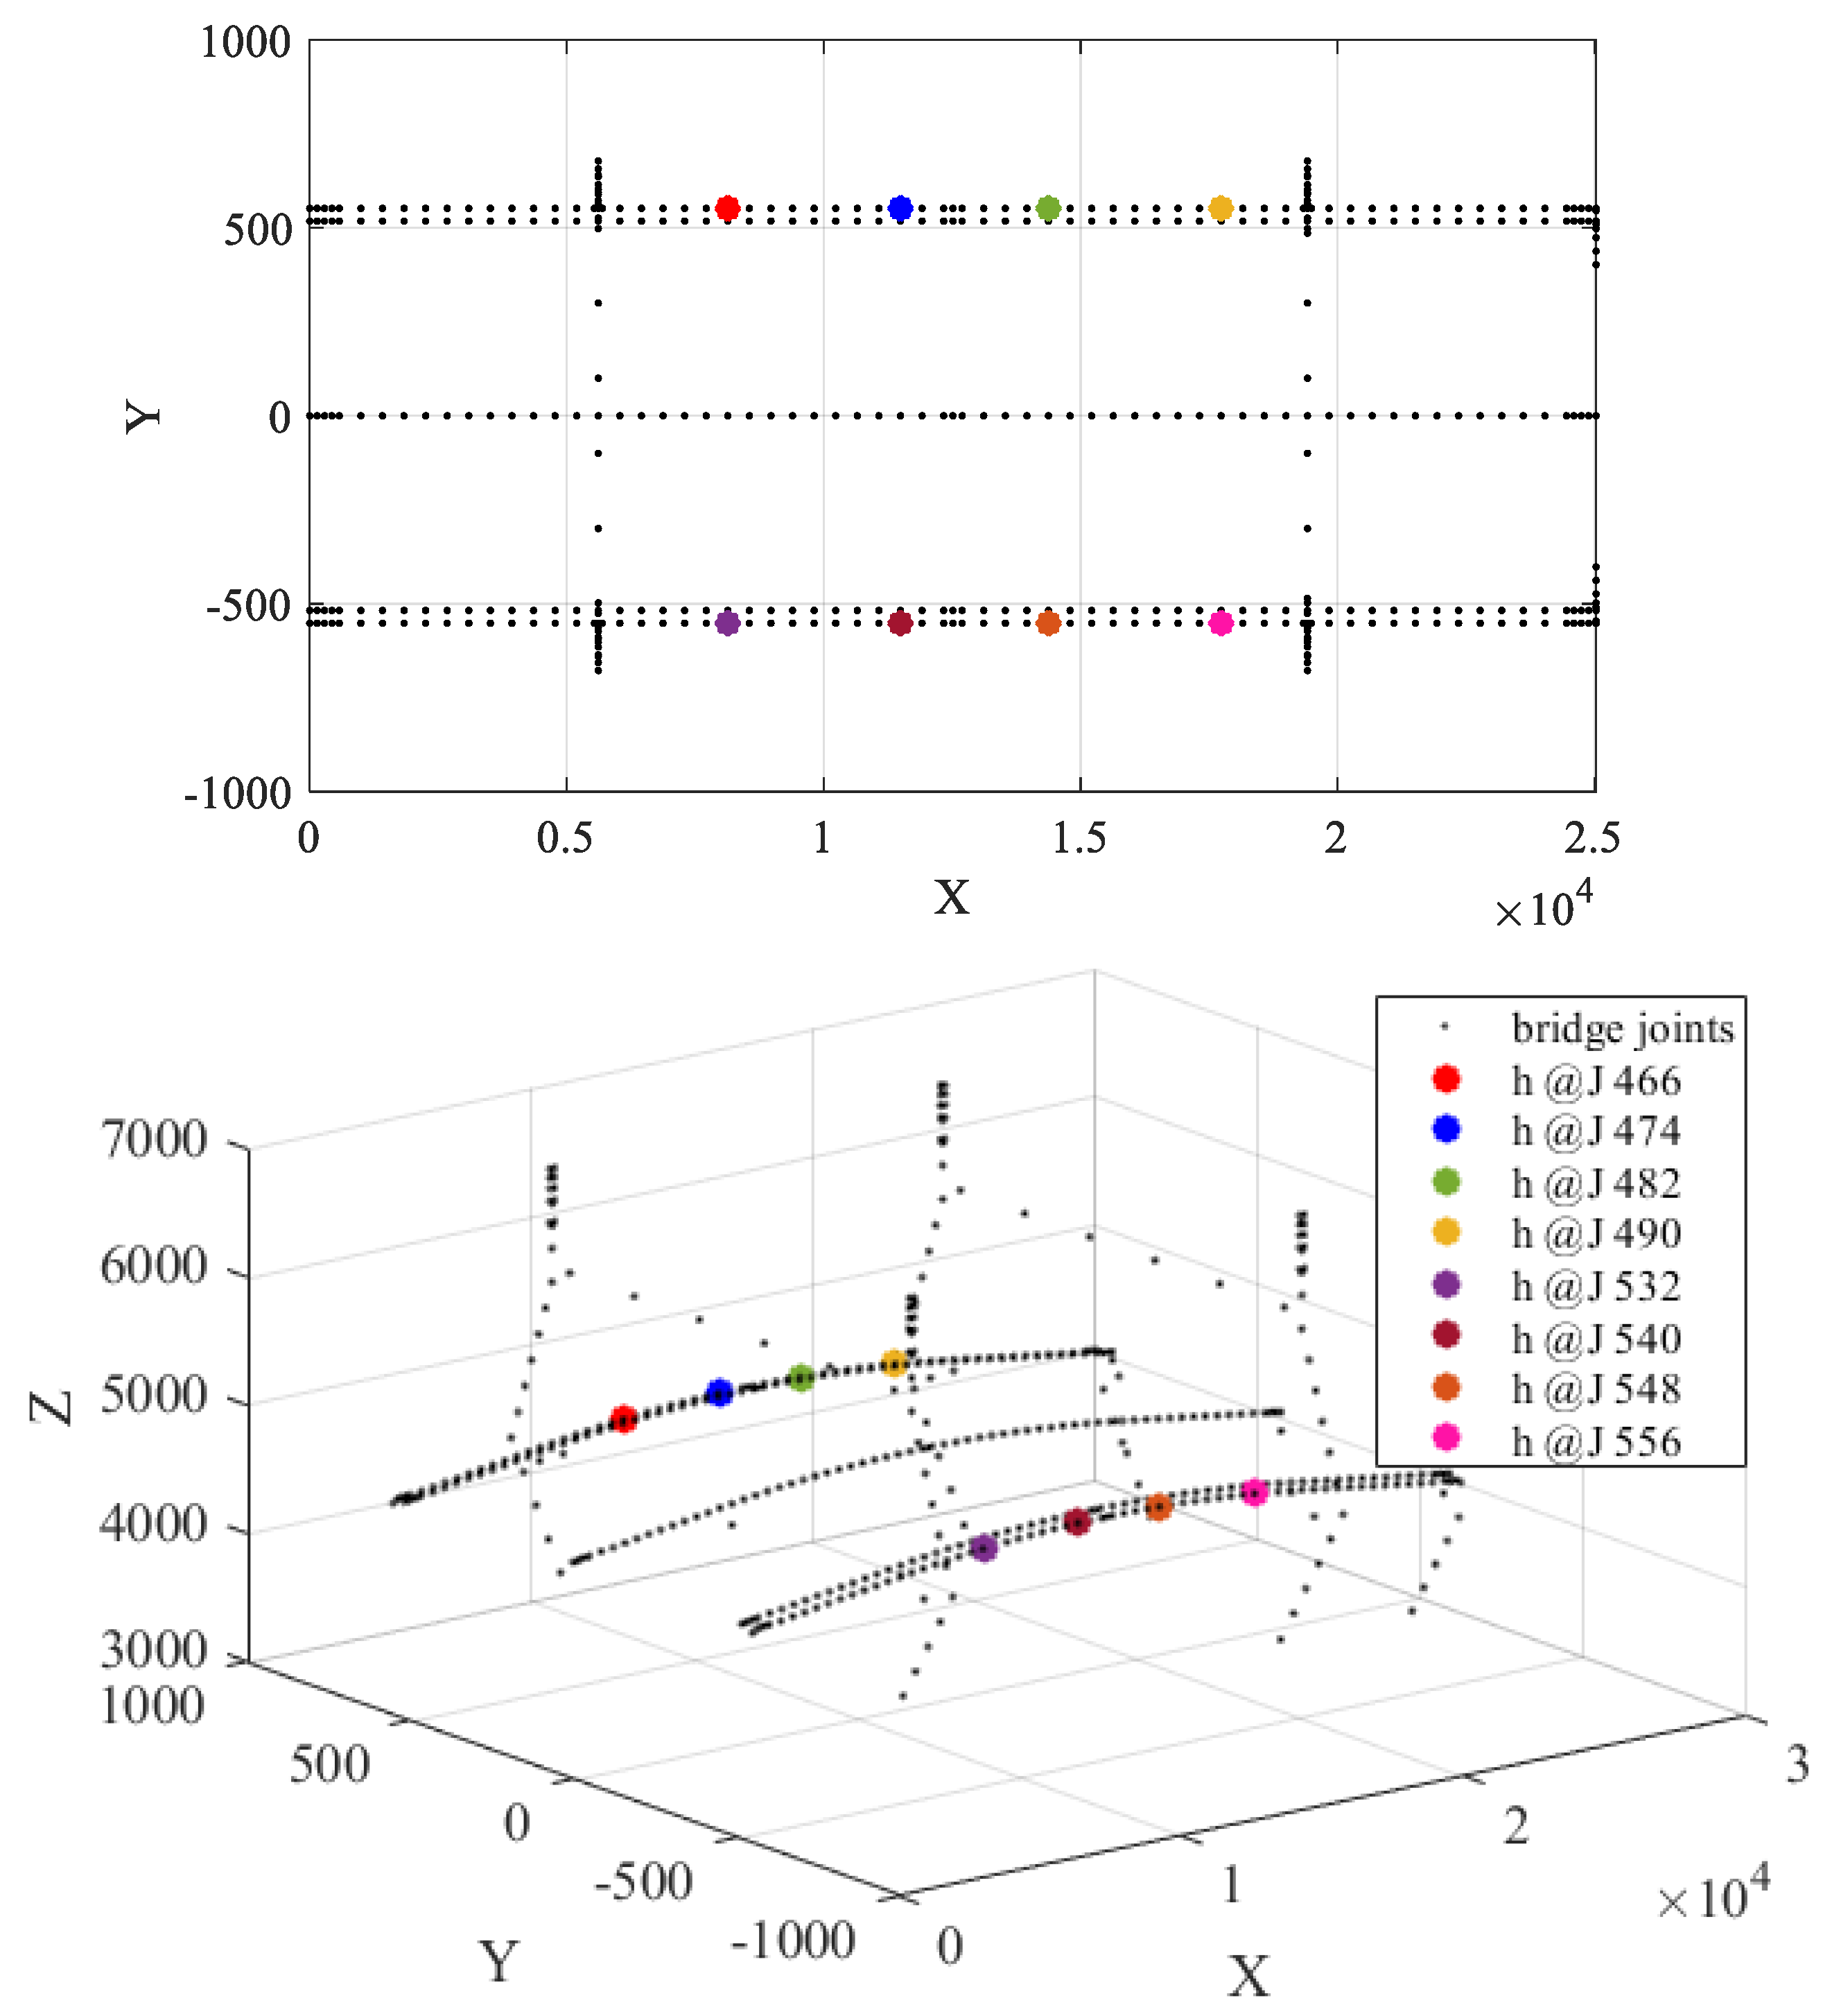
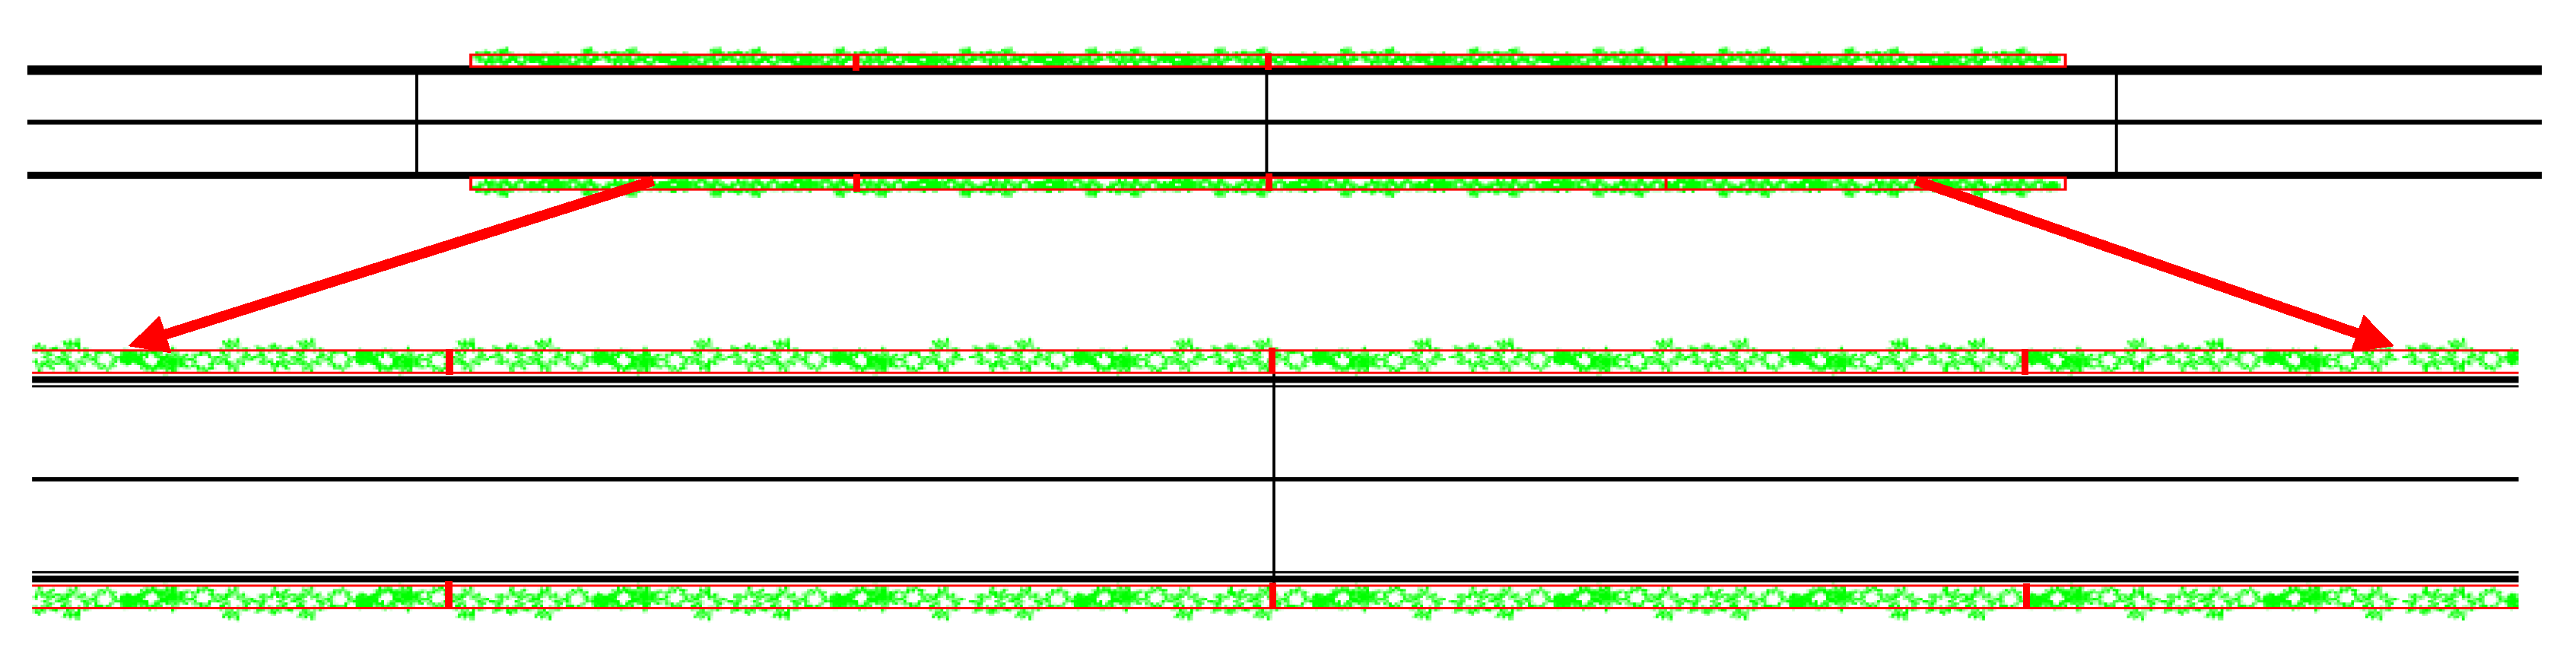
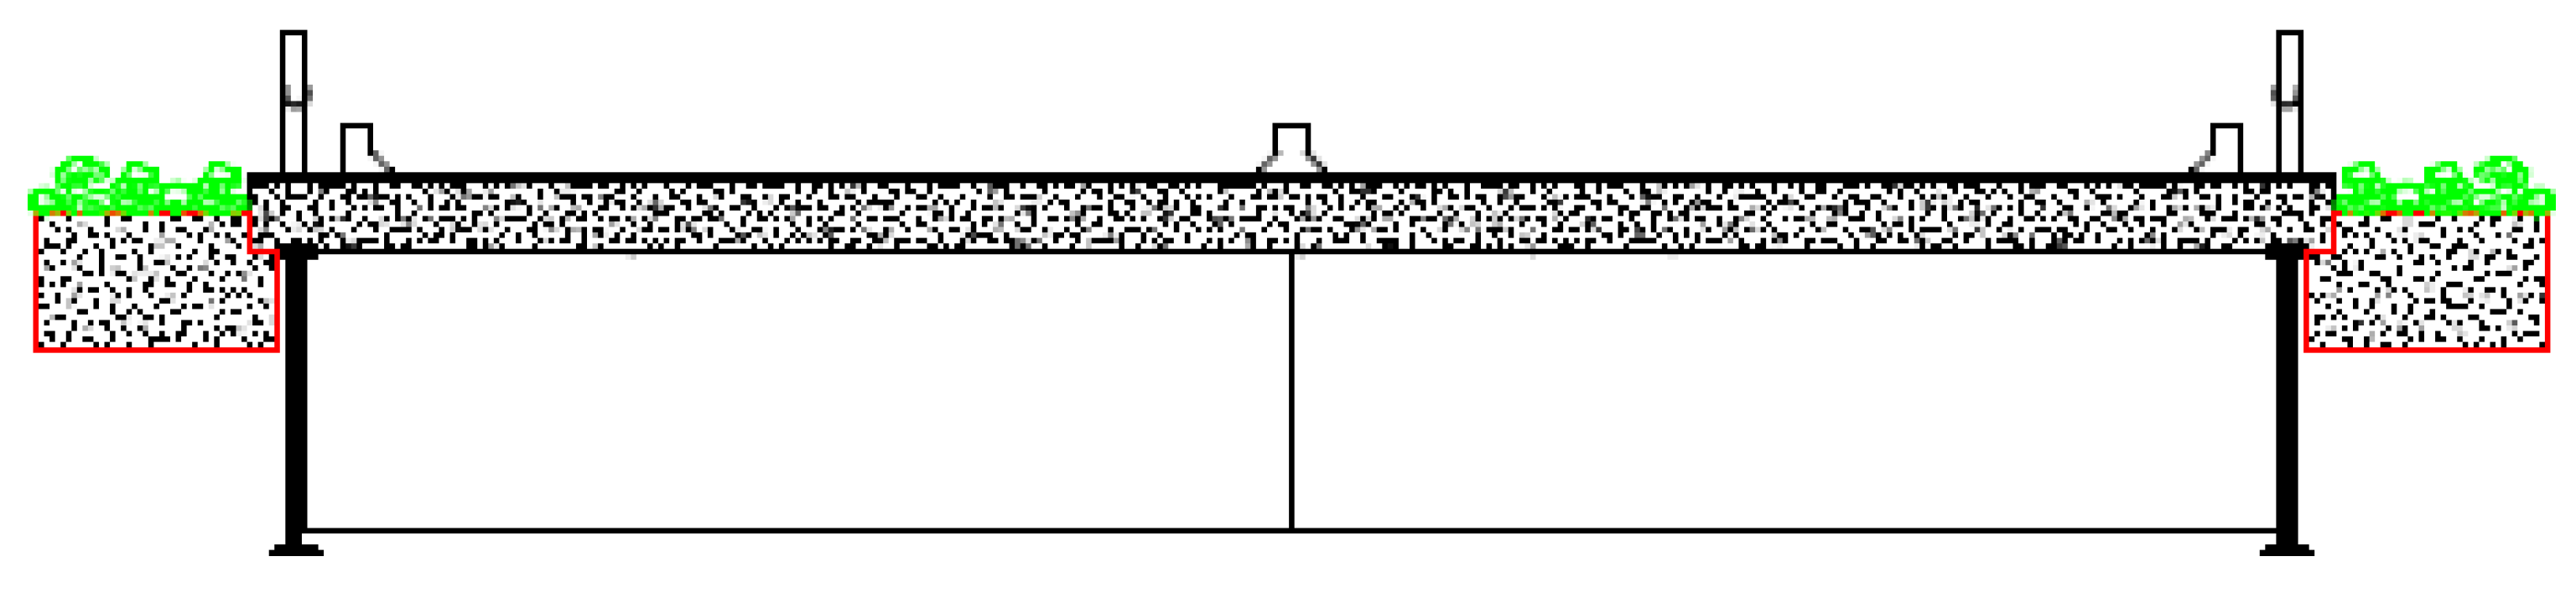
Based on these considerations, the total garden mass was divided into two sections and placed on joints located between piers 2 and 3, and more specifically 466, 474, 482 and 490 on the outer right deck and 532, 540, 548 and 556 on the outer left deck as schematically shown in Figure 13. In this particular case a total of eight harvesters were considered, but different configurations can be selected without affecting the efficacy and practicality of the employed computational method. The total garden area was divided into eight equal tributary areas where each is supported by a harvester at the specified joints and schematically shown in Figure 14. A schematic representation of the green gardens connected to both sides the bridge outer deck is shown in Figure 15.
Detailed calculations were performed to determine the total required mass for the green gardens, with each harvester tributary area defined by a length of 82.29 m, considering the spacing between joints, and a width of 3 m, selected to achieve proportionality within the structure. Table 7 shows the different components and general specifications for the design and implementation of the green gardens as presented in [27]. Based on the calculations performed, each harvester’s mass was found to be approximately 67,093.7 kg resulting in a total harvester mass of 536,749.6 kg.
The same two input loads were considered in the design process as described in Section 3.2, including both El Centro earthquake record and a scaled version of it to simulate typical vibration levels from traffic loads at the Bill Emerson cable-stayed bridge. The optimization again consisted of maximizing the power generated under both input loads by optimizing each harvester frequency. Results from the optimization process are shown in Table 8 for both input cases.
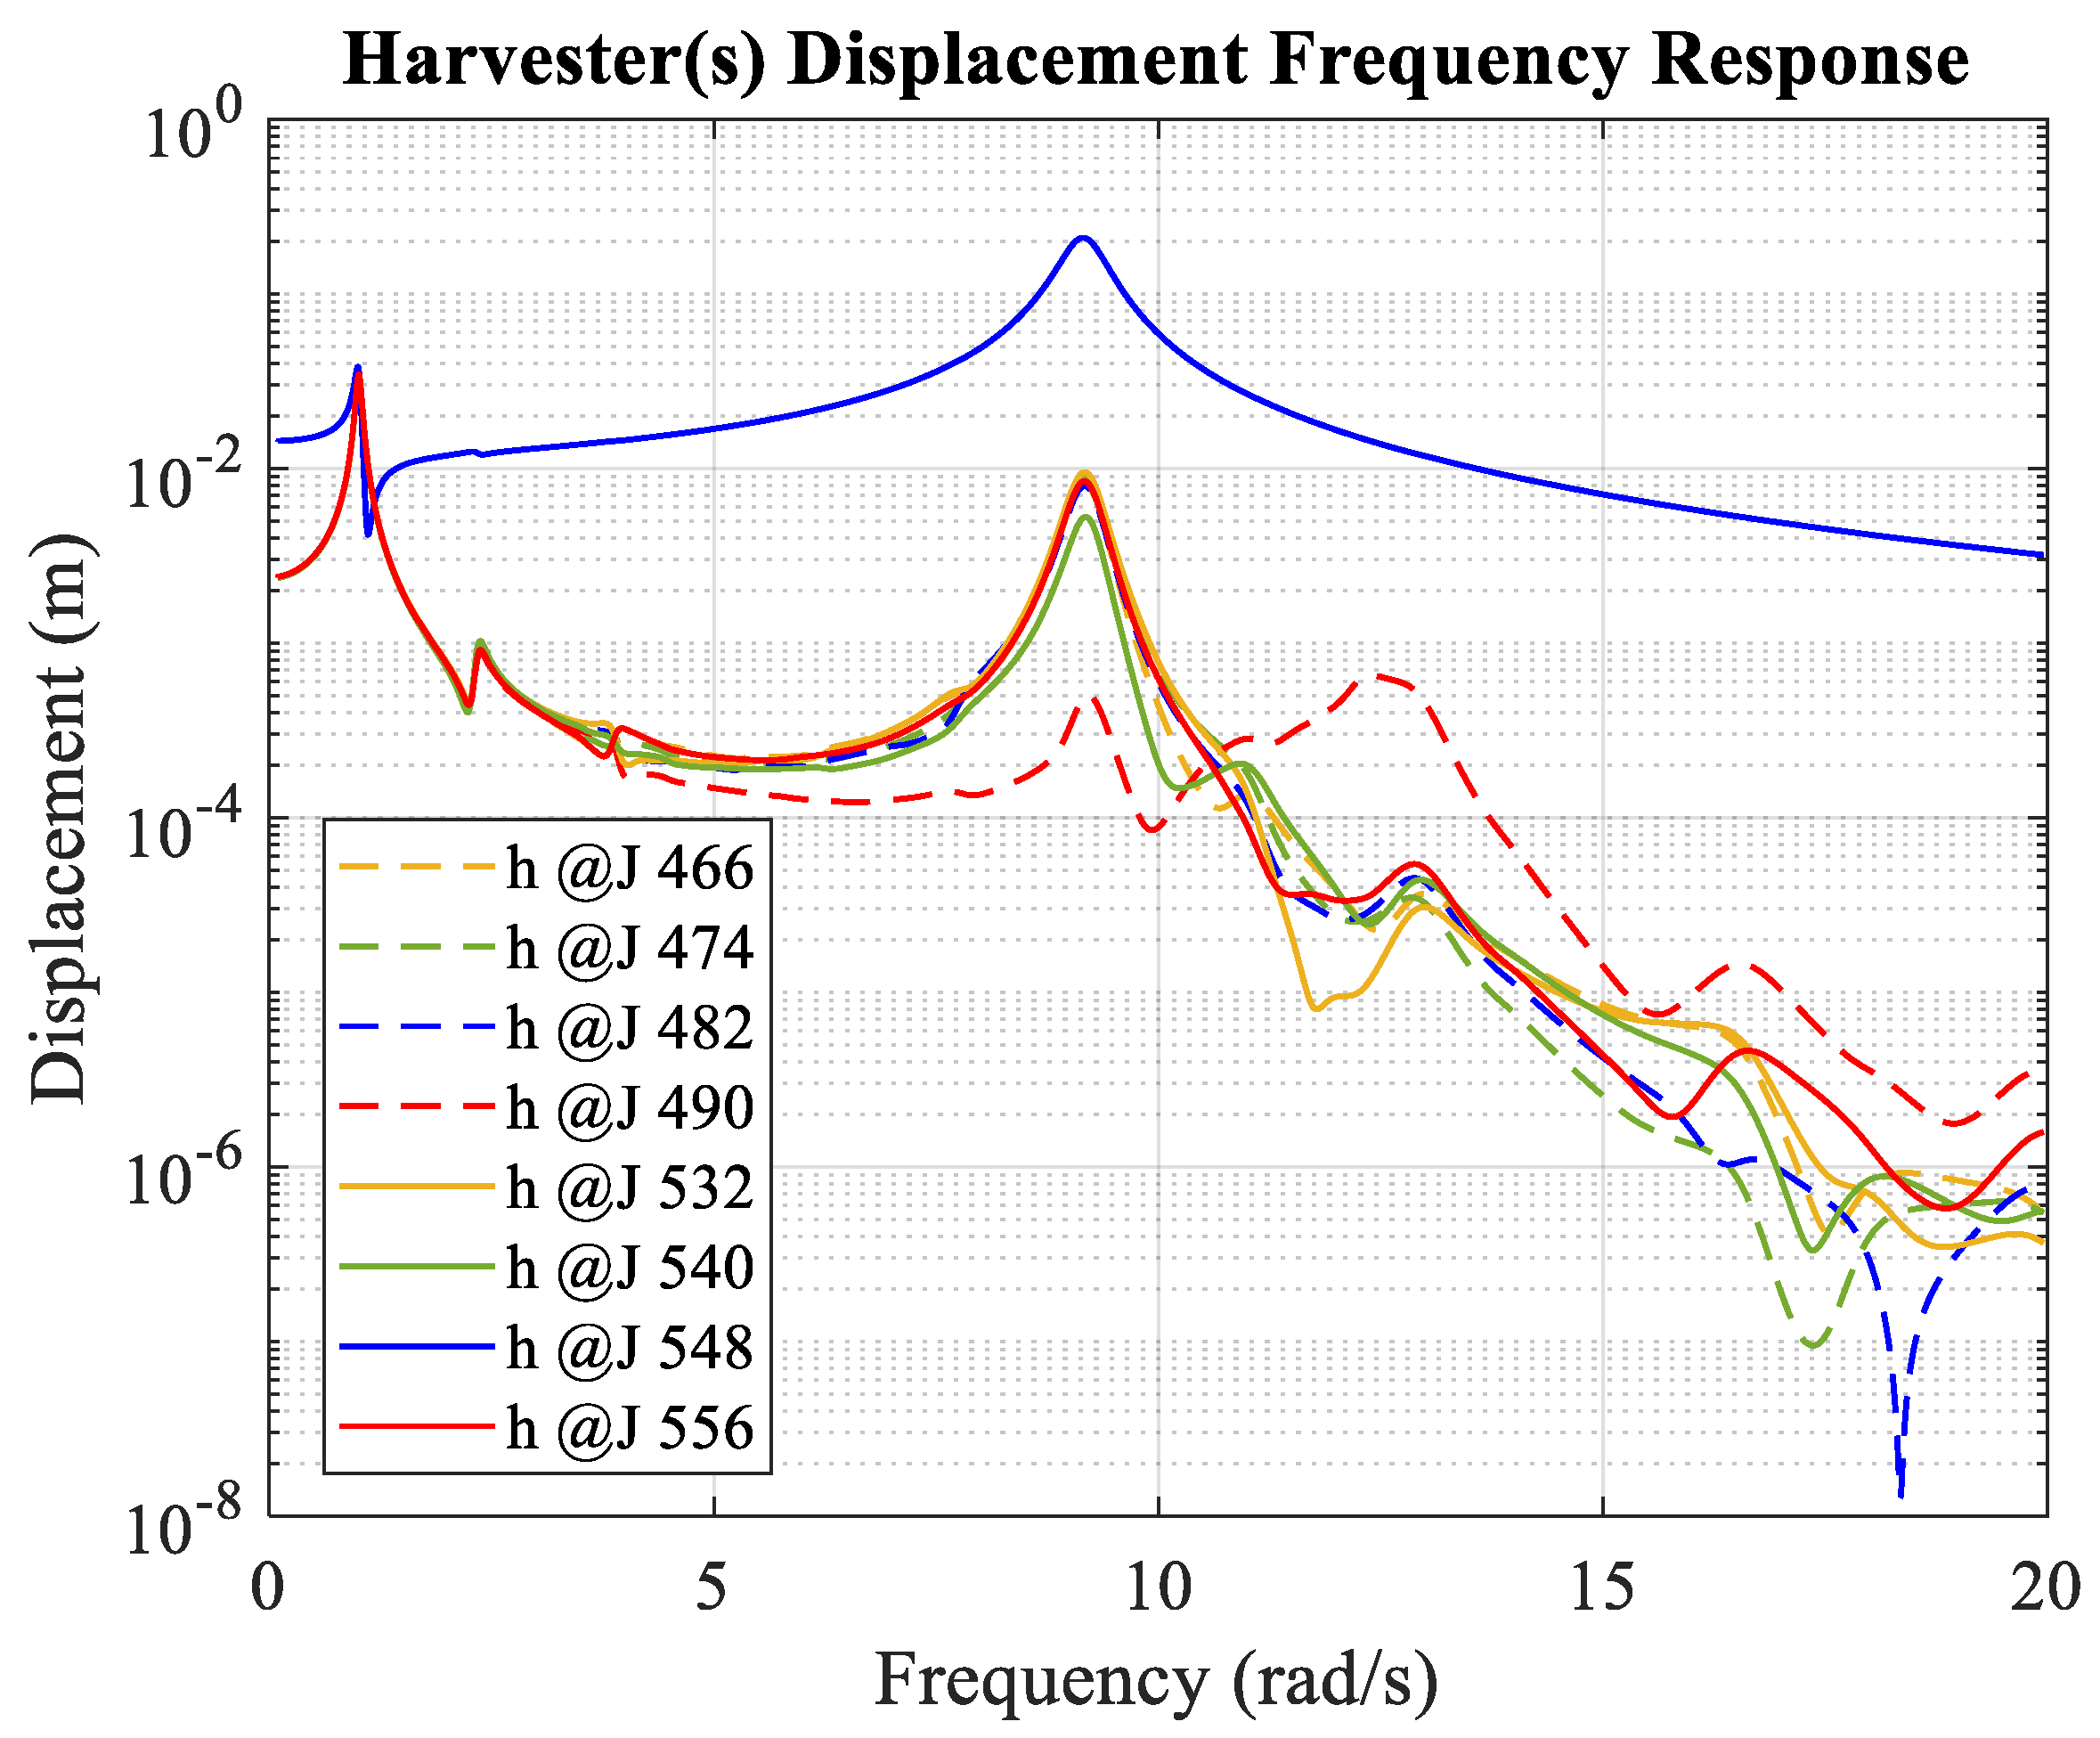
In this particular example the resulting frequencies follow a similar pattern, with most of them tuned around 9.14 rad/s under both input loads, consistent with their highest peaks located around 9.14 rad/s in Figure 16. There is an exception to this behavior for the harvester connected at joint 490 which is tuned at 12.25 rad/s, also consistent with its highest peak located between 12.2 and 12.4 rad/s in Figure 16. Although the total harvester mass was considered to be similar to that described in Section 4.1 or more specifically 1.03% of the total structure mass, the harvester’s placement was chosen taking into consideration aesthetic factors, with a difference of about only 3% in total power generation with respect to the optimal results for the 8-harvester case shown in Table 3.
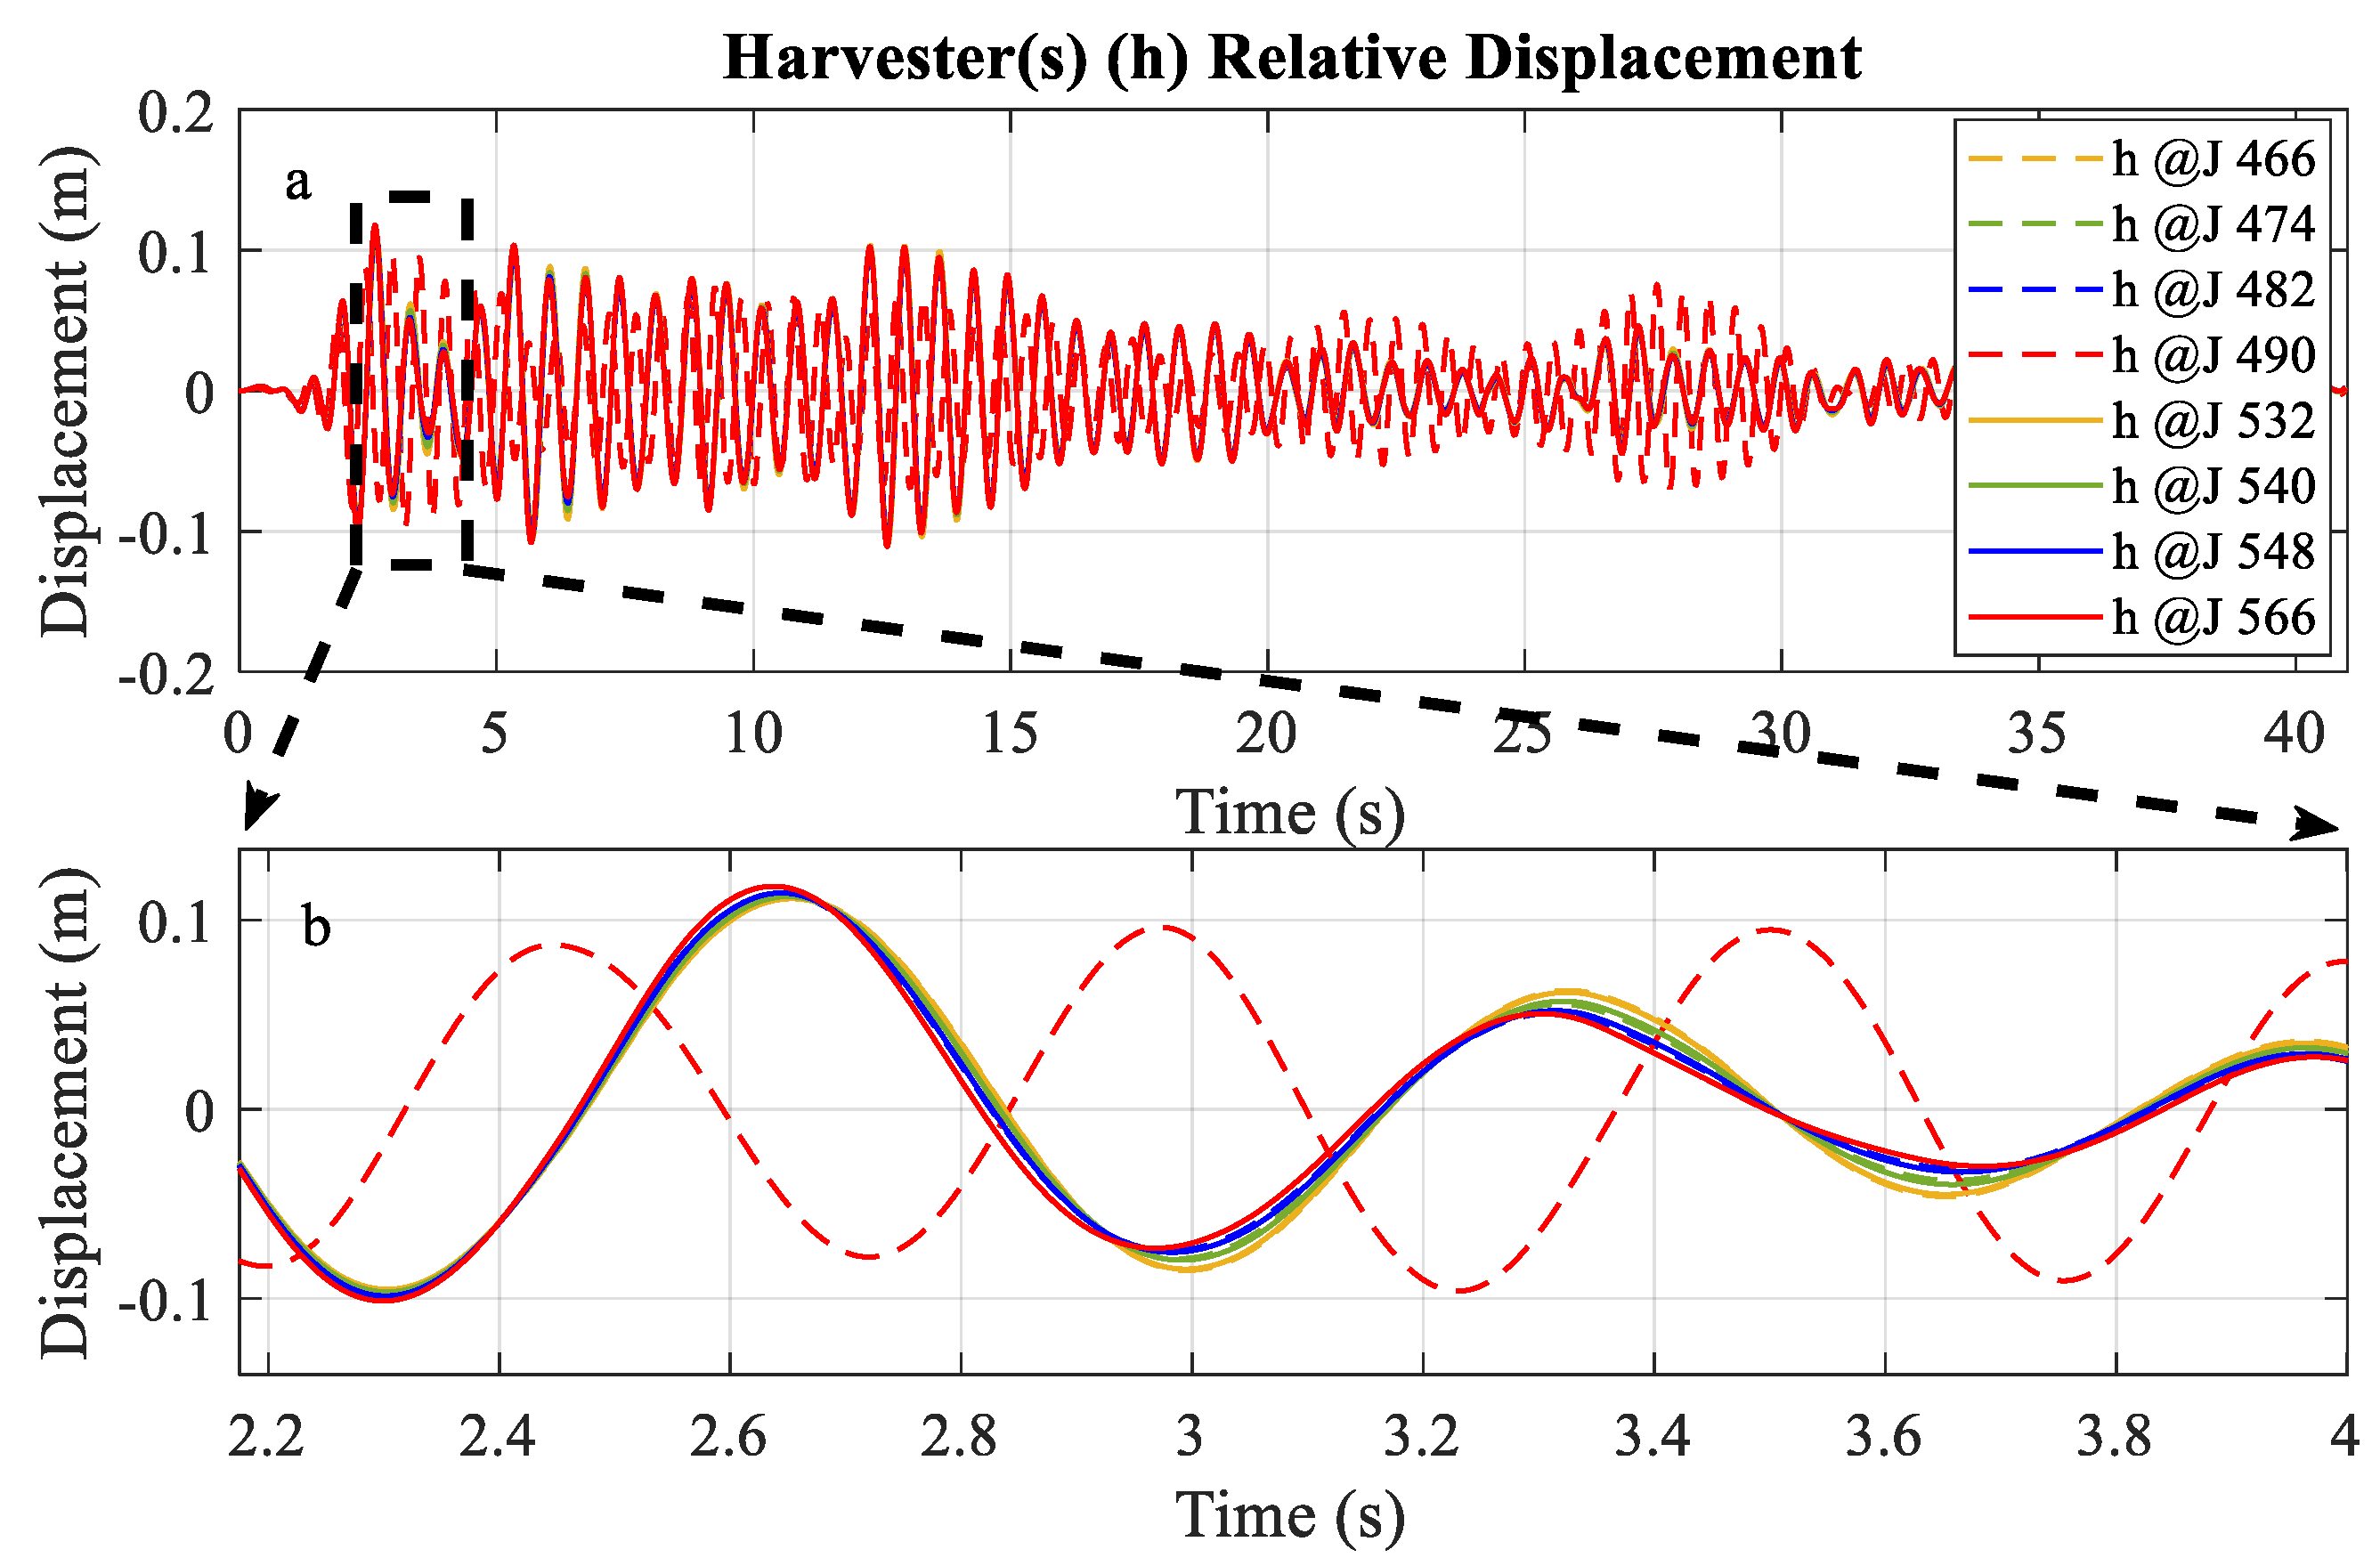
Figure 17 shows the displacement time histories for all devices subjected to the El Centro earthquake record input load for the implementation of the green garden concept using a total of eight harvesters and no damping. In all cases, maximum harvester displacements are within acceptable and safe values. For this particular example, only displacements under El Centro earthquake record load were investigated considering that the peak acceleration from the traffic induced scaled input load is considerably smaller than the earthquake load.
5. Conclusions
Earthquake vibrations were employed to assess the power generation capabilities of the different harvester configurations applied to a realistic bridge structure. Even though civil infrastructure is not constantly exposed to earthquake loads, the results obtained during these moderate to extreme vibrations validate the benefits of incorporating this technology into the overall structural system design and their significant power generation capabilities (the order of thousands of kilowatts over a 40 s period). Although the amount of electrical power obtained from traffic induced level vibrations in the particular bridge example considered are only on the order of milliwatts, the scavenged energy is still sufficient to power WSNs that can monitor the structural health of bridge structures.
To further investigate the effects of multiple input loads in the performance and power generation capabilities of vibrational energy harvesters in bridges, wind and traffic loads can be included in the analyses.
Pre-defined symmetric locations were considered in this paper to optimize the total power generation of all harvesters for the purpose of implementing the multifunctional green garden concept. However, a topology optimization can be performed without alterations to the proposed methodology and is one future direction of the authors’ research.
The green garden concept was investigated and presented as potential multifunctional solution to holistically integrate the mass of the harvesters into the overall structural system design for the cable-stayed bridge example. The proposed design solution maximized the harvester’s power generation capabilities while utilizing the harvester’s proof mass as gardens to enhance the structure’s aesthetics while benefitting both the ecology and the environment.
The efficient design, analysis, and validation of vibrational energy harvesters is critical to their successful implementation in bridges and buildings. This research, when implemented as multifunctional devices, will enable energy efficient civil structural systems capable of dissipating vibrations while integrating the mass of the energy harvester to improve the functionality and aesthetics of structures. Since vibrational energy harvesters will not only dissipate structural vibrations but will also provide a localized energy source, this multifunctional concept can also potentially contribute to the sustainability of varied infrastructure systems.
Author Contributions
Conceptualization, L.F. and S.F.W.; methodology, L.F. and S.F.W.; software, L.F. and S.F.W.; validation, L.F. and S.F.W.; formal analysis, L.F. and S.F.W.; investigation, L.F. and S.F.W.; resources, L.F. and S.F.W.; data curation, L.F. and S.F.W.; writing—original draft preparation, L.F.; writing—review and editing, S.F.W.; visualization, L.F. and S.F.W.; supervision, S.F.W.; project administration, L.F. and S.F.W.; funding acquisition, L.F. and S.F.W. All authors have read and agreed to the published version of the manuscript.
Funding
This research was funded by the Dwight David Eisenhower Transportation Fellowship Program (DDETFP), grant number 69JJ32145071.
Institutional Review Board Statement
Not applicable.
Informed Consent Statement
Not applicable.
Data Availability Statement
Not applicable.
Acknowledgments
We would like to thank James Gibert from Purdue University for the harvester base data provided and his valuable insights on the mechanics of vibrational energy harvesters. We would also like to thank Subhayan De from Northern Arizona University for providing the cable-stayed bridge model data.
Conflicts of Interest
The authors declare no conflict of interest.
References
- Rhimi, M.; Lajnef, N. Tunable Energy Harvesting from Ambient Vibrations in Civil Structures. J. Energy Eng. 2012, 138, 185–193. [Google Scholar] [CrossRef]
- Baldwin, J.D.; Roswurm, S.; Nolan, J.; Holliday, L. Energy Harvesting on Highway Bridges; Department of Transportation: Oklahoma City, OK, USA, 2011. [Google Scholar]
- Cahill, P.; Nuallain, N.A.N.; Jackson, N.; Mathewson, A. Energy Harvesting from Train-Induced Response in Bridges. J. Bridge Eng. 2014, 19, 1–11. [Google Scholar] [CrossRef]
- Sazonov, E.; Li, H.; Curry, D.; Pillay, P. Self-Powered Sensors for Monitoring of Highway Bridges. IEEE Sens. J. 2009, 9, 1422–1429. [Google Scholar] [CrossRef] [Green Version]
- McEvoy, T.; Dierks, E.; Weaver, J. Developing innovative energy harvesting approaches for infrastructure health monitoring systems. In Proceedings of the ASME 2011 International Design Engineering Technical Conferences and Computers and Information in Engineering Conference, Washington, DC, USA, 28–31 August 2011; pp. 325–339. [Google Scholar]
- Jo, B.; Lee, Y.; Yun, G.; Park, C.; Kim, J. Vibration-induced energy harvesting for green technology. In Proceedings of the International Conference on Chemical, Environmental and Civil Engineering, Dubai, United Arab Emirates, 24–25 March 2012; pp. 167–170. [Google Scholar]
- Galchev, T.; Kim, H.; Najafi, K. Micro Power Generator for Harvesting Low-Frequency and Nonperiodic Vibrations. J. Microelectromech. Syst. 2011, 20, 852–866. [Google Scholar] [CrossRef]
- Zhang, Y.; Cai, C.S. A retrofitted energy harvester for low frequency vibrations. Smart Mater. Struct. 2012, 21, 075007. [Google Scholar] [CrossRef]
- Ali, S.F.; Friswell, M.I.; Adhikari, S. Analysis of energy harvesters for highway bridges. J. Intell. Mater. Syst. Struct. 2011, 22, 1929–1938. [Google Scholar] [CrossRef]
- Kwon, S.D.; Park, J.; Law, K. Electromagnetic energy harvester with repulsively stacked multilayer magnets for low frequency vibrations. Smart Mater. Struct. 2013, 22, 055007. [Google Scholar] [CrossRef] [Green Version]
- Elvin, N.G.; Lajnef, N.; Elvin, A.A. Feasibility of structural monitoring with vibration powered sensors. Smart Mater. Struct. 2006, 15, 977–986. [Google Scholar] [CrossRef]
- Ali, M.; Armstrong, P.J. Sustainability and the tall building: Recent developments and future trends. In Sustainability and the Tall Building; AIA Illinois Central Symposium: Springfield, IL, USA, 2010; pp. 1–12. [Google Scholar] [CrossRef]
- Farrar, C.R.; Lieven, N.A.J. Damage prognosis: The future of structural health monitoring. Philos. Trans. R. Soc. A 2007, 365, 623–632. [Google Scholar] [CrossRef]
- Shen, W.; Zhu, S.; Zhu, H. Experimental study on using electromagnetic devices on bridge stay cables for simultaneous energy harvesting and vibration damping. Smart Mater. Struct. 2016, 25, 1–17. [Google Scholar] [CrossRef]
- Wang, H.; Jasim, A.; Chen, X. Energy harvesting technologies in roadway and bridge for different applications—A comprehensive review. Appl. Energy 2018, 212, 1083–1094. [Google Scholar] [CrossRef]
- Khan, F.; Ahmad, I. Review of energy harvesters utilizing bridge vibrations. Shock. Vib. 2016, 2016, 1340402. [Google Scholar] [CrossRef] [Green Version]
- Khan, F.; Iqbal, M. Electromagnetic bridge energy harvester utilizing bridge’s vibrations and ambient wind for wireless sensor node application. J. Sens. 2018, 2018, 1–18. [Google Scholar] [CrossRef] [Green Version]
- Khan, F.U. Review of non-resonant vibration based energy harvesters for wireless sensor nodes. J. Renew. Sustain. Energy 2016, 8, 044702. [Google Scholar] [CrossRef]
- Beeby, S.P.; Torah, R.N.; Tudor, M.J.; Glynne-Jones, P.; O’Donnell, T.; Saha, C.R.; Roy, S. A micro electromagnetic generator for vibration energy harvesting. J. Michromechanics Microeng. 2007, 17, 1257–1265. [Google Scholar] [CrossRef]
- Khan, F.; Sassani, F.; Stoeber, B. Copper foil-type vibration-based electromagnetic energy harvester. J. Michromechanics Microeng. 2010, 20, 125006. [Google Scholar] [CrossRef]
- Shen, W.; Zhu, S. Harvesting energy via electromagnetic damper: Application to bridge stay cables. J. Intell. Mater. Syst. Struct. 2015, 26, 3–19. [Google Scholar] [CrossRef]
- Saadon, S.; Sidek, O. A review of vibration-based MEMS piezoelectric energy harvesters. Energy Convers. Manag. 2011, 52, 500–504. [Google Scholar] [CrossRef]
- Alsaadi, A.; Shi, Y.; Pan, L.; Tao, J.; Jia, Y. Vibration energy harvesting of multifunctional carbon fibre composite laminate structures. Compos. Sci. Technol. 2019, 178, 1–10. [Google Scholar] [CrossRef]
- Peigny, M.; Siegert, D. Piezoelectric energy harvesting from traffic-induced bridge vibrations. Smart Mater. Struct. 2013, 22, 095019. [Google Scholar] [CrossRef] [Green Version]
- Fernandez, L.; Wotjkiewicz, S.F. Computationally efficient analysis and design optimization of vibrational energy harvesters at the infrastructure scale. Mech. Syst. Signal Process. 2021, 170, 108780. [Google Scholar] [CrossRef]
- Green Vehicle Guide. Available online: https://www.epa.gov/greenvehicles/greenhouse-gas-emissions-typical-passenger-vehicle (accessed on 1 November 2021).
- SkyGarden Green Solutions. Available online: https://www.sky-garden.co.uk (accessed on 1 November 2021).
- Bridge Health Monitoring System. Available online: https://www.signaguard.com/bridge-health-monitoring-system/ (accessed on 1 June 2021).
- Gaurav; Wojtkiewicz, S.F.; Johnson, E.A. Efficient uncertainty quantification of dynamical systems with local nonlinearities and uncertainties. Probabilistic Eng. Mech. 2011, 26, 561–569. [Google Scholar] [CrossRef]
- Fu, Q.; Jiang, B.; Wang, C.; Zhou, X. A novel deblocking quantization table for luminance component in baseline JPEG. J. Commun. 2015, 10, 629–637. [Google Scholar] [CrossRef] [Green Version]
- De, S.; Wotjkiewicz, S.F.; Johnson, E.A. Efficient optimal design and design-under-uncertainty of passive control devices with application t a cable-stayed bridge. Struct Control. Health Monit. 2017, 24, e1846. [Google Scholar] [CrossRef]
- Dyke, S.J.; Caicedo, J.M.; Turan, G.; Bergmn, L.A.; Hague, S. Phase I benchmark control problem for seismic response of cable-stayed bridges. J. Struct. Eng. 2003, 129, 857–872. [Google Scholar] [CrossRef] [Green Version]
- Yan, D.; Wang, W.; Chen, G.; Hartnagel, B.A. Condition assessment of bill emerson memorial cable-stayed bridge under postulated design earthquake. Transp. Res. Rec. 2010, 2172, 159–167. [Google Scholar] [CrossRef]
- Chen, G.; Yan, D.; Wang, W.; Zheng, M.; Ge, L.; Liu, F. Assessment of the Bill Emerson Memorial Cable-Stayed Bridge Based on Seismic Instrumentation Data; Missouri University of Science and Technology: Jefferson, MO, USA, 2007. [Google Scholar]
- Fernandez, L. Computationally Efficient Analysis, Optimization and Holistic Design of Vibrational Energy Harvesters at the Infrastructure Scale; Clarkson University: Potsdam, Germany, 2021. [Google Scholar]
- Roof Garden Systems. 2010. Available online: https://www.carlislesyntec.com/en/Roofing-Products/Specialty/Roof-Garden (accessed on 1 June 2021).
- ODS Outdoor Design Source. Available online: https://www.outdoordesign.com.au/news-info/innovative-spinning-bridge-design/3407.htm (accessed on 1 June 2021).
- Available online: https://www.flickr.com/photos/mtefft/27730943583 (accessed on 20 November 2021).
- Zhang, Z.; Xiang, H.; Shi, Z.; Zhan, J. Experimental investigation on piezoelectric energy harvesting from vehicle-bridge coupling vibration. Energy Convers. Manag. 2018, 163, 169–179. [Google Scholar] [CrossRef]
Figure 1.
Architecture of wireless sensor nodes [17].
Figure 1.
Architecture of wireless sensor nodes [17].

Figure 2.
Schematic bridge health monitoring representation [28].
Figure 2.
Schematic bridge health monitoring representation [28].

Figure 3.
Patternsearch optimization flowchart [30].
Figure 3.
Patternsearch optimization flowchart [30].

Figure 4.
Representation of finite element model of the cable-stayed bridge [31].
Figure 4.
Representation of finite element model of the cable-stayed bridge [31].

Figure 5.
Representation of original and interpolated El Centro earthquake record.

Figure 6.
Scaled input loading.

Figure 7.
Optimal configuration for eight harvesters with top and 3D views.

Figure 8.
(a) Eight-harvester displacement time histories with no damping with (b) zoom in for 12.5–15 s of (a).
Figure 8.
(a) Eight-harvester displacement time histories with no damping with (b) zoom in for 12.5–15 s of (a).

Figure 9.
Eight-harvester displacement frequency response functions with no damping.

Figure 10.
El Centro frequency content.

Figure 11.
Influence of non-optimized versus optimized harvester(s) properties in the power generation capabilities of 8 harvesters.
Figure 11.
Influence of non-optimized versus optimized harvester(s) properties in the power generation capabilities of 8 harvesters.

Figure 12.
Garden Bridge by Michael Tefft [38].
Figure 12.
Garden Bridge by Michael Tefft [38].

Figure 13.
Optimal configuration for eight harvesters, with top and 3D views, for green garden implementation.
Figure 13.
Optimal configuration for eight harvesters, with top and 3D views, for green garden implementation.

Figure 14.
Schematic representation of bridge deck top view with green garden connected on both sides of the outer deck between piers 2 and 3 with zoom in portion.
Figure 14.
Schematic representation of bridge deck top view with green garden connected on both sides of the outer deck between piers 2 and 3 with zoom in portion.

Figure 15.
Schematic representation of bridge deck cross-section with green gardens attached at both sides of the outer deck.
Figure 15.
Schematic representation of bridge deck cross-section with green gardens attached at both sides of the outer deck.

Figure 16.
Eight-harvester displacement frequency response functions for El Centro input and no damping for the distributed garden concept implementation.
Figure 16.
Eight-harvester displacement frequency response functions for El Centro input and no damping for the distributed garden concept implementation.

Figure 17.
(a) Eight-harvester displacement time histories with (b) zoom in for 2.2–4 s of (a) for El Centro input and no damping for the distributed garden concept implementation.
Figure 17.
(a) Eight-harvester displacement time histories with (b) zoom in for 2.2–4 s of (a) for El Centro input and no damping for the distributed garden concept implementation.


Table 1.
Harvester(s) configurations parameters for bridge model.
| Scenario 1 | Scenario 2 | |
|---|---|---|
| Number of harvesters | 2 | |
| Location | Symmetric joints | Symmetric joints |
| Mass of harvester | 259,938.835 kg | 519,877.67/ kg |
| Total harvester mass | 519,877.67 kg | 519,877.67 kg |
| Mass ratio | 0.01 | 0.01 |
| System DOFs | 421 |
Table 2.
Scaled harvester(s) electrical properties.
| Harvester Electrical Properties | (kg) | (N/A) | (H) | |
|---|---|---|---|---|
| Base harvester | 2.4 | 4118 | 452 | 0.04 |
| Scaled harvester | 4118 | 452 | 0.04 | |
| where / | ||||
Table 3.
Optimized frequencies for eight harvesters at different locations under El Centro input. The resulting optimal location and frequencies that maximizes power generation are shown in bold.
Table 3.
Optimized frequencies for eight harvesters at different locations under El Centro input. The resulting optimal location and frequencies that maximizes power generation are shown in bold.
| 8 Harvesters | |||||||
|---|---|---|---|---|---|---|---|
| Location | Frequencies [rad/s] | Power [kW] | Energy [W-h] | ||||
| 1 | (117 184 204 209 459 461 525 527) | 9.13 | 9.13 | 13.18 | 12.86 | 1253.1 | 348.10 |
| 9.17 | 9.17 | 9.17 | 9.17 | ||||
| 2 | (117 184 205 210 318 323 459 525) | 12.24 | 11.71 | 13.09 | 12.87 | 1368.6 | 380.16 |
| 13.47 | 13.47 | 9.21 | 9.21 | ||||
| 3 | (119 186 206 211 319 324 459 525) | 12.26 | 11.70 | 21.47 | 12.79 | 1442 | 400.57 |
| 13.39 | 13.39 | 9.20 | 9.20 | ||||
| 4 | (117 184 206 211 319 324 461 527) | 11.66 | 11.67 | 12.39 | 12.91 | 1623.8 | 451.05 |
| 13.46 | 13.46 | 9.20 | 9.20 | ||||
| 5 | (119 186 205 210 318 323 461 527) | 11.71 | 12.25 | 12.87 | 13.09 | 1370.2 | 380.61 |
| 13.47 | 13.47 | 9.20 | 9.20 | ||||
| 6 | (83 119 150 186 461 494 527 560) | 9.15 | 12.28 | 9.15 | 9.13 | 1564.2 | 434.50 |
| 9.15 | 9.12 | 9.15 | 9.13 | ||||
Table 4.
Optimized frequencies for eight harvesters at different locations under scaled input. The resulting optimal location and frequencies that maximizes power generation are shown in bold.
Table 4.
Optimized frequencies for eight harvesters at different locations under scaled input. The resulting optimal location and frequencies that maximizes power generation are shown in bold.
| 8 Harvesters | |||||||
|---|---|---|---|---|---|---|---|
| Location | Frequencies [rad/s] | Power [mW] | Energy [W-h] | ||||
| 1 | (117 184 204 209 459 461 525 527) | 9.13 | 9.13 | 13.18 | 12.86 | 4.135 | 1.149 |
| 9.17 | 9.17 | 9.17 | 9.17 | ||||
| 2 | (117 184 205 210 318 323 459 525) | 12.24 | 11.71 | 13.09 | 12.87 | 4.516 | 1.255 |
| 13.47 | 13.47 | 9.21 | 9.21 | ||||
| 3 | (119 186 206 211 319 324 459 525) | 12.26 | 11.70 | 21.47 | 12.79 | 4.759 | 1.322 |
| 13.39 | 13.39 | 9.20 | 9.20 | ||||
| 4 | (117 184 206 211 319 324 461 527) | 11.66 | 11.67 | 12.39 | 12.91 | 5.359 | 1.488 |
| 13.46 | 13.46 | 9.20 | 9.20 | ||||
| 5 | (119 186 205 210 318 323 461 527) | 11.71 | 12.25 | 12.87 | 13.09 | 4.522 | 1.256 |
| 13.47 | 13.47 | 9.20 | 9.20 | ||||
| 6 | (83 119 150 186 461 494 527 560) | 9.15 | 12.28 | 9.15 | 9.13 | 5.162 | 1.434 |
| 9.15 | 9.12 | 9.15 | 9.13 | ||||
Table 5.
Maximum bridge nominal (n), without harvesters, and modified (m), with harvesters, displacement and acceleration responses for all configurations.
Table 5.
Maximum bridge nominal (n), without harvesters, and modified (m), with harvesters, displacement and acceleration responses for all configurations.
| Cable-Stayed Bridge Model, El Centro Input | ||||||
|---|---|---|---|---|---|---|
| h | Joint | DOF | ||||
| 2 | 0.3703 | 0.3395 | 9 | 49 | 17.4 | 17.08 |
| 4 | 0.3383 | 17.03 | ||||
| 8 | 0.3544 | 16.99 | ||||
Table 6.
Comparison of required computational time for the cable-stayed bridge model.
| Number of Harvesters | Function Evaluations | Conventional Method (Projected) | Proposed Method (Actual) | Computational Speed Up |
|---|---|---|---|---|
| 2 | 239 | 10,870 s | 164 s | 66.3 |
| 4 | 903 | 54,687 s | 324 s | 168.8 |
| 8 | 3703 | 231,290 s | 684 s | 338.1 |
Table 7.
Components and specifications for the implementation of green garden at the cable-stayed bridge model.
Table 7.
Components and specifications for the implementation of green garden at the cable-stayed bridge model.
| System Components | Specifications | Weight | Total |
|---|---|---|---|
| Number of harvesters | 8 | ||
| Area of each h | |||
| Growth media depth | |||
| Volume of each h | |||
| Drainage Composite | roll | each | (44 rolls) |
| Protection Fabric | each | (6) | |
| Growth Media | Saturated Weight | ||
| Plants, Sedum Mats | each | (852) | |
| Total harvester mass | |||
Table 8.
Optimized eight-harvester frequencies with no damping for distributed garden concept implementation.
Table 8.
Optimized eight-harvester frequencies with no damping for distributed garden concept implementation.
| Optimized Frequencies in rad/s for the Cable-Stayed Bridge Garden Application | |||||||
|---|---|---|---|---|---|---|---|
| Load | Location | Frequencies [rad/s] | Power [W] | Energy [W-h] | |||
| El Centro | (466 474 482 490 532 540 548 556) | 9.14 | 9.14 | 9.14 | 12.25 | 1,574,902.46 | 437.47 |
| 9.14 | 9.14 | 9.14 | 9.14 | ||||
| Scaled | (466 474 482 490 532 540 548 556) | 9.14 | 9.14 | 9.14 | 12.25 | 0.0052 | 1.44 × 10⁻⁶ |
| 9.14 | 9.14 | 9.14 | 9.14 | ||||
Publisher’s Note: MDPI stays neutral with regard to jurisdictional claims in published maps and institutional affiliations. |
© 2022 by the authors. Licensee MDPI, Basel, Switzerland. This article is an open access article distributed under the terms and conditions of the Creative Commons Attribution (CC BY) license (https://creativecommons.org/licenses/by/4.0/).
Share and Cite
MDPI and ACS Style
Fernandez, L.; Wojtkiewicz, S.F. Multifunctional Design of Vibrational Energy Harvesters in a Bridge Structure. Sustainability 2022, 14, 16540. https://0-doi-org.brum.beds.ac.uk/10.3390/su142416540
AMA Style
Fernandez L, Wojtkiewicz SF. Multifunctional Design of Vibrational Energy Harvesters in a Bridge Structure. Sustainability. 2022; 14(24):16540. https://0-doi-org.brum.beds.ac.uk/10.3390/su142416540
Chicago/Turabian StyleFernandez, Lissette, and Steven F. Wojtkiewicz. 2022. "Multifunctional Design of Vibrational Energy Harvesters in a Bridge Structure" Sustainability 14, no. 24: 16540. https://0-doi-org.brum.beds.ac.uk/10.3390/su142416540
Note that from the first issue of 2016, this journal uses article numbers instead of page numbers. See further details here.