
A Novel Categorization of Key Predictive Factors Impacting Hotels’ Online Ratings: A Case of Makkah

Department of Management and Information Systems, College of Business Administration, University of Ha’il, P.O. Box 2440, Ha’il 81451, Saudi Arabia
*
Author to whom correspondence should be addressed.
Sustainability 2022, 14(24), 16588; https://0-doi-org.brum.beds.ac.uk/10.3390/su142416588
Submission received: 1 November 2022
/
Revised: 7 December 2022
/
Accepted: 9 December 2022
/
Published: 11 December 2022
(This article belongs to the Special Issue Contemporary Issues in Applied Economics and Sustainability)
Abstract
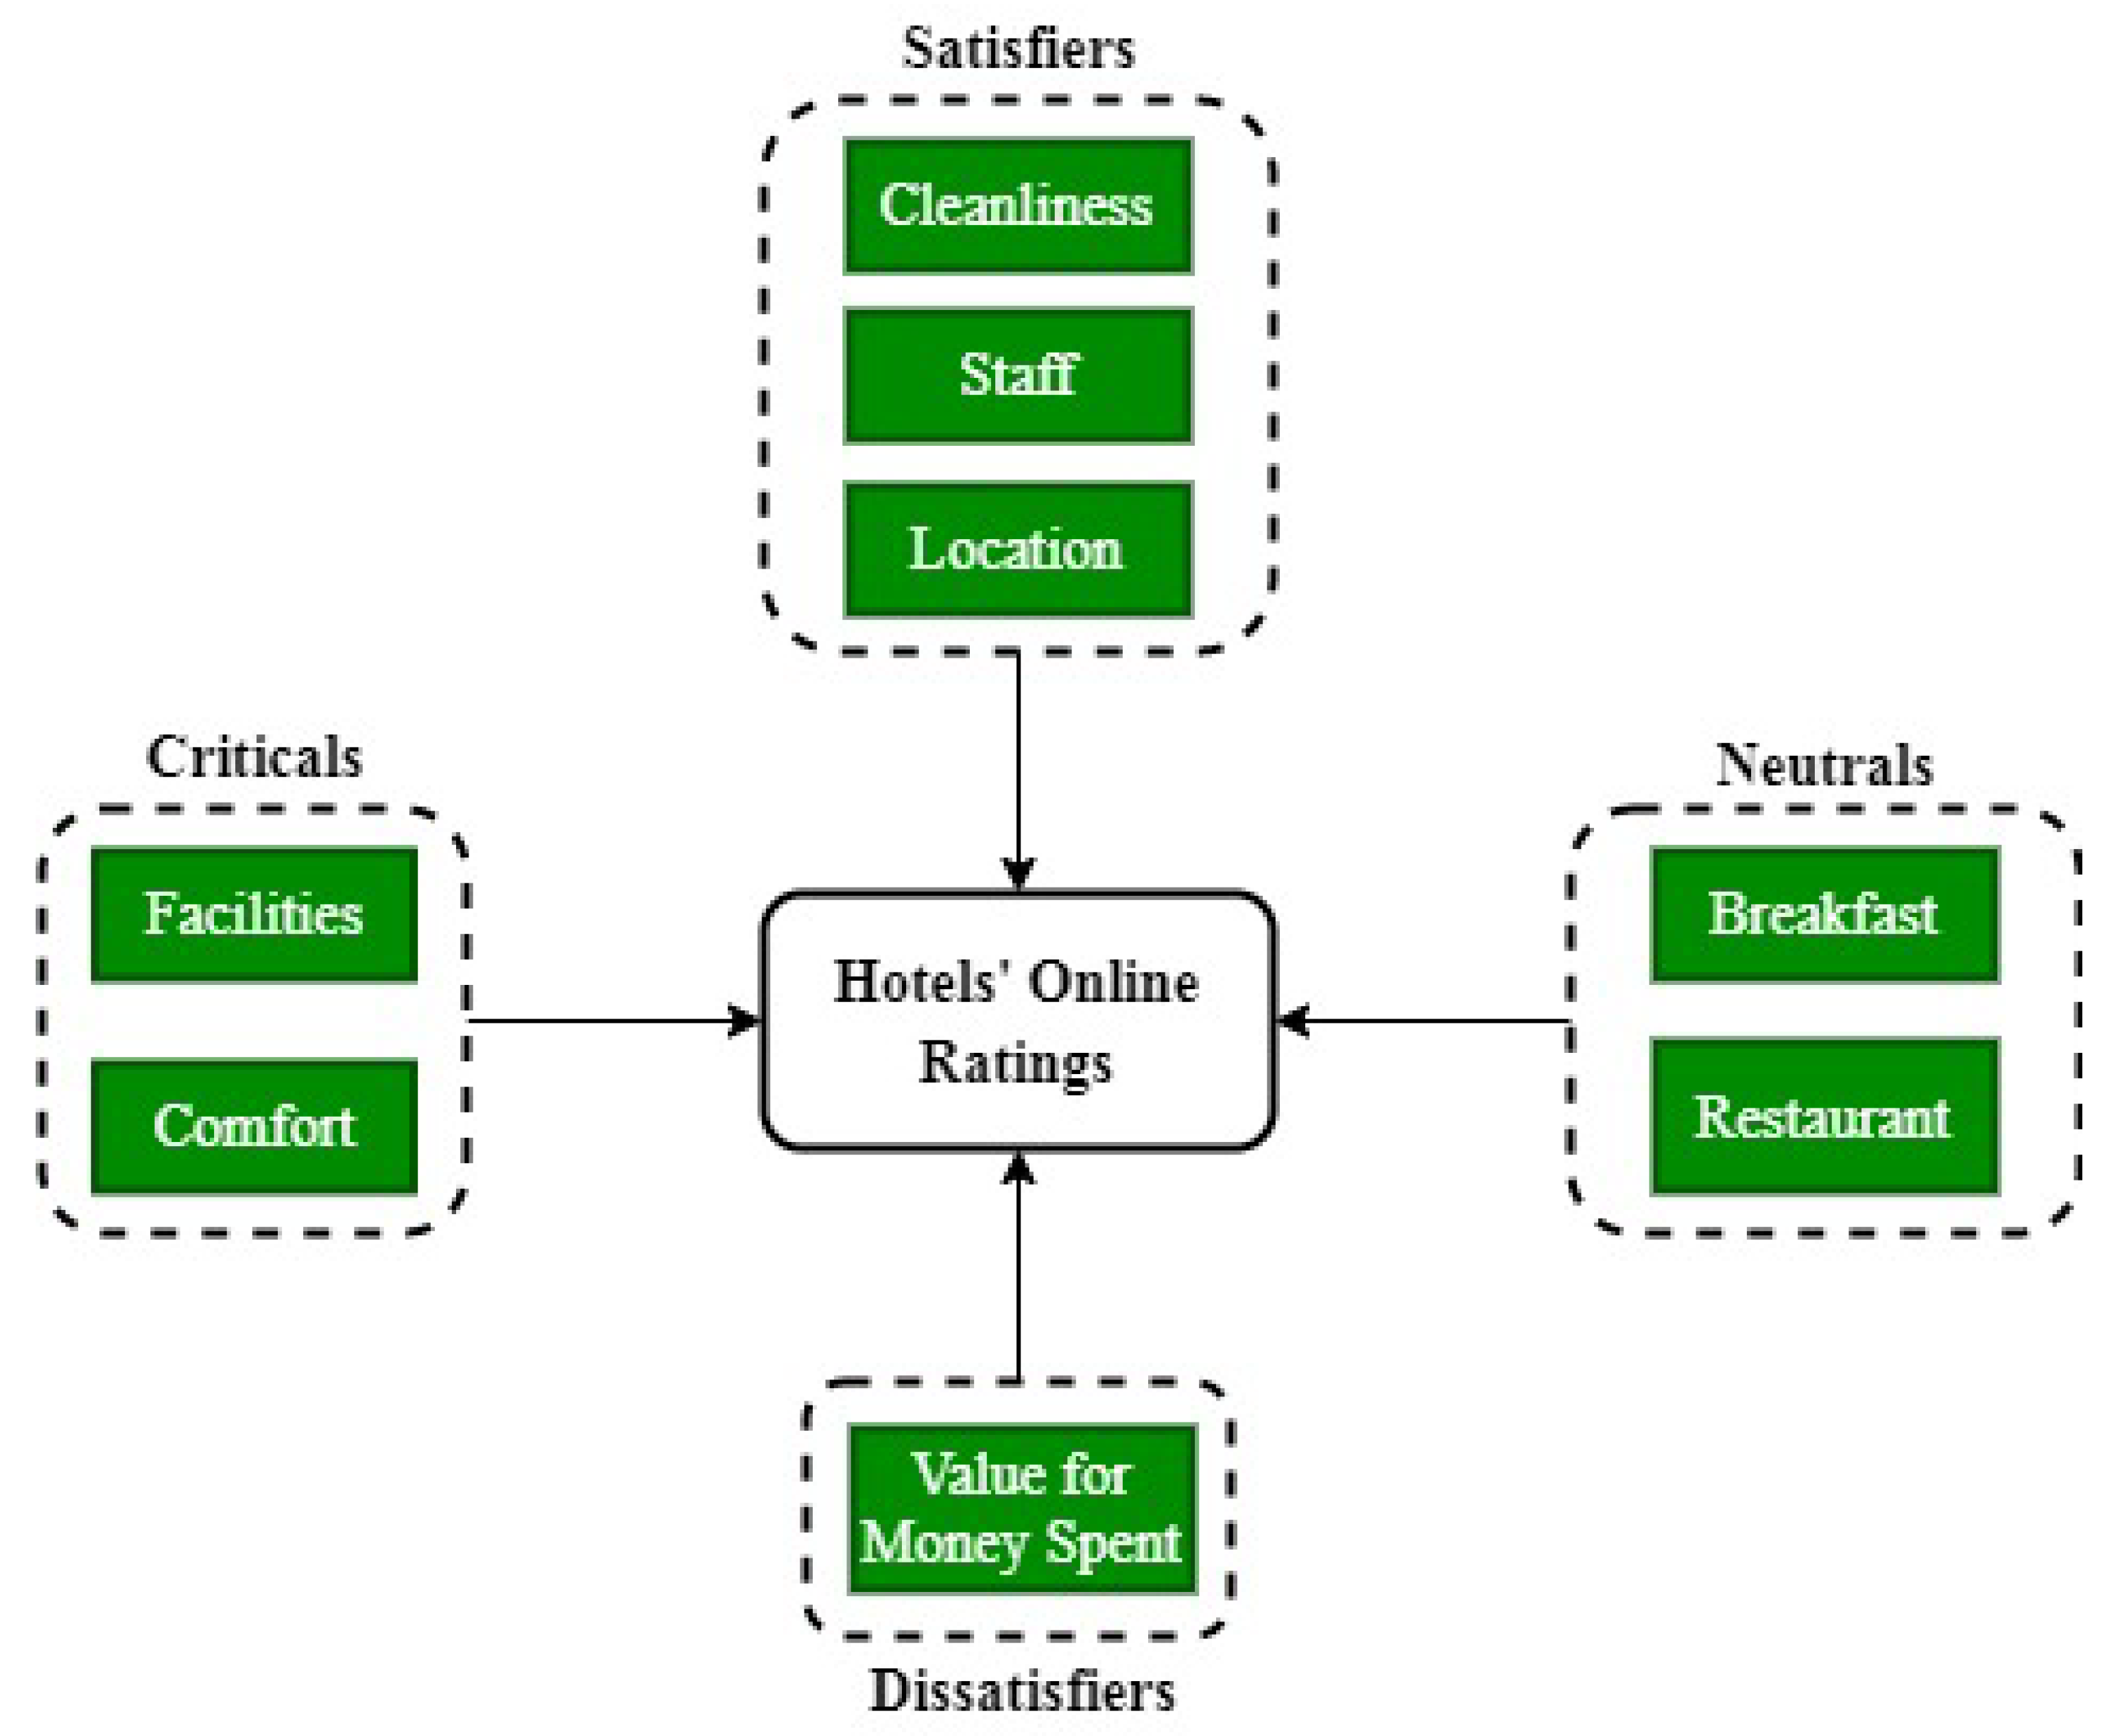
:In the present Internet age, customers have turned to online booking websites to meet their demand for quality hotel services and convey their experiences. As hotels can survive and succeed by satisfying consumers and obtaining high online ratings, this research predicts the key factors impacting these ratings. The study analyzes online consumer review data gleaned from the popular Booking.com website for hotel ratings near the key religious heritage site in Makkah, Saudi Arabia. The research applies the four-factor theory due to its importance in studying consumer satisfaction and prior non-application to the hospitality and tourism industry. This theory extended the two-factor theory to report four distinct sets of factors: satisfiers, dissatisfiers, criticals, and neutrals. Accordingly, the present research presents a novel categorization of key predictive factors and enriches the literature, which categorized factors as either satisfiers or dissatisfiers. Consequently, facilities and comfort are critical factors, while cleanliness, staff, and location are satisfiers; the value for the money spent is dissatisfier; the availability of breakfast and restaurants are neutral factors. The hospitality industry, specifically the hotel industry, can focus on characteristics of the four distinct sets of factors; various nations can leverage the findings to boost their hospitality and tourism sectors.
1. Introduction
Tourists use the Internet to gather information, form social bonds, develop identities, and share their experiences in the Web 2.0 era [1]. The Internet has transpired as a new venue for interpersonal encounters, which has led to online user-generated content (UGC) [2,3,4]. The travel booking websites support online UGC to propagate the electronic word of mouth (e-WOM), which is any positive or negative customer response to a company’s product or service [5]. E-WOM can spread more swiftly through the Internet than traditional word of mouth (WOM) [6].
In the hospitality and tourism context, online travel reviews are vital in propagating e-WOM [7,8]. Online reviews by tourists present a rich source of data, which aids in hospitality and tourism management [9,10]. Several researchers recognize the value of hotels’ online reviews in enhancing customer satisfaction [9,11,12]. Online reviews present rich insights to understand consumer behavior and meet their service expectations. They provide substantial amounts of inexpensive information [13] and are well-organized, diverse, and easily collected [14,15]. Therefore, they can give the managers better decision-making capability to improve customer satisfaction [16,17].
In recent years, online review websites have grown their market reach and influenced tourists’ purchasing decisions [18]. In this context, potential tourists often search for many different recommendations to decide which product or service to purchase, given many online alternatives [19]. Thus, online UGC can serve as a reliable and valuable information source for tourists and hotels. As a result, popular booking platforms such as Booking.com encourage online reviews to propagate E-WOM and attract tourists.
Globally, the hospitality and tourism sectors are important employment and revenue generators. Religious heritage sites are critical in driving international tourism. In particular, Saudi Arabia has the potential to exploit its tourism sector, specifically at Makkah, an important and sacred heritage site. Saudi Arabia aims to increase non-oil income under the Vision 2030 plan [20]. Religious tourism—including the Hajj and Umrah at Makkah—can dominate this endeavor, as most of Saudi Arabia’s tourists visit these sites while on pilgrimage [21]. In the coming decade, religious tourism in Saudi Arabia is expected to grow considerably; estimates suggest that Saudi Arabia will attract 30 million Hajj and Umrah pilgrims by 2030, an increase from 19 million pilgrims in 2017 [22]. This will cause vast improvements in the nation’s inventory of hotels and resorts and enhance competitive pressure among them, particularly at critical religious heritage sites [23]. Hotels in Saudi Arabia, in general, and Makkah, in particular, can endure and succeed if they satisfy their consumers and gain high online ratings on popular booking websites. This study’s findings will empower these hotels to attract tourists to religious heritage sites, such as Makkah, by revealing the critical factors impacting hotels’ online ratings through a data-mining approach.
Recent tourism and hospitality studies present the significance of online reviews in the tourism products, restaurants, and hotels context—suggesting their noteworthy impact on consumers’ visits and purchase intentions [24,25,26]. The consumers’ increasing dependence on online reviews for decision-making necessitates further research [27,28]. Prior research on the hospitality industry has identified key factors impacting hotels’ online ratings; however, there have been few attempts to categorize the factors. Categorizing the key factors impacting hotels’ online ratings could be very useful for developing theory and practical implications in this area of research. Some studies have categorized the factors impacting hotels’ online ratings as satisfiers or dissatisfiers using Herzberg et al.’s [29] two-factor theory. However, the two-factor theory was modified and extended over a period; noticeable works include the theories of Kano et al. [30], Matzler and Hinterhuber [31], Lee et al. [32], and Cadotte and Turgeon [33]. Among these modified and extended theories, Cadotte and Turgeon’s [33] four-factor theory has made the most noticeable contribution to advancing the study of consumer satisfaction. It reports four distinct sets of factors influencing consumer satisfaction and dissatisfaction: satisfiers, dissatisfiers, criticals, and neutrals. However, the research application of the four-factor theory to categorize the key factors impacting online review ratings of hotels lags—further signifying the need for this research. The current study is also necessary because extant research investigated and categorized the key factors impacting hotels’ online ratings into groups of satisfiers and dissatisfiers using surveys and interviews. In contrast, the vast wealth of online reviews remains unutilized to categorize the factors. The current study is unique as it utilizes a data mining approach to categorize the key predictive factors impacting hotels’ online ratings. Prediction allows induction on the data to forecast trends [34]. The current study is also unique as it takes the religious heritage site of Makkah, whereas most of the prior research has focused on commercial cities. The findings of the research on commercial cities might have limited generalization in case of religious cities, such as Makkah. Therefore, the current research can shed light on the differences in the hotel stay motivations of customers in religious destinations.
The current study aims to:
- Investigate the extant literature’s categorization of critical factors influencing hotels’ online review ratings using the two-factor theory
- Leverage the four-factor theory in conjunction with the data-mining rule-based approach to build a conceptual model depicting the categorization of key factors influencing hotels’ online ratings; and
- Suggest strategies to enhance hotels’ online ratings and improve customer satisfaction, especially at religious destinations such as Makkah.
The remainder of the study is structured as follows: Section 2 discusses the review of literature and theories. It presents the significance of online consumer review ratings for hotels and the factors impacting hotels’ online ratings. The authors also lay down the theoretical background for the study in Section 2 and report the existing literature’s categorization of the factors influencing hotels’ online ratings based on the two-factor theory. The research methodology for the study is presented in Section 3. Section 4 reveals the modeling and evaluation of the study, viz., experimentation, attributes evaluation, rules extraction and selection mechanism, categorization of factors based on selected rules, and model of factors impacting hotels’ online ratings based on study results. Section 5 discusses the study results in light of the existing literature and theoretical background. Section 6 concludes the research and presents its implications. Finally, Section 7 presents the current study’s limitations and scope for further research.
2. Review of Literature and Theories
Consumer satisfaction is critical in establishing a competitive advantage [23,35]. Customer satisfaction leads to loyalty and positive WOM and contributes to sales growth [36,37]. In contrast, dissatisfied customers exhibit low brand loyalty, give negative WOM, and can even boycott the product category, brand, or distribution chain [38].
In their endeavor to identify antecedents to customer satisfaction and dissatisfaction, various researchers employed the expectations confirmation theory (ECT) [39,40,41,42,43]. According to ECT, a consumer is satisfied if the perceived performance meets or exceeds expectations; otherwise, the consumer is dissatisfied [40]. In the hotel industry, consumers evaluate their satisfaction on the basis of their opinions of the hotel attributes they regard as the most significant [44].
2.1. Factors Impacting Hotels’ Online Ratings
Prior research has reported specific predictors of consumer satisfaction in online reviews of hotels. For example, online reviews prime the comfort attribute and improve the customers’ attitude towards the comfort level of hotels [13,24]. Li et al. [13] analyzed 42,668 online consumer reviews covering 774 hotels having star ratings to reveal that their facilities, comfort, transport, food, and the ratio of the value obtained to money spent were imperative factors for customers of both luxury and budget hotels.
Shanka and Taylor [45] studied 3-star hotels in Perth city of Western Australia to report that lower service efficiency hampers customer satisfaction. Hua et al. [46] studied Chinese budget hotels to reveal that their service quality, comfort, value for money spent, promotion, and location influenced customers’ purchase decisions. Au et al. [47], in their study of hotels in mainland China’s major cities, used data from TripAdvisor’s website and CTrip.com to report that service quality, location, cleanliness, food, and the value for money spent were critical to customers’ satisfaction. Kim et al. [48], in their study, used online reviews from TripAdvisor of 100 New York city hotels to reveal that the staff’s attitude, facilities, and cleanliness were significant factors.
O’Connor et al. [49] examined E-WOM comments from TripAdvisor to report that room size, food, staff, locality, bathroom, shower, and bed were significant factors for reviewers. According to Albayrak and Caber’s [50] study on multinational tour operators’, essential factors for customers’ satisfaction were the availability of breakfast, food service, and wellness services. Buhalis and Foerste [51] and Neirotti et al. [52] considered the quality of breakfast and the hotel’s location as crucial factors.
Raguseo and Vitari’s [18] study of 221 French hotels using 34,164 online customer reviews from TripAdvisor reported that staff, comfort, cleanliness, facilities, and the value for money spent were vital dimensions of hotel quality. Similarly, Phillips et al.’s [53] study of 442 Swiss hotels used customer review data from 68 online platforms to inform that the hotel’s room cleanliness, value for money spent, location, and staff were important to customers.
Öğüta and Cezara’s [54] study, which examined online reviews from Booking.com regarding hotels in Paris, reported that the hotel’s staff, comfort, cleanliness, facilities, value for money spent, and location were essential for customers’ satisfaction. Becerra et al. [55] examined the influence of horizontal and vertical differentiation on price policy in Spanish hotels to observe that the location, value for the money spent, staff, and cleanliness determined customers’ hotel choices. Liu et al. [56], in their study, which used 412,784 online reviews from TripAdvisor for 10,149 hotels in 5 cities in China, noted room quality, the value for money spent, cleanliness, service, and locality were significant determinants of guests’ preferences. Furthermore, Chang et al. [57], in their study using TripAdvisor’s customer reviews of Hilton hotels in the USA, considered social media analytics to demonstrate that cleanliness, location, room service, and sleep quality determine online review ratings.
Bulchand-Gidumal et al.’s [58] research in Europe suggests that free Wi-Fi improved hotel ratings by up to eight percent and recommended providing it to clients.
Alhamad and Singh [59] conducted a study using Booking.com data from the 172 hotels in Makkah city to identify significant and trivial factors that influence online review ratings. They employed regression analysis to report significant and trivial factors. The results of the regression analysis revealed that facilities (p-Value 0.01, coefficient 0.48), comfort (p-Value 0.01, coefficient 0.38), cleanliness (p-Value 0.01, coefficient 0.34), staff (p-Value 0.02, coefficient 0.31), and location (p-Value 0.04, coefficient 0.23) were significant factors. In contrast, the value for money (p-Value 0.06, coefficient 0.18), breakfast (p-Value 0.88, coefficient 0.01), and free Wi-Fi (p-Value 0.46, coefficient −0.03) were trivial factors.
Hillard et al. [60] revealed the hospitality and tourism industry’s lack of preparedness to manage crisis situations. This is mainly due to a lack of knowledge and experience in managing resources [61,62]. During the COVID-19 pandemic, the length and severity of the crisis situation in the tourism and hospitality industry worsened. As a result, hotels took revenue protection measures during COVID-19 that are relevant to the current study attributes by, for example, making their facilities COVID-19-free, ensuring cleanliness and disinfection, instituting health and safety protocols for staff, and providing staff with education and training to manage COVID-19 [63]. Prior studies have shown that investing in staff education and training increased their organizational commitment and job satisfaction, both of which are crucial to the growth of the hospitality and tourism sector [64,65,66]. Staff satisfaction and well-being could also influence other hotel attributes such as facilities, comfort, cleanliness, etc. [65,66].
Prior research conducted in various countries and contexts revealed that breakfast [50,51,52], comfort [13,46,54], cleanliness [18,47,48,54,56], facilities [13,18,48,54], locality [46,47,49,51,52,53], staff attitude [18,48,49,54,55], value for the money spent [13,18,46,47,53,54,55,56], and complementary Wi-Fi [58] could impact online review ratings of hotels. Some of these factors play an important role in managing crisis situations, such as COVID-19 [63]. Furthermore, online hotel review ratings have a significant impact on the online booking decisions of customers [16,17,27,28,46]. Thus, it can be concluded that online ratings of factors such as breakfast, comfort, cleanliness, facilities, locality, staff attitude, value for money spent, and free Wi-Fi could influence customers’ hotel reservation decisions. Therefore, the factors that can impact hotels’ online ratings in this study include the hotel’s breakfast availability, comfort, cleanliness, facilities, locality, the attitude of staff, value for the money spent, and the availability of free Wi-Fi.
2.2. Review of Theories to Categorize Factors Impacting Hotels’ Online Ratings
According to Herzberg et al.’s [29] two-factor theory, satisfiers and dissatisfiers are mutually exclusive and affect job satisfaction and performance. Satisfiers encourage employees to work harder and lead to job satisfaction. While dissatisfiers do not directly contribute to satisfaction, their absence causes dissatisfaction. In his study, Soliman [67] identified satisfiers and dissatisfiers as consumers’ higher- and lower-order needs, respectively. Swan and Combs [68] found support for the two-factor theory in the clothing industry. Maddox [69] found support for the two-factor theory in the durable product market. Babin and Griffin [70] found support for the two-factor theory in the service industry in Malaysia. Zhang and Dran [71] supported Herzberg et al.’s [29] two-factor theory with proof from the website design field. Levy et al. [72] and Li et al. [13] examined customer satisfaction and dissatisfaction using the two-factor theory. Singh and Alhamad [73] examined consumer satisfaction and dissatisfaction in the hotel industry using the two-factor theory. It is noteworthy that the two-factor theory has been improved and expanded over time.
Kano et al.’s [30] customer satisfaction model stated that five factors influenced customer satisfaction: must-be, one-dimensional, attractive, indifferent, and reverse quality requirements. Must-be factors are basic requirements—their fulfillment is taken for granted, whereas non-fulfillment causes customer dissatisfaction. The organization’s competitive survival depends on the achievement of the must-be factors. Customers typically seek one-dimensional factors. The fulfillment and non-fulfillment of one-dimensional factors cause proportionate customer satisfaction and dissatisfaction, respectively. Attractive factors have the greatest influence on customer satisfaction. The fulfillment of attractive factors increases customer satisfaction, whereas their non-fulfillment is acceptable. However, customers do not typically seek attractive factors. The realization or non-realization of indifferent factors does not affect customer satisfaction or dissatisfaction. The fulfillment and non-fulfillment of reverse quality factors lead to customer dissatisfaction and satisfaction, respectively. Matzler and Hinterhuber [31] showed the applicability of the Kano et al.’s [30] model to quality function disposition. According to Lee et al. [32], factors such as delighters, satisfiers, hybrids, dissatisfiers, and frustrators influence job satisfaction. Satisfiers and dissatisfiers resemble those of the two-factor theory. Delighters and frustrators are high level of satisfiers and dissatisfiers, respectively. Hybrids result in job satisfaction if they are met, but job discontent if they are not.
Cadotte and Turgeon [33] extended the two-factor theory to report four sets of factors: satisfiers, dissatisfiers, criticals, and neutrals. While satisfiers increase satisfaction, their absence does not increase dissatisfaction. Further, dissatisfiers do not increase satisfaction, but their absence increases dissatisfaction. Satisfiers meet individuals’ intrinsic needs, and dissatisfiers meet their extrinsic needs. Critical factors affect both satisfaction and dissatisfaction as well as negative evaluations, specifically, whether they are present or absent. In contrast, neutral factors do not affect satisfaction or dissatisfaction. Johnston [74] examined a variety of service industries to lend support to the four-factor theory, which was confirmed by Vargo et al. [75], Oliver [76], Silverman and Grover [77], and Chu and Choi [78].
From the above-reviewed theories, we preferred the four-factor theory as it has advanced the two-factor theory due to the following reasons:
- The four-factor theory is more applicable to customer satisfaction than Lee et al.’s [32] theory, which is more relevant to job satisfaction.
However, to the best of our knowledge, the four-factor theory has not been used to categorize the key factors impacting online review ratings of hotels. Therefore, we selected the four-factor theory due to its scope and lack of prior application to categorize the key factors impacting online review ratings of hotels.
2.3. Categorization of Factors in Literature
Several researchers categorized hotel consumer satisfaction factors into groups of satisfiers and dissatisfiers using the two-factor theory. Table 1 presents the extant literature’s categorization of key factors influencing hotels’ online review ratings and any conflicts.
3. Research Methodology
This research employs the methodology prescribed by Cios et al. [88], as it is one of the most established data-mining methods. Its processes are as follows:
- Understanding the problem—In this stage, authors extensively reviewed the literature from various sources, such as books, journals, and the Internet, among others. This extensive review revealed that breakfast, cleanliness, comfort, facilities, locale, staff, value for money, and complimentary Wi-Fi play a role in determining customer satisfaction. In most published works, the two-factor theory has been used to categorize these factors as either satisfiers or dissatisfiers. However, identifying these elements as either satisfiers or dissatisfiers in the literature remains contested (Table 1). Nonetheless, these factors may significantly impact the overall online review ratings of hotels.
- Understanding the data—Data for aggregate numerical rating were recorded in MS Excel from Booking.com, as it is considered more reliable than other websites, such as TripAdvisor. For example, users can only post reviews on Booking.com after their reservation is booked and paid; this avoids fake reviews [89]. This work also used Booking.com to study online rating criteria with ten non-class attributes such as name of the hotel (HN), facilities (FS), breakfast availability (BF), comfort (CM), cleanliness (CN), staff (SF), location (LC), the value for money spent (VS), availability of restaurant (RE), and free Wi-Fi (FF). In addition, the review class (RC) is considered the class attribute. Customers rated these attributes numerically on a scale of 1 to 10. We collected the data spanning the check-in date of 8 May 2019, to the check-out date of 9 May 2019, with 172 hotels available in the selected date range.
- Preparing the data—This stage involved data preparation to control its quality. The authors followed Han et al.’s [90] guidelines and examined the data for inconsistency, completeness, missing values, redundancy, noise, and outliers. The names of hotels’ were disregarded, as these were not suitable attribute(s) for data mining. The remaining nine attributes were discretized in Microsoft Excel as per the formulae adopted by Booking.com, as displayed in the ensuing Table 2.
The missing values in the data are represented by a discretized score of 7. Table 3 displays the summary count of discretized scores by attributes prepared for data mining.
- Mining the data—This stage involved the construction of a classification model that predicts hotel attributes’ impacts on hotels’ online ratings. The experiments included rule-based and tree-based classifiers. The best-performing classifier was then used for rule extraction.
- Evaluating the discovered knowledge—The extracted rules represent hidden knowledge. The researchers selected the rules that exhibit both adequate coverage and high accuracy.
- Using the discovered knowledge—The researchers considered the selected rules in constructing the final model and drawing pertinent conclusions and recommendations.
4. Modeling and Evaluation
The model was built by entering the data into the Weka software suite, version 3.9.5. The dataset had nine non-class attributes, one class attribute, and 172 records. We balanced the dataset following Han et al.’s [90] recommendations to improve the classification results. Accordingly, the dataset was balanced based on the “review score” class attribute using Weka’s ClassBalancer filter.
4.1. Classification Experiments
The accuracy, error rate, and performance of various rule- and tree-based classifiers available in the Weka software are summarized in Table 4, Table 5 and Table 6. The accuracy of the classifier is determined by the percentage of correctly classified instances (CCI%), recall, precision, and F-measure. The error rate is determined by the incorrectly classified instances percentage (ICI%), the mean absolute error (MAE), the root-mean-squared error (RMSE), the relative-absolute error (RAE), and the root relative-squared error (RRSE). The performance is determined by the kappa statistic, Matthews correlation coefficient (MCC), precision-recall (PRC) area, and receiver-operating-characteristic (ROC) area. These assessment parameters were also used in recent research [87,90,91].
Table 4 exhibits that the J48 classifier without pruning achieves better classification accuracy than other classifiers for the percentage of correctly classified instances (99.071%), precision (0.993), recall (0.991), and F-measure (0.992). Table 5 portrays that the J48 classifier without pruning has a lower error rate than other classifiers in terms of the percentage of incorrectly classified instances (0.929%), MAE (0.011), RMSE (0.108), RAE (4.054%), and RRSE (24.415%). Table 6 shows that the J48 classifier without pruning achieves better classification performance than other classifiers in terms of kappa (0.988), MCC (0.988), ROC area (0.996), and PRC area (0.982). Overall, Table 4, Table 5 and Table 6 demonstrate that the J48 classifier without pruning achieves superior classification accuracy and performance and a lower error rate than other classifiers.
4.2. Evaluation of Attributes
The attributes were evaluated using Weka’s Ranker search method’s information gain (IG) and gain ratio evaluators. Table 7 presents the evaluation results.
Table 7 depicts that both information gain and gain ratio evaluators assign a rank to the attributes from 1 to 9 in this order: facilities (first), comfort (second), cleanliness (third), staff (fourth), location (fifth), value for money (sixth), breakfast (seventh), restaurant (eighth), and free Wi-Fi (ninth).
4.3. Rules Extraction and Selection
Table 4, Table 5 and Table 6 depict that the J48 unpruned classifier performs better than other classifiers. Thus, the J48 unpruned classifier is ideal for the rule extraction process. The J48 un-pruned tree contains 48 leaves with a size of 57 and 25 meaningful rules extracted. This study does not consider the rules portraying coverage of less than 1.5% of total instances and accuracy of less than 80% of all class instances; rather, 19 rules were selected based on their coverage and accuracy, which are detailed in Table 8.
Table 8 depicts the following information about the rules:
- Rule 1 covers 28.67 of the 172 total instances and gives correct results for each of them. Thus, it covers 16.7% of all instances and is 100% accurate in class instances.
- Rule 2 covers 21.5 of the 172 total instances and gives correct results for each of them. Thus, it covers 12.5% of all instances and is 100% accurate in class instances.
- Rule 3 covers 3.37 of the 172 total instances and gives correct results for each of them. Thus, this rule covers 2% of all instances and is 100% accurate in class instances.
- Rule 4 covers 3.58 of the 172 total instances and gives correct results for each of them. Thus, it covers 2.1% of total instances and is 100% accurate in class instances.
- Rule 5 covers 3.58 of the 172 total instances and gives correct results for each of them. Thus, this rule covers 2.1% of total instances and is 100% accurate in class instances.
- Rule 6 covers 7.22 of the 172 total instances. Since it provides incorrect results for only 0.48 of all instances, it covers 4.2% of all instances with an accuracy of 93.4% in class instances.
- Rule 7 covers 3.85 of the 172 total instances. As it provides incorrect results for only 0.48 of all instances, it covers 2.2% of all instances with an accuracy of 87.5% in class instances.
- Rule 8 covers 3.82 of the 172 total instances and gives correct results for each of them. This rule exhibits a coverage of 2.2% of total instances, with 100% accuracy in class instances.
- Rule 9 covers 3.82 of the 172 total instances and gives correct results for each of them. Thus, it exhibits a 2.2% coverage of total instances and is 100% accurate in class instances.
- Rule 10 covers 3.37 of the 172 total instances and gives correct results for each of them. Thus, this rule exhibits a 2% coverage of all instances, with 100% accuracy in class instances.
- Rule 11 covers 5.06 of the 172 total instances and gives correct results for each of them. Thus, this rule covers 2.9% of total instances and is 100% accurate in class instances.
- Rule 12 covers 4 of the 172 total instances. Since it provides incorrect results for only 0.48 of all instances, therefore, this rule exhibits a coverage of 2.3% of total instances, with 88% accuracy in class instances.
- Rule 13 covers 43.6 of the 172 total instances. Since it gives incorrect results for only 1.69 of all instances, it covers 25.3% of total instances and is 96.1% accurate in class instances.
- Rule 14 covers 13.48 of the 172 total instances, with an incorrect result for only 1.06 instances. Thus, it covers 7.8% of all instances, with 92.1% accuracy in class instances.
- Rule 15 covers 2.74 of the 172 total instances, with an incorrect result for only 0.35 instances and the correct result for 2.39 instances. Thus, it covers 1.6% of total instances with an accuracy of 87.2% in class instances.
- Rule 16 covers 2.6 instances of the 172 total instances. It gives an incorrect result for only 0.48 instances and the correct result for 2.12 instances. Thus, it exhibits a coverage of 1.5% of total instances and an accuracy of 81.5% in class instances.
- Rule 17 covers 19.11 out of the 172 total instances and gives correct results for each of them. Thus, this rule exhibits a coverage of 11.1% of the total instances and displays 100% accuracy in class instances.
- Rule 18 covers 5.31 instances out of 172 total instances and gives correct results for each of them. Thus, this rule exhibits a coverage of 3.1% of the total instances and displays 100% accuracy in class instances.
- Rule 19 covers 29.02 of the 172 total instances. It gives an incorrect result for only 0.35 instances and the correct result for 28.67 instances. Thus, this rule exhibits a coverage of 16.9% of all instances, with 98.8% accuracy in class instances.
Where R stands for rule, FS stands for facilities, CN stands for cleanliness, CM stands for comfort, SF stands for staff, LC stands for location, VS stands for the value for money spent, BF stands for breakfast, RE stands for restaurant, RC stands for review class, CO% stands for percentage of coverage, AC% stands for percentage of accuracy, W stands for wonderful online ratings, E stands for excellent online ratings, V stands for very good online ratings, G stands for good online ratings, K stands for okay online ratings, P stands for poor online ratings, and A stands for absence of online ratings.
Table 9 presents a quick summary of the selected 19 rules. These rules are then used in conjunction with the four-factor theory to derive the factors that impact hotels’ online ratings (Section 4.5). Furthermore, Figure A1 presents all 48 rules using a J48 unpruned decision tree. The discretized scores in Figure A1 correspond to their descriptions given in Table 2. We built an elegant J48 unpruned decision tree using the Graphviz software (v. 2.38) and the DOT graph description language (GDL), as noted in Figure A1.
4.4. Categorization of Factors Based on Rules
This research used the four-factor theory to categorize its factors into satisfiers, dissatisfiers, criticals, and neutrals. We considered the previously mentioned 19 rules and their presentation in Table 9 to categorize the factors based on the rules as follows:
- Facilities—If the facilities are wonderful or excellent, then the review score is wonderful or excellent (Rules 1 and 2). If the facilities and their comfort are poor, then the review score is poor (Rule 19). Furthermore, the facilities’ attributes are available in all the rules (Rules 1 to 19). Thus, “good” facilities increase customers’ satisfaction, while their absence or insufficiency decreases satisfaction. The evaluation of these attributes also assigns the first-place rank to their facilities (Table 7). Thus, we categorize facilities as a critical factor.
- Comfort—If the facilities and cleanliness are satisfactory, and their comfort and staff are good, then the review score is good (Rule 15). If the facilities and their comfort are satisfactory, then the review score is as well (Rule 18). If the facilities and their comfort are poor, then the review score is poor (Rule 19). Thus, “good” comfort increases customers’ satisfaction, while its absence decreases their satisfaction. The evaluation of attributes also assigns a second-place rank to comfort (Table 7), so comfort is categorized as a critical factor.
- Cleanliness—If the facilities are satisfactory and cleanliness is good, then the review score is good (Rule 14). If the facilities and their cleanliness and comfort are satisfactory, then the review score is as well (Rule 17). If the facilities and their cleanliness, comfort, and staff are satisfactory, then the review score is also satisfactory (Rule 16). Thus, cleanliness increases—or at least positively impacts—customers’ satisfaction. The evaluation of attributes assigns a third-place rank to cleanliness (Table 7), so cleanliness is considered a satisfier.
- Staff—If the facilities and their cleanliness are satisfactory but their comfort and staff are good, then the review score is good (Rule 15). If the facilities and their cleanliness, comfort, and staff are satisfactory, then the review score is as well (Rule 16). Thus, staff increases—or at least positively impacts—customers’ satisfaction. As the evaluation of attributes also assigns a fourth-place rank to the staff factor (Table 7), then the staff is categorized as a satisfier.
- Location—If the facilities are very good, and the location is wonderful, then the review score is very good (Rule 3). If the facilities are very good, and the location is excellent, then the review score is excellent (Rule 4). If the facilities are very good, and the location is very good, then the review score is also excellent (Rule 5). If the facilities are very good, and the location is good, then the review score is very good (Rule 6). Thus, the location increases—or at least positively impacts—customers’ satisfaction. As the evaluation of attributes also assigns a fifth-place rank to the location (Table 7), this is categorized as a satisfier.
- Value for Money—If the facilities are good and the value for money spent is excellent, then the review score is good (Rule 12). If the facilities are good and the value for money spent is very good, then the review score is good (Rule 13). Thus, the presence of “excellent” or “very good” responses for the value for money spent does not increase the review score. As the evaluation of attributes also assigns a sixth-place rank to the value for money spent (Table 7), the value for money spent is categorized as a dissatisfier.
- Breakfast—If the facilities are good, the value for money spent is wonderful, and the breakfast is poor, then the review score is very good (Rule 10). If the facilities are good, the value for the money spent is wonderful, and the breakfast is absent, then the review score is very good (Rule 11). Thus, a poor or unavailable breakfast has little or no effect on the review score. As the evaluation of attributes also assigns a seventh-place rank to breakfast (Table 7), breakfast is categorized as a neutral factor.
- Restaurant—If the facilities are good and the restaurant is wonderful, then the review score is very good (Rule 7). If the facilities are good, and the restaurant is good, then the review score is good (Rule 8). If the facilities are good, and the restaurant is okay, then the review score is good (Rule 9). If the facilities are good, the value for money spent is excellent, and there is no restaurant, then the review score is good (Rule 12). If the facilities are good, the value for the money spent is very good, and there is no restaurant, then the review score is good (Rule 13). Thus, the presence or absence of a restaurant has little to no effect on the review score. As the evaluation of attributes also assigns an eighth-place rank to the restaurant factor (Table 7), the restaurant is categorized as a neutral factor.
4.5. Novel Model of Key Factors Impacting Online Ratings of Hotels
Based on the categorization in Section 4.4, we constructed a novel model that depicts the factors impacting hotels’ online ratings, as illustrated in Figure 1. This novel model categorizes key factors impacting hotels’ online ratings under each dimension of the four-factor theory.
5. Discussion
This research predicts various factors—including the facilities and their comfort, sanitation, staff, locale, the value for money spent, and the availability of breakfast or restaurant—that impact hotels’ online ratings. The research findings parallel those in previous research [13,18,24,45,46,47,48,49,51,52,53,54,55,56,57].
The existing literature has observed various conflicts in categorizing factors as either satisfiers or dissatisfiers [79,80,82,83,84,85,86]. This research enriches the literature, as presented in Table 1, with facilities classified as a critical factor instead of a satisfier or dissatisfier earlier [79,82,83,84,85,86]. This result is in line with Alhamad and Singh’s [59] regression analysis which revealed that hotel facilities have the highest impact on the overall online review ratings (p-Value 0.01, coefficient 0.48). While comfort has been previously categorized as a satisfier [79,81], the current work considers this a critical factor. This result is in line with Alhamad and Singh’s [59] regression analysis, which revealed that comfort has the second highest impact on the overall online review ratings (p-Value 0.01, coefficient 0.38). Applying the four-factor theory to these critical factors suggests that the presence or absence of hotels’ facilities and comfort affects both satisfaction and dissatisfaction as well as negative evaluations of consumers [33].
Conflicts exist in the literature’s categorization of cleanliness [79,80], staff [79,82,83,84,85], and location [79,80,82,85], which this research resolves to classify them as satisfiers. This result is in line with Alhamad and Singh’s [59] regression analysis which revealed that cleanliness (p-Value 0.01, coefficient 0.38), staff (p-Value 0.02, coefficient 0.31) and location (p-Value 0.04, coefficient 0.23) have a significant impact on the overall online review ratings. Application of the four-factor theory to these satisfiers indicates that hotels’ cleanliness, staff, and location meet consumers’ intrinsic needs; their presence increases consumer satisfaction; however, absence does not increase dissatisfaction [33].
The literature also states that the value for money spent influences hotels’ online ratings [13,18,46,47,54,55,56]. The authors agree with this aspect of the literature to some extent, as it appears that while the value for money spent is necessary, it is not the primary motivation for tourists visiting a religious destination such as Makkah. This shows a critical difference in the point of view of customers visiting religious destinations compared to commercial destinations. Furthermore, this work contributes to the literature [82,84,86] (Table 1) and categorizes the value for money spent as a dissatisfier. This result is in line with Alhamad and Singh’s [59] regression analysis, which revealed that value for money has a trivial impact on the overall online review ratings (p-Value 0.06, coefficient 0.18). Administration of the four-factor theory to this dissatisfier suggests that the value for money spent meets consumers’ extrinsic needs; its presence does not increase satisfaction; however, absence increases dissatisfaction [33].
The literature finds that the availability of breakfast influences hotels’ online ratings [49,50,52]. However, this research finds that breakfast has little or no importance in a religious destination such as Makkah. Furthermore, we categorize breakfast as a neutral factor and contribute to the literature [79,80] (Table 1) in the context of religious destinations. This result is in line with Alhamad and Singh’s [59] regression analysis, which revealed that breakfast has a trivial impact on the overall online review ratings (p-Value 0.88, coefficient 0.01). The authors could not find any research to demonstrate that hotels’ restaurant facilities significantly influence their online ratings. Moreover, the restaurant has little or no importance in this research; therefore, this is categorized as a neutral factor. Utilization of the four-factor theory to these neutral factors suggests that the presence or absence of breakfast and a restaurant do not affect consumer satisfaction or dissatisfaction [33].
This research also finds that free Wi-Fi is the least important attribute (Table 7). Furthermore, the unpruned J48 tree does not generate any rule that relates to free Wi-Fi. Consequently, this research differs from the work of Bulchand-Gidumal et al. [58] in that the former does not consider free Wi-Fi important in influencing hotels’ online ratings. This mismatch could be because almost all hotels provide free Wi-Fi to their customers, which was not previously the norm. This result is in line with Alhamad and Singh’s [59] regression analysis, which revealed that free Wi-Fi has trivial and the least impact on the overall online review ratings (p-Value 0.46, coefficient −0.03).
Expectations confirmation theory (ECT) states that a consumer is satisfied if the perceived performance matches or surpasses expectations; otherwise, the consumer is dissatisfied [40]. Integrating the four-factor and expectations confirmation theories in the current research context suggests that customers will be satisfied if hotels fulfill or exceed their expectations for critical factors (facilities and comfort); otherwise, they will be dissatisfied [33,40]. However, it is not possible to integrate the four-factor and expectations confirmation theories for satisfiers, dissatisfiers, and neutrals, as ECT does not fully support the characteristics of these factors. This is because satisfiers and dissatisfiers in the four-factor theory are unidirectional (either satisfaction or dissatisfaction, but not both) [33], whereas ECT requires bi-directionality (both satisfaction and dissatisfaction) [40]. Additionally, neutral factors in the four-factor theory do not result in satisfaction or dissatisfaction [33], whereas ECT requires both satisfaction and dissatisfaction [40].
6. Conclusions and Implications
This study demonstrated the significance of analyzing online consumer review data to enhance online ratings of hotels and improve customer satisfaction. The study established the importance of a hotel’s online rating system as a platform hotel customers use to convey their experiences. The study showed that the customer’s psychology of the hotel experience impacts the behavioral aspects of online ratings.
The previous research has identified factors that impact hotels’ online ratings, such as hotel’s breakfast availability, sanitation, comfort, facilities, locale, staff, value for the money spent, and the availability of free Wi-Fi. The existing literature categorized these factors as either satisfiers or dissatisfiers. Furthermore, the extant literature does not categorize these factors as either criticals or neutrals. This study applied the four-factor theory to present a novel categorization of the key predictive factors impacting hotels’ online ratings. Accordingly, the study categorized the factors as satisfiers, dissatisfiers, criticals, or neutrals.
This study decodes hidden knowledge from online consumer review data and uses a data-mining rule-based approach. With a dataset of 172 hotels in Makkah from Booking.com, the study used data mining in conjunction with the four-factor theory to empirically identify the four sets of factors impacting hotels’ online ratings. The study enriches the four-factor theory by identifying specific factors under each dimension and reports that:
- (1)
- The facilities and comfort are critical factors—their presence or absence affects satisfaction and dissatisfaction, as well as negative consumer evaluations;
- (2)
- The cleanliness, staff, and location are satisfiers—they meet consumers’ intrinsic needs; while their presence increases consumer satisfaction, their absence does not increase dissatisfaction;
- (3)
- The value for money spent is a dissatisfier—it meets consumers’ extrinsic needs; while its absence increases consumer dissatisfaction, its presence does not increase satisfaction; and
- (4)
- The availability of breakfast and a restaurant are neutral factors—their presence or absence does not affect consumer satisfaction or dissatisfaction.
This research’s tenets contribute to the current theory regarding hotels’ online ratings by identifying a distinct set of factors under the four-factor theory. The study extends the four-factor theory to the hospitality and tourism industry. This research contributes to the literature by categorizing hotels’ restaurant facilities as a neutral factor. However, the current research disagrees with the previous research [49,50,52,58] to the extent of not considering the availability of breakfast and free Wi-Fi significant for influencing hotels’ online ratings. Furthermore, the study enriches the literature by adding critical and neutral factors in addition to satisfiers and dissatisfiers. The study further contributes to the literature by suggesting the possibility to integrate four-factor and expectations confirmation theories for critical factors but not for satisfiers, dissatisfiers or neutral factors.
The current research contributes to the practice by presenting a novel categorization of key factors impacting hotels’ online ratings to enhance consumer satisfaction. The hospitality industry, in general, and particularly the hotel industry, can focus on the specific characteristics of the four distinct sets of factors identified in this research to survive and succeed. The research identifies facilities and comfort as critical factors, so they must be hotels’ first and foremost concerns. Failure to provide requisite facilities and necessary comfort to the customers will likely result in a business loss to the hotels. In contrast, the hotels’ ability to satisfy customers in these critical factors will improve their ratings and add business value. Cleanliness, staff, and location should be the hotels’ managers’ next priority as they play an essential role in customer satisfaction. The hotels should also pay attention to value for money, as customers can become dissatisfied if the value delivery by hotels does not match their money spent. The study also suggests that the value for money spent is less important for customers visiting a religious destination such as Makkah. The research further shows that hotel managers can afford to pay less attention to neutral factors such as breakfast availability and restaurant facilities (especially in religious destinations such as Makkah), as they hold lesser importance in customers’ minds than other factors.
This result also has implications for crisis management situations (e.g., COVID-19). This study identifies hotel facilities as a crucial factor. COVID-19-free facilities may play a vital role in protecting the revenue stream of hotels during crisis situations [63]. Cleanliness and staff are identified as satisfiers. Cleanliness (disinfection) and staff training in health and safety protocols are important to manage crises situations, such as the COVID-19 pandemic. Cleanliness and staff attitude can also improve customer satisfaction and protect the revenue stream of hotels, especially during COVID-19 [63]. The hotel’s facilities, comfort, cleanliness, etc., may all be affected by the happiness and contentment of its staff [65,66]. Therefore, hotels should invest in staff education and training to safeguard their income streams in crisis scenarios such as the COVID-19 pandemic.
The study’s findings are extremely valuable to a country such as Saudi Arabia, which is promoting its hospitality and tourism industries to diversify its revenue sources outside of oil as part of its Vision 2030 program. In particular, this study creates useful knowledge for hotels at various religious heritage sites, such as Saudi Arabia’s Makkah. Additionally, various nations can leverage the findings to promote their hospitality and tourism enterprises.
7. Limitations and Future Research
This study collected data from online review ratings for hotels in Makkah. However, future research can also include Madinah City to increase the dataset’s size and further generalize the findings. Similarly, the authors collected data from Booking.com, but future researchers can collect a wider variety of data by including websites from other companies, such as Agoda.com, Trivago.com, Expedia.com, Kayak.com, and Hotels.com, among others.
While this research focused only on numerical ratings, customers’ comments on online reviews can also provide useful information. Future studies can examine them using text mining to enhance the current research results.
Future research can take online review data from key religious heritage sites in different locales worldwide, such as Lhasa in Tibet, Varanasi and Amritsar in India, Sri Pada in Sri Lanka, Lumbini in Nepal, Salt Lake City in the USA, Lourdes in France, Wittenberg in Germany, Vatican City, Bethlehem, and Jerusalem, among others. Such cross-country and cross-religious research will further enrich the findings.
The future research can discuss the aspects of online ratings, such as mobile applications, in conjunction with popular tourism websites. As many customers who travel have a smartphone readily available, future research can address the mediums via which human behaviors are shaped and expressed in the hotel tourism context. Such a study can investigate the effect of different devices on the hotels’ online ratings and provide ideas on moment marketing campaigns to improve ratings.
Future research can consider growing concerns regarding fake and paid online reviews [92,93,94,95,96,97,98]. In addition, it can address manipulation concerns of online ratings by considering reviewers’ profiles, previous reviews, frequency of reviews by specific customers, writing style, etc.
This research applied rule-based classifiers (such as JCBA, WeightedClassifier, ConjunctiveRule, DecisionTable, DTNB, FURIA, JRip, LAC, MODLEM, MOEFC, NNge, OLM, OneR, PART, Prism, Ridor, RoughSet, ZeroR) and tree-based classifiers (such as BFTree (pruned and unpruned), CDT (pruned and unpruned), CSForest, DecisionStump, ForestPA, FT, HoeffdingTree, ID3, J48 (pruned and unpruned), J48Consolidated, J48Graft, LADTree, LMT, NBTree, PCT, RandomForest, RandomTree, REPTree (pruned and unpruned), SimpleCart, SPF, SPAARC, SysFor) for the data mining of the hotels’ online ratings. Future research can apply clustering algorithms such as K-means, C-means, farthest first, fuzzy clustering, expected maximization, BIRCH, DBSCAN, STING, etc. [99,100,101].
Author Contributions
Conceptualization, H.P.S. and I.A.A.; methodology, H.P.S.; software, H.P.S.; validation, H.P.S. and I.A.A.; formal analysis, H.P.S.; investigation, H.P.S. and I.A.A.; resources, H.P.S. and I.A.A.; data curation, H.P.S.; writing—original draft preparation, H.P.S.; writing—review and editing, H.P.S. and I.A.A.; supervision, H.P.S. and I.A.A.; funding acquisition, I.A.A.; project administration, H.P.S. and I.A.A. All authors have read and agreed to the published version of the manuscript.
Funding
This research received no external funding.
Institutional Review Board Statement
Not Applicable.
Informed Consent Statement
Not Applicable.
Data Availability Statement
The corresponding author can make the data accessible upon reasonable request.
Conflicts of Interest
The authors declare no conflict of interest.
Appendix A
Figure A1.
J48 unpruned decision tree with 48 rules.

References
- Guex, V. A Sociological View of the Cybertourists. In Information and Communication Technologies in Tourism 2010; Springer: Berlin/Heidelberg, Germany, 2010; pp. 417–428. [Google Scholar]
- García, B.B.; Carreras, A.O.; Royo, E.R. User Generated Content in Destination Marketing Organisations’ Websites. Int. J. Web Based Communities 2012, 8, 103. [Google Scholar] [CrossRef]
- Ayeh, J.K.; Au, N.; Law, R. “Do We Believe in TripAdvisor?” Examining Credibility Perceptions and Online Travelers’ Attitude toward Using User-Generated Content. J. Travel Res. 2013, 52, 437–452. [Google Scholar] [CrossRef]
- Munar, A.M.; Jacobsen, J.K.S. Trust and Involvement in Tourism Social Media and Web-Based Travel Information Sources. Scand. J. Hosp. Tour. 2013, 13, 1–19. [Google Scholar] [CrossRef]
- Hennig-Thurau, T.; Gwinner, K.P.; Walsh, G.; Gremler, D.D. Electronic Word-of-Mouth via Consumer-Opinion Platforms: What Motivates Consumers to Articulate Themselves on the Internet? J. Interact. Mark. 2004, 18, 38–52. [Google Scholar] [CrossRef]
- Litvin, S.W.; Goldsmith, R.E.; Pan, B. A Retrospective View of Electronic Word-of-Mouth in Hospitality and Tourism Management. Int. J. Contemp. Hosp. Manag. 2018, 30, 313–325. [Google Scholar] [CrossRef] [Green Version]
- Leung, D.; Law, R.; van Hoof, H.; Buhalis, D. Social Media in Tourism and Hospitality: A Literature Review. J. Travel Tour. Mark. 2013, 30, 3–22. [Google Scholar] [CrossRef]
- Zhang, W.T.; Choi, I.Y.; Hyun, Y.J.; Kim, J.K. Hotel Service Analysis by Penalty-Reward Contrast Technique for Online Review Data. Sustainability 2022, 14, 7340. [Google Scholar] [CrossRef]
- Kim, J.; Hardin, A. The Impact of Virtual Worlds on Word-of-Mouth: Improving Social Networking and Servicescape in the Hospitality Industry. J. Hosp. Mark. Manag. 2010, 19, 735–753. [Google Scholar] [CrossRef]
- Lu, W.; Stepchenkova, S. Ecotourism Experiences Reported Online: Classification of Satisfaction Attributes. Tour. Manag. 2012, 33, 702–712. [Google Scholar] [CrossRef]
- Gerdes, J.J.; Stringam, B.B. Addressing Researchers’ Quest for Hospitality Data: Mechanism for Collecting Data from Web Resources. Tour. Anal. 2008, 13, 309–315. [Google Scholar] [CrossRef]
- O’Connor, P. Managing a Hotel’s Image on TripAdvisor. J. Hosp. Mark. Manag. 2010, 19, 754–772. [Google Scholar] [CrossRef]
- Li, H.; Ye, Q.; Law, R. Determinants of Customer Satisfaction in the Hotel Industry: An Application of Online Review Analysis. Asia Pac. J. Tour. Res. 2013, 18, 784–802. [Google Scholar] [CrossRef]
- Banyai, M.; Glover, T.D. Evaluating Research Methods on Travel Blogs. J. Travel Res. 2012, 51, 267–277. [Google Scholar] [CrossRef]
- Mkono, M. A Netnographic Examination of Constructive Authenticity in Victoria Falls Tourist (Restaurant) Experiences. Int. J. Hosp. Manag. 2012, 31, 387–394. [Google Scholar] [CrossRef]
- Barsky, J.D. Customer Satisfaction in the Hotel Industry. Hosp. Res. J. 1992, 16, 51–73. [Google Scholar] [CrossRef]
- Sann, R.; Lai, P.-C.; Liaw, S.-Y.; Chen, C.-T. Predicting Online Complaining Behavior in the Hospitality Industry: Application of Big Data Analytics to Online Reviews. Sustainability 2022, 14, 1800. [Google Scholar] [CrossRef]
- Raguseo, E.; Vitari, C. The Effect of Brand on the Impact of E-WOM on Hotels’ Financial Performance. Int. J. Electron. Commer. 2017, 21, 249–269. [Google Scholar] [CrossRef]
- Baum, D.; Spann, M. The Interplay Between Online Consumer Reviews and Recommender Systems: An Experimental Analysis. Int. J. Electron. Commer. 2014, 19, 129–162. [Google Scholar] [CrossRef]
- Saudi Gazette Full Text of Saudi Arabia’s Vision 2030 | Al Arabiya English. Available online: https://english.alarabiya.net/en/perspective/features/2016/04/26/Full-text-of-Saudi-Arabia-s-Vision-2030.html (accessed on 7 July 2022).
- Khan, G.A. Saudi Arabia Launches New Tourism Initiatives within Vision 2030. Available online: https://www.arabnews.com/node/1130646/saudi-arabia (accessed on 7 July 2022).
- Bridge, S. Saudi Tourist Numbers Forecast to Top 23m in 2023–Arabianbusiness. Available online: https://www.arabianbusiness.com/travel-hospitality/417805-saudi-tourist-numbers-set-to-exceed-23m-in-2023 (accessed on 7 July 2020).
- Mittal, V.; Kumar, P.; Tsiros, M. Attribute-Level Performance, Satisfaction, and Behavioral Intentions over Time: A Consumption-System Approach. J. Mark. 1999, 63, 88. [Google Scholar] [CrossRef]
- Vermeulen, I.E.; Seegers, D. Tried and Tested: The Impact of Online Hotel Reviews on Consumer Consideration. Tour. Manag. 2009, 30, 123–127. [Google Scholar] [CrossRef]
- Ye, Q.; Law, R.; Gu, B.; Chen, W. The Influence of User-Generated Content on Traveler Behavior: An Empirical Investigation on the Effects of e-Word-of-Mouth to Hotel Online Bookings. Comput. Human Behav. 2011, 27, 634–639. [Google Scholar] [CrossRef]
- Zhang, Z.; Ye, Q.; Law, R.; Li, Y. The Impact of E-Word-of-Mouth on the Online Popularity of Restaurants: A Comparison of Consumer Reviews and Editor Reviews. Int. J. Hosp. Manag. 2010, 29, 694–700. [Google Scholar] [CrossRef]
- Berezina, K.; Bilgihan, A.; Cobanoglu, C.; Okumus, F. Understanding Satisfied and Dissatisfied Hotel Customers: Text Mining of Online Hotel Reviews. J. Hosp. Mark. Manag. 2016, 25, 1–24. [Google Scholar] [CrossRef]
- Kwok, L.; Xie, K.L. Factors Contributing to the Helpfulness of Online Hotel Reviews. Int. J. Contemp. Hosp. Manag. 2016, 28, 2156–2177. [Google Scholar] [CrossRef]
- Herzberg, F.; Mausner, B.; Snyderman, B.B. The Motivation to Work; Routledge: London, UK, 1959. [Google Scholar]
- Kano, N.; Seraku, N.; Takahashi, F.; Tsuji, S. Attractive Quality and Must-Be Quality. J. Jpn. Soc. Qual. Control 1984, 14, 39–48. [Google Scholar]
- Matzler, K.; Hinterhuber, H.H. How to Make Product Development Projects More Successful by Integrating Kano’s Model of Customer Satisfaction into Quality Function Deployment. Technovation 1998, 18, 25–38. [Google Scholar] [CrossRef]
- Lee, J.-S.; Back, K.-J.; Chan, E.S.W. Quality of Work Life and Job Satisfaction among Frontline Hotel Employees. Int. J. Contemp. Hosp. Manag. 2015, 27, 768–789. [Google Scholar] [CrossRef] [Green Version]
- Cadotte, E.R.; Turgeon, N. Dissatisfiers and Satisfiers: Suggestions from Consumer Complaints and Compliments. J. Consum. Satisf. Dissatisfaction Complain. Behav. 1988, 1, 74–79. [Google Scholar]
- Singh, H.P.; Alhulail, H.N. Predicting Student-Teachers Dropout Risk and Early Identification: A Four-Step Logistic Regression Approach. IEEE Access 2022, 10, 6470–6482. [Google Scholar] [CrossRef]
- Mittal, V.; Anderson, E.W.; Sayrak, A.; Tadikamalla, P. Dual Emphasis and the Long-Term Financial Impact of Customer Satisfaction. Mark. Sci. 2005, 24, 544–555. [Google Scholar] [CrossRef]
- Pooser, D.M.; Browne, M.J. The Effects of Customer Satisfaction on Company Profitability: Evidence from the Property and Casualty Insurance Industry. Risk Manag. Insur. Rev. 2018, 21, 289–308. [Google Scholar] [CrossRef]
- Alhamad, I.A.; Singh, H.P. Predicting Key Factors Impacting Online Hotel Ratings Using Data Mining Approach: A Case Study of the Makkah City of Saudi Arabia. Int. Trans. J. Eng. Manag. Appl. Sci. Technol. 2021, 12, 1–12. [Google Scholar] [CrossRef]
- Sánchez-Rebull, M.-V.; Rudchenko, V.; Martín, J.-C. The Antecedents and Consequences of Customer Satisfaction in Tourism: A Systematic Literature Review. Tour. Hosp. Manag. 2017, 24, 151–183. [Google Scholar] [CrossRef]
- Bhattacherjee, A. Understanding Information Systems Continuance: An Expectation-Confirmation Model. MIS Q. 2001, 25, 351. [Google Scholar] [CrossRef]
- Jiang, J.J.; Klein, G. Expectation-Confirmation Theory: Capitalizing on Descriptive Power. In Handbook of Research on Contemporary Theoretical Models in Information Systems; Dwivedi, Y., Lal, B., Williams, M., Schneberger, S., Wade, M., Eds.; IGI Global: Hershey, PA, USA, 2009; pp. 384–401. [Google Scholar]
- Oghuma, A.P.; Libaque-Saenz, C.F.; Wong, S.F.; Chang, Y. An Expectation-Confirmation Model of Continuance Intention to Use Mobile Instant Messaging. Telemat. Inform. 2016, 33, 34–47. [Google Scholar] [CrossRef]
- Lan, Y.-L. Intentions to Continue Using a Digital Mammography Vehicle Based on the Technology Acceptance Model and Expectation Confirmation Theory. Asian Women 2017, 33, 23–40. [Google Scholar] [CrossRef]
- Tsao, W.-Y. Understanding Lazy Usage Success Based on Expectation Confirmation Model and Technology Acceptance Model. Int. Rev. Manag. Bus. Res. 2018, 7, 896–909. [Google Scholar] [CrossRef]
- Guo, Y.; Barnes, S.J.; Jia, Q. Mining Meaning from Online Ratings and Reviews: Tourist Satisfaction Analysis Using Latent Dirichlet Allocation. Tour. Manag. 2017, 59, 467–483. [Google Scholar] [CrossRef] [Green Version]
- Shanka, T.; Taylor, R. An Investigation into the Perceived Importance of Service and Facility Attributes to Hotel Satisfaction. J. Qual. Assur. Hosp. Tour. 2004, 4, 119–134. [Google Scholar] [CrossRef]
- Hua, W.; Chan, A.; Mao, Z. Critical Success Factors and Customer Expectation in Budget Hotel Segment—A Case Study of China. J. Qual. Assur. Hosp. Tour. 2009, 10, 59–74. [Google Scholar] [CrossRef]
- Au, N.; Buhalis, D.; Law, R. Online Complaining Behavior in Mainland China Hotels: The Perception of Chinese and Non-Chinese Customers. Int. J. Hosp. Tour. Adm. 2014, 15, 248–274. [Google Scholar] [CrossRef]
- Kim, B.; Kim, S.; Heo, C.Y. Analysis of Satisfiers and Dissatisfiers in Online Hotel Reviews on Social Media. Int. J. Contemp. Hosp. Manag. 2016, 28, 1915–1936. [Google Scholar] [CrossRef]
- O’Connor, P. User-Generated Content and Travel: A Case Study on Tripadvisor.Com. In Information and Communication Technologies in Tourism 2008; O’Connor, P., Höpken, W., Gretzel, U., Eds.; Springer: Vienna, Austria, 2008; pp. 47–58. [Google Scholar]
- Albayrak, T.; Caber, M. Prioritisation of the Hotel Attributes According to Their Influence on Satisfaction: A Comparison of Two Techniques. Tour. Manag. 2015, 46, 43–50. [Google Scholar] [CrossRef]
- Buhalis, D.; Foerste, M. SoCoMo Marketing for Travel and Tourism: Empowering Co-Creation of Value. J. Destin. Mark. Manag. 2015, 4, 151–161. [Google Scholar] [CrossRef]
- Neirotti, P.; Raguseo, E.; Paolucci, E. Are Customers’ Reviews Creating Value in the Hospitality Industry? Exploring the Moderating Effects of Market Positioning. Int. J. Inf. Manag. 2016, 36, 1133–1143. [Google Scholar] [CrossRef] [Green Version]
- Phillips, P.; Barnes, S.; Zigan, K.; Schegg, R. Understanding the Impact of Online Reviews on Hotel Performance. J. Travel Res. 2016, 56, 235–249. [Google Scholar] [CrossRef] [Green Version]
- Öğüta, H.; Cezara, A. The Factors Affecting Writing Reviews in Hotel Websites. Procedia Soc. Behav. Sci. 2012, 58, 980–986. [Google Scholar] [CrossRef] [Green Version]
- Becerra, M.; Santaló, J.; Silva, R. Being Better vs. Being Different: Differentiation, Competition, and Pricing Strategies in the Spanish Hotel Industry. Tour. Manag. 2013, 34, 71–79. [Google Scholar] [CrossRef]
- Liu, Y.; Teichert, T.; Rossi, M.; Li, H.; Hu, F. Big Data for Big Insights: Investigating Language-Specific Drivers of Hotel Satisfaction with 412,784 User-Generated Reviews. Tour. Manag. 2017, 59, 554–563. [Google Scholar] [CrossRef]
- Chang, Y.-C.; Ku, C.-H.; Chen, C.-H. Social Media Analytics: Extracting and Visualizing Hilton Hotel Ratings and Reviews from TripAdvisor. Int. J. Inf. Manag. 2019, 48, 263–279. [Google Scholar] [CrossRef]
- Bulchand-Gidumal, J.; Melián-González, S.; González López-Valcárcel, B. Improving Hotel Ratings by Offering Free Wi-Fi. J. Hosp. Tour. Technol. 2011, 2, 235–245. [Google Scholar] [CrossRef]
- Alhamad, I.A.; Singh, H.P. Decoding Significant and Trivial Factors Influencing Online Hotel Ratings: The Case of Saudi Arabia’s Makkah City. Int. Trans. J. Eng. Manag. Appl. Sci. Technol. 2021, 12, 1–11. [Google Scholar] [CrossRef]
- Hilliard, T.; Scott-Halsell, S.; Palakurthi, R. Elements That Influence the Implementation of Crisis Preparedness Measures by Meeting Planners. J. Contingencies Cris. Manag. 2011, 19, 198–206. [Google Scholar] [CrossRef] [Green Version]
- Bremser, K.; Alonso-Almeida, M.M.; Llach, J. Strategic Alternatives for Tourism Companies to Overcome Times of Crisis. Serv. Bus. 2018, 12, 229–251. [Google Scholar] [CrossRef]
- Adekola, J.; Clelland, D. Two Sides of the Same Coin: Business Resilience and Community Resilience. J. Contingencies Cris. Manag. 2020, 28, 50–60. [Google Scholar] [CrossRef]
- Rodríguez-Antón, J.M.; Alonso-Almeida, M. del M. COVID-19 Impacts and Recovery Strategies: The Case of the Hospitality Industry in Spain. Sustainability 2020, 12, 8599. [Google Scholar] [CrossRef]
- Kong, H.; Jiang, X.; Chan, W.; Zhou, X. Job Satisfaction Research in the Field of Hospitality and Tourism. Int. J. Contemp. Hosp. Manag. 2018, 30, 2178–2194. [Google Scholar] [CrossRef]
- García-Rodríguez, F.J.; Dorta-Afonso, D.; González-de-la-Rosa, M. Hospitality Diversity Management and Job Satisfaction: The Mediating Role of Organizational Commitment across Individual Differences. Int. J. Hosp. Manag. 2020, 91, 102698. [Google Scholar] [CrossRef]
- Dorta-Afonso, D.; Romero-Domínguez, L.; Benítez-Núñez, C. It’s Worth It! High Performance Work Systems for Employee Job Satisfaction: The Mediational Role of Burnout. Int. J. Hosp. Manag. 2023, 108, 103364. [Google Scholar] [CrossRef]
- Soliman, H.M. Motivation-Hygiene Theory of Job Attitudes: An Empirical Investigation and an Attempt to Reconcile Both the One- and the Two-Factor Theories of Job Attitudes. J. Appl. Psychol. 1970, 54, 452–461. [Google Scholar] [CrossRef]
- Swan, J.E.; Combs, L.J. Product Performance and Consumer Satisfaction: A New Concept. J. Mark. 1976, 40, 25. [Google Scholar] [CrossRef]
- Maddox, R.N. Two-Factor Theory and Consumer Satisfaction: Replication and Extension. J. Consum. Res. 1981, 8, 97. [Google Scholar] [CrossRef]
- Babin, B.J.; Griffin, M. The Nature of Satisfaction: An Updated Examination and Analysis. J. Bus. Res. 1998, 41, 127–136. [Google Scholar] [CrossRef]
- Zhang, P.; Dran, G.M.V. Satisfiers and Dissatisfiers: A Two-Factor Model for Website Design and Evaluation. J. Am. Soc. Inf. Sci. 2000, 51, 1253–1268. [Google Scholar] [CrossRef]
- Levy, S.E.; Duan, W.; Boo, S. An Analysis of One-Star Online Reviews and Responses in the Washington, D.C., Lodging Market. Cornell Hosp. Q. 2013, 54, 49–63. [Google Scholar] [CrossRef]
- Singh, H.P.; Alhamad, I.A. Deciphering Key Factors Impacting Online Hotel Ratings Through the Lens of Two-Factor Theory: A Case of Hotels in the Makkah City of Saudi Arabia. Int. Trans. J. Eng. Manag. Appl. Sci. Technol. 2021, 12, 1–12. [Google Scholar] [CrossRef]
- Johnston, R. The Determinants of Service Quality: Satisfiers and Dissatisfiers. Int. J. Serv. Ind. Manag. 1995, 6, 53–71. [Google Scholar] [CrossRef] [Green Version]
- Vargo, S.L.; Nagao, K.; He, Y.; Morgan, F.W. Satisfiers, Dissatisfiers, Criticals, and Neutrals: A Review of Their Relative Effects on Customer (Dis)Satisfaction. Acad. Mark. Sci. Rev. 2007, 11, 1–9. [Google Scholar]
- Oliver, R.L. Satisfaction: A Behavioral Perspective on the Consumer, 2nd ed.; Routledge: New York, NY, USA, 2014; ISBN 9781315700892. [Google Scholar]
- Silverman, S.N.; Grover, R. Forming Perceptions of Overall Quality in Consumer Products: A Process of Quality Element Integration; Marketing Science Institute: New York, NY, USA, 1995. [Google Scholar]
- Chu, R.K.S.; Choi, T. An Importance-Performance Analysis of Hotel Selection Factors in the Hong Kong Hotel Industry: A Comparison of Business and Leisure Travellers. Tour. Manag. 2000, 21, 363–377. [Google Scholar] [CrossRef]
- Gu, H.; Ryan, C. Place Attachment, Identity and Community Impacts of Tourism—The Case of a Beijing Hutong. Tour. Manag. 2008, 29, 637–647. [Google Scholar] [CrossRef]
- Dolnicar, S. A Review of Data-Driven Market Segmentation in Tourism. J. Travel Tour. Mark. 2002, 12, 1–22. [Google Scholar] [CrossRef]
- Gundersen, M. Hotel Guest Satisfaction among Business Travelers What Are the Important Factors? Cornell Hotel Restaur. Adm. Q. 1996, 37, 72–81. [Google Scholar] [CrossRef]
- Barsky, J.D.; Labagh, R. A Strategy for Customer Satisfaction. Cornell Hotel Restaur. Adm. Q. 1992, 33, 32–40. [Google Scholar] [CrossRef]
- Choi, T.Y.; Chu, R. Levels of Satisfaction among Asian and Western Travellers. Int. J. Qual. Reliab. Manag. 2000, 17, 116–132. [Google Scholar] [CrossRef]
- Qu, H.; Ryan, B.; Chu, R. The Importance of Hotel Attributes in Contributing to Travelers’ Satisfaction in the Hong Kong Hotel Industry. J. Qual. Assur. Hosp. Tour. 2000, 1, 65–83. [Google Scholar] [CrossRef]
- Poon, W.; Lock-Teng Low, K. Are Travellers Satisfied with Malaysian Hotels? Int. J. Contemp. Hosp. Manag. 2005, 17, 217–227. [Google Scholar] [CrossRef]
- Heung, V.C.S. Satisfaction Levels of Mainland Chinese Travelers with Hong Kong Hotel Services. Int. J. Contemp. Hosp. Manag. 2000, 12, 308–315. [Google Scholar] [CrossRef]
- Naseem, R.; Shaukat, Z.; Irfan, M.; Shah, M.A.; Ahmad, A.; Muhammad, F.; Glowacz, A.; Dunai, L.; Antonino-Daviu, J.; Sulaiman, A. Empirical Assessment of Machine Learning Techniques for Software Requirements Risk Prediction. Electronics 2021, 10, 168. [Google Scholar] [CrossRef]
- Cios, K.J.; Teresinska, A.; Konieczna, S.; Potocka, J.; Sharma, S. A Knowledge Discovery Approach to Diagnosing Myocardial Perfusion. IEEE Eng. Med. Biol. Mag. 2000, 19, 17–25. [Google Scholar] [CrossRef]
- Yahoo Finance Fake Hotel Reviews? Never on Booking.Com, Says CEO. Available online: https://finance.yahoo.com/news/fake-hotel-reviews-never-booking-com-says-ceo-173948451.html (accessed on 7 July 2020).
- Khan, B.; Naseem, R.; Muhammad, F.; Abbas, G.; Kim, S. An Empirical Evaluation of Machine Learning Techniques for Chronic Kidney Disease Prophecy. IEEE Access 2020, 8, 55012–55022. [Google Scholar] [CrossRef]
- Sami, B.H.Z.; Jee khai, W.; Sami, B.F.Z.; Ming Fai, C.; Essam, Y.; Ahmed, A.N.; El-Shafie, A. Investigating the Reliability of Machine Learning Algorithms as a Sustainable Tool for Total Suspended Solid Prediction. Ain Shams Eng. J. 2021, 12, 1607–1622. [Google Scholar] [CrossRef]
- Malbon, J. Taking Fake Online Consumer Reviews Seriously. J. Consum. Policy 2013, 36, 139–157. [Google Scholar] [CrossRef]
- Filieri, R.; Alguezaui, S.; McLeay, F. Why Do Travelers Trust TripAdvisor? Antecedents of Trust towards Consumer-Generated Media and Its Influence on Recommendation Adoption and Word of Mouth. Tour. Manag. 2015, 51, 174–185. [Google Scholar] [CrossRef]
- Al-Sultany, G.A.; Hussain, S.M. Fake Reviews Detection through Users Behavior Analysis. J. Adv. Res. Dyn. Control. Syst. 2019, 11, 737–741. [Google Scholar] [CrossRef]
- Chen, L.; Li, W.; Chen, H.; Geng, S. Detection of Fake Reviews: Analysis of Sellers’ Manipulation Behavior. Sustainability 2019, 11, 4802. [Google Scholar] [CrossRef] [Green Version]
- Rout, J.K.; Dalmia, A.; Choo, K.-K.R.; Bakshi, S.; Jena, S.K. Revisiting Semi-Supervised Learning for Online Deceptive Review Detection. IEEE Access 2017, 5, 1319–1327. [Google Scholar] [CrossRef]
- Sun, Y.; Loparo, K. Opinion Spam Detection Based on Heterogeneous Information Network. In Proceedings of the 2019 IEEE 31st International Conference on Tools with Artificial Intelligence (ICTAI), Portland, OR, USA, 4–6 November 2019; pp. 1156–1163. [Google Scholar]
- Banerjee, S.; Chua, A.Y.K. Understanding the Process of Writing Fake Online Reviews. In Proceedings of the Ninth International Conference on Digital Information Management (ICDIM 2014), IEEE, Bangkok, Thailand, 29 September–1 October 2014; pp. 68–73. [Google Scholar]
- Dutt, A.; Ismail, M.A.; Herawan, T. A Systematic Review on Educational Data Mining. IEEE Access 2017, 5, 15991–16005. [Google Scholar] [CrossRef]
- Parikh, V.; Keskar, M.; Dharia, D.; Gotmare, P. A Tourist Place Recommendation and Recognition System. In Proceedings of the 2018 Second International Conference on Inventive Communication and Computational Technologies (ICICCT), Coimbatore, India, 20–21 April 2018; pp. 218–222. [Google Scholar]
- Venkatkumar, I.A.; Shardaben, S.J.K. Comparative Study of Data Mining Clustering Algorithms. In Proceedings of the 2016 International Conference on Data Science and Engineering (ICDSE), Cochin, India, 23–25 August 2016; pp. 1–7. [Google Scholar]
Figure 1.
Novel Model of Key Predictive Factors Impacting Hotels’ Online Ratings (Source: Authors Design as a Result of Current Research).
Figure 1.
Novel Model of Key Predictive Factors Impacting Hotels’ Online Ratings (Source: Authors Design as a Result of Current Research).


Table 1.
Categorization of Factors Affecting Consumer Satisfaction.
| Factor | Research |
|---|---|
| Breakfast (BF) | Gu and Ryan [79] and Singh and Alhamad [73] categorize breakfast as a satisfier. However, Dolnicar [80] classifies it as a dissatisfier. |
| Cleanliness (CN) | Gu and Ryan [79] and Singh and Alhamad [73] categorize cleanliness as a satisfier, although Dolnicar [80] classifies it as a dissatisfier. |
| Comfort (CM) | Gundersen [81], Gu and Ryan [79], and Singh and Alhamad [73] categorize comfort as a satisfier. |
| Facilities (FS) | Barsky and Labagh [82], Choi and Chu [83], Qu et al. [84], Poon and Low [85], Gu and Ryan [79], and Singh and Alhamad [73] categorize facilities as a satisfier, but Heung [86] classifies it as a dissatisfier. |
| Location (LC) | Barsky and Labagh [82], Poon and Low [85], and Gu and Ryan [79] categorize location as a satisfier, while Dolnicar [80] and Singh and Alhamad [73] classify it as a dissatisfier. |
| Staff (SF) | Barsky and Labagh [82], Choi and Chu [83], Qu et al. [84], and Gu and Ryan [79] categorize staff as a satisfier. However, Heung [86] and Singh and Alhamad [73] classify it as a dissatisfier. |
| Value for Money Spent (VS) | Barsky and Labagh [82] and Qu et al. [84] categorize the value for money spent as a satisfier, while Heung [86] and Singh and Alhamad [73] classify it as a dissatisfier. |
| Free Wi-Fi (FF) | Singh and Alhamad [73] categorize free Wi-Fi as a dissatisfier. |
Table 2.
Discretization of Scores of Attributes.
| Attribute Score | Discretized Score (DS) | Explanation of Score |
|---|---|---|
| 9 to 10 | I | Wonderful (W) |
| 8.6 to <9 | II | Excellent (E) |
| 8 to 8.5 | III | Very Good (V) |
| 7 to <8 | IV | Good (G) |
| 5 to <7 | V | Okay (K) |
| 3 to <5 | VI | Poor (P) |
| No score | VII | Absent (A) |
Table 3.
Count of Discretized Scores.
| DS | BF | CN | CM | LC | FS | SF | VS | FF | RE | RC |
|---|---|---|---|---|---|---|---|---|---|---|
| I | 3 | 6 | 7 | 10 | 1 | 3 | 7 | 3 | 4 | 1 |
| II | 3 | 10 | 9 | 10 | 6 | 13 | 9 | 1 | 2 | 8 |
| III | 8 | 20 | 17 | 6 | 10 | 13 | 16 | 4 | 4 | 17 |
| IV | 15 | 47 | 59 | 55 | 35 | 70 | 59 | 25 | 15 | 60 |
| V | 14 | 81 | 73 | 85 | 99 | 71 | 75 | 78 | 33 | 81 |
| VI | 10 | 8 | 7 | 6 | 21 | 2 | 6 | 40 | 10 | 5 |
| VII | 119 | 0 | 0 | 0 | 0 | 0 | 0 | 17 | 104 | NA |
Note: “NA” denotes “not applicable” in the review class (RC) column, as there are only six classes.
Table 4.
Classification Accuracy of Rule and Tree-Based Classifiers.
| Classifier | CCI% | Precision | Recall | F-Measure |
|---|---|---|---|---|
| Rule-Based Classifiers | ||||
| JCBA (Pruned) | 11.905 | 0.119 | 0.119 | 0.119 |
| JCBA (Unpruned) | 41.071 | 0.398 | 0.411 | 0.404 |
| WeightedClassifier | 35.119 | 0.293 | 0.351 | 0.319 |
| ConjunctiveRule | 32.143 | 0.391 | 0.321 | 0.353 |
| DecisionTable | 86.905 | 0.870 | 0.869 | 0.869 |
| DTNB | 85.714 | 0.851 | 0.857 | 0.854 |
| FURIA | 92.262 | 0.923 | 0.923 | 0.923 |
| JRip (Pruned) | 89.286 | 0.895 | 0.893 | 0.894 |
| JRip (Unpruned) | 91.667 | 0.919 | 0.917 | 0.918 |
| LAC | 95.238 | 0.953 | 0.952 | 0.952 |
| MODLEM | 91.667 | 0.917 | 0.917 | 0.917 |
| MOEFC | 72.619 | 0.721 | 0.726 | 0.723 |
| NNge | 94.643 | 0.947 | 0.946 | 0.946 |
| OLM | 94.048 | 0.943 | 0.940 | 0.941 |
| OneR | 76.190 | 0.800 | 0.762 | 0.781 |
| PART (Pruned) | 90.476 | 0.914 | 0.905 | 0.909 |
| PART (Unpruned) | 89.286 | 0.894 | 0.893 | 0.893 |
| Prism | 93.452 | 0.952 | 0.952 | 0.952 |
| Ridor | 86.310 | 0.864 | 0.863 | 0.863 |
| RoughSet | 94.047 | 0.940 | 0.940 | 0.94 |
| ZeroR | 11.905 | 0.119 | 0.119 | 0.119 |
| Tree-Based Classifiers | ||||
| BFTree (Pruned) | 91.667 | 0.918 | 0.917 | 0.917 |
| BFTree (Unpruned) | 92.262 | 0.923 | 0.923 | 0.923 |
| CDT (Pruned) | 86.309 | 0.870 | 0.863 | 0.866 |
| CDT (Unpruned) | 90.476 | 0.909 | 0.905 | 0.907 |
| CSForest | 83.333 | 0.833 | 0.833 | 0.833 |
| DecisionStump | 29.762 | 0.244 | 0.298 | 0.268 |
| ForestPA | 92.857 | 0.930 | 0.929 | 0.929 |
| FT | 92.857 | 0.928 | 0.929 | 0.928 |
| HoeffdingTree | 91.071 | 0.910 | 0.911 | 0.91 |
| ID3 | 91.071 | 0.921 | 0.922 | 0.921 |
| J48 (Pruned) | 97.691 | 0.977 | 0.977 | 0.977 |
| J48 (Unpruned) | 99.071 | 0.993 | 0.991 | 0.992 |
| J48Consolidated | 97.691 | 0.977 | 0.977 | 0.977 |
| J48Graft | 97.691 | 0.977 | 0.977 | 0.977 |
| LADTree | 92.857 | 0.929 | 0.929 | 0.929 |
| LMT | 91.667 | 0.916 | 0.917 | 0.916 |
| NBTree | 90.476 | 0.906 | 0.905 | 0.905 |
| PCT | 11.905 | 0.119 | 0.119 | 0.119 |
| RandomForest | 93.452 | 0.934 | 0.935 | 0.934 |
| RandomTree | 92.262 | 0.925 | 0.923 | 0.924 |
| REPTree (Pruned) | 94.905 | 0.949 | 0.951 | 0.950 |
| REPTree (Unpruned) | 97.286 | 0.973 | 0.971 | 0.972 |
| SimpleCart | 92.857 | 0.930 | 0.929 | 0.929 |
| SPF | 57.738 | 0.556 | 0.577 | 0.566 |
| SPAARC | 92.857 | 0.930 | 0.929 | 0.929 |
| SysFor | 69.047 | 0.676 | 0.690 | 0.683 |
Table 5.
Error Rate Assessment of Rule and Tree-Based Classifiers.
| Classifier | ICI% | MAE | RMSE | RAE% | RRSE% |
|---|---|---|---|---|---|
| Rule-Based Classifiers | |||||
| JCBA (Pruned) | 88.095 | 0.293 | 0.542 | 105.67 | 145.341 |
| JCBA (Unpruned) | 58.929 | 0.196 | 0.443 | 70.684 | 118.871 |
| WeightedClassifier | 64.881 | 0.216 | 0.465 | 77.824 | 124.729 |
| ConjunctiveRule | 67.857 | 0.234 | 0.344 | 84.305 | 92.377 |
| DecisionTable | 13.095 | 0.140 | 0.222 | 50.474 | 59.487 |
| DTNB | 14.286 | 0.057 | 0.182 | 20.652 | 48.679 |
| FURIA | 7.738 | 0.026 | 0.149 | 9.327 | 39.956 |
| JRip (Pruned) | 10.714 | 0.044 | 0.180 | 15.676 | 48.243 |
| JRip (Unpruned) | 8.333 | 0.030 | 0.156 | 10.943 | 41.864 |
| LAC | 4.762 | 0.075 | 0.146 | 26.806 | 39.202 |
| MODLEM | 8.333 | 0.028 | 0.167 | 9.996 | 44.70 |
| MOEFC | 27.381 | 0.091 | 0.302 | 32.843 | 81.028 |
| NNge | 5.357 | 0.018 | 0.134 | 6.426 | 35.841 |
| OLM | 5.952 | 0.020 | 0.141 | 7.140 | 37.780 |
| OneR | 23.81 | 0.079 | 0.282 | 28.559 | 75.559 |
| PART (Pruned) | 9.524 | 0.040 | 0.168 | 14.455 | 45.110 |
| PART (Unpruned) | 10.714 | 0.035 | 0.169 | 12.733 | 45.340 |
| Prism | 6.548 | 0.016 | 0.127 | 5.921 | 34.405 |
| Ridor | 13.69 | 0.046 | 0.214 | 16.422 | 57.296 |
| RoughSet | 5.953 | 0.022 | 0.115 | 7.722 | 30.873 |
| ZeroR | 88.095 | 0.278 | 0.373 | 100 | 100 |
| Tree-Based Classifiers | |||||
| BFTree (Pruned) | 8.333 | 0.035 | 0.155 | 12.574 | 41.656 |
| BFTree (Unpruned) | 7.738 | 0.032 | 0.153 | 11.490 | 40.961 |
| CDT (Pruned) | 13.691 | 0.063 | 0.196 | 20.810 | 52.435 |
| CDT (Unpruned) | 9.524 | 0.043 | 0.172 | 15.483 | 46.049 |
| CSForest | 16.667 | 0.196 | 0.275 | 70.406 | 73.732 |
| DecisionStump | 70.238 | 0.237 | 0.347 | 85.197 | 93.101 |
| ForestPA | 7.143 | 0.064 | 0.157 | 22.844 | 42.229 |
| FT | 7.143 | 0.027 | 0.140 | 9.787 | 37.446 |
| HoeffdingTree | 8.929 | 0.035 | 0.146 | 12.715 | 39.262 |
| ID3 | 8.929 | 0.026 | 0.162 | 9.507 | 43.595 |
| J48 (Pruned) | 2.309 | 0.014 | 0.113 | 5.462 | 28.967 |
| J48 (Unpruned) | 0.929 | 0.011 | 0.108 | 4.054 | 24.415 |
| J48Consolidated | 2.309 | 0.015 | 0.112 | 5.700 | 29.215 |
| J48Graft | 2.309 | 0.014 | 0.112 | 5.314 | 29.444 |
| LADTree | 7.143 | 0.038 | 0.130 | 13.798 | 34.984 |
| LMT | 8.333 | 0.032 | 0.140 | 11.620 | 37.618 |
| NBTree | 9.524 | 0.032 | 0.154 | 11.628 | 41.304 |
| PCT | 88.095 | 0.278 | 0.373 | 100 | 100 |
| RandomForest | 6.548 | 0.036 | 0.125 | 13.080 | 44.542 |
| RandomTree | 7.738 | 0.025 | 0.156 | 9.091 | 41.871 |
| REPTree (Pruned) | 5.095 | 0.031 | 0.136 | 14.895 | 30.468 |
| REPTree (Unpruned) | 2.714 | 0.028 | 0.131 | 6.907 | 28.958 |
| SimpleCart | 7.143 | 0.036 | 0.151 | 12.985 | 40.458 |
| SPF | 42.262 | 0.242 | 0.492 | 87.106 | 131.958 |
| SPAARC | 7.143 | 0.038 | 0.152 | 13.523 | 40.659 |
| SysFor | 30.953 | 0.099 | 0.279 | 35.712 | 74.875 |
Table 6.
Classification Performance of Rule and Tree-Based Classifiers.
| Classifier | Kappa | MCC | ROC | PRC |
|---|---|---|---|---|
| Rule-Based Classifiers | ||||
| JCBA (Pruned) | −0.057 | −0.064 | 0.471 | 0.161 |
| JCBA (Unpruned) | 0.293 | 0.286 | 0.646 | 0.364 |
| WeightedClassifier | 0.221 | 0.218 | 0.611 | 0.250 |
| ConjunctiveRule | 0.186 | 0.190 | 0.709 | 0.341 |
| DecisionTable | 0.843 | 0.843 | 0.972 | 0.870 |
| DTNB | 0.829 | 0.825 | 0.983 | 0.932 |
| FURIA | 0.907 | 0.907 | 0.966 | 0.900 |
| JRip (Pruned) | 0.871 | 0.872 | 0.963 | 0.877 |
| JRip (Unpruned) | 0.900 | 0.901 | 0.971 | 0.912 |
| LAC | 0.943 | 0.943 | 0.984 | 0.976 |
| MODLEM | 0.900 | 0.900 | 0.950 | 0.859 |
| MOEFC | 0.671 | 0.668 | 0.836 | 0.577 |
| NNge | 0.936 | 0.936 | 0.968 | 0.907 |
| OLM | 0.929 | 0.930 | 0.964 | 0.897 |
| OneR | 0.714 | 0.816 | 0.857 | 0.653 |
| PART (Pruned) | 0.886 | 0.889 | 0.965 | 0.870 |
| PART (Unpruned) | 0.871 | 0.871 | 0.956 | 0.882 |
| Prism | 0.942 | 0.942 | 0.963 | 0.903 |
| Ridor | 0.836 | 0.836 | 0.918 | 0.778 |
| RoughSet | 0.929 | 0.928 | 0.981 | 0.973 |
| ZeroR | −0.057 | −0.064 | 0.464 | 0.158 |
| Tree-Based Classifiers | ||||
| BFTree (Pruned) | 0.900 | 0.900 | 0.968 | 0.891 |
| BFTree (Unpruned) | 0.907 | 0.907 | 0.971 | 0.900 |
| CDT (Pruned) | 0.836 | 0.838 | 0.960 | 0.823 |
| CDT (Unpruned) | 0.886 | 0.887 | 0.963 | 0.853 |
| CSForest | 0.800 | 0.798 | 0.983 | 0.934 |
| DecisionStump | 0.157 | 0.130 | 0.692 | 0.315 |
| ForestPA | 0.914 | 0.915 | 0.982 | 0.939 |
| FT | 0.914 | 0.914 | 0.981 | 0.953 |
| HoeffdingTree | 0.893 | 0.892 | 0.983 | 0.962 |
| ID3 | 0.906 | 0.906 | 0.948 | 0.860 |
| J48 (Pruned) | 0.964 | 0.964 | 0.992 | 0.978 |
| J48 (Unpruned) | 0.988 | 0.988 | 0.996 | 0.982 |
| J48Consolidated | 0.964 | 0.964 | 0.993 | 0.977 |
| J48Graft | 0.964 | 0.964 | 0.993 | 0.976 |
| LADTree | 0.914 | 0.914 | 0.980 | 0.957 |
| LMT | 0.900 | 0.900 | 0.982 | 0.959 |
| NBTree | 0.886 | 0.886 | 0.981 | 0.932 |
| PCT | −0.057 | −0.064 | 0.464 | 0.158 |
| RandomForest | 0.921 | 0.921 | 0.982 | 0.971 |
| RandomTree | 0.907 | 0.908 | 0.957 | 0.880 |
| REPTree (Pruned) | 0.943 | 0.945 | 0.985 | 0.970 |
| REPTree (Unpruned) | 0.961 | 0.962 | 0.987 | 0.975 |
| SimpleCart | 0.914 | 0.915 | 0.971 | 0.894 |
| SPF | 0.493 | 0.478 | 0.745 | 0.333 |
| SPAARC | 0.914 | 0.915 | 0.969 | 0.886 |
| SysFor | 0.629 | 0.620 | 0.874 | 0.651 |
Table 7.
Attributes Evaluation.
| Attribute | Abbreviation | Rank | IG Weight | GR Weight |
|---|---|---|---|---|
| Facilities | FS | 1 | 1.936 | 0.766 |
| Comfort | CM | 2 | 1.830 | 0.740 |
| Cleanliness | CN | 3 | 1.715 | 0.690 |
| Staff | SF | 4 | 1.630 | 0.653 |
| Location | LC | 5 | 1.598 | 0.629 |
| Value for Money | VS | 6 | 1.337 | 0.552 |
| Breakfast | BF | 7 | 1.198 | 0.488 |
| Restaurant | RE | 8 | 1.180 | 0.473 |
| Free Wi-Fi | FF | 9 | 1.005 | 0.377 |
Table 8.
Rules.
| No. | Rule | Coverage | Accuracy |
|---|---|---|---|
| 1 | IF (Facilities = Wonderful) THEN (Review = Wonderful) (28.67/0.0) | 16.7% | 100% |
| 2 | IF (Facilities = Excellent) THEN (Review = Excellent) (21.5/0.0) | 12.5% | 100% |
| 3 | IF (Facilities = Very Good) AND (Location = Wonderful) THEN (Review = Very Good) (3.37/0.0) | 2.0% | 100% |
| 4 | IF (Facilities = Very Good) AND (Location = Excellent) THEN (Review = Excellent) (3.58/0.0) | 2.1% | 100% |
| 5 | IF (Facilities = Very Good) AND (Location = Very Good) THEN (Review = Excellent) (3.58/0.0) | 2.1% | 100% |
| 6 | IF (Facilities = Very Good) AND (Location = Good) THEN (Review = Very Good) (7.22/0.48) | 4.2% | 93.4% |
| 7 | IF (Facilities = Good) AND (Restaurant = Wonderful) THEN (Review = Very Good) (3.85/0.48) | 2.2% | 87.5% |
| 8 | IF (Facilities = Good) AND (Restaurant = Good) THEN (Review = Good) (3.82/0.0) | 2.2% | 100% |
| 9 | IF (Facilities = Good) AND (Restaurant = Okay) THEN (Review = Good) (3.82/0.0) | 2.2% | 100% |
| 10 | IF (Facilities = Good) AND (Restaurant = Absent) AND (Value for Money = Wonderful) AND (Breakfast = Poor) THEN (Review = Very Good) (3.37/0.0) | 2.0% | 100% |
| 11 | IF (Facilities = Good) AND (Restaurant = Absent) AND (Value for Money = Wonderful) AND (Breakfast = Absent) THEN (Review = Very Good) (5.06/0.0) | 2.9% | 100% |
| 12 | IF (Facilities = Good) AND (Restaurant = Absent) AND (Value for Money = Excellent) THEN (Review = Good) (4/0.48) | 2.3% | 88% |
| 13 | IF (Facilities = Good) AND (Restaurant = Absent) AND (Value for Money = Very Good) THEN (Review = Good) (43.6/1.69) | 25.3% | 96.1% |
| 14 | IF (Facilities = Okay) AND (Cleanliness = Good) THEN (Review = Good) (13.48/1.06) | 7.8% | 92.1% |
| 15 | IF (Facilities = Okay) AND (Cleanliness = Okay) AND (Comfort = Good) AND (Staff = Good) THEN (Review = Good) (2.74/0.35) | 1.6% | 87.2% |
| 16 | IF (Facilities = Okay) AND (Cleanliness = Okay) AND (Comfort = Good) AND (Staff = Okay) THEN (Review = Okay) (2.6/0.48) | 1.5% | 81.5% |
| 17 | IF (Facilities = Okay) AND (Cleanliness = Okay) AND (Comfort = Okay) THEN (Review = Okay) (19.11/0.0) | 11.1% | 100% |
| 18 | IF (Facilities = Poor) AND (Comfort = Okay) THEN (Review = Okay) (5.31/0.0) | 3.1% | 100% |
| 19 | IF (Facilities = Poor) AND (Comfort = Poor) THEN (Review = Poor) (29.02/0.35) | 16.9% | 98.8% |
Table 9.
Rules Depicting the Factors Impacting Hotels’ Online Ratings.
| R | FS | CN | CM | SF | LC | VS | BF | RE | RC | CO% | AC% |
|---|---|---|---|---|---|---|---|---|---|---|---|
| 1 | W | W | 16.7 | 100 | |||||||
| 2 | E | E | 12.5 | 100 | |||||||
| 3 | V | W | V | 2.0 | 100 | ||||||
| 4 | V | E | E | 2.1 | 100 | ||||||
| 5 | V | V | E | 2.1 | 100 | ||||||
| 6 | V | G | V | 4.2 | 93.4 | ||||||
| 7 | G | W | V | 2.2 | 87.5 | ||||||
| 8 | G | G | G | 2.2 | 100 | ||||||
| 9 | G | K | G | 2.2 | 100 | ||||||
| 10 | G | W | P | A | V | 2.0 | 100 | ||||
| 11 | G | W | A | A | V | 2.9 | 100 | ||||
| 12 | G | E | A | G | 2.3 | 88 | |||||
| 13 | G | V | A | G | 25.3 | 96 | |||||
| 14 | K | G | G | 7.8 | 92.1 | ||||||
| 15 | K | K | G | G | G | 1.6 | 87.2 | ||||
| 16 | K | K | G | K | K | 1.5 | 81.5 | ||||
| 17 | K | K | K | K | 11.1 | 100 | |||||
| 18 | P | K | K | 3.1 | 100 | ||||||
| 19 | P | P | P | 16.9 | 98.8 |
Publisher’s Note: MDPI stays neutral with regard to jurisdictional claims in published maps and institutional affiliations. |
© 2022 by the authors. Licensee MDPI, Basel, Switzerland. This article is an open access article distributed under the terms and conditions of the Creative Commons Attribution (CC BY) license (https://creativecommons.org/licenses/by/4.0/).
Share and Cite
MDPI and ACS Style
Singh, H.P.; Alhamad, I.A. A Novel Categorization of Key Predictive Factors Impacting Hotels’ Online Ratings: A Case of Makkah. Sustainability 2022, 14, 16588. https://0-doi-org.brum.beds.ac.uk/10.3390/su142416588
AMA Style
Singh HP, Alhamad IA. A Novel Categorization of Key Predictive Factors Impacting Hotels’ Online Ratings: A Case of Makkah. Sustainability. 2022; 14(24):16588. https://0-doi-org.brum.beds.ac.uk/10.3390/su142416588
Chicago/Turabian StyleSingh, Harman Preet, and Ibrahim Abdullah Alhamad. 2022. "A Novel Categorization of Key Predictive Factors Impacting Hotels’ Online Ratings: A Case of Makkah" Sustainability 14, no. 24: 16588. https://0-doi-org.brum.beds.ac.uk/10.3390/su142416588
Note that from the first issue of 2016, this journal uses article numbers instead of page numbers. See further details here.