Article

Risk of Salinization in the Agricultural Soils of Semi-Arid Regions: A Case Study from Moldavian Plain (NE Romania)

by
Cristina Oana Stan
1,2,*,
Radu Gabriel Pîrnău
2,*,
Bogdan Roșca
2 and
Doina Smaranda Sirbu-Radasanu
1
1
Department of Geology, Faculty of Geography and Geology, “Alexandru Ioan Cuza” University of Iași, 20A ‘Carol I’ Blvd, 700505 Iași, Romania
2
Geographic Research Center, Iași Branch, Romanian Academy, 8 ‘Carol I’ Blvd, 700505 Iași, Romania
*
Authors to whom correspondence should be addressed.
Sustainability 2022, 14(24), 17056; https://0-doi-org.brum.beds.ac.uk/10.3390/su142417056
Submission received: 30 November 2022 / Revised: 14 December 2022 / Accepted: 16 December 2022 / Published: 19 December 2022
(This article belongs to the Special Issue Assessment and Monitoring of Land Degradation)

Abstract

:
In the present study, the salinization trends of different soil types from a small hydrographic basin situated in NE Romania (Roșior basin) are investigated. The climatic conditions are favorable for long dry summers and intensive evaporation. The soils are developed on immature evolved clay sediments, as revealed by geochemical analysis. The salinity varies among soil types, attaining maximum values for Solonetz with total dissolved salts (TDS) between 1165.75 to 1881.25 mg/L. The aqueous solutions are represented by natural water and soil solution. The hydrogeochemical facies of the natural waters change from HCO3—Mg2+ in the upper basin to SO42−—Na+ in the middle or lower basin. The soil solution is moderately or strongly salinized and shows anionic variations from HCO3 to SO42− in the studied profiles, whereas Na+ is always the main cation. The concentrations of Na+ and SO42− evolve simultaneously. Raman spectroscopic exploration of the white efflorescences, which occur on topsoil, reveals the presence of thenardite as the dominant phase. The composition of soil solution results from both the ionic exchange and evaporation processes. The nature of soil solution mineralization and summer temperatures are two main factors that interact and promote the thenardite precipitation. The soil salinization induces negative effects on crop nutrition, impacting further the crop yields. The results of this study can be extrapolated to larger areas formed on Sarmatian sedimentary deposits affected by salinization processes.

1. Introduction

At the global level, humanity’s food and water needs represent an issue that has become more acute in the context of climate change. Although the annual population growth rate had slightly decreased from 1.1% per year in 2010 [1] to 1% in 2022 (World Population Growth Rate 1950–2022), food production must increase by 57% until 2050 [2]. Moreover, the exploitation of water resources for human consumption, agriculture, or industry has intensified and responsible consumption is required [3,4]. In this context, the quality of soils and water used for irrigation sets a strain on agricultural production.
Environmental factors such as a reduction in the amount of precipitation, rising temperatures, increasing evapotranspiration, or soil degradation through salinization influence the ability of plants to absorb nutrients from the nutritional environment [5]. In the case of crops, this is reflected in a quantitative and qualitative decrease of the yield.
Salinization is the process that leads to the accumulation of salts more soluble than gypsum (CaSO4 × 2H2O) in the soil [6,7,8] above a level that puts agricultural crop productivity at risk and impacts environmental and human health and economic prosperity [2,9].
Soils with high salt content are classified using the following parameters: pH, electrical conductivity (ECe), sodium absorption ratio (SAR), and exchangeable sodium percentage (ESP). All these parameters are determined in the saturation extract, but SAR and ESP may be estimated from the concentrations of the dissolved cations [10]. Three types of soils have been defined [2,7,11]: (i) saline soils (with pH < 8.5, EC > 4 dS/m, SAR < 13 mmol/L and ESP < 15%); (ii) sodic soils (pH > 8.5, EC < 4 dS/m, SAR > 13 mmol/L and ESP > 15%), and (iii) saline-sodic soils, the last category displaying the characteristics of both saline and sodic soils. Also, the process of soil salinization occurs when the total soluble salts content exceeds 100 mg/100 g soil if the salinization is of the chloric type, or if it is greater than 150 mg/100 g soil if the salinization is of the sulfate type [12].
Mineralization of natural water interacting with the soil layer is a primary source of salinization. The salt enrichment of groundwater is determined by various factors, such as the dissolution of secondary minerals from the lithological substrate, ion exchange reactions, evapotranspiration, an input of saline water from neighboring aquifers, land use, irrigation waters, or anthropic input. Frequently, an increase in the salt concentration of groundwater is a consequence of a combination of the factors above, having harmful effects on crops through the accumulation of large amounts of salts, which cannot be tolerated by plants [13,14]. Other sources of salinization (secondary) of soil are due to human activities such as agriculture, irrigation, and intensive and improper land use [5,15,16,17].
The relationship between soil salinization and groundwater mineralization has been studied in different regions by various methods: in situ experiments [18]; studying the physical and mineralogical characteristics of the soil [19,20]; modelling the dynamics of groundwater that affect salt migration [21]; or comparing the spatial distribution of groundwater chemistry and soil salt content [22].
In Northeast Romania, studies were carried out on the impact of climate change on groundwater level [23,24,25] or the physical degradation of the soil [26,27] but there is limited information in the literature about the geochemistry of salinized soils and the relationships between them and the parental materials on which they evolved.
The main objectives of the present study are the following: (i) the evaluation of the interactions between sediments, soil, and aqueous solution; (ii) the assessment of soil salinization; (iii) the impact of saline efflorescence on plant life and soil quality.

2. Materials and Methods

2.1. Study Area

With an area of 18.3 km2 Roșior river basin is a left tributary of the Bahlui river situated in North-Eastern Romania (Figure 1). Over time, the river has undergone hydrotechnical works on its upper course and is currently intermittent on its middle and lower courses due to the low flow. Geologically, the studied area belongs to the central-eastern part of the Moldavian Platform and is characterized by the occurrence of the Lower Bassarabian (Sarmatian age) and Quaternary deposits. Sarmatian deposits consist of silty clays, sandy-clayey silts, and clayey silts [28,29]. Pleistocene deposits have a limited occurrence in the upper part of the terraces and are composed of sand and silt [29].
The genesis of the relief was linked to a geotectonic, fluvio-denudational process and “pre-existing marine” factors [30], which materialized through the accumulation, in the Moldavian Platform, of the “clay with Cryptomactra” formation of Middle Sarmatian age (Bassarabian) with a high content of soluble salts.
The direction of groundwater flow is conditioned by the quasi-horizontal slope of the sedimentary cover from NW to SE. The phreatic water is contained in the discharge hydro-structure of the terrace alluvial deposits and is fed by precipitation and surface waters.
The mean annual temperature is 9.9 °C and the mean annual precipitation is 589 mm, based on annual averages for the period 1961–1990 (the reference climatologic interval used in Romania), recorded at the nearby Iași meteorological station (Figure 2a). Although the climatic data over the period 1961–1990 does not highlight a typical semi-arid character of this area, the temperature anomalies calculated for the 1990–2021 interval (Figure 2b) show that the climate is already shifting towards semi-arid (steppe) conditions corresponding to BSk climate type in Köppen-Geiger classification [25,31].
The climatic conditions, as well as the lithological structure and moisture variation caused by the oscillation of the groundwater, have allowed the formation of a wide range of soils specific to steppe areas. Thus, the dominant soils that cover the interfluves are represented by Calcic Chernozems (Cambic), while on the steeper slopes they occur in association with Salic Chernozems and Solonetz, often affected by erosion and landslide processes. The low-elevation areas of the basin represented by the narrow valleys are occupied mainly by Salic and Sodic Fluvisols and Gleysols (soil names according to [10]).
Halophilic species are found in the spontaneous vegetation (Suaeda maritima, Artemisia sp., Portulacaceae sp.).

2.2. Sampling and Methodology

A total of 142 samples were collected as follows: 20 from the topsoil (0–10 cm interval) from a cross-section over the Roșior riverbed, where efflorescences occur; 122 from the soil profiles at specific depths of 0–20 cm, 20–40 cm, 40–60 cm, and 60–80 cm. The lithological substrate was investigated through 8 samples collected from the “clay with Cryptomactra” formation. The sampling method for soil and sediments was based on [32] procedure. Approximately 500 g of soil was collected in sampling bags, labelled at each sampling point, and delivered to the laboratory. Also, 12 water samples were taken in September 2021 and 2022, respectively, from the Roșior river and the well. Water was collected from each sampling point in two 500 mL polyethylene bottles [33]. Temperature, pH, electrical conductivity, and total dissolved solids (TDS) were measured on-site.
The water content of the soil samples was obtained gravimetrically after drying 10 g of the soil in an oven for 48 h at 105 °C. The remaining soil and sediment samples were air-dried at room temperature. Following drying, the samples were crushed and passed through a 2 mm sieve.
The pH of the soil samples was determined through the potentiometric method, in aqueous suspension with a glass electrode using a WTW Inolab 730 MultiLevel pH meter, the ratio between soil and distilled water being 1:2.5, after shaking and resting for 1 h. The pH meter was calibrated with buffer solution after each set of 10 determinations. Soil to water ratio of 1:5 has been used to prepare the soil solution and determine the ion concentration and the EC value of the soil after stirring, resting time, and filtration [34]. The electrical conductivity (EC) was determined through the conductimetric method, in aqueous suspension with a Crison EC-meter GLP 31+ conductometer.
Particle-size analysis was carried out by pipetting method [32] after the removal of the organic matter with 30% H2O and carbonates with 0.2 N HCl. The texture of soil and sediment samples was established according to [10].
The chemical analyses conducted on the sediment samples were performed at the Romanian Geological Institute. The major ions content of the natural waters and the soil solution was determined through the analytical method, using the national standards (Na+, K+ through the flame photometric method: SR ISO 9964-3:1993; Ca2+, Mg2+ through the complexometric method: SR ISO 6059-2008; HCO3, CO32− by titration with HCl: SR ISO 9963-1:2002; SO42− through the spectrophotometric method HACH 8051; and Cl through the titrimetric method with AgNO3 O.1 N ISO 9297-2001).
Mineralogical analysis of the saline efflorescence was done by Raman spectrometry. Raman spectra were obtained on a Horiba Jobin-Yvon RPA-HE 532 spectrograph by exposing the samples for 3 s, 100 acquisitions, at 100% maximum laser power.

2.3. Geochemical Indices

Sediment maturity was determined using the index of compositional variability (ICV). ICV decreases from non-clay minerals to clay minerals. Immature sediments have ICV greater than 1, while mature sediments typically show ICV lower than 1 [35,36]. The oxides are expressed in wt%.
ICV = (Fe2O3 + K2O + Na2O + CaO + MgO + TiO2)/Al2O3
To estimate the degree of chemical alteration of the sediments, we used the ternary diagrams Al2O3-(CaO + K2O + Na2O)-(Fe2O3 + MgO) [A-CNK-FM], Al2O3-(CaO + Na2O)-K2O [A-CN-K] and the Chemical Index of Alteration (CIA). This index is based on the alteration of feldspars, the release of alkali metals, and the accumulation of alumina in the reaction products [37]. The CIA is calculated based on the molar concentration of the oxides, but the CaO content combined with carbonates or phosphates have been excluded. The CIA reflected the evolution of chemical alteration in the source area [38,39].
CIA = [Al2O3/(Al2O3 + CaO + Na2O + K2O)] × 100
The cation-chloride ratio (CCR) index in correlation with Cl/(Cl +HCO3) showed the process that affects the mineralization of the aqueous solution. The CCR index reflected changes in major cation concentrations (in meq/L) relative to chloride concentration [40,41]:
CCR = [(Ca2+ +Mg2+)/Cl]–[(Na+ + K+)/Cl]
The sodium adsorption ratio (SAR) was calculated from soil solution data (cations given in meq/L): SAR = Na+/[(Ca2+ + Mg2+)/2] 0.5 (mmol/L) [10,34].

3. Results

3.1. Sediments and Soil Texture

The particle size distribution of the sediments and soil samples is graphically represented in Figure 3. The water condition from the Middle Sarmatian age allowed the accumulation of clay and silt with sandy intercalation. This was observed in the sediment samples where the clay fraction was dominant. Two samples belonged to the silty clay sediments because they had a high content of silt and carbonates. Soil texture varied from clay to clay-loam, sandy clay loam, and loam, reflecting the lithological substrate on which pedogenetic processes took place.

3.2. Sediment Geochemistry

The chemical composition of the sediment samples from the hydrographic basin of the Roșior river is presented in Table 1. The sediments displayed a homogeneous content for SiO2 (between 50.15 wt% and 52.90 wt%) and relatively varied concentrations for Al2O3 (11.95–21.55 wt%) and Fe2O3 (3.68–6.32 wt%). The SiO2/Al2O3 ratio varied from 2.34 to 4.42 and was lower than in the Upper Continental Crust (UCC) [41]. The relatively low silica content (the average value of SiO2 is 52.06 wt%) and the low value of the SiO2/Al2O3 ratio suggest proximity to clayey rocks, in which the quartz component has a moderate frequency. The amount of Na2O and K2O varied from 0.8 wt% to 1.43 wt%, and from 1.45 wt% to 2.17 wt%, respectively.
The Pearson correlation coefficients between SiO2 and the other oxides were weak and negative, except TiO2, which had a moderate positive correlation (r = 0.68). The correlation trends between Al2O3 and Fe2O3 (r = 0.89) or Al2O3 and MnO (r = 0.81) could be related to the same source (e.g., oxyhydroxides coating on clay mineral particles) [42].
These clays were enriched in MgO and showed a positive correlation between MgO and Na2O (r = 0.62), indicating a common source. The sources of calcium can be represented as either a mineral fraction or bioclastic fraction and brought high CaO content. Consequently, the correlation between CaO and MgO (r = 0.23) was disturbed.
The moderate correlation between MgO and Na2O (r = 0.62) may indicate an enrichment process of clay minerals in magnesiu, due to Mg accommodation in the octahedral site in clay minerals (montmorillonite) [43].
CIA values ranged from 67.25 to 83.91, with a mean of 74.74, indicating a moderate alteration of the primary clay material [41,44]. Thus, the samples were projected in the smectite field (Figure 4).
In the A-CNK-FM and A-CN-K diagrams, the samples were projected onto an area showing different concentrations of Al2O3, CaO, Na2O, and K2O, compared to the UCC values. It was observed that alteration had reached the stage where significant concentrations of the alkaline and alkaline earth elements had been removed from the sediments. An enrichment in Fe2O3 and MgO of the sediments was also found. The Mg/(Fe2+ +Fe3+) ratio [45] was below 1 and the inverse proportionality relationship with Al2O3 can be explained by changing the quantitative ratio between the smectites and illite present in the clay fraction [28].
ICV for the sediment samples from the Roșior basin ranged from 0.7 and 1.24, thus being at the borderline between mature and immature sediments (Figure 5). Consequently, we used the SiO2/Al2O3 ratio as an indicator of sediment maturity. If this ratio exceeded 5, then the sediment had a mature composition [35]. In our case, the values of this ratio were between 2.34 and 4.42, indicating the immaturity of the sediment samples.

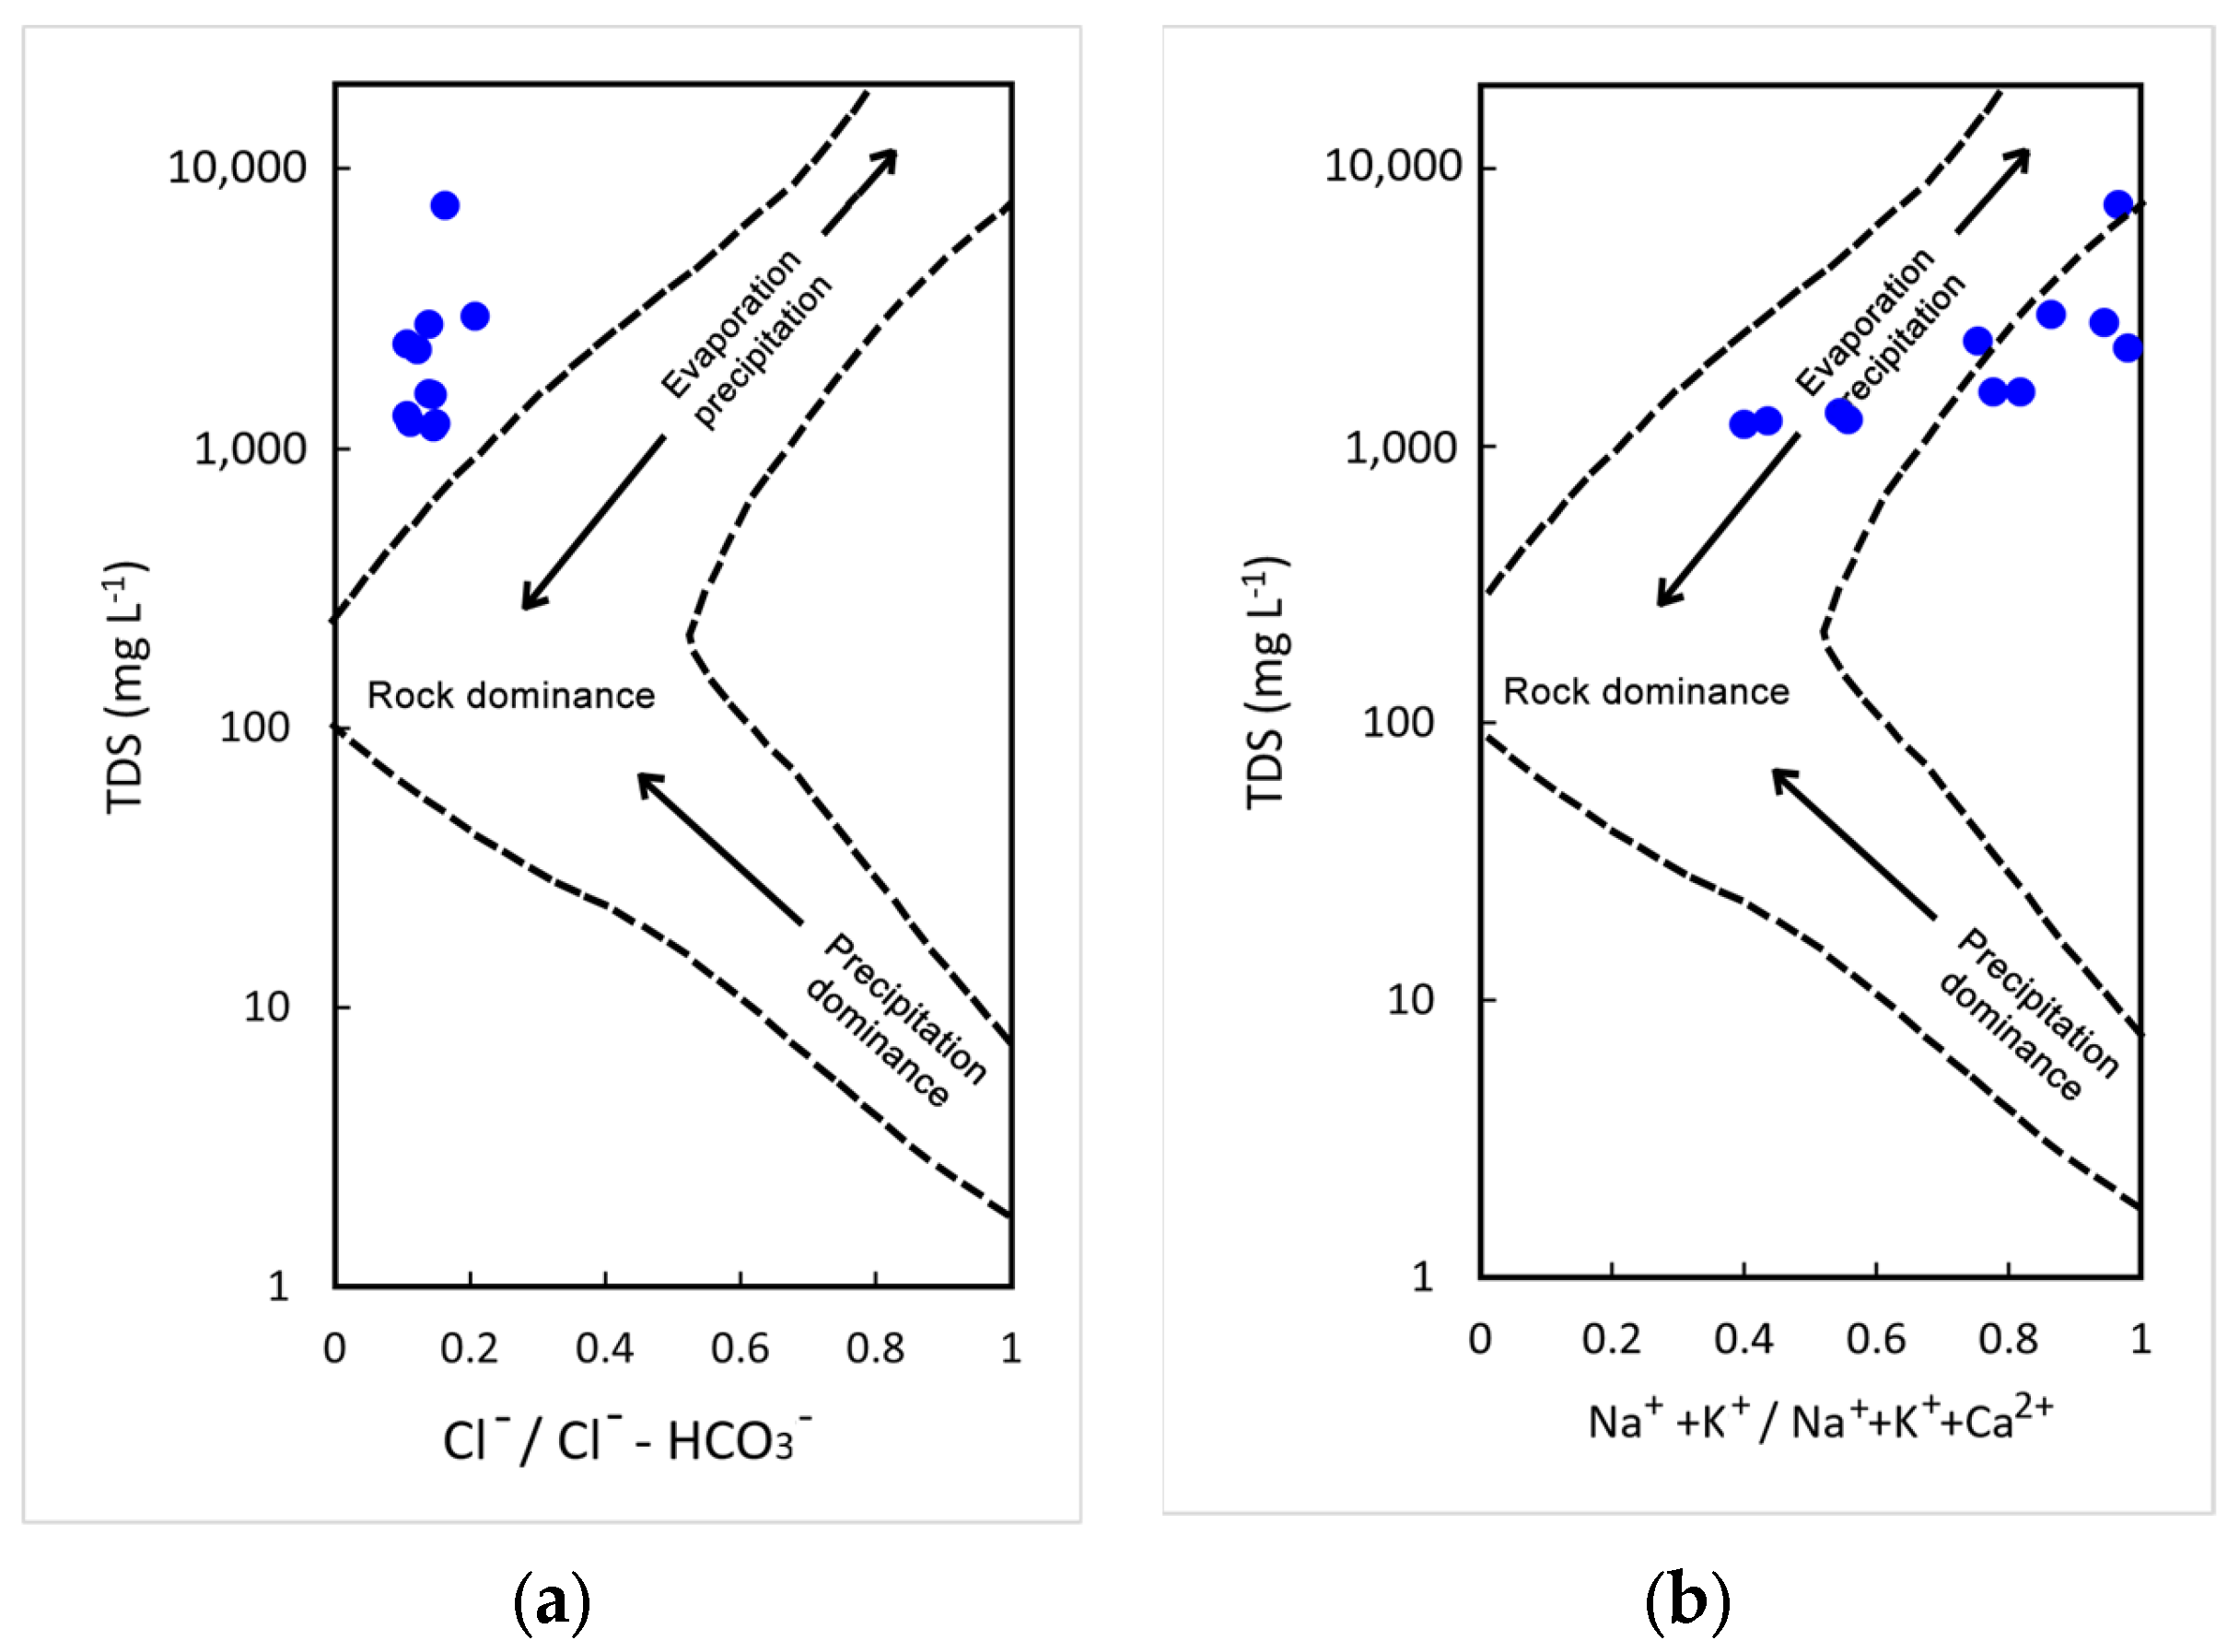
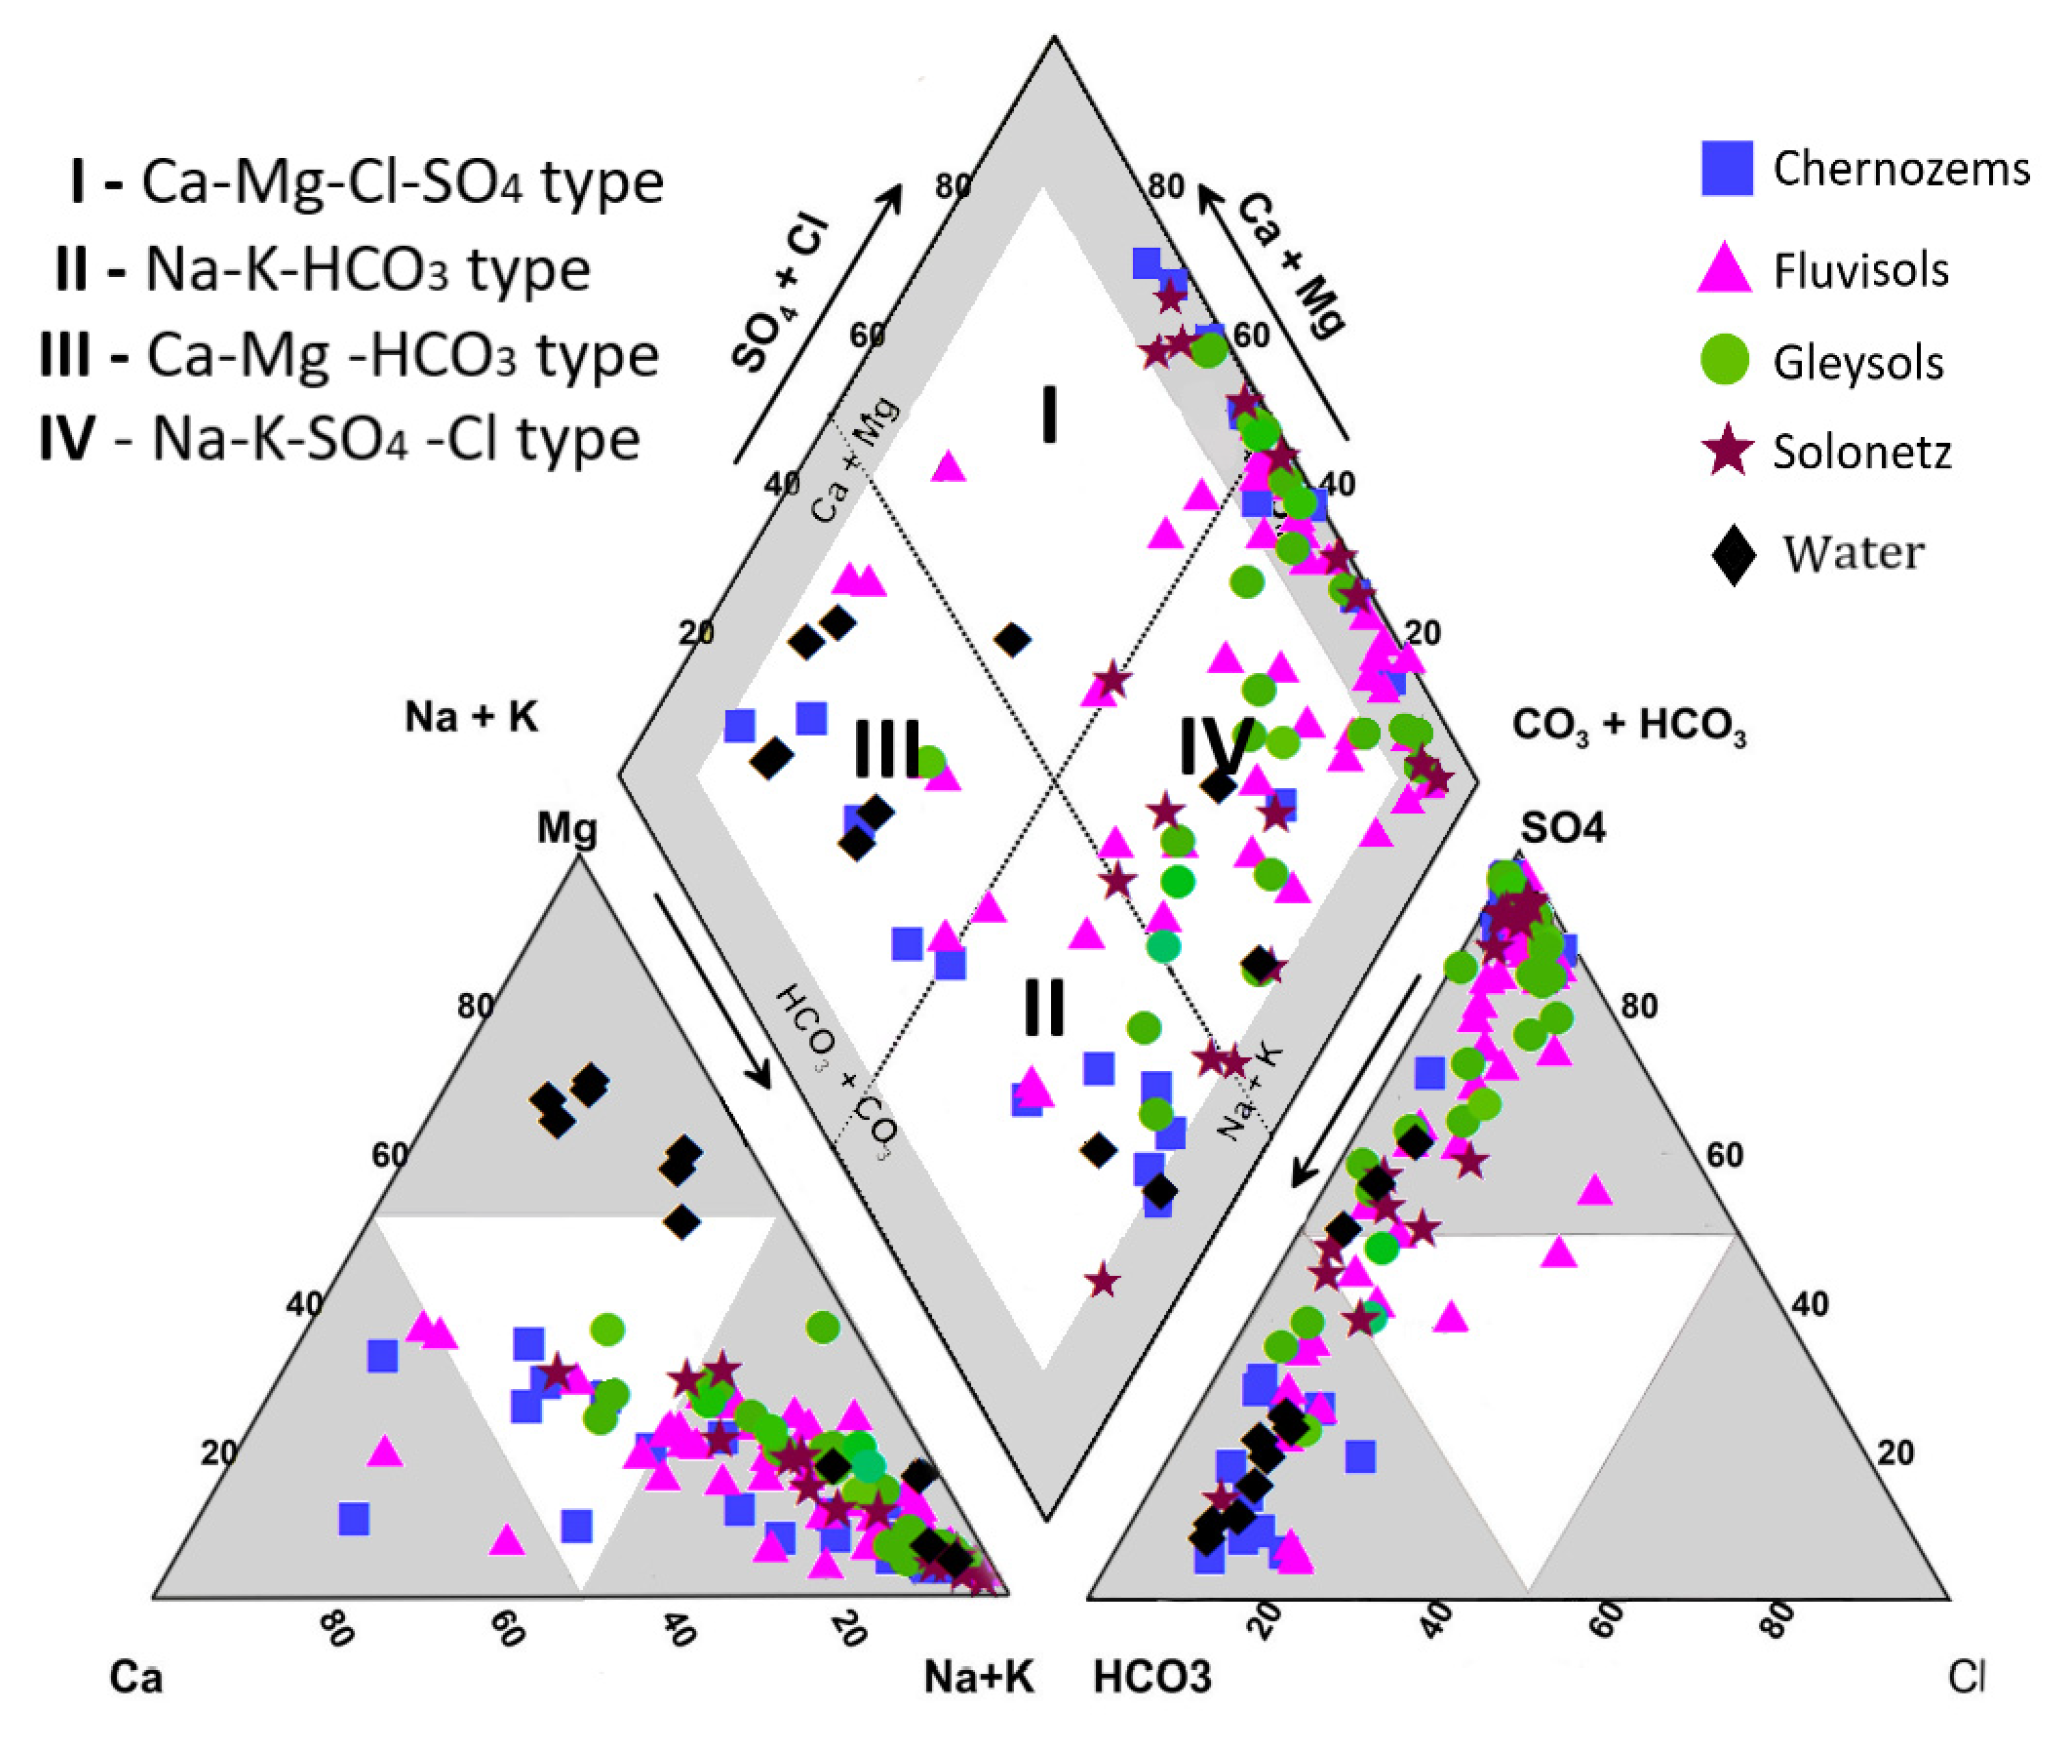
3.3. Geochemistry of the Aqueous Solutions

Aqueous solutions are the environments in which substances from chemical or biochemical processes are dissolved and in which there is an exchange with the atmosphere, hydrosphere, and pedosphere [46,47]. In this study, we considered as “aqueous solution” the natural water and soil solution.
The chemical constituents of the waters from the study area came from the residual salts that had been retained by the sediments of the Sarmatian Sea and washed away by the circulating waters. The retention capacity was proportional to the accentuation of the clayey character of the Sarmatian sediment. In the fraction larger than 0.063 mm, the presence of pyrite was indicated, which was the origin of the gypsum neoformations in this clay-silt unit [28].
The changes that occur over time in the chemistry of these waters are caused by the process of drainage, the absorption process, and the exchange of ions between clay and water. The establishment of the chemical composition of the waters in the study area allowed the identification of their origin and of the geochemical processes that occurred at the water-rock or water-soil interfaces. The water samples were alkaline, with a pH varying between 7.24 and 9.42, and highly variable EC1:5 between 0.814 and 7.660 dS/m. Total dissolved solids (TDS) ranged from 1190.5 mg/L to 2971.8 mg/L, which allowed them to be classified as brackish water (TDS > 1000 mg/L) [46]. In September 2022, the highest recorded value of 7380.2 mg/L was found in an artificial reservoir. The excessive drought from the summer of 2022 led to increased mineralization. Also, an increase in the value of TDS was observed for both surface water and groundwater, from north to south, in the direction of the river’s flow. This variation was mainly attributed to geochemical reactions that occurred between aqueous solutions and the solid phase.
The main ions (Na+, Ca2+, Mg2+, HCO3, SO42−, Cl) had variable concentrations (Figure 6) due to the leaching of the salts stored in clay or silty-clay sediments, being the result of the ion exchange processes between water and clay minerals, or a secondary product of the alteration of metalliferous minerals (pyrite) present in very small amounts in the silt fraction [28]. The anion evolution of the waters showed a transition from the dominant anion HCO3 in surface water and the phreatic water of the upper basin of the Roșior river to the SO42− type in the waters situated in the middle and the lower part of the hydrographic basin. Also, in the cationic evolution of waters, there was a transition from dominant Mg2+ to Na+.
We used Gibbs diagrams to clarify what factors influenced the water mineralization (Figure 7). The samples with Cl/(Cl + HCO3) < 0.4 showed the influence of the ion exchange process on the source of mineralization of the waters. The relation between TDS and the Na+/(Na+ + Ca2+) ratio indicated evaporation and precipitation as the main processes.
In the soil solution, pH values (between 7.1 and 9.8) showed an alkaline reaction but varied in depth from one soil type to another (Table 2). The concentration of the major ions allows the following sequences: SO42− > HCO3 > Cl and Na+ > Mg2+ > Ca2+.
In Solonetz, an increase in Na+ concentration from the samples collected below 60 cm to the topsoil was noted. An inverse situation was recorded in Chernozems, Gleysols, and Fluvisols. SO42− had the highest values in the lower part of Gleysol, where moisture was present, compared to Solonetz, which appeared in the upper horizon. The total of soluble salts varied with depth and was proportional to EC values. The highest salinity (EC1:5 = 15.32 dS/m) was found in Solonetz and was inversely proportional to depth, while other soils had higher EC values in the lower horizons. The soils in which water stagnated due to the development on clays parental material, preventing proper drainage, showed an enrichment of hydrolysed ions in the soil solution.
The Piper diagram was used to determine the hydrogeochemical facies. Surface waters belonged to the Mg2+-HCO3 and Na+-HCO3 types, while Na+-SO42− types characterized the groundwater (Figure 8).
For the Chernozems, there were different types of soil solutions. In the layer between 0–20 cm, where there were better conditions for aeration and the exchange with atmospheric gases, the soil solution was Ca2+-HCO3 or Na+-HCO3. In deeper layers, this changed in Na+-SO42− and Ca2+ -SO42− types. The same tendency was observed in Fluvisols, but in deep horizons, Ca2+-SO42− was missing. In some Gleysols, Mg2+-HCO3 or Mg2+-SO42− types occurred in the upper layer, but in general, the soil solution was Na+-SO42− type. In Solonetz, the soil solution was Na+-SO42− type for all profiles, with some exceptions such as on the top layer where it was Na+-HCO3 type.
The CCR index vs. Cl/(Cl + HCO3) diagram [31] that allows the identification of hydrogeochemical processes was also used for the soil solution to assess the evolution of the chemistry as the two environmental components–water and soil–interact. Data projection allowed the differentiation between aqueous solutions directly influenced by contact with the atmosphere (the Ca2+-Mg2+-HCO3 or Na+-HCO3 types) and aqueous solutions whose chemistry was directly influenced by the solubilization of salts from sedimentary environments (the Na+-SO42−-Na+-Cl type) (Figure 9).

3.4. Saline Efflorescence

Samples collected from the topsoil, transversal on the riverbed, showed that pH, EC1:5, and TDS parameters vary widely. Thus, pH varied from weak to strong alkaline and EC1:5 had values between 0.19 and 4.93 dS/m. Electrical conductivity in soil saturation extract (ECe) was estimated by EC determined in 1:5 soil water ratio suspension, using a conversion factor (f) for a different type of soil texture [34]: Ece = f EC1:5. For clay, the soil factor was 7.19 and for the loamy soil, the soil factor was 7.62 (Table 3).
There is a classification of soils into four classes of salinization [18]: non-salinization soils (<1 g/salt content), weak salinization soils (1–2 g/kg), medium salinization soils (2–4 g/kg), and strong salinization soils (>4 g/kg). The analyzed topsoil samples varied from non-salinization to strong salinization soils, with a TDS value between 0.892 and 22.69 g/kg. The medium and strong salinization soils were found in the minor bed of the Roșior river or, locally, on the slope area, being influenced by the geomorphological, hydrological, or climatic conditions.
The daily manifestation of soil salinization lies in the appearance of efflorescence in the form of crusts or powder, the thickness of which depends on climatic conditions (Figure 10). Saline efflorescence appears especially in small depressionary zones that have exposure to the south or west. Higher EC values were also found for the topsoil samples collected from the slope of the hill, but they did not display efflorescence, only halophilic flora (Arthemisia sp., Suaeda maritima).
The Raman spectra obtained on the saline efflorescence indicated the presence of anhydrous sodium sulfate (thenardite). An example of the Raman spectra type can be seen in Figure 11, while the comparative data from the other studies are presented in Table 4.
The sulfate had a simple chemical structure and consisted of tetrahedral sulfate groups whose O atoms were coordinated with interstitial cations [49]. A very good correlation can be observed between our measured data and the literature [48,49,50,51]: the four modes of vibration of sulfate tetrahedral oxyanion occur at 992–993.2 (ν1–symmetric stretching), 451–466.6 (ν2–symmetric bending), 1102.1–1178 (ν3–antisymmetric stretching), and 620–647.2 (ν4–antisymmetric bending). For our samples, the Raman spectra corresponded to Na2SO4, with spectral signature features showing a strong peak at 992 cm−1 for ν1, which in turn corresponded to the symmetric stretches of the S-O4 tetrahedron. Other signals were at 461/480 cm−1 for ν2, at 1101/1129/1150 cm−1 for ν3, and at 626/645 cm−1 for ν4. The absence of the characteristic signal between H and O in water argues for the presence of thenardite and other polymorphs (e.g., mirabilite).

4. Discussion

The geochemical composition of the aqueous solutions and the sediments on which soils have evolved in the Roșior area are strongly influenced by current climate change, where evaporation exceeds precipitation and the chemical weathering of the parent material is more intense as the temperatures rises. The temperature anomalies recorded for the 1961–2021 interval (Figure 2b) reflect an accentuated tendency of aridization, especially in the last two decades, which are marked only by positive anomalies that led to a higher rate of soil salinization.
These conditions affect the geochemical balance of the environment and are conducive of the primary salinization and sodification of the soil.
In the CIA-A-CN-K diagram, all sediment samples were plotted close to the Al2O3-CaO + Na2O joint, reflecting the high abundance of smectite minerals in the clay fraction. Also, these sample positions denoted a contribution of plagioclase to clay generation. The incongruent dissolution of plagioclase could be the main source of sodium over time.
The CIA and ICV indices showed that the silty-clay and clay, being immature sediments with a moderate weathering of the primary material, released soluble cations such as Na+, Ca2+, or Mg2+, which were transferred to the groundwater or the soil solution. As the weathering and pedeogenetic processes advanced, the soil layer thickness increased, and the underline clay sediments hindered the movement of mineralized water and progressively accumulated in the soil.
In the climatic conditions of the study area, the cations tended to remain in the exchangeable soil complex, or to precipitate as salt minerals. The less soluble salt (calcium and magnesium carbonates) was precipitated in the first stages of saturation of the soil solution. Thus, the concentration of Na+ exceeded the concentration of Ca2+ or Mg2+ in the soil solution, and a replacement of some exchangeable cations by Na+ on the exchange complex of soil occurred [9].
The quality of water from the upper river source was good, with a low salt content (EC 0.814–3.25 dS/m), while the water from artificial accumulation situated on the middle river course had poor quality because of leaching and drainage of the salt soil to the valley. In the Gibbs diagram and CCR index vs. Cl/(Cl +HCO3) (Figure 9) the samples’ positions reflect the climatic influences on water mineralization.
Cl/SO42− ratio was used to determine the type of soil salinization [12,52]. In the study area, the concentrations of sulfate ions were higher than chloride ions, and therefore the value at this ratio was below 1, which suggests the soil salinity is sulfate.
During the summer season, due to high evaporation processes, the soil solution tended to be more concentrated and the salts that were more soluble than gypsum precipitated. This situation determined the variations of the salinity parameters, which can affect the dynamics of pedogenetic processes. Sodium salts are often found in the early stages of salinization [7]. Because the salinity was due to the presence of sodium salts, it can lead to the development of sodic soil or saline-sodic soil. In this situation, the values of the SAR index must exceed 13 mmol/L. The samples analyzed with this characteristic showed a variation between 13.43 and 48.69 for the SAR index.
According to soil salinity parameters (pH, ECe, SAR and ESP), there was 9.83% saline soil, 14.75% saline-sodic soil, and 13.11% sodic soil in the investigated area. These soils occurred at the foot of the slope and on valley floors, where the water table makes the soil saline. Due to the deficit of precipitation, the amount of water was not sufficient to leach the salt accumulated below the root zone into the aquifer.
The high content of clay in soil, caused by lithogenic factors, influenced the water infiltration and aeration of the root zone. The chemistry of the soil solution was influenced by the ion exchange process that was produced between cations (mono and divalent) and clay minerals. These minerals presented a negative charge at the surface that was compensated by the positive charge of cations [9].
Thenardite (Na2SO4) occurs in evaporitic deposits in arid regions, very commonly as crusts and efflorescence [53]. The monomineralic character of saline efflorescence is determined by the regulation of the salinity and its constant maintenance at a certain degree of saturation in salt, which allows the precipitation of the same minerals. This is possible when there is a constant supply of water in the sediment environment; when the concentration increases through evaporation, under a restrictive hydrodynamic regime; or through the output of a part of the solution that becomes hypersaline through infiltration into the sediments.
The sulphate was mobilized by dissolving the gypsum crystals present in the clays with Cryptomactra or was a product of the alteration of the pyrite present in the silty fraction [23]. The consequences of the salinization of these soils are manifested in crops, which have reduced productivity due to the blocking of nutrients at the root level by the salt [54].
The presence of Na+ in the soil profile causes lower water infiltration, hardening, sealing, and poor aeration of the root zone and prevents root growth [55]. These factors reduce the plant’s ability to absorb water and inhibits plant growth through an osmotic effect that limits the water potential for soil and plant roots [2,9]. The crops have lower than normal vegetative emergence, with variable plant heights (Figure 12).

5. Conclusions

The lithology-soil-water system can be observed through the correlation between the mineralization of aqueous solution that interacts with the solid component of the system and their chemical composition.
The salinization and the sodicity process affect a wide variety of areas under semi-arid conditions associated with the steppe environment. In the Roșior area, the primary salinization of soil is linked to the chemical composition of sediments, the oscillation and mineralization of the groundwater, or the infiltration of water with the salt from the topsoil under lower horizons of soil.
A share of 37.69% of soil samples showed salinization and/or sodicity, so the soil with ECe below 4 dS/m may limit the yields of higher sensitive crops.
The use of water for irrigation from the artificial accumulation source is not recommended, because of its high EC value.
The Raman spectra are effective tools for determination of salt efflorescence mineralogy, which revealed, in our study, the presence of thenardite.
To reduce the negative effect of salinization on crops it is necessary to use conservation agricultural practices such as crop rotation, to manage the fertilization scheme efficiently, and to select crops that can be adapted to the soil conditions.

Author Contributions

Conceptualization, C.O.S. and R.G.P.; methodology, C.O.S. and R.G.P.; software, B.R.; validation, C.O.S., R.G.P. and D.S.S.-R.; formal analysis, R.G.P.; investigation, C.O.S. and R.G.P.; resources, C.O.S., R.G.P. and D.S.S.-R.; writing—original draft preparation, C.O.S., R.G.P. and B.R.; writing—review and editing, C.O.S.; visualization, R.G.P.; supervision, C.O.S. All authors have read and agreed to the published version of the manuscript.

Funding

This work was supported by a grant of the Ministry of Research, Innovation and Digitization, CNCS–UEFISCDI, project number PN-III-P4-PCE-2021-1350, within PNCDI III.

Data Availability Statement

The data presented in this paper are available on request.

Acknowledgments

The authors gratefully acknowledge to Geological Institute of Romania for access to chemistry analyses. Also, the authors are thankful to Nicolae Buzgar for access to Raman spectrometer at Geology Department, UAIC.

Conflicts of Interest

The authors declare no conflict of interest.

References

  1. Lee, R. The outlook for population growth. Science 2011, 333, 569–573. [Google Scholar] [CrossRef] [PubMed] [Green Version]
  2. Rengasamy, P. World Salinization with Emphasis on Australia. J. Exp. Bot. 2006, 57, 1017–1023. [Google Scholar] [CrossRef] [PubMed] [Green Version]
  3. Negacz, K.; Malek, Z.; de Vos, A.; Vellinga, P. Saline soil worldwide: Identifying the most promising areas for saline agriculture. J. Arid Environ. 2022, 203, 104775. [Google Scholar] [CrossRef]
  4. Vasantha, S.; Venkataramana, S.; Rao, P.N.G.; Gomathi, R. Long term salinity effect on growth, photosynthesis and osmotic characteristics in sugarcane. Sugar Tech 2010, 12, 5–8. [Google Scholar] [CrossRef]
  5. Pessoa, L.G.; Freire, M.B.d.S.; Green, C.H.; Miranda, M.F.; Filho, J.C.d.A.; Pessoa, W.R. Assessment of soil salinity status under different land-use conditions in the semiarid region of Northeastern Brasil. Ecol. Indic. 2022, 141, 109139. [Google Scholar] [CrossRef]
  6. Tόth, G.; Adhikari, K.; Bόdis, K. Updated map of salt affected soils in the European Union. In Threats to Soil Quality in Europe, 1st ed.; Tόth, G., Montanarella, L., Rusco, E., Eds.; European Commission, Joint Research Center: Ispra (VA), Italy, 2008; pp. 61–74. [Google Scholar] [CrossRef]
  7. Choudhary, O.P.; Kharche, V.K. Soil salinity and sodicity. In Soil Science: An Introduction; Rattan, R.K., Katyal, J.C., Dwivedi, B.S., Sarkar, A.K., Bhattacharya, T., Tarafdar, J.C., Eds.; Indian Society of Soil Science: New Delhi, India, 2018; pp. 352–384. [Google Scholar]
  8. Andrade, G.R.P.; Furquim, S.A.C.; Nascimento, T.T.V.; Brito, A.C.; Camargo, G.R.; de Souza, G.C. Transformation of clay minerals in salt-affected soils, Pantanal wetland, Brazil. Geoderma 2020, 371, 114380. [Google Scholar] [CrossRef]
  9. Stavi, I.; Thevs, N.; Priori, S. Soil Salinity and Sodicity in Drylands: A review of causes, effects, monitoring, and restoration measures. Front. Environ. Sci. 2021, 9, 712831. [Google Scholar] [CrossRef]
  10. IUSS Working Group WRB. World Reference Base for Soil Resources 2014, Update 2015. International Soil Classification System for Naming Soils and Creating Legends for Soil Maps; World Soil Resources Reports No. 106; Food and Agriculture Organization of the United Nations: Rome, Italy, 2015. [Google Scholar]
  11. Haj-Amor, Z.; Araya, T.; Kim, D.-G.; Bouri, S.; Lee, J.; Ghiloufi, W.; Yang, Y.; Kang, H.; Jhariya, M.K.; Banerjee, A.; et al. Soil salinity its associated effects on soil microorganisms, greenhouse gas emissions, crop yield, biodiversity and desertification: A review. Sci. Total Environ. 2022, 843, 156946. [Google Scholar] [CrossRef]
  12. Florea, N.; Munteanu, I.; Rusu, C.; Dumitru, M.; Ianoș, G.; Răducu, D.; Rogobete, D.; Țărău, D. The Romanian Soil Taxonomy System (SRTS-2012); SITECH: Craiova, Romania, 2012. (In Romanian) [Google Scholar]
  13. Paula, R.R.; Calmon, M.; Lopes-Assad, M.L. Soil organic carbon storage in forest restoration models and environmental conditions. J. For. Res. 2022, 33, 1123–1134. [Google Scholar] [CrossRef]
  14. Lu, C.; Zhai, C.; Liu, J. Increased salinity and groundwatee level led to degradation of the Robina pseudoacacia forest in the Yellow River Delta. J. Ror. Res. 2022, 33, 1233–1245. [Google Scholar] [CrossRef]
  15. Lisetskii, F.N.; Goleusov, P.V.; Chepelev, O.A. The development of Chernozems on the Dniester–Prut interfluve in the Holocene. Eurasian Soil Sci. 2013, 46, 491–504. [Google Scholar] [CrossRef]
  16. Dreibrodt, S.; Hofmann, R.; Dal Corso, M.; Bork, H.R.; Duttmann, R.; Shatilo, L.; Kirleis, W.; Müller, J.; Grootes, P.M.; Martini, S.; et al. Earthworms, Darwin and prehistoric agriculture-Chernozem genesis reconsidered. Geoderma 2022, 409, 115607. [Google Scholar] [CrossRef]
  17. Günal, H.; Korucu, T.; Birkas, M.; Özgöz, E.; Halbac-Cotoara-Zamfir, R. Threats to sustainability of soil functions in Central Southeast Europe. Sustainability 2015, 7, 2161–2188. [Google Scholar] [CrossRef] [Green Version]
  18. Cui, G.; Lu, Y.; Zheng, C.; Liu, Z.; Sai, J. Relationship between soil salinization and groundwater hydration in Yaoba Oasis, Northwest China. Water 2019, 11, 175. [Google Scholar] [CrossRef] [Green Version]
  19. Costică, T.M.; Stoleriu, C.C. The Ileana Valley’s Salts. Final Report: Scientific Study on the ROSCI 0221.2012. Available online: http://www.econatura2000.ro/doc/saraturi/studii/Raport_intermediar_2_Saraturile_din_Valea_Ilenei.pdf (accessed on 22 August 2002). (In Romanian).
  20. Jafarpoor, F.; Manafi, S.; Poch, R.M. Textural features of saline-sodic soil affected by Urmia Lake in the Northwest of Iran. Geoderma 2021, 392, 115007. [Google Scholar] [CrossRef]
  21. Rajmohan, N.; Masoud, M.H.Z.; Niyazi, B.A.M. Impact of evaporation on groundwater salinity in the arid coastal aquifer, Western Saudi Arabia. Catena 2021, 196, 104864. [Google Scholar] [CrossRef]
  22. Zhang, H.; Li, Y.; Meng, Y.-L.; Cao, N.; Li, D.-S.; Zhou, Z.-G.; Chen, B.-L.; Dou, F.-G. The effects of soil moisture and salinity as functions of groundwater depth on wheat growth and yield in coastal saline soils. J. Integr. Agric. 2019, 18, 2472–2484. [Google Scholar] [CrossRef]
  23. Patriche, C.V.; Pîrnau, R.; Grozavu, A.; Roșca, B. A comparative analysis of binary logistic regression and analytical hierarchy process for landslide susceptibility assessment in the Dobrov River Basin, Romania. Pedosphere 2016, 26, 335–350. [Google Scholar] [CrossRef]
  24. Minea, I.; Boicu, D.; Chelariu, O.E. Detection of groundwater levels trends using innovative trend analysis method in temperate climatic conditions. Water 2020, 12, 2129. [Google Scholar] [CrossRef]
  25. Sfîcă, L.; Minea, I.; Hriţac, R.; Amihăesei, V.-A.; Boicu, D. Projected changes of groundwater levels in northeastern Romania according to climate scenarios for 2020–2100. J. Hydrol. Reg. Stud. 2022, 41, 101108. [Google Scholar] [CrossRef]
  26. Niacşu, L.; Sfîcă, L.; Ursu, A.; Ichim, P.; Bobric, D.E.; Breabăn, I.G. Wind erosion on arable lands, associated with extreme blizzard conditions within the hilly area of Eastern Romania. Environ. Res. 2019, 169, 86–101. [Google Scholar] [CrossRef] [PubMed]
  27. Dobri, R.V.; Sfîcă, L.; Amihăesei, V.A.; Apostol, L.; Țîmpu, S. Drought extent and severity on arable lands in Romania derived from normalized difference drought index (2001–2020). Remote Sens. 2021, 13, 1478. [Google Scholar] [CrossRef]
  28. Grasu, C.; Miclăuş, C.; Brânzilă, M.; Boboş, I. The Sarmatian of the Eastern Carpathian Foreland Basin System; Tehnică: Bucureşti, România, 2002; p. 407. (In Romanian) [Google Scholar]
  29. Ionesi, L. Geology of Platform Units and the North Dobrogean Orogen; Tehnică: Bucureşti, România, 1994; p. 280. (In Romanian) [Google Scholar]
  30. Brânzilă, M. Geology of the Southern Part of the Moldavian Plain; Corson: Iaşi, România, 1999; p. 221. (In Romanian) [Google Scholar]
  31. Beck, H.E.; Zimmerman, N.; McVicar, T.; Vergopolan, N.; Berg, A.; Wood, E. Present and future Koppen-Geiger climate classification maps at 1-km resolution. Sci. Data 2018, 5, 180214. [Google Scholar] [CrossRef] [PubMed] [Green Version]
  32. USDA. Soil survey laboratory methods manual. In Soil Survey Investigation Report No.42; Version 4.0; USDA-NCRS: Lincon, NE, USA, 2004. [Google Scholar]
  33. Ramos-Leal, J.; Moran-Ramírez, J.; Rodríguez-Robles, U.; León, G.S.-D.; Roy, P.; Fuentes-Rivas, R.; de Oca, R.F.-M. Hydrogeochemical and isotopic characterizations of an aquifer in the semi-arid region of the Mexican Highlands. Geochemistry 2022, 82, 125872. [Google Scholar] [CrossRef]
  34. Shahid, S.A.; Zaman, M.; Heng, L. Introduction to soil salinity, sodicity and diagnostics techniques. In Guideline for Salinity Assessment, Mitigation and Adaptation Using Nuclear and Related Techniques; Zaman, M., Shahid, S.S., Heng, L., Eds.; Springer Nature Switzerland AG: Cham, Switzerland, 2018; pp. 55–88. [Google Scholar] [CrossRef] [Green Version]
  35. El-Sayed, S.A.; Hassan, H.B.; El-Sabagh, M.E.I. Geochemistry and mineralogy of Qaroun Lake and relevant drain sediments, El-Fayoum, Egypt. J. Afr. Earth Sci. 2021, 185, 104388. [Google Scholar] [CrossRef]
  36. Cox, R.; Lowe, D.R.; Cullers, R.L. The influence of sediment recycling and basement composition on evolution of mudrock chemistry in the southwestern United States. Geochim. Cosmochim. Acta 1995, 59, 2919–2940. [Google Scholar] [CrossRef]
  37. Vašinka, M.; Krmíček, L.; Všianský, D.; Hrbáček, F.; Nývlt, D. Chemical weathering in Antarctica: An example of ignous rock particles in Big Lachman Lake sediments, James Ross Island. Environ. Earth Sci. 2020, 79, 186. [Google Scholar] [CrossRef]
  38. Nesbitt, H.W.; Young, G.M. Prediction of some weathering trends of plutonic and volcanic rocks based on thermodynamic and kinetic consideration. Geochim. Cosmochim. Acta 1984, 48, 1523–1534. [Google Scholar] [CrossRef]
  39. Shao, J.Q.; Yang, S.Y. Does chemical index of alteration (CIA) reflect silicate weathering and monsoonal climate in the Changjiang River basin? Chin. Sci. Bull. 2012, 57, 1178–1187. [Google Scholar] [CrossRef] [Green Version]
  40. Owen, D.D.R.; Cox, M.E. Hydrochemical evolution within a large alluvial groundwater resource overlying a shallow coal seam gas reservoir. Sci. Total Environ. 2015, 523, 233–252. [Google Scholar] [CrossRef]
  41. Taylor, S.R.; Mc Lennan, S.M. The Continental Crust: Its Composition and Evolution; Blackwell: Oxford, UK, 1985; p. 312. [Google Scholar]
  42. Ataman, G. Chemical Composition of clay minerals and shales of Anatolian Tertiary Sediments: A Global Interpretation. Chem. Geol. 1979, 26, 311–320. [Google Scholar] [CrossRef]
  43. Bleam, W.F. Soil and Environmental Chemistry; Academic Press: Cambridge, MA, USA, 2016. [Google Scholar]
  44. Garzanti, E.; Resentini, A. Provenance control on chemical indices of weathering (Taiwan river sands). Sediment. Geol. 2016, 336, 81–95. [Google Scholar] [CrossRef]
  45. Ştefan, P.; Ştefan, C.O.; Buzgar, N. Contribution à l’étude pétrogéochimique des argiles basarabiennes dans la zone Leţcani (Plate-forme Moldave). Anal. Ştiinț. UAIC-Iaşi. Geol. 2003, 47, 175–183. [Google Scholar]
  46. Freeze, R.A.; Cherry, J.A. Groundwater; Prentice-Hall: Englewood Cliffs, NJ, USA, 1979; p. 604. [Google Scholar]
  47. Buchanan, J.R. Decentralized Wastewater Treatment. In Comprehensive Water Quality and Purification; Ahuja, S., Ed.; Elsevier: Waltham, MA, USA, 2014; Volume 3, pp. 244–267. [Google Scholar] [CrossRef]
  48. Myneni, S.C.B. X-ray and vibrational spectroscopy of sulfate in Earth materials. In Sulfate Minerals: Crystallography, Geochemistry, and Environmental Significance; Alpers, C.N., Jambor, J.L., Nordstrom, D.K., Eds.; Mineralogical Society of America Geochemical Society: Chantilly, VA, USA, 2000; Volume 40, pp. 113–172. [Google Scholar]
  49. Lane, M.D. Mid-infrared emission spectroscopy of sulfate and sulfate-bearing minerals. Am. Miner. 2007, 92, 1–18. [Google Scholar] [CrossRef]
  50. Roberts, A.; Burke, H.; Pring, A.; Zhao, J.; Gibson, C.T.; Popelka-Filcoff, R.S.; Thredgold, J.; Bland, C. Engravings, and rock coatings at Pudjinuk Rockshelter No. 2 South Australia. J. Archaeolog. Sci. Rep. 2018, 18, 272–284. [Google Scholar] [CrossRef]
  51. Hamilton, A.; Menzies, R.I. Raman spectra of mirabilite, Na2SO4*10H2O and the rediscovered metastable heptahydrate, Na2SO4*7H2O. J. Raman Spectrosc. 2010, 41, 1014–1020. [Google Scholar] [CrossRef]
  52. Li, S.; Lu, L.; Gao, Y.; Zhang, Y.; Shen, D. An analysis on the characteristics and influence factors on soil salinity in the Wasteland of the Kashgar River Basin. Sustainability 2022, 14, 3500. [Google Scholar] [CrossRef]
  53. Anthony, J.W.; Bideaux, R.A.; Bladh, K.W.; Nichols, M.C. (Eds.) Handbook of Mineralogy; Mineralogical Society of America: Chantilly, VA, USA, 2003. [Google Scholar]
  54. Kumar, A.; Yadav, A.; Dhanda, P.S.; Delta, A.K.; Sharma, M.; Kaushik, P. Salinity Stress and the Influence of Bioinoculants on the Morphological and Biochemical Characteristics of Faba Bean (Vicia faba L.). Sustainability 2022, 14, 14656. [Google Scholar] [CrossRef]
  55. Awedat, A.M.; Zhu, Y.; McLean Bennett, J.; Raine, S.R. The impact of clay dispersion and migration on soil hydraulic conductivity and pore networks. Geoderma 2021, 404, 115297. [Google Scholar] [CrossRef]
Figure 1. Study area with indication of soil, sediment, and water sampling points.
Sustainability 14 17056 g001
Figure 2. (a) Climogram showing monthly mean precipitation and temperature averages for the period 1961−1990 at Iasi meteorological station; (b) average temperature anomaly relative to the 1961−1990 average temperature recorded at Iasi meteorological station.
Sustainability 14 17056 g002
Figure 3. Particle size distribution of soils and sediments.
Sustainability 14 17056 g003
Figure 4. (a) A-CNK- FM and A-CN-K diagrams for sediments (black point is a UT reference). A-CNK- FM diagram; (b) A-CN-K diagram.
Sustainability 14 17056 g004
Figure 5. Maturity of the sediments.
Sustainability 14 17056 g005
Figure 6. Variation of the mean ion concentration in water in the study area, from upstream to downstream.
Sustainability 14 17056 g006
Figure 7. The origin of the mineralization of the studied waters (Gibbs diagram): (a) anions chart (Cl/(ClHCO3); (b) cations chart (Na++K+ / Na++K++Ca2+).
Sustainability 14 17056 g007
Figure 8. Chemical characteristics of natural waters and the aqueous solution of analysed soils.
Sustainability 14 17056 g008
Figure 9. CCR index vs. Cl/(Cl + HCO3).
Sustainability 14 17056 g009
Figure 10. Saline efflorescence from the hydrographic basin of the Roșior river.
Sustainability 14 17056 g010
Figure 11. Raman spectrum of thenardite in the sample shown in the photo.
Sustainability 14 17056 g011
Figure 12. Crops affected by soil salinization.
Sustainability 14 17056 g012
Table 1. Chemical composition of sediments (wt%).
SiO2TiO2Al2O3Fe2O3FeOMnOMgOCO2CaONa2OK2OP2O5SiO2/Al2O3ICVCIA
mean52.070.6915.5511.601.190.143.217.717.030971.840.123.441.0474.74
min50.150.511.953.680.820.132.651.903.010671.450.102.340.7667.26
max58.90121.5556.101.500.203.5539.009.381.432.170.144.421.2483.91
Table 2. Mean values of soil solution salinity at different depths.
Soil TypeDepth (cm)pHEC1:5 (dS/m)ClSO42−HCO3Na+K+Ca2+Mg2+TDS
(g/kg)
Chernozems0–208.121.1490.0872.1310.6230.9970.0230.1600.0613.908
20–408.201.6330.1073.4620.6071.1330.0170.4070.1865.553
40–608.542.3750.2886.2020.6061.7490.0190.7960.3258.074
60–808.782.4040.0895.6790.8461.6210.0220.7480.3348.174
Fluviosols0–208.140.7130.1671.2010.5670.5090.0390.1620.0882.426
20–408.301.0240.1462.0280.5930.7820.0410.2000.1353.482
40–608.442.4340.3064.4780.5012.0860.0350.3290.2448.275
60–808.543.5050.4295.9830.5262.8500.0350.6560.34911.918
Gleysols0–208.211.2340.3471.9230.7511.0260.0510.1470.1144.200
20–408.521.7750.2983.3460.8241.5750.0570.1910.1646.036
40–608.464.1400.55510.9590.6083.3310.0481.0580.69614.076
60–808.424.9770.69812.7000.4894.1280.0281.0130.72316.921
Solonetz0–208.655.5330.3799.3570.8713.8130.0790.5350.32318.813
20–409.035.1540.3378.5470.8603.8870.0510.3550.19217.525
40–609.104.5290.3418.2930.9843.3810.0870.5100.30615.398
60–809.203.4390.3386.3210.8482.3860.0490.4660.35311.658
Table 3. Statistical parameter for topsoil samples.
StatisticH2O (%)pHEC1:5 (dS/m)ECe (dS/m)TDS (g/kg)
Nr. of Obs.2020202020
Min.12.4005.4050.1941.3930.892
Max.27.74010.0614.93035.44722.686
1st Quartile15.8947.3080.2221.5961.022
Median18.8527.9530.6614.7493.039
3rd Quartile21.3298.9582.84020.42013.069
Mean19.1857.9641.54311.0957.101
Std. dev.4.3801.1881.55811.2017.169
Var. coef.0.2280.1491.0101.0101.010
Table 4. Raman wavenumbers (cm−1) from the database of randomly oriented samples.
Free Ion Values [48][49][50][51]Roșior Basin Samples
SO4 ν1-981 992993.2992
SO4 ν2-451 451
465
451.8
466.6
461
480
SO4 ν3-11041135
1178
1103
1133
1154
1102.1
1132.1
1152.7
1101
1129
1150
SO4 ν4-613620
642
631
648
620.5
632.8
647.2
626
645
Publisher’s Note: MDPI stays neutral with regard to jurisdictional claims in published maps and institutional affiliations.

