1. Introduction
Soil moisture is necessary for examining water budgeting processes and meteorological and agricultural applications [
1]. Active or passive microwave sensors provide areal-extensive coarse-scale measurements (12–50 km) for surface soil moisture (SSM) retrieval [
2]. For soil-moisture depth estimations, remote sensing methods have been relatively successful in measuring moisture at a depth of 5 cm from the topsoil surface for bare soil or soil with reduced vegetation. However, estimations at ≥ 10cm from the soil surface or at the root zone depth remain challenging [
1].
Improving crop water-use efficiency and water resource planning, especially in rainfed agricultural areas, requires an understanding of the soil moisture at various depths in the root zone at the farm scale. Yet, few studies have been conducted on soil moisture at the farm scale during the growing season [
3,
4,
5]. Huang et al. [
3] assessed the spatial and temporal variations in the surface soil water content (0–0.1 m) using seven in situ soil moisture probes and Sentinel-1 satellite data throughout the 2016 and 2017 cropping seasons in irrigated fields in the USA. An empirical multiple linear regression model was developed for the soil water content and Sentinel-1 backscatter data. Mohamed et al. [
4] determined the soil moisture (0–0.1 m) under irrigated soil conditions based on thermal infrared remote sensing and synthetic aperture radar (SAR) data to identify the irrigation status of crop fields. Koyama et al. [
5] analysed the spatial variability in the surface soil moisture at different spatial scales (ranging from catchment to field scales) based on field measurements and remote sensing estimates. They also monitored the soil moisture at depths of 10 and 30 cm using probes in grassland, sugar beet, and winter wheat land-use types.
According to Huang et al. [
3], the lack of soil moisture estimates at the field scale at high spatial and temporal resolutions is due to sparse soil moisture networks characterised by coarse spatial scales, which cannot be used to describe the soil moisture heterogeneity at the farm scale for agricultural applications. Recently, with improvements to digital agriculture, such as sensor technology, soil moisture data collection at the farm scale is more feasible. Generally, in situ data from gravimetric measurements and electromagnetic sensors are considered the most reliable approach for direct and accurate soil moisture determinations [
6]. However, uncertainties may occur owing to high salinity levels, loss of contact between sensors and the surrounding soil resulting from shrinkage, or a lack of calibration [
6]. Moreover, using these methods to obtain in situ data is destructive, expensive, laborious, and time consuming while only providing point measurements [
6,
7]. Furthermore, in countries where rainfed farmers individually manage their land, these farmers cannot consistently control all areas of their farm such as using machines. Non-uniformity may also exist in the land preparation and seed quality stages. Soil moisture from in situ sensors alone may lead to misinterpretation because soil moisture from in situ sensors is point data. Therefore, more data from other methods is required to verify sensor results before using in situ soil moisture data to obtain its relationship with remote sensing data.
In this study, we examined the relationship between soil moisture retrieved from Sentinel-1 data and in situ soil moisture data obtained from sensors. It is to be noted that the soil moisture used in this study is the gravimetric soil water content. We then cross-verified the soil moisture data from the sensors with the soil moisture obtained using a soil water balance model. The daily soil water balance was calculated using CROPWAT8.0, which is a computer program developed by the Land and Water Development Division of the Food and Agriculture Organization (FAO), to calculate the crop water and irrigation requirements based on soil, climate, rainfall, and crop data [
8]. Moreover, CROPWAT8.0 can also provide the daily soil moisture balance during each crop growth stage. To the best of our knowledge, this is the first study to apply the soil moisture obtained from the daily soil water balance from CROPWAT8.0 to verify the soil moisture data from the sensor before comparing with the soil moisture retrieved from remote sensing data. To calculate the daily soil moisture balance using CROPWAT8.0, the planting date of the crop must be used as input for the crop data. Farmers tend to have difficulty remembering exact crop planting dates, especially when having to recall dates from several years past. Therefore, this study applied the planting date identified by the Normalised Difference Vegetation Index (NDVI) based on optical remote sensing data, such as MODIS (Moderate Resolution Imaging Spectroradiometer), as this method has been widely used in plant phenology studies.
In summary, the purpose of this study is to determine whether the soil moisture from the water balance model can be used to help verify in situ soil moisture sensor data by providing more information on soil moisture in the root zone before using the in situ data to obtain its relationship with remote sensing data. The proposed method of this study includes (1) determining the crop planting date using the NDVI, (2) calculating the daily soil moisture balance using CROPWAT8.0, (3) determining the relationship between the soil moisture balance from CROPWAT8.0 and the in situ soil moisture data, and (4) determining the relationship between the in situ soil moisture sensors and Sentinel-1 remote sensing data. The proposed method was applied to a rainfed maize farm in Wiangsa, Nan Province, Thailand. This method is easily reproducible, such that it may also be applicable to other regions.
2. Materials and Methods
2.1. Study Area and Data
The study area was a maize farm of 0.0221 km
2 in Wiangsa, Nan Province, Thailand. This maize farm is a rainfed agricultural area with an average rainfall of 848 mm and average number of 67 rainy days during the rainy season, which mostly begins ca. 18 May and ends ca. 19 September [
9]. The farm area topography varies between a 2 and 12% slope.
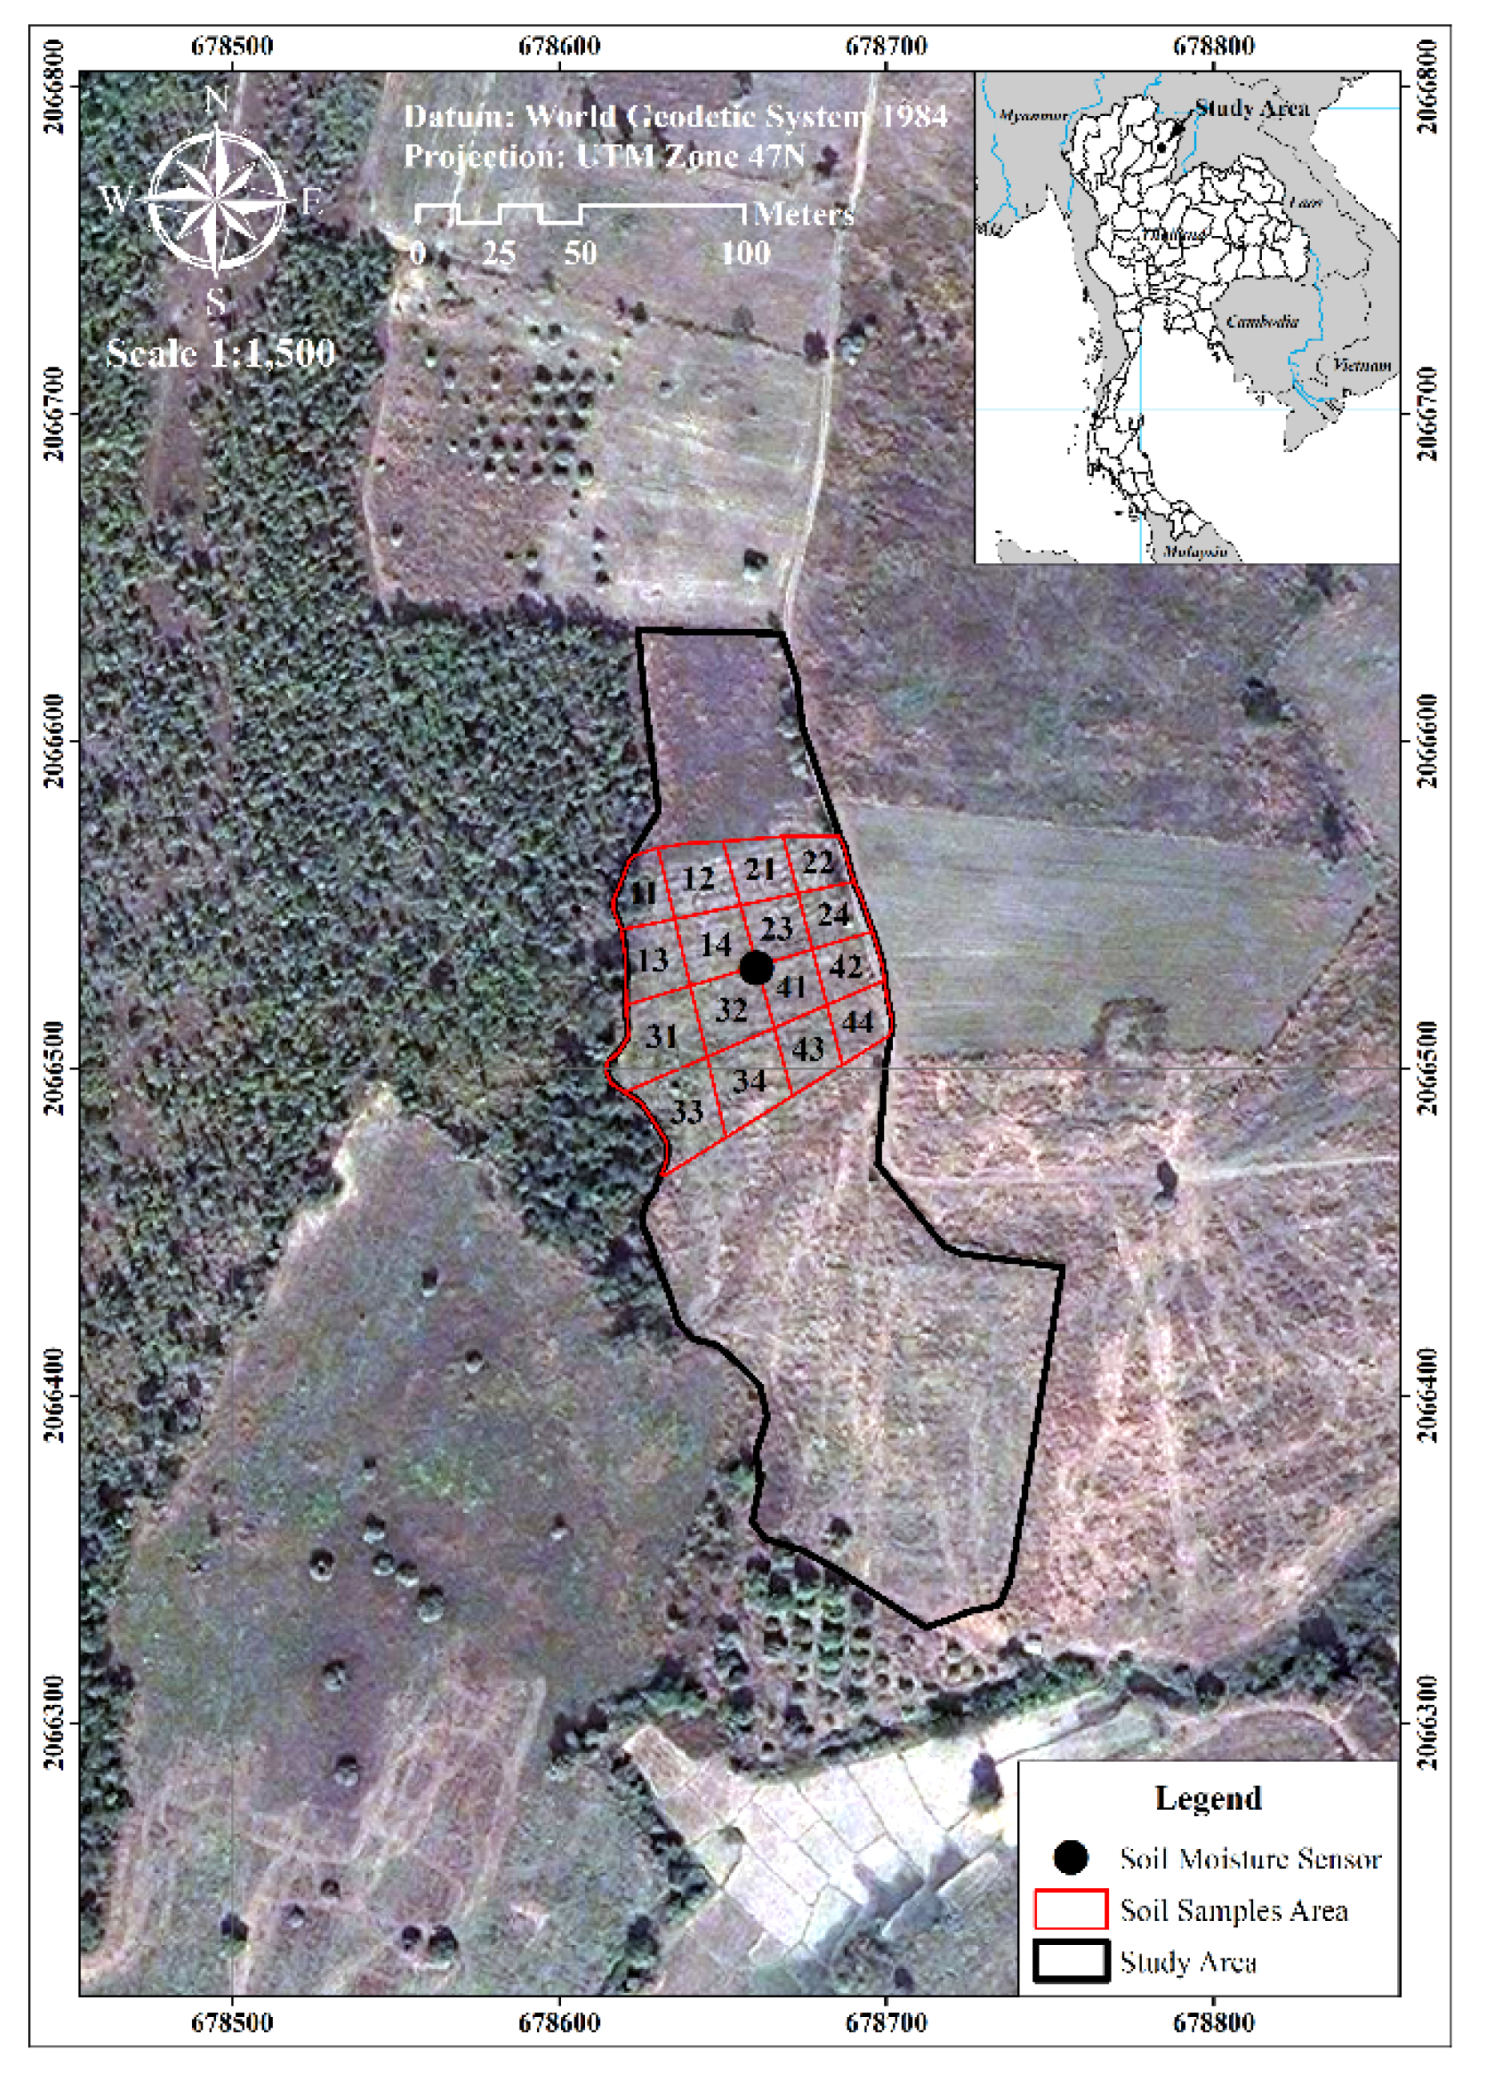
Figure 1 shows the location of the farm area. The maize grown on this farm is a hybrid variety that can usually be harvested at 120 d. The reproductive growth stage of maize occurs 55–90 d after planting.
Within this farm area, we selected the zones where soil samples were collected, as shown by the gridded area in
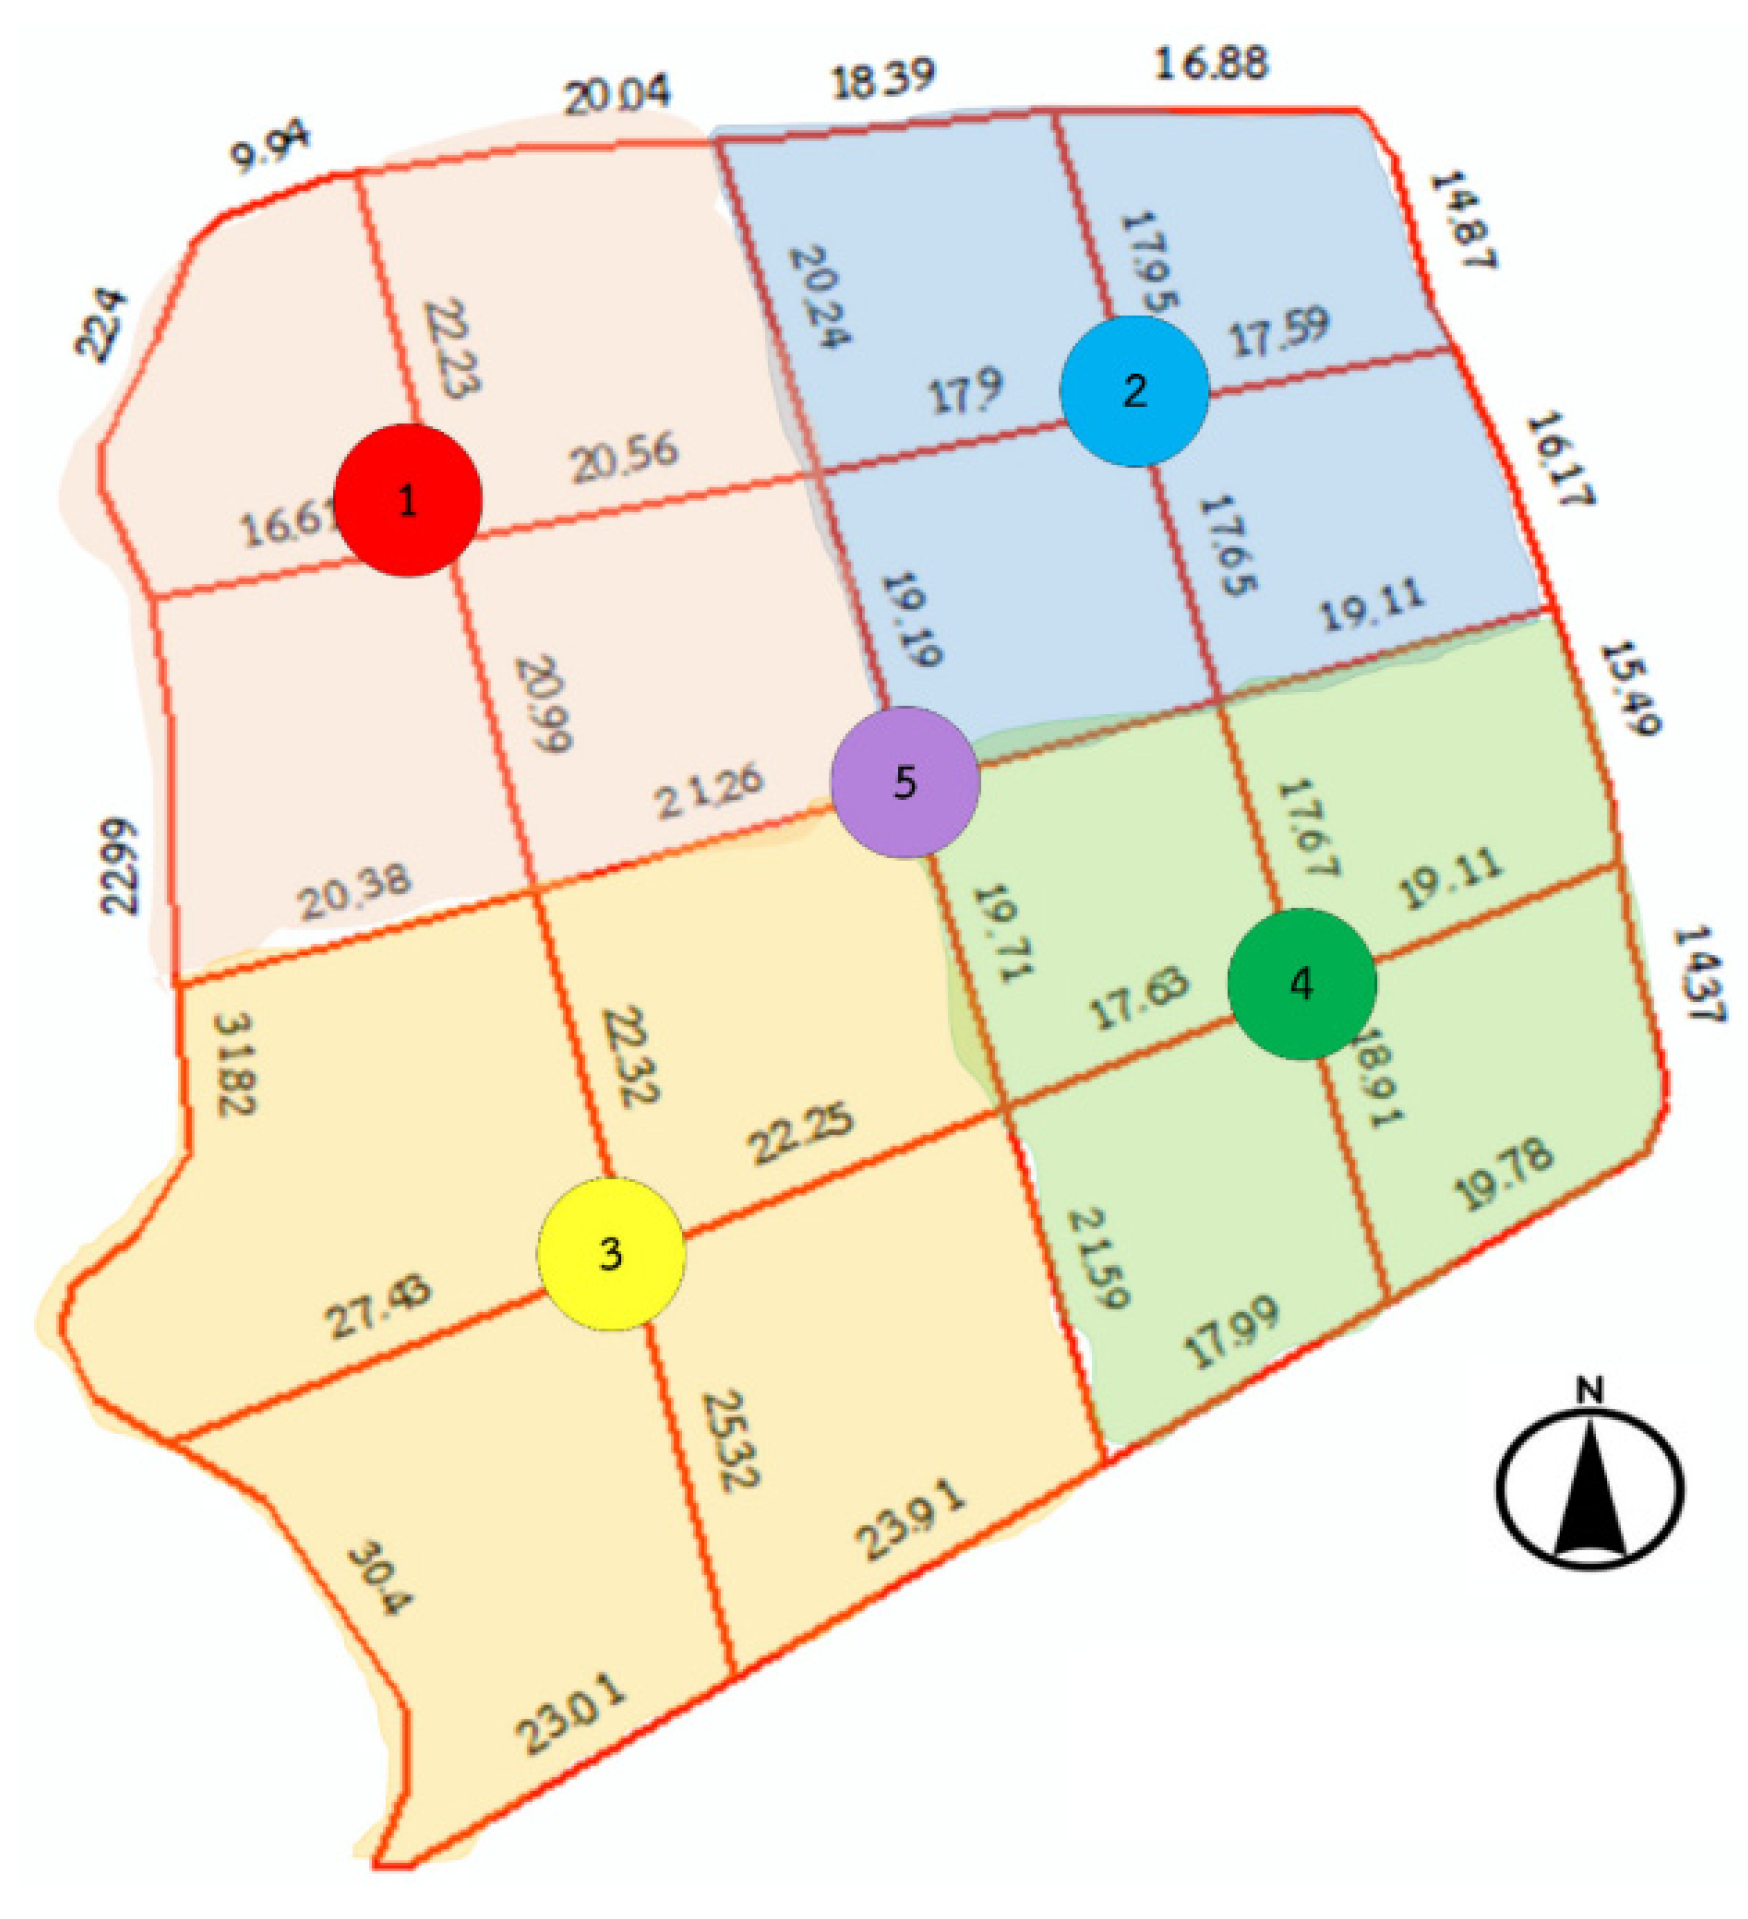
Figure 2. This area had a slope in one direction to ensure runoff flow in only one direction. The soil moisture sensor instrument was then installed at the centre of the gridded area to collect the in situ soil moisture. The sensor probes were placed 10 and 30 cm below the soil surface. The type of sensor used in this study is a resistive soil moisture sensor, which uses the relationship between electrical resistance and water content to gauge the moisture levels of the soil. The sensor was connected to a data logger consisting of an SD card, micro controller, and real time clock. The sensor must be calibrated with known soil moisture samples before being used. The soil moisture data recorded using the sensors were collected every 15 min between 1 April 2018 and 31 December 2020. The gridded area was divided into four parts (
Figure 2). In each part, we collected soil samples by digging at 15–20 sites in a zigzag direction at depths of 0–20 cm from the soil surface, and then mixing the soil samples to obtain one soil composite. We also collected soil samples from the soil moisture instrument. The soil composites were analysed for soil texture; percentage of sand, silt, clay, and rock fragments; and soil electrical conductivity. Furthermore, we also collected undisturbed samples at the centre of these zones and at the location of the soil moisture sensor instrument to measure the hydraulic conductivity and dry density. The soil samples were collected in March 2018.
This study used two types of remote sensing data: Terra MODIS image data and C-band SAR datasets from Sentinel-1A and Sentinel-1B images. To calculate the NDVI, we used Terra MODIS image data (MOD09A1.006 Terra Surface Reflectance 8-Day Global 500 m) from 2016 to 2020 retrieved from the National Aeronautics and Space Administration (NASA’s Earth data website:
https://urs.earthdata.nasa.gov/ accessed on 15 January 2021). Sentinel-2 was not chosen for NDVI calculation even though it has a higher spatial resolution (i.e., 10 m) than that of MODIS. According to the Sentinel-2 user guide [
10], the revisit time of Sentinel-2 is 5 days in cloud-free conditions. The study area chosen for this study is a rainfed agricultural area. Therefore, even though, Sentinel-2 has better spatial resolution, the image data cannot be used if cloud is present. In contrast with Sentinel-2, in the 8-day product of MODIS, each surface reflectance pixel contained the best possible Level 2 Gridded (L2G) observation as selected on the basis of high observation coverage, low view angle, the absence of clouds or cloud shadow, and aerosol loading [
11]. Therefore, using MODIS, more image data can be obtained and can be used in the NDVI analysis of the study area.
To determine the soil moisture of the maize farm area, we used C-band SAR datasets from Sentinel-1A and Sentinel-1B images collected from 2016 to 2020. The Sentinel-1 image data were obtained from the European Space Agency (ESA) via the Copernicus Open Access Hub (
https://scihub.copernicus.eu/ accessed on 6 February 2021). Sentinel-1 is a SAR mission satellite that provides continuous all-weather, day-and-night imagery at C-band (centre frequency: 5.405 GHz) and operates in four exclusive imaging modes with different spatial resolutions and coverages [
12]. The repeat cycle of Sentinel-1 image data with both satellites was six days over the study area. The spatial resolution of the Sentinel-1 image data used in this study was 5 m × 20 m. It is to be noted that SAR has the ability to penetrate the near-surface soil layer up to a depth of 5 cm for C-band [
13].
To determine the daily soil moisture balance using CROPWAT8.0, four types of data were used as inputs: rainfall, climate, soil, and crop data. Daily rainfall data and daily climate data, including the minimum and maximum temperatures, relative humidity, wind speed, and sunshine duration data, were obtained from the nearest climate station via the Thai Meteorological Department. The soil data including total available soil moisture and maximum rain infiltration rate were based on field data collected from the study area. The crop data included the plant type, duration of each growth stage, and planting date. The maize grown on this farm was a hybrid variety that can usually be harvested after 120 d. The reproductive growth stage of maize typically occurs 55–90 d after planting. The time series of NDVI were calculated for the whole season of maize growth. After the date with maximum NDVI at the particular growing season was determined, the planting date could be estimated as 90 days from the date prior to the date with maximum NDVI. The period of analysis was during the maize growing season in 2018 and 2019.
2.2. Analysis of Planting Dates in Maize Plot Area
Optical satellite remote sensing was used to determine the crop phenology and planting dates for the maize farm area by employing the NDVI method. The steps consisted of (1) data collection and pre-processing, (2) NDVI calculation, (3) data smoothing, and (4) crop phenology analysis. After obtaining the Terra MODIS data, the images were reprojected onto the Geographic Lat/Long (WGS 84).
The NDVI time-series could be derived from Terra MODIS images, such that NDVI values were extracted for the maize farm area. The NDVI was calculated based on the ratio of the two bands adjusted to satisfy a normal distribution, the near-infrared and red bands. In other words, the red band was subtracted from the near-infrared band, which was then divided by the sum of the near-infrared and red bands, as follows [
14]:
where NIR and RED refer to the surface reflectance values in the near-infrared and red bands, respectively.
The time-series of the NDVI values were then smoothed by the fitting model in the Whittaker smoother algorithm through implementation in MATLAB. According to Atkinson et al. [
11] and Atzberger and Eilers [
15,
16], the Whittaker smoother is based on penalised least squares. It fits a discrete series to discrete data while penalising the roughness of a smooth curve. Therefore, this algorithm balances the reliability of the data and the roughness of the fitted data. The Whittaker smoother can be easily adapted to fit data with missing values and data that are arbitrarily non-equally spaced [
17].
Finally, we analysed the crop phenology using the differences between the maximum and minimum seasonal NDVI values. The maximum NDVI was the value of the crop at the peak growth stage. The reproductive growth stage of maize occurs 55–90 d after planting. Therefore, the planting date can be estimated by determining the date approximately 90 d prior to the date of the maximum NDVI value.
2.3. Retrieval of Soil Moisture from Sentinel-1
In this study, microwave remote sensing was used to retrieve the soil moisture from SAR images in the maize sampling plot area. During the data pre-processing process, Sentinel-1 images in Co-Polarization (VV) were obtained using the SNAP software developed by the ESA, and consisted of the following steps: (i) radiometric correction was applied to the calibration of SAR images, followed by the derivation of the backscattering coefficients (
); (ii) speckle filtering was applied for speckle noise reduction in the images using the Lee speckle filter with a window size of 3 × 3; (iii) terrain correction was implemented with a Range Doppler Terrain Correction Operator using an SRTM DEM (Shuttle Radar Topography Mission Digital Elevation Model) at a spatial resolution of 30 m; and (iv) the backscattering coefficients (
) were expressed in decibels (dB), as follows:
We then developed an algorithm for estimating the soil moisture from Sentinel-1 data using empirical scattering models. The relationships between the backscattering coefficient in VV polarisations for the maize farm area and in situ soil moisture at depths of 10 and 30 cm from 2018 to 2020 were compiled to analyse and determine an empirical scattering model via regression fit analysis. The accuracy assessment for the empirical scattering model was performed using statistical analysis methods with the following quality measures: R2 (coefficient of determination), root mean square error (RMSE), mean absolute error (MAE), and relative bias in percent (RE). Finally, an empirical scattering model was applied to the soil moisture retrieval from Sentinel-1 as a time-series during the crop growing season.
2.4. Calculation of Soil Water Balance Using CROPWAT8.0
In CROPWAT8.0, the daily soil water balance was calculated as follows [
18]:
where Dr,i and Dr,i−1 are the root zone depletion on days i and i-1, respectively; ETc adj,i is the crop evapotranspiration under non-standard conditions on day i; P,i is the total rainfall on day i; I,i is the net irrigation on day i; RO,i is the water loss due to runoff from the soil surface on day i; and DP,i is the water loss due to deep percolation on day i. The units of all the variables in Equation (3) are mm. We note that the net irrigation term in this study was zero because the study area is a rainfed agricultural area. Here, RO was assumed to occur when P exceeded the maximum infiltration rate. Furthermore, DP occurred when the available soil moisture content in the root zone exceeded the field capacity (FC). The crop evapotranspiration under non-standard conditions (ETc adj) and the water stress factor (Ks) was calculated using Equations (4) and (5), respectively:
where TAW is the total available water, Dr is the root zone depletion, and RAW is the readily available water. For soil-water-limiting conditions, Ks < 1, whereas Ks = 1 where there is no soil water stress. The crop evapotranspiration (ETc) was calculated using Equation (6):
where Kc is the crop coefficient, which depends on the type of crop and its growth stage, and ETo is the reference crop evapotranspiration, which can be calculated using the FAO Penman-Monteith method [
14].
According to Allen et al. [
18], the ETo can be calculated as follows:
where ETo is the reference evapotranspiration of clipped grass (mm/day), △ is the slope of the vapour pressure curve (kPa/°C), Rn is the net radiation at the crop surface (MJ m
−2 d
−1), G is the soil heat flux density (MJ m
−2 d
−1), T is the mean air temperature (°C), u2 is the wind speed at a height of 2 m (m/s), es is the saturation vapour pressure (kPa), ea is the actual vapour pressure (kPa), and γ is the psychrometric constant (kPa/°C). Allen et al. [
18] presents a detailed derivation of Equation (7).
The daily root zone depletion (Dr,i) from Equation (3) was then calculated using CROPWAT8.0 as the percentage of moisture at the field capacity to obtain the daily root zone depletion as a percentage. The daily soil moisture (%) was calculated as 100 − Dr. The soil moisture was then compared with the in situ soil moisture obtained from the sensors.
3. Results
Here, we discuss the soil properties of the study area, such as the soil parameters used in CROPWAT8.0, as well as describing the soil salinity, because high salinities may induce sensor malfunction. The NDVI analysis used to determine the planting date is then discussed, which was used in the crop module of CROPWAT8.0. We then describe the relationship between the daily soil moisture obtained from the soil water balance using CROPWAT8.0 and the in situ soil moisture data from 2018 and 2019. The relationship between the in situ soil moisture data and Sentinel-1 remote sensing data is then described. Finally, we present the results of the soil moisture retrieval from Sentinel-1 data as compared with the daily soil moisture from CROPWAT8.0 in 2016, 2017, and 2020.
3.1. Soil Properties
Table 1 lists soil properties of the study area. The soil texture in the study area is loam with a high percentage of sand and rock fragments. The average hydraulic conductivity of the soil in this farm area is 2.5 × 10
−4 cm/s, with a dry density of 1454.71 kg/m
3 and a void ratio of 0.74. According to this soil texture, the soil properties used as inputs in the CROPWAT8.0 soil module were as follows: the total availability soil moisture (field capacity − wilting point) was 160 mm/m; the maximum rain infiltration rate was 35 mm/day.
The average electrical conductivity was 0.32 dS/m, which is a measure of the soil salinity. For loamy fine sand to loam, the range between 0 and 1.2 dS/m should not be saline [
19]. This test was performed to ensure that there were no salinity problems with the sensors.
3.2. Planting Dates from NDVI Analysis
As the maize growing season occurs during the rainy season, it can be expected that some NDVI values may be erroneous because MODIS cannot observe the surface when cloud cover is present [
20]. This problem can be solved using the Whittaker filtering technique to smooth the data, fill in data gaps, and provide missing values. After using the Whittaker filtering technique, the amplitude of the NDVI values during the growing season was analysed. Typically, the maximum NDVI usually occurs when the crop is at its peak during the growth stage. For this variety of maize used in the study, which can be harvested 120 d after planting, the peak of the growth stage occurs approximately 90 d after planting. Therefore, the planting date could be identified as the date approximately 90 d before the date of the maximum NDVI value.
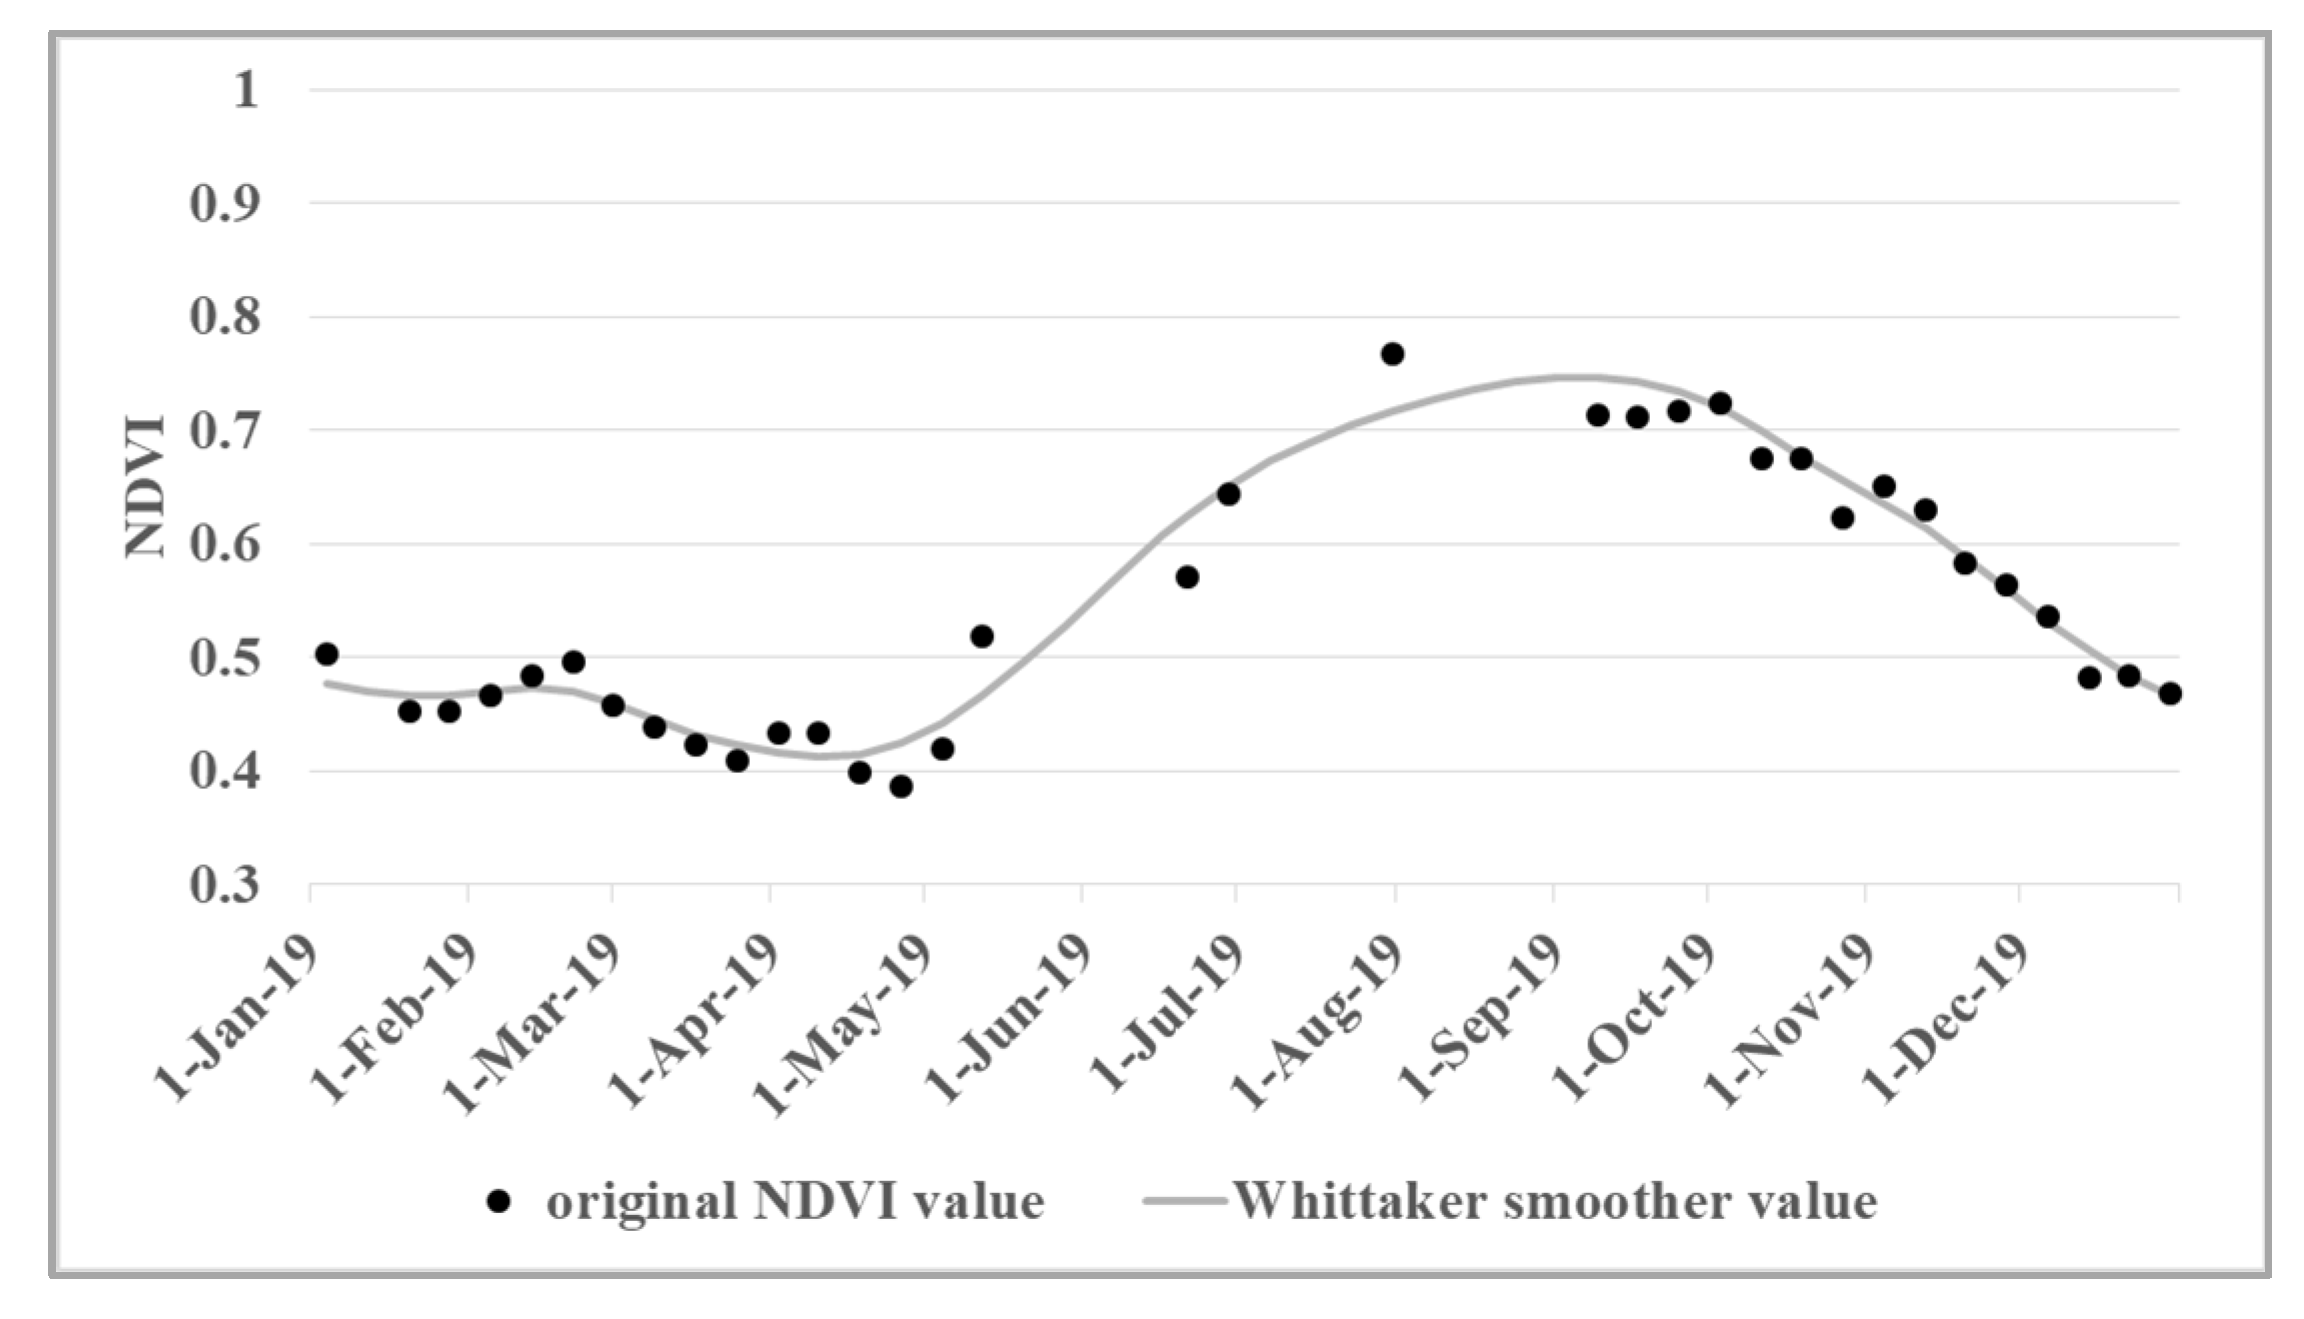
Figure 3 and
Figure 4 present the NDVI in the same area.
Figure 3 illustrates the comparison of the original NDVI values and the smoothed NDVI values obtained with the Whittaker smoother method in 2019. While
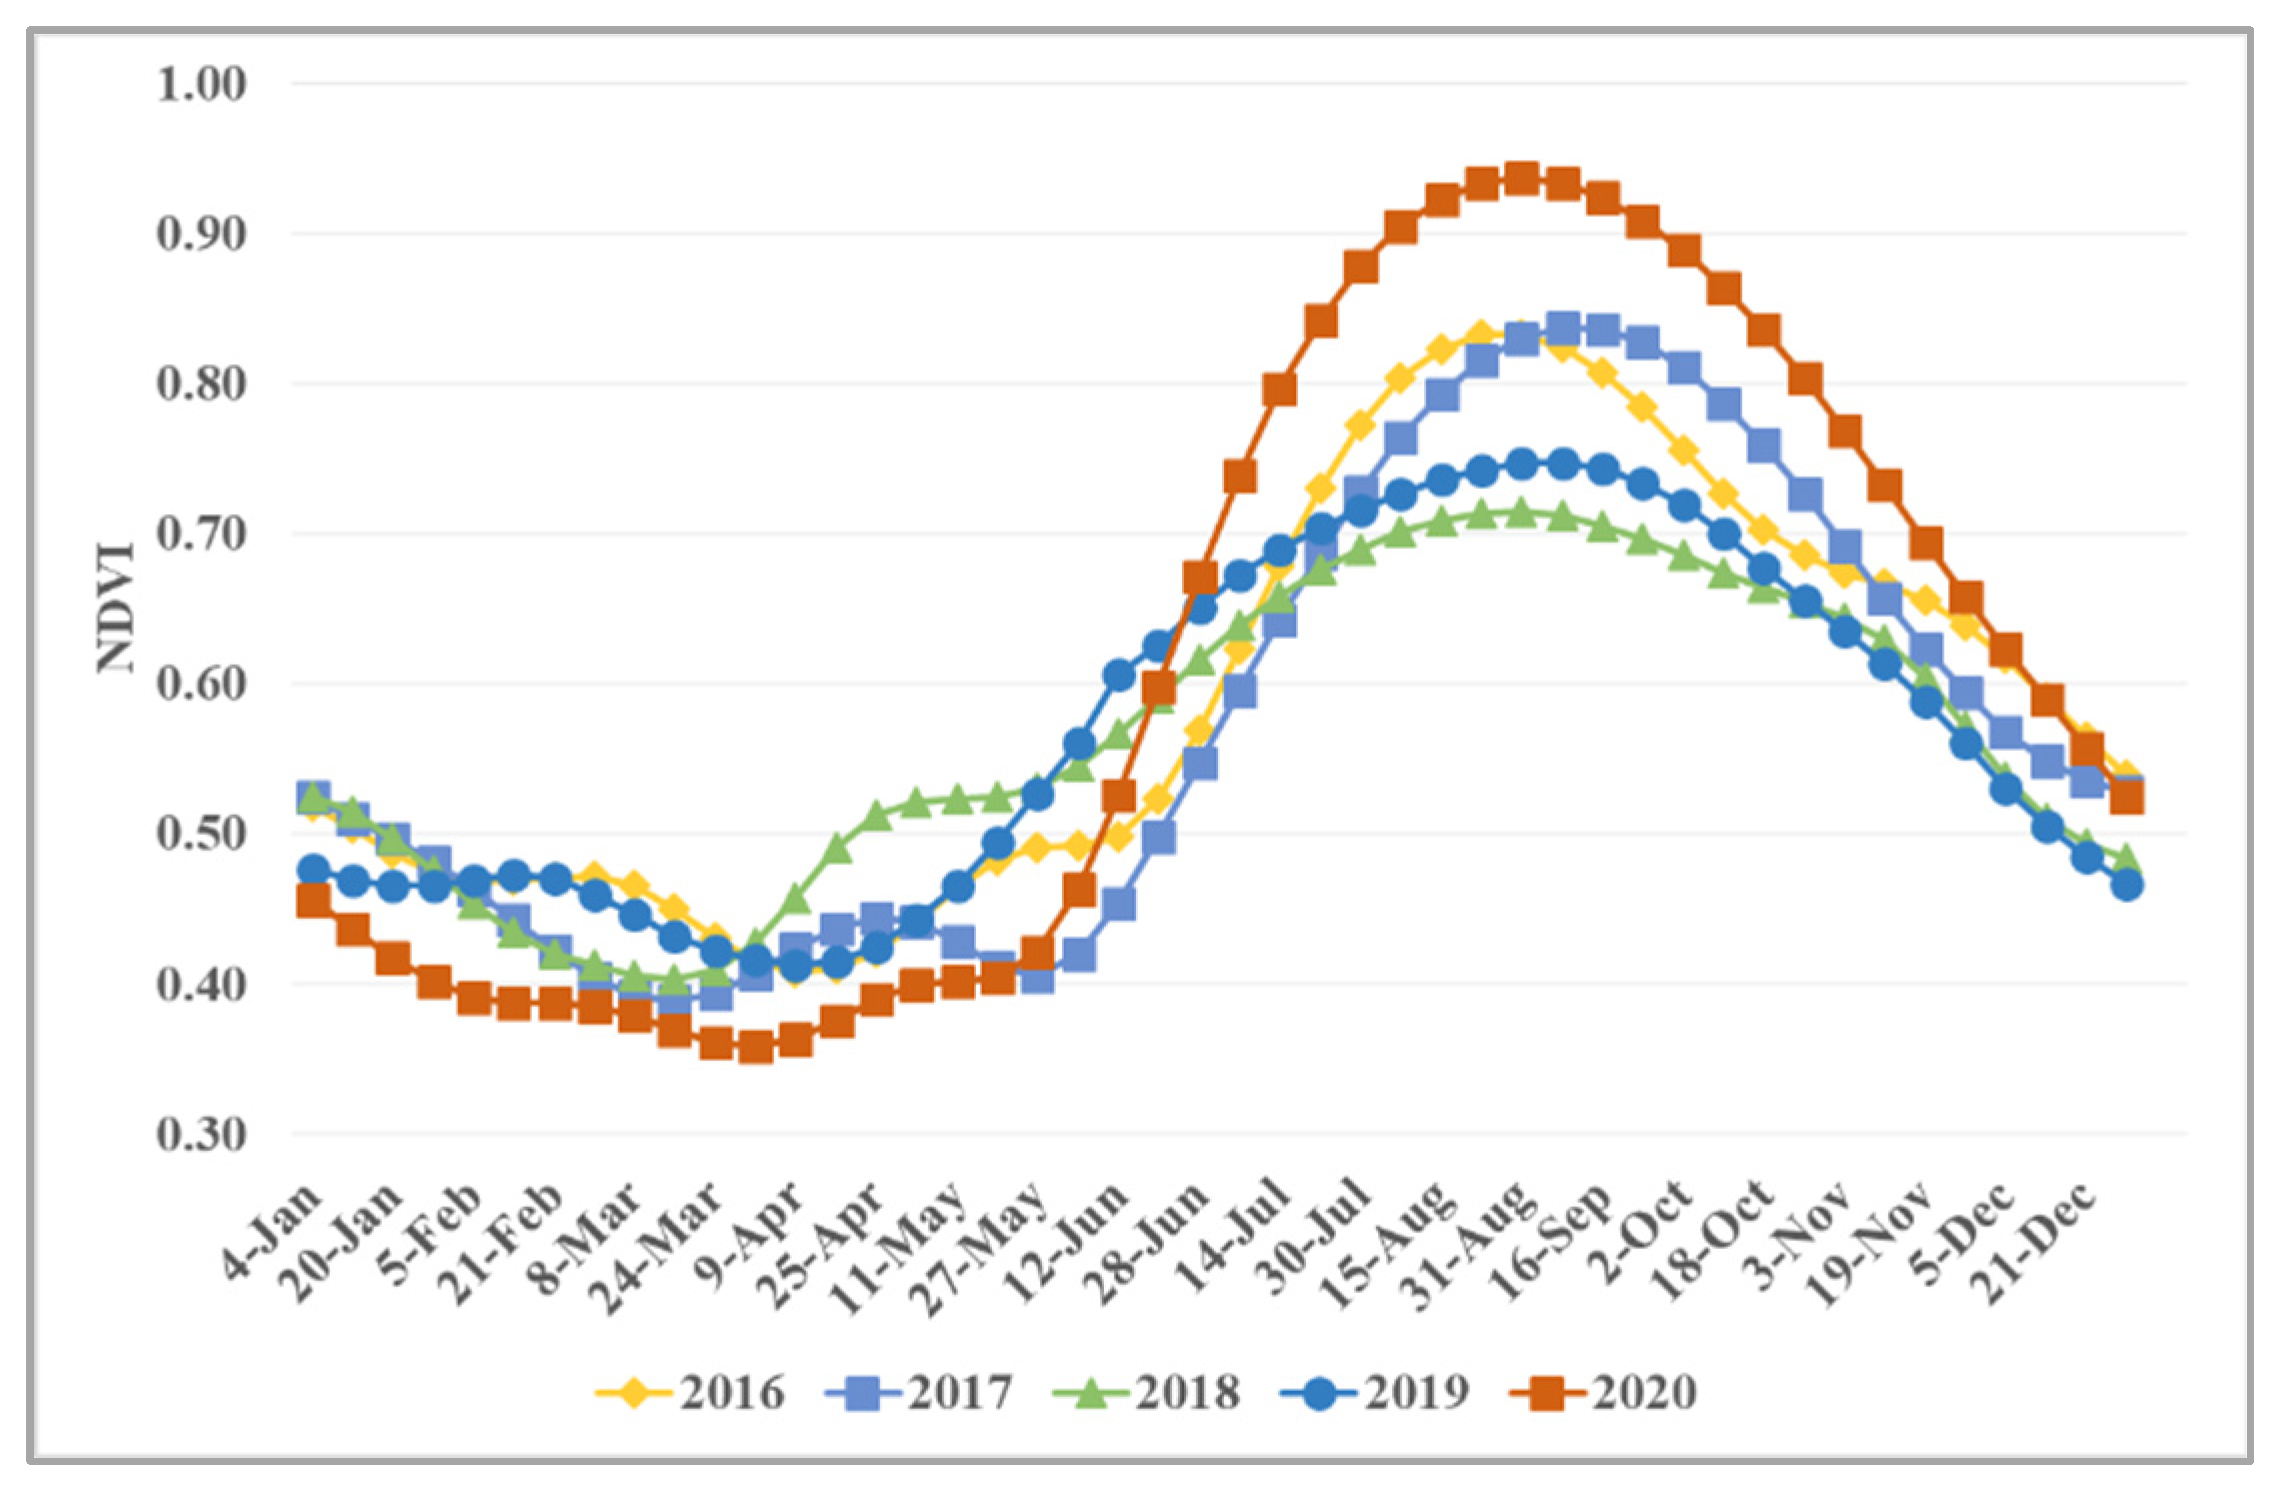
Figure 4 present the comparison of NDVI results in year 2016 to 2020. According to
Figure 4, the planting date was 10 June 2019 and the maize growing season in this study area was from 10 June to 7 October 2019. Moreover, the NDVI curve is consistent with the crop coefficient (Kc) used in each stage of plant growth, which indicates that Kc is the lowest at the initial stage, increases at the development stage, and reaches its peak at the mid-season stage. The Kc of plant growth stage is also an input of CROPWAT8.0 model. In this study, we used the Kc values reported by Allen et al. [
18]. Using the same method for the other years,
Figure 4 and
Table 2 present the smoothed NDVI values and planting dates, respectively.
3.3. Daily Soil Moisture from Soil Water Balance Using CROPWAT8.0
The in situ soil moisture was collected from 1 April 2018 to 31 December 2020. According to the NDVI results in
Table 2, the maize planting dates in the study area were 2 June 2018, 10 June 2019, and 2 June 2020. Maize can typically be harvested after 120 d of planting. Unfortunately, the in situ soil moisture was missing for some periods during the growing season in 2018 and not available from June to November 2020. Therefore, the soil moisture from CROPWAT8.0 and in situ soil moisture could only be partially compared in 2018 and not at all in 2020.
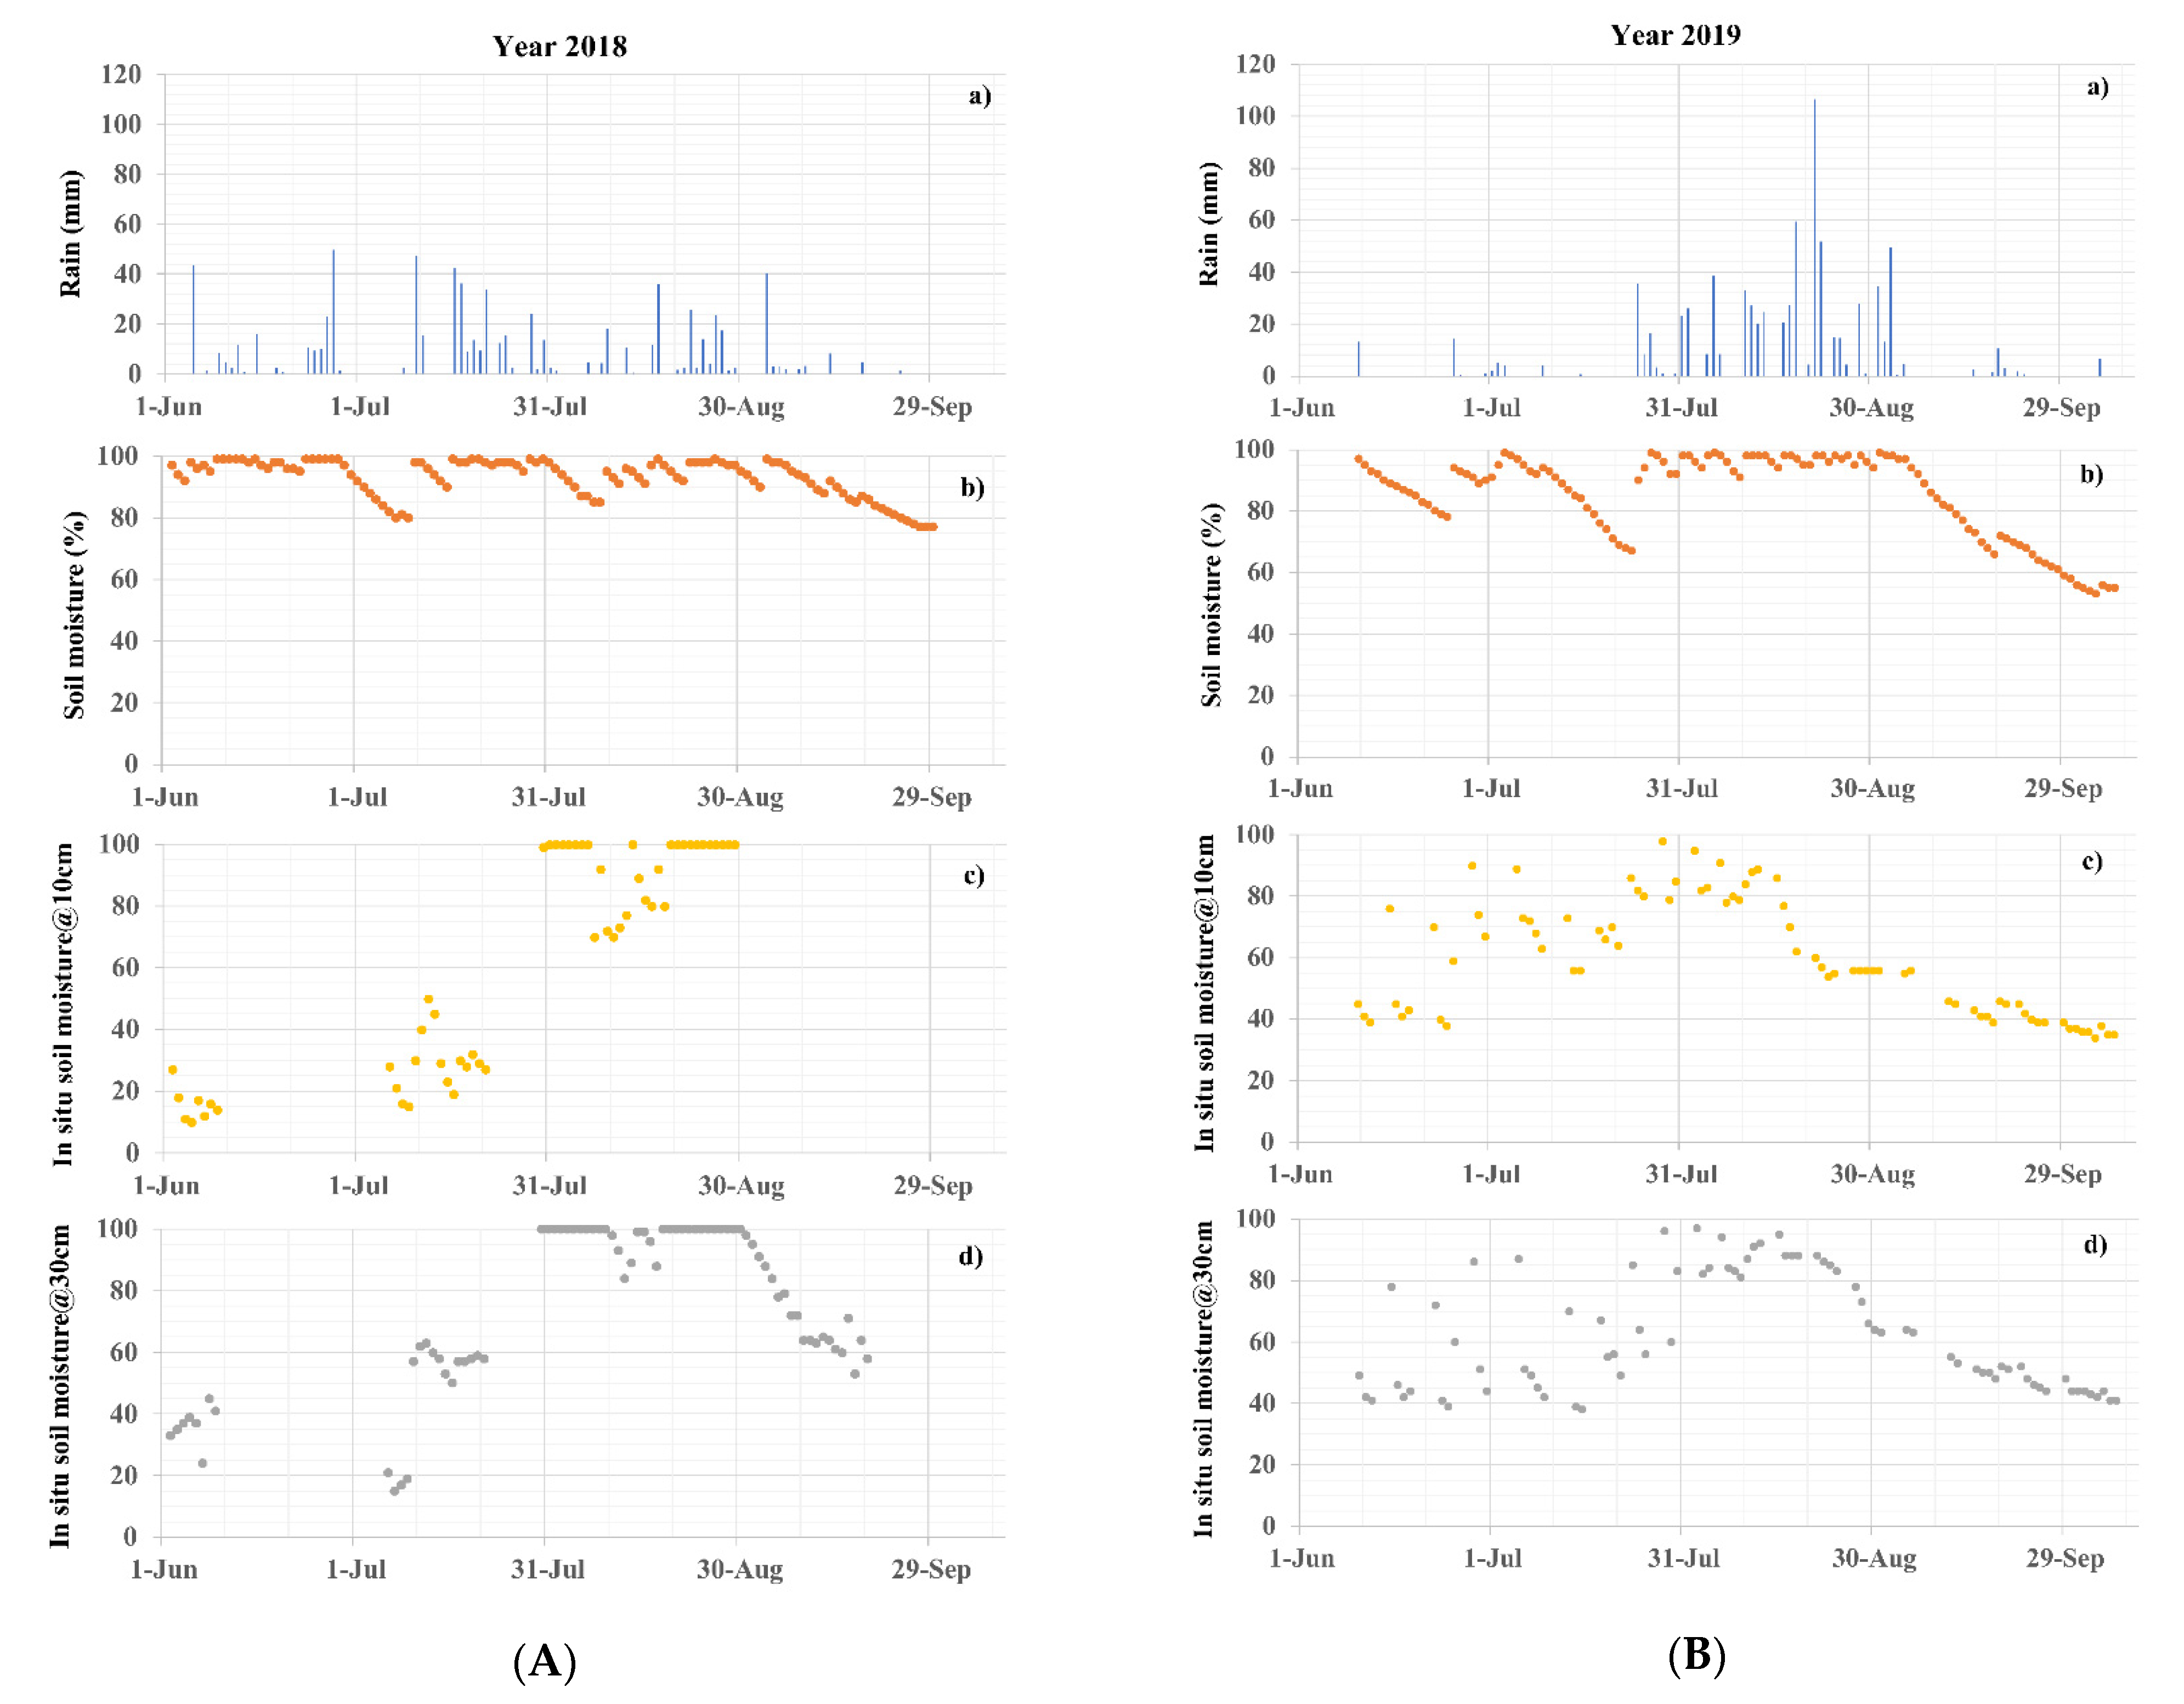
Figure 5 presents the soil moisture from CROPWAT8.0 compared with the in situ soil moisture at depths of 10 and 30 cm below the soil surface. As shown in
Figure 5A, there were many missing values for the in situ soil moisture during the growing season. However, for the period of 30 July to 29 August 2018, the in situ soil moisture and the soil moisture from CROPWAT8.0 can still be compared. According to
Figure 5A, there was rain from 28 July to 1 August, followed by a period of no rain during 2 to 5 August. The corresponding soil moisture from CROPWAT8.0 gradually decreased while the in situ soil moisture at 10 and 30 cm continued at 100% of field capacity and then quickly dropped at 7 and 10 August, respectively. It seems that the soil moisture from CROPWAT8.0 is more consistent with the rainfall than with the in situ soil moistures at both depths.
As shown in
Figure 5A, in the year 2018, when there was no rain, the soil moisture decreased, such that the in situ soil moisture at a depth of 10 cm from the soil surface was lower than that at 30 cm. The soil moisture from CROPWAT8.0 was higher than the in situ soil moisture at both depths.
Using data from 2019, which was more complete than that from 2018, the correlation between the in situ soil moisture at 10 and 30 cm was 0.78, while the correlation between the in situ soil moisture at 10 and 30 cm and the soil moisture from CROPWAT8.0 was 0.64 and 0.62, respectively.
It should be noted that, as shown in
Figure 5B, in the year 2019, there was a decrease in the in situ soil moisture at 10 cm ca. mid-August, which was earlier than that for the in situ soil moisture at 30 cm (i.e., a decrease ca. 27 August) and that obtained from CROPWAT8.0 (i.e., a decrease on 4 September).
3.4. Relation between In Situ Soil Moisture Data and Sentinel-1 Remote Sensing Data
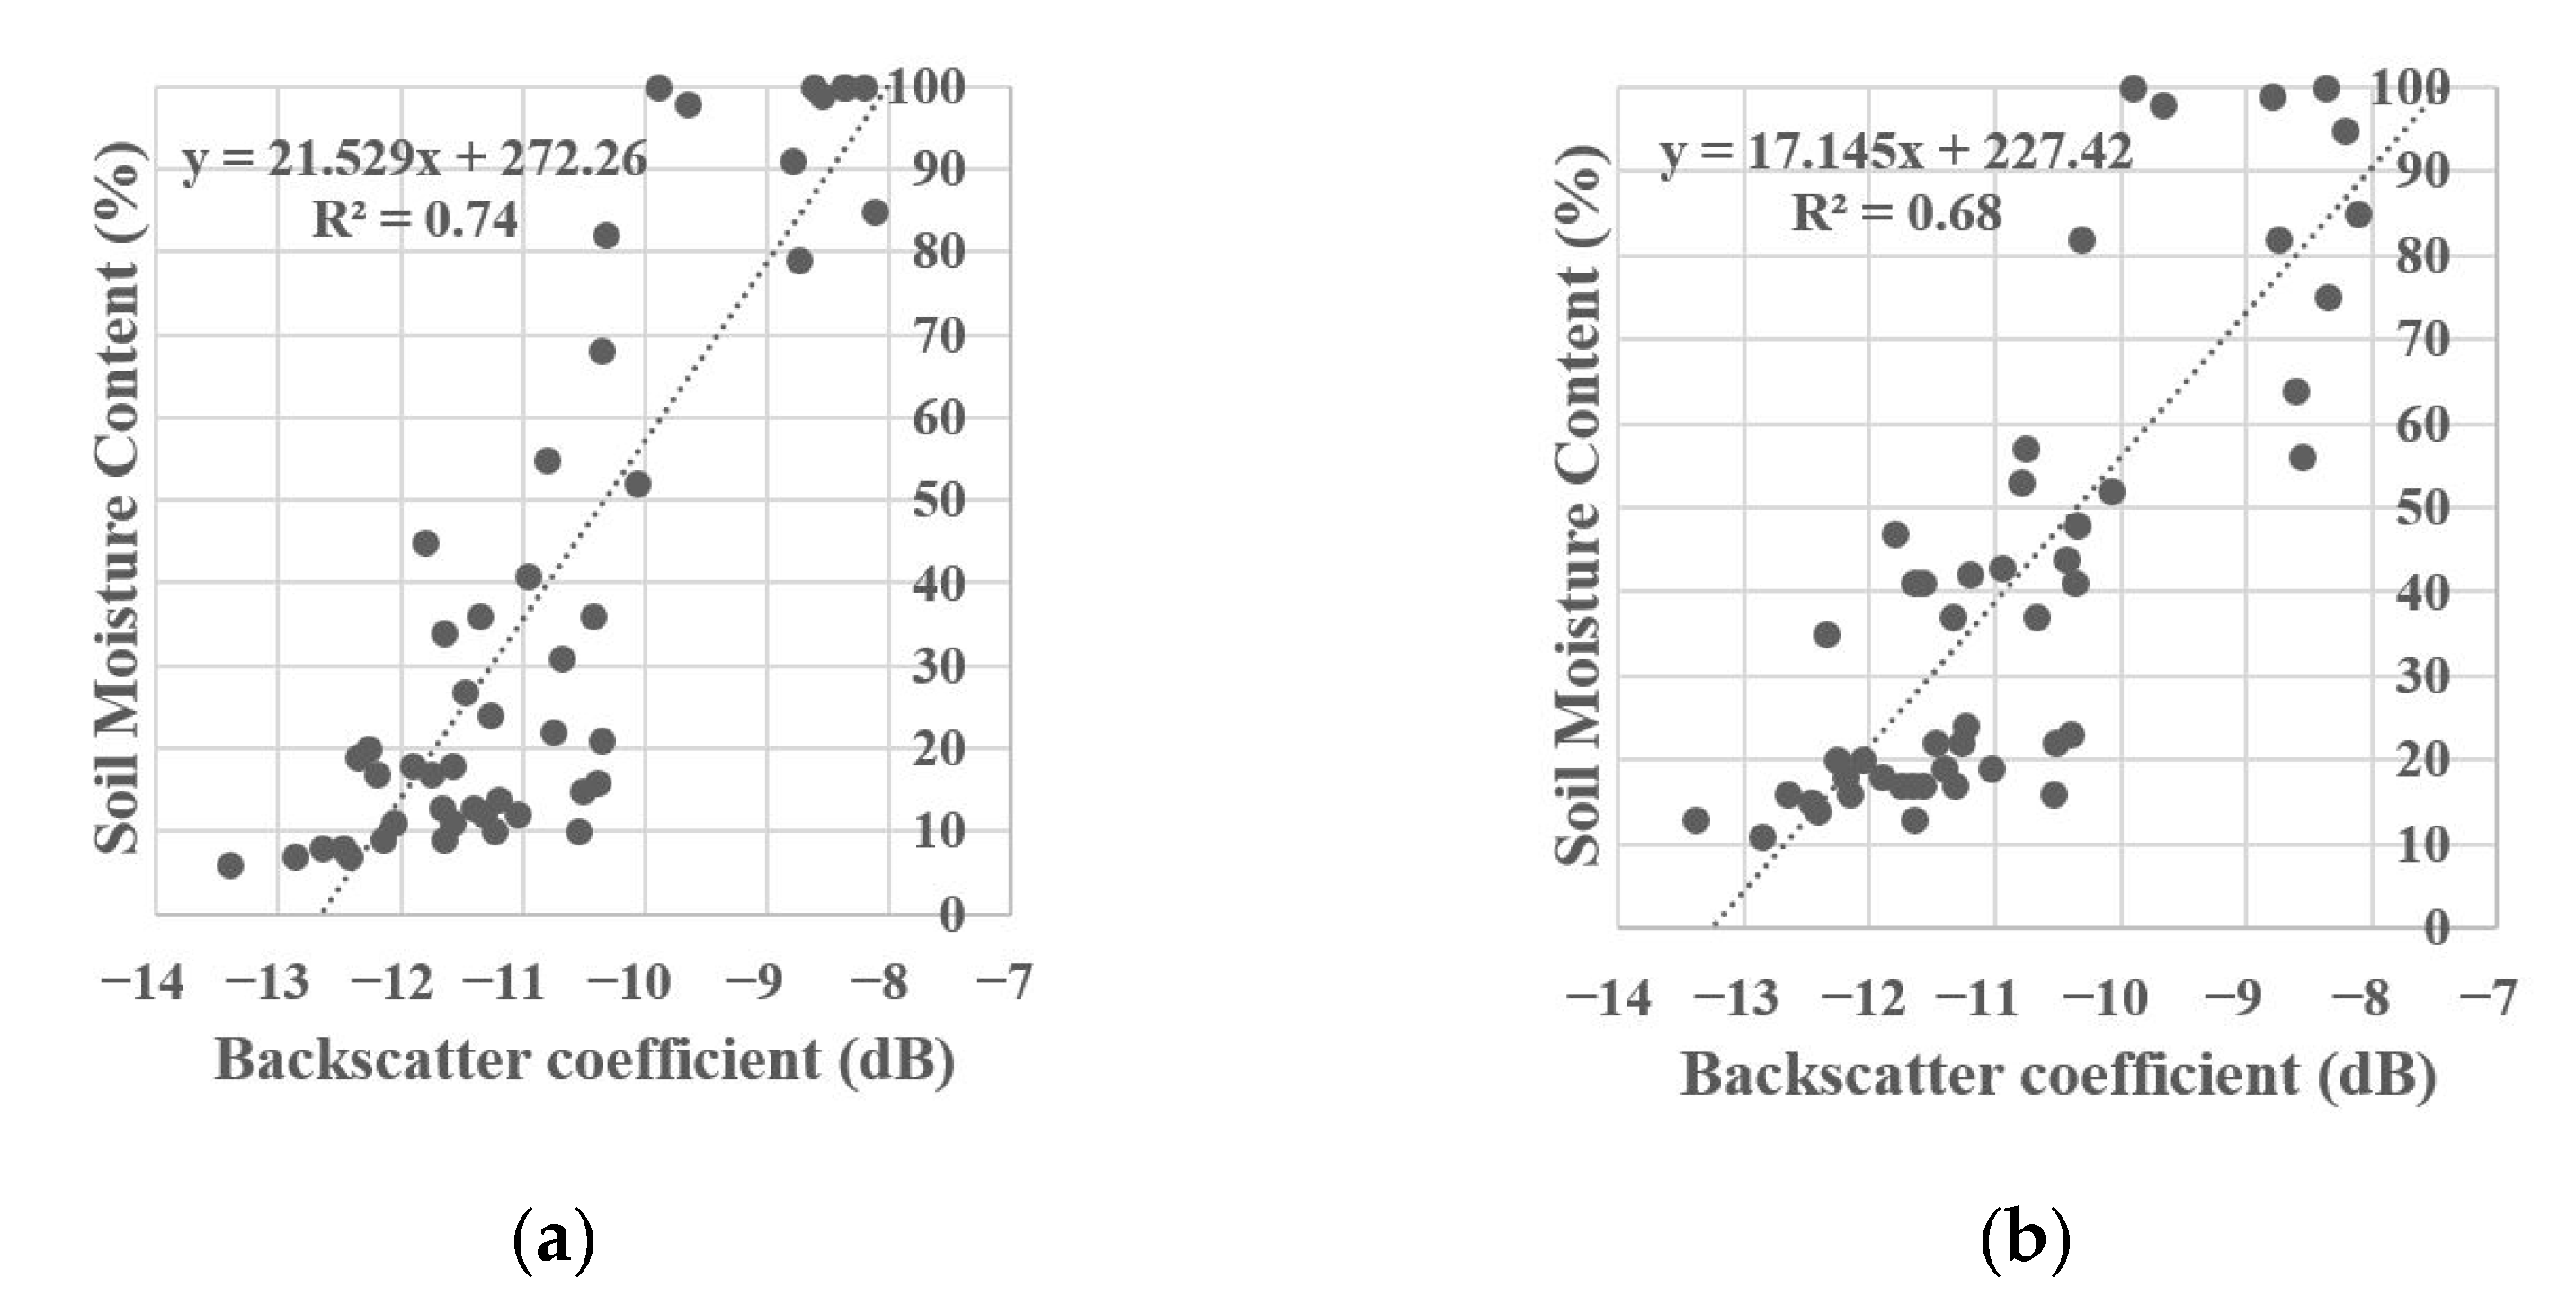
The relationship between the backscattering coefficient in the VV polarisations and in situ soil moisture at depths of 10 and 30 cm were used in the regression analysis to develop an algorithm for soil moisture estimations with Sentinel-1 data across the maize sites. The values used to analyse the relationship ranged from 2018 to 2020 (except June to November 2020) with 48 observations (N = 48).
The relationship between the in situ soil moisture data and Sentinel-1 data showed an R
2 value of 0.74 at a depth of 10 cm and 0.68 at a depth 30 cm, i.e., a significantly strong relationship (
Figure 6). The correlation at a depth of 10 cm was higher than that at a depth of 30 cm. Overall, the results obtained from the maize sites were consistent with the radar sensitivity in the C-band VV polarisation, which is suitable for estimating the soil moisture content near the surface in the study area.
To evaluate the empirical scattering model, the in situ soil moisture and soil moisture retrieved from the backscattering coefficient with an empirical scattering model were analysed using statistical analysis methods. For the retrieved soil moisture at a depth of 10 cm, the RMSE, MAE, and RE were approximately 16.94, 13.50, and 29.5%, respectively. For the retrieved soil moisture at a depth of 30 cm, the values of RMSE, MAE, and RE were approximately 15.63, 12.10, and 23.6%, respectively.
3.5. Comparison of Soil Moisture from CROPWAT8.0 and Sentinel-1 Retrieval Soil Moisture
After the relationship between the backscattering coefficient in the VV polarizations and in situ soil moisture at depths of 10 and 30 cm was determined (
Figure 6a,b, respectively), it was then used to generate the retrieved soil moistures at depths of 10 and 30 cm for the date when there was Sentinel-1 image data available.
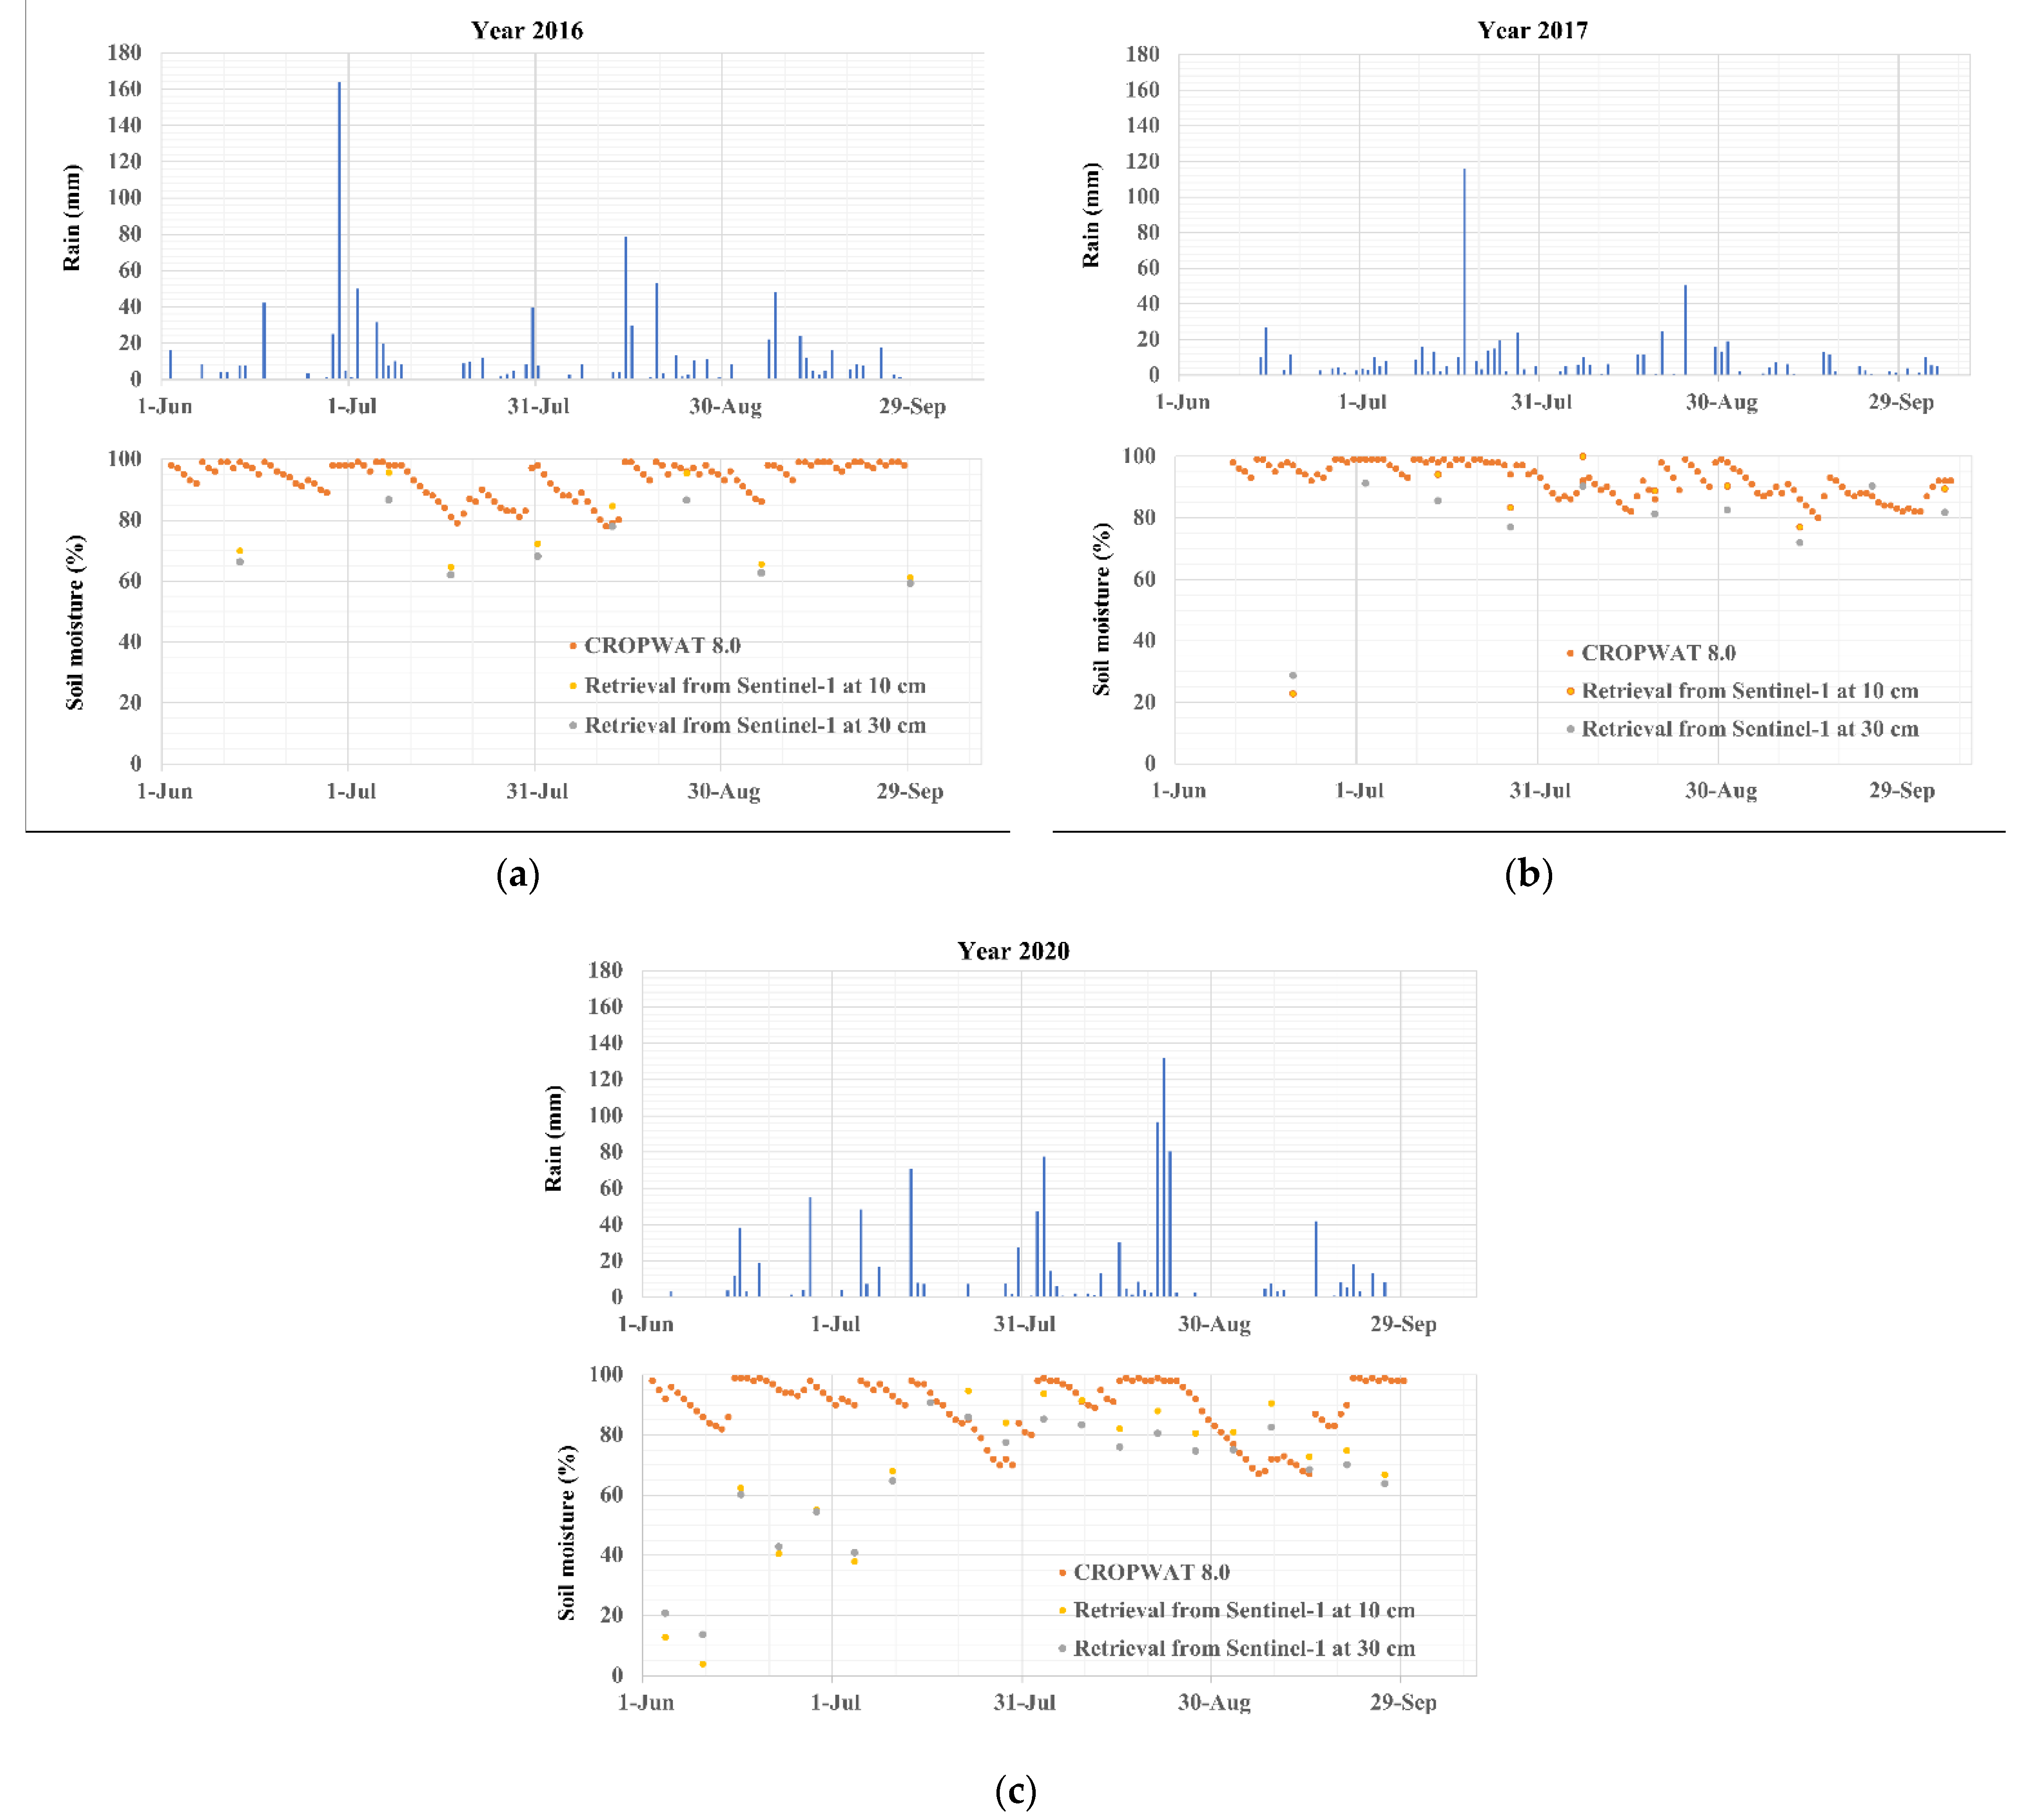
Figure 7 compares the soil moisture retrieval with that from CROPWAT8.0. As shown in
Figure 7, most of the retrieved soil moistures at depths of 10 and 30 cm were similar to the soil moisture from CROPWAT8.0, especially when considering the continuous rainfall conditions for multiple days. When there was no rain for multiple days between each rainfall event, the retrieved soil moisture was significantly different from the soil moisture obtained by CROPWAT8.0. Moreover, the soil moisture retrieved at a depth of 30 cm was more similar to that obtained by CROPWAT8.0 than the soil moisture retrieved at a depth of 10 cm.
4. Discussion
The in situ soil moisture at a depth of 10 cm was lower than the in situ soil moisture at a depth of 30 cm because crops can more easily extract soil moisture at 10 cm than at 30 cm; there was also a higher soil moisture loss at 10 cm due to surface evaporation. This is consistent with the results of Burns et al. [
21], who evaluated the in situ soil moisture at depths of 5, 20, and 50 cm in an agriculturally dominated region of Canada. They found that after an extended period of reduced rainfall, the soil moisture at 5 cm was lower than that at 20 and 50 cm because crops are more likely to utilise the available water in the upper soil, whereas the soil moisture in deeper layers is less exposed to surface evaporation. Moreover, this might be because of the nature of the plant root system, since the density and complexity of plant root systems are known to decrease with soil depth and roots are typically mainly distributed near the surface up to a depth of 20 cm [
22]. Further, the spatial distribution of roots may cause differences of infiltration depth in the soil profile [
23]. In addition, different root diameters may have different effects on the infiltration rate. According to Cui et al. [
24], fine roots (0–2 mm diameter) were found to be positively correlated with infiltration rate, while coarse roots (> 4.5 mm diameter) were negatively correlated with infiltration rate. That same study also determined that the percentage of root volume was the main factor influencing infiltration rate with increasing infiltration time.
It should be noted that when comparing the in situ soil moisture with that obtained by CROPWAT8.0, using the explanation above, the soil moisture from CROPWAT8.0 was higher than the in situ soil moisture at depths of 10 and 30 cm because it was the average soil moisture along the root zone in terms of the percent soil moisture at the field capacity. We note that the maximum root depth for maize was 100 cm [
8].
When there was continuous rainfall for several days, the in situ soil moisture and that from CROPWAT8.0 should have been high. However, the in situ soil moisture at 10 cm decreased earlier than the in situ soil moisture at 30 cm and that from CROPWAT8.0. In CROPWAT8.0, the response of the crop yield to the water supply could be generally quantified via the yield response factor. Comparing the growth stages of the crops, the maize yield response factors were 0.40, 0.40, 1.30, and 0.50 for the initial, development, mid-season, and late season stages, respectively [
8]. This indicates that the water deficit during the mid-season stage had the largest effect on the crop yield. This is because crops require more water to grow during the mid-season stage. For the maize varieties grown in the study area, the mid-season typically begins from days 51 to 90 after planting. In the year 2019, the mid-season stage ranged from 30 July to 7 September as the planting date was 10 June. As mentioned before, there was a decrease in the in situ soil moisture at 10 cm ca. mid-August, which was earlier than that for the in situ soil moisture at 30 cm (i.e., a decrease ca. 27 August) and that obtained from CROPWAT8.0 (i.e., a decrease on 4 September) in 2019, which was clearly during the mid-season. This is consistent with the NDVI graph in
Figure 4, which shows a high NDVI value during the mid-season stage at the peak of the graph in 2019 on September 8. Another possible reason is that during the mid-season growth stage, the maize was fully developed such that the large leaves prevented rainfall from reaching the ground. According to Hupet and Vanclooster [
25], the maize canopy has an important effect on the distribution of rainfall to the soil, in that some locations under the canopy may receive very large amounts of water via stemflow or throughfall, while other locations may receive much less. It is to be noted that throughfall is the portion of rainfall that directly reaches the soil surface without interacting with the canopy [
26]. The existence of the plant canopy causes the distribution of the rainwater reaching the ground to be very uneven, thereby causing non-uniformity in soil infiltration and forming the concentration of water in the local area [
26]. The leaves of a full canopy crop can be expected to funnel water to the soil; therefore, soil water near the soil surface should be higher shortly following a rain event. The reason for drier soil is that fully developed nodal roots would be very efficient in taking up soil water near the soil surface and would cause the soil to dry rapidly [
25,
26].
In addition, the obtained rainfall patterns were not uniform in this area because the closest rain station in the Thailand Meteorological Department used in CROPWAT8.0 was approximately 13.7 km from the study area. Moreover, the area surrounded by the weather station is more urban than the study area. This was a limitation of this study and should be addressed in future research. However, no other previous studies have compared the in situ soil moisture with the soil moisture from CROPWAT8.0.
Considering the relation between the backscatter from the Sentinel-1 satellite data and the in situ soil moisture, we obtained an R
2 of 0.74 at a depth of 10 cm and 0.68 at a depth of 30 cm, which is a significantly strong relationship. Compared with previous studies, the multiple linear regression between the in situ soil moisture probes and Sentinel-1 satellite data in the 2016 and 2017 cropping seasons in irrigated fields [
3] showed an R
2 of 0.60, mean error of −0.00 m
3·m
−3, and RMSE of 0.02 m
3·m
−3. When the retrieval soil moisture was validated with the soil moisture from CROPWAT8.0, most of the retrieved soil moistures at depths of 10 and 30 cm were similar to the soil moistures from CROPWAT8.0, especially during continuous rainfall events.
In this study, the in situ sensors were placed at 10 and 30 cm depths. In fact, the soil moisture sensors can be placed at various depths. However, we intended to use the in situ soil moisture sensor data to determine the relation with image data in order to estimate soil moisture retrieval (i.e., soil moisture from remote sensing data). In this study, we used the C-band signal. The C-band of Sentinel-1 could be easily accessed by the public but its penetrating depth is quite low. According to a previous study [
6], the penetrating depths of C-, L-, and P- bands are (3.75–7.5 cm), (15–30 cm), and (30–100 cm), respectively. It has been reported that C-band signal penetrates only into the top layers of the canopy, and therefore will experience mostly roughness scattering mixed with a limited amount of volume scattering [
27], while a L-band or P-band signal can have much deeper penetration and therefore can experience strongly enhanced volume scattering as well as increasing amounts of double-bounce scattering caused by the tree trunk. In addition, the L-band signal is more expensive because it is commercial while P-band was launched recently in 2020 [
27]. Therefore, we did not install sensors deeper than 30 cm and used a water balance model to verify the soil moisture at a certain depth in the root zone. If the L-band and P-band are made accessible by the public, it would be interesting to determine the soil moisture in the root zone using them in the future. Nevertheless, as L-band and P-band have some disadvantages with respect to double-bounce scattering, more information from other approaches such as water balance model would be beneficial.


