
Assessing the Environmental Footprint of Distiller-Dried Grains with Soluble Diet as a Substitute for Standard Corn–Soybean for Swine Production in the United States of America


Abstract
:1. Introduction
2. Methods
2.1. Diet Formulation
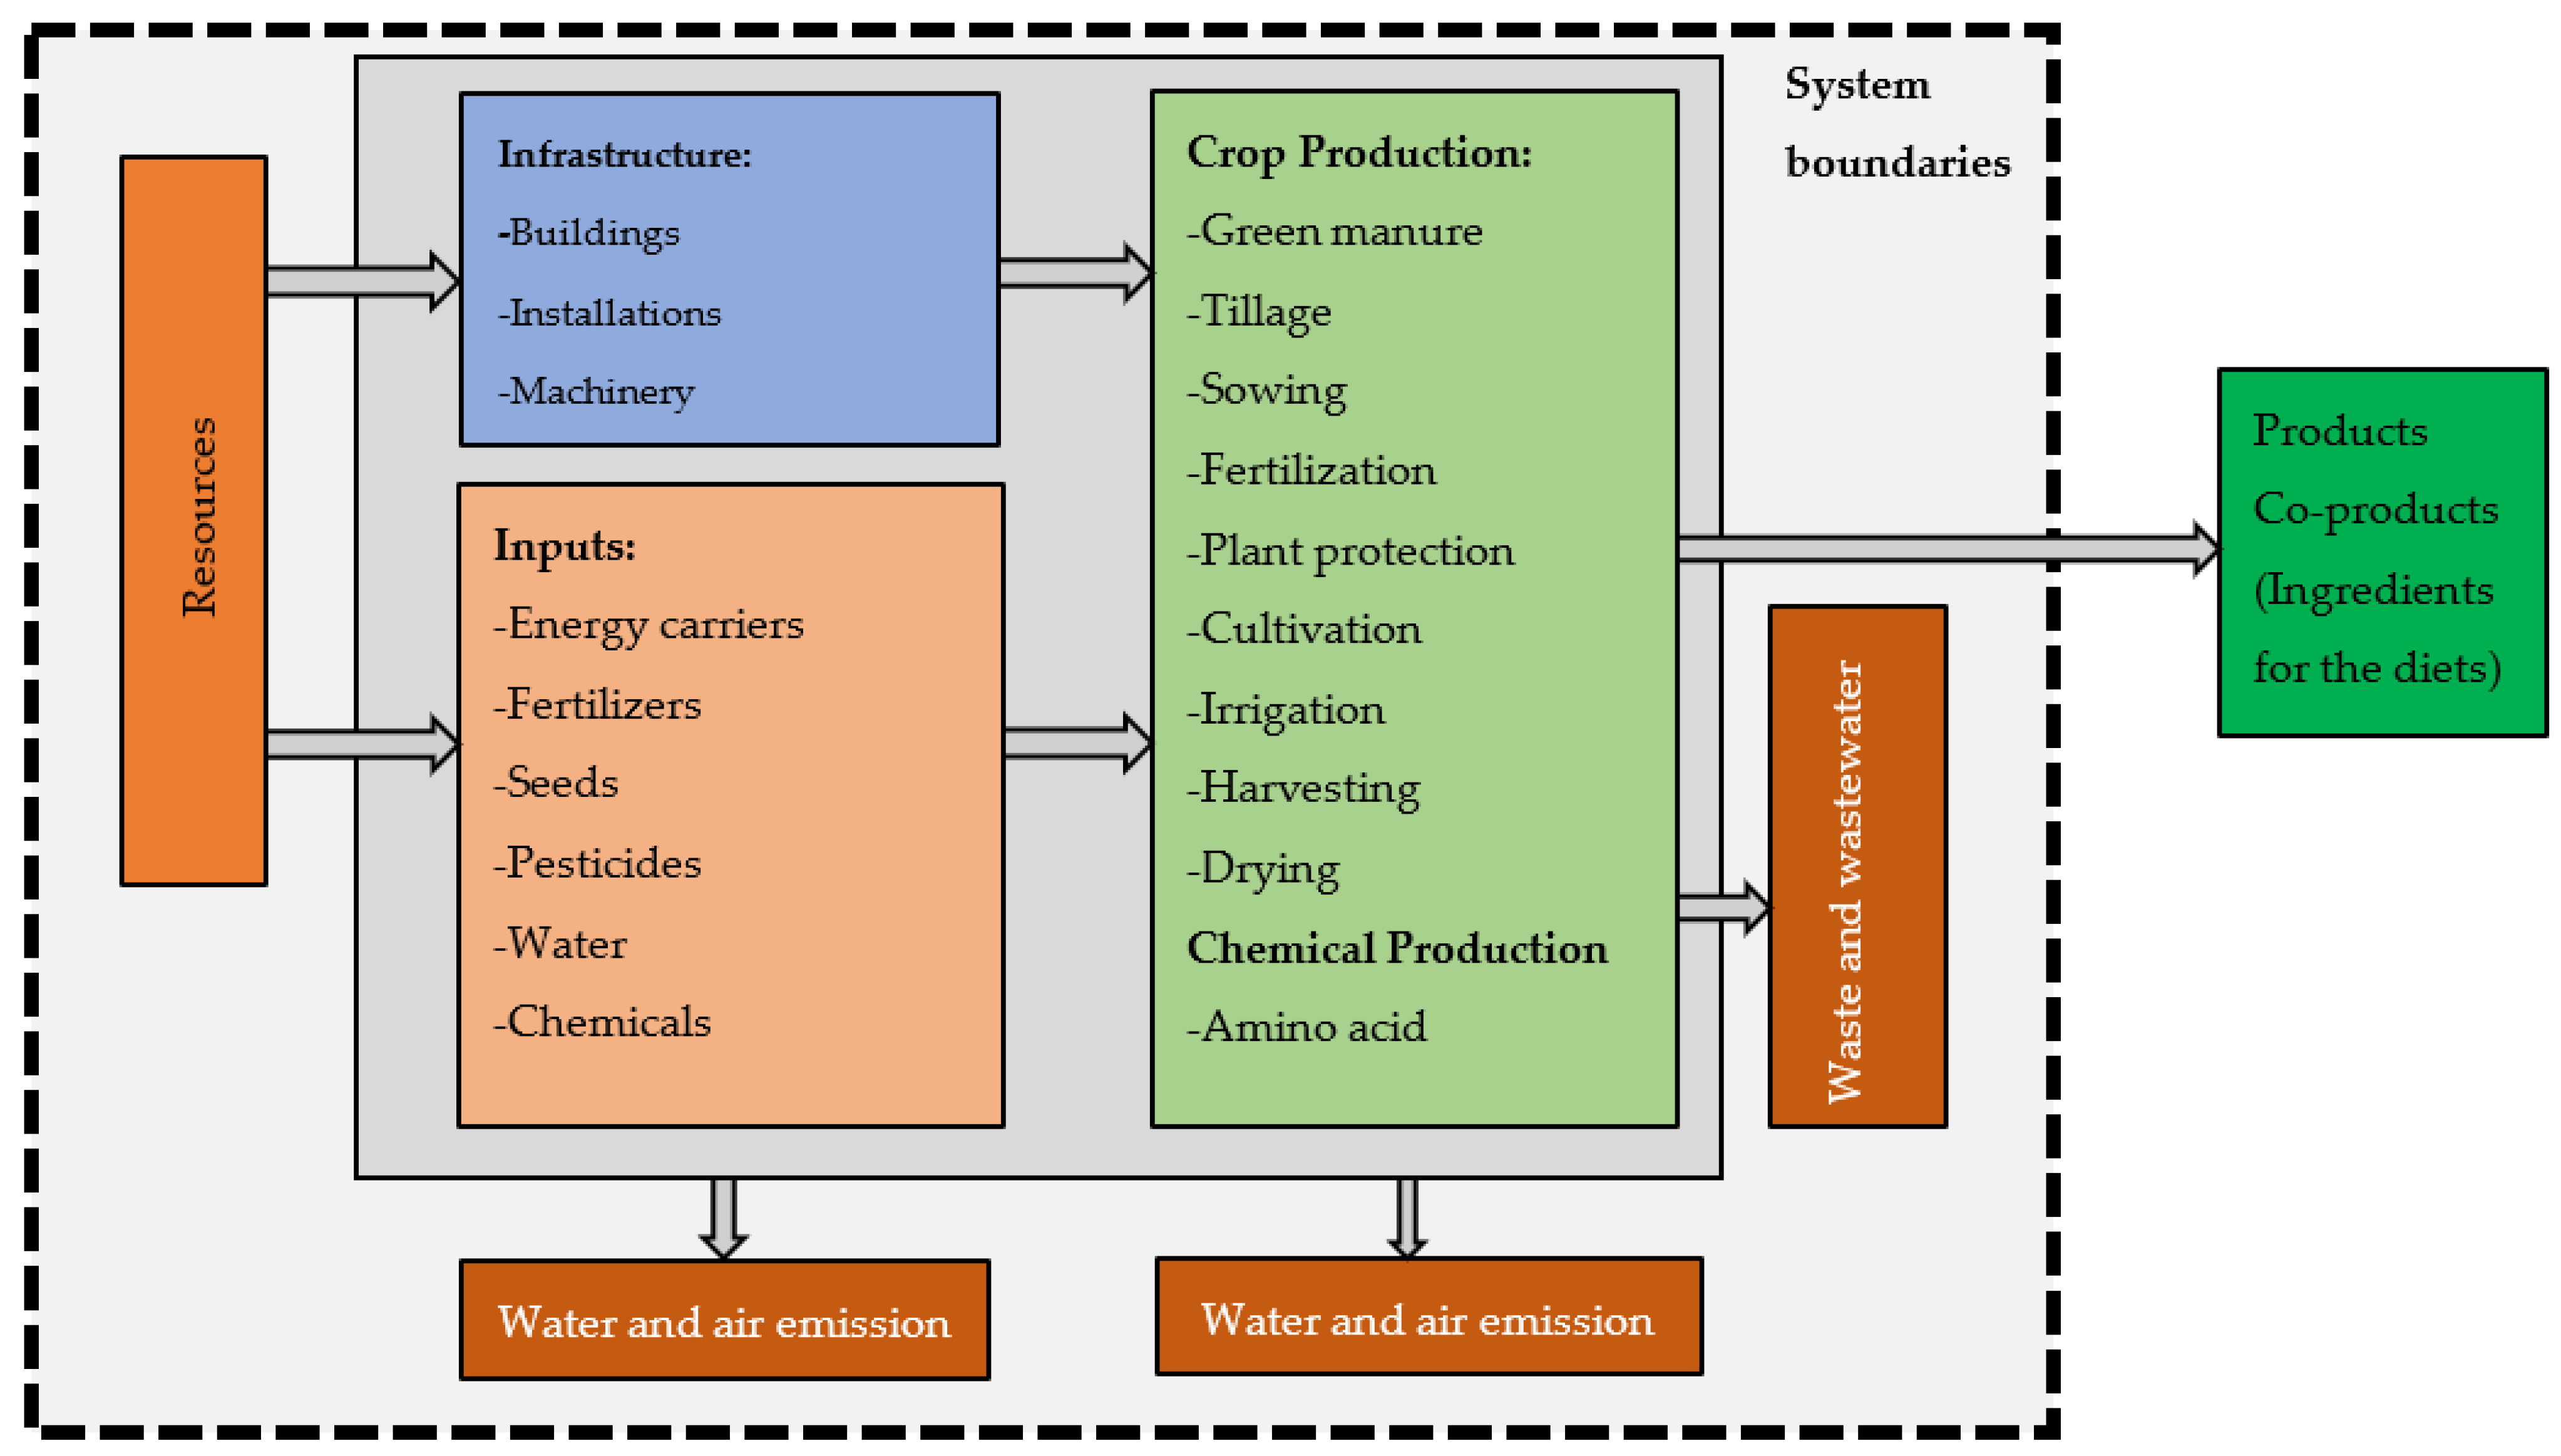
2.2. System Boundary and Functional Unit
2.3. Life Cycle Inventory
2.4. Life Cycle Impact Assessment Method (LCIA)
2.5. Environmental Footprints by Mass and Economic Allocation
3. Results and Discussion
3.1. Environmental Footprint of Individual Feed Ingredients
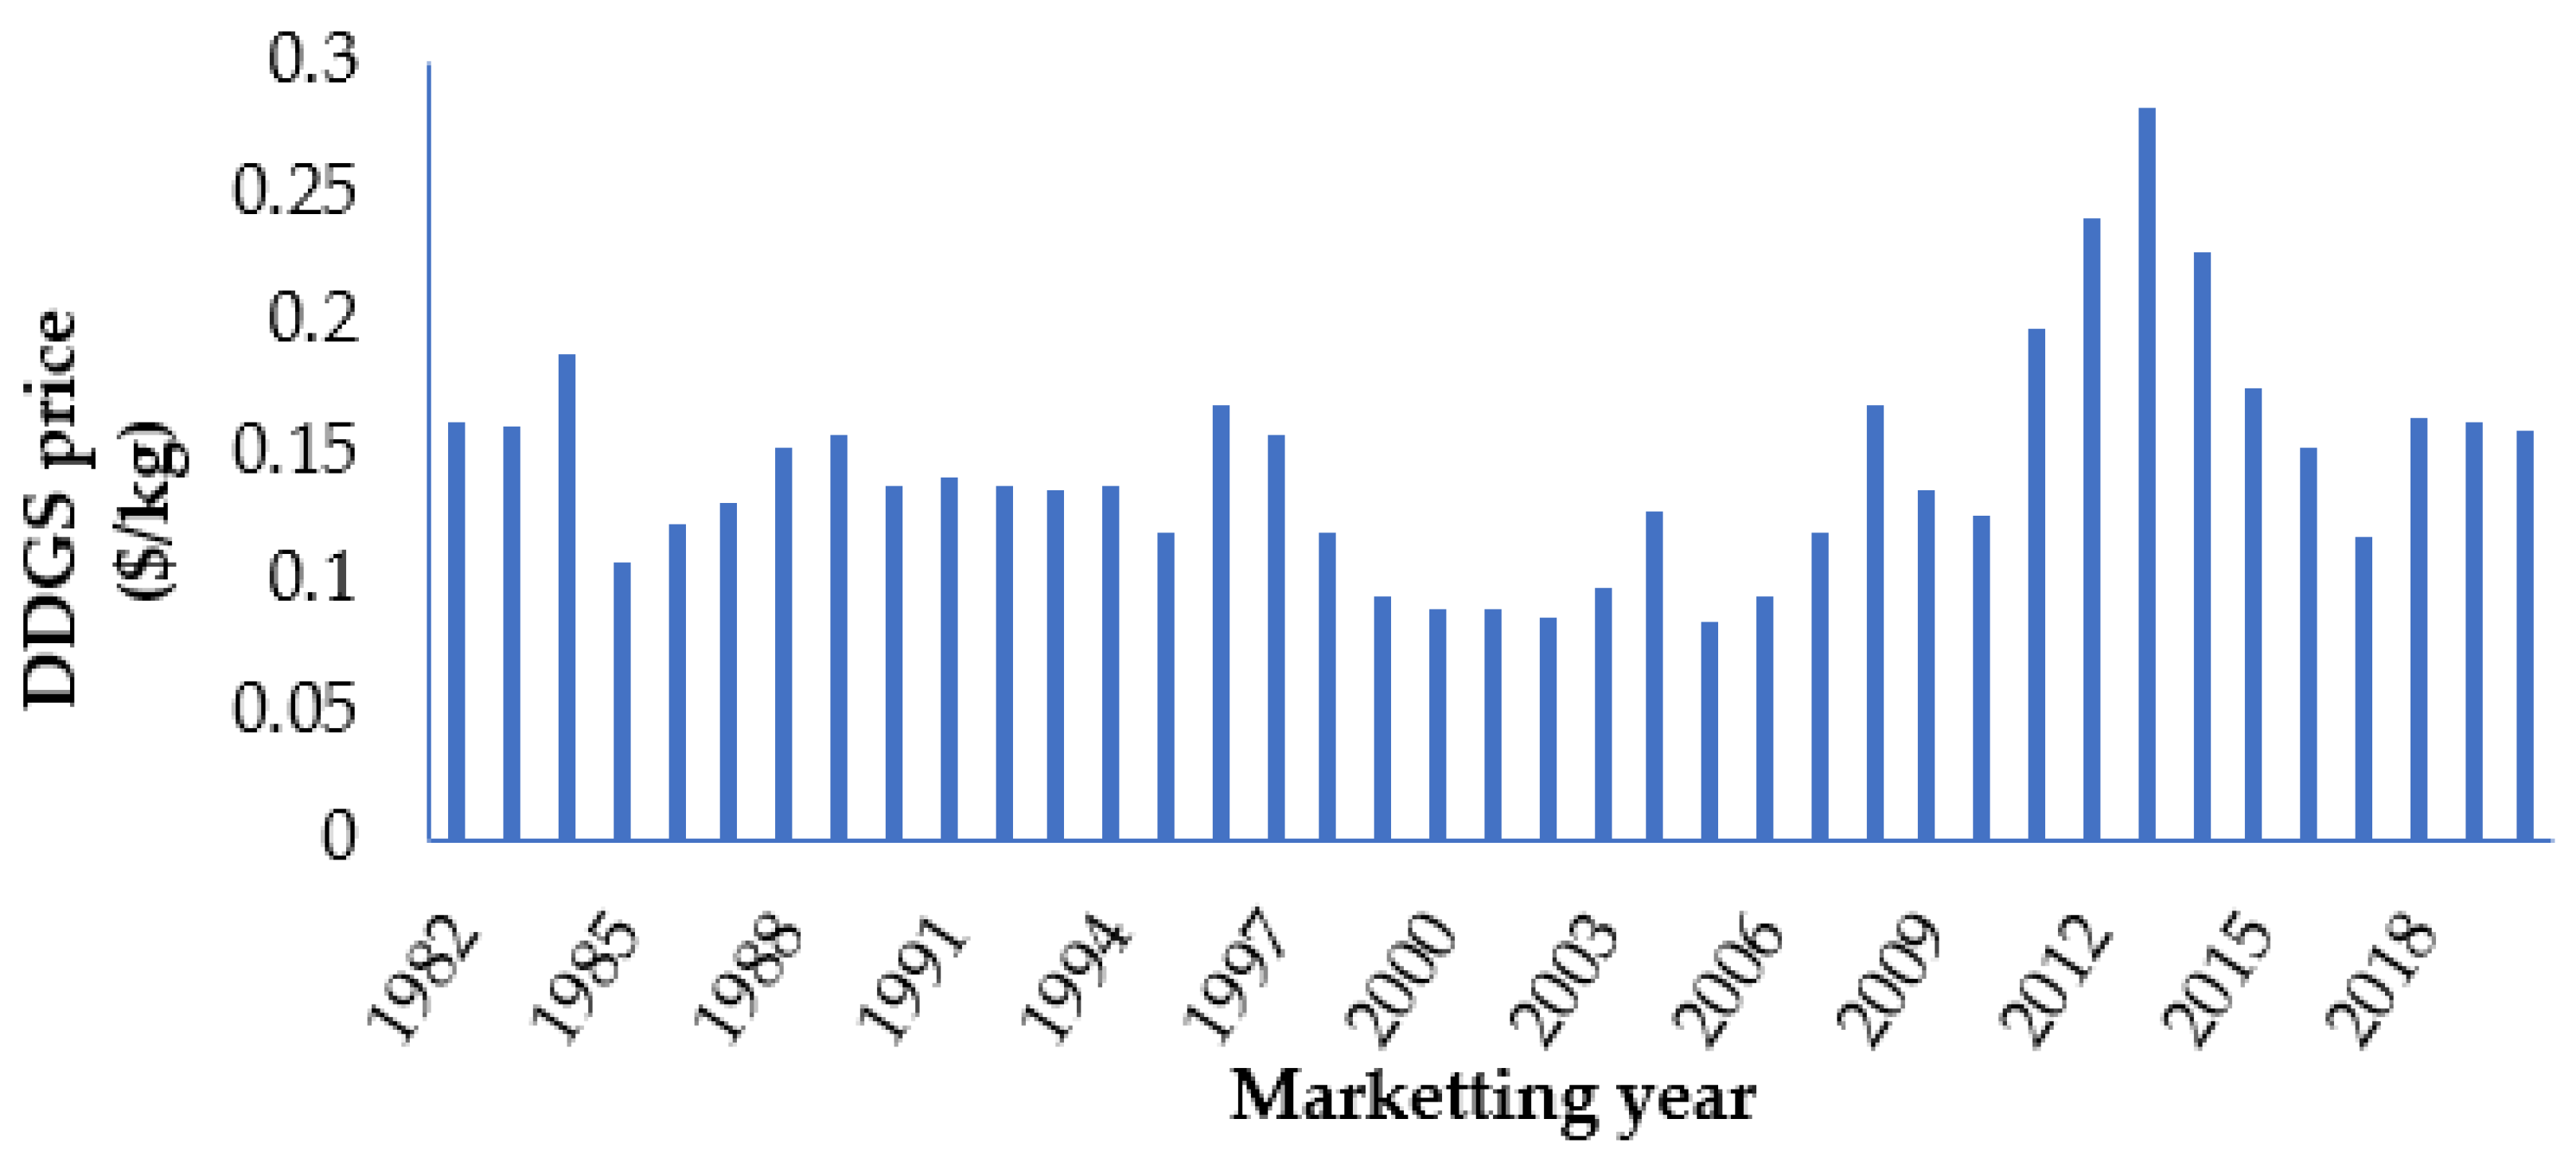
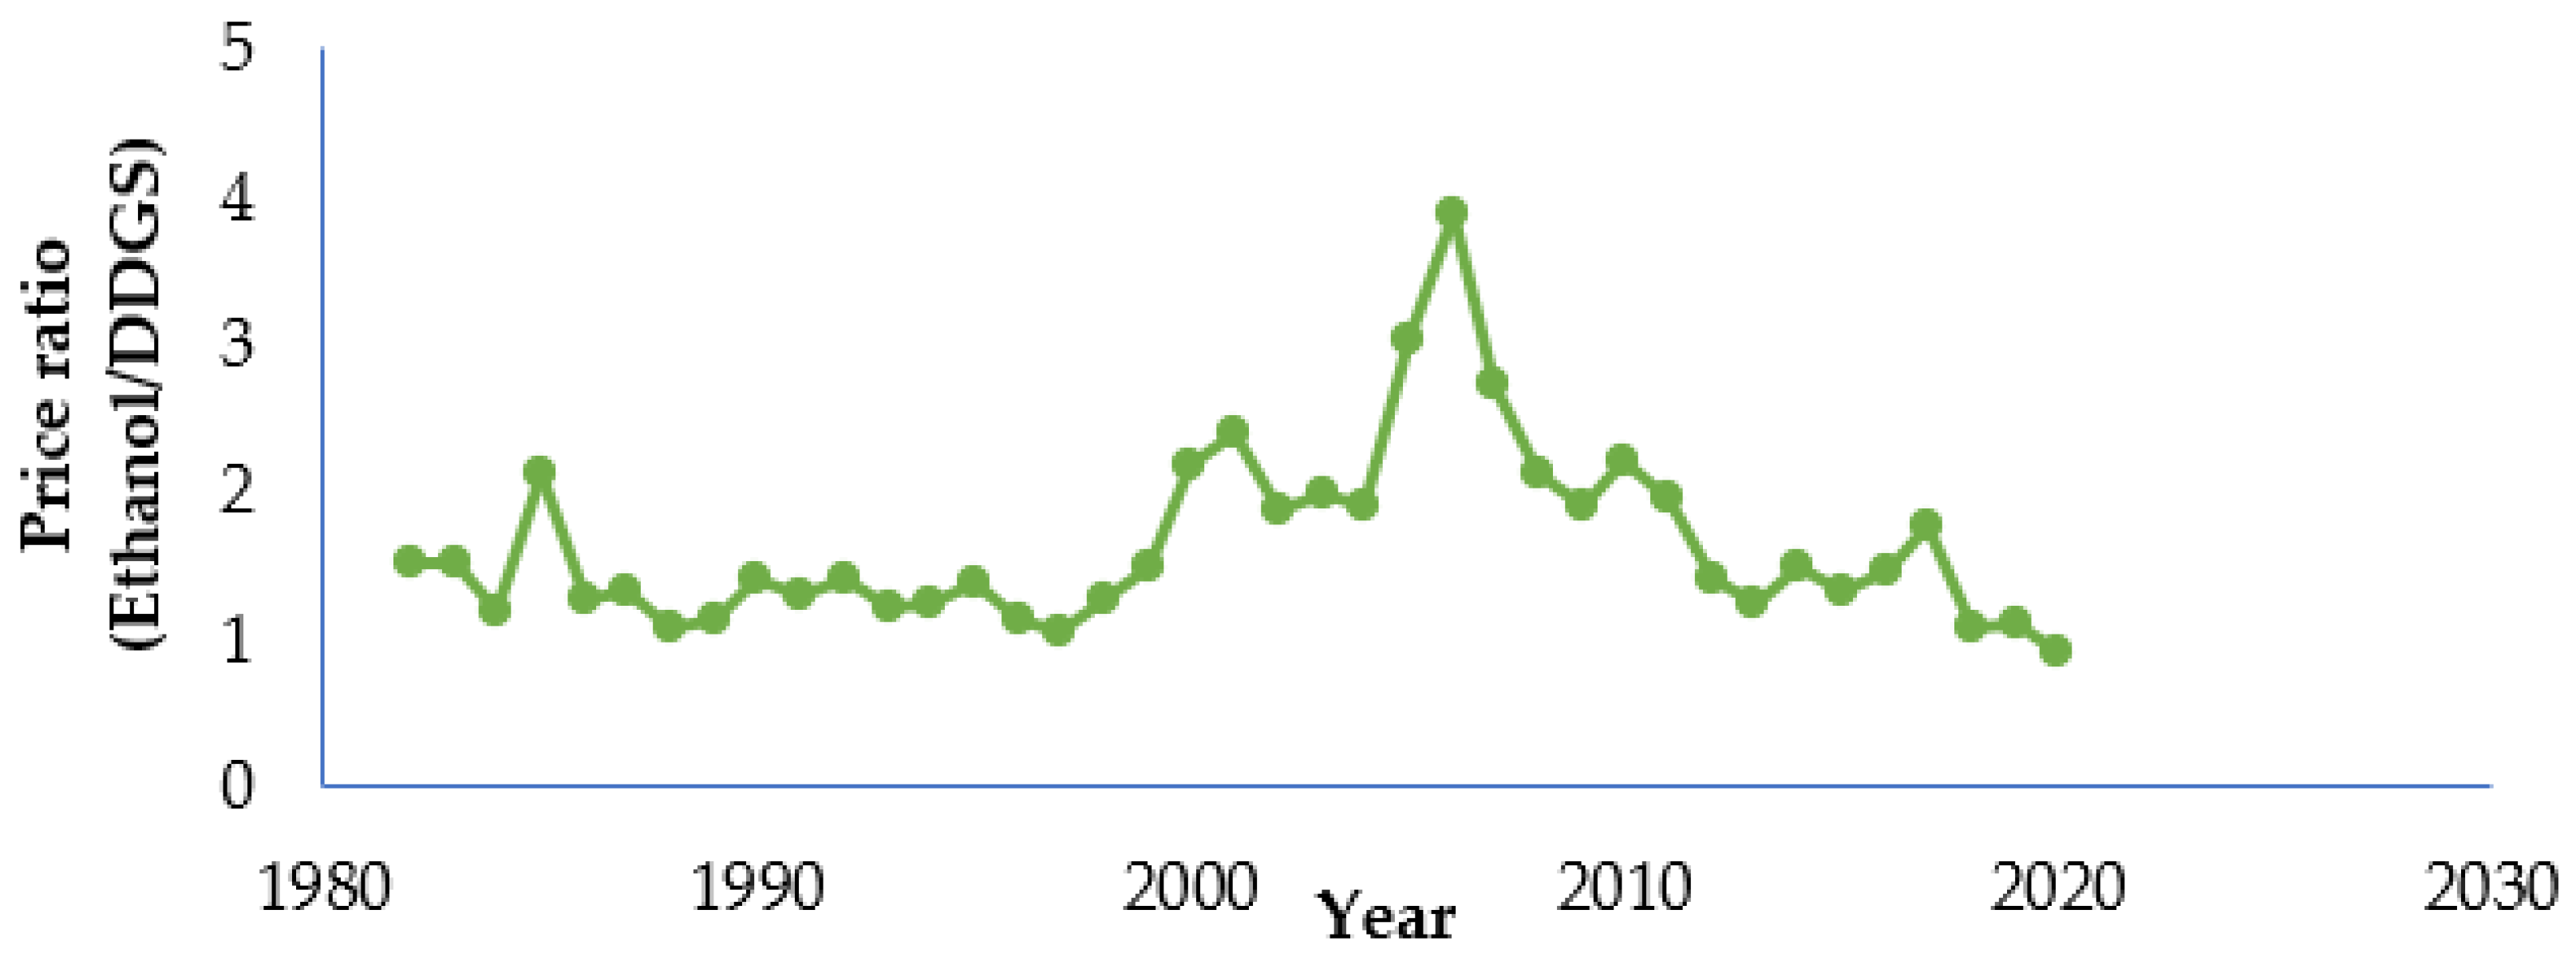
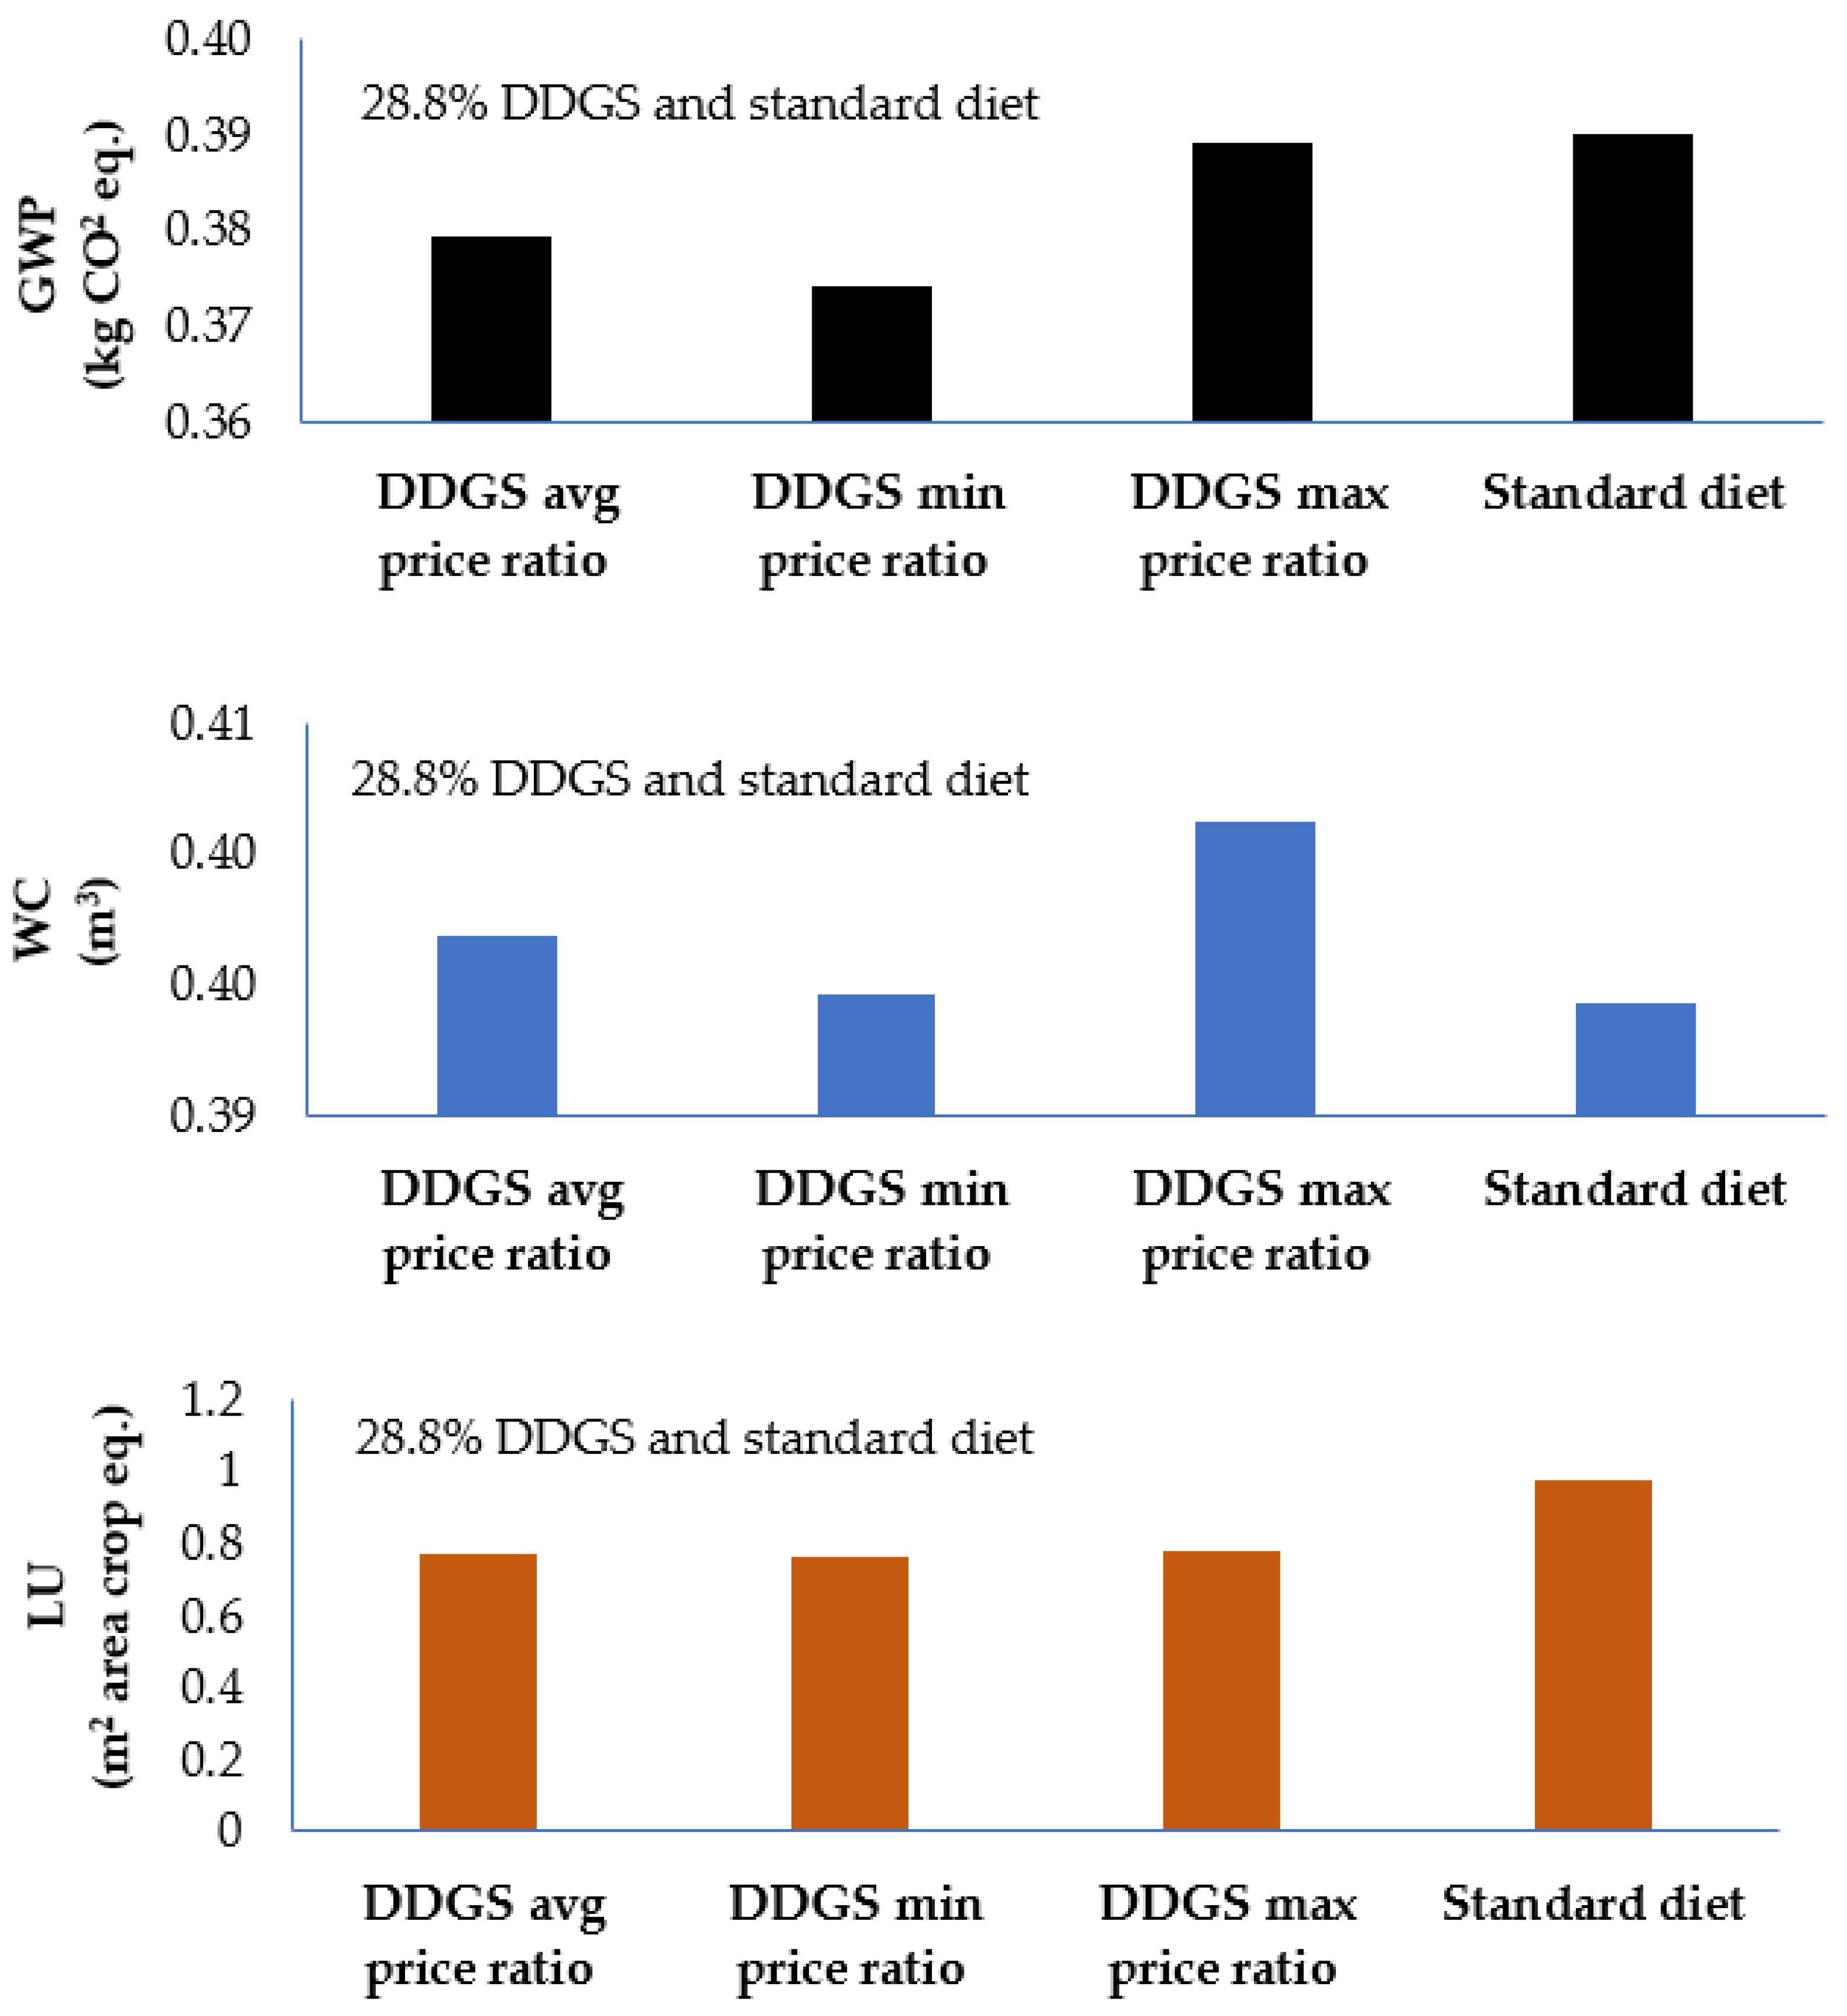
3.2. Sensitivity of Environmental Footprint to DDGS and Ethanol Price
3.3. Discussion
4. Conclusions and Limitations
- A DDGS displacement ratio of 0.65–0.69 can save a GWP of up to 0.12–0.49 million metric tons of CO2 eq. at the feed production stage on a national level.
- Though the DDGS displacement ratio of 0.65–0.69 does not significantly impact WC and FR, it can save up to 26% LU and 8% TE.
- The historic price elasticity of DDGS and ethanol did not influence the diet’s environmental footprint, indicating that the environmental footprint is not sensitive to the price of DDGS.
- With nutritional benefits and availability, DDGS remained one of the most important byproduct ingredients for the swine diet in the US.
- Although the amount of DDGS production is almost equal to the amount of ethanol in corn-based ethanol processing, with economic allocation, the environmental footprint of DDGS is lower than other ingredients in the diet.
Author Contributions
Funding
Institutional Review Board Statement
Informed Consent Statement
Data Availability Statement
Conflicts of Interest
Appendix A

| Nutrient Composition | Standard Corn-SBM Diet | 10.1% DDGS Diet | 28.8% DDGS Diet | ||||||||||||
|---|---|---|---|---|---|---|---|---|---|---|---|---|---|---|---|
| Phase 1 | Phase 2 | Phase 3 | Phase 4 | Phase 5 | Phase 1 | Phase 2 | Phase 3 | Phase 4 | Phase 5 | Phase 1 | Phase 2 | Phase 3 | Phase 4 | Phase 5 | |
| Weight Range (lb) | Weight Range (lb) | Weight Range (lb) | |||||||||||||
| 50–75 | 75–140 | 140–195 | 195–240 | 240–280 | 50–75 | 75–140 | 140–195 | 195–240 | 240–280 | 50–75 | 75–140 | 140–195 | 195–240 | 240–280 | |
| Gilt required SID Lys:NE Ratio | 4.52 | 3.80 | 3.17 | 2.82 | 2.54 | 4.52 | 3.80 | 3.17 | 2.82 | 2.54 | 4.52 | 3.80 | 3.17 | 2.82 | 2.54 |
| Calculated SID Lysine Required, % | 1.10 | 0.94 | 0.80 | 0.72 | 0.65 | 1.10 | 0.94 | 0.80 | 0.71 | 0.65 | 1.09 | 0.93 | 0.79 | 0.70 | 0.65 |
| PIC required SID Lys:NE Ratio | 5.08 | 4.23 | 3.45 | 3.10 | 3.03 | 5.08 | 4.23 | 3.45 | 3.10 | 3.03 | 5.08 | 4.23 | 3.45 | 3.10 | 3.03 |
| Calc. PIC SID Lysine Required, % | 1.24 | 1.05 | 0.87 | 0.79 | 0.77 | 1.24 | 1.05 | 0.87 | 0.78 | 0.77 | 1.22 | 1.03 | 0.85 | 0.77 | 0.77 |
| SID amino acids, % | |||||||||||||||
| Lys | 1.17 | 0.99 | 0.83 | 0.75 | 0.70 | 1.17 | 0.99 | 0.83 | 0.75 | 0.70 | 1.15 | 0.97 | 0.82 | 0.73 | 0.70 |
| Ile:Lys | 63 | 62 | 61 | 62 | 65 | 61 | 61 | 63 | 66 | 66 | 66 | 67 | 70 | 70 | 65 |
| Leu:Lys | 131 | 138 | 146 | 154 | 164 | 135 | 148 | 163 | 175 | 175 | 160 | 184 | 205 | 219 | 178 |
| Met:Lys | 32 | 31 | 30 | 28 | 30 | 31 | 29 | 29 | 31 | 32 | 29 | 33 | 36 | 38 | 32 |
| Met & Cys:Lys | 56 | 56 | 56 | 56 | 60 | 55 | 55 | 58 | 62 | 62 | 56 | 62 | 69 | 73 | 63 |
| Thr:Lys | 61 | 61 | 61 | 63 | 64 | 60 | 59 | 59 | 58 | 61 | 61 | 61 | 62 | 63 | 65 |
| Trp:Lys | 18.5 | 18.3 | 18.1 | 18.2 | 18.4 | 18.1 | 17.9 | 18.1 | 17.8 | 17.6 | 18.2 | 18.1 | 18.1 | 18.2 | 18.1 |
| Val:Lys | 69 | 69 | 70 | 72 | 76 | 68 | 70 | 74 | 78 | 78 | 76 | 80 | 86 | 89 | 78 |
| His:Lys | 42 | 42 | 43 | 44 | 47 | 41 | 42 | 44 | 47 | 47 | 45 | 47 | 50 | 51 | 47 |
| Total Lys, % | 1.31 | 1.11 | 0.94 | 0.85 | 0.80 | 1.32 | 1.13 | 0.96 | 0.87 | 0.81 | 1.34 | 1.15 | 0.99 | 0.89 | 0.81 |
| ME, kcal/lb | 1491 | 1497 | 1502 | 1506 | 1508 | 1490 | 1493 | 1500 | 1502 | 1506 | 1481 | 1483 | 1486 | 1488 | 1504 |
| NE Noblet Grow/Finish, kcal/lb | 1084 | 1107 | 1129 | 1138 | 1141 | 1007 | 987 | 1006 | 1011 | 1060 | 807 | 720 | 734 | 746 | 1032 |
| NE Noblet Sow, kcal/lb | 1125 | 1147 | 1167 | 1177 | 1179 | 1045 | 1022 | 1040 | 1045 | 1095 | 838 | 746 | 759 | 769 | 1066 |
| DE NRC, kcal/lb | 1554 | 1551 | 1549 | 1549 | 1550 | 1552 | 1548 | 1550 | 1549 | 1550 | 1551 | 1547 | 1544 | 1542 | 1548 |
| NE NRC, kcal/lb | 1103 | 1124 | 1144 | 1152 | 1155 | 1105 | 1123 | 1140 | 1146 | 1154 | 1092 | 1110 | 1122 | 1132 | 1152 |
| SID Lys:NE, g/Mcal | 4.81 | 3.99 | 3.29 | 2.95 | 2.75 | 4.80 | 4.00 | 3.30 | 2.97 | 2.75 | 4.78 | 3.97 | 3.32 | 2.92 | 2.76 |
| CP, % | 20.6 | 17.6 | 15.1 | 14.1 | 13.8 | 20.5 | 18.1 | 16.1 | 15.4 | 14.4 | 22.8 | 20.8 | 18.9 | 17.5 | 14.5 |
| Ca, % | 0.64 | 0.58 | 0.52 | 0.47 | 0.45 | 0.64 | 0.59 | 0.49 | 0.47 | 0.45 | 0.64 | 0.58 | 0.55 | 0.53 | 0.46 |
| P, % | 0.54 | 0.49 | 0.43 | 0.39 | 0.38 | 0.52 | 0.47 | 0.40 | 0.38 | 0.35 | 0.53 | 0.48 | 0.46 | 0.44 | 0.38 |
| Available P w/o phytase, % | 0.22 | 0.19 | 0.15 | 0.13 | 0.12 | 0.22 | 0.19 | 0.14 | 0.13 | 0.10 | 0.25 | 0.24 | 0.23 | 0.23 | 0.13 |
| Available P, % | 0.35 | 0.32 | 0.27 | 0.23 | 0.20 | 0.34 | 0.32 | 0.26 | 0.23 | 0.19 | 0.37 | 0.36 | 0.34 | 0.33 | 0.22 |
| Avail P:calorie ratio g/mcal | 1.05 | 0.96 | 0.81 | 0.70 | 0.62 | 1.05 | 0.96 | 0.78 | 0.71 | 0.56 | 1.14 | 1.10 | 1.05 | 1.00 | 0.67 |
| Stand. Dig. P w/out phytase, % | 0.30 | 0.26 | 0.21 | 0.19 | 0.18 | 0.28 | 0.24 | 0.19 | 0.18 | 0.15 | 0.29 | 0.26 | 0.24 | 0.23 | 0.18 |
| Stand. Dig. P with phytase, % | 0.40 | 0.37 | 0.31 | 0.28 | 0.26 | 0.39 | 0.35 | 0.29 | 0.27 | 0.23 | 0.40 | 0.36 | 0.34 | 0.33 | 0.26 |
| STTD Ca, % without phytase | 0.43 | 0.39 | 0.35 | 0.31 | 0.30 | 0.43 | 0.34 | 0.28 | 0.27 | 0.26 | 0.42 | 0.33 | 0.33 | 0.32 | 0.27 |
| STTD Ca, % with phytase | 0.47 | 0.43 | 0.38 | 0.34 | 0.33 | 0.47 | 0.43 | 0.35 | 0.34 | 0.32 | 0.46 | 0.41 | 0.39 | 0.37 | 0.33 |
| Ca:P | 1.17 | 1.18 | 1.22 | 1.19 | 1.18 | 1.23 | 1.26 | 1.22 | 1.22 | 1.26 | 1.20 | 1.20 | 1.20 | 1.20 | 1.21 |
| STTD Ca:STTD P | 1.17 | 1.16 | 1.22 | 1.22 | 1.28 | 1.21 | 1.22 | 1.21 | 1.25 | 1.38 | 1.17 | 1.13 | 1.13 | 1.15 | 1.29 |
| Cost/ton | $194.04 | $180.35 | $167.03 | $160.54 | $156.90 | $190.46 | $175.40 | $163.19 | $156.48 | $152.95 | $183.73 | $169.60 | $159.41 | $153.25 | $154.60 |
| Cost with processing | $206.04 | $192.35 | $179.03 | $172.54 | $168.90 | $202.46 | $187.40 | $175.19 | $168.48 | $164.95 | $195.73 | $181.60 | $171.41 | $165.25 | $166.60 |
| Feed budget, lb/pig | 50 | 155 | 158 | 148 | 145 | 50 | 155 | 158 | 149 | 145 | 51 | 157 | 161 | 150 | 146 |
| Feed cost, $/pig | $5.17 | $14.86 | $14.13 | $12.74 | $12.27 | $5.07 | $14.49 | $13.87 | $12.52 | $11.99 | $4.96 | $14.21 | $13.79 | $12.42 | $12.13 |
| Inputs from Nature | |
|---|---|
| 1 Yield (lb/acre) | 9699.2 |
| *,2 Water, unspecified natural origin, US (L) | 77.5 |
| *,3 Occupation, annual crop (land-m2a) | 0.4047 |
| Inputs from Technosphere: Materials/Fuels | |
| *,3 Corn seed IP, at regional storehouse/US U (lb) | 0.104020385 |
| *,4 Nitrogen ecoprofile, as N, at regional storehouse/US U (lb) | 0.007423293 |
| *,4 Phosphate ecoprofile, as P, at regional storehouse/US U (lb) | 0.005464368 |
| *,3 Manure, fertilizer, as applied N, at field/US U (lb) | 0.001545702 |
| *,4 Potash ecoprofile, at regional storehouse/US U (lb) | 0.007320191 |
| *,3 Lime ecoprofile, at factory/US U (lb) | 0.000820022 |
| Boron, at factory/US U (lb) | 0 |
| *,4 Sulfur, at regional storehouse/US U(lb) | 0.001340317 |
| *,5 Corn herbicides, at regional storehouse/US U (lb) | 0.000409002 |
| *,5 Corn insecticides, at regional storehouse/US U (lb) | 0.000119708 |
| *,6 Diesel produced and combusted, at industrial boiler/US U (gal) | 0.00005480480 |
| *,6 Gasoline produced and combusted, at equipment/US U (gal) | 0.000006094 |
| *,7 Fungicides, at regional storehouse/US- US-EI U (lb) | 0.000047322 |
| *,5 Corn pesticides from NASS (emissions only)/US U (m2) | 0.4047 |
| * Corn air, soil and water emissions (PO4 + NO3)/US U (m2) | 0 |
| * Transport, lorry 16–32t, EURO3/US- US-EI U (kgkm) | 45 |
| Inputs from technosphere: electricity/heat | |
| *,6 Natural gas produced and combusted, at industrial furnace/US U (cuft) | 0.000243589 |
| *,6 Electricity, at grid, Western US NREL/US U (kwh) | 0.00222624 |
| *,6 LPG production and combustion, at industrial boiler/US U_NPB_Wheat middling (lb) | 0.0024239 |
| Inputs from Nature | |
|---|---|
| Yield (lb/acre) | 29,582 |
| *,1 Water, unspecified natural origin, US (L) | 79.5 |
| *,2 Occupation, annual crop (m2a) | 0.76056338 |
| Inputs from Technosphere: Materials/Fuels | |
| *,1 Soybean seed IP, at regional storehouse/US U (lb) | 0.03 |
| *,3 Nitrogen ecoprofile, as N, at regional storehouse/US U (lb) | 0.006085193 |
| *,3 Phosphate ecoprofile, as P, at regional storehouse/US U (lb) | 0.017579446 |
| *,3 Potash ecoprofile, at regional storehouse/US U (lb) | 0.03076403 |
| *,1 Lime ecoprofile, at factory/US U (lb) | 0.202713707 |
| Boron, at factory/US U (lb) | 0 |
| *,3 Sulfur, at regional storehouse/US U (lb) | 0.005070994 |
| *,4 Soybean herbicides, at regional storehouse/US U (lb) | 0.005551048 |
| *,4 Soybean insecticides, at regional storehouse/US U (lb) | 0.00053854 |
| *,5 Diesel produced and combusted, at industrial boiler/US U (gal) | 0.001680335 |
| *,5 Gasoline produced and combusted, at equipment/US U (gal) | 0.000418155 |
| *,4 Soybean fungicides, at regional storehouse/US- US-EI U (gal) | 0.000328938 |
| *,6 Soybeans pesticides from NASS (emissions only)/US U (m2) | 0.76056338 |
| Soybean air, soil and water emissions (PO4 +NO3)/US U (m2) | 0 |
| Inputs from technosphere: electricity/heat | |
| *,5 Natural gas produced and combusted, at industrial furnace/US U (cuft) | 0.015668 |
| *,5 Electricity, at grid, Eastern US NREL/US U (kwh) | 0.004321821 |
| *,5 LPG production and combustion, at industrial boiler/US U_NPB_Wheat middling (kg) | 0.000252827 |
| Inputs from Nature | |||
|---|---|---|---|
| Lysine | Methionine | Threonine | |
| 1 Water, cooling, unspecified natural origin, US (m3) | 0.072 | 0.024 | 0.009 |
| 1 Water, unspecified natural origin, US (m3) | 0 | 0.00041 | 0 |
| Inputs from Techno-Sphere: Materials/Fuels | |||
| 1 Glucose {GLO}| market for glucose|APOS, U (kg) | 0 | 0 | 3 |
| 1 Maize fibre/bran, wet, from wet milling (grinding and screening), at plant/US Economic (kg) | 0.3 | 0 | 1 |
| 1 Sugar, from sugar cane, from sugar production, at plant/US Mass | 3.5 | 0 | 0 |
| 1 Ammonia, liquid, at regional storehouse/US- US-EI U (kg) | 0.155 | 0 | 0.700 |
| 1 Sulfuric acid (98% H2SO4), at plant/RER Mass (kg) | 0.320 | 0 | 1.5 |
| 1 Phosphoric acid, industrial grade, 85% in H2O, at plant/US- US-EI U (kg) | 0.025 | 0 | 0.004 |
| 1 Manganese sulfate {GLO}| production|Cut-off, U as salt (kg) | 0.005 | 0 | 0.001 |
| 1 Sodium hydroxide, 50% in H2O, production mix, at plant/US- US-EI U as caustic (kg) | 0.0045 | 0 | 0.370 |
| 1 Water, deionized, at plant/US US-EI U for fermentation and cleaning (kg) | 0.0046 | 0 | 120 |
| 1 Nitric acid, 50% in H2O, at plant/US- US-EI U as cleaning agent (kg) | 0.0015 | 0 | 0.08 |
| 1 C16-18 fatty alcohol from palm oil (No. 13a-Matrix), at plant, 100% active substance/EU-27 as antifoam (kg) | 0.01 | 0 | 0 |
| # Methionine/US- US-EI U_NPB as source of amino acids (kg) | 0.04 | 0 | 0 |
| # Lysine-HCl at plant/US- US-EI U_NPB as amino acid source (kg) | 0 | 0 | 0.004 |
| 1 Transport, freight, rail/US- US-EI U (tkm) | 0.519 | 0.519 | 0.519 |
| 1 Transport, lorry > 16t, fleet average/US- US-EI U (tkm) | 0.0865 | 0.0865 | 0.0865 |
| 1 Chemical plant, organics/US-/I US-EI U (p refers to 1 process) | 0.0000000004 | 0.0000000004 | 0.0000000004 |
| 1 Electricity, natural gas, at power plant NREL/US U (MJ) | 0.003935 | 16 | 0.012 |
| 1 Dummy process steam copied from USLCI (MJ) | 0.000678 | 0 | 0.0006 |
| 1 Acrylic acid {GLO}|market for|APOS, U (kg) | 0 | 0.376 | 0 |
| 1 Methanol, at regional storage/US* US-EI U (kg) | 0 | 0.228 | 0 |
| 1 Hydrogen sulfide {GLO}| market for|APOS, U (kg) | 0 | 0.215 | 0 |
| 1 Hydrogen cyanide {GLO}| market for|APOS, U (kg) | 0 | 0.181 | 0 |
| 1 Ammonium bicarbonate, at plant/US- US-EI U (kg) | 0 | 1.61 | 0 |
References
- Ikram, M.; Sroufe, R.; Awan, U.; Abid, N. Enabling Progress in Developing Economies: A Novel Hybrid Decision-Making Model for Green Technology Planning. Sustainability 2021, 14, 258. [Google Scholar] [CrossRef]
- D’Adamo, I.; Gastaldi, M.; Morone, P.; Rosa, P.; Sassanelli, C.; Settembre-Blundo, D.; Shen, Y. Bioeconomy of Sustainability: Drivers, Opportunities and Policy Implications. Sustainability 2021, 14, 200. [Google Scholar] [CrossRef]
- Thaler, B.; Holden, P.J. By-Products in Swine Diets. Pork Industry Handbook, Purdue Extension. 2001. Available online: https://www.extension.purdue.edu/extmedia/as/07-06-01.pdf (accessed on 9 September 2018).
- Stein, H.H.; Shurson, G.C. BOARD-INVITED REVIEW: The use and application of distillers dried grains with solubles in swine diets. J. Anim. Sci. 2009, 87, 1292–1303. [Google Scholar] [CrossRef] [PubMed] [Green Version]
- Stein, H.H. Distillers Dried Grains with Solubles (DDGS) in Diets Fed to Swine. Swine Focus #001. University of Illinois Urbana-Champaign IL. 2007. Available online: https://nutrition.ansci.illinois.edu/sites/default/files/SwineFocus001.pdf (accessed on 24 November 2021).
- Klashing, K.C. Displacement Ratios for US corn DDGS. The International Council of Clean Transportation, Working Paper 2012-3. Available online: https://theicct.org/wp-content/uploads/2021/06/ICCT_US-DDGS_May2012.pdf (accessed on 24 November 2021).
- Rebitzer, G.; Ekvall, T.; Frischknecht, R.; Hunkeler, D.; Norris, G.; Rydberg, T.; Schmidt, W.P.; Suh, S.; Weidema, B.P.; Penning-ton, D.W. Life cycle assessment part 1: Framework, goal and scope definition, inventory analysis, and applications. Environ. Int. 2004, 30, 701–720. [Google Scholar] [CrossRef] [PubMed]
- 2013/179/EU: Commission Recommendation of 9 April 2013 on the Use of Common Methods to Measure and Communicate the Life Cycle Environmental Performance of Products and Organisations. Text with EEA Relevance OJ L 124, 4.5.2013, p. 1–210 (BG, ES, CS, DA, DE, ET, EL, EN, FR, IT, LV, LT, HU, MT, NL, PL, PT, RO, SK, SL, FI, SV). Available online: https://eur-lex.europa.eu/legal-content/EN/TXT/?uri=CELEX:32013H0179 (accessed on 4 February 2016).
- ISO 14044: 2006(en) Environmental Management-Life Cycle Assessment-Requirements and Guidelines. Life Cycle Assessment. Technical Committee ISO/TC 207, Environmental Management, Subcommittee SC 5. Available online: https://www.iso.org/obp/ui/#iso:std:iso:14044:ed-1:v1:en (accessed on 24 November 2021).
- National Hog Farmer. Econutrion: Reducing Environmental Impact without Comprising Productivity. 2020. Available online: https://www.nationalhogfarmer.com/nutrition/econutrition-reducing-environmental-impacts-without-comprising-productivity-0 (accessed on 23 November 2021).
- Lammers, P.J.; Kenealy, M.D.; Kliebenstein, J.B.; Harmon, J.D.; Helmers, M.J.; Honeyman, M.S. Nonsolar energy use and one-hundred-year global warming potential of Iow swine feedstuffs and feeding strategies. J. Anim. Sci. 2010, 88, 1204–1212. [Google Scholar] [CrossRef] [PubMed]
- Mackenzie, S.G.; Leinonen, I.; Ferguson, N.; Kyriazakis, I. Can the environmental impact of pig production systems be reduced by utilizing co-products as feed? J. Cleaner Prod. 2016, 115, 172–181. [Google Scholar] [CrossRef]
- Mackenzie, S.G.; Leinonen, I.; Ferguson, N.; Kyriazakis, I. Towards a methodology to formulate sustainable diets for livestock: Accounting for environmental impact in diet formulation. Br. J. Nutr. 2016, 115, 1860–1874. [Google Scholar] [CrossRef] [PubMed] [Green Version]
- Kebreab, E.; Liedke, A.; Caro, D.; Deimling, S.; Binder, M.; Finkbeiner, M. Environmental impact of using specialty feed ingredients in swine and poultry production: A life cycle assessment1. J. Anim. Sci. 2016, 94, 2664–2681. [Google Scholar] [CrossRef] [PubMed]
- National Research Council (NRC). Nutrient Requirements of Swine, Eleventh Revised Edition; The National Academies Press: Washington, DC, USA, 2012. [Google Scholar]
- PIC. Nutrient Specifications Manual. 2013 Nutrient Specifications. 2008. Available online: https://www.picperu.com/pdf/Manual-Requerimientos-Nutricionales-PIC13%e2%80%8f.pdf (accessed on 24 November 2021).
- USDA. United States Department of Agriculture, National Agricultural Library. 2018. Available online: https://www.nal.usda.gov/swine (accessed on 20 May 2020).
- SimaPro. Available online: https://simapro.com/ (accessed on 12 November 2019).
- Marinussen, M.; Kool, A. Environmental Impacts of Synthetic Amino Acids Production. 2010. Available online: http://www.blonkconsultants.nl/wp-content/uploads/2016/06/amino-acids.pdf (accessed on 3 December 2018).
- Hossain, M.U.; Poon, C.S.; Dong, Y.H.; Xuan, D. Evaluation of environmental impact distribution methods for supplementary cementitious materials. Renew. Sustain. Energy Rev. 2018, 82, 597–608. [Google Scholar] [CrossRef]
- U.S. Grains Council, Ethanol Market and Pricing Data—28 August 2018. Available online: https://grains.org/ethanol_report/ethanol-market-and-pricing-data-august-28-2018/ (accessed on 20 April 2020).
- St Joseph, M.O. Weekly Distillers Grains Summary, USDA Market News Service. Available online: https://www.ams.usda.gov/mnreports/nw_gr115.txt (accessed on 20 April 2020).
- Market Insiders. Soybean Oil. Available online: https://markets.businessinsider.com/commodities/soybean-oil-price (accessed on 20 April 2020).
- All By-Products, Sorted by Company. In University of Missouri Division of Animal Sciences and Commercial Agriculture Pro-gram. Available online: http://agebb.missouri.edu/dairy/byprod/allcompanies.asp (accessed on 20 April 2020).
- Kim, S.; Dale, B.E.; Keck, P. Energy Requirements and Greenhouse Gas Emissions of Maize Production in the USA. BioEnergy Res. 2014, 7, 753–764. [Google Scholar] [CrossRef]
- Arora, S.; Wu, M.; Wang, M. Estimated displaced products and ratios of distillers’ co-products from corn ethanol plants and the implications of lifecycle analysis. Biofuels 2010, 1, 911–922. [Google Scholar] [CrossRef]
- RFA (Renewables Fuels Association). 2020 Ethanol Industry Outlook. Available online: https://ethanolrfa.org/file/21/2020-Outlook-Final-for-Website.pdf (accessed on 20 May 2020).
- USDA Economic Research Service with Data from USDA, Agricultural Marketing Service and Grain and Feed Market. Available online: https://www.ams.usda.gov/market-news/livestock-poultry-grain (accessed on 20 May 2020).
- National Agricultural Statistics Service, Quick Stats Database and, for Fuel Prices, Nebraska Energy Office, April, 2020. Available online: https://www.nass.usda.gov/Quick_Stats/ (accessed on 20 April 2020).


| Ingredient Use | Corn-SBM | Corn-SBM-10.1% DDGS | Corn-SBM-28.8% DDGS |
|---|---|---|---|
| lb/Pig (from 50 to 280 lb Body Weight) | |||
| Corn | 520.07 | 476.6 | 387.6 |
| Soybean meal | 119.75 | 99.1 | 70.4 |
| Corn DDGS, 7.5% Oil | 0.00 | 66.6 | 190.9 |
| Calcium carbonate | 5.45 | 6.1 | 7.01 |
| Calcium phosphate (monocalcium) | 2.94 | 1.3 | 0.35 |
| Sodium chloride | 3.28 | 3.3 | 3.32 |
| L-Lys-HCl | 1.82 | 2.2 | 2.59 |
| DL-Met | 0.18 | 0.1 | 0.0 |
| L-Thr | 0.44 | 0.2 | 0.12 |
| L-Trp | 0.05 | 0.1 | 0.10 |
| Vitamin premix with phytase | 0.76 | 0.8 | 0.77 |
| Trace mineral premix | 0.76 | 0.8 | 0.77 |
| Items | Unit Price ($/lb) [21,22,23,24] | Mass Allocation | Economic Allocation | |
|---|---|---|---|---|
| DDGS | Ethanol | 0.211 | 0.490 | 0.832 |
| DDGS | 0.041 | 0.510 | 0.167 | |
| SBM | Crude soy oil | 0.271 | 0.217 | 0.492 |
| Soy hulls | 0.065 | 0.074 | 0.012 | |
| SBM | 0.146 | 0.709 | 0.496 |
| Ingredients | GWP kg CO2 eq. | LU m2 yr. Crop eq. | WC m3 | FR kg Oil eq. | |
|---|---|---|---|---|---|
| SBM | Crude oil | 0.390 | 0.346 | 0.160 | 0.028 |
| Soy hulls | 0.054 | 0.135 | 0.062 | 0.010 | |
| SBM | 0.516 | 1.280 | 0.593 | 0.104 | |
| DDGS | DDGS | 0.242 | 0.187 | 0.108 | 0.066 |
| Ethanol | 1.200 | 0.932 | 0.535 | 0.328 | |
| Bakery meal | 0.380 * | - | - | - | |
| Corn | 0.311 | 1.010 | 0.393 | 0.054 | |
| Amino acids | |||||
| L-Lysine-HCl | 4.060 | 3.340 | 1.490 | 0.757 | |
| Methionine | 9.060 | 0.728 | 4.930 | 2.940 | |
| Threonine | 8.140 | 5.070 | 2.900 | 2.000 | |
| Tryptophan | 9.620 * | - | - | - | |
| Ingredients | Major Contributing Factors | Contribution (%) | |||
|---|---|---|---|---|---|
| GWP | LU | WC | FR | ||
| Corn | Nitrogen ecoprofile at regional storehouse | 19.7 | |||
| Corn agricultural production | 88.3 | 45.9 | |||
| Natural gas, unprocessed, at extraction | 26.9 | ||||
| SBM | Application lime ecoprofile at field | 12.8 | |||
| Soybean agricultural production at farm | 94.3 | ||||
| Electricity, hydropower, at run-of river power plant | 52.6 | ||||
| Natural gas, unprocessed, at extraction | 22.6 | ||||
| DDGS | Natural gas burned at industrial furnace | 41.3 | |||
| Corn agricultural production at farm | 79.7 | ||||
| Electricity, hydropower, at run-of river power plant | 39.3 | ||||
| Natural gas, unprocessed, at extraction | 74.0 | ||||
| Amino acid | |||||
| Lysine | Sugar, from sugar cane, from sugar production at plant | 64.9 | 96.3 | 40.9 | 70.4 |
| Methionine | Ammonium bicarbonate, at plant | 26.1 | 38.8 | ||
| Electricity, natural gas, at power plant | 71.0 | ||||
| Ammonia liquid at regional storehouse | 84.6 | ||||
| Threonine | Glucose global market for glucose at point of substitution unit process | 54.0 | 92.3 | 50.2 | |
| Ammonia, liquid, at regional storehouse | 25.1 | ||||
| Ingredients | 10.1% | 28.8% |
|---|---|---|
| Corn | 0.6532 | 0.6938 |
| Soybean meal | 0.31 | 0.2583 |
| Calcium carbonate | −0.01 | −0.0082 |
| Calcium phosphate (monocalcium) | 0.0252 | 0.0136 |
| Sodium chloride | −0.0001 | −0.0002 |
| L-Lys-HCl | −0.006 | −0.004 |
| DL-Met | 0.0017 | 0.0009 |
| L-Thr | 0.0031 | 0.0017 |
| L-Trp | −0.0004 | −0.0003 |
| Vitamin premix with phytase | 0.00 | −0.0001 |
| Trace mineral premix | 0.00 | −0.0001 |
| Diet | GWP (kg CO2 eq.) | LU (m2 Area Crop eq.) | WC (m3) | TE (kg 1,4-DCB) | FR (kg Oil eq.) |
|---|---|---|---|---|---|
| Standard (0% DDGS) | 0.390 | 0.975 | 0.394 | 0.544 | 0.063 |
| 10.1% DDGS | 0.374 | 0.898 | 0.365 | 0.502 | 0.063 |
| 28.8% DDGS | 0.352 | 0.751 | 0.385 | 0.434 | 0.065 |
Publisher’s Note: MDPI stays neutral with regard to jurisdictional claims in published maps and institutional affiliations. |
© 2022 by the authors. Licensee MDPI, Basel, Switzerland. This article is an open access article distributed under the terms and conditions of the Creative Commons Attribution (CC BY) license (https://creativecommons.org/licenses/by/4.0/).
Share and Cite
Haque, M.A.; Liu, Z.; Demilade, A.; Kumar, N.M. Assessing the Environmental Footprint of Distiller-Dried Grains with Soluble Diet as a Substitute for Standard Corn–Soybean for Swine Production in the United States of America. Sustainability 2022, 14, 1161. https://0-doi-org.brum.beds.ac.uk/10.3390/su14031161
Haque MA, Liu Z, Demilade A, Kumar NM. Assessing the Environmental Footprint of Distiller-Dried Grains with Soluble Diet as a Substitute for Standard Corn–Soybean for Swine Production in the United States of America. Sustainability. 2022; 14(3):1161. https://0-doi-org.brum.beds.ac.uk/10.3390/su14031161
Chicago/Turabian StyleHaque, Md Ariful, Zifei Liu, Akinbile Demilade, and Nallapaneni Manoj Kumar. 2022. "Assessing the Environmental Footprint of Distiller-Dried Grains with Soluble Diet as a Substitute for Standard Corn–Soybean for Swine Production in the United States of America" Sustainability 14, no. 3: 1161. https://0-doi-org.brum.beds.ac.uk/10.3390/su14031161