
An Assessment of Agricultural Vulnerability in the Context of Global Climate Change: A Case Study in Ha Tinh Province, Vietnam


Abstract
:1. Introduction
2. Study Area
3. Material and Methods
3.1. Identify Vulnerability Indicators for Calculating AV
3.2. Calculation of the Agricultural Vulnerability
4. Results
4.1. The Component Analysis Results for the Study
- (1)
- Exposure component
- (2)
- Sensitivity component
- (3)
- Adaptive Capacity
4.2. Agricultural Vulnerability Zoning
5. Discussion
6. Conclusions
Author Contributions
Funding
Informed Consent Statement
Data Availability Statement
Acknowledgments
Conflicts of Interest
References
- Sridevi, G.; Jyotishi, A.; Mahapatra, S.; Jagadeesh, G.; Bedamatta, S. Climate Change Vulnerability in Agriculture Sector: Indexing and Mapping of Four Southern Indian States. Quaderni—Working Paper DSE N 966. 2021. Available online: https://ssrn.com/abstract=2503834 (accessed on 12 June 2021).
- Smit, B.; Wandel, J. Adaptation, adaptive capacity and vulnerability. Glob. Environ. Chang. 2006, 16, 282–292. [Google Scholar] [CrossRef]
- Field, C.B.; Barros, V.R.; Dokken, D.J.; Mach, K.J.; Mastrandrea, M.D.; Bilir, T.E.; Chatterjee, M.; Ebi, K.L.; Estrada, Y.O.; Genova, R.C.; et al. Climate Change: Impacts, Adaptation, and Vulnerability. Contribution of Working Group II to the Fifth Assessment Report of the Intergovernmental Panel on Climate Change; Cambridge University Press: Cambridge, UK; New York, NY, USA, 2014; pp. 1–32. [Google Scholar]
- Tina-Simone, N.; Lotten, W.; Tomasz, O.; Erik, G.; Björn-Ola, L. Evaluation of indicators for agricultural vulnerability to climate change: The case of Swedish agriculture. Ecol. Indic. 2018, 105, 571–580. [Google Scholar]
- Thomas, F. The Assessment of Climate Change-Related Vulnerability in the Agricultural Sector: Reviewing Conceptual Frameworks. Available online: https://www.researchgate.net/publication/266911984_The_assessment_of_climate_change-related_vulnerability_in_the_agricultural_sector_reviewing_conceptual_frameworks (accessed on 12 June 2021).
- Mallari; Alyosha Ezra, C. Climate Change Vulnerability Assessment in the Agriculture Sector: Typhoon Santi Experience. Procedia-Soc. Behav. Sci. 2016, 216, 440–451. [Google Scholar] [CrossRef] [Green Version]
- Ranganathan, C.; Palanisami, K.; Kakumanu, K.; Baulraj, A. Mainstreaming the Adaptations and Reducing the Vulnerability of the Poor Due to Climate Change; ADBI Working Paper 333; Asian Development Bank Institute: Tokyo, Japan, 2010; Available online: http://www.adbi.org/workingpaper/2011/12/19/4831.adaptations.reducing.vulnerability.poor.climate.change/ (accessed on 12 June 2021).
- Knox, J.; Hess, T.; Daccache, A.; Wheeler, T. Climate change impacts on crop productivity in Africa and South Asia. Environ. Res. Lett. 2012, 7, 034032. Available online: https://0-iopscience-iop-org.brum.beds.ac.uk/article/10.1088/1748-9326/7/3/034032 (accessed on 12 June 2021). [CrossRef]
- IPCC. Climate Change: Impacts, Adaptation, and Vulnerability Summaries, Frequently Asked Questions, and Cross-Chapter Boxes, A Working Group II Contribution to the Fifth Assessment Report of the Intergovernmental Panel on Climate Change. 2014. Available online: https://www.ipcc.ch/report/ar5/wg2/ (accessed on 12 June 2021).
- MARD—Ministry of Agriculture and Rural Development of Vietnam. Climate Change Adaptation Plan in Agriculture and Rural Development Sector of Vietnam; Ministry of Agriculture and Rural Development of Vietnam: Hanoi, Vietnam, 2009.
- Tran, V.T. Impacts of climate change in Crop Production sub-sector in Vietnam. In Climate Change Impacts on Agriculture and Rural Development Sector in Vietnam and Response Measures; The Agricultural Publishing House: Hanoi, Vietnam, 2011; p. 53. [Google Scholar]
- IPCC. Climate Change: Impacts, Adaptation and Vulnerability: Contribution of Working Group II to the Third Assessment Report of the IPCC; Cambridge University Press: Cambridge, UK, 2001; Available online: https://www.ipcc.ch/site/assets/uploads/2018/03/WGII_TAR_full_report-2.pdf (accessed on 6 May 2021).
- Hinkel, J. Indicators of vulnerability and adaptive capacity: Towards a clarification of the science–policy interface. Glob. Environ. Chang. 2011, 21, 198–208. [Google Scholar] [CrossRef]
- Rosenzweig, C.; Parry, M.L. Potential impact of climate change on world food supply. Nature 1994, 367, 133–137. [Google Scholar] [CrossRef]
- Arnell, N.W. Climate change and global water resources. Glob. Environ. Chang. 1999, 9, 31–49. [Google Scholar] [CrossRef]
- Turner, B.L.; Kasperson, R.E.; Matson, P.A.; McCathy, J.J.; Corell, R.W. A framework for vulnerability analysis in sustainability science. Proc. Natl. Acad. Sci. USA 2003, 100, 8074–8079. [Google Scholar] [CrossRef] [Green Version]
- Kim, A.N.; Yuei, A.L. Global mapping of eco-environmental vulnerability from human and nature disturbances. Sci. Total Environ. 2019, 664, 995–1004. [Google Scholar]
- Reilly, J. Climate Change, Global Agriculture and Regional Vulnerability; FAO Report (CH10); USDA: Washington, DC, USA, 1996; pp. 1–15. Available online: https://www.fao.org/3/w5183e/w5183e0c.htm (accessed on 12 June 2021).
- Downing, T.E. Vulnerability to hunger in Africa: A climate change perspective. Glob. Environ. Chang. 1991, 5, 365–380. [Google Scholar] [CrossRef]
- Luers, A.L.; Lobell, D.B.; Sklar, L.S. A method for quantifying vulnerability, applied to the agricultural system of the Yaqui Valley, Mexico. Glob. Environ. Chang. 2003, 13, 255–267. [Google Scholar] [CrossRef]
- Parker, L.; Bourgoin, C.; Martinez-Valle, A.; Läderach, P. Vulnerability of the agricultural sector to climate change: The development of a pan-tropical Climate Risk Vulnerability Assessment to inform sub-national decision making. PLoS ONE 2019, 14, e0213641. [Google Scholar] [CrossRef] [Green Version]
- Alexandrov, V.A.; Hoogenboom, G. Vulnerability and adaptation assessments of agricultural crops under climate change in the southeastern USA. Theor. Appl. Climatol. 2000, 67, 45–63. [Google Scholar] [CrossRef]
- Igesia, A.; Rosenzweig, C.; Pereire, D. Agricultural impacts of climate change in Spain: Developing tools for a spatial analysis. Glob. Environ. Chang. 2000, 10, 69–80. [Google Scholar]
- Hahn, M.B.; Riederer, A.M.; Foster, S.O. The livelihood vulnerability index: A pragmatic approach to assessing risks from climate variability and change-a case study in Mozambique. Glob. Environ. Chang. 2009, 19, 74–88. [Google Scholar] [CrossRef]
- Zhang, D.; Wu, S. Vulnerability of natural ecosystem in China under regional climate scenarios: An analysis based on eco-geographical regions. J. Geogr. Sci. 2014, 24, 237–248. Available online: http://www.ipcc.ch/ipccreports/tar/wg2/index.php?idp=650 (accessed on 12 June 2021).
- Kvalvik, I.; Dalmannsdottir, S.; Dannevig, H.; Hovelsrul, G.; Ronning, L.; Uleberg, E. Climate change vulnerability and adaptive capacity in the agricultural sector in Northern Norway. Acta Agric. Scand. Sect. B-Soil Plant Sci. 2011, 61, 27–37. Available online: https://0-www-tandfonline-com.brum.beds.ac.uk/doi/full/10.1080/09064710.2011.627376 (accessed on 5 November 2021).
- Wilhelmi, O.V.; Wilhite, D.A. Assessing vulnerability to agricultural drought: A Nebraska case study. Nat. Hazards 2002, 25, 37–58. [Google Scholar] [CrossRef]
- Wu, H.; Qian, H.; Chen, J.; Huo, C. Assessment of agricultural drought vulnerability in the Guanzhong Plain, China. Water Resour. Manag. 2017, 31, 1557–1574. [Google Scholar] [CrossRef]
- Kollongei, K.J.; Lorentz, S.A. Modelling hydrological processes, crop yields and NPS pollution in a small sub-tropical catchment in South Africa using ACRU-NPS. Hydrol. Sci. J. 2015, 60, 2003–2028. [Google Scholar] [CrossRef] [Green Version]
- Annandale, J.G.; Steyn, J.M.; Benadé, N.; Jovanovic, N.Z.; Soundy, P. Technology Transfer of the Soil Water Balance (SWB) Model As a User Friendly Irrigation Scheduling Tool. WRC Report No. TT251/05. 2005. Available online: http://www.wrc.org.za/wp-content/uploads/mdocs/TT251-05.pdf (accessed on 12 June 2021).
- Keating, B.A.; Carberry, P.S.; Hammer, G.L.; Probert, M.E.; Robertson, M.J.; Holzworth, D. An overview of APSIM, a model designed for farming systems simulation. Eur. J. Agron. 2003, 18, 267–288. [Google Scholar] [CrossRef] [Green Version]
- Abedinpour, M.; Sarangi, A.; Rajput, T.B.S.; Singh, M.; Pathak, H.; Ahmad, T. Performance evaluation of AquaCrop model for maize crop in a semi-arid environment. Agric. Water Manag. 2012, 110, 55–66. [Google Scholar] [CrossRef]
- Mendelsohn, R. The impact of climate change on agriculture in developing countries. J. Nat. Resour. Policy Res. 2008, 1, 5–19. [Google Scholar] [CrossRef] [Green Version]
- Tao, S.; Xu, Y.; Liu, K.; Pan, J.; Gou, S. Research progress in agricultural vulnerability to climate change. Adv. Clim. Change Res. 2011, 2, 203–210. [Google Scholar] [CrossRef]
- Wiréhn, L.; Opach, T.; Neset, T.S. Assessing agricultural vulnerability to climate change in the Nordic countries—An interactive geovisualization approach. J. Environ. Plan. Manag. 2017, 60, 115–134. [Google Scholar] [CrossRef]
- Raúl, S.; Jesus, J.C.; Emilia, G.; Fidel, G.R.; Antonio, G.; Gabriel, S.; Laia, A.; Juan, C.L.; Kristina, S. Assessing forest vulnerability to climate warming using a process-based model of tree growth: Bad prospects for rear-edges. Glob. Change Biol. 2017, 23, 2705–2719. [Google Scholar]
- Barnett, J.; Lambert, S.; Fry, I. The hazards of indicators: Insights from the environmental vulnerability index. Ann. Assoc. Am. Geogr. 2008, 98, 102–119. [Google Scholar] [CrossRef]
- Dong, Z.; Pan, Z.; An, P.; Wang, L.; Zhang, J.; He, D.; Han, H.; Pan, X. A novel method for quantitatively evaluating agricultural vulnerability to climate change. Ecol. Indic. 2015, 48, 49–54. [Google Scholar] [CrossRef]
- Adger, W.N.; Brooks, N.; Bentham, G.; Agnew, M.; Eriksen, S. New Indicators of Vulnerability and Adaptive Capacity; Tyndall Centre for Climate Change Research, University of East Anglia: Norwich, UK, 2004; Available online: https://citeseerx.ist.psu.edu/viewdoc/download?doi=10.1.1.112.2300&rep=rep1&type=pdf (accessed on 12 June 2021).
- Li, Y.; Xiong, W.; Hu, W.; Berry, P.; Ju, H.; Lin, E.; Wang, W.; Li, K.; Pan, J. Integrated assessment of China’s agricultural vulnerability to climate change: A multi-indicator approach. Clim. Chang. 2015, 128, 355–366. [Google Scholar] [CrossRef]
- Eriksen, S.H.; Kelly, P.M. Developing credible vulnerability indicators for climate adaptation policy assessment. Mitig. Adapt. Strateg. Glob. Chang. 2007, 12, 495–524. [Google Scholar] [CrossRef]
- Sanjit, M.; Sujeet, K.J.; Sanchita, G.; Arindam, N.; Bera, A.K.; Vijay Paul, R.C.; Upadhaya, S.M.D. An assessment of social vulnerability to climate change among the districts of Arunachal Pradesh, India. Ecol. Indic. 2017, 77, 105–113. [Google Scholar]
- Institute of Strategy and Policy on Natural Resources and Environment, Vietnam. Ha Tinh Assessment Report on Climate Change. 2009. Available online: https://www.unep.org/resources/report/ha-tinh-province-assessment-report-climate-change (accessed on 12 June 2021).
- Rockström, J.; Barron, J.; Fox, P. Water productivity in rain-fed agriculture: Challenges and opportunities for smallholder farmers in drought-prone tropical agroecosystems. Limits Oppor. Improv. 2003, 85, 1–8. [Google Scholar]
- Wani, S.P.; Rockström, J.; Oweis, T. Rainfed Agriculture: Unlocking the Potential; CABI: Wallingford, UK, 2009. [Google Scholar]
- Ha Tinh Statistical Yearbook (1980–2013), Statistical Publisher: Hanoi, Vietnam. Available online: https://www.worldcat.org/title/nien-giam-thong-ke-tinh-ha-tinh/oclc/192024180 (accessed on 6 May 2021).
- Marcelo, T.; Richard, H.; Lineu, R. Analyzing Rainfall Effects on Agricultural Income: Why Timing Matters. EconomiA 2019, 20, 1–14. Available online: https://ainfo.cnptia.embrapa.br/digital/bitstream/item/201012/1/Lineu-Analyzing-rainfall-effects-on-agricultural.pdf (accessed on 6 May 2021).
- Yash, P.A.; Keith, T.I. Effects of Higher Day and Night Temperatures on Growth and Yields of Some Crop Plants, Food and Agricultural Organization of the United Nations. 1996. Available online: https://www.fao.org/3/w5183e/w5183e08.htm (accessed on 6 May 2021).
- Zhao, C.; Liu, B.; Piao, S.; Wang, X.; David, B.L.; Yao, H.; Mengtian, H. Temperature increase reduces global yields of major crops in four independent estimates. Proceeding Natl. Acad. Sci. USA 2007, 114, 9326–9331. [Google Scholar] [CrossRef] [PubMed] [Green Version]
- Evangelia, G.; Chrisoula, R.; Kleomenis, K.; Christos, C. A gis-based flash flood run-off model using high-resolution DEM and meteorological data. Eur. Assoc. Remote Sens. Lab. (EARSeL) eProceedings 2013, 12, 33–43. [Google Scholar]
- Ministry of Agriculture and Rural Development of Ha Tinh Province. 2018. Available online: https://www.nexi.go.jp/environment/info/pdf/19-040_EIA_05.pdf (accessed on 6 May 2021).
- Tran, K.C. Mapping extent of flooded area using Sentinel-1 Satellite image. J. Water Environ. Eng. 2017, 58, 78–82. Available online: https://vjol.info.vn/index.php/DHTL/article/view/31679/26897 (accessed on 6 May 2021).
- United Nations Development Programme (UNDP) and Oxford Poverty and Human Development Initiative (OPHI), University of Oxford. How to Build a National Multidimensional Poverty Index (MPI): Using the MPI to inform the SDGs. 2019. Available online: https://www.undp.org/content/dam/undp/library/prosperity/inclusive-growth/How_to_Build_a_National_Multidimensional_Poverty%20Index.pdf (accessed on 6 May 2021).
- Statistical Report of Ha Tinh Province. 2021. Available online: https://honglinh.hatinh.gov.vn/portal/Home/van-ban/bao-cao-thong-ke.aspx (accessed on 6 May 2021).
- Hou, Y.; Liu, W. Forecast of changes in climate vulnerability of agricultural production in the Loess Plateau in China. J. Catastrophol. 2003, 18, 34–38. [Google Scholar]
- Statistics of Ha Tinh Department of Labor, War Invalids and Social Affairs. 2019. Available online: http://www.molisa.gov.vn/Pages/tintuc/chitiet.aspx?tintucID=220889 (accessed on 6 May 2021).
- Kelly, P.M.; Adger, W.N. Theory and practice in assessing vulnerability to climate change and facilitating adaptation. Clim. Chang. 2000, 47, 325–352. [Google Scholar] [CrossRef]
- Lam, T.M.H.; Lindsay, C.S. Multi-Scale assessment of social vulnerability to climate change: An empirical study in coastal Vietnam. Clim. Risk Manag. 2018, 20, 165–180. [Google Scholar] [CrossRef]
- MNRE—Ministry of Natural Resources and Environment. Climate Change, Sea Level Rise Scenarios for Vietnam. 2012. Available online: https://www.preventionweb.net/publications/view/11348 (accessed on 6 May 2021).
- Hoang Luu, T.T. State-Level Project: Assess the Vulnerability of the Socio-Economic System Due to Impact of Climate Change in the North Central Region. Core: BDKH-24; Geography of Institute: Hanoi, Vietnam, 2015. (In Vietnamese) [Google Scholar]


| Component | Indicators | Description | Impact on AV | Data Source |
|---|---|---|---|---|
| I. E | Variation coefficient (Vc) of precipitation | The data used for the assessment was the Vc of precipitation from 1980 to 2013, which was taken from the climate data report of Ha Tinh province. Vc was interpolated using Inverse Distance Weighting method with a resolution of 0.00382 degrees, then was normalized to be valued from 0 to 1. | Rainfall is an integral part of food production. It is estimated that up to 60% of staple food is produced from rain-fed agriculture [44,45]. Irregular rain patterns accompanied by storms and tropical depressions cause crop failure and severe flooding. | [46] |
| Heavy rain | A day is called a “heavy rainfall day” according to Vietnam Meteorological Department if the rainfall is above 50 mm/day. The data used is the average number of heavy rainy days in the period of 1980—2013, which was taken from the climate data report of Ha Tinh province. The number of heavy rain from observation stations was also interpolated using Inverse Distance Weighting method with a resolution of 0.00382 degrees, then was normalized to be valued from 0 to 1. | Too much rain can harm crop production, floods fields, and wash away seeds and precious topsoil. Wet weather encourages bacteria and fungus growth, which can further damage crops [47]. | [46] | |
| Hot days | The “hot day” is defined as days with a temperature above 35 degrees Celsius. The data used is the average number of hot days in the period of 1980–2013. The data was processed by using the same weather station and method as precipitation data. | Temperature plays a very important role in the development of organisms. The increased temperature would affect the crop calendar in tropical regions. Global warming can reduce the length of the effective growing season, particularly where more than one crop per year is grown, and reduce global yields [48]. For example, each degree-Celsius increase in global mean temperature would, on average, reduce global yields of wheat by 6.0%, rice by 3.2%, maize by 7.4%, and soybean by 3.1% [49]. | [46] | |
| II. S | Risk of flash flood | The assessment is based on the flash flood risk zoning map. Risk of flash flood data is stored in shapefile format in ArcGIS software. The risk of flash floods in the study area is divided into four levels: high risk, medium risk, low risk, and no risk. | An increase in flash floods in terms of quantity, intensity, and frequency is seen as a manifestation of climate change. The flash flood has caused many negative effects on the environment and society [50] and is the top weather-related killer. The flash flood hazard map is built based on a combination of physical factors such as slope, land use-land cover, soil type.etc. The areas at higher risk of flash floods have greater vulnerability of agriculture, and vice versa. | [51] |
| Percentage of agricultural land | This indicator is determined by the ratio between the area of agricultural land and total natural area by each district. Percentage of agricultural land data is in excel file format, stored into a shapefile in ArcGIS software. Finally, the percentage of agricultural land was classified into five classes. | The proportion of agricultural land is an important factor in assessing the impact of agriculture on climate change. Accordingly, areas with a large proportion of agricultural land area have a higher index of agricultural vulnerability due to climate change than the rest of the region. | [46] | |
| Percentage of inundated area | This indicator is determined by the ratio between the inundated area and agricultural land by each district. Percentage of agricultural land data are also in excel file format, stored into a shapefile. It was further classified into five classes. | Agricultural production activities in the study area are concentrated mainly in lowland and coastal areas. However, these are also areas that are more susceptible to floods. In areas with large inundated areas, the vulnerability to climate change is considered to be higher than the rest. | [52] | |
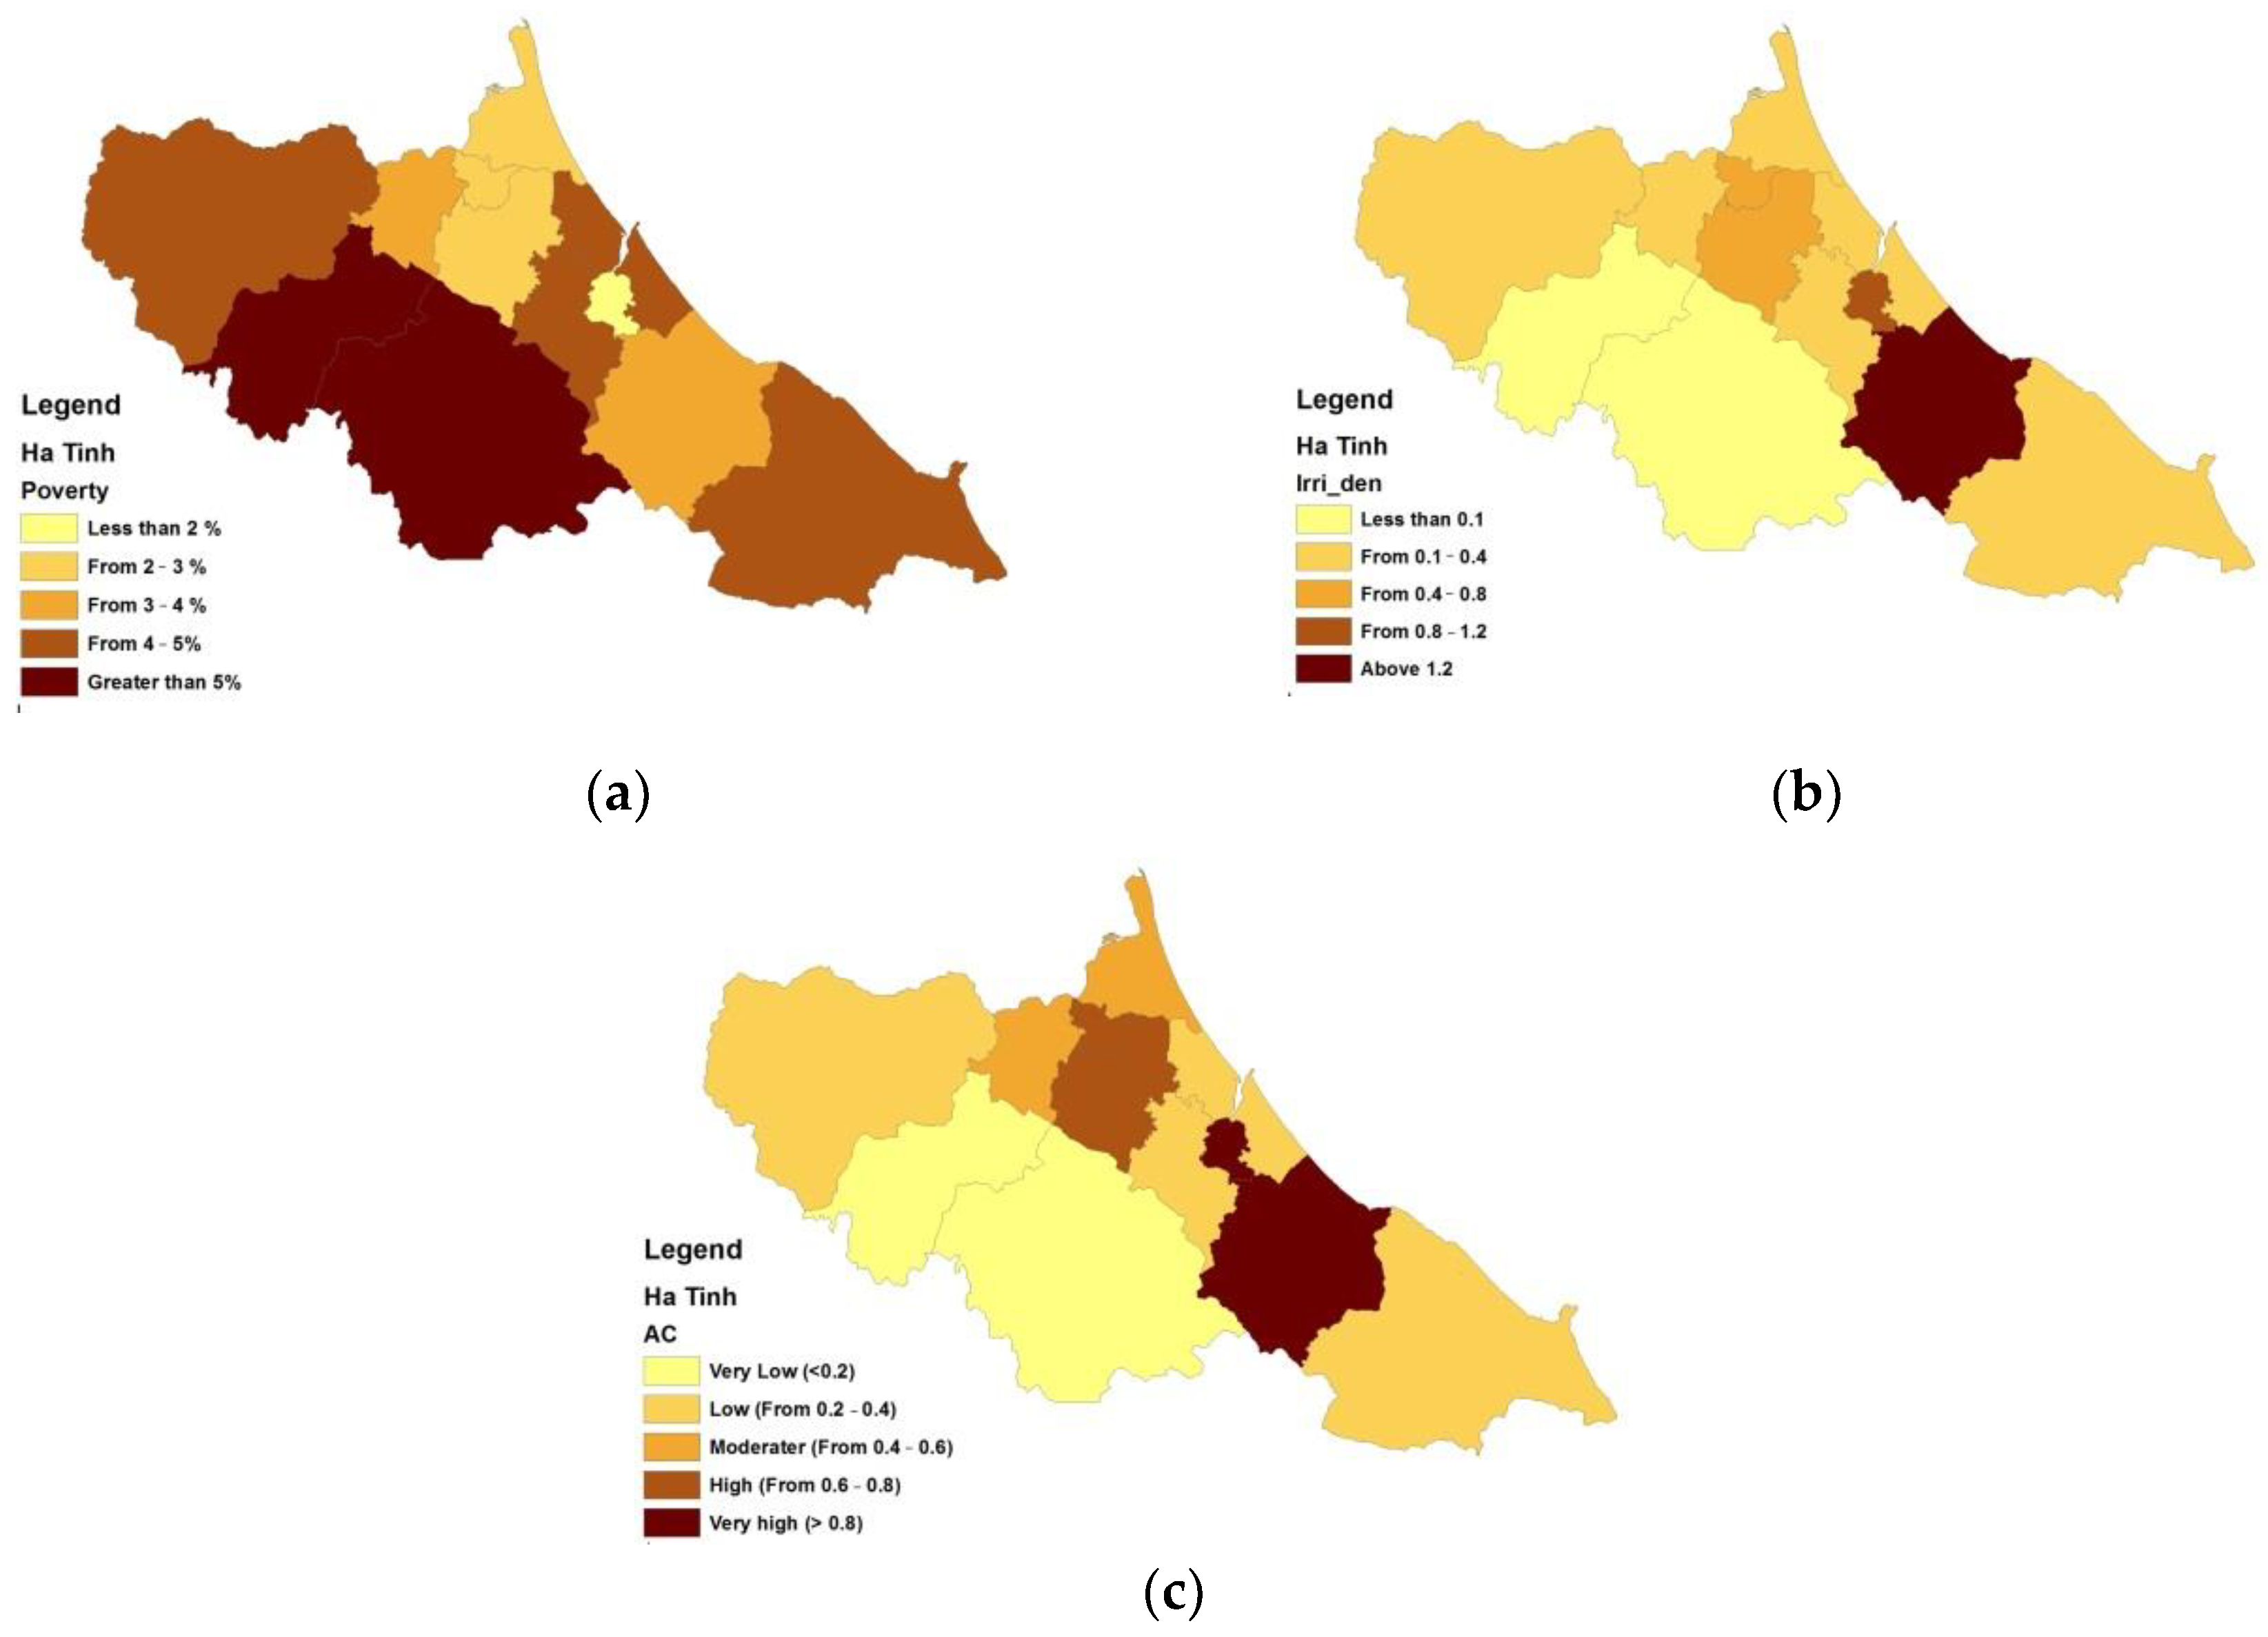
| III. AC | Household below poverty line | This indicator is identified by the percentage of households below poverty line to the total population. From 2016 to now, Vietnam has applied a national multidimensional poverty measure, based on the Alkire–Foster method with five elements: (1) living conditions; (2) income level; (3) access to health and education; (4) access to information; and (5) access to security insurance and social assistance [53]. Number of households below poverty line is converted to attribute data in ArcGIS software and stored into a shapefile. It was further classified into five classes. | The poverty rate is one of the key factors in the vulnerability of households and communities to climate change, and their adaptive capacity. Areas with high poverty rates have a very low response to climate change. | [54] |
| The density of irrigation works | The index is determined based on the number of irrigation works per unit area of agricultural land (hectare). This data is collected from the Statistical Yearbook of Hatinh province and then processed using the same method as household below property line indicator. | Irrigation works play an important role in agriculture. They help to regulate water sources in agricultural production, minimizing flooding in the rainy season and drought in the dry season, thereby increasing resilience to climate change | [46] |
| Components | Scale Classification | Rating |
|---|---|---|
| E | Less than 0.3 From 0.3 to 0.4 From 0.4 to 0.5 From 0.5 to 0.6 Greater than 0.6 | Very low Low Moderate High Very high |
| S | Less than 0.25 From 0.25 to 0.4 From 0.4 to 0.55 From 0.55 to 0.7 Greater than 0.7 | Very low Low Moderate High Very high |
| AC | Less than 0.2 From 0.2 to 0.4 From 0.4 to 0.6 From 0.6 to 0.8 Greater than 0.8 | Very low Low Moderate High Very high |
| AV | From 0.32–0.41 From 0.41–0.47 From 0.47–0.53 From 0.53–0.6 From 0.6–0.67 | Very low Low Moderate High Very high |
Publisher’s Note: MDPI stays neutral with regard to jurisdictional claims in published maps and institutional affiliations. |
© 2022 by the authors. Licensee MDPI, Basel, Switzerland. This article is an open access article distributed under the terms and conditions of the Creative Commons Attribution (CC BY) license (https://creativecommons.org/licenses/by/4.0/).
Share and Cite
Loi, D.T.; Huong, L.V.; Tuan, P.A.; Hong Nhung, N.T.; Quynh Huong, T.T.; Hoa Man, B.T. An Assessment of Agricultural Vulnerability in the Context of Global Climate Change: A Case Study in Ha Tinh Province, Vietnam. Sustainability 2022, 14, 1282. https://0-doi-org.brum.beds.ac.uk/10.3390/su14031282
Loi DT, Huong LV, Tuan PA, Hong Nhung NT, Quynh Huong TT, Hoa Man BT. An Assessment of Agricultural Vulnerability in the Context of Global Climate Change: A Case Study in Ha Tinh Province, Vietnam. Sustainability. 2022; 14(3):1282. https://0-doi-org.brum.beds.ac.uk/10.3390/su14031282
Chicago/Turabian StyleLoi, Duong Thi, Le Van Huong, Pham Anh Tuan, Nguyen Thi Hong Nhung, Tong Thi Quynh Huong, and Bui Thi Hoa Man. 2022. "An Assessment of Agricultural Vulnerability in the Context of Global Climate Change: A Case Study in Ha Tinh Province, Vietnam" Sustainability 14, no. 3: 1282. https://0-doi-org.brum.beds.ac.uk/10.3390/su14031282