

Tree Diversity and Tree Community Composition in Northern Part of Megacity Bengaluru, India
 , , and
Abstract
:1. Introduction
2. Methods
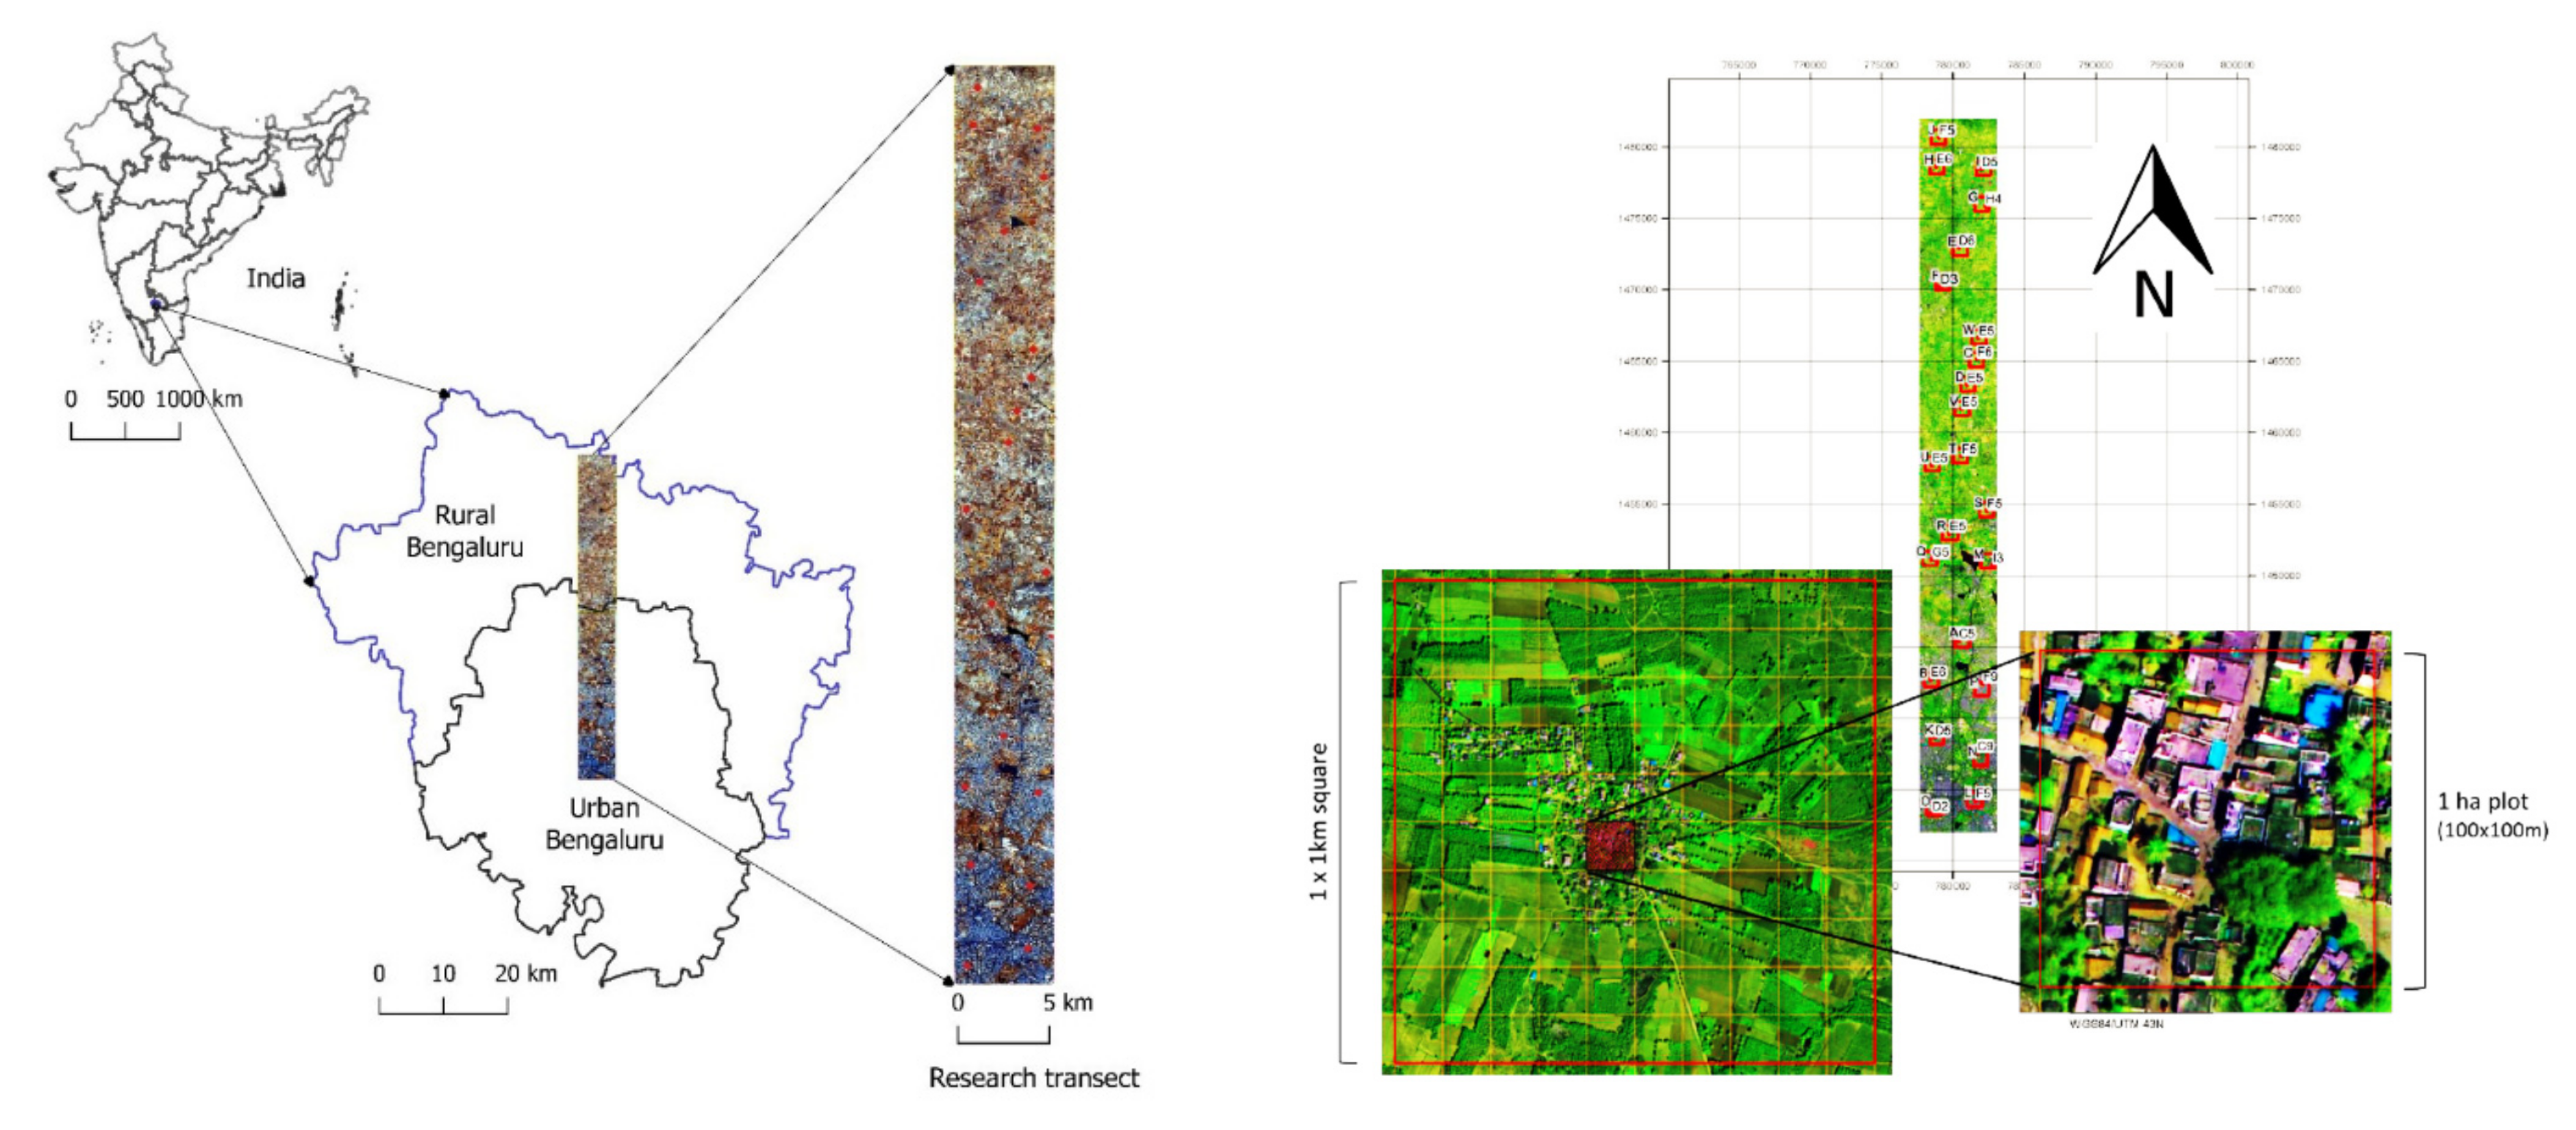
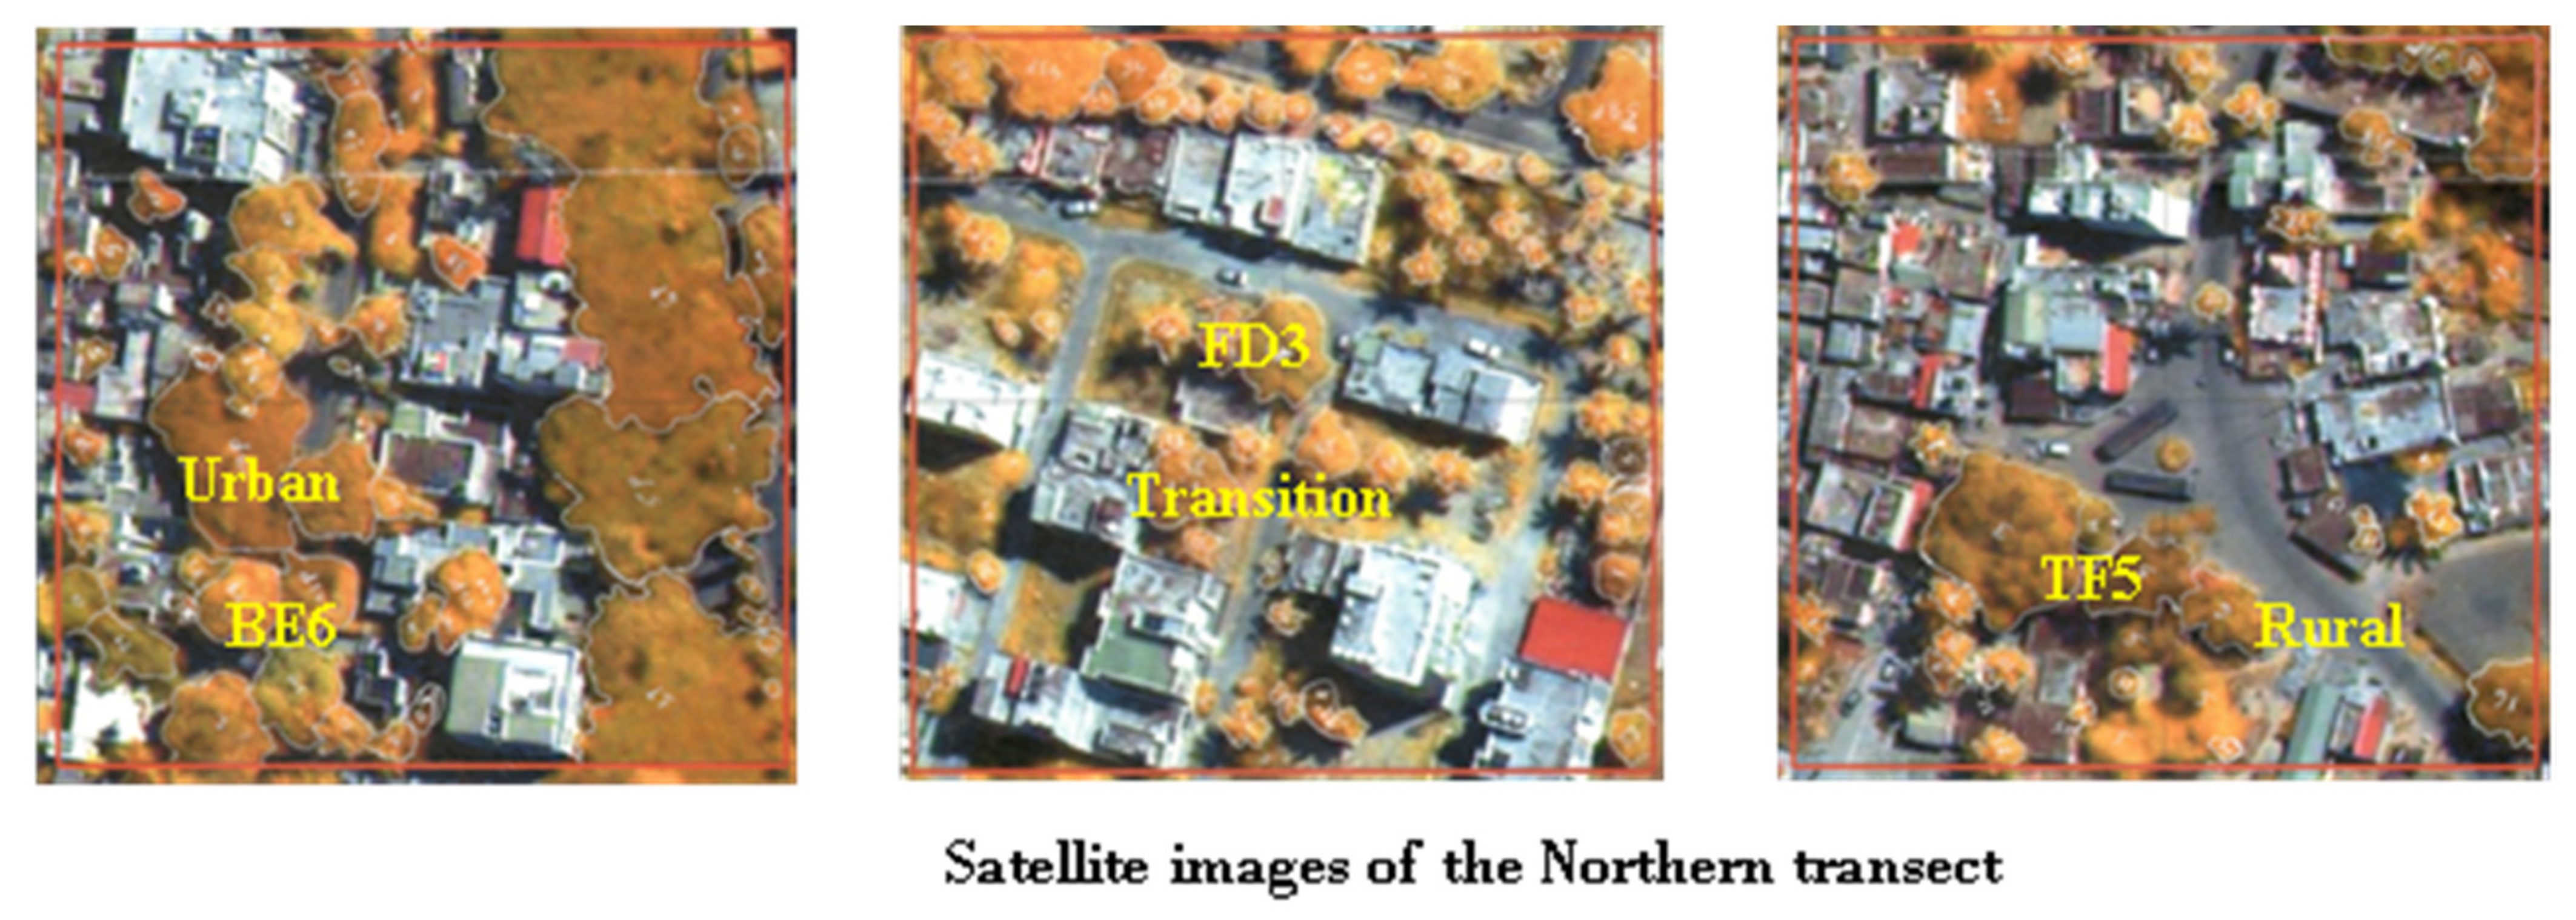
2.1. Study Area
2.2. Data and Field Procedure
3. Results
3.1. Tree Variables
3.1.1. Height
3.1.2. Crown Base Height and Crown Height
3.1.3. Crown Shape, Density and Symmetry
3.1.4. Tree Access
3.1.5. Tree Permat and Tree Condition, Basal Area and Volume
4. Discussion
5. Conclusions
Author Contributions
Funding
Institutional Review Board Statement
Informed Consent Statement
Data Availability Statement
Acknowledgments
Conflicts of Interest
References
- UNDESA. World Urbanization Prospects: The 2018 Revision, New York 2019; 126p. Available online: https://population.un.org/wup/Publications/Files/WUP2018-Report.pdf (accessed on 16 December 2021).
- Sudhira, H.S.; Ramachandra, T.V.; Subrahmanya, M.H.B. City profile Bangalore. Cities 2007, 24, 379–390. [Google Scholar] [CrossRef]
- Narayana, M.R. Globalization and Urban Economic Growth: Evidence for Bangalore, India. Int. J. Urban Reg. Res. 2011, 35, 1284–1301. [Google Scholar] [CrossRef]
- Ramachandra, T.V.; Aithal, B.H.; Durgappa, D.S. Insights to urban dynamics through landscape spatial pattern analysis. Int. J. Appl. Earth Obs. Geoinf. 2012, 18, 329–343. [Google Scholar]
- Bangalore, India Metro Area Population 1950–2021. Available online: https://www.macrotrends.net/cities/21176/bangalore/population (accessed on 16 December 2021).
- Nagendra, H.; Gopal, D. Street trees in Bangalore—Density, diversity, composition and distribution. Urban For. Urban Green. 2010, 9, 129–137. [Google Scholar] [CrossRef]
- Gopal, D.; Nagendra, H. Vegetation in Bangalore’s slums: Boosting livelihoods, well-being and social capital. Sustainability 2014, 6, 2459–2573. [Google Scholar] [CrossRef] [Green Version]
- Nagendra, H.; Lucas, R.; Honrado, J.P.; Jongman, R.H.G.; Tarantino, C.; Adamo, M.; Mairota, P. Remote sensing for conservation monitoring: Assessing protected areas, habitat extent, habitat condition, species diversity and threats. Ecol. Indic. 2013, 33, 45–59. [Google Scholar] [CrossRef]
- Paul, S.; Nagendra, H. Vegetation change and fragmentation in the mega city of Delhi: Mapping 25 years of change. Appl. Geogr. 2015, 58, 153–166. [Google Scholar] [CrossRef]
- Aronson, M.F.; La Sorte, F.A.; Nilon, C.H.; Katti, M.; Goddard, M.A.; Lepczyk, C.A.; Warren, P.S.; Williams, N.S.; Cilliers, S.; Clarkson, B.; et al. A global analysis of the impacts of urbanization on bird and plant diversity reveals key anthropogenic drivers. Proc. R. Soc. B Biol. Sci. 2014, 281, 20133330. [Google Scholar] [CrossRef]
- Aronson, M.F.J.; Handel, S.N.; La Puma, I.P.; Clemants, S.E. Urbanization promotes non-native woody species and diverse plant assemblages in the New York metropolitan region. Urban Ecosyst. 2015, 18, 31–45. [Google Scholar] [CrossRef]
- Nagendra, H.; Gopal, D. Tree diversity, distribution, history and change in urban parks: Studies in Bangalore, India. Urban Ecosyst. 2011, 14, 211–223. [Google Scholar] [CrossRef]
- Chaudhry, P.; Bagra, K.; Singh, B. Urban Greenery Status of Some Indian Cities: A Short Communication. Int. J. Environ. Sci. Dev. 2011, 2, 98–101. [Google Scholar] [CrossRef]
- Gowda, K.; Sridhara, M.V.; Rajan, S. Planning and management of parks and green areas: The case of Bangalore metropolitan area. Manag. Environ. Qual. 2007, 19, 270–282. [Google Scholar] [CrossRef]
- Behera, G.; Nageshwara, R.; Dutt, P.P.; Manikiam, B.; Balakrishna, P.; Krishnamurthy, J.; Jagadeesh, K.M.; Ganesha, R.K.; Diwakar, P.G.; Padmavathy, A.S.; et al. Growth of Bangalore City Since 1980 Based on Maps and Satellite Imagery; Technical Report, ISRO-EOS-TR-55-85; Indian Space Research Organization: Bangalore, India, 1985. [Google Scholar]
- Sudha, P.; Ravindranath, N.H. A study of Bangalore urban forest. Landsc. Urban Plan. 2000, 47, 47–63. [Google Scholar] [CrossRef]
- Maurer, U.; Peschel, T.; Schmitz, S. The flora of selected land-use types in Berlin and Potsdam with regard to nature conservation in cities. Landsc. Urban Plan. 2000, 46, 209–215. [Google Scholar] [CrossRef]
- Zerbe, S.; Choi, I.; Kowarik, I. Characteristics and habitats of non-native plant species in the city of Chonju, Southern Korea. Ecol. Res. 2004, 19, 91–98. [Google Scholar] [CrossRef]
- Curtis, J.T.; McIntosh, R.P. The interrelations of certain analytic and synthetic phytosociological characters. Ecology 1950, 31, 434–455. [Google Scholar] [CrossRef]
- Shannon, C.E.; Wiener, W. The Mathematical Theory of Communication; University of Illinois Press: Urbana, IL, USA, 1963; 127p. [Google Scholar]
- Simpson, E.H. Measurement of diversity. Nature 1949, 163, 688. [Google Scholar] [CrossRef]
- Ludwig, J.A.; Reynolds, J.F. Statistical Ecology; John Wiley and Sons: New York, NY, USA, 1988. [Google Scholar]
- Pielou, E.C. Ecological Diversity; John Wiley & Sons: New York, NY, USA, 1975; viii + 165p. [Google Scholar]
- Gentry, A.H. Changes in Plant Community Diversity and Floristic Composition on Environmental and Geographical Gradients. Ann. Mo. Bot. Gard. 1988, 75, 1–34. [Google Scholar] [CrossRef]
- Kacholi, D.S. Analysis of Structure and Diversity of the Kilengwe Forest in the Morogoro Region, Tanzania. Int. J. Biodivers. 2014, 2014, 516840. [Google Scholar] [CrossRef] [Green Version]
- Jonsson, P. Vegetation as an urban climate control in the subtropical. Int. J. Climatol. 2004, 24, 1307–1322. [Google Scholar] [CrossRef]
- Song, X.P.; Richards, D.; Edwards, P.; Tan, P.Y. Benefits of trees in tropical cities. Science 2017, 356, 1241. [Google Scholar] [CrossRef]
- Lal, C.B.; Annapurna, C.; Raghubanshi, A.S.; Singh, J.S. Effect of leaf habit and soil type on nutrient resorption and conservation in woody species of a dry tropical environment. Can. J. Bot. 2001, 79, 1066–1075. [Google Scholar]
- Godefroid, S.; Koedam, N. Urban plant species patterns are highly driven by density and function of built-up areas. Landsc. Ecol. 2007, 22, 1227–1239. [Google Scholar] [CrossRef]
- McKinney, M.L. Urbanization as a major cause of biotic homogenization. Biol. Conserv. 2006, 127, 247–260. [Google Scholar] [CrossRef]
- Olden, J.D.; Poff, N.L. Toward a mechanistic understanding and prediction of biotic homogenization. Am. Nat. 2003, 162, 442–460. [Google Scholar] [CrossRef] [PubMed] [Green Version]
- McKinney, M.L. Urbanization, biodiversity, and conservation: The impacts of urbanization on native species are poorly studied, but educating a highly urbanized human population about these impacts can greatly improve species conservation in all ecosystems. Bioscience 2002, 52, 883–890. [Google Scholar] [CrossRef]
- Nagendra, H.; Nagendran, S.; Paul, S.; Pareeth, S. Graying, greening and fragmentation in the rapidly expanding Indian city of Bangalore. Landsc. Urban Plan. 2012, 105, 400–406. [Google Scholar] [CrossRef]
- McDonnell, M.J.; Hahs, A.K. The use of gradient analysis studies in advancing our understanding of the ecology of urbanizing landscapes: Current status and future directions. Landsc. Ecol. 2008, 23, 1143–1155. [Google Scholar] [CrossRef]
- Mutlu, S.S.; Selim, C.; Gülçin, Ü.N. Plant Biodiversity of Urban Roadside Trees in Antalya, Turkey. J. For. Fac. 2017, 17, 80–87. [Google Scholar] [CrossRef] [Green Version]
- Roy, D.; Mukherjee, S.K. Diversity of trees in Kalyani township in West Bengal. J. Econ. Taxon. Bot. 2011, 35, 687–695. [Google Scholar]
- Vakhlamova, T.; Rusterholz, H.P.; Kamkin, V.A.; Baur, B. Recreational use of urban and suburban forests affects plant diversity in a Western Siberian city. Urban For. Urban Green. 2016, 17, 92–103. [Google Scholar] [CrossRef]
- Ramachandra, T.V.; Aithal, B.H.; Kulkarni, G.; Vinay, S. Green spaces in Bengaluru: Quantification through geospatial techniques. Indian For. 2017, 143, 307–320. [Google Scholar]


| Sl. No. | Tree Variables | Description | |
|---|---|---|---|
| 1. | Diameter at Breast height DBH (cm) | Tree stem was measured at 1.33 m above the ground with diameter tape. | |
| 2. | Height (m) | Height is the total height of the standing tree measured as the straight line distance from tip of the leading shoot to the ground level. | |
| 3. | Crown Base Height (m) | The average distance between ground and lowest foliage layer of the tree. | |
| 4. | Crown Height (m) | It is the vertical measurement of the crown of a tree from the tip to the and lowest foliage layer of the tree. | |
| 5. | Tree access | It describes if the tree is directly accessible or in fenced premises. | 0 = accessible 1 = not-accessible 2 = tree stands on private property |
| 6. | Tree stand | It describes whether the tree is solitary or part of a tree group. | 0 = solitary tree 1 = part of group of trees |
| 7. | Tree permat | It describes the pavement around the tree stem. | 1 = non-permeable 2 = permeable pavements 3 = bare soil |
| 8. | Crown symmetry | It describes the symmetry of the crown. | 0 = symmetrical 1 = non-symmetrical |
| 9. | Crown shape | Based on visual estimate, crown shape was noted based on crown measurements. | 1 = cylinder 2 = horizontal ellipsoid 3 = vertical ellipsoid 4 = paraboloid 5 = upside down paraboloid 6 = sphere |
| 10. | Crown density | Based on visual assessment, the crown hemisphere of the tree was assigned with one of the density classes. | 0 = dense (80–100%) 1 = medium (40–80%) 2 = sparse (0–40%) |
| 11. | Tree condition | Based on a visual assessment, tree health condition was noted down based on four categories. | 1 = healthy 2 = affected/at risk 3 = dying/declining 4 = dead 7 = Whole crown is visible 8 = Crown only partially visible 9 = Crown not visible |
| Sl. No. | Diversity Index | Formula | Range | Description |
|---|---|---|---|---|
| 1 | Shannon–Wiener diversity index [20] | 0–1 | It characterises both the number of species and their distribution in the community. Higher value indicates high diversity and vice versa. | |
| 2 | Simpson’s index of diversity [21] | 0–1 | It give more emphasis on the most abundant species in the community. Higher value indicates high diversity and vice versa. | |
| 3 | Simpson’s index of dominance [21] | It considers number of individual species present, as well as the relative abundance of each species. | ||
| 4 | Margalef Richness index [22] | It is a measure of species richness in the community. | ||
| 5 | Pielou’s evenness index [23] | e = H′/ln S | 0–1 | It is a measure of evenness in the community. 0 stands for low and 1 for high evenness. |
| Sl. No. | Family | Northern Transect |
|---|---|---|
| 1 | Anacardiaceae | 2 |
| 2 | Annonaceae | 1 |
| 3 | Apocynaceae | 2 |
| 4 | Araucariaceae | 1 |
| 5 | Arecaceae | 6 |
| 6 | Bignoniaceae | 7 |
| 7 | Boraginaceae | 2 |
| 8 | Burseraceae | 1 |
| 9 | Caricaceae | 1 |
| 10 | Casuarinaceae | 1 |
| 11 | Combretaceae | 1 |
| 12 | Cornaceae | 1 |
| 13 | Cupressaceae | 1 |
| 14 | Euphorbiaceae | 3 |
| 15 | Fabaceae | 16 |
| 16 | Lamiaceae | 1 |
| 17 | Lauraceae | 1 |
| 18 | Lecythidaceae | 1 |
| 19 | Lythraceae | 2 |
| 20 | Magnoliaceae | 1 |
| 21 | Malvaceae | 2 |
| 22 | Meliaceae | 5 |
| 23 | Moraceae | 10 |
| 24 | Moringaceae | 1 |
| 25 | Muntingiaceae | 1 |
| 26 | Myrtaceae | 5 |
| 27 | Nyctaginaceae | 1 |
| 28 | Oleaceae | |
| 29 | Phyllanthaceae | 2 |
| 30 | Podocarpaceae | 1 |
| 31 | Proteaceae | 1 |
| 32 | Rubiaceae | 2 |
| 33 | Rutaceae | 5 |
| 34 | Santalaceae | |
| 35 | Sapindaceae | 1 |
| 36 | Sapotaceae | 1 |
| 37 | Strelitziaceae | 1 |
| 38 | Unknown | 1 |
| 39 | Verbenaceae | 1 |
| Total | 93 | |
| Plot No. | Plot ID | No. of Trees | No. of Species | Shannon–Wiener Diversity | Simpson’s Dominance | Simpson’s Diversity | Richness | Evenness |
|---|---|---|---|---|---|---|---|---|
| 1 | OD2 | 42 | 10 | 1.893 | 0.206 | 0.794 | 2.408 | 0.822 |
| 2 | LF5 | 49 | 20 | 2.577 | 0.111 | 0.889 | 4.882 | 0.860 |
| 3 | NC9 | 103 | 25 | 2.720 | 0.092 | 0.908 | 5.178 | 0.845 |
| 4 | KD5 | 47 | 21 | 2.656 | 0.108 | 0.892 | 5.195 | 0.872 |
| 5 | PF9 | 48 | 16 | 2.285 | 0.157 | 0.843 | 3.875 | 0.824 |
| 6 | BE6 | 89 | 18 | 2.325 | 0.151 | 0.849 | 3.787 | 0.804 |
| 7 | AC5 | 61 | 18 | 2.358 | 0.163 | 0.837 | 4.135 | 0.816 |
| 8 | MI3 | 57 | 21 | 2.592 | 0.106 | 0.894 | 4.947 | 0.851 |
| 9 | QG5 | 37 | 14 | 2.229 | 0.154 | 0.846 | 3.323 | 0.869 |
| 10 | RE5 | 63 | 17 | 2.468 | 0.114 | 0.886 | 3.862 | 0.871 |
| 11 | SF5 | 35 | 12 | 2.024 | 0.187 | 0.813 | 3.094 | 0.814 |
| 12 | UE5 | 45 | 17 | 2.283 | 0.160 | 0.840 | 4.203 | 0.806 |
| 13 | TF5 | 48 | 10 | 1.658 | 0.272 | 0.728 | 2.325 | 0.720 |
| 14 | VE5 | 36 | 11 | 1.830 | 0.225 | 0.775 | 2.791 | 0.763 |
| 15 | DE5 | 49 | 12 | 1.947 | 0.207 | 0.793 | 2.826 | 0.784 |
| 16 | CF6 | 26 | 12 | 2.086 | 0.189 | 0.811 | 3.376 | 0.839 |
| 17 | WE5 | 44 | 17 | 2.444 | 0.123 | 0.877 | 4.228 | 0.863 |
| 18 | FD3 | 76 | 19 | 2.287 | 0.172 | 0.828 | 4.156 | 0.777 |
| 19 | ED6 | 19 | 12 | 2.233 | 0.147 | 0.853 | 3.736 | 0.899 |
| 20 | GH4 | 52 | 15 | 2.395 | 0.115 | 0.885 | 3.543 | 0.884 |
| 21 | ID5 | 17 | 5 | 1.335 | 0.315 | 0.685 | 1.412 | 0.829 |
| 22 | HE6 | 50 | 14 | 1.979 | 0.230 | 0.770 | 3.323 | 0.750 |
| 23 | JF5 | 35 | 13 | 1.685 | 0.349 | 0.651 | 3.375 | 0.657 |
| Sl. No. | List of Species | Origin | Urban | Transition | Rural | Total | Frequency | RF | Density | RD |
|---|---|---|---|---|---|---|---|---|---|---|
| 1 | Acacia catechu | Na | 1 | 0 | 0 | 1 | 4.35 | 0.29 | 0.04 | 0.09 |
| 2 | Acacia ferruginea | Na | 1 | 0 | 0 | 1 | 4.35 | 0.29 | 0.04 | 0.09 |
| 3 | Aegle marmelos | Na | 0 | 0 | 1 | 1 | 4.35 | 0.29 | 0.04 | 0.09 |
| 4 | Alangium salviifolium | Na | 0 | 0 | 1 | 1 | 4.35 | 0.29 | 0.04 | 0.09 |
| 5 | Alastonia macrophylla | Ex | 3 | 0 | 0 | 3 | 4.35 | 0.29 | 0.13 | 0.27 |
| 6 | Albizia kalkora | Na | 0 | 0 | 1 | 1 | 4.35 | 0.29 | 0.04 | 0.09 |
| 7 | Anthocephalus kadamba | Na | 7 | 0 | 0 | 7 | 8.70 | 0.57 | 0.30 | 0.62 |
| 8 | Araucaria cunninghamii | Ex | 5 | 0 | 2 | 7 | 21.74 | 1.43 | 0.30 | 0.62 |
| 9 | Areca catechu | Ex | 3 | 4 | 2 | 9 | 21.74 | 1.43 | 0.39 | 0.80 |
| 10 | Artocarpus heterophyllus | Na | 10 | 4 | 16 | 30 | 65.22 | 4.29 | 1.30 | 2.66 |
| 11 | Azadirachta indica | Na | 7 | 10 | 15 | 32 | 73.91 | 4.86 | 1.39 | 2.84 |
| 12 | Bauhinia purpurea | Na | 7 | 0 | 1 | 8 | 13.04 | 0.86 | 0.35 | 0.71 |
| 13 | Bougainvillea glabra | Ex | 1 | 0 | 0 | 1 | 4.35 | 0.29 | 0.04 | 0.09 |
| 14 | Callistemon lanceolatus | Ex | 1 | 0 | 0 | 1 | 4.35 | 0.29 | 0.04 | 0.09 |
| 15 | Carica papaya | Ex | 1 | 1 | 7 | 9 | 13.04 | 0.86 | 0.39 | 0.80 |
| 16 | Caryota urens | Na | 8 | 0 | 0 | 8 | 8.70 | 0.57 | 0.35 | 0.71 |
| 17 | Cassia fistula | Na | 1 | 0 | 0 | 1 | 4.35 | 0.29 | 0.04 | 0.09 |
| 18 | Casuarina equisetifolia | Ex | 2 | 0 | 0 | 2 | 4.35 | 0.29 | 0.09 | 0.18 |
| 19 | Ceiba pentandra | Na | 0 | 0 | 5 | 5 | 8.70 | 0.57 | 0.22 | 0.44 |
| 20 | Citrus limonum | Na | 0 | 0 | 1 | 1 | 4.35 | 0.29 | 0.04 | 0.09 |
| 21 | Citrus maxima | Ex | 0 | 1 | 0 | 1 | 4.35 | 0.29 | 0.04 | 0.09 |
| 22 | Citrus medica | Na | 0 | 0 | 1 | 1 | 4.35 | 0.29 | 0.04 | 0.09 |
| 23 | Cocos nucifera | Ex | 84 | 46 | 144 | 274 | 100.00 | 6.57 | 11.91 | 24.29 |
| 24 | Coffee arebica | Ex | 1 | 0 | 0 | 1 | 4.35 | 0.29 | 0.04 | 0.09 |
| 25 | Commiphora caudata | Na | 0 | 0 | 5 | 5 | 13.04 | 0.86 | 0.22 | 0.44 |
| 26 | Cordia dichotoma | Na | 0 | 3 | 3 | 6 | 17.39 | 1.14 | 0.26 | 0.53 |
| 27 | Cordia mixa | Na | 1 | 0 | 0 | 1 | 4.35 | 0.29 | 0.04 | 0.09 |
| 28 | Couroupita guianensis | Ex | 2 | 0 | 0 | 2 | 4.35 | 0.29 | 0.09 | 0.18 |
| 29 | Crysalidocarpous lutescens | Ex | 0 | 0 | 1 | 1 | 4.35 | 0.29 | 0.04 | 0.09 |
| 30 | Dead | Un | 1 | 1 | 0 | 2 | 8.70 | 0.57 | 0.09 | 0.18 |
| 31 | Dilonix regia | Ex | 8 | 1 | 4 | 13 | 34.78 | 2.29 | 0.57 | 1.15 |
| 32 | Duranta plumeri | Ex | 0 | 3 | 0 | 3 | 8.70 | 0.57 | 0.13 | 0.27 |
| 33 | Eucalyptus hybrid | Ex | 5 | 9 | 35 | 49 | 43.48 | 2.86 | 2.13 | 4.34 |
| 34 | Euphorbia synadenium | Na | 1 | 1 | 0 | 2 | 8.70 | 0.57 | 0.09 | 0.18 |
| 35 | Euphorbia tirucalli | Ex | 0 | 0 | 1 | 1 | 4.35 | 0.29 | 0.04 | 0.09 |
| 36 | Ficus benghalensis | Na | 0 | 1 | 3 | 4 | 8.70 | 0.57 | 0.17 | 0.35 |
| 37 | Ficus benzamin | Na | 1 | 0 | 0 | 1 | 4.35 | 0.29 | 0.04 | 0.09 |
| 38 | Ficus drupacea | Na | 0 | 1 | 6 | 7 | 13.04 | 0.86 | 0.30 | 0.62 |
| 39 | Ficus elastica | Na | 2 | 0 | 0 | 2 | 4.35 | 0.29 | 0.09 | 0.18 |
| 40 | Ficus glomerata | Na | 3 | 3 | 3 | 9 | 34.78 | 2.29 | 0.39 | 0.80 |
| 41 | Ficus religiosa | Na | 1 | 6 | 17 | 24 | 43.48 | 2.86 | 1.04 | 2.13 |
| 42 | Ficus tinctoria | Na | 0 | 0 | 4 | 4 | 4.35 | 0.29 | 0.17 | 0.35 |
| 43 | Gliricidia sepium | Ex | 0 | 0 | 2 | 2 | 8.70 | 0.57 | 0.09 | 0.18 |
| 44 | Grevillea robusta | Ex | 20 | 10 | 35 | 65 | 52.17 | 3.43 | 2.83 | 5.76 |
| 45 | Jacaranda mimosifolia | Ex | 6 | 0 | 6 | 12 | 13.04 | 0.86 | 0.52 | 1.06 |
| 46 | Kigelia pinnata | Ex | 1 | 0 | 0 | 1 | 4.35 | 0.29 | 0.04 | 0.09 |
| 47 | Lagerstroemia flos-reginae | Ex | 4 | 1 | 0 | 5 | 13.04 | 0.86 | 0.22 | 0.44 |
| 48 | Lannea coromandelica | Na | 0 | 0 | 1 | 1 | 4.35 | 0.29 | 0.04 | 0.09 |
| 49 | Leucaena leucocephala | Ex | 0 | 2 | 0 | 2 | 8.70 | 0.57 | 0.09 | 0.18 |
| 50 | Mangifera indica | Na | 23 | 6 | 9 | 38 | 73.91 | 4.86 | 1.65 | 3.37 |
| 51 | Manilkara zapota | Ex | 1 | 0 | 0 | 1 | 4.35 | 0.29 | 0.04 | 0.09 |
| 52 | Melia azedarach | Na | 1 | 0 | 1 | 2 | 8.70 | 0.57 | 0.09 | 0.18 |
| 53 | Melia dubia | Na | 0 | 0 | 5 | 5 | 13.04 | 0.86 | 0.22 | 0.44 |
| 54 | Michelia champaca | Na | 8 | 0 | 0 | 8 | 21.74 | 1.43 | 0.35 | 0.71 |
| 55 | Millingtonia hortensis | Ex | 3 | 0 | 1 | 4 | 13.04 | 0.86 | 0.17 | 0.35 |
| 56 | Moringa oleifera | Na | 5 | 4 | 6 | 15 | 30.43 | 2.00 | 0.65 | 1.33 |
| 57 | Morus alba | Ex | 0 | 10 | 0 | 10 | 4.35 | 0.29 | 0.43 | 0.89 |
| 58 | Morus papyrifera | Ex | 2 | 2 | 0 | 4 | 8.70 | 0.57 | 0.17 | 0.35 |
| 59 | Muntingia calabura | Ex | 3 | 3 | 4 | 10 | 34.78 | 2.29 | 0.43 | 0.89 |
| 60 | Murraya koenigii | Na | 1 | 4 | 13 | 18 | 39.13 | 2.57 | 0.78 | 1.60 |
| 61 | Parkia biglandularis | Ex | 0 | 0 | 1 | 1 | 4.35 | 0.29 | 0.04 | 0.09 |
| 62 | Peltophorum pterocarpum | Na | 21 | 0 | 1 | 22 | 21.74 | 1.43 | 0.96 | 1.95 |
| 63 | Persea americana | Ex | 1 | 0 | 0 | 1 | 4.35 | 0.29 | 0.04 | 0.09 |
| 64 | Phoenix dactylifera | Ex | 0 | 0 | 1 | 1 | 4.35 | 0.29 | 0.04 | 0.09 |
| 65 | Phyllanthus acidus | Ex | 1 | 0 | 1 | 2 | 8.70 | 0.57 | 0.09 | 0.18 |
| 66 | Phyllanthus emblica | Na | 1 | 0 | 1 | 2 | 8.70 | 0.57 | 0.09 | 0.18 |
| 67 | Pithocellbium dulce | Ex | 1 | 0 | 0 | 1 | 4.35 | 0.29 | 0.04 | 0.09 |
| 68 | Plumeria alba | Ex | 2 | 0 | 0 | 2 | 4.35 | 0.29 | 0.09 | 0.18 |
| 69 | Podocarpus totara | Ex | 0 | 2 | 0 | 2 | 4.35 | 0.29 | 0.09 | 0.18 |
| 70 | Polyalthia longifolia | Ex | 45 | 0 | 12 | 57 | 26.09 | 1.71 | 2.48 | 5.05 |
| 71 | Pongamia pinnata | Na | 32 | 16 | 15 | 63 | 52.17 | 3.43 | 2.74 | 5.59 |
| 72 | Prosopis juliflora | Ex | 0 | 1 | 0 | 1 | 4.35 | 0.29 | 0.04 | 0.09 |
| 73 | Psidium guajava | Ex | 5 | 5 | 3 | 13 | 30.43 | 2.00 | 0.57 | 1.15 |
| 74 | Punica granatum | Ex | 0 | 0 | 1 | 1 | 4.35 | 0.29 | 0.04 | 0.09 |
| 75 | Ravenala madagascariensis | Ex | 2 | 0 | 0 | 2 | 4.35 | 0.29 | 0.09 | 0.18 |
| 76 | Ricinus communis | Ex | 1 | 1 | 1 | 3 | 13.04 | 0.86 | 0.13 | 0.27 |
| 77 | Royestonea regia | Ex | 2 | 0 | 1 | 3 | 8.70 | 0.57 | 0.13 | 0.27 |
| 78 | Samanea saman | Ex | 11 | 1 | 4 | 16 | 26.09 | 1.71 | 0.70 | 1.42 |
| 79 | Sapindus mukorossi | Ex | 1 | 0 | 0 | 1 | 4.35 | 0.29 | 0.04 | 0.09 |
| 80 | Sesbania grandiflora | Ex | 0 | 0 | 2 | 2 | 4.35 | 0.29 | 0.09 | 0.18 |
| 81 | Spathedea campanulata | Ex | 16 | 2 | 0 | 18 | 26.09 | 1.71 | 0.78 | 1.60 |
| 82 | Swietenia macrophylla | Ex | 24 | 0 | 3 | 27 | 26.09 | 1.71 | 1.17 | 2.39 |
| 83 | Swietenia mahagoni | Ex | 16 | 0 | 0 | 16 | 13.04 | 0.86 | 0.70 | 1.42 |
| 84 | Syzygium cumini | Na | 10 | 1 | 3 | 14 | 26.09 | 1.71 | 0.61 | 1.24 |
| 85 | Syzygium jambos | Ex | 0 | 1 | 0 | 1 | 4.35 | 0.29 | 0.04 | 0.09 |
| 86 | Tabebuia aurea | Ex | 2 | 0 | 0 | 2 | 4.35 | 0.29 | 0.09 | 0.18 |
| 87 | Tabebuia rosea | Ex | 16 | 0 | 1 | 17 | 17.39 | 1.14 | 0.74 | 1.51 |
| 88 | Tamarindus indica | Ex | 0 | 0 | 2 | 2 | 8.70 | 0.57 | 0.09 | 0.18 |
| 89 | Tecoma stans | Ex | 22 | 1 | 1 | 24 | 26.09 | 1.71 | 1.04 | 2.13 |
| 90 | Tectona grandis | Na | 2 | 10 | 34 | 46 | 56.52 | 3.71 | 2.00 | 4.08 |
| 91 | Terminalia catappa | Na | 4 | 1 | 1 | 6 | 26.09 | 1.71 | 0.26 | 0.53 |
| 92 | Thespesia populnea | Na | 11 | 0 | 1 | 12 | 17.39 | 1.14 | 0.52 | 1.06 |
| 93 | Thuja biota | Ex | 0 | 1 | 0 | 1 | 4.35 | 0.29 | 0.04 | 0.09 |
| 94 | Unknown | Un | 1 | 0 | 0 | 1 | 4.35 | 0.29 | 0.04 | 0.09 |
| Total | 496 | 180 | 452 | 1128 | 1521.74 | 100 | 49.04 | 100 |
| Species | Origin | Urban | Transition | Rural |
|---|---|---|---|---|
| Areca catechu | Na | 7.86 | ||
| Artocarpus heterophyllus | Na | 8.07 | 7.86 | 10.99 |
| Azadirachta indica | Na | 6.18 | 16.26 | 11.33 |
| Cocos nucifera | Ex | 39.31 | 58.18 | 59.02 |
| Dilonix regia | Ex | 6.59 | ||
| Duranta plumeri | Ex | 6.74 | ||
| Eucalyptus hybrid | Ex | 11.75 | 14.75 | |
| Ficus benghalensis | Na | 7.62 | ||
| Ficus glomerata | Na | 6.74 | ||
| Ficus religiosa | Na | 10.09 | 51.89 | |
| Ficus tinctoria | Na | 8.02 | ||
| Grevillea robusta | Ex | 10.09 | 14.56 | 15.50 |
| Mangifera indica | Na | 13.99 | 11.79 | 7.54 |
| Michelia champaca | Na | 6.59 | ||
| Moringa oleifera | Na | 7.86 | ||
| Morus alba | Ex | 12.87 | ||
| Muntingia calabura | Ex | 6.74 | ||
| Murraya koenigii | Na | 7.86 | 7.55 | |
| Peltophorum pterocarpum | Na | 11.17 | ||
| Polyalthia longifolia | Ex | 20.87 | ||
| Pongamia pinnata | Na | 16.28 | 21.27 | 8.12 |
| Psidium guajava | Ex | 10.67 | ||
| Samanea saman | Ex | 6.46 | ||
| Spathedea campanulata | Ex | 9.82 | ||
| Swietenia macrophylla | Ex | 13.05 | ||
| Swietenia mahagoni | Ex | 8.48 | ||
| Syzygium cumini | Na | 6.72 | ||
| Tabebuia rosea | Ex | 8.48 | ||
| Tecoma stans | Ex | 11.57 | ||
| Tectona grandis | Na | 16.26 | 16.79 | |
| Thespesia populnea | Na | 6.46 |
| Domain | Parameters | 2017 | 2018 | 2019 | * Change |
|---|---|---|---|---|---|
| Urban | Number of Species | 64 | 58 | 55 | −9 |
| Number of trees | 496 | 474 | 466 | −30 | |
| Basal area (m2) | 43.01 | 44.56 | 46.67 | 3.66 | |
| Wood volume (m3) | 803.47 | 827.35 | 862.17 | 58.7 | |
| Transition | Number of Species | 37 | 32 | 31 | −6 |
| Number of trees | 180 | 161 | 154 | −26 | |
| Basal area (m2) | 12.8 | 12.75 | 13.4 | 0.6 | |
| Wood volume (m3) | 233.56 | 233.87 | 245.23 | 11.67 | |
| Rural | Number of Species | 56 | 53 | 51 | −5 |
| Number of trees | 452 | 421 | 381 | −71 | |
| Basal area (m2) | 40.58 | 42.13 | 42.69 | 2.11 | |
| Wood volume (m3) | 782.54 | 810.52 | 818.83 | 36.29 | |
| Total | Number of Species | 93 | 87 | 83 | −10 |
| Number of trees | 1128 | 1056 | 1001 | −127 | |
| Basal area (m2) | 96.39 | 99.44 | 102.76 | 6.37 | |
| Wood volume (m3) | 1819.57 | 1871.74 | 1926.23 | 106.66 |
Publisher’s Note: MDPI stays neutral with regard to jurisdictional claims in published maps and institutional affiliations. |
© 2022 by the authors. Licensee MDPI, Basel, Switzerland. This article is an open access article distributed under the terms and conditions of the Creative Commons Attribution (CC BY) license (https://creativecommons.org/licenses/by/4.0/).
Share and Cite
Divakara, B.N.; Nikitha, C.U.; Nölke, N.; Tewari, V.P.; Kleinn, C. Tree Diversity and Tree Community Composition in Northern Part of Megacity Bengaluru, India. Sustainability 2022, 14, 1295. https://0-doi-org.brum.beds.ac.uk/10.3390/su14031295
Divakara BN, Nikitha CU, Nölke N, Tewari VP, Kleinn C. Tree Diversity and Tree Community Composition in Northern Part of Megacity Bengaluru, India. Sustainability. 2022; 14(3):1295. https://0-doi-org.brum.beds.ac.uk/10.3390/su14031295
Chicago/Turabian StyleDivakara, Baragur Neelappa, Chitradurga Umesh Nikitha, Nils Nölke, Vindhya Prasad Tewari, and Christoph Kleinn. 2022. "Tree Diversity and Tree Community Composition in Northern Part of Megacity Bengaluru, India" Sustainability 14, no. 3: 1295. https://0-doi-org.brum.beds.ac.uk/10.3390/su14031295