
Exploring the Evolution and Determinants of Open Innovation: A Perspective from Patent Citations


1
School of Management, Huazhong University of Science and Technology, Wuhan 430074, China
2
School of Intellectual Property, Nanjing University of Science and Technology, Nanjing 210014, China
3
Law School, Huazhong University of Science and Technology, Wuhan 430074, China
*
Author to whom correspondence should be addressed.
Sustainability 2022, 14(3), 1618; https://0-doi-org.brum.beds.ac.uk/10.3390/su14031618
Submission received: 27 December 2021
/
Revised: 18 January 2022
/
Accepted: 26 January 2022
/
Published: 29 January 2022
(This article belongs to the Special Issue Open Innovation and Business Model for Economy Sustainability after the COVID-19 Pandemic)
Abstract
:The research of open innovation (OI) has developed considerably in recent years. In this article, a new perspective based on the patent citation network is provided to explore the dynamic evolution and mode of OI. In our framework of the OI network, enterprises are represented as nodes, and patent citations represent cross-organizational knowledge flow, which are ties in the network. The Driver Assistance System (DAS) was selected as the research case. Time-sliced patent citation networks are constructed, and then an exponential random graph model is employed to identify the formation mechanism of OI networks. The results show that the OI network of DAS is still partially open and at a low level. The inherent dominance of automakers may have been weakened, and new models and relationships in innovation activities are developing. In addition, heterogeneity in type and geographic proximity which significantly promote the formation of the open network was prevented, but the larger scale of the enterprise inhibited the OI network. R&D investment has no obvious impact. This research provides a new perspective to observe open innovation and helps stakeholders to better understand industry trends.
1. Introduction
Innovation is becoming more and more important than ever due to economic globalization and fast-growing technological complexity [1]. The explosion of innovation makes it difficult for companies to grasp all the knowledge and rely solely on their power [2]. Therefore, it is worth mentioning that the open innovation theory is recieving more and more attention from entrepreneurs and scholars.
OI promotes its innovation performance by emphasizing the active seeking and absorption of external resources in its innovation activities [3]. For example, Procter & Gamble has improved its R&D efficiency by 60% through its OI strategy [4,5]. In short, the essence of OI is the cross-organizational flow of knowledge and technology. By identifying this flow, we can better understand the pattern of OI and the path of knowledge creation and dissemination. This research proposes a new perspective to simulate the OI process in a field from the network, explore the influencing factors of this process, and help stakeholders to fully understand open innovation.
Methodologically, this research observes the OI pattern through the knowledge flow network, and patent citation information is used. First, a patent citation network based on time slices is constructed separately, and the status and trend of the knowledge flow are presented. Then, the formation mechanism of the OI network is analyzed by exponential random graph model (ERGM). In innovative activities, the attributes of actors and other relationships that exist between them may lead to different network patterns. Moreover, many network structures also reflect the motivations that promote the formation of the network. Past research has contributed to the discovery of different types of OI such as outsourcing, R&D collaboration, and the characteristics of different OI patterns [6]. However, due to the explosion of technology, the large-scale knowledge flow that exists among enterprises should attract more attention. Meanwhile, most of the static models are not matched with the dynamic knowledge flow in the OI process, especially in the current situation where the development cycle is greatly shortened. The dynamic network approach implemented in this paper responds to this concern, and provides a new framework to explore the OI process and its determinants at the industry level.
The rest of the research is organized as follows. First, we systematically reviewed the open innovation theory and related research and practice. Subsequently, this paper proposes a framework based on a cross-organizational knowledge diffusion network. Autonomous driving technology was selected as a case for the empirical verification of the proposed framework, and the results and potential impacts were discussed. In the final part, this article summarizes the main contributions and proposes future research directions.
2. Literature Review
Open innovation (OI) theory focuses on how external valuable information affects the innovation behavior of enterprises. OI means using purposive inflows and outflows of knowledge to accelerate internal innovation, and to expand the markets for external use of innovation. It is the opposite of closed innovation, which usually relies on the company’s own abilities in idea, R&D, production, and marketing [7,8].
Many scholars have affirmed the positive effects of OI on enterprises. Wit et al. [9] believe that the main motivator for enterprises to adopt an OI strategy is the low cost of external knowledge, and the knowledge complementary to one’s expertise which can bring the greatest benefit. Dahlander et al. [10] also recognized the positive effects of outside ideas. They said that openness is essential for modern enterprises, but an appropriate openness degree is more worth exploring, especially for large scale enterprises. Arvanitis et al. [11] found that the employees who have joined at least one R&D cooperation can significantly promote the productivity of the affiliated company, confirming the advantages of OI from organizational behavior.
Other studies have discussed factors that influence the innovation performance of OI activities. Robaczewska et al. [12] selected Janssen Pharmaceuticals as a case study to explore the OI cluster within regions. It was confirmed that geographic proximity improves the interaction between science, education, and business, thus strengthening the multi-dimensional OI system. In contrast, Chen et al. [13] emphasize heterogeneity as a key factor in improving open innovation. They found that OI strategies do not always have a positive effect on earnings, and complementary assets such as foreign capital and unfamiliar knowledge may be more useful to firms. According to a study from Belgian companies, Spithoven et al. [14] concluded that small and medium-sized enterprises can more effectively employ multiple OI strategies than large firms, with resource constraints being the main reason. Similarly, Lokshin et al. [15] also proved that the external R&D ratio is curvilinearly related to labor productivity because of the diseconomies of scale and marginal effects. Marco Greco et al. [16] drew a cognitive map (CM) that combined the literature and interviews. Absorptive capacity and organizational structure are summarized as the most critical parameters affecting the performance of the OI strategy. It was also confirmed that public subsidies are an important moderator variable.
The knowledge flow across organizations in the OI process has attracted more attention. It is the essence of open innovation, and even many experts believe that the concept of knowledge flow is in line with open innovation [17,18]. In detail, knowledge flow is divided into inbound processes that internalize external resources, and outbound processes that externalize internal results according to the flow direction [19,20]. Based on this consensus, Laine et al. [21] claim that the inbound process is supported by suppliers, universities, competitors, and consumers, which improves the innovation performance of firms due to the convergence between knowledge stock and knowledge increment. Bianchi et al. [22] believe that large companies increase the value of their intellectual property through outbound OI activities such as patent licensing and technical cooperation, while small and medium-sized enterprises act more as absorbers in inbound innovation processes. Some experts realize the advantages of dynamic models in analyzing knowledge flow. Sandulli et al. [23] argue that OI is a dynamic process, and the strength of openness varies widely across the stages of the technology life cycle. Zhang et al. [24] also agree that OI is a time-varying system, and the quadratic assignment procedure was adopted to observe dynamic knowledge diffusion.
Many scholars have researched open innovation from different perspectives, and a new trend that emphasizes the knowledge flow of the organization is emerging. Previous studies in this field are still lacking in analyzing large-scale knowledge flows and their evolution at the industry level. In this paper, a knowledge flow network based on patent citation data is adopted to describe the overall knowledge flow rather than focusing on an individual. This is especially important in the field of emerging technologies, as behind the intricate technological flow there are disruptive innovations and upheavals in competition.
3. Methodology and Data
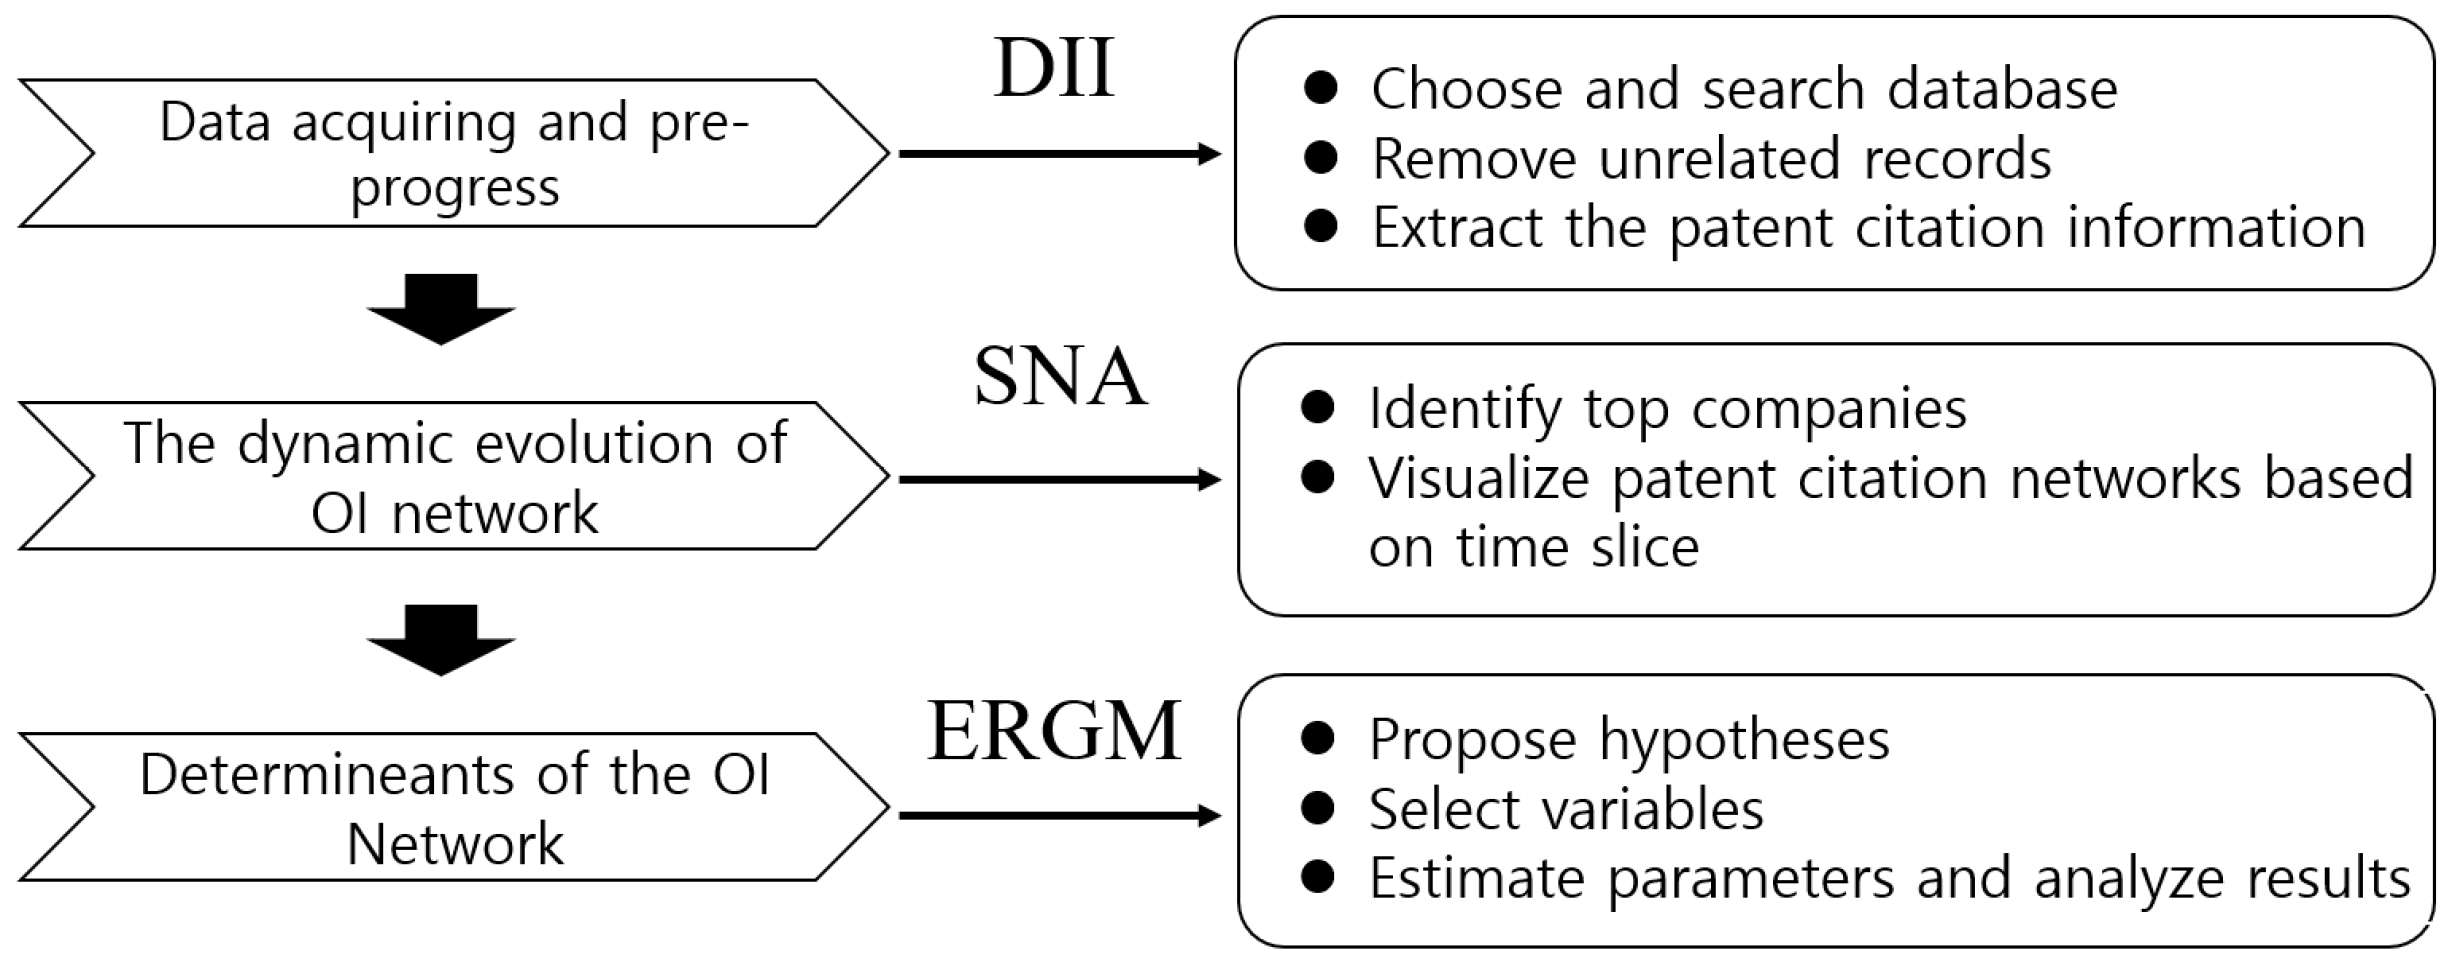
In this article, open innovation is divided into inbound innovation and outbound innovation. According to Chesbrough et al., inbound innovation is an innovation process that introduces technology and experience from other fields and companies without relying on its own R&D. It is a knowledge flow from the outside to the inside of the organization. Outbound innovation indicates that a diffusion process enterprise promotes its technology and even its standards, which represents an opposite direction of knowledge flow compared with inbound innovation. The framework of this research is shown in Figure 1.
First, as shown in Figure 2, backward citations and forward citations of patents are used to quantify inbound innovation and outbound innovation in our empirical research. Patents are often regarded as an important indicator to reveal the enterprise’s R&D strategy, technological evolution, and knowledge spillovers between the main bodies of industry, university, and research [25,26]. A patent is the unity of exclusivity and publicity, which means that although the owner is allowed to enjoy the benefits of a certain innovation for a certain period of time, it also provides other researchers with opportunities to learn from it and produce further improvements, thereby benefiting the generation of positive externalities. In other words, the patent system embodies a balance between monopoly and open. Patent citations are the direct proxy of the relationship between patents. It has been proved that the cited patent contains the knowledge base which supports and promotes new inventions [27]. It is the embodiment of the behavior of enterprises to absorb external technology and use the intellectual property rights of others in the patent text. In summary, referring to previous studies, this article uses patent citations as an indicator to analyze the cross-organizational flow of knowledge in the process of open innovation. The data is used to observe the dynamic evolution of the open innovation network every three years. In this process, we use Gephi to plot the visual results of the social network and calculate the degree centrality and other indicators that describe the characteristics of the network. Then, an exponential random graph model (ERGM) based on the Markov chain Monte Carlo’s maximum likelihood estimation method was used to simulate the formation of an open network. Specifically, R software was used.
ERGM is a probabilistic statistical model used to explain whether the relationship in the network occurs. It is based on the following five assumptions: (1) Local emergence is an important feature of social networks; (2) Network relationships are not only self-organizing but also related to other exogenous factors such as the attributes of actors; (3) The patterns existing in the network can be seen as evidence to reflect a constructing network; (4) The network can include several simultaneous processes; (5) Social networks are structured and random. The specification of ERGM is shown in formula (1):
In which represents the network statistic corresponding configuration, θ is its corresponding parameter, and k is a normalizing constant. The estimation is based on the Markov Monte Carlo method. The estimation values are the log-values of the probability of a pattern appearing in the network. The standard error of each parameter represents confidence for the results. In other words, a smaller standard error means greater accuracy and certainty. It is generally believed that a parameter is significantly unequal to zero with at least 95% confidence when its absolute value exceeds twice the standard error. It also means that a certain factor is obviously different from a random network and thus affects the formation of the network [28].
Next, an ERGM is adopted to detect the determinants of the OI network. Ten parameters were chosen based on OI theory and previous work. Among them, six parameters related to the network structural effects were selected. Edge represents the tendency of connections between different nodes, so a sparse network usually has a significantly negative estimation value. Similarly, if Mutual has an estimated value greater than zero, there may be two-way communication between nodes so that the network will show reciprocity. These two variables are usually essential in an ERGM. Gwideg and Gwodeg are used to measure the in-degree effect and the out-degree effect. A significantly positive result of Gwideg indicates that some particularly popular nodes affect the structure of the network, and Gwodeg is similar. This pair of parameters can be used to observe whether nodes differ in position during network evolution. The impact of high-tech enterprises on the network can be further verified. Gwdsp and Gwesp are related to triangles in the network. If their estimated values are opposite in sign and the former is less than zero, it reflects that closed triangles are more frequent in some parts. These two variables are very important for analyzing the openness scale of the OI network. If they are not significant, other parameters related to structure effects should be searched for further analysis [29].
Nodematch.type and Nodematch.area are connected as a parameter to observe the homophily or heterophily of the OI network. Different types of enterprises are different in terms of relative technological advantage (RTA), and the knowledge flow from different types of enterprises is beneficial in promoting the development of the industry. Based on the previous results, we believe that there may be a high frequency of knowledge flow among different types of firms. Additionally, actors located in the same or adjacent countries may be more inclined towards linking due to cost savings and similar cultures. Nodematch.area plays a role to validate it from a network perspective [30]. In addition, other variables regarding actor–relation effects have been added. The names and illustration of each parameter are shown in detail in Table 1.
In this study, Driver Assistance System (DAS) is selected as the research sample. DAS is considered an important emerging technology and a necessary preparation for high-level autonomous driving, which is breaking the old path dependence [31]. Over the past few decades, car manufacturers have maintained their competitive advantage through huge R&D investment for a long period of time [32]. However, the storm of digitization and intellectualization in recent years has forced them to cope with the dual dilemmas caused by innovation and cost. On the other hand, ICT companies have joined the R&D of DAS with their expertise in automatic control systems, V2X software, and Internet infrastructure [33]. In this situation, the transition from the traditional linear value chain to the open innovation network is becoming a new trend. It is also regarded as a motivator for the automotive industry to leap over the bottleneck. In summary, DAS is a suitable example for our model in studying a dynamic OI process.
We collect US patent applications for DAS from the Derwent Innovation Index (DII) from 2007 to 2015. This is based on the following considerations: first, the US Patent and Trademark Office has disclosed more complete patent citation information, which provides great convenience for researchers. Secondly, a sound patent protection system and a huge market have increased the willingness of innovators to apply for patents in the United States, which has also made US patents the basis of the most effective patents. Therefore, the US patent is effective and representative in reflecting global innovation activities [34]. After referring to the relevant reports issued by the European Patent Office and the opinions of experts in the field, a patent search formula suitable for DII was determined and executed. Subsequently, incomplete records and abnormal values were deleted, and 21411 patent records were obtained. The annual number of patent applications is shown in Figure 3.
It is worth noting that although the number of patentees to which these patents belong is huge, the number of patents from top 50 patentees accounted for 67%, and the total number of patents for each of them was more than 50. Details about these major patent assignees are presented in Table 2. They are the most prominent in the number of patent applications, including 14 car manufacturers, 18 car suppliers, and 18 high-tech companies in electronic communications and the Internet. As for regions, they can be divided into East Asia (China, Japan, and South Korea), the European Union, and the United States. Therefore, these patentees are further selected as research objects in this research.
In addition, it should be noted that the direct use of cited data as knowledge transfer between organizations has proved to be unreasonable in bibliometrics. To optimize the model, random citations and the intensity of citations should be considered to exclude the author’s unconscious unawareness. In this article, the threshold is determined to be 20, considering the average connection strength of the network and the experience from other scholars. In addition, self-citations are excluded because they do not reflect the flow of knowledge across organizations.
4. Results and Discussion
In order to observe the dynamic evolution of OI networks in the DAS, patent citation networks among patentees based on time slicing are shown in Table 3. The growth of emerging technologies is consistent with the increasing complexity of OI networks. It can be seen that the cross-organizational knowledge flow has been increasing during these three periods. The number of directed edges in the third period is 545, which is 1.8 times that of the first period, and the average weighting degree is also rising steadily. The clustering coefficient reflects that the network structure is changing from chaotic to compact, but still showing low network connectivity. In addition, some automakers such as Toyota Motor Corporation (TOYT-C) are centrally located in the OI network compared to the other two types of companies. Some stable triangular knowledge flows were formed in the past between car companies. However, the position of developing high-tech companies has become more and more important, and an OI network involving multiple types of participation has been initially formed, and the position of car companies has been weakened.
The results of the ERGM model are shown in Table 4. Compared with the null model that only considers edges and the differentiation homogeneity model that adds node attributes, the final model which converges the influence of several basic structures and actor attributes has a smaller Akaike Information Criterion value (AIC) and Bayesian Information Criterion (BIC) value, revealing the good fit of the model. In addition, a series of sample networks based on the GOF test method is generated. Compared with the model in this study, all parameter differences are less than two, which also supports the model.
Firstly, the OI network of DAS is still partially open and at a low level, with a typical sparse effect. The value of Edges less than zero indicates that the network density is less than 50%. Meanwhile, Gwideg and Gwodeg are also significantly negative. Most of the nodes in the network are similar in activity closure and activity spread. At present, the in-degree and out-degree of the actors determine that the network does not tend to form a central tendency. From the theory of technology life cycle, DAS technology is still in the development stage. At this stage, R&D activities grow rapidly, which leads to a large number of patent applications. Meanwhile, various exploratory experiments are still ongoing because the mainstream technology route is unclear. The knowledge system is transforming from unstructured to structured until the technology maturity stage. Considering the previous findings from OI network evolution, this result suggests that Toyota, Bosch, Honda, etc. are not the actors that dominate the OI network, although they have high out-degree and in-degree values at the beginning. The rise of high-tech companies has greatly diluted the advantages of these former leaders. We can infer that the position of each participant has a high degree of uncertainty in the future, and external knowledge is essential for repositioning and self-renewal. These results echo and further confirm the evolution trend of the network structure.
Secondly, Mutual, Gwdsp, and Gwesp reveal the path-dependent characteristics of knowledge diffusion in OI networks. Reciprocity is common in many node pairs. The negative Gwdsp value and the positive Gwesp value show that the cross-organizational knowledge flow has a greater probability of forming a closed triangle rather than an open triangle. There are not many actors acting as transfer stations for knowledge, and the characteristics of structural holes in the network are not prominent. Structural embeddedness significantly affects the OI network. When node i and node j are connected by a directed knowledge flow, and also between nodes j and k, there is a high probability that knowledge flow also occurs between i and k. However, indirect communication between i and k via j is rare.
Finally, the parameters of the actor’s attributes also provide some interesting findings. Companies including automakers, suppliers, and high-tech companies are more inclined to learn from other types of companies rather than the same. This remarkable heterogeneity in type shows that companies are eager to absorb knowledge with low similarity to their own. Geographic proximity also has a positive effect on the construction of the network. Knowledge searches based on close geographic distance are very common, especially in the United States. As for the scale of the enterprise, the greater number of employees seems to be negative for the OI of the enterprise. However, smaller businesses are more eager to communicate with the outside world. R&D investment is not a key factor in the formation of OI networks.
5. Conclusions
In this study, we reviewed the research methods of open innovation. Based on the shortcomings of existing research, an open innovation network analysis framework based on patent citation networks was proposed. The approach focuses on groups and their interrelationships rather than individual cases. It can not only analyze the self-organizing characteristics of the network at the industry level, but also add exogenous factors. Specifically, SNA was first used to analyze the flow of knowledge among innovation subjects. According to the visualization results of SNA, the dynamic changes of the open innovation network are analyzed, and appropriate parameters are selected to build the ERGM model. Subsequently, the ERGM was used to analyze the formation mechanism of the OI network. We found that DAS is still in the development stage and the OI network is still partial and unstable. Taken overall, the OI network is still partial and unstable. However, there is a lot of evidence that high-tech companies may have a disruptive impact on the field. They greatly reduce the power of vehicle manufacturers to control knowledge flow, which will deeply affect the value chain. In the past, value chains presented a vertical structure or star network, which was dominated by one vehicle manufacturer, and multi-tiered suppliers participated. However, under the trend of digitalization, structural embeddedness has replaced the old framework and become an important factor driving the OI network. It is advantageous for increasing the speed of information exchange, leading to stable alliances based on complementary advantages. However, we should also see the negative effects of excessive structural embeddedness. An extreme case is the patent thicket, which is consistent with triangular structures in knowledge flow networks. It is detrimental to incremental innovation and becomes a difficulty that new entrants must face.
Furthermore, the knowledge flow that exists between different types of firms significantly facilitates the OI network. It also supports the view of Chen et al. that complementary assets are more conducive to OI strategies than homogenization [13]. At present, DAS is still far from the goal of autonomous driving, and some accidents have also affected consumer acceptance. More breakthrough inventions are expected to improve performance and increase market confidence. Therefore, it is foreseeable that, as an important source of breakthroughs, interdisciplinary technology integration will always be valued in the industry until the technology path is locked in.
Finally, we also found that both geographic proximity and fewer employees improved OI network formation, supporting some existing views from another perspective. In many emerging fields, the diffusion of knowledge is affected by distance attenuation, and geographic proximity is logical due to lower costs in communication and transactions. It is interesting that spatial distance still plays an important role in this age of network information. On the one hand, the high complexity caused by the technological explosion makes face-to-face communication still irreplaceable [12]. On the other hand, anxiety about de-globalization may dampen companies’ confidence in expanding OI networks [35,36]. With regard to firm size, the results of this paper confirm that small firms are more active in OI strategies, as they hope to rapidly increase their capabilities and quickly bridge funding gaps by marketing their technologies, while the flexible organizational structure within them also indirectly promotes the above behavior [37].
We recognize that our research is an exploratory experiment. We hope that more attention will be given to the relationship between social networks and open innovation, and that research will continue to deeply explore the OI model and the influencing factors behind it. As for ERGM, there are still fewer parameters to choose from, which limits the spread of the method.
Author Contributions
Conceptualization, Y.J. and X.Y.; methodology, Y.J.; software, M.S.; validation, Y.J., M.S. and B.Z.; formal analysis, Y.J. and B.Z.; writing—original draft preparation, Y.J. and B.Z.; writing—review and editing, Y.J.; visualization, M.S.; supervision, B.Z. All authors have read and agreed to the published version of the manuscript.
Funding
This research was funded by the National Natural Science Foundation of China (grant number 71974096).
Institutional Review Board Statement
Not applicable.
Informed Consent Statement
Not applicable.
Data Availability Statement
Not applicable.
Conflicts of Interest
The authors declare no conflict of interest.
References
- Kodama, F. Learning Mode and Strategic Concept for the 4th Industrial Revolution. J. Open Innov. Technol. Mark. Complex. 2018, 4, 32. [Google Scholar] [CrossRef] [Green Version]
- Liu, Z.; Stephens, V. Exploring Innovation Ecosystem from the Perspective of Sustainability: Towards a Conceptual Framework. J. Open Innov. Technol. Mark. Complex. 2019, 5, 48. [Google Scholar] [CrossRef] [Green Version]
- Taghizadeh, S.K.; Nikbin, D.; Alam, M.M.D.; Rahman, S.A.; Nadarajah, G. Technological capabilities, open innovation and perceived operational performance in SMEs: The moderating role of environmental dynamism. J. Knowl. Manag. 2020, 25, 1486–1507. [Google Scholar] [CrossRef]
- Aitamurto, T.; Lewis, S. Open innovation in digital journalism: Examining the impact of Open APIs at four news organizations. New Media Soc. 2013, 15, 314–331. [Google Scholar] [CrossRef] [Green Version]
- Bellantuono, N.; Pontrandolfo, P.; Scozzi, B. Measuring the Openness of Innovation. Sustainability 2021, 13, 2205. [Google Scholar] [CrossRef]
- Lee, S.; Park, G.; Yoon, B.; Park, J. Open innovation in SMEs—An intermediated network model. Res. Policy 2010, 39, 290–300. [Google Scholar] [CrossRef]
- Chesbrough, H.W.; Vanhaverbeke, W.; West, J.; Ebrary, I. Open Innovation: Researching a New Paradigm; Oxford University Press: Oxford, UK, 2006; Volume 84, p. 1259. [Google Scholar]
- Hemphill, T.A. Open Innovation: The New Imperative for Creating and Profiting from Technology by Henry Chesbrough. Acad. Manag. Perspect. 2006, 20, 86–88. [Google Scholar]
- Wit, J.D.; Dankbaar, B.; Vissers, G. Open Innovation: The New Way of Knowledge Transfer? J. Bus. Chem. 2007, 4, 11–19. [Google Scholar]
- Dahlander, L.; Gann, D.M. How open is innovation? Res. Policy 2010, 39, 699–709. [Google Scholar] [CrossRef]
- Arvanitis, S. How do different motives for R&D cooperation affect firm performance?—An analysis based on Swiss micro data. J. Evol. Econ. 2012, 22, 981–1007. [Google Scholar] [CrossRef] [Green Version]
- Robaczewska, J.; Vanhaverbeke, W.; Lorenz, A. Applying open innovation strategies in the context of a regional innovation ecosystem: The case of Janssen Pharmaceuticals. Glob. Transit. 2019, 1, 120–131. [Google Scholar] [CrossRef]
- Chen, J.; Chen, Y.; Vanhaverbeke, W. The influence of scope, depth, and orientation of external technology sources on the innovative performance of Chinese firms. Technovation 2011, 31, 362–373. [Google Scholar] [CrossRef] [Green Version]
- Spithoven, A.; Vanhaverbeke, W.; Roijakkers, N. Open innovation practices in SMEs and large enterprises. Small Bus. Econ. 2013, 41, 537–562. [Google Scholar] [CrossRef]
- Lokshin, B.; Belderbos, R.; Carree, M. The Productivity Effects of Internal and External R&D: Evidence from a Dynamic Panel Data Model. Oxf. Bull. Econ. Stat. 2008, 70, 399–413. [Google Scholar] [CrossRef] [Green Version]
- Greco, M.; Grimaldi, M.; Locatelli, G.; Serafini, M. How does open innovation enhance productivity? An exploration in the construction ecosystem. Technol. Forecast. Soc. 2021, 168, 120740. [Google Scholar] [CrossRef]
- Užienė, L. Open Innovation, Knowledge Flows and Intellectual Capital. Procedia-Soc. Behav. Sci. 2015, 213, 1057–1062. [Google Scholar] [CrossRef] [Green Version]
- Kim, S.; Kim, H.; Kim, E. How knowledge flow affects Korean ICT manufacturing firm performance: A focus on open innovation strategy. Technol. Anal. Strateg. Manag. 2016, 28, 1167–1181. [Google Scholar] [CrossRef]
- Lichtenthaler, U. Integrated Roadmaps for Open Innovation: Roadmapping Needs to Be Fully Integrated into a Firm’s Strategic Planning and Business Operations. Res. Technol. Manag. 2008, 51, 45–49. [Google Scholar] [CrossRef]
- Chesbrough, H.; Crowther, A.K. Beyond high tech: Early adopters of open innovation in other industries. R&D Manag. 2006, 36, 229–236. [Google Scholar] [CrossRef]
- Laine, O.J.M.; Laine, V.O.A. Open Innovation, Intellectual Capital and Different Knowledge Sources. In Proceedings of the European Conference on Intellectual Capital, Helsinki, Finland, 23–24 April 2012. [Google Scholar]
- Bianchi, M.; Cavaliere, A.; Chiaroni, D.; Frattini, F.; Chiesa, V. Organisational modes for Open Innovation in the bio-pharmaceutical industry: An exploratory analysis. Technovation 2011, 31, 22–33. [Google Scholar] [CrossRef]
- Sandulli, F.D.; Fernandez Menendez, J.; Rodriguez Duarte, A.; Lopez Sanchez, J.I. Testing the Schumpeterian hypotheses on an open innovation framework. Manag. Decis. 2012, 50, 1222–1232. [Google Scholar] [CrossRef]
- Zhang, B.; Wang, H. Network Proximity Evolution of Open Innovation Diffusion: A Case of Artificial Intelligence for Healthcare. J. Open Innov. Technol. Mark. Complex. 2021, 7, 222. [Google Scholar] [CrossRef]
- Souili, A.; Cavallucci, D.; Rousselot, F. A lexico-syntactic Pattern Matching Method to Extract Idm-Triz Knowledge from On-line Patent Databases. Procedia Eng. 2015, 131, 418–425. [Google Scholar] [CrossRef] [Green Version]
- Shi, X.; Lu, L.; Zhang, W.; Zhang, Q. Managing open innovation from a knowledge flow perspective: The roles of embeddedness and network inertia in collaboration networks. Eur. J. Innov. Manag. 2020, 24, 1011–1034. [Google Scholar] [CrossRef]
- Suh, Y.; Jeon, J. Monitoring patterns of open innovation using the patent-based brokerage analysis. Technol. Forecast. Soc. 2019, 146, 595–605. [Google Scholar] [CrossRef]
- Brashears, M.E. Exponential Random Graph Models for Social Networks: Theory, Methods and Applications. Contemp. Sociol. 2014, 43, 552–553. [Google Scholar] [CrossRef]
- Harris, J.K. An Introduction to Exponential Random Graph Modeling; SAGE Publications: Thousand Oaks, CA, USA, 2013. [Google Scholar]
- De Prato, G.; Nepelski, D. Global technological collaboration network: Network analysis of international co-inventions. J. Technol. Transf. 2012, 39, 358–375. [Google Scholar] [CrossRef] [Green Version]
- Park, Y.; Nakaoka, I.; Chen, Y. The R&D Strategy of Automobile Companies in Radical Innovation. J. Robot. Netw. Artif. Life 2020, 7, 184. [Google Scholar] [CrossRef]
- Bailey, D. Globalization and restructuring in the auto industry: The impact on the West Midlands automobile cluster. Strateg. Chang. 2007, 16, 137–144. [Google Scholar] [CrossRef]
- Ji, Y.; Zhu, X.; Zhao, T.; Wu, L.; Sun, M. Revealing Technology Innovation, Competition and Cooperation of Self-Driving Vehicles From Patent Perspective. IEEE Access 2020, 8, 221191–221202. [Google Scholar] [CrossRef]
- Yamashita, N. Economic crisis and innovation capacity of Japan: Evidence from cross-country patent citations. Technovation 2021, 101, 102208. [Google Scholar] [CrossRef]
- Petricevic, O.; Teece, D.J. The structural reshaping of globalization: Implications for strategic sectors, profiting from innovation, and the multinational enterprise. J. Int. Bus. Stud. 2019, 50, 1487–1512. [Google Scholar] [CrossRef] [Green Version]
- Luo, Y. New OLI advantages in digital globalization. Int. Bus. Rev. 2021, 30, 101797. [Google Scholar] [CrossRef]
- Baierle, I.C.; Benitez, G.B.; Nara, E.O.B.; Schaefer, J.L.; Sellitto, M.A. Influence of Open Innovation Variables on the Competitive Edge of Small and Medium Enterprises. J. Open Innov. Technol. Mark. Complex. 2020, 6, 179. [Google Scholar] [CrossRef]
Figure 1.
The analysis framework of this study.

Figure 2.
The relationship between open innovation and patent citations.

Figure 3.
Patent applications for DAS in the USPTO (2007–2015).


Table 1.
ERGM parameters, annotations, and illustrations.
| Type of Parameter | Parameter | Annotation | Illustration |
|---|---|---|---|
| Structural effects | Edges | Probability of knowledge flow |  |
| Mutual | Two-way reciprocal relationship |  | |
| Gwideg | Convergence and expansion of the network |  | |
| Gwodeg | Convergence and expansion of the network |  | |
| Gwdsp | Closed triangle or open triangle |  | |
| Gwesp | Closed triangle or open triangle |  | |
| Homophily/Heterophily | Nodematch.type | Knowledge flow between different types of enterprises |  |
| Nodematch.area | Geographical proximity |  | |
| Actor–relation effects | Nodeocov.RD | Annual R&D investment |  |
| Nodeocov.employee | Enterprise size |  |
Table 2.
Major patent assignees in the DAS field (only top 10).
| Assignee | Number of Patents | Country Origin | Type |
|---|---|---|---|
| TOYT-C | 1755 | Japan | Car Manufacturer |
| FORD-C | 1108 | the U.S. | Car Manufacturer |
| NPDE-C | 1108 | Japan | Supplier |
| BOSC-C | 1066 | Germany | Supplier |
| GENK-C | 953 | The U.S. | Car Manufacturer |
| HOND-C | 731 | Japan | Car Manufacturer |
| HYMR-C | 670 | Korea | Car Manufacturer |
| GOOG-C | 595 | the U.S. | High-tech company |
| NSMO-C | 524 | Japan | Car Manufacturer |
| MATU-C | 323 | Japan | High-tech company |
Table 3.
The dynamic evolution of OI networks in the DAS field.
| Period | Period 1 (2007–2009) | Period 2 (2010–2012) | Period 3 (2013–2015) |
|---|---|---|---|
| Network Structure |  |  |  |
| Nodes | 48 | 49 | 50 |
| Edges | 299 | 418 | 545 |
| Average weighted degree | 809.4 | 1097.7 | 1332.2 |
| Clustering coefficient | 0.476 | 0.548 | 0.563 |
Table 4.
ERGM Results of the OI network.
| Parameter | Estimation | Standard Error 1 |
|---|---|---|
| Edges | −2.192 | 2.263 × 10⁻³ *** |
| Mutual | 1.879 | 6.510 × 10⁻³ *** |
| Gwideg | −1.803 | 2.740 × 10⁻⁴ *** |
| Gwodeg | −6.909 × 10⁻¹ | 1.377 × 10⁻³ *** |
| Gwdsp | −2.122 × 10⁻¹ | 6.308 × 10⁻³ *** |
| Gwesp | 6.326 × 10⁻¹ | 2.586 × 10⁻³ *** |
| Nodematch.type | 2.727 × 10⁻¹ | 5.824 × 10⁻³ *** |
| Nodematch.area1 2 | 7.029 × 10⁻¹ | 7.195 × 10⁻³ *** |
| Nodematch.area2 | 9.832 × 10⁻¹ | 1.453 × 10⁻² *** |
| Nodematch.area3 | 2.421 × 10⁻¹ | 1.007 × 10⁻² *** |
| Nodeocov.RD | −3.997 × 10⁻⁶ | 2.980 × 10⁻⁶ |
| Nodeocov.employee | −9.807 × 10⁻⁵ | 5.899 × 10⁻⁵ * |
| Akaike Inf. Crit. | 2333 | |
| Bayesian Inf. Crit. | 2402 |
1 * p < 0.05, *** p < 0.001. 2 area1 represents East Asia, area2 represents the U.S., and area3 represents the EU.
Publisher’s Note: MDPI stays neutral with regard to jurisdictional claims in published maps and institutional affiliations. |
© 2022 by the authors. Licensee MDPI, Basel, Switzerland. This article is an open access article distributed under the terms and conditions of the Creative Commons Attribution (CC BY) license (https://creativecommons.org/licenses/by/4.0/).
Share and Cite
MDPI and ACS Style
Ji, Y.; Yu, X.; Sun, M.; Zhang, B. Exploring the Evolution and Determinants of Open Innovation: A Perspective from Patent Citations. Sustainability 2022, 14, 1618. https://0-doi-org.brum.beds.ac.uk/10.3390/su14031618
AMA Style
Ji Y, Yu X, Sun M, Zhang B. Exploring the Evolution and Determinants of Open Innovation: A Perspective from Patent Citations. Sustainability. 2022; 14(3):1618. https://0-doi-org.brum.beds.ac.uk/10.3390/su14031618
Chicago/Turabian StyleJi, Yakun, Xiang Yu, Minghan Sun, and Ben Zhang. 2022. "Exploring the Evolution and Determinants of Open Innovation: A Perspective from Patent Citations" Sustainability 14, no. 3: 1618. https://0-doi-org.brum.beds.ac.uk/10.3390/su14031618
Note that from the first issue of 2016, this journal uses article numbers instead of page numbers. See further details here.