
Exploring Differentiated Conservation Priorities of Urban Green Space Based on Tradeoffs of Ecological Functions


1
School of Resources and Environmental Sciences, Wuhan University, Wuhan 430079, China
2
Key Laboratory of Digital Mapping and Application of Land Information Engineering, Ministry of Natural Resources, Wuhan 430079, China
*
Author to whom correspondence should be addressed.
Sustainability 2022, 14(3), 1845; https://0-doi-org.brum.beds.ac.uk/10.3390/su14031845
Submission received: 17 January 2022
/
Revised: 1 February 2022
/
Accepted: 3 February 2022
/
Published: 5 February 2022
(This article belongs to the Special Issue Advances in Sustainable Utilization and Optimal Decision of Land Resources)
Abstract
:Urban green space (UGS) can simultaneously provide social and ecological benefits for humans. Although numerous studies have evaluated the multifunctional benefits of urban green space, few of them have determined the differentiated conservation priorities of UGS towards the tradeoff relationship of multiple UGS functions. Here, we proposed an integrated framework to explore the targeted conservation strategies of UGS patches. Specifically, the circuit theory model and gravity floating catchment area method were adopted to evaluate ecological connectivity and spatial accessibility of UGS under multiple scenarios in terms of different species dispersal distances and resident travelling modes, and Pareto ranking analysis was utilized to identify conservation priorities of UGS. Wuhan City in central China was taken as a case study. The results show that Wuhan exhibits low synergic relationship of ecological connectivity and spatial accessibility of UGS, and only approximately 7.51% of UGS patches on average rank high. Based on the frequency of UGS Pareto ranks under different scenarios, the differentiated conservation strategy was developed, which identified 10 key green areas that need to be protected and 11 green areas that need to be restored. This work is expected to provide an applicable framework to identify key UGS patches and assist in urban planning and layout optimization of multifunctional UGS in Wuhan, China.
1. Introduction
Urban green spaces (UGS) are a key component of urban ecosystems that can simultaneously provide ecological and social benefits [1,2]. With the acceleration of the urbanization process, however, urban green spaces are increasingly encroached upon, and the urban ecological quality has shown a significant downward trend [3,4]. At the same time, people’s vision of pursuing a better life is increasing, and urban green spaces are needed to provide better services to meet the leisure and cultural needs of residents. In this context, how to make comprehensive use of the scarce UGS resources to realize their maximum social and ecological benefits has become a challenging issue and also a key agenda in promoting harmonious human–nature relationships.
As the scarce natural resource within cities, urban green space has significant versatility [5], e.g., a range of regulation, supporting, and cultural services such as water cycle supporting, climate regulation, air purification, and recreation [6,7]. According to existing studies, improving versatility of urban green spaces can effectively coordinate the conflict between urban development and ecological protection and then enhance resilience and sustainability of urban ecosystems [8,9,10]. Various functions of urban green space are closely related to different land use stakeholders, and the differences in the interests of different stakeholders will cause tradeoffs of multiple UGS functions. In traditional urban planning, the decision processes of different government departments in terms of planning and management of different UGS functions are usually separated, and the interrelationship between the multi-functions of urban green spaces is rarely considered. Thus, how to improve the multi-functionality of urban green spaces is still one of great challenges of urban planning. To face this challenge, many scholars have explored the trade-off/synergy between urban green spaces [11] and hope to coordinate multiple UGS functions to determine its conservation priorities to maximize the potential ecosystem services of urban green spaces [6,12]. Existing research mostly adopted a multi-criteria evaluation method to conduct a comprehensive assessment of the versatility of urban green space or utilized spatial overlay analysis to reveal conflicts between multiple functions of green space [9,10]. However, the weighted aggregation of multiple criteria is subject to weighting uncertainty, while ignoring the tradeoff relationship between multi-functionalities of green space. It is urgent to address the multi-functionality evaluation issue from the perspective of UGS function tradeoffs.
Among various social and ecological benefits of urban green space, biodiversity conservation and recreation provision are two essential functions of urban green space, which have attracted increasing attention in spatial allocation of urban green space [13,14]. Complex tradeoffs and synergies exist between two UGS functions. For example, biodiversity conservation of UGS may significantly improve the recreation experience and health well-being of urban residents [15] while resident recreation behavior will impose a certain disturbance on the protection of urban green habitats [16]. In this context, accurately identifying the tradeoffs and synergies of two functions of urban green spaces can provide a scientific basis for formulating multi-functional protection strategies for urban green spaces. In order to effectively measure the functional benefits of urban green space, a large number of studies have selected ecological connectivity and spatial accessibility to characterize the level of biodiversity conservation and the level of recreation service of UGS. Specifically, scholars chose the ecological connectivity index to represent the impact of landscape on species movement among landscape patches and the influence of landscape fragmentation on biodiversity [3,17,18]. The measurement methods of ecological connectivity mainly include empirical studies on the diffusion behaviors of species, the least cumulative resistance model based on graph theory, and the connectivity model based on circuit theory [19,20], among which the circuit theory model was able to identify multiple alternative dispersal pathways for species to migrate between landscape patches [21,22]. On the other hand, spatial accessibility is an effective indicator that reflects the ability of urban green space to provide recreation service to residents [23]. Spatial accessibility analysis of urban green space will help to identify the differences in recreation service of green space, and optimizes the spatial layout of green space to meet the needs of different types of social groups, thereby improving the overall social benefit of green space [24,25]. Current spatial accessibility analysis approaches mainly comprise spatial buffering analysis, minimum proximity distance analysis, and the floating catchment area method, of which the floating catchment area method was proven to be more practical due to its integration with the urban road network and the gravity model of spatial interaction [26]. Although the existing studies provide solid support for quantitative analysis of ecological and social benefits of urban green space, the differentiated conservation priorities related to the socio-ecological interactions of UGS still require further exploration, especially the impact of different travelling modes and species dispersal distances on the tradeoff relationship of two UGS functions were rarely taken into account.
The purpose of this work is to coordinate the ecological connectivity and the spatial accessibility of UGS from the functional tradeoff aspect, and to take Wuhan City in central China as a case study to identify the conservation priorities of UGS. To achieve the win-win goal of maximizing the level of biodiversity maintenance and the level of recreation services of urban green space, the Pareto ranking method is adopted to analyze the tradeoff relationship between ecological connectivity and spatial accessibility of urban green spaces in the main urban area of Wuhan under the scenarios of different travel modes and species dispersal distances. The key conservation and restoration UGS patches will be identified to provide practical basis for urban planning and the optimal adjustment of green space of Wuhan City.
2. Study Area and Data Sources
2.1. Study Area
The main urban area of Wuhan City is selected as the study area, with the total area of 678 km2 (Figure 1). Although the green area in the entire city reached 209 km2, with a coverage rate of 39.55%, it only occupies 4% in the study area due to high land use intensity. The green space ratio of the study area is significantly lower than its required standard as regulated by the urban planning policy in China (i.e., 30%, which will evidently contribute to the sustainable development of the urban ecosystem). The mixed forest composed of evergreen broad-leaved forest and deciduous broad-leaved forest is a typical vegetation type in the city, and the main tree species include camphor, masson pine, and fir. As the inventory of urban green space reported, there are more than 400 bird species in the study area and the brown-headed crow finches, white-headed bulbuls, and gray magpies dominate.
However, the green space has become increasingly fragmented under the influence of urban expansion, which seriously affects the equitable access of urban residents to green space resources [14,27]. The decline of urban green space will also exert a negative impact on ecological connectivity of urban ecosystems and then cause the loss of urban biodiversity [3]. It is of great importance to identify key UGS patches that play an ecological and social role in urban planning.
2.2. Data and Processing
We collected the urban green space data based on the 2018 POI data from Baidu Map and the Open Street Map (http://download.geofabrik.de/ (accessed on 5 May 2021)), and a total of 150 UGS patches were extracted, which were mainly divided into three types: park green space, road auxiliary green space, and other auxiliary green space attached to urban construction land such as residential areas, commercial service facilities, and utility land. To identify the tradeoff between biodiversity conservation and resident welfare services, we utilized the following criteria to identify green spaces: (1) From the perspective of ecological connectivity, we determined 3 ha as the area threshold for species habitat due to the minimum conditions of typical urban species for habitat selection [17,28]; (2) From the perspective of daily travel accessibility of urban residents, green spaces for non-daily leisure use (e.g., UGS patches along streets) were excluded from candidate green spaces. Then, 71 urban green spaces with an area of more than 3 ha and accessible to residents for their daily leisure were selected as research subjects, which include 45 park green spaces and 26 auxiliary green spaces such as universities and squares, with a total area of 2735.29 ha.
Moreover, land use data, population distribution data, and road networks were also included in this study. The land use map in 2018 was obtained from the Resources and Environmental Science Data Center of the Chinese Academy of Sciences (http://www.resdc.cn (accessed on 8 March 2021)); the population data at the community level were obtained from the sixth census of Wuhan City; the road networks were downloaded from the Open Street Map (http://download.geofabrik.de/ (accessed on 6 May 2021)), and roads suitable for walking and cycling were extracted for network analysis.
3. Methodology
3.1. Analysis of UGS Ecological Connectivity Based on Circuit Theory
Urban green spaces are key habitat patches for urban species (birds, arthropods, etc.), which provide habitats and food sources for species survival [17]. Exploring the ecological connectivity between urban green spaces can provide scientific support for urban biodiversity protection. Circuit theory, a fundamental concept in physics that was first applied to landscape ecology by McRae, can adopt the random travel of electrons in circuits to simulate the migration or dispersal of species, genes, or populations in complex landscapes [29]. An ecological connectivity model based on circuit theory treats species populations or gene streams as electrons, habitat patches as nodes, and conductivities as landscape resistance surfaces, and characterizes the probability of dispersal of species in landscape as the current density generated by electron travel [21].
In this article, the circuit theory model considers UGS patches as the source nodes of species and uses the average current density of the patches to quantitatively evaluate the level of ecological connectivity of green patches. Considering that the dispersal capabilities of species are mainly affected by their own size, different area thresholds of the source nodes, i.e., 1 ha, 3 ha, and 5 ha, were selected to simulate the dispersal behaviors of different species in the study area. In the construction of landscape conductive surfaces, we used habitat quality to represent the ecological resistance to species dispersal.
The habitat quality was calculated using the InVEST model and the corresponding parameters were set as shown in Table 1 and Table 2 [30], the specific calculation follows Equations (1)–(3). The Circuitscape 4.0 software was used to simulate species dispersal between green patches, and the cumulative and average current density through each UGS node was then calculated iteratively.
where, Dxj is the habitat degradation degree of grid x in land type j, and Qxj is the habitat quality; r is the threat source of the habitat, and y is the grid in the threat source r; ry, wr, and irxy are the human disturbance intensity, weight, and impact on the habitat of the grid where the threat source is located, respectively; βx and Sjr are the anti-disturbance ability of the habitat and its relative sensitivity to various threat sources; dxy is the distance between the habitat grid x and the threat source grid grid y, and drmax is the maximum influence range of the threat source r; Hj is the habitat suitability of land use type j; k is the half-saturation constant, k = 0.5; z is the default parameter, z = 2.5 in this study.
3.2. Spatial Accessibility Analysis of Green Space Based on Gravity-Based Floating Catchment Area Model
The potential population size within the service range of a certain urban green space represents its capability to satisfy the leisure demand of urban residents, and the UGS patches that have greater potential serving population will be easier to be accessed by people [31]. Compared with the traditional spatial accessibility analysis approach, the gravity based floating catchment area model incorporate the distance decay effect into the spatial accessibility of UGS patches as well as to indicate the spatially heterogeneity of human demand to UGS ecosystem services [26]. The calculation is as follows:
where, Rj is the spatial accessibility level of urban green space j; dkj is the minimum travel distance from community k to green space j; d0 is the longest distance a resident in a certain community travels to a green space; Pk is the weighted population size of community k within the service range of a UGS patch (dkj ≤ d0); G(dkj, d0) is a Gaussian equation that takes into account distance decay of UGS accessibility.
3.3. Identification of UGS Protection Priorities Based on Pareto Ranking Analysis
The ecological connectivity and spatial accessibility patches are key indicators of urban green space to provide biodiversity conservation and cultural services, which usually exhibit tradeoff relationships with each other. Pareto ranking analysis was proposed to address multi-objective optimization issues. Compared with traditional linear weighted models, Pareto ranking approach can avoid the process of determining parameters such as weights and threshold values and can reach the optima of individual solutions that balance the conflicts of multiple objectives [32,33]. Therefore, we used Pareto ranking method to identify UGS patches that can maximize the comprehensive benefits of ecological connectivity and spatial accessibility in the context of scarcity of UGS resources.
According to the definition of Pareto ranking, the ecological connectivity level and spatial accessibility level of urban green space were taken as two maximum development targets of green space patches, and sequentially identify Pareto solution sets with different Pareto ranks. The ranking process is as follows:
where, k is the number of maximum development targets (k = 2 in this study), x is a certain UGS patch, x′ indicates any patch of green space except x. By definition, a solution with a lower Pareto rank will dominate a solution with a higher Pareto rank. In this work, UGS patches in the lower rank indicate that they can exert the comprehensive benefits of ecological connectivity and spatial accessibility, and conversely, the comprehensive benefits of green patches at high Pareto ranks are low.
4. Results and Analysis
4.1. Ecological Connectivity of Urban Green Spaces
Three ecological networks were constructed based on different area thresholds of UGS habitat patches, i.e., 1 ha, 3 ha, and 5 ha. Figure 2 presents current density in the three networks. As the area threshold of UGS habitat patches increases, the patch amount gradually decreases and will drop by 50% when the area threshold is 5 ha. Overall current density at regional scale will reach up to 189.14 when the minimum area threshold is fixed (1 ha), while it will decrease to 79.59 when UGS patches with an area greater than 5 ha are considered as ecological sources. The changes in current density through UGS patches demonstrate the significance of small-sized urban green space for species dispersal in urban center areas with high development intensity. As we can see in Figure 2, the distribution pattern of current density present similar under three ecological connectivity scenarios with different area thresholds of UGS patches. There are many remarkable species dispersal corridors in the outer areas of the study area such as Tingtao Scenic Area of the East Lake, the Moshan Mountain Scenic Area, the Ma’anshan Forest Park, especially the adjacent relationship of these areas will further facilitate species survival.
The average current density of park and attached green patches in three ecological networks was statistically analyzed (Table 3). In all three networks, the proportion of attached green space below the average of current density is greater than that of parks, indicating the superior connectivity level of parks over attached green patches. With the increase of area thresholds, the ecological connectivity level of individual patches in urban green space gradually decreases. Specifically, when the area threshold equals 1 ha, the ecological connectivity level of UGS patches is the best, and the average current density of patches reaches up to 162.52. When the threshold increases to 5 ha, the maximum value of the average current density decreases by more than 55%.
The average current density of patches under different ecological networks were divided into three levels using the natural breaking analysis. In comparison, the green spaces affiliated to Simeitang Park, Baodao Park, and Zhongnan University of Finance and Economics have always been at a relatively low level of ecological connectivity, while parks such as Hankou beach park, Hanyang beach park, and Tingtao Scenic Area of Donghu Lake, as well as affiliated green spaces such as Wuhan University, Huazhong Agricultural University, and Huazhong University of Science and Technology, have always been at a high level of ecological connectivity, among which Guishan Scenic Area, Yellow Crane Tower Park, and Luojia Mountain always ranked in the top three in terms of ecological connectivity. From the perspective of spatial distribution, the green space patches with a relatively high ecological connectivity level are mainly concentrated in the eastern part of the study area, e.g., Donghu Lake Scenic Area (Figure 3).
4.2. Spatial Accessibility of Urban Green Space
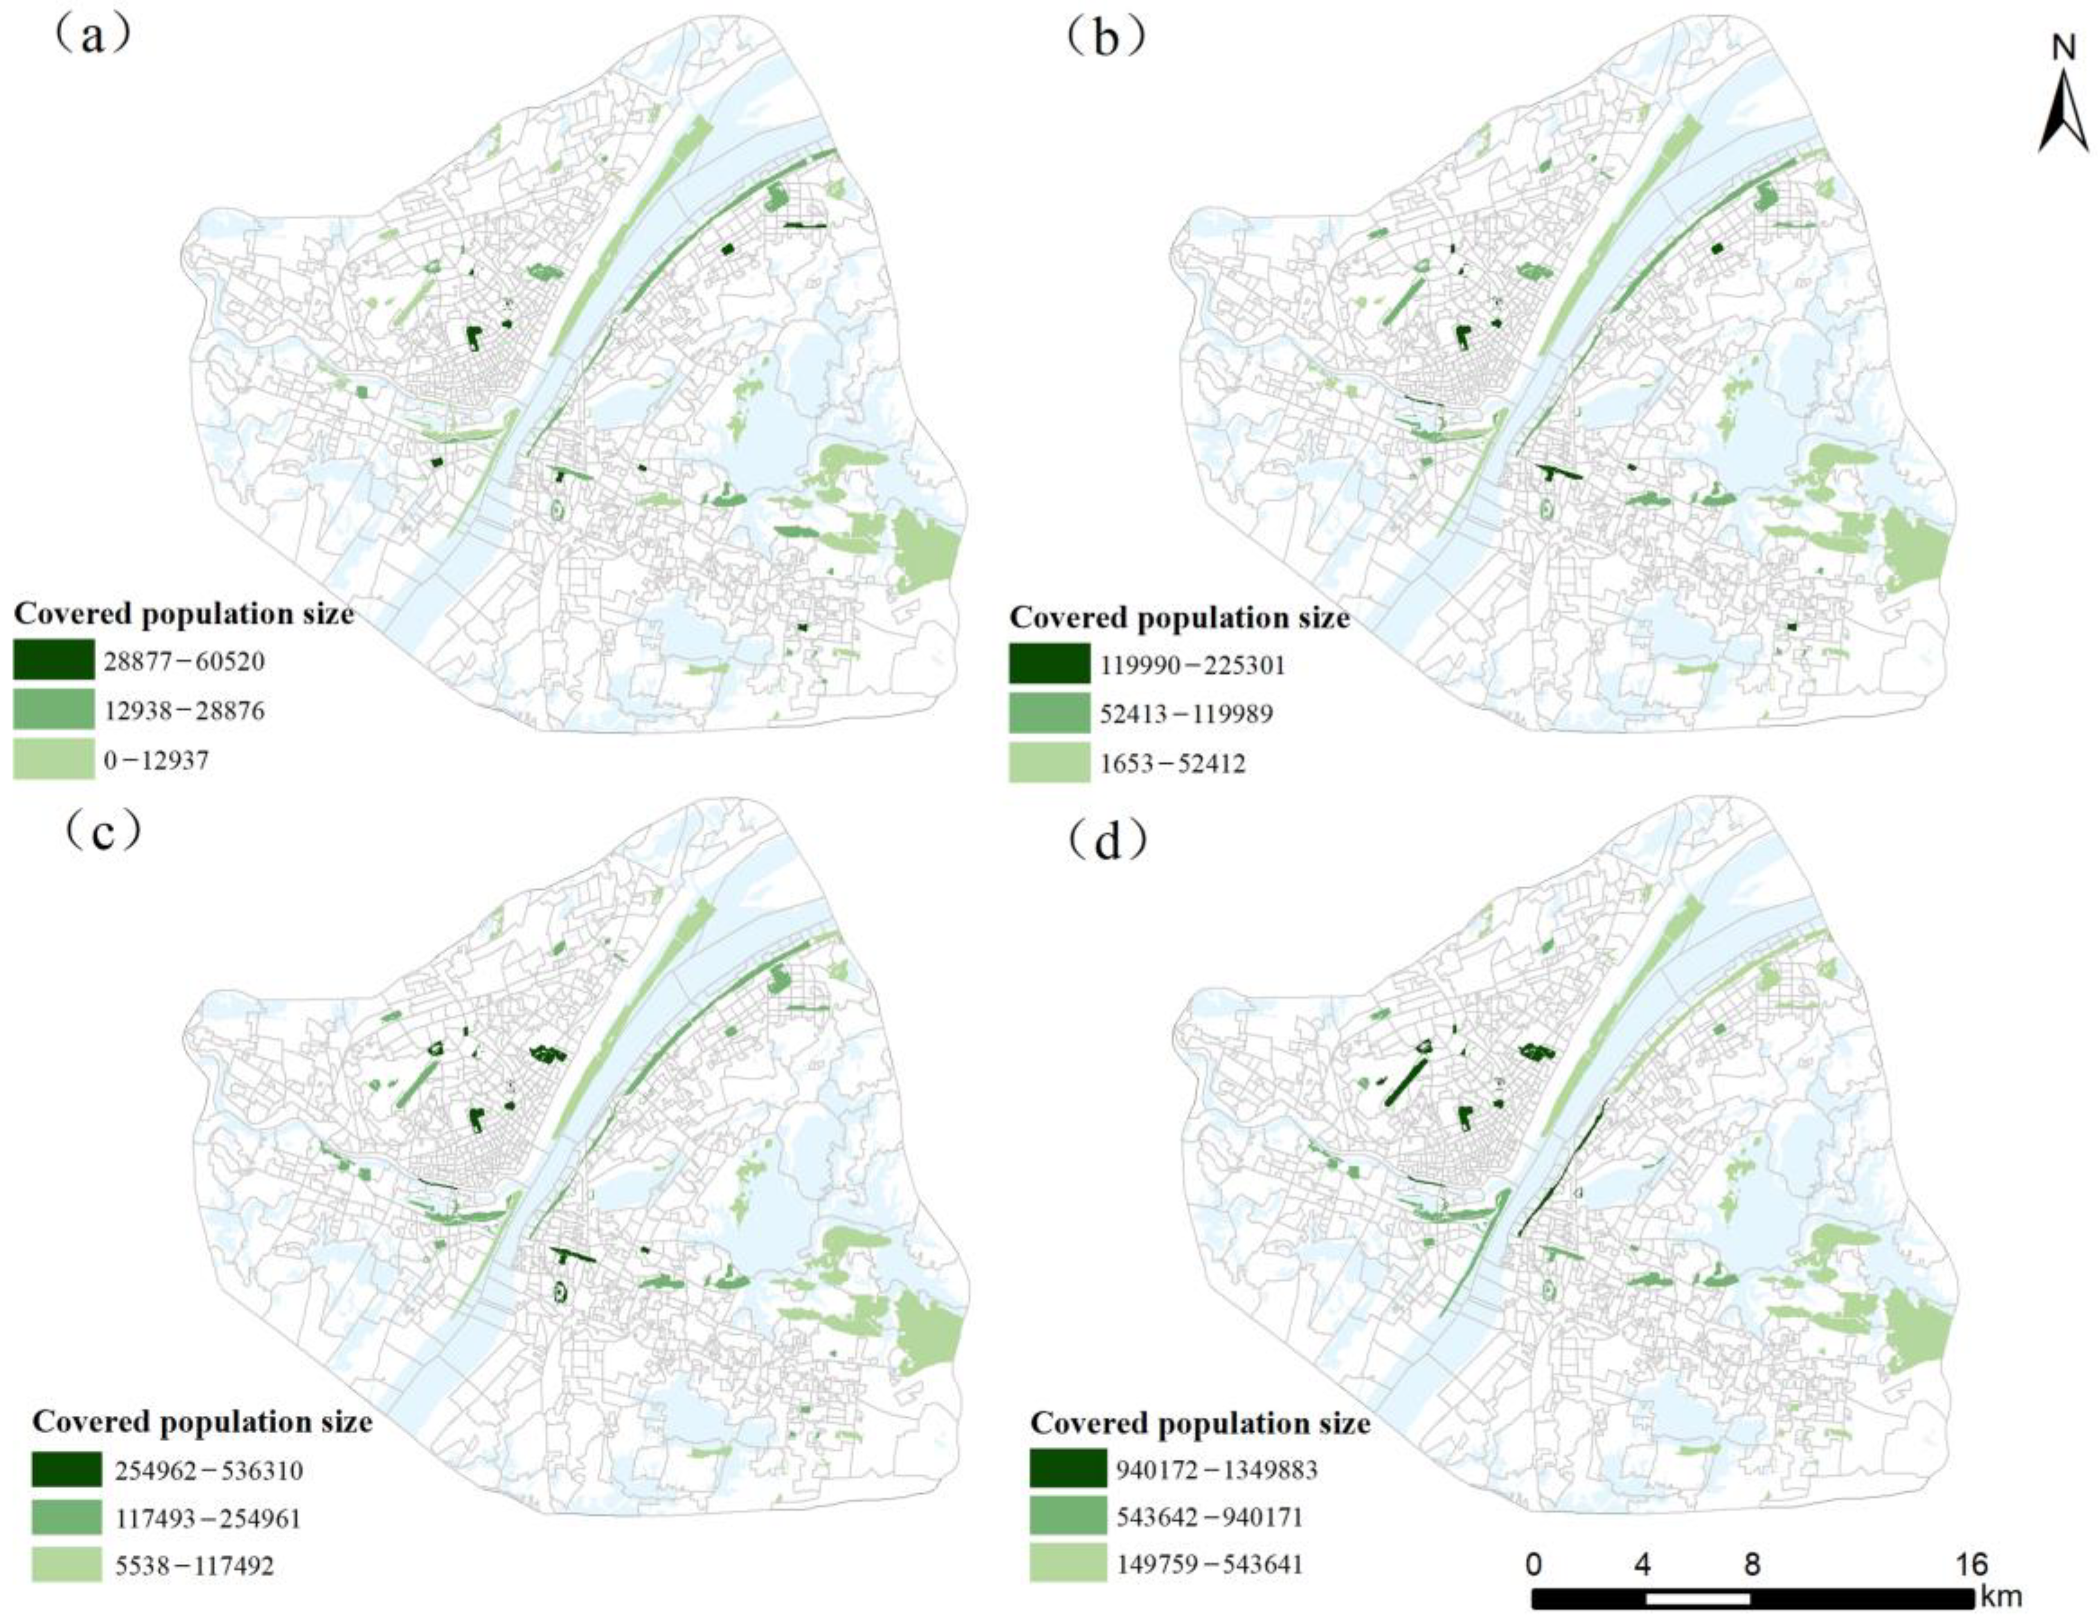
The spatial accessibility level of urban green space under four travelling scenarios is presented in Figure 4. In comparison, the accessible areas of urban green space will cover more than 80% of the study area within 30 min by bicycle, while within 15 min by walking, the accessible rate will be less than 20%. Comparing different types of green spaces, there is no doubt that the spatial accessibility of parks is always better than that of attached green spaces under different travelling scenarios, and the total size of the potential population served by parks is always twice as large as that of attached green spaces (Figure 4). However, from the perspective of the service capacity per unit area of green patches, the attached green spaces are likely to meet more leisure and recreation needs of residents, and with the increase of the service thresholds, this superiority of the attached green spaces will become more evident. It can be observed that the population size covered by per unit area of parks is only 50% of that of the attached green space under the scenario of 30 min by cycling.
For spatial distribution, under different travel modes, the spatial accessibility level of urban green spaces in the central and western parts of the study area is relatively high, while that of eastern green spaces exhibits relatively low (Figure 5). Among them, Zhongshan Park, Baodao Park and Lingjiaohu Park, and Wuhan Youth Palace always have high spatial accessibility under different travelling scenarios, while the river beach park in the center and the green space in the east periphery are relatively poorly accessible.
4.3. Key Conservation Patches
Based on the ecological connectivity of urban green patches under three area thresholds and the spatial accessibility of green space under four kinds of travelling modes, Pareto ranking analysis was used to compare the comprehensive benefit level of urban green patches in 12 potential combinations of different travelling modes and connectivity types.
Figure 6 shows the Pareto ranks of comprehensive benefits of UGS patches. When the area threshold is less than 3 ha, a significant convex Pareto boundary can be observed, which indicates the tradeoff between ecological and social functions of urban green space, for example, to facilitate species dispersal and resident recreation. When the area threshold is increased to 5 ha, the relative levels of ecological connectivity of the two types of green patches are remarkably different, resulting in the separate distribution of the scattered spots in Figure 6.
According to the Pareto ranking theory, urban green spaces at the first two ranks have higher comprehensive benefits of ecological connectivity and spatial accessibility, and vice versa. Overall, the comprehensive benefits of urban green space in the study area are relatively low, and only approximately 7.51% of green patches on average rank the first. The frequency of each UGS patch at different Pareto ranks in 12 combination scenarios was calculated; a total of 27 patches appears at Pareto level 1–2 at least once, and 28 patches rank at the last three levels at least once (Figure 7a). In space, the comprehensive benefit level of green spaces exhibits a pattern of “high in the center and the south, and low in the periphery and the north” (Figure 7a). Urban green spaces with high comprehensive benefits are mostly distributed in the central area, among which Guishan Scenic Area, Yellow Crane Tower Park, Shouyi Park, and Wuhan Youth Palace always rank the first. As for urban green space in the periphery of the study area, e.g., Zhongnan University of Finance and Economics, Chufeng Park, and Dijiao Park, their comprehensive benefits are relatively low, and the frequency of ranking at the last three levels exceeds 11 times. Compared with different types of green space, the comprehensive benefits of parks are higher than that of attached UGS, and nearly 38% of parks appears in the first two levels and less than 35% in the last three levels, but for attached green space, the proportion of low ranked patches exceeds 46%.
Urban green spaces with a frequency of more than six times at the first two levels are regarded as key protected patches due to their high comprehensive benefits of ecological connectivity and spatial accessibility, while UGS patches with a frequency of more than 50% in the last three levels are considered as restoration areas. In total, 10 green patches, including seven parks and three attached green spaces, need to be protected, and seven parks and four attached green spaces were identified as restoration patches (Table 4). The key protective patches are mainly concentrated in the middle of the study area, while the key restoration ones are mostly distributed in the periphery (Figure 7b).
5. Discussion
5.1. Strengths of Trade-Off Analysis of Urban Green Spaces
UGS multifunctionality has attracted increasing attention from urban planners. The coordination of different UGS functions may maximize their potential benefits in both social and ecological aspects [6,8,10]. However, the existing multifunctional assessment of UGSs based on weighted aggregation of UGS merits may largely ignore the coordinated relationships of multiple UGS functions [8,10]. This phenomenon is mainly caused by the separated governance from different departments of the local government. For example, ecology and environment management may highlight ecological functions of UGSs, while housing and urban development will emphasize their capabilities of providing cultural tourism and leisure services. As one type of scarce ecological components in urban systems, UGS provides both social and ecological benefits for human beings. It is a new attempt to rearrange the UGS pattern from a multifunctional perspective in the context of human–nature harmonious development. Therefore, we propose a Pareto ranking method to identify tradeoff relationship of UGS patches in terms of ecological and social functions. Different from previous studies, this work will help to develop a differentiated conservation strategy for UGS management. For example, UGS patches with high comprehensive socio-ecological benefit will be protected as a priority, while those with low comprehensive benefit will be restored as soon as possible.
5.2. Implications for Urban Landscape Planning
The case study will provide solid support for urban landscape planning in Wuhan City. As it can be observed, within an intensive development city, a large river beach and forest parks can better facilitate species dispersal (e.g., brown-headed crow finches, white-headed bulbuls, and gray magpies in the study area) and maintain urban biodiversity. However, the ecological significance of small sized urban green spaces cannot be ignored, for example, the attached green spaces within residential areas may exert a steppingstone effect in the process of species dispersal.
Moreover, the spatial accessibility of urban green space in the main urban area is severely limited, and the construction of a “15-min community life circle” in Wuhan still has plenty of room for improvement. Although the spatial accessibility of the attached green spaces shows lower than that of parks, their service capability per unit area is likely to be higher than that of parks. Therefore, on the one hand, it is necessary to pay attention to the design of pedestrian roads; on the other hand, the service capacity of the attached green space should be promoted in combination with the community living circle planning and the optimal utilization of the attached green space such as residential areas and universities in the living circle.
Overall, 21 key UGS patches were identified in the main urban area of Wuhan (Table 4). In the process of urban development, 10 key patches such as Guishan Scenic Area, Yellow Crane Tower, and Shouyi Park require better protection from the occupation of urban expansion. Meanwhile, 11 key green patches are considered as the hotspots of restoration in further UGS planning and construction, which can be improved in terms of habitat quality, landscape pattern, spatial accessibility, and surrounding transportation conditions.
6. Conclusions
For the urban areas with high land intensity and large population density, it is impossible to improve the comprehensive benefits of urban green spaces through large-scale UGS rearrangement. In this context, comprehensive use of the existing UGS patches will be highlighted, and targeted policies need to be developed accordingly. In this work, the differentiated conservation priorities of UGSs are expected to be identified from the perspective of multi-functional tradeoffs. The comprehensive benefits of the ecological connectivity and spatial accessibility of urban green space were explored using Pareto ranking analysis, and the differentiated priorities of green space patch, i.e., protection and restoration, are determined based on the ranking levels. This work is expected to provide an applicable framework for the quantitative identification of key urban green space patches.
Author Contributions
Conceptualization, H.L. and D.L.; methodology, H.L.; formal analysis, H.L.; writing—original draft preparation, H.L.; writing—review and editing, D.L. and J.H. All authors have read and agreed to the published version of the manuscript.
Funding
This research was funded by National Natural Scientific Foundation of China, grant number 41771429.
Institutional Review Board Statement
Not applicable.
Informed Consent Statement
Not applicable.
Conflicts of Interest
The authors declare no conflict of interest.
References
- Aronson, M.F.J.; Lepczyk, C.A.; Evans, K.L.; Goddard, M.A.; Lerman, S.B.; MacIvor, J.S.; Nilon, C.H.; Vargo, T. Biodiversity in the city: Key challenges for urban green space management. Front. Ecol. Environ. 2017, 15, 189–196. [Google Scholar] [CrossRef] [Green Version]
- Douglas, O.; Lennon, M.; Scott, M. Green space benefits for health and well-being: A life-course approach for urban planning, design and management. Cities 2017, 66, 53–62. [Google Scholar] [CrossRef] [Green Version]
- Kong, X.S.; Fu, M.X.; Zhao, X.; Wang, J.; Jiang, P. Ecological effects of land-use change on two sides of the Hu Huanyong Line in China. Land Use Policy 2022, 113, 105895. [Google Scholar] [CrossRef]
- Haaland, C.; van den Bosch, C.K. Challenges and strategies for urban green-space planning in cities undergoing densification: A review. Urban For. Urban Green. 2015, 14, 760–771. [Google Scholar] [CrossRef]
- Madureira, H.; Andresen, T. Planning for multifunctional urban green infrastructures: Promises and challenges. Urban Des. Int. 2014, 19, 38–49. [Google Scholar] [CrossRef]
- Belmeziti, A.; Cherqui, F.; Kaufmann, B. Improving the multi-functionality of urban green spaces: Relations between components of green spaces and urban services. Sustain. Cities Soc. 2018, 43, 1–10. [Google Scholar] [CrossRef]
- Kabisch, N.; Qureshi, S.; Haase, D. Human-environment interactions in urban green spaces—A systematic review of contemporary issues and prospects for future research. Environ. Impact Assess. Rev. 2015, 50, 25–34. [Google Scholar] [CrossRef]
- Sun, Y.; Liu, D.; Wang, P. Urban simulation incorporating coordination relationships of multiple ecosystem services. Sustain. Cities Soc. 2022, 76, 103432. [Google Scholar] [CrossRef]
- Charoenkit, S.; Piyathamrongchai, K. A review of urban green spaces multifunctionality assessment: A way forward for a standardized assessment and comparability. Ecol. Indic. 2019, 107, 105592. [Google Scholar] [CrossRef]
- Meerow, S.; Newell, J.P. Spatial planning for multifunctional green infrastructure: Growing resilience in Detroit. Landsc. Urban Plan. 2017, 159, 62–75. [Google Scholar] [CrossRef]
- Derkzen, M.L.; van Teeffelen, A.J.A.; Verburg, P.H. REVIEW Quantifying urban ecosystem services based on high-resolution data of urban green space: An assessment for Rotterdam, the Netherlands. J. Appl. Ecol. 2015, 52, 1020–1032. [Google Scholar] [CrossRef]
- Dai, E.; Wang, X.; Zhu, J.; Xi, W. Quantifying ecosystem service trade-offs for plantation forest management to benefit provisioning and regulating services. Ecol. Evol. 2017, 7, 7807–7821. [Google Scholar] [CrossRef]
- Guo, S.Y.; Saito, K.; Yin, W.D.; Su, C. Landscape Connectivity as a Tool in Green Space Evaluation and Optimization of the Haidan District, Beijing. Sustainability 2018, 10, 1979. [Google Scholar] [CrossRef] [Green Version]
- Xing, L.J.; Liu, Y.F.; Liu, X.J. Measuring spatial disparity in accessibility with a multi-mode method based on park green spaces classification in Wuhan, China. Appl. Geogr. 2018, 94, 251–261. [Google Scholar] [CrossRef]
- Ekkel, E.D.; de Vries, S. Nearby green space and human health: Evaluating accessibility metrics. Landsc. Urban Plan. 2017, 157, 214–220. [Google Scholar] [CrossRef]
- Sarah, P.; Zhevelev, H.M. Effect of visitors’ pressure on soil and vegetation in several different micro-environments in urban parks in Tel Aviv. Landsc. Urban Plan. 2007, 83, 284–293. [Google Scholar] [CrossRef]
- Zhao, H.; Liu, D.; Li, F.; Liu, X.; Niu, J.; He, J.; Liu, Y. Incorporating spatio-temporal connectivity for prioritized conservation of individual habitat patches in a dynamic landscape. Ecol. Indic. 2021, 124, 107414. [Google Scholar] [CrossRef]
- Tian, Y.H.; Liu, Y.Q.; Jim, C.Y.; Song, H.Z. Assessing Structural Connectivity of Urban Green Spaces in Metropolitan Hong Kong. Sustainability 2017, 9, 1653. [Google Scholar] [CrossRef] [Green Version]
- Ersoy, E.; Jorgensen, A.; Warren, P.H. Identifying multispecies connectivity corridors and the spatial pattern of the landscape. Urban For. Urban Green. 2019, 40, 308–322. [Google Scholar] [CrossRef]
- Gao, Y.; Ma, L.; Liu, J.; Zhuang, Z.; Huang, Q.; Li, M. Constructing Ecological Networks Based on Habitat Quality Assessment: A Case Study of Changzhou, China. Sci. Rep. 2017, 7, 1–11. [Google Scholar] [CrossRef]
- Liu, X.; Liu, D.; Zhao, H.; He, J.; Liu, Y. Exploring the spatio-temporal impacts of farmland reforestation on ecological connectivity using circuit theory: A case study in the agro-pastoral ecotone of North China. J. Geogr. Sci. 2020, 30, 1419–1435. [Google Scholar] [CrossRef]
- Merrick, M.J.; Koprowski, J.L. Circuit theory to estimate natal dispersal routes and functional landscape connectivity for an endangered small mammal. Landsc. Ecol. 2017, 32, 1163–1179. [Google Scholar] [CrossRef]
- Li, Z.; Wei, H.; Wu, Y.; Su, S.; Wang, W.; Qu, C. Impact of community deprivation on urban park access over time: Understanding the relative role of contributors for urban planning. Habitat Int. 2019, 92, 102031. [Google Scholar] [CrossRef]
- Tan, C.D.; Tang, Y.H.; Wu, X.F. Evaluation of the Equity of Urban Park Green Space Based on Population Data Spatialization: A Case Study of a Central Area of Wuhan, China. Sensors 2019, 19, 2929. [Google Scholar] [CrossRef] [PubMed] [Green Version]
- Rahman, K.; Zhang, D.F. Analyzing the Level of Accessibility of Public Urban Green Spaces to Different Socially Vulnerable Groups of People. Sustainability 2018, 10, 3917. [Google Scholar] [CrossRef] [Green Version]
- Li, L.J.; Du, Q.Y.; Ren, F.; Ma, X.Y. Assessing Spatial Accessibility to Hierarchical Urban Parks by Multi-Types of Travel Distance in Shenzhen, China. Int. J. Environ. Res. Public Health 2019, 16, 1038. [Google Scholar] [CrossRef] [Green Version]
- Xing, L.J.; Liu, Y.F.; Liu, X.J.; Wei, X.J.; Mao, Y. Spatio-temporal disparity between demand and supply of park green space service in urban area of Wuhan from 2000 to 2014. Habitat Int. 2018, 71, 49–59. [Google Scholar] [CrossRef]
- Bowman, J. Is dispersal distance of birds proportional to territory size? Can. J. Zool. Rev. Can. Zool. 2003, 81, 195–202. [Google Scholar] [CrossRef]
- McRae, B.H.; Dickson, B.G.; Keitt, T.H.; Shah, V.B. Using circuit theory to model connectivity in ecology, evolution, and conservation. Ecology 2008, 89, 2712–2724. [Google Scholar] [CrossRef]
- Wang, B.; Liu, Z. Functional connectivity analyses and construction strategies of the structure of green space network in haidian district of Beijing. Landsc. Archit. Front. 2019, 7, 34–51. [Google Scholar] [CrossRef]
- Kwan, M. Recent advances in accessibility research: Representation, methodology and applications. J. Geogr. Syst. 2003, 5, 129–138. [Google Scholar] [CrossRef]
- Cao, K.; Zhang, W.; Liu, S.; Huang, B.; Huang, W. Pareto law-based regional inequality analysis of PM2.5 air pollution and economic development in China. J. Environ. Manag. 2019, 252, 109635. [Google Scholar] [CrossRef] [PubMed]
- Yang, W.; Jin, Y.; Sun, T.; Yang, Z.; Cai, Y.; Yi, Y. Trade-offs among ecosystem services in coastal wetlands under the effects of reclamation activities. Ecol. Indic. 2018, 92, 354–366. [Google Scholar] [CrossRef]
Figure 1.
Location of the study area and distribution of urban green spaces.

Figure 2.
Current density in the urban center of Wuhan under different area thresholds of UGS patches (area threshold of nodes in ecological networks, (a) 1 ha; (b) 3 ha; (c) 5 ha. Black rectangles indicate the remarkable species dispersal corridors in landscapes.
Figure 2.
Current density in the urban center of Wuhan under different area thresholds of UGS patches (area threshold of nodes in ecological networks, (a) 1 ha; (b) 3 ha; (c) 5 ha. Black rectangles indicate the remarkable species dispersal corridors in landscapes.

Figure 3.
Spatial distribution of ecological connectivity of UGSs in the urban center of Wuhan (area threshold of nodes in ecological networks, (a) 1 ha; (b) 3 ha; (c) 5 ha).
Figure 3.
Spatial distribution of ecological connectivity of UGSs in the urban center of Wuhan (area threshold of nodes in ecological networks, (a) 1 ha; (b) 3 ha; (c) 5 ha).

Figure 4.
Spatial accessibility level of UGSs under different travelling scenarios (a) Potentially serving population (10,000 people); (b) Population served per unit area of green space (10,000 people/m2)).
Figure 4.
Spatial accessibility level of UGSs under different travelling scenarios (a) Potentially serving population (10,000 people); (b) Population served per unit area of green space (10,000 people/m2)).

Figure 5.
Spatial distribution of spatial accessibility of UGSs in the urban center of Wuhan ((a) Accessible by walking 15 min; (b) Accessible by walking 30 min; (c) Accessible by cycling 15 min; (d) Accessible by cycling 30 min).
Figure 5.
Spatial distribution of spatial accessibility of UGSs in the urban center of Wuhan ((a) Accessible by walking 15 min; (b) Accessible by walking 30 min; (c) Accessible by cycling 15 min; (d) Accessible by cycling 30 min).

Figure 6.
Pareto ranks of UGSs in the urban center of Wuhan.

Figure 7.
The comprehensive benefit of UGSs in the urban center of Wuhan ((a) Frequency of patches in different Pareto ranks; (b) Distribution of key green patches).
Figure 7.
The comprehensive benefit of UGSs in the urban center of Wuhan ((a) Frequency of patches in different Pareto ranks; (b) Distribution of key green patches).


Table 1.
Threats of species and their weights.
| Threat Source | Influencing Distance/km | Weights | Spatial Decay Type |
|---|---|---|---|
| Urban and rural construction land | 2.0 | 1.0 | Exponential |
| Transportation land | 1.0 | 0.9 | Linear |
| Cultivated land | 0.5 | 0.5 | Linear |
| Barren land | 1.5 | 0.6 | Exponential |
Table 2.
Habitat suitability and their relative sensitivity to different threat sources.
| Land Use Type | Habitat Suitability | Urban and Rural Construction Land | Transportation Land | Cultivated Land | Barren Land |
|---|---|---|---|---|---|
| Woodland | 1.00 | 0.90 | 0.65 | 0.85 | 0.65 |
| Grassland | 0.60 | 0.65 | 0.35 | 0.50 | 0.50 |
| Water areas | 0.90 | 0.85 | 0.50 | 0.75 | 0.50 |
| Cultivated land | 0.50 | 0.50 | 0.25 | 0.35 | 0.30 |
| Urban and rural construction land | 0.00 | \ | \ | \ | \ |
| Transportation land | 0.00 | \ | \ | \ | \ |
| Barren land | 0.00 | \ | \ | \ | \ |
Table 3.
Ecological connectivity level of urban green patches in Wuhan under different habitat area thresholds.
Table 3.
Ecological connectivity level of urban green patches in Wuhan under different habitat area thresholds.
| Habitat Area Threshold | Current Density through UGS Patches | |||||
|---|---|---|---|---|---|---|
| Maximum | Minimum | Mean | Standard Deviation | Proportion below the Average | ||
| Parks | 1 ha | 162.52 | 65.09 | 123.24 | 18.05 | 37.78% |
| 3 ha | 103.32 | 69.61 | 88.97 | 5.75 | 42.22% | |
| 5 ha | 71.55 | 1.50 | 52.18 | 24.84 | 20.00% | |
| Attached green space | 1 ha | 155.73 | 64.29 | 125.14 | 19.86 | 50.00% |
| 3 ha | 101.36 | 70.35 | 89.94 | 6.33 | 61.54% | |
| 5 ha | 68.82 | 1.09 | 45.67 | 28.92 | 30.77% | |
Table 4.
Key UGS patches in the main urban area of Wuhan.
| Park | Attached Green Space | |||||
|---|---|---|---|---|---|---|
| No. | Name | Frequency at the First Two Levels | No. | Name | Frequency at the First Two Levels | |
| Green space to be protected with high comprehensive benefits | 7 | Guishan Scenic Area | 12 | 3 | Wuhan Youth Palace | 12 |
| 17 | Yellow crane tower | 12 | 71 | Luojia Mountain | 11 | |
| 19 | Shouyi Park | 12 | 79 | Nanwangshan Mountain | 6 | |
| 2 | Zhongshan Park | 11 | ||||
| 16 | Shouyi Cultural Park | 7 | ||||
| 28 | Hongshan Park | 7 | ||||
| 78 | Hongshan Square | 6 | ||||
| Green space to be restored with low comprehensive benefits | 34 | Chufeng Garden | 12 | 62 | University affiliated green space | 12 |
| 39 | Dijiao Park | 11 | 61 | Optics Valley | 9 | |
| 1 | Jinxiulongcheng Park | 8 | 90 | Attached green space in residential area | 9 | |
| 21 | Baibuting Garden | 7 | 87 | Attached green space in residential area | 8 | |
| 12 | Lotus Lake Park | 6 | ||||
| 32 | Tianxingzhou Bridge Park | 6 | ||||
| 45 | Qingshan Park | 6 | ||||
Publisher’s Note: MDPI stays neutral with regard to jurisdictional claims in published maps and institutional affiliations. |
© 2022 by the authors. Licensee MDPI, Basel, Switzerland. This article is an open access article distributed under the terms and conditions of the Creative Commons Attribution (CC BY) license (https://creativecommons.org/licenses/by/4.0/).
Share and Cite
MDPI and ACS Style
Li, H.; Liu, D.; He, J. Exploring Differentiated Conservation Priorities of Urban Green Space Based on Tradeoffs of Ecological Functions. Sustainability 2022, 14, 1845. https://0-doi-org.brum.beds.ac.uk/10.3390/su14031845
AMA Style
Li H, Liu D, He J. Exploring Differentiated Conservation Priorities of Urban Green Space Based on Tradeoffs of Ecological Functions. Sustainability. 2022; 14(3):1845. https://0-doi-org.brum.beds.ac.uk/10.3390/su14031845
Chicago/Turabian StyleLi, Huiying, Dianfeng Liu, and Jianhua He. 2022. "Exploring Differentiated Conservation Priorities of Urban Green Space Based on Tradeoffs of Ecological Functions" Sustainability 14, no. 3: 1845. https://0-doi-org.brum.beds.ac.uk/10.3390/su14031845
Note that from the first issue of 2016, this journal uses article numbers instead of page numbers. See further details here.