Article

Estimating Driver Behavior Measures Related to Traffic Safety by Investigating 2-Dimensional Uncertain Linguistic Data—A Pythagorean Fuzzy Analytic Hierarchy Process Approach

1
Department of Civil Engineering, COMSATS University Islamabad, Islamabad 47040, Pakistan
2
Department of Transport Technology and Economics, Budapest University of Technology and Economics, 1111 Budapest, Hungary
*
Author to whom correspondence should be addressed.
Sustainability 2022, 14(3), 1881; https://0-doi-org.brum.beds.ac.uk/10.3390/su14031881
Submission received: 15 December 2021 / Revised: 28 January 2022 / Accepted: 29 January 2022 / Published: 7 February 2022
(This article belongs to the Special Issue Multi-criteria Decision Making and Sustainable Transport)

Abstract

:
Human behavior has been estimated as a factor too uncertain and complex to investigate road safety issues. By utilizing recent expansions of ordinary fuzzy sets, experts in the field have intended to handle the vagueness of human behavior in sustainable transport systems by using linguistic terms for assessment. Pythagorean Fuzzy sets (PFSs) are considered a superior method that has been developed for multi-criteria decision-making (MCDM), which enables assigning of both membership and non-membership functions in a large domain area. A novel Pythagorean Fuzzy Analytic Hierarchy Process (PF-AHP) is performed to assess and prioritize critical driver behavior criteria designed into a hierarchical model based on data gathered from observed driver groups in Budapest city. Accordingly, based on the aggregated weights, the criterion ‘lapses’ is prioritized as the most critical factor connected to road safety. The criterion ‘disobey speed limits’ is found to be the least critical factor, followed by ‘disobey overtaking rules’ as the second least. For a comparative analysis, the case of dependent criteria has been considered. Pythagorean Fuzzy DEMATEL method has been applied to determine dependencies between the criteria. Through the dependencies, a network of criteria has been constructed and the Pythagorean Fuzzy Analytic Network Process (ANP) conducted to interpret the results. Moreover, sensitivity analyses have been carried out to examine its robustness by applying different case scenarios.

1. Introduction

The global road safety report estimates that the annual number of deaths in traffic accidents has reached 1.35 million [1]. Globally, European roads have been declared the safest, with a 19% decrease in road fatalities over the past six years. Although the strategic goal for sustainable development of halving the number of deaths in traffic accidents between 2010 and 2020 has been achieved, it is worth intending to protect every single life [2]. The performance of Hungary in road safety is below the European Union (EU) average. On Hungarian roads, 64 people per million inhabitants died in 2018, indicating a 1% rise compared to the previous year [3]. When the situation analysis of the Road Safety Action Program is examined, it seems that most of the traffic accidents were caused by human-related issues; so minimizing human-related issues becomes an extremely dynamic goal to make the roads safe [4].
Human behavior plays a very significant role in the sustainable transport system, with previous research findings showing human factors to be a primary cause in almost 90% of the traffic crashes on the roads [5,6,7]. Also, a study observed that driving behavior is one of the basic driver-related components that directly affect road safety [8]. Several driver behavior factors have been detected as dynamic, intentional rule violations and errors due to less driving experience, while others were due to inattention, momentary faults or failure to perform a function—the latter generally connected to age [9,10]. Driving behavior evaluation has been considered a crucial constraint for traffic studies. The studies provide valuable data on generally three main topics that can be classified as road safety analysis, microscopic traffic simulation, and intelligent transportation systems [11]. A resolution by the Council of Ministers approved on 24 September 2019 on the “Strategy for the Sustainable Transport Development by 2030” emphasized on the need to increase transport accessibility in the country, and enhance the safety of traffic users and competence of the transport sector by creating a sustainable, innovative, coherent, and user-friendly transport network at the national, European, and global levels [12]. A sustainable transportation system can provide access to people, opportunities, and goods and services in an efficient, safe, and equitable way without affecting the environment. Sustainable transportation can serve all groups of people in the city in a way that is within its environmental carrying capability and is rational to both users and providers of the system [13].
MCDM is an innovative area of operational study in quantitative hazard assessment classification. MCDM presents a wide assortment of approaches to decision makers (DMs) and experts who are well complemented with the intricacy of decision-making issues. MCDM approaches primarily contain human intervention and decisions [14]. MCDM approaches involve estimating and deciding alternatives under conflicting criteria while considering the choices provided by DMs [15]. The major elements of an MCDM approach involve alternatives, criteria against assessed alternatives, alternatives scores on criteria, and criteria weights signifying the relative significance of each criterion in comparison with others [15].
In risk-assessment literature, researchers utilize valuable MCDM methodologies such as AHP to rank deterrents or development actions of risky systems [16,17]. AHP, developed by Saaty (1990) [18], is based on the hierarchic MCDM issue involving an objective, criteria, and alternatives. The AHP has the benefits of hierarchical arrangement definition, presentation of the issue in a structural way, and incorporation of all the decisions with structured links. After the design of the hierarchy, linguistic expressions are utilized by evaluators to do pairwise comparisons (PCs). These linguistic expressions are transformed into numerical values by implementing fuzzy sets that are capable of focusing on the vagueness and uncertainty of the assessment processes [18]. At present, numerous studies combine AHP approaches with the system of fuzzy logic, which provides risk prioritization according to threat level and yields a consistent model for risk assessment. The use of such risk assessment models can be found in several fields, such as the risk assessment of floor water incursion in coal mines [19], driver behavior criteria [20], and information technology developments [21]. Previous studies utilized fuzzy AHP to estimate and give priority to the most important driver behavior criteria related to road safety for Budapest drivers [22] and those from different cultures [23]. Furthermore, the triangular fuzzy method was integrated with the best–worst method (F-BWM) to better estimate the nominated driver behavior criteria for the development of a consistent decision process related to road safety issues [24]. However, there is a demand for a better and more flexible description of membership tasks in fuzzy MCDM approaches. In this study, the adopted model targets to examine and rank the most crucial driver behavior factors and sub-factors affecting road safety based on evaluators’ responses in order to alleviate the uncertainty of non-expert assessments.
The PFS, an expansion of intuitionistic fuzzy sets, was created with the objective of generating a larger domain area for evaluators in stating their decisions regarding the impreciseness and vagueness of the studied complex problem. It attains this objective because the evaluators do not have to designate membership and non-membership grades whose total is at ultimate 1. Though the total squares of such degrees should be at ultimate 1, the weight scores achieved through the PF-AHP method will be utilized as inputs for prospectively factor in risk assessment methods [25]. The extensions aim to cope with the uncertainty and decide the indeterminacy more consistently. PFSs enable the statement on a larger frame of membership and non-standard membership grades that allow experts to consider uncertainty more efficiently than others of fuzzy extensions [26].
The main aim of the work is to estimate and rank the ultimate essential factors affecting road safety by utilizing the PF-AHP method and its application. The questionnaire created on the fuzzy scale is utilized to assess the responses of different drivers’ groups using PCs. The work prioritizes specified factors developed in three levels of hierarchical structure by giving weight to each factor. Finally, high-rank driver behavior factors that can drastically affect road safety are highlighted.

2. Materials and Methods

In this section, the fundamentals of PFS and applied methodology are presented in detail.

2.1. Pythagorean Fuzzy Sets

Pythagorean Fuzzy sets (PFSs) were introduced by Yager (2013) [27] based on intuitionistic type-2 fuzzy (IFS2) sets initially created by Atanassov (1999) [28]. In PFSs, instead of ordinary fuzzy sets, there are two functions called membership and non-membership that represent the degree of belonging and non-belonging. Through this representation, presenting decision makers/experts hesitancy on their evaluations can be available in the mathematical representations. The mathematical procurement of a PFS is described in Definition 1 as follows:
Definition 1.
(Yager, 2013)[27]. Let X be a fixed set. A PFS L ˜ is an object in X having the following form:
L ˜ x , μ L ˜ x , ϑ P ˜ x ; x X  
where the functions μ L ˜ x : X 0 , 1 and ϑ P ˜ x : X 0 , 1 define the degree of membership and non-membership of the elements x ϵ X to L , respectively. For each x ϵ X , it holds that:
0 μ L ˜ x 2 + ϑ L ˜ x 2 1
Also, π L x = 1 μ L ˜ x 2 ϑ L ˜ x 2 is the hesitation degree of the element L ˜ in set X . In a similar way, we obtain 0 π L ˜ x 2 1 by using Equation (2).
Definition 2.
(Zhang & Xu, 2014)[29][. Let A ˜ μ A ˜ , ϑ A ˜ and B ˜ μ B ˜ , ϑ B ˜ be Pythagorean Fuzzy Numbers (PFNs), and λ > 0 . Some arithmetical operations of PFNs can be epitomized as follows:
A ˜ B ˜ μ A ˜ 2 + μ B ˜ 2 μ A ˜ 2 μ B ˜ 2 ,   ϑ A ˜ ϑ B ˜
A ˜ B ˜ μ A ˜ μ B ˜ ,   ϑ A ˜ 2 + ϑ B ˜ 2 ϑ A ˜ 2 ϑ B ˜ 2
λ A ˜ = 1 1 μ 2 λ , ϑ λ
A ˜ λ = μ λ , 1 1 ϑ 2 λ

2.2. Interval Valued Pythagorean Fuzzy Sets

Zhang (2016) [30] introduces interval-valued PFSs (IV PFSs). The mathematical assimilation of an IV-PFS is depicted as follows:
Definition 3.
(Garg, 2016)[31]. An IV-PFS in L ˜ is denoted over X can be represented as follows:
L ˜ x , μ L ˜ x , ϑ P ˜ x ; x X
where μ L ˜ x 0 , 1 and ϑ L ˜ x 0 , 1 are interval numbers such that 0 sup μ L ˜ x + sup ϑ L ˜ x 1 for all x ϵ X .
For convenience, let μ L ˜ x = a , b and ϑ L ˜ x = c , d , then this pair is often denoted by L ˜ = a , b , c , d and named an IV PFN where,
a , b 0 , 1 ,   c , d 0 , 1 ,   and   0 b 2 + d 2 1
Similar to PFSs, the hesitancy degree of this IV PFN is given as
π ˜ L = 1 b 2 d 2 , 1 a 2 c 2
Definition 4.
Let A ˜ μ A ˜ L , μ A ˜ U , ϑ A ˜ L , ϑ A ˜ U and B ˜ μ B ˜ L , μ B ˜ U , ϑ B ˜ L , ϑ B ˜ U be IV-PFNS, and λ > 0 . The arithmetical operations of these IV PFNs are declared as follows:
A ˜ B ˜ μ A ˜ L 2 + μ B ˜ L 2 μ A ˜ L 2 μ B ˜ L 2 , μ A ˜ U 2 + μ B ˜ U 2 μ A ˜ U 2 μ B ˜ U 2 ,   ϑ A ˜ L ϑ B ˜ L , ϑ A ˜ U ϑ B ˜ U
A ˜ B ˜ μ A ˜ L μ B ˜ L , μ A ˜ U μ B ˜ U , ϑ A ˜ L 2 + ϑ B ˜ L 2 ϑ A ˜ L 2 ϑ B ˜ L 2 , ϑ A ˜ U 2 + ϑ B ˜ U 2 ϑ A ˜ U 2 ϑ B ˜ U 2
λ A ˜ = 1 1 μ A ˜ L λ , 1 1 μ A ˜ U λ , ϑ L λ , ϑ U λ
A ˜ λ = μ A ˜ L λ , μ A ˜ U λ , 1 1 ϑ A ˜ L λ , 1 1 ϑ A ˜ U λ

2.3. Pythagorean Fuzzy AHP Method

The pseudo code of Pythagorean Fuzzy AHP (PF-AHP) method is given in Algorithm 1 as follows:
Algorithm 1. Pseudo representation of PF-AHP [25].
Input :                               n :   number   of   groups ,   n = 1 , , k
                                      m :   number   of   evaluation   criteria ,   m = 1 , , i
                                      m i j k :   linguistic   comparison   of   i t h   criterion   over   j t h   criterion   based   on   group   k
Output :   w i k :   local   weights   of   the   criterion   i   based   on   group   k
for   n   1   t o   k   do
Step 1: Construct   the   linguistic   pairwise   comparison   matrix   ( PCM )   L ˜ = l ˜ i j m × m     Based   on Table 1 *
Step 2: Check consistency ratio (CR) based on Saaty’s algotithm [32].
C R = C I R I
where CI is the consistency index and RI randomness index.
if   CR   >   0.1   then
   return Step 1;
else
go Step 3;
end
  Step 3: Convert   linguistic   terms   into   corresponded   IV   PFNs   R ˜ = r ˜ i j m × m   Based   on Table 1 *
  Step 4:   Obtain   the   difference   matrix   D = d i j m × m   by   using   the   following   equations :
d i j L = μ i j L 2 ϑ i j U 2
d i j U = μ i j U 2 ϑ i j L 2
where   d i j = d i j L ,   d i j U .
Step 5: Calculate   IMM   S = s i j m × m   by   using   the   following   equations :
s i j L = 1000 d i j L
s i j U = 1000 d i j U
Step 6: Obtain   the   indeterminacy   value   h i j   by   using   the   following   equation :
h i j = 1 μ i j U 2 μ i j L 2 ϑ i j U 2 ϑ i j L 2
Step 7: Multiply   the   indeterminacy   degrees   with   S = s i j m × m   matrix   for   finding   the   matrix   of   weights   T = t i j m × m   by   using   the   following   equation :
t i j = s i j L + s i j U 2 h i j
Step 8: Find   the   priority   weights   ( w i k )   by   using   the   following   equation :
w i k = j = 1 m w i j i = 1 m j = 1 m w i j
end
*: To illustrate Saaty’s consistency procedure, we converted linguistic terms to values in the traditional AHP scale [32].
The implemented scale for the linguistic terms is depicted in Table 1 as follows.
Table 1. Linguistic Scale for the IVPF-AHP method [32].
Linguistic TermsIV PFNs
Certainly Low Important—CLI<[0, 0, [0.9, 1]>
Very Low Important—VLI<[0.1, 0.2], [0.8, 0.9]>
Low Important—LI<[0.2, 0.35], [0.65, 0.8]>
Below Average Important—BAI<[0.35, 0.45],[0.55, 0.65]>
Average Important—AI<[0.45, 0.55],[0.45, 0.55]>
Above Average Important—AAI<[0.55, 0.65],[0.35, 0.45]>
High Important—HI<[0.65, 0.80], [0.2, 0.35]>
Very High Important—VHI<[0.8, 0.9], [0.1, 0.2]>
Certainly High Important—CHI<[0.9, 1], [0, 0]>

3. Application

In this section, based on available data, we adopted the PF-AHP method for the evaluation of drivers’ behavior factors that directly affect road safety. In the following sub-sections, we present the data-gathering process, problem structure, and steps of the applied method.

3.1. Questionnaire Survey

There has been vital work performed to identify and resolve comportments that reduce driving safety. The Driver Behavior Questionnaire (DBQ) pushes for its endurance and leading employ among various implements [33,34]. To measure problematic driving behavior, DBQ was primarily created as an implement in connected studies in the 1990s [35]. Accordingly, DBQ pushes for their longevity and leading use to detect problematic driver behaviors.
The current research utilized the questionnaire survey designed on a fuzzy scale [20] to prioritize critical driver comportments connected to road safety using the PF-AHP method. A questionnaire survey was conducted as a data source that considered three automobile driver groups in the city of Budapest, Hungary. The first driver group (Group 1) included foreigners living in Hungary with a Hungarian driver license and adequate driving experience. Foreign citizens can get a driver’s license if they have lived for six months in Hungary. A recent study stated that considerable regional differences exist in driving attitudes towards road safety issues [23]. Also, a previous study indicated that these differences should play an essential part in planning road safety policies and campaigns [36]. Previous studies have found that self-reported driving behaviors are related to both active and passive road accidents among drivers in different countries [37]. While the second group (Group 2) included experienced drivers with much more driving experience, the third group (Group 3) had young drivers with little driving experience. The study was conducted on 35 randomly nominated members of every driver group. The pattern size could be reflected as illustrative due to the phenomenon of “the wisdom of crowds”, where assessors answer calculations representing their knowledge in an effective way. Solomon argued that when it comes to preference evaluations, even a relatively small group of people (over 20 members as a rule of thumb) can be representative because of the filtration of extreme opinions [38]. These members were asked to provide linguistic judgment data based on the specified questionnaire.
The questionnaire survey consisted of two parts: the first was implemented to obtain demographic data about the drivers who participated, and outcomes were presented in Table 2. The second part intended to estimate critical driver behavior criteria affecting road safety as presented in the conducted outcomes and discussion part.

3.2. Driver Behavior Model

Driver attitude or behavior has been studied as one of the ultimate considerable factors for safe movement on the road. The main observed factors that forthrightly affected road safety were driving attitude, driving experience, and driver perception of road traffic hazards [8]. Reason et al. (1990) [39] proposed three types of driving behavior, i.e., lapses, errors, and violations, and investigated the connection between driving behavior and its involvement in accidents. Slips and lapses are inevitable when utmost caution is not exercised. Human error is an unintentional judgment or action. Violations are intentional failures—intentionally performing the wrong action. DBQ with elongated violations was recently used to evaluate aberrant driver behaviors [40,41,42]. The extended version of the DBQ incorporates aggressive and ordinary violations along with lapses and errors [43].
The current research considered that a well-proved driver behavior model [20] consists of 21 driver behavior items designed in a three-level hierarchical arrangement as presented in Figure 1. The first hierarchical level incorporates three main driver attitude criteria such as ‘violations’, ‘lapses’, and ‘errors’. These main driver attitude criteria are broken down into related sub-criteria in the second hierarchical level. Level 2 further breaks down the two specified sub-criteria, ‘ordinary’ and ‘aggressive’ violations, into more sub-criteria. A summary of 20 studied driver behavior factors influencing road safety is stated in Table 3, which is assembled in three levels based on their characteristics. Table 3 also provides explanations for each factor, abbreviation, and associated reference.

3.3. Steps of the Application

The application starts with the construction of PCMs based on hierarchy, which is given in Figure 1. As in Step 1, constructed PCMs by employing the scale presented in Table 1 for Group 1 are presented in Appendix A.
For the illustration of the methodology, main criteria evaluation with respect to objectives based on Group 1 judgments is given with all its steps.
For Step 2, consistency procedure based on Saaty’s algorithm is applied to check the consistency ratio (CR) of the PCM. The matrix obtained after the transformation for the algorithm is depicted in Table 4:
Since CR is calculated as 0.0334, we continue with the next step.
For Step 3, linguistic terms are converted and R ˜ = r ˜ i j 3 × 3 is depicted in Table 5.
For Step 4, the difference matrix D = d i j 3 × 3 is computed as in Table 6.
For Step 5, interval multiplicative matrix (IMM) S = s i j 3 × 3 is obtained after calculations as in Table 7.
After finding the indeterminacy degrees in Step 6, the matrix of weights T = t i j 3 × 3 is constructed which is given in Table 8.
For the last step of the PF AHP, the weights obtained in Step 7 are normalized and the local weights are calculated. The outcomes are presented in Table 9.

4. Results and Discussion

The PF-AHP method can be recommended for all decision support systems in which layman evaluators measure the fundamentals of the decision system, mostly in methods where pairwise comparisons are adopted. In addition, the proposed model allows experts to better understand the whole assessment procedure. This consequence has been proved by our survey data. The proposed integrated process could help decision-makers focus on high-ranked critical factors affecting road safety to fulfill the criteria for sustainable transport system. Through the applied algorithm for each comparison matrix, the outcomes of the application are calculated (Table 10).
For a broader analysis, for driver Group 1 the application outcomes indicated the criterion ‘errors’ (C3) as the ultimate critical factor connected to road safety for the first level of structure. In the same way, the criterion ‘lapses’ (C2) was determined as the least effective factor based on the outcomes. Instead of Group 1, the criterion ‘lapses’ (C2) obtained the first rank as the ultimate effective criterion. Through the evaluation of all groups, the criterion ’lapses’ (C2) was determined as the ultimate effective Level-1 criterion. For Level 2, application outcomes depicted ‘failure to apply brakes in road hazards’ (C33) as the ultimate crucial factor, followed by ‘ordinary violations’ (C11), while ‘pull away from traffic lights in the wrong gear’ (C22) was noticed as the least critical factor in comparison with others. For Level 3, application outcomes showed ‘fail to maintain a safe gap’ (C112) as the ultimate critical factor followed by ‘fail to use personal intelligence’ (C111) while application outcomes found ‘disobey overtaking rules’ (C121) as the least critical criteria based on measured weight scores.
For driver Group 2, application outcomes depicted ‘lapses’ (C2) and ‘errors’ (C3) as the ultimate critical factor connected to road safety for the first level of hierarchical structure while ‘violations’ (C1) was observed as the least critical factor based on measured weight scores. For Level 2, application outcomes showed ‘fail to apply brakes in road hazards’ (C33) as the ultimate critical factor, followed by ‘hit something that had not been seen when reversing’ (C23), while ‘ordinary violations’ (C11) were observed as the least critical factor as compared to others. For Level 3, application outcomes showed ‘drive with alcohol use’ (C126) as the ultimate critical factor, followed by ‘disobey traffic lights’ (C123), and ‘fail to use personal intelligence’ (C111) as the least critical criteria based on measured weight scores.
For driver Group 3, outcomes depicted ‘lapses’ (C2) as the ultimate critical factor connected to road safety for the first level of hierarchical structure while ‘violations’ (C1) and ‘errors’ (C3) were observed as the least critical factors based on measured weight scores. For Level 2, ‘driver inattention’ (C21) was found to be the ultimate critical factor, followed by ‘hit something that had not been seen when reversing’ (C23), while ‘visual perception failure’ (C31) was observed as the least essential fact as compared to other specified factors. For Level 3, application outcomes showed ‘drive with alcohol use’ (C126) as the ultimate critical factor, followed by ‘disobey traffic lights’ (C123), while application outcomes found ‘disobey overtaking rules’ (C121) as the least critical criteria based on measured weight scores.
Based on aggregated weights, the criterion ‘lapses’ (C2) was found to be the ultimate critical factor connected to road safety. Previous outcomes of the factor analysis depicted that mostly lapses elements loaded on errors, which was a combination of lapses and errors and some violation elements [61]. The criteria ‘fail to apply brakes in road hazards’ (C33), ‘violations’ (C1), ‘driver inattention’ (C21), and ‘aggressive violations’ (C12) were also found to be major risks due to high weight scores. However, the criterion ‘disobey speed limits’ (C121) was found to be the least critical factor as compared to other observed factors while ‘disobey overtaking rules’ (C125) was observed as the second-least critical factor connected to road safety. A previous questionnaire-based study found that Budapest drivers were less compliant with speed limits [62], while a recent study observed the complex relationships of significant driver behavior factors related to road safety in decision-making, which aids in consequently improving the consistency of decisions for sustainable traffic safety. Linkage of research data with transport authorities and traffic management agencies could aid in implementing effective road safety plans and increasing the sustainable level of traffic safety [20]. Some of the improvements that a city can make for establishing a sustainable transport system and decreasing traffic accidents are setting high standards of training for public transit drivers, ensuring compliance to safe operation measures, establishment of safe crosswalks and other pedestrian infrastructure, conducting a safety audit of the road network, and setting up dedicated lanes for public transit buses [13].

4.1. Comparative Analysis

Optimism and pessimism are basic personal–psychological attributes that both define and indicate how a person reacts to his or her professed environment. Optimists interpret their lives and future conditions of the world positively, while pessimists interpret their lives and future conditions of the world depressingly. Similarly, optimists think in terms of high overall efficacy and promising results, but pessimists think in terms of less overall efficacy and undesirable results [63]. Psychology indicates that in a core network, dispositional optimism mechanism allows for evolving coping behavior or habits that are more expected to lead to anticipated results [64,65].
In the interpretation of multi-criteria decision-making issues, optimism and pessimism can imitate individual variances of different decision makers. Besides, they manage to be both dependable and durable. It shows that optimism and pessimism reliably impact how the decision maker responds to a decision environment. Hence, an understanding of their impact on the decision-making procedure is very useful and valuable in multiple criteria decision study [63]. In our application, driver behavior factors and sub-factors are evaluated based on the no-dependency-among-themselves situation. Through that, the PF-AHP method is performed. For a comparison of the outcomes, we develop pessimistic estimations based on the DEMATEL technique, where pessimism is measured using pessimistic point operators. With a pessimistic attitude, driver behavior factors and sub-factors affect each other and cause high-risk driver behavior, affecting road safety. Through the outcomes of DEMATEL, dependencies are determined and a network of criteria is constructed. Then, based on the dependencies, pairwise comparison matrices are re-constructed. Based on the results of re-constructed pairwise comparison matrices, a supermatrix is constructed and then converged to obtain the new weights of driver behavior criteria connected to road safety. Two academicians who are experts in human behavioral effects on traffic safety evaluate the criteria for the Pythagorean DEMATEL method. Based on the evaluations, dependencies are determined (Appendix B).
Based on the dependencies, the network of criteria and pairwise comparison matrices are constructed. Since there is no dependency between C11 and C12 with any other criteria, they are evaluated out of the network separately. Based on the calculations, the weights of the criteria are calculated as in Table 11.
For Level-3 criteria, weights are calculated as in Table 12.
Through the results, the most important criteria remain the same at each level. Moreover, C11 and C12 are not evaluated with respect to Level-2 criteria network since they have no dependency on any Level-2 criteria.

4.2. Sensitivity Analysis

The reliability of the model is supported by sensitivity analyses that observe a range for the weights’ values and are consistent with alternative outcomes. One-at-a-time sensitivity analyses are also applied to observe the shifts in all levels. The analyses are based on group dominance. For each group, weights are assigned, and then the shifts are observed. The pattern for the analyses is given in Table 13:
We first check Level 1, which is for the main criteria. Figure 2 presents the shifts with respect to weight changes of the groups.
To visualize more clearly, the weights of the groups are multiplied by 10. As it can be seen from Figure 2, criterion C1 has small changes for each group. It is also deduced that its weight is the ultimate consistent when compared with other criteria over each group’s dominance. For criterion C2, it staidly decreases against other criteria while the weights of the groups increase. Criterion C3 fluctuates most based on the changes. Moreover, when the dominance group is Group 1, criterion C3 has the highest weight when compared with other criteria. Also, in all levels of weights for the groups, Group 1 affects criteria at most. As a result of this analysis, one infers that C1 has the maximum consensus level. The groups are assigned approximate values when they evaluate it. In the same way, C3 criterion has the ultimate fluctuated values during evaluation. For further research, we believe that more focus groups are needed to evaluate the C3 criterion.
Secondly, the pattern is applied to Level-2 criteria. Figure 3 presents the shifts with respect to weight changes of the groups.
At first, as a result of the application, criterion C33 has the highest weight and criterion while C22 has the lowest. During the sensitivity analysis, the ranks are mostly preserved except for some shifts. Criterion C33 is affected most when it is compared with other criteria. Its peak points are obtained when the weights of Group 2 are equal to 0.5 and 0.7, respectively. Criterion C33 and criterion C21 are almost converged while the weights of Group 1 equal 0.7. Moreover, they have approximate values in the below situations:
Group 1 weight is equal to 0.6, therefore Group 2 and Group 3 are equal to 0.20.
Group 1 weight is equal to 0.7, and the others are 0.15.
Group 2 weight is equal to 0.6, and the others are 0.20.
Group 3 weight is equal to 0.5, and the others are 0.25.
Group 3 weight is equal to 0.6, and the others are 0.20.
In addition, C11 has the second rank when the weight of Group 2 is equal to 0.5. However, after that level, it tends to fall. The ultimate constant criteria among Level-2 criteria are criterion C31 and criterion C22. During the pattern, their values are the least affected criteria. Their evaluation for the group is mostly converged.
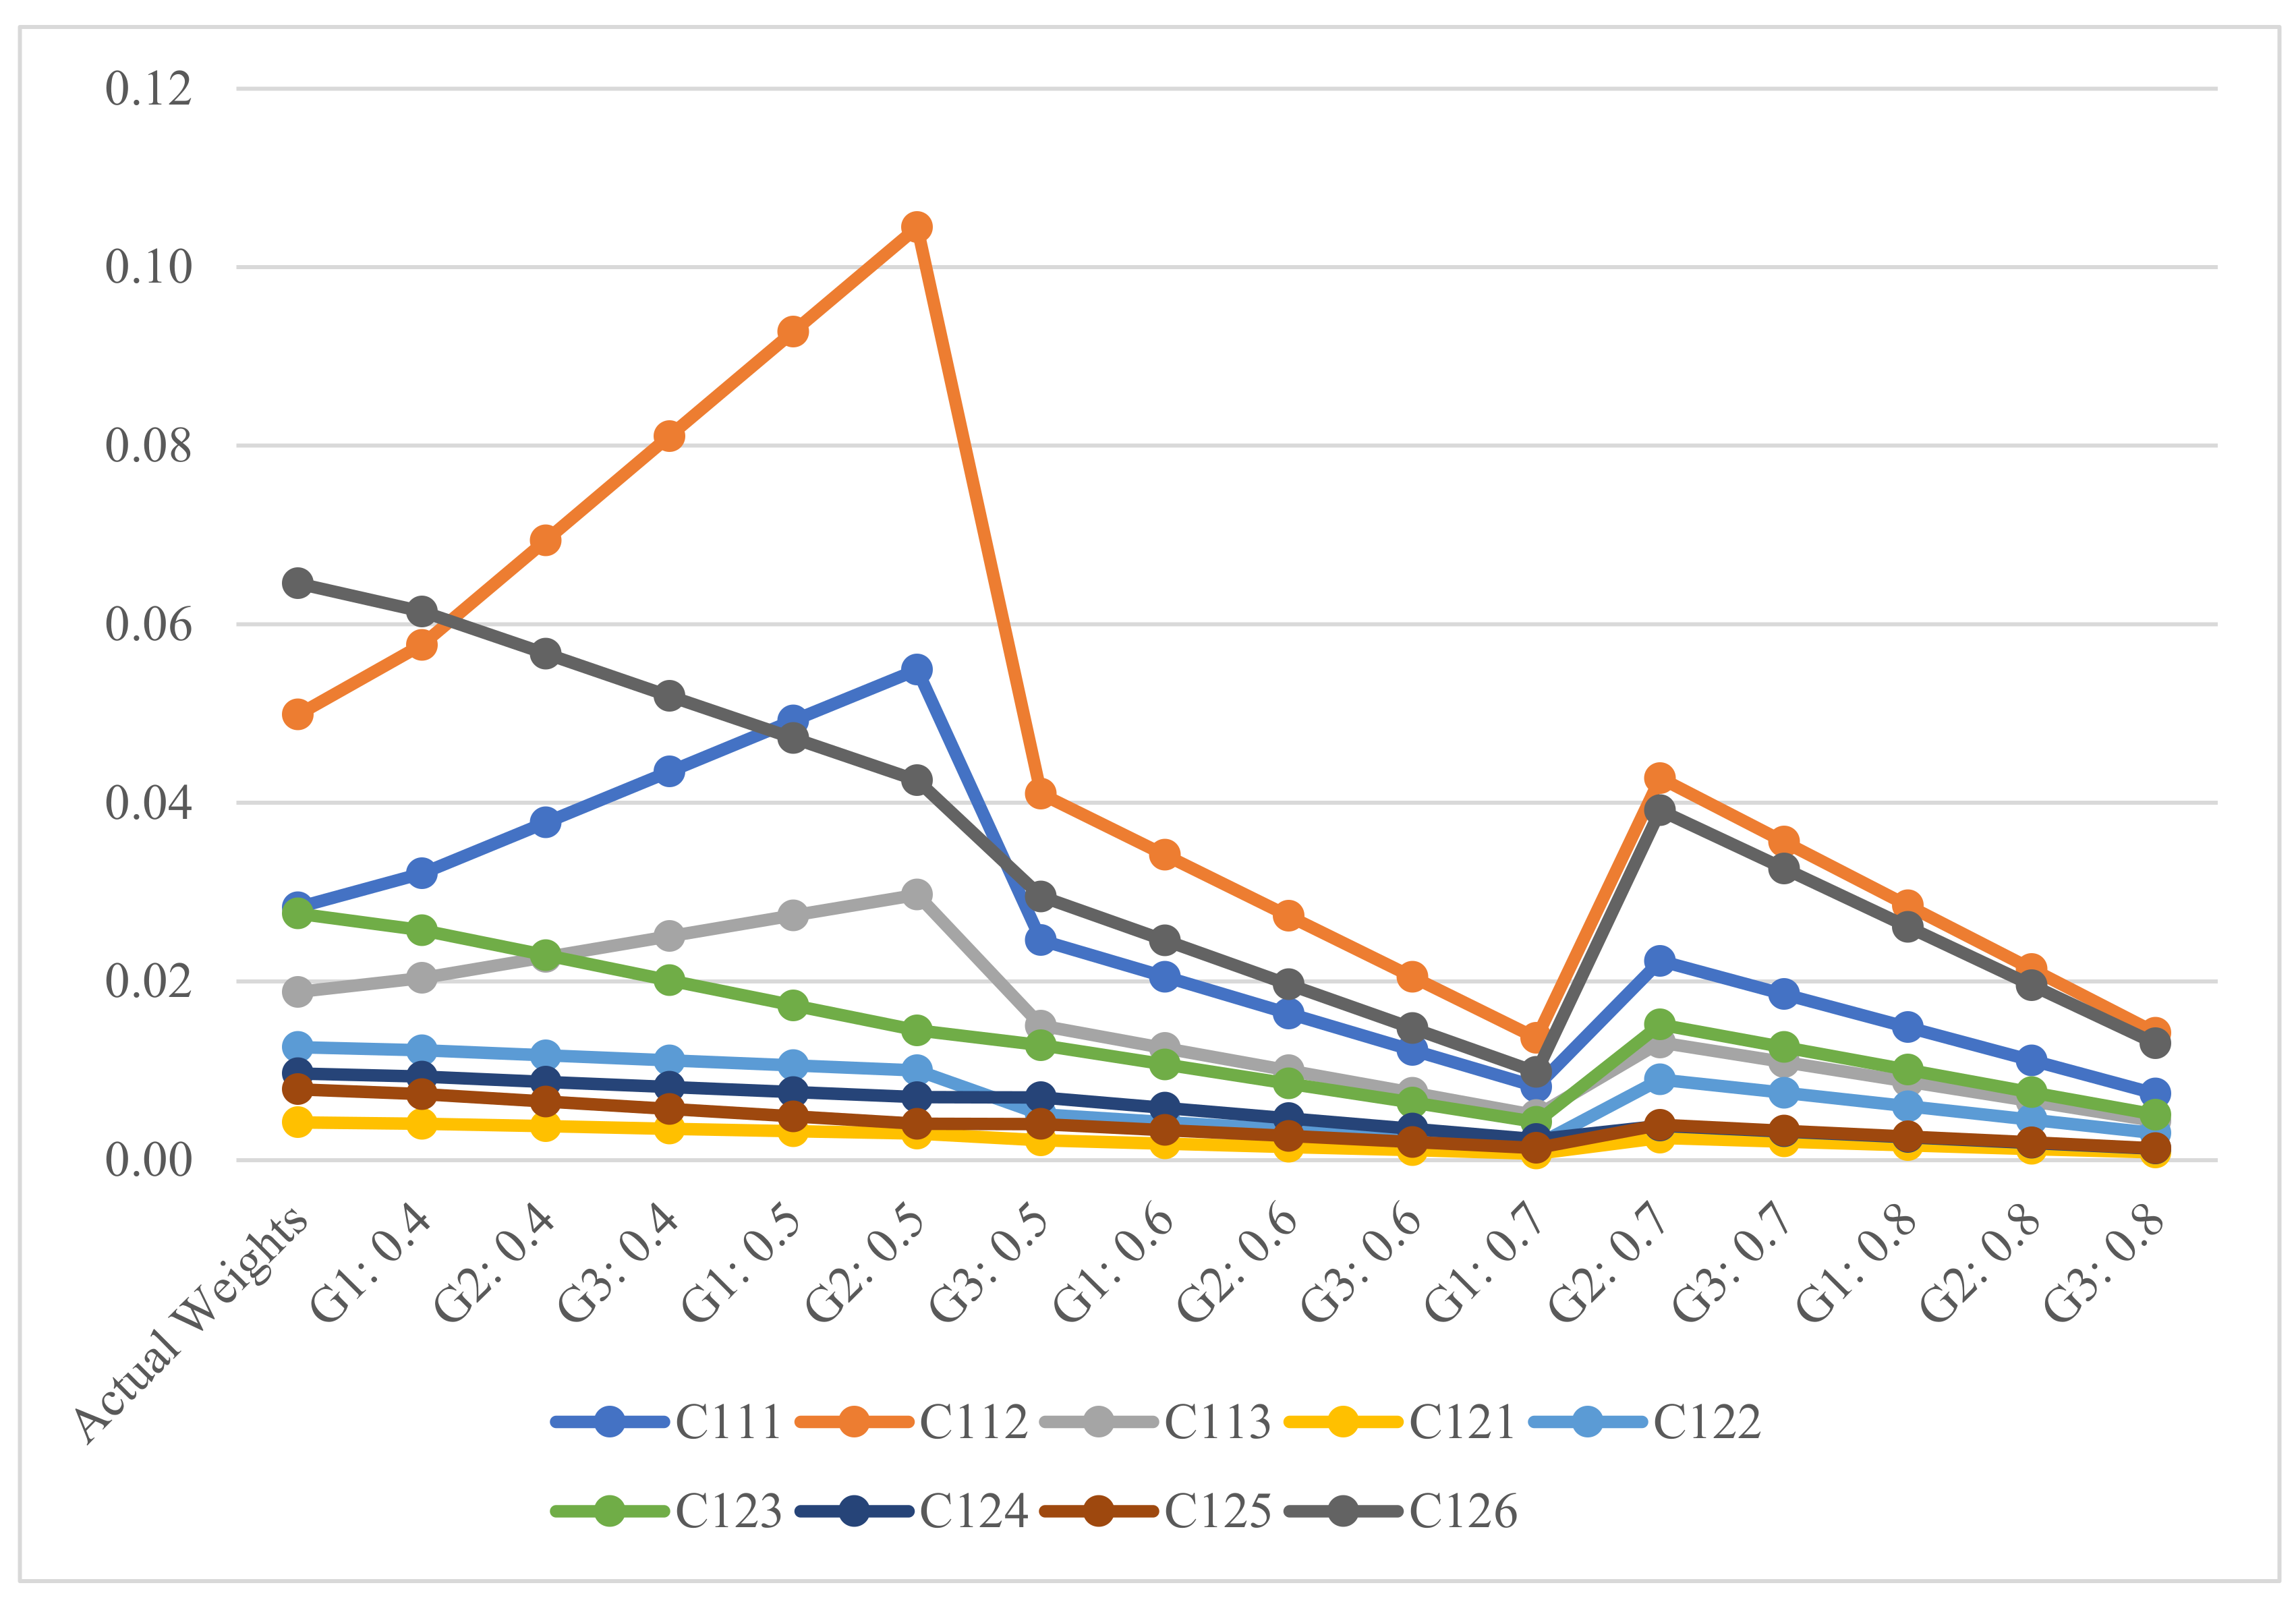
Lastly, we also check the effects of the groups for Level 3. Figure 4 presents the shifts with respect to weight changes of the groups.
In third-level analysis, since the weights are mostly less than 0.1, shifts are fewer than other levels. When the weights of the groups are increased, criterion C112 moves into first place and has the maximum weight among Level-3 criteria. The two peak points are reached when the weights of Group 2 are equal to 0.5 and 0.7. Moreover, when Group 1 and Group 2 weights are equal to 0.5, C111 moves to second rank. Since the weights of C121, C122, C124, and C125 are small values, the dominance of the groups over them is affected slightly.
Through the analyses, it is observed that all PCMs are sensitive to changes in group weights. Since the ultimate effective criteria have remained in most cases, it can be said that the result of the application is reliable against variations in main criteria weights.

5. Conclusions

The consistency and, conversely, conflicts in driver behavior factors inducing crash risk may alternate due to different driving characteristics. The PF-AHP method is a useful evaluation to overcome uncertainty of driver behavior in managing complex road safety issues. For driver group G1, application outcomes depicted ‘errors’ (C3) as the ultimate critical factor connected to road safety for Level 1 of the hierarchical model. For Level 2, the application outcomes showed ‘fail to apply brakes in road hazards’ (C33) as the ultimate critical factor, followed by ‘ordinary violations’ (C11). For Level 3, application outcomes showed ‘fail to maintain a safe gap’ (C112) as the ultimate critical factor followed by ‘fail to use personal intelligence’ (C111). For driver group G2, application outcomes showed ‘lapses’ (C2) and ‘errors’ (C3) as the ultimate critical factor connected to road safety for Level 1 of the hierarchical structure. For Level 2, application outcomes showed ‘fail to apply brakes in road hazards’ (C33) as the ultimate critical factor followed by ‘hit something that had not been seen when reversing’ (C23). For Level 3, application outcomes showed ‘drive with alcohol use’ (C126) as the utmost critical factor followed by ‘disobey traffic lights’ (C123).
For driver group G3, application outcomes showed ‘lapses’ (C2) as the most critical factor connected to road safety for Level 1 of the hierarchical model. For Level 2, application outcomes showed ‘driver inattention’ (C21) as the utmost critical factor followed by ‘hit something that had not been seen when reversing’ (C23). For Level 3, application outcomes showed ‘drive with alcohol use’ (C126) as the uttermost critical factor followed by ‘disobey traffic lights’ (C123). Based on aggregated weights, the criteria ‘lapses’ (C2) is the most critical factor connected to road safety as compared to all other specified factors. The criterion ‘disobey speed limits’ (C121) is found to be the least critical factor as compared to other observed factors. This evaluation could be valuable in making drivers aware of individual traffic risks for each country. Linkage of estimated data with traffic authorities may also assist in the implementation of effective local road safety policies.
Since our system has presented meaningful outcomes based on calculations we made, it can be a useful decision-making support technique to deal with uncertain data. Researchers and policymakers can implement our model to obtain robust outcomes that are backed by sensitivity analyses.
For further studies, data can be extended by adding new surveys from cities that have a similar social background [66]. Comparison of different data sets can enable us to extend this work to construct proactive behavioral systems. Moreover, a new section of questionnaires can be added to measure indeterminacy. As a new uncertainty characteristic needs to be overcome through the calculations, neutrosophic or hesitant sets can be applied to handle it [67,68,69] while other significant elements of the transport system, such as vehicles, road infrastructure, and the environment, should be studied dynamically for achieving sustainable development goals.

Author Contributions

Conceptualization, D.F. and S.M.; methodology, S.M.; software, S.M.; validation, D.F., S.M.; formal analysis, D.F.; investigation, S.M.; resources, D.F.; data curation, D.F.; writing—original draft preparation, D.F.; writing—review and editing, D.F.; visualization, S.M.; supervision, S.M.; project administration, D.F.; funding acquisition, S.M. All authors have read and agreed to the published version of the manuscript.

Funding

The funding is supported by the National Research Development and Innovation Fund (TKP2020 Institution Excellence Subprogram, Grant No. BME-IE-MISC).

Institutional Review Board Statement

This survey by the Department of Transport Technology and Economics at Budapest University of Technology and Economics conducts a study on ‘Estimating Driver Behavior Measures Related to Traffic Safety by Investigating 2-Dimensional Uncertain Linguistic Data—A Pythagorean Fuzzy Analytic Hierarchy Process Approach’. The principal intention of this work is to identify and rank the nominated significant factors and sub-factors influencing road safety based on participants’ answers on a specified questionnaire survey. This survey is for academic research only, does not participate in any business activity, and does not reveal any personal information. The questionnaire survey data were collected from professionals of the above-specified department through online Google forms. The motives/aims of the survey were told to respondents. They were also assured about their anonymity and the confidentiality of their responses. Their participation was absolutely voluntary, and they were not compensated in any way.

Informed Consent Statement

Not applicable.

Data Availability Statement

Please contact the corresponding author.

Acknowledgments

The authors are grateful to Ali Karaşan for his valuable help in conducting the Pythagorean Fuzzy AHP and for his supporting comments.

Conflicts of Interest

The authors declare no conflict of interest.

Appendix A

Table A1. Constructed PCMs based on Group 1 judgments.
Group 1
wrt GoalC1C2C3
C1AIAAIBAI
C2BAIAILI
C3AAIHIAI
wrt C1C11C12
C11AIHI
C12LIAI
wrt C2C21C22C23
C21AIHIAAI
C22LIAIBAI
C23BAIAAIAI
wrt C3C31C32C33
C31AIBAIVLI
C32AAIAIBAI
C33VHIAAIAI
wrt C11C111C112C113
C111AIBAIAAI
C112AAIAIHI
C113BAILIAI
wrt C12C121C122C123C124C125C126
C121AILILIBAIAICLI
C122HIAIAIAAIHILI
C123HIAIAIBAIHILI
C124AAIBAIAAIAIAAIVLI
C125AILILIBAIAICLI
C126CHIHIHIVHICHIAI
Table A2. Constructed PCMs based on Group 2 judgments.
Group 2
wrt GoalC1C2C3
C1AIBAIBAI
C2AAIAIAI
C3AAIAIAI
wrt C1C11C12
C11AIVLI
C12VHIAI
wrt C2C21C22C23
C21AIHIBAI
C22LIAIVLI
C23AAIVHIAI
wrt C3C31C32C33
C31AIAAILI
C32BAIAIVLI
C33HIVHIAI
wrt C11C111C112C113
C111AILIBAI
C112HIAIAAI
C113AAIBAIAI
wrt C12C121C122C123C124C125C126
C121AILIVLIAIBAICLI
C122HIAIBAIHIAAILI
C123VHIAAIAIHIHIBAI
C124AILILIAIBAICLI
C125AAIBAILIAAIAICLI
C126CHIHIAAICHICHIAI
Table A3. Constructed PCMs based on Group 3 judgments.
Group 3
wrt GoalC1C2C3
C1AILIAI
C2HIAIHI
C3AILIAI
wrt C1C11C12
C11AILI
C12HIAI
wrt C2C21C22C23
C21AIHIAAI
C22LIAIBAI
C23BAIAAIAI
wrt C3C31C32C33
C31AIBAIVLI
C32AAIAIBAI
C33VHIAAIAI
wrt C11C111C112C113
C111AIAAIAI
C112BAIAIBAI
C113AIAAIAI
wrt C12C121C122C123C124C125C126
C121AIBAIVLILIBAICLI
C122AAIAILIBAIBAIVLI
C123VHIHIAIAAIHIBAI
C124HIAAIBAIAIAAILI
C125AAIAAILIBAIAIVLI
C126CHIVHIAAIHIVHIAI

Appendix B

Table A4. Dependencies of the criteria.
Level-2 Criteria
C21C22C23C11C12C31C32C33
C2101000011
C2210001111
C230000s0010
C1100000000
C1201000011
C3101000011
C3211101111
C3311001111
Level-3 Criteria
C111C112C113C121C122C123C124C125C126
C111000000001
C112000000001
C113010100111
C121001011101
C122000101111
C123000010101
C124111111111
C125000001101
C126111111111

References

  1. World Health Organization (WHO). The Global Status Report on Road Safety 2018; WHO: Geneva, Switzerland, 2018. [Google Scholar]
  2. Valette, L. Road Safety: New Statistics Call for Fresh Efforts to Save Lives on EU Roads; European Commission Press Release: Brussels, Belgium, 2016. [Google Scholar]
  3. EU Commission. Road Safety Facts & Figures; EU Commission: Brussels, Belgium, 2019. [Google Scholar]
  4. OECD/ITF. Road Safety Annual Report; OECD: Paris, France, 2016. [Google Scholar]
  5. NHTSA (National Highway Traffic Safety Administration). National Motor Vehicle Crash Causation Survey; U.S. Department of Transportation: Washington, DC, USA, 2008.
  6. Lewin, I. Driver training: A perceptual-motor skill approach. Ergonomics 1982, 25, 917–924. [Google Scholar] [CrossRef] [PubMed]
  7. Rumar, K. The Role of Perceptual and Cognitive Filters in Observed Behavior. In Human Behavior and Traffic Safety; Evans, L., Schwing, R.C., Eds.; Plenum Press: New York, NY, USA, 1985; Volume 2. [Google Scholar]
  8. Juan, D.O.; Rocio, D.O.; Eboli, L.; Forciniti, C.; Mazzulla, G. How to identify the key factors that affect driver perception of accident risk, A comparison between Italian and Spanish driver behavior. Accid. Anal. Prev. 2014, 73, 225–235. [Google Scholar]
  9. Stanton, N.A.; Salmon, P.M. Human error taxonomies applied to driving: Generic driver error taxonomy and its implications for intelligent transport systems. Saf. Sci. 2009, 47, 227–237. [Google Scholar] [CrossRef]
  10. Wierwille, W.W.; Hanowski, R.J.; Hankey, J.M.; Kieliszewski, C.A.; Lee, S.E.; Medina, A.; Keisler, A.S.; Dingus, T.A. Identification and Evaluation of Driver Errors: Overview and Recommendations; Report No. FHWA-RD-02-003; US Department of Transportation, Federal Highway Administration: Washington, DC, USA, 2002.
  11. Bifulco, G.N.; Galante, F.; Pariota, L.; Russo Spena, M.; Del Gais, P. Data Collection for Traffic and Drivers’ Behavior Studies: A large-scale survey. Procedia-Soc. Behav. Sci. 2014, 111, 721–730. [Google Scholar] [CrossRef] [Green Version]
  12. Strategy for Sustainable Transport Development to 2030 Adopted with the Resolution No. 105/2009 of the Council of Ministers as of 24 September 2019 (M.P. Item1054). Available online: https://constructionmarketexperts.com/en/news/a-new-transport-development-strategy-adopted-by-the-government/ (accessed on 11 November 2020).
  13. United Nations Economic and Social Commission for Asia and the Pacific and CITYNET. Sustainable Urban Transportation Systems; United Nations Economic and Social Commission for Asia and the Pacific and CITYNET: Bangkok, Thailand, 2012. [Google Scholar]
  14. Kubler, S.; Robert, J.; Derigent, W.; Voisin, A.; Le Traon, Y. A state-of the-art survey & testbed of fuzzy AHP (FAHP) applications. Expert Syst. Appl. 2016, 65, 398–422. [Google Scholar]
  15. Gul, M.; Celik, E.; Aydin, N.; Gumus, A.T.; Guneri, A.F. A state of the art literature review of VIKOR and its fuzzy extensions on applications. Appl. Soft Comput. 2016, 46, 60–89. [Google Scholar] [CrossRef]
  16. Fera, M.; Macchiaroli, R. Appraisal of a new risk assessment model for SME. Saf. Sci. 2010, 48, 1361–1368. [Google Scholar] [CrossRef]
  17. Badri, A.; Nadeau, S.; Gbodossou, A. Proposal of a risk-factorbased analytical approach for integrating occupational health and safety into project risk evaluation. Accid. Anal. Prev. 2012, 48, 223–234. [Google Scholar] [CrossRef]
  18. Saaty, T.L. How to make a decision: The analytic hierarchy process. Eur. J. Oper. Res. 1990, 48, 9–26. [Google Scholar] [CrossRef]
  19. Wang, Y.; Yang, W.; Li, M.; Liu, X. Risk Assessment of Floor Water Inrush in Coal Mines Based on Secondary Fuzzy Comprehensive Evaluation. Int. J. Rock Mech. Min. Sci. 2012, 52, 50–55. [Google Scholar] [CrossRef]
  20. Farooq, D.; Moslem, S.; Duleba, S. Evaluation of Driver Behavior Criteria for Evolution of Sustainable Traffic Safety. Sustainability 2019, 11, 3142. [Google Scholar] [CrossRef] [Green Version]
  21. Tüysüz, F.; Kahraman, C. Project Risk Evaluation Using a Fuzzy Analytic Hierarchy Process: An Application to Information Technology Projects. Int. J. Intell. Syst. 2006, 21, 559–584. [Google Scholar] [CrossRef]
  22. Farooq, D.; Moslem, S. A fuzzy dynamical approach for examining driver behavior criteria related to road safety. In Proceedings of the IEEE Smart City Symposium, Prague, Czech Republic, 23–24 May 2019. [Google Scholar]
  23. Farooq, D.; Moslem, S.; Faisal Tufail, R.; Ghorbanzadeh, O.; Duleba, S.; Maqsoom, A.; Blaschke, T. Analyzing the Importance of Driver Behavior Criteria Related to Road Safety for Different Driving Cultures. Int. J. Environ. Res. Public Health 2020, 17, 1893. [Google Scholar] [CrossRef] [PubMed] [Green Version]
  24. Moslem, S.; Gul, M.; Farooq, D.; Celik, E.; Ghorbanzadeh, O.; Blaschke, T. An Integrated Approach of Best-Worst Method (BWM) and Triangular Fuzzy Sets for Evaluating Driver Behavior Factors Related to Road Safety. Mathematics 2020, 8, 414. [Google Scholar] [CrossRef] [Green Version]
  25. Ilbahar, E.; Karaşan, A.; Cebi, S.; Kahraman, C. A novel approach to risk assessment for occupational health and safety using Pythagorean fuzzy AHP & fuzzy inference system. Saf. Sci. 2018, 103, 124–136. [Google Scholar]
  26. Yager, R.R. Properties and Applications of Pythagorean Fuzzy Sets. Imprecision and Uncertainty in Information Representation and Processing; Springer: Cham, Switzerland, 2016; pp. 119–136. [Google Scholar]
  27. Yager, R.R. Pythagorean fuzzy subsets. In Proceedings of the Joint IFSA World Congress and NAFIPS Annual Meeting (IFSA/NAFIPS), Edmonton, AB, Canada, 24–28 June 2013; pp. 57–61. [Google Scholar]
  28. Atanassov, K.T. Intuitionistic Fuzzy Sets: Theory and Applications; Physica: New York, NY, USA, 1999. [Google Scholar]
  29. Zhang, X.; Xu, Z. Extension of TOPSIS to multiple criteria decision making with Pythagorean fuzzy sets. Int. J. Intell. Syst. 2014, 29, 1061–1078. [Google Scholar] [CrossRef]
  30. Zhang, X. Multicriteria Pythagorean fuzzy decision analysis: A hierarchical QUALIFLEX approach with the closeness index-based ranking methods. Inf. Sci. 2016, 330, 104–124. [Google Scholar] [CrossRef]
  31. Garg, H. A New Generalized Pythagorean Fuzzy Information Aggregation Using Einstein Operations and It’s application to Decision Making. Int. J. Intell. Syst. 2016, 33, 886–920. [Google Scholar] [CrossRef]
  32. Saaty, T.L. Decision making with the analytic hierarchy process. Int. J. Serv. Sci. 2008, 1, 83–98. [Google Scholar] [CrossRef] [Green Version]
  33. Af Wåhlberg, A.; Dorn, L.; Kline, T. The Manchester driver behavior questionnaire as a predictor of road traffic accidents. Theor. Issues Ergon. Sci. 2011, 12, 66–86. [Google Scholar] [CrossRef] [Green Version]
  34. Winter, J.C.F.; Dodou, D. The Driver Behavior Questionnaire as a predictor of accidents: A meta-analysis. J. Saf. Res. 2010, 41, 463–470. [Google Scholar] [CrossRef] [PubMed]
  35. Parker, D.; Reason, J.T.; Manstead, A.S.R.; Stradling, S. Driving errors, driving violations and accident involvement. Ergonomics 1995, 38, 1036–1048. [Google Scholar] [CrossRef] [PubMed]
  36. Karlaftis, M.G.; Golias, I. Effects of road geometry and traffic volumes on rural roadway accident rates. Accid. Anal. Prev. 2002, 34, 357–365. [Google Scholar] [CrossRef]
  37. Bener, A.; Crundall, D. Effects of driver behavior on accident involvement: The role of gender and driver behavior in Road Traffic Crashes. Int. J. Crashworthiness 2008, 13, 331–336. [Google Scholar] [CrossRef]
  38. Solomon, M. Groupthink versus “The wisdom of the crowds”: The social epistemology deliberation and dissent. South. J. Philos. 2006, 44, 28–42. [Google Scholar] [CrossRef]
  39. Reason, J.T.; Manstead, A.S.R.; Stradling, S.; Baxter, J.; Campbell, K. Errors and violations on the roads. Ergonomics 1990, 33, 1315–1332. [Google Scholar] [CrossRef]
  40. Lajunen, T.; Parker, D.; Summala, H. The Manchester Driver Behavior Questionnaire: A cross-cultural study. Accid. Anal. Prev. 2004, 36, 231–238. [Google Scholar] [CrossRef]
  41. Lawton, R.; Parker, D.; Stradling, S.G.; Manstead, A.S.R. Predicting road traffic accidents: The role of social deviance and violations. Br. J. Psychol. 1997, 88, 249–262. [Google Scholar] [CrossRef]
  42. Bener, A.; Ozkan, T.; Lajunen, T. The Driver Behavior Questionnaire in Arab Gulf countries: Qatar and United Arab Emirates. Accid. Anal. Prev. 2008, 40, 1411–1417. [Google Scholar] [CrossRef]
  43. Martinussen, L.M.; Hakamies-Blomqvist, L.; Møller, M.; Özkan, T.; Lajunen, T. Age, gender, mileageand the DBQ: The validity of the Driver Behavior Questionnaire in different driver groups. Accid. Anal. Prev. 2013, 52, 228–236. [Google Scholar] [CrossRef] [Green Version]
  44. Stradling, S.G.; Meadows, M.L.; Beatty, S. Driving as part of your work may damage your health. Behav. Res. Road Saf. 2000, IX, 1–9. [Google Scholar]
  45. Bener, A.; Al Maadid, M.G.; Özkan, T.; Al-Bast, D.A.; Diyab, K.N.; Lajunen, T. The impact of four-wheel drive on risky driver behaviours and road traffic accidents. Transp. Res. Part F Traffic Psychol. Behav. 2008, 11, 324–333. [Google Scholar] [CrossRef]
  46. Rowe, R.; Roman, G.D.; Mckenna, F.P.; Barker, E.; Poulter, D. Measuring errors and violations on the road: A bifactor modeling approach to the Driver Behavior Questionnaire. Accid. Anal. Prev. 2014, 74, 118–125. [Google Scholar] [CrossRef] [PubMed] [Green Version]
  47. Klauer, S.G.; Dingus, T.A.; Neale, V.L.; Sudweeks, J.D.; Ramsey, D.J. The Impact of Driver Inattention on Near Crash/Crash Risk: An Analysis Using the 100-Car Naturalistic Driving Study Data; Report No: DOT-HS-810-594; National Highway Traffic Safety Administration: Washington, DC, USA, 2006.
  48. Stradling, S.G.; Parker, D.; Lajunen, T.; Meadows, M.L.; Xiel, C.Q. Normal behavior and traffic safety: Violations, errors, lapses and crashes. In Transportation. Traffic Safety and Health—Human Behavior; Springer: Berlin/Heidelberg, Germany, 2000; pp. 279–295. [Google Scholar]
  49. Bener, A.; Verjee, M.; Dafeeah, E.E.; Yousafzai, M.T.; Mari, S.; Hassib, A.; Al-Khatib, H.; Choi, M.K.; Nema, N.; Özkan, T.; et al. A Cross “Ethnical” Comparison of the Driver Behaviour Questionnaire (DBQ) in an Economically Fast Developing Country. Glob. J. Health Sci. 2013, 5, 165. [Google Scholar] [CrossRef] [PubMed] [Green Version]
  50. ACEM. In-Depth Investigations of Accidents Involving Powered Two Wheelers; Avenue de la Joyeuse Entrée 1–1040, Report number 2; ACEM: Brussels, Belgium, 2004. [Google Scholar]
  51. Pradhan, A.K.; Li, K.; Bingham, C.R.; Simons-Morton, B.G.; Ouimet, M.C.; Shope, J.T. Peer Passenger Influences on Male Adolescent Drivers’ Visual Scanning Behavior during Simulated Driving. J. Adolesc. Health 2014, 54, S42–S49. [Google Scholar] [CrossRef] [Green Version]
  52. Bella, F.; Silvestri, M. Effects of safety measures on driver’s speed behavior at pedestrian crossings. Accid. Anal. Prev. 2015, 83, 111–124. [Google Scholar] [CrossRef]
  53. Khorasani, G.; Tatari, A.; Yadollahi, A.; Rahimi, M. Evaluation of Intelligent Transport System in Road Safety. Int. J. Chem. Environ. Biol. Sci. (IJCEBS) 2013, 1, 110–118. [Google Scholar]
  54. Niezgoda, M.; Kamiski, T.; Kruszewski, M. Measuring Driver Behaviour—Indicators for Traffic Safety. J. KONES Powertrain Transp. 2012, 19, 503–511. [Google Scholar] [CrossRef]
  55. Park, H.; Oh, C.; Moon, J. Real-Time Estimation of Lane Change Risks Based on the Analysis of Individual Vehicle Interactions. Transp. Res. Rec. J. Transp. Res. Board 2018, 2672, 39–50. [Google Scholar] [CrossRef]
  56. Hassan, H.M.; Shawky, M.; Kishta, M.; Garib, A.M.; Al-Harthei, H.A. Investigation of drivers’ behavior towards speeds using crash data and self-reported questionnaire. Accid. Anal. Prev. 2017, 98, 348–358. [Google Scholar] [CrossRef]
  57. Subramaniam, K.; Phang, W.K.; Hayati, K.S. Traffic light violation among motorists in Malaysia. IATSS Res. 2007, 31, 67–73. [Google Scholar]
  58. Goldenbeld, C. Increasing Traffic Fines; SWOV, Institute for Road Safety Research: The Hague, The Netherlands, 2017. [Google Scholar]
  59. Walker, I. Drivers overtaking bicyclists: Objective data on the effects of riding position, helmet use, vehicle type and apparent gender. Accid. Anal. Prev. 2007, 39, 417–425. [Google Scholar] [CrossRef] [PubMed]
  60. Arnedt, A.; Wilde, W.; Munt, M.; Maclean, M. Simulated driving performance following prolonged wakefulness and alcohol consumption: Separate and combined contributions to impairment. J. Sleep Res. 2000, 9, 233–241. [Google Scholar] [CrossRef] [PubMed]
  61. Gras, M.E.; Sullman, M.J.; Cunill, M.; Planes, M.; Aymerich, M.; Font-Mayolas, S. Spanish drivers and their aberrant driving behaviours. Transp. Part F Traffic Psychol. Behav. 2006, 9, 129–137. [Google Scholar] [CrossRef]
  62. Farooq, D.; Juhasz, J. Simulation-Based Analysis of the Effect of Significant Traffic Parameters on Lane Changing for Driving Logic “Cautious” on a Freeway. Sustainability 2019, 11, 5976. [Google Scholar] [CrossRef] [Green Version]
  63. Chen, T.-Y.; Tsui, C.-W. Optimism and Pessimism in decision making based on intuitionistic Fuzzy sets. In Proceedings of the 11th Joint Conference on Information Sciences; Atlantis Press: Paris, France, 2008. [Google Scholar]
  64. Friedman, L.; Weinberg, A.; Webb, J.; Cooper, H.; Bruce, S. Skin Cancer Prevention and Early Detection Intentions and Behavior. Am. J. Prev. Med. 1995, 11, 59–65. [Google Scholar] [CrossRef]
  65. Puri, M.; Robinson, D.T. Optimism and Economic Choice. J. Financ. Econ. 2007, 86, 71–99. [Google Scholar] [CrossRef] [Green Version]
  66. Esztergár-Kiss, D.; Lizarraga, J.C.L. Exploring user requirements and service features of e-micromobility in five European cities. Case Stud. Transp. Policy 2021, 9, 1531–1541. [Google Scholar] [CrossRef]
  67. Karaşan, A.; Kaya, İ.; Erdoğan, M.; Çolak, M. A multicriteria decision making methodology based on two-dimensional uncertainty by hesitant Z-fuzzy linguistic terms with an application for blockchain risk evaluation. Appl. Soft Comput. 2021, 113, 108014. [Google Scholar] [CrossRef]
  68. Karaşan, A.; Kahraman, C. A novel intuitionistic fuzzy DEMATEL–ANP–TOPSIS integrated methodology for freight village location selection. J. Intell. Fuzzy Syst. 2019, 36, 1335–1352. [Google Scholar] [CrossRef]
  69. Karasan, A.; Erdogan, M.; Ilbahar, E. Prioritization of production strategies of a manufacturing plant by using an integrated intuitionistic fuzzy AHP & TOPSIS approach. J. Enterp. Inf. Manag. 2018, 31, 510–528. [Google Scholar]
Figure 1. Driver behavior model [20].
Sustainability 14 01881 g001
Figure 2. Weights of Level-1 criteria with respect to changes.
Sustainability 14 01881 g002
Figure 3. Weights of Level-2 criteria with respect to changes.
Sustainability 14 01881 g003
Figure 4. Weights of Level-3 criteria with respect to changes.
Sustainability 14 01881 g004
Table 2. Sample features of evaluators [32].
VariablesGroup G1Group G2Group G3
N353535
Age
Mean32.24638.27421.635
SD5.6413.6722.737
Sex (1 = male, 0 = female)
Mean1.00.8830.785
SD0.00.3530.317
Driving Experience
Mean3.52317.3261.852
SD2.7212.7141.041
Driver Occupation
(1 = job, 0 = student)
Mean0.9121.00.361
SD0.5420.00.648
Table 3. Presentation of driver behavior factors and abbreviations [20].
Driver Behavior FactorsImportance for Road Safety
Level 1Violations (C1)Road Traffic Violations (RTVs) are the most serious, posing definite risk to other road users [44]
Lapses (C2)Lapses were observed as a predictor in crash involvement among other predictors in Qatar-based research [45]
Errors (C3)It has been noticed that both driving error and driving style are correlates of crash involvement [34]
Level 2Ordinary violations (C11)Previous study results observed the significance of ordinary violations as a correlation to accident involvement [34]
Aggressive violations (C12)Aggressive violations were found in critical correlation with crash involvement but alongside strong connection with ordinary violations [46]
Driver inattention (C21)Klauer et al. (2006) estimated that approximately 25–30% of traffic conflicts are associated with driver inattention, but argued that the true involvement of inattention may be as high 70% [47]
Pull away from traffic lights in wrong gear (C22)A UK-based study flagged “pull away from traffic lights in wrong gear” as aberrant driver behavior [48]
Hit something that hadn’t been seen when reversing (C23)“Hit something that hadn’t been seen when reversing” was measured highest with one other factor in factor analysis [49]
Visual perception failure (C31)Perception failure (both on the part of the rider and other road users) was inspected as the most typical factor in road crashes [50]
Visual scan wrongly (C32)Wide visual scanning is a significant component of safe driving [51]
Fail to apply brakes in road hazards (C33)“Hazard-based duration model” was introduced to examine the effects related to vehicle dynamic variables on driver’s braking behavior [52]
Level 3Fail to use personal intelligence (C111)Intelligent transport system is facilitating a change in safety concentration to decrease the incidence of crashes [53]
Fail to maintain safe gap (C112)Gap acceptance was noticed as one of the most significant factors related to traffic safety at intersections [54]
Frequently changing lanes (C113)Risk exposure level specifies how long a subject vehicle is exposed to risky conditions that could probably lead to a crash while changing lanes [55]
Disobey speed limits (C121)Speeding is one of the most common and critical aberrant driving behaviors that negatively influence the safety of the violators themselves and the rest of the motorized public [56]
Fail to yield to pedestrians (C122)In terms of involving factors, 14.2% fatalities were attributed to failure to yield right of way at crossings [5]
Disobey traffic lights (C123)One of the most likely reasons for the high number of road crashes and injuries is due to beating traffic lights [57]
No deterrence punishment (C124)A 2016 meta-analysis specified that fine increases between 50% and 100% are related to a 15% decrease in traffic violations [58]
Disobey overtaking rules (C125)It was found that dangerous overtaking accounted for 41% of all drivers who died in traffic in 2006 [59]
Drive with alcohol use (C126)Even with a small amount of alcohol consumption, drivers are twice as likely to be involved in a traffic collision than when sober [60]
Table 4. Converted PCM for consistency procedure.
wrt GoalC1C2C3
C1130.33
C20.3310.2
C3351
Table 5. R ˜ = r ˜ i j 3 × 3 matrix of the comparison.
wrt GoalC1C2C3
C1<[0.4, 0.55], [0.4, 0.55]><[0.5, 0.65], [0.3, 0.45]><[0.45, 0.3], [0.45, 0.5]>
C2<[0.3, 0.45], [0.5, 0.65]><[0.4, 0.55], [0.4, 0.55]><[0.2, 0.35], [0.6, 0.75]>
C3<[0.5, 0.65], [0.3, 0.45]><[0.6, 0.75], [0.2, 0.35]><[0.4, 0.55], [0.4, 0.55]>
Table 6. Difference matrix of the comparison.
wrt GoalC1C2C3
C1(−0.143, 0.143)(0.048, 0.333)(−0.333, −0.048)
C2(−0.333, −0.048)(−0.143, 0.143)(−0.523, −0.238)
C3(0.048, 0.333)(0.238, 0.523)(−0.143, 0.143)
Table 7. IMM of the difference matrix.
wrt GoalC1C2C3
C1(0.611, 1.636)(1.178, 3.153)(0.317, 0.849)
C2(0.317, 0.849)(0.611, 1.636)(0.165, 0.44)
C3(1.178, 3.153)(2.271, 6.078)(0.611, 1.636)
Table 8. Matrix of weights.
CriterionWeight
C12.77
C21.44
C35.34
Sum9.54
Table 9. Weights of the main criteria based on Group 1 judgments.
C10.29
C20.15
C30.56
Table 10. Outcomes of the application.
G1G2G3Aggregated Weight
CriterionLocal WeightGlobal WeightCriterionLocal WeightGlobal WeightCriterionLocal WeightGlobal WeightCriterionFinal Weight
C10.2900.290C10.2060.206C10.1750.175C10.224
C20.1510.151C20.3970.397C20.6500.650C20.399
C30.5590.559C30.3970.397C30.1750.175C30.377
C110.7880.229C110.1230.025C110.2120.037C110.097
C120.2120.062C120.8770.181C120.7880.138C120.127
C1110.2900.066C1110.1510.004C1110.3970.015C1110.028
C1120.5590.128C1120.5590.014C1120.2060.008C1120.050
C1130.1510.034C1130.2900.007C1130.3970.015C1130.019
C1210.0390.002C1210.0310.006C1210.0340.005C1210.004
C1220.1450.009C1220.1170.021C1220.0580.008C1220.013
C1230.1450.009C1230.2250.041C1230.2410.033C1230.028
C1240.0950.006C1240.0330.006C1240.1250.017C1240.010
C1250.0390.002C1250.0590.011C1250.0780.011C1250.008
C1260.5370.033C1260.5350.097C1260.4640.064C1260.065
C210.5590.084C210.3130.124C210.5590.364C210.191
C220.1510.023C220.0840.033C220.1510.098C220.051
C230.2900.044C230.6030.239C230.2900.189C230.157
C310.1090.061C310.1910.076C310.1090.019C310.052
C320.2270.127C320.0990.039C320.2270.040C320.069
C330.6640.371C330.7100.282C330.6640.116C330.256
Table 11. Weights of the Level-2 criteria based on the constructed network.
CriteriaWeight
C210.54
C220.42
C230.04
C310.09
C320.21
C330.7
Table 12. Weights of the Level-2 criteria based on the constructed network.
CriteriaWeight
C1110.24
C1120.5
C1130.26
C1210.02
C1220.06
C1230.09
C1240.08
C1250.03
C1260.72
Table 13. Sensitivity analysis pattern.
Weight of the Dominance GroupIn Case of G1 is Dominant and Other Groups Are Equal WeightedIn Case of G2 is Dominant and Other Groups Are Equal WeightedIn Case of G3 is Dominant and Other Groups Are Equal Weighted
Obtained Weights of the Criteria
0.4New weights of the criteria
0.5
0.6
0.7
0.8
Publisher’s Note: MDPI stays neutral with regard to jurisdictional claims in published maps and institutional affiliations.

