
Feasibility Analysis of Promoting Wind and Solar Energy in Texas Farms


Mechanical and Industrial Engineering Department, Texas A&M University-Kingsville, Kingsville, TX 78363, USA
*
Author to whom correspondence should be addressed.
Sustainability 2022, 14(4), 2222; https://0-doi-org.brum.beds.ac.uk/10.3390/su14042222
Submission received: 30 December 2021
/
Revised: 4 February 2022
/
Accepted: 10 February 2022
/
Published: 15 February 2022
(This article belongs to the Special Issue Feature Papers in Energy Sustainability)
Abstract
:Since the 1970s, agricultural lands have served as useful locations for the installation of renewable energy generators, such as wind turbines, photovoltaic modules, biodigesters, and others. Likewise, agriculture is one of the five industries with the highest annual energy consumption in the US. Energy is a vital component in farms’ daily activities, which is involved in the harvesting of crops and the growth of livestock. Due to the current rapidly growing energy consumption trends, renewable energy sources have become a potential solution for energy generation. This paper focuses on the feasibility analysis of promoting the utilization of solar and wind energy generation to provide power for the operational activities involved in diverse agricultural processes through the performance of a geospatial analysis and an in-depth numerical analysis to study the patterns in the estimation of energy potential across the 254 counties located in the state of Texas. Furthermore, different patterns surrounding the thousand farms are analyzed, such as the distance to the largest cities and the location of heavily populated areas with higher energy potential. The results show that farms in several regions in Texas have significant potential to utilize wind and solar energy for their farm operations, and to supply electricity to the nearby population.
1. Introduction
As an essential component of human life in the delivery of basic needs and the performance of daily activities, energy has become a vital resource for all societies [1]. Likewise, it is one of the main drivers in the economic, social, and technological growth of any nation [2]. Since the 1950s, electricity consumption in the US has increased by ten times [3]. Moreover, due to the continuous rise in the demand for food and the significance of agriculture in US trade, it is expected that agriculture will play a greater role in the future US economy [4]. Due to the current environmental concerns regarding traditional energy resources, renewable energy sources are becoming viable options for on-farm energy generation.
Energy is a necessary input for the proper operation of farming practices. It is needed for the harvesting of crops, the growth of livestock, and the simplification of human labor [5]. As an example, direct energy applications in agriculture are involved in the powering up of equipment, the fueling up of machinery, and for temperature regulation purposes for buildings or crops. Furthermore, it is indirectly employed in irrigation and fertilizers. In fact, agriculture ranks as the fourth largest industry in terms of annual energy consumption in the US [6]. In 2011, the Food and Agriculture Organization of the United Nations (FAO) reported that the food sector accounts for 30% of global energy consumption [7]. In 2014, the electricity consumption for agricultural purposes was estimated to be over 1700 trillion Btus of energy in the US [7]. Although energy consumption expenses in farms vary according to the size of the farms and the type of farming activities they focus on, the average total farm energy expenses compose about 13% of the total expenditure of farms [8]. In addition, the increasing trends in the demand for food and the forecasting of the population for the next several decades will significantly increase the demand for energy to be utilized for agricultural purposes. The FAO estimates that the world population will grow by a third, and will reach 9.1 billion by 2050, which presents the agricultural sector with its main challenge, i.e., adapting to the steady, growing demand for food while reducing its energy dependence on fossil fuels in order to achieve sustainability [7].
The US Department of Agriculture defines the concept of a “farm” as any place that produces or sells agricultural products of at least $1000 a year [9]. In the US, there are 2,042,220 farms based on the reports of the 2017 US Census of Agriculture. Approximately 127 million acres of land (about twice the area of Alaska) are destined for agricultural purposes. Moreover, agriculture and its related industries contributed $1.109 trillion to the US economy in 2019 [9]. Over the last few years, increasing energy prices, access to electrical grids, energy regulations, the capacities of energy generators, and profit margins have been some of the concerns in the agriculture sector that have forced the consideration and expansion of on-farm energy sites [10]. The potential of agricultural lands and the availability of renewable sources of energy in most of these areas makes agricultural fields a suitable candidate for the creation of an equilibrium between energy and agriculture. The employment of such energy for self-practices in agriculture and the installation of renewable energy devices in agricultural lands are necessary in order to decrease pollution levels. Therefore, on-farm generation sites of wind and solar energy have become more prevalent across the US, especially during the last two decades. In 2012, 52,000 farms were reported to utilize renewable energy in their daily activities. The latest US Census of Agriculture indicated that 6.5% of farms (about 133,000) employ some type of renewable energy for their daily operations. The number of on-farm generation sites doubled in a period of five years [11].
Nowadays, the renewable energy sources employed in farming practices are more diverse. Farmers can obtain their own energy from wind, solar, hydroelectric, geothermal, and biomass systems. Correspondingly, on-farm energy generation brings farmers the advantages of monetary earnings, energy independence, energy security, the diminishment of energy-related costs, and the reduction of greenhouse gas pollution [12]. Furthermore, these improvements in energy effectiveness have been reported to increase the production efficiency between farmers [10].
Some of the first renewable energy sources used in agriculture were solar and wind energy. Their earliest applications in this sector were employed in the improvement of agricultural practices through the pumping of water and the grinding of seeds, or for heating purposes for food production [13]. Although the first prototypes of wind turbines were common in rural areas of the United States in the beginning of the twentieth century, the incorporation of electrical systems caused the disappearance of these devices [13]. About a century later, renewable energies have risen as a possible solution to counter the continuously growing energy demand and the pollution from the non-renewable energy sources employed in the field. Texas is the state that produces, in the commercial sector, the most wind energy, and it ranks second in solar energy in the nation [14,15]. Although more than 80% of its land is used for agricultural purposes, the Energy Investment Report from the USDA—which contains the information for the multiple renewable energy programs and projects in agriculture—reflects that Texas has a lower level of investments compared to other states [16]. According to the report, Texas is one of the states with a higher number of investments of renewable energy in agriculture, with a total of $89,123,964 in solar energy developments. However, there exists an enormous difference between some other states like North Carolina ($1,345,903,208), South Carolina ($359,870,351), and Oregon ($280,916,920). Up to this point, there are no clear factors that could explain the smaller number of renewable energy investments in the state’s agricultural sector.
The implementation and feasibility of renewable energy in agriculture may still be considered to be uncertain when compared to traditional methods of energy obtention. However, the only possible path to an effective implementation of these clean sources of energy is through a proper evaluation to determine the potential of these energies. This paper focuses on promoting the utilization of solar and wind energy generation to power the operational activities involved in diverse agricultural processes, the harvesting of crops, and the growth of livestock through the performance of a technical feasibility analysis to study the patterns involved in the estimation of wind and solar energy potential in areas across the state of Texas. Moreover, this research seeks to address the issue of finding the most suitable regions in Texas that reflect optimal wind or solar energy potential levels based on the meteorological and physical factors surrounding the area. The proper identification of those regions will allow us to accurately target the areas in which to promote the implementation of renewable energy in agriculture. Due to the extent and great importance of agriculture in a state like Texas, it is pertinent to start promoting sustainable practices for the use of wind and solar energy as sources of on-farm energy generation, which could also facilitate the transition to a wider use of renewable energies in society. Likewise, the methodologies employed in this analysis are not solely limited to our region of study but can also be further developed and applied in any other locations through the application of geo-spatial data and software packages. In addition, the current trends and increasing popularity of GIS will allow the utilization of similar methods to analyze detailed and more complex data that can be employed for future research in the field.
2. Methods
Agriculture is a key component in a nation’s economy, and a significant contributor to its gross domestic product. For this study, the state of Texas was selected for the performance of a feasibility analysis to evaluate wind and solar power potential, and the benefits of its implementation in agriculture. Primarily, due to being considered a top agricultural state in the US, Texas farms are important regarding the economic reliance on the agriculture industry, their strategic location, the number of farms, and the cultural significance of such practices. Likewise, about 86% of the total area in Texas is destined for agricultural purposes [13,14]. In this project, the wind and solar energy potential of more than 248,000 farms and ranches located across the 254 counties in Texas were estimated by performing a geospatial and numerical analysis.
For this analysis, the primary source consulted was the 2017 US Census of Agriculture from the United States Department of Agriculture [11]. The Census of Agriculture compiles the necessary information regarding farms and ranches in every county across the United States, along with their unique characteristics, such as land use, land size, crops and plants, livestock, economics, expenses and revenues, ownership, and production practices. Moreover, it provides a further insight into the American agriculture industry through maps and statistics from across the fifty states every five years.
In order to provide a further overview and achieve a better understanding of the state of Texas, information regarding farm patterns were studied. The study of patterns surrounding the thousands of farms in Texas consisted of the performance of a geospatial and numerical analysis for the correlation of data. Employing GIS methodologies, data were plotted for the 248,416 farms based on the reports from the most recent Census of Agriculture. The geospatial analysis was performed using multiple toolsets offered by ArcMap, such as spatial join, distance, intersection, and statistical analysis, among others.
Although the total number of farms reported for each county was used for this research, the information regarding the exact location of each farm or ranch was not provided in the dataset. However, for display purposes, the locations were estimated throughout the boundaries of the counties they belong to. The raw data were plotted in the GIS software, ArcMap, using the “Random Point” tool, which assigns a location to every point representing a farm that would spatially fall in one of the counties after performing a spatial join between this data and the Texas shapefile.
In the same degree, data for the solar and wind energy potential in Texas were obtained from the database “Solar Resource Data and Tools” from the National Renewable Energy Laboratory (NREL). Based on the Annual Average solar Radiation datasets, the solar energy potential was estimated by calculating the energy output using one selected photovoltaic module, using Equation (1).
where, E = energy (kWh), PR = performance ratio, H = annual average solar radiation (W/m2), r = photovoltaic module efficiency, and A = total photovoltaic module area (m2).
E = A*r*H*PR
The chosen photovoltaic module was the Canadian Solar BiHiKu CS3W-395PB-AG 395w Bifacial Poly Photovoltaic Module. Likewise, the performance ratio (PR) of the photovoltaic module was assumed to be 98% during the first year, and gradually decreased by 0.45% every year afterward. The photovoltaic module efficiency (r) was provided by the photovoltaic module manufacturer; its module efficiency is known to be 17.68%. Moreover, the photovoltaic module has a total area of 2.23 m2. Finally, the values for the annual average solar radiation were determined using the interpolation tool in ArcMap. Consequently, the values present some variation across the different regions. The results are summarized in Figure 1, which shows the availability of wind and solar energy potential in Texas.
On the other hand, the calculations for the wind energy potential consisted of two calculations for realistic and ideal energy output. Nevertheless, only realistic calculations were considered for the estimation of the wind energy potential. The selected wind turbine for these calculations was the Aeronautica AW47-500 series. Monthly and annual average wind data were obtained from the University of Texas GeoData Libraries, and were published by the NASA Langley Atmospheric Sciences Data Center [15]. The shapefile contains information for the wind speed at 50 m between 1983 and 1993. In ArcMap, the average wind speeds for each of the 254 counties were estimated through interpolation and the power table provided by the turbine’s manufacturer.
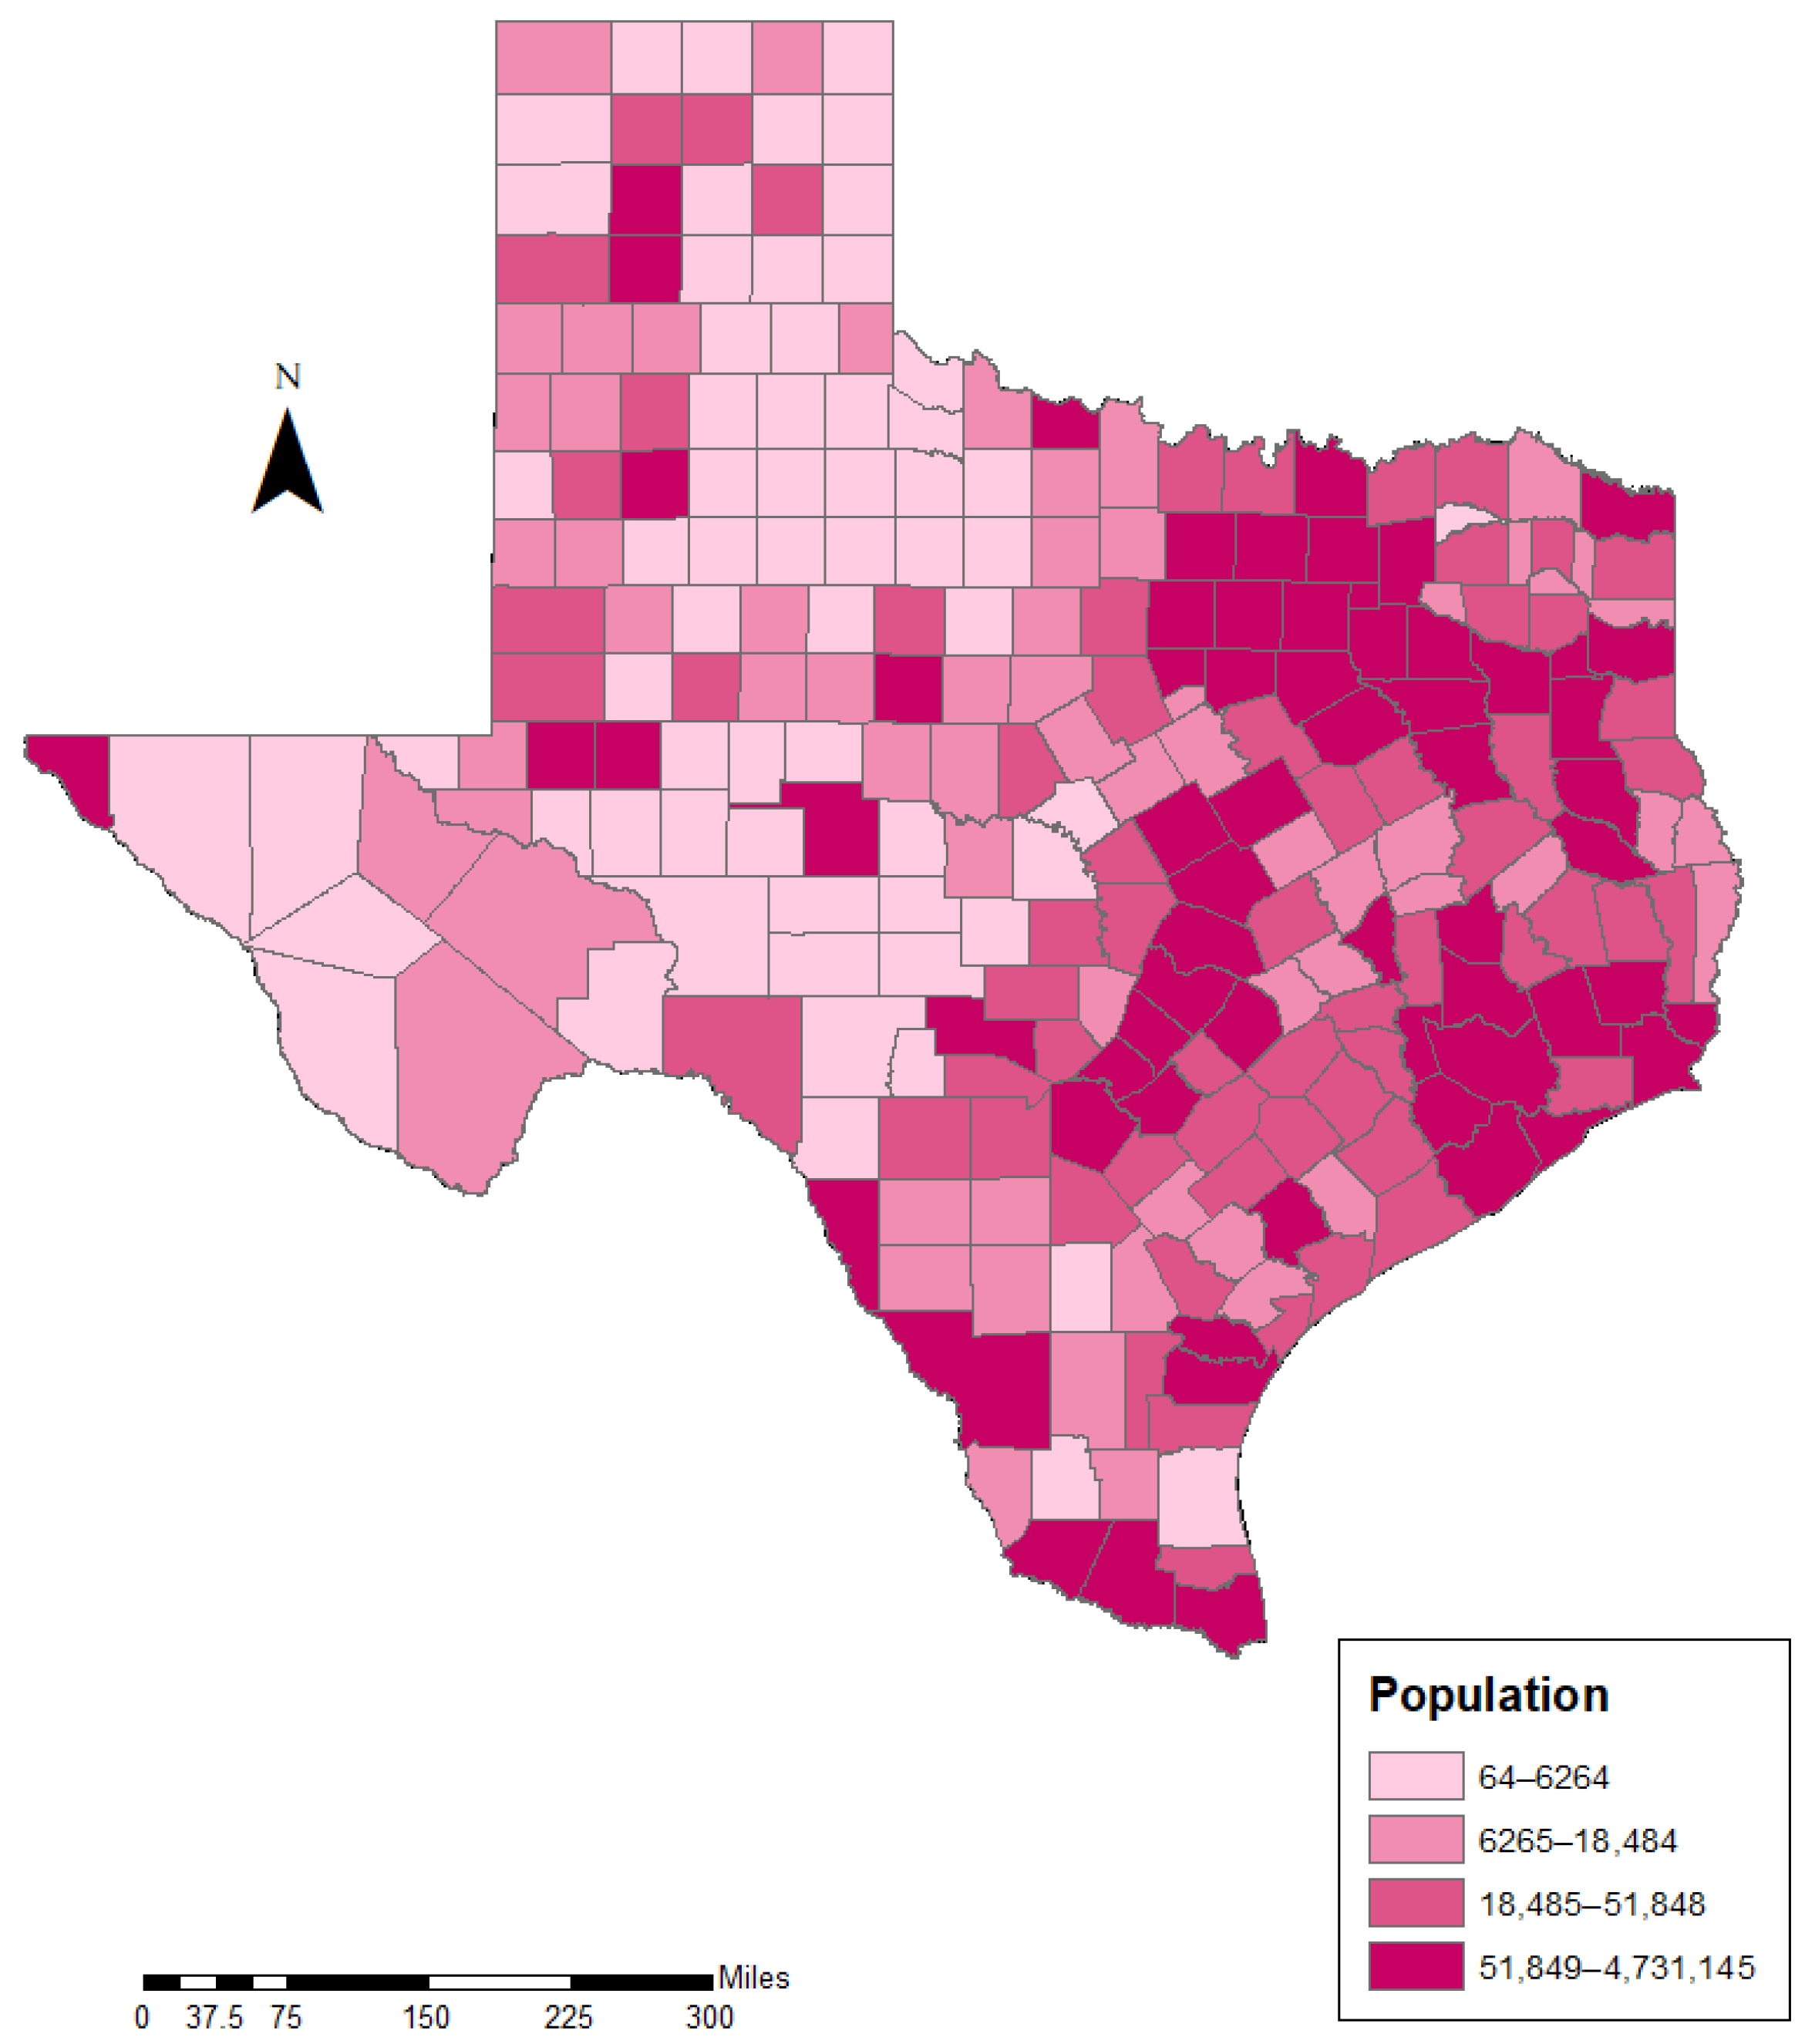
For the analysis of the patterns, multiple toolsets were employed. First, population shapefiles for the state of Texas were obtained from the US 2020 Census Population [16]. According to the findings, there were 29,145,505 inhabitants in the Lone Star State, which is becoming one of the most populated areas in the United States. For this research, calculations were performed, and the population was divided in quartiles. The population data were considered for this study in order to understand the demographics surrounding the counties with high energy potential levels of wind and solar energy. Thus, we will analyze later in this research the relationship that exists between heavily populated counties, counties with high energy, and the distance between the farms in the potential regions and the largest cities. For this study, the population was divided in quartiles using ArcMap, as in Figure 2. It is important to highlight that only those counties falling under the top 25% were utilized for the posterior analyses performed in this research. Using GIS, the 254 counties were divided in four categories based on their population: 0–6264; 6264–18,484; 18,484–51,847; and 51,847–431,145. As shown in Figure 2, a color ramp was used to distinguish the category that each county would fall under.
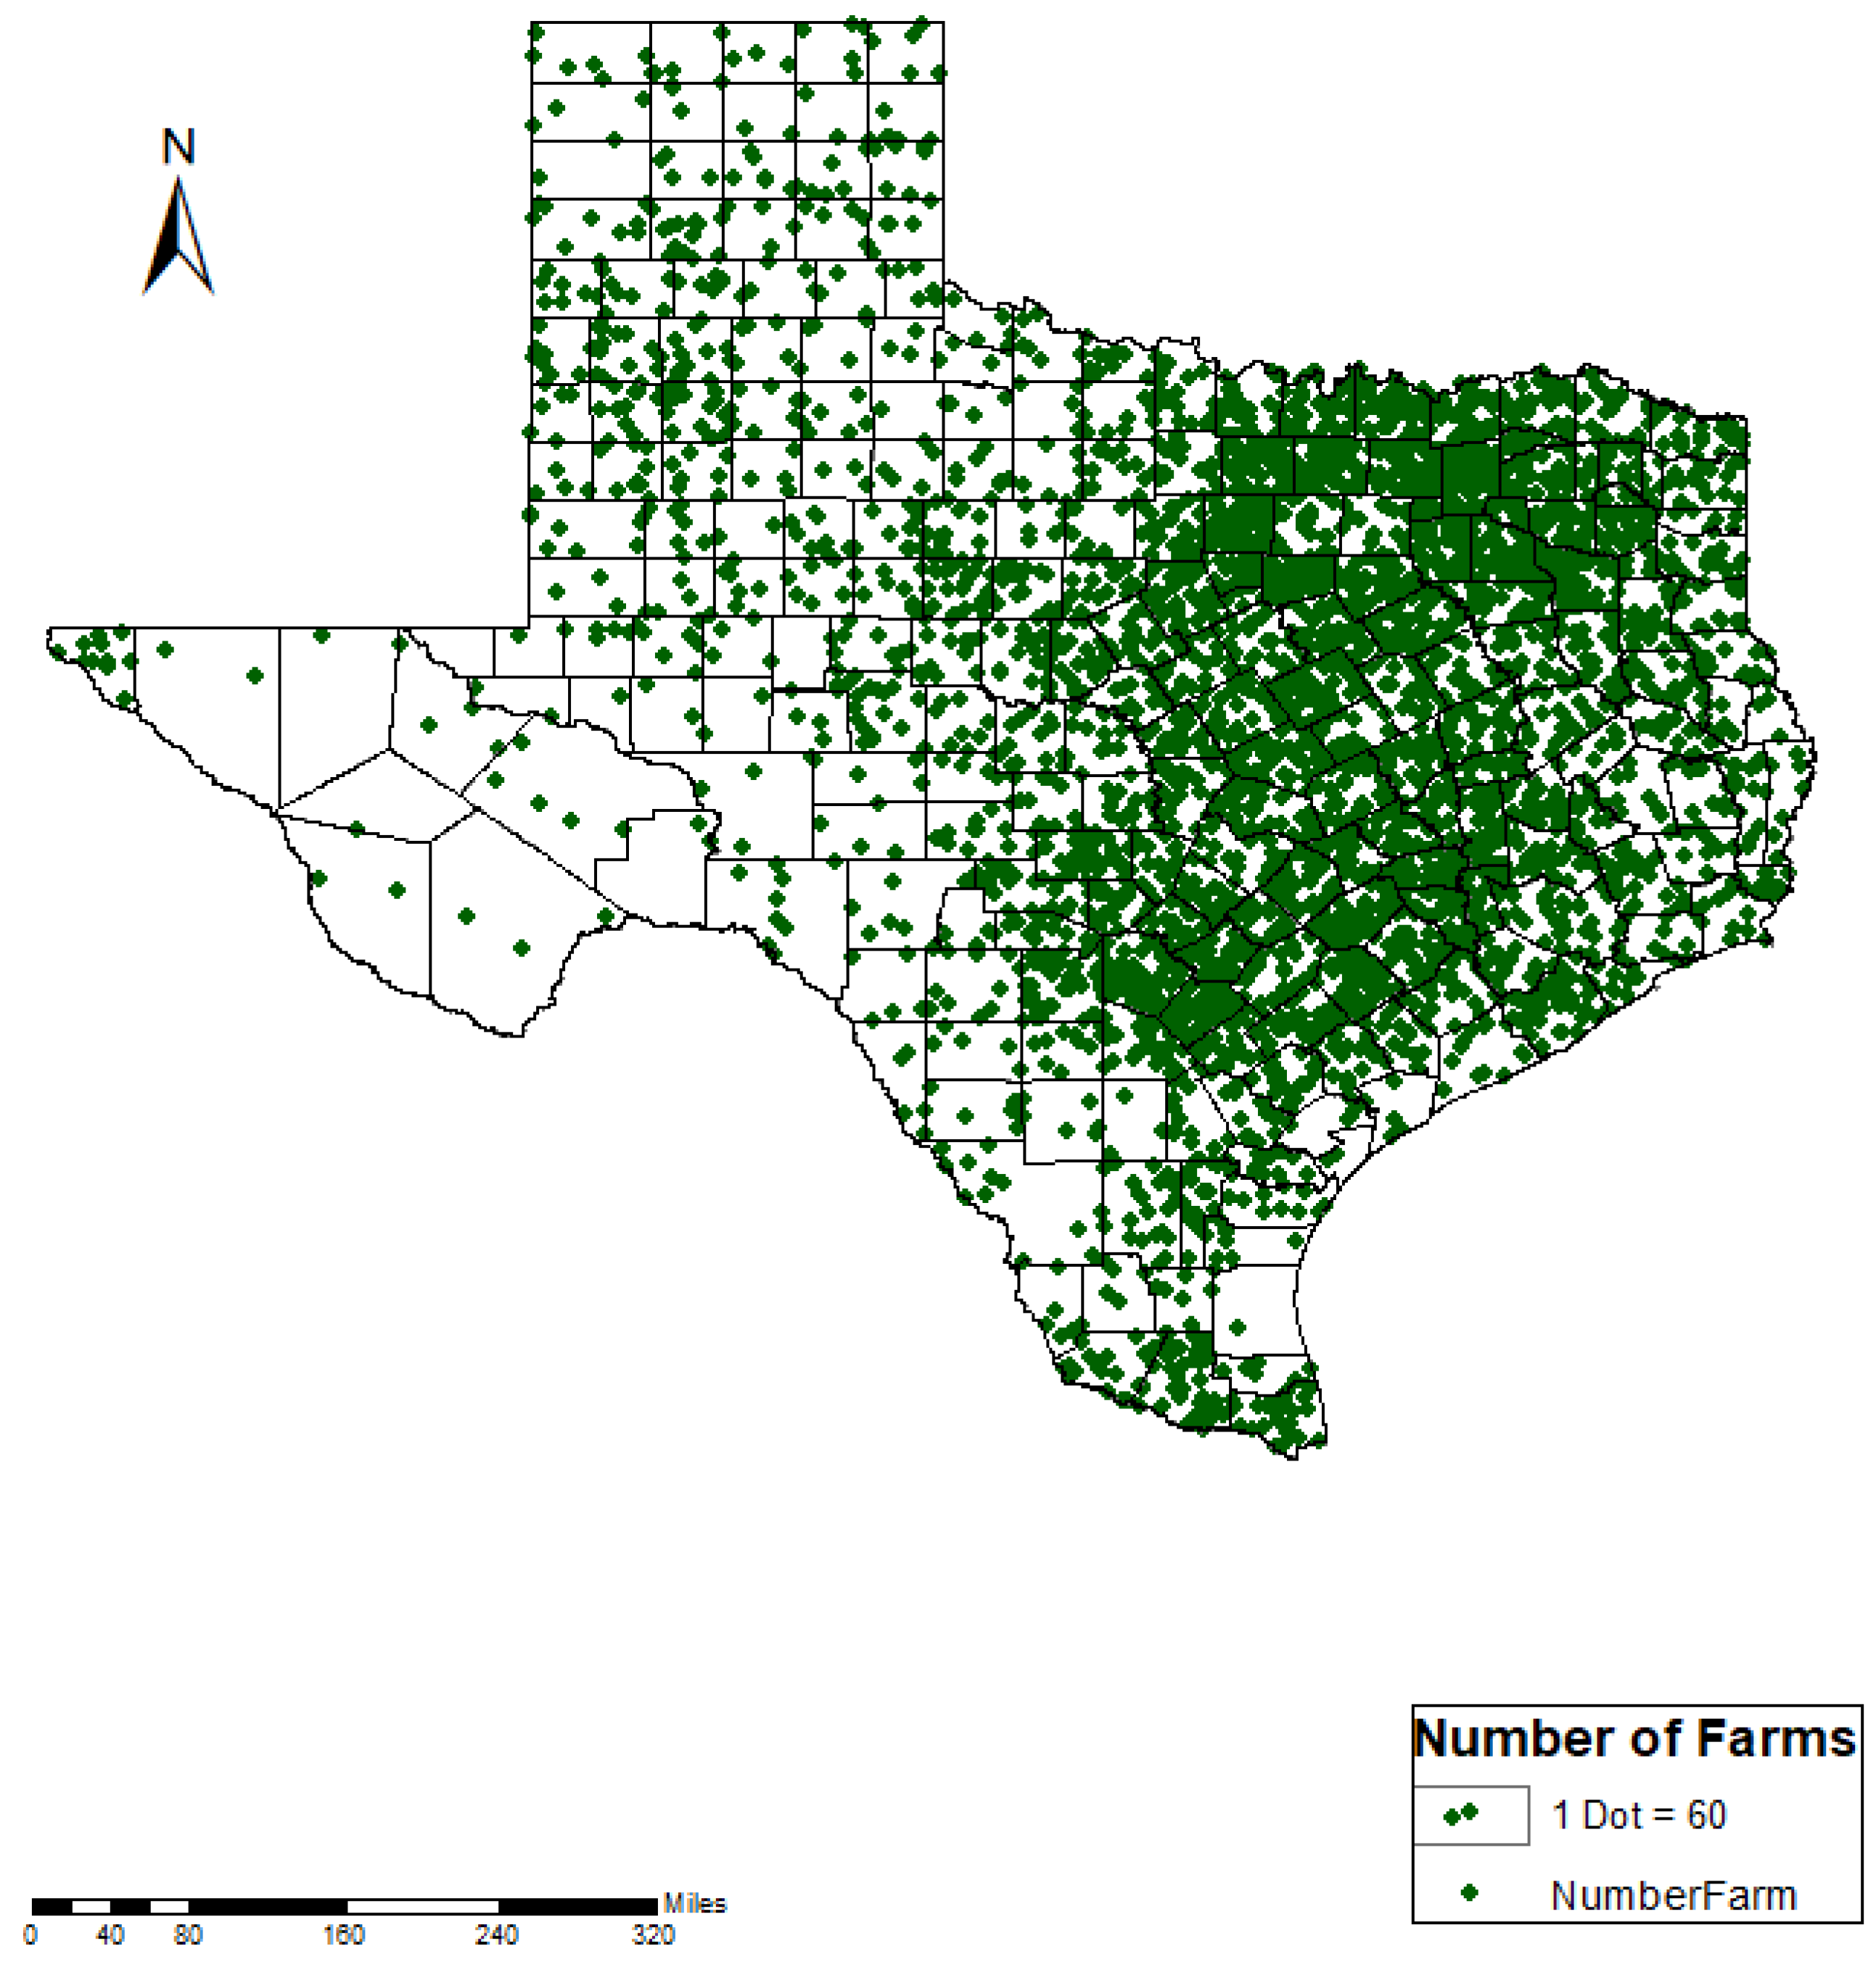
Agriculture is one of the biggest industries in Texas [4]. Furthermore, the latest Census of Agriculture ranks the state as the number one in terms of the total number of farms in the United States. Figure 3 shows a visual representation of the farm dispersion statewide, where every dot represents 60 farms. Similarly, the total number of farms in the state of Texas is summarized in Table 1, based on their pertaining region (Central, East, North, South, and West), county, and the total number of farms by region.
The relationship between highly populated counties and counties with significant wind and solar energy potential was also analyzed. Using the application of spatial queries in ArcMap, the top 25% more highly populated counties were selected to perform the analysis. Additionally, similar calculations were used to determine the top 50%, 25%, and 10% of counties with the highest wind and solar energy potential in Texas, respectively. Using “Intersection”, a geoprocessing tool in ArcMap, the automatic overlaying of the multiple layers to be analyzed was possible. During this step, the yearly averages for wind and solar energy potential in Texas were determined for each one of the farms. As a result, maps were generated to provide a visual perspective, and to locate each one of the farms in four main categories based on quartiles, using the previously obtained shapefile from the National Renewable Energy Laboratory (NREL) and the annual wind speed average between 1983 and 1993 from NASA.
Along with the study of the counties with the highest energy potential, the distance between the farms and the five largest cities in Texas were calculated. Based on population, the largest cities in Texas are Austin, the Dallas-Fort Worth Metropolitan area, El Paso, Houston, and San Antonio. The distance calculations were automatically obtained using the “Point Distance” tool, which is part of the geoprocessing toolset in ArcMap. “Point Distance” allows us to determine the distance between all of the data points that are used as an input layer and fall under the search radius, which can be specified by the user. The resulting distance is then summarized in an output table containing all of the records in the corresponding units. In this case, the first layer containing each data point representing a farm located in a wind or solar energy potential region, and a second layer containing the data point for every largest city in the state were used to determine their proximity.
Due to the total number of data points, the results were summarized based on the distance segments: 0–100 km, 100–200 km, 200–300 km, 300–400 km, 400–500 km, and 500+ km. Once all of the data and layers had been analyzed using ArcMap, the next step was the performance of a data analysis in Excel. The use of pivot tables during this process contributed significantly to the understanding of the trends surrounding the thousands of farms using charts and tables for our numerical analysis.
3. Results
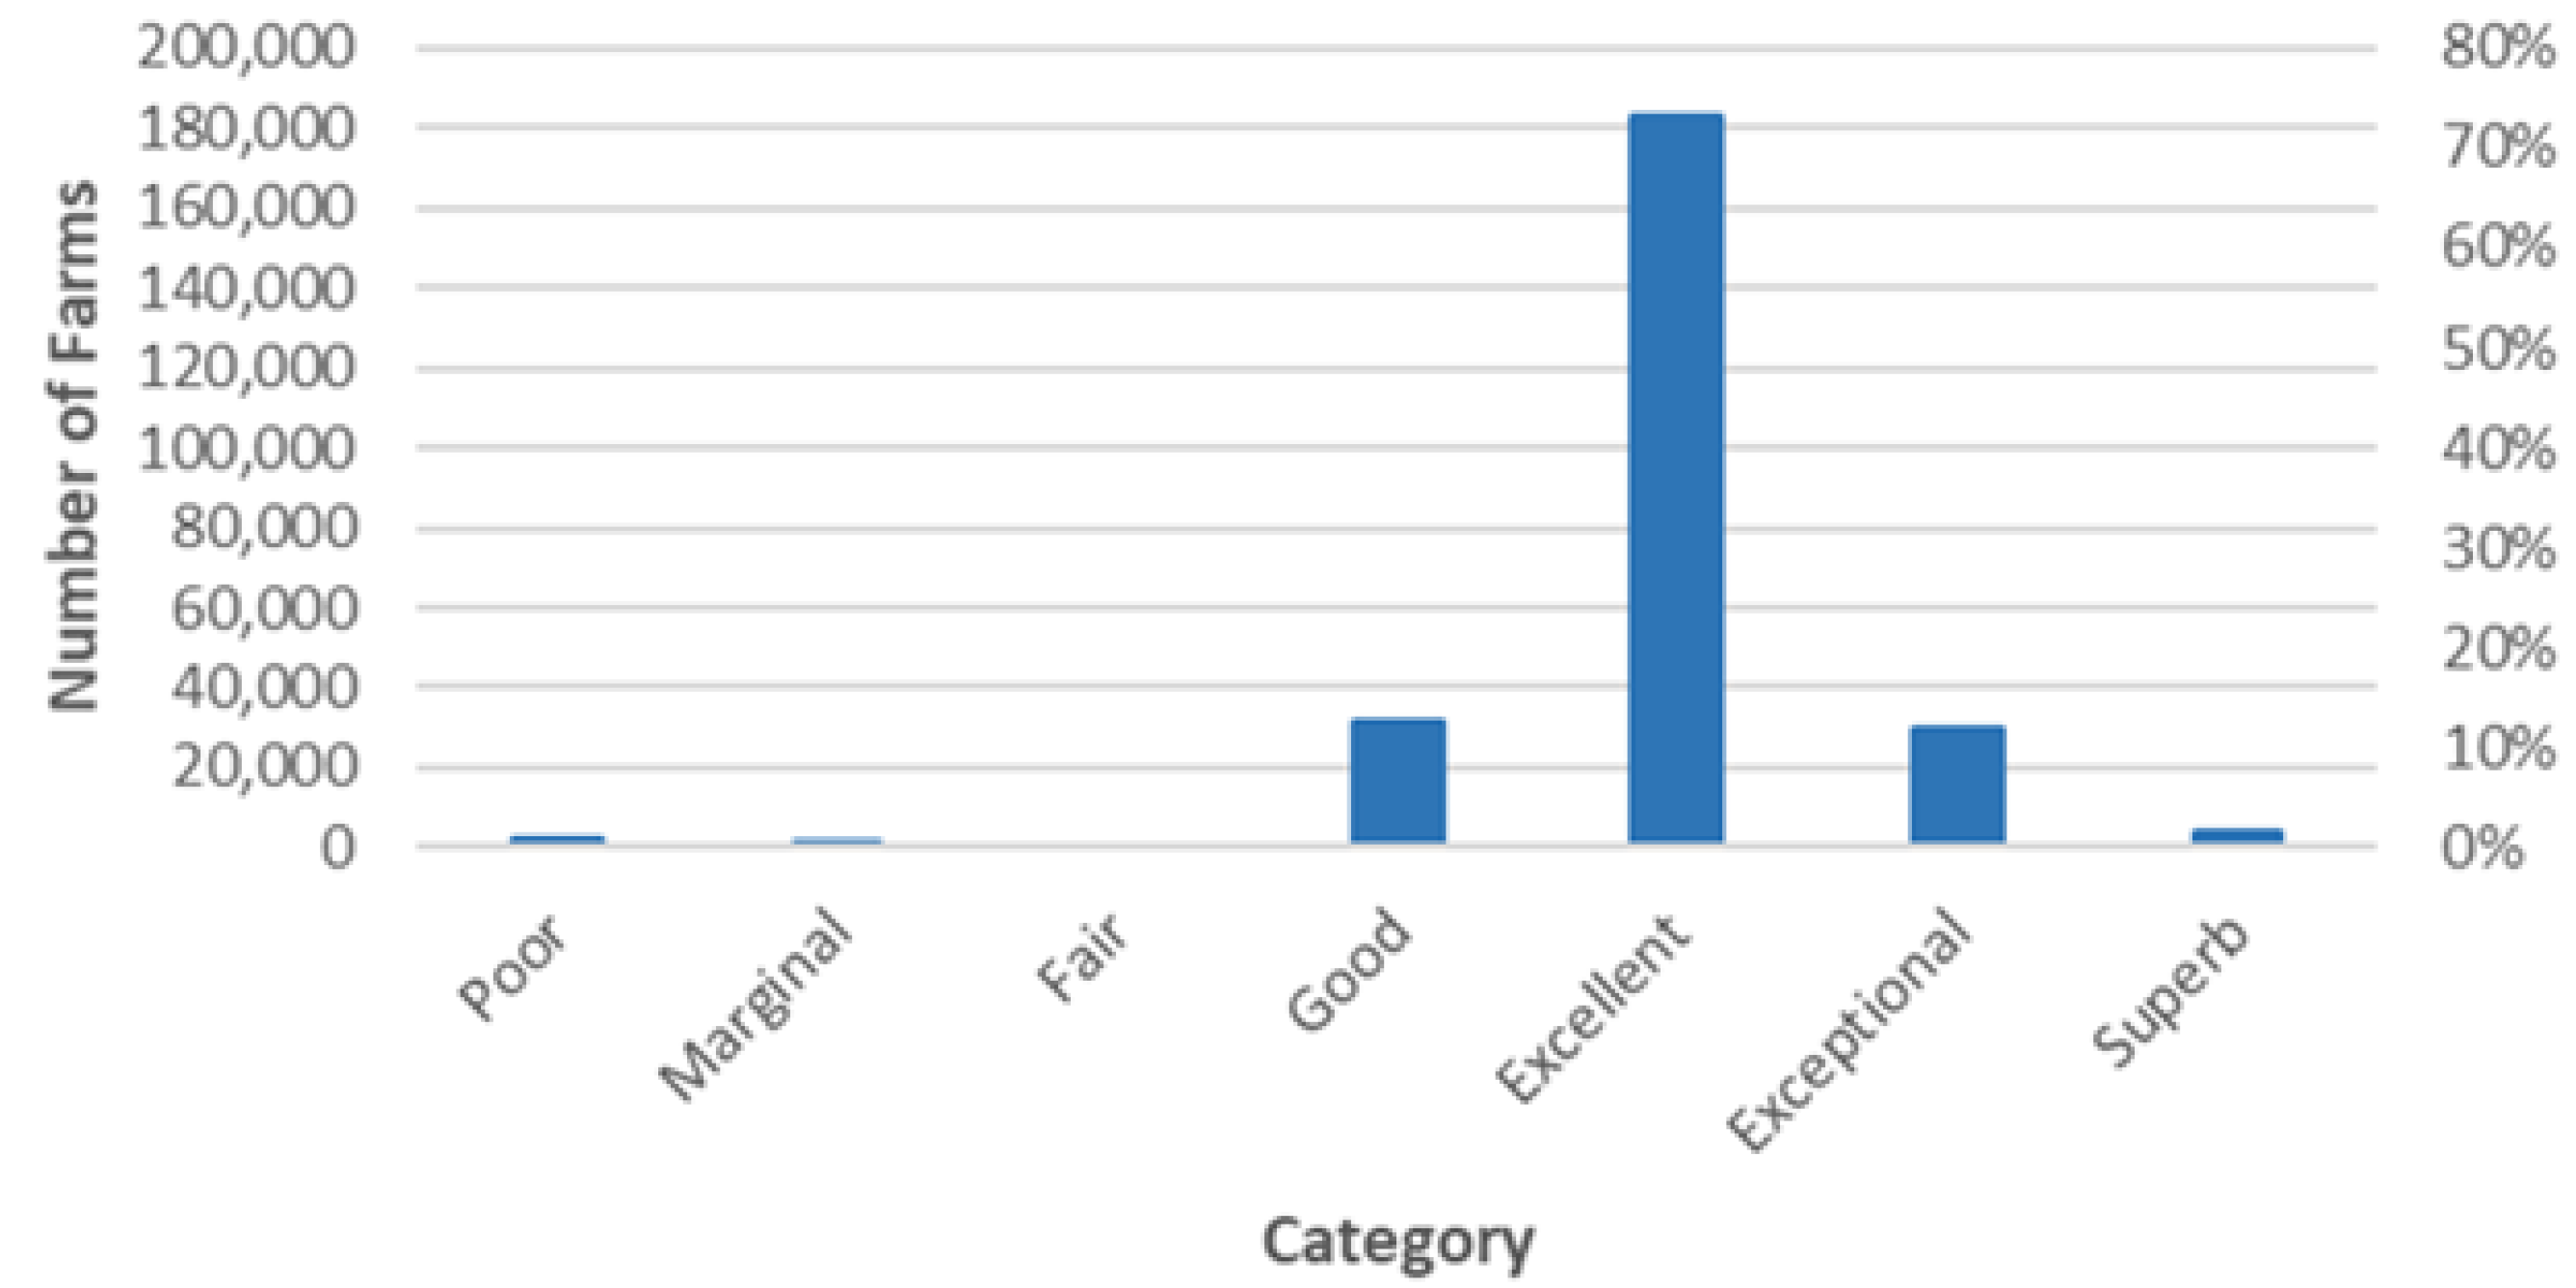
The results from multiple analyses show interesting trends. As was mentioned, the layers for the number of farms and the Average Direct Normal Irradiance (DNI) were joined. Since most of the DNI numbers fall between 0 and 7.5 kW/m2, the data were divided into seven different categories. The categories used for this section were defined by NREL, including Superb, Outstanding, Excellent, Good, Fair, Marginal, and Poor. The first set of results show that all of the farms fall into the different solar potential categories, with most farms falling into the categories for “Excellent”, “Good”, and “Exceptional”.
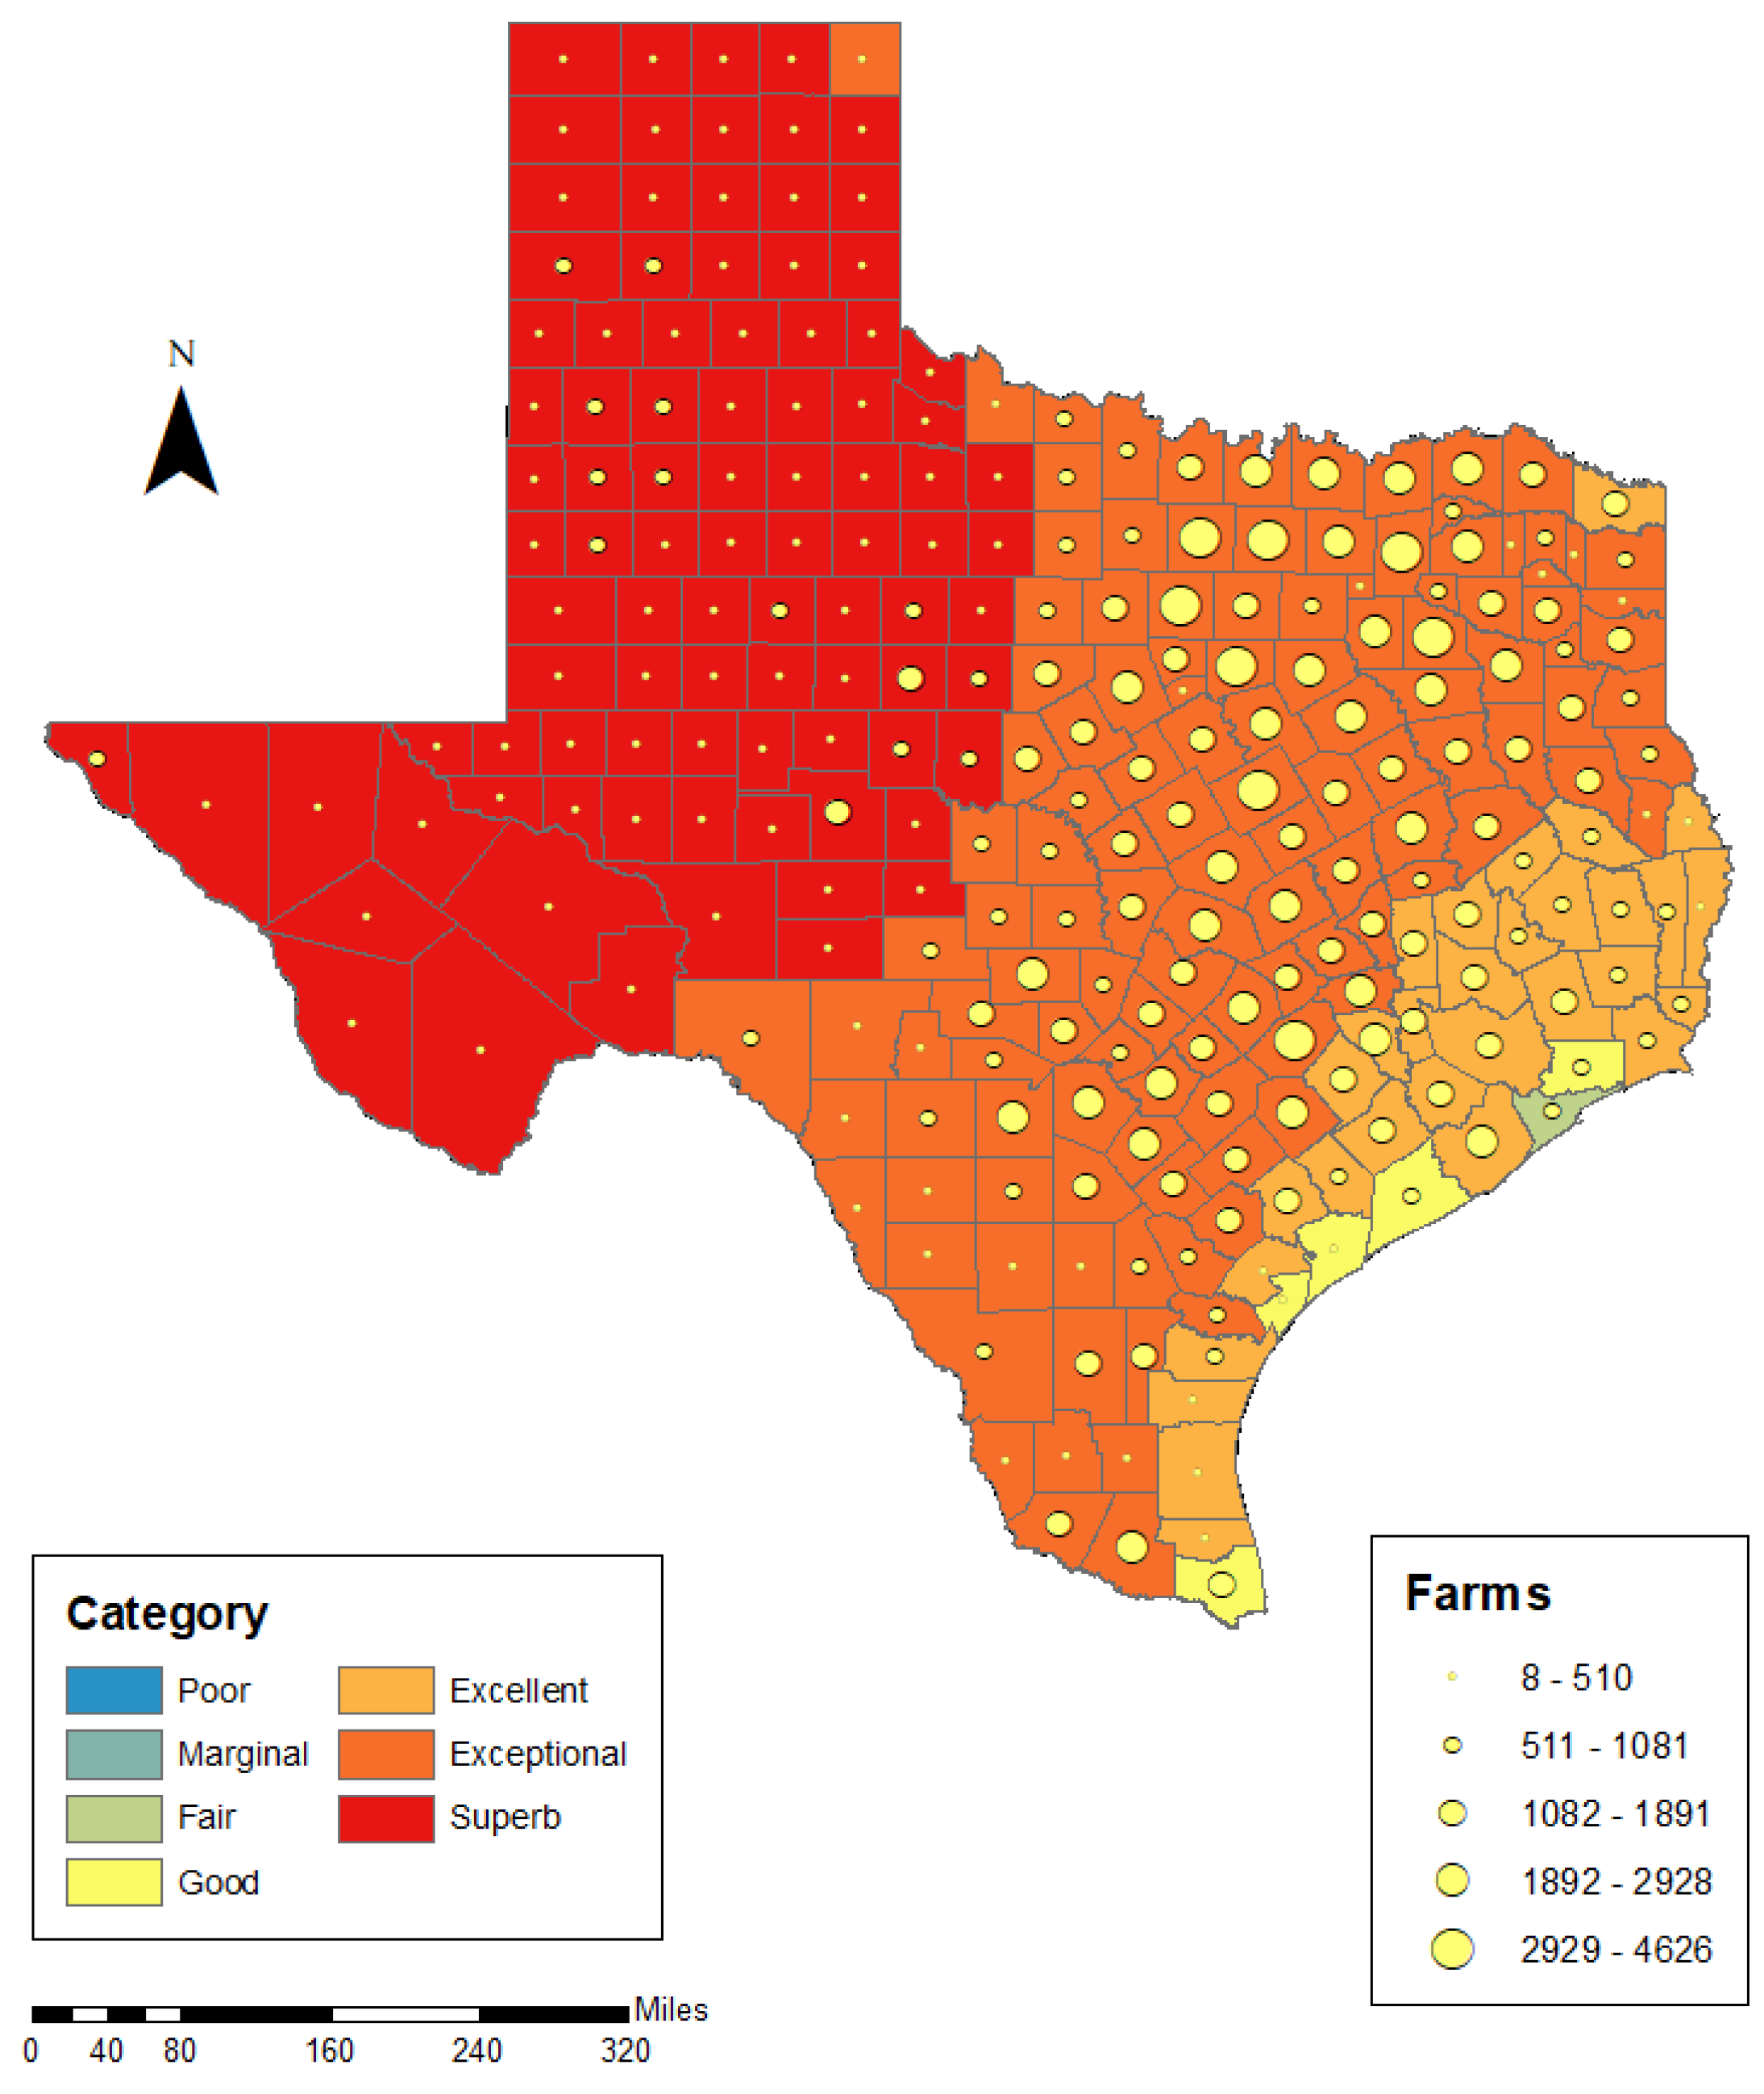
Based on the results, there is a good feasibility for the installation of photovoltaic modules in farms, as thousands of Texan farms would be able to produce a significant amount of solar energy. Moreover, Figure 4 shows that more than 70% of the farms (about 181,500 farms) have an “Excellent” solar potential, with an average of 5 to 6 W/m2. In Figure 5, the map represents the areas where farms would have higher levels of solar radiation. It can be observed that farms spread across the West Texas region would have higher solar energy potential. Although this region does not have as many farms as the Northern and Eastern regions, on-farm solar energy generation through the installation of photovoltaic modules would be beneficial for their owners, as it is an energy resource that is easier to obtain, and at a lower price. This type of energy generation would not only have an impact on the environment and pollution levels but also on the economic side of the operations of farms and ranches. Traditionally, income generated from the lease of lands for energy purposes comprises between 4 and 6% of farms’ gross income in highly driven agricultural states [8,17]. According to different reports, the average price per acre leased oscillates between $300 and $800 a year, depending on the state [17]. The Texas Farm Bureau reports that solar energy companies are currently offering farm owners in the state up to $1200 per acre per year, with 20–40-year leases [18]. At the same time, agrivoltaic systems have allowed the coexistence of photovoltaic modules and farming practices such as crop harvesting or pasture. Moreover, solar energy presents a cost-effective solution that can be employed in the control of electric fencing, lighting, and air purification purposes [8]. At the same time, small-scale solar energy systems present less environmental concern for farmers due to their almost negligible use of water, lack of toxic waste disposal, and low soil pollution [17]. The incorporation of renewable energy in agriculture will lead to economic development in rural areas, improve the welfare of citizens, and boost the gross domestic product of a nation [19].
For wind potential, the same categories employed for the solar potential analysis were used. Each of these categories was classified based on the wind speed at 50 m. The categories are Poor (0–5.6 m/s), Marginal (5.6–6.4 m/s), Fair (6.4–7.0 m/s), Good (7.0–7.5 m/s), Excellent (7.5–8.0 m/s), Outstanding (8.0–8.8 m/s), and Superb (>8.8 m/s). According to the geospatial and numerical analysis performed for wind energy potential, the results show that most of the farms in Texas fall under the “Poor” and “Marginal” categories. Figure 6 shows that around 180,000 farms fall under the “Poor” category, while about 40,000 farms fall under the “Marginal” category. Even though the wind potential conditions in most parts of Texas do not qualify as high categories, Texas has thousands of acres distributed across the state where wind energy turbines could be installed. Based on the numerical analysis performed, there are more than 20,000 farms under the “Fair” or “Good” categories. Therefore, the ideal location for on-farm wind generation would also be the West Texas region.
Performing the geospatial analysis in ArcMap, the results show a similar pattern. As was previously discussed, most of the farms located in Texas are found in North Texas and West Texas, with “Poor” being the predominant category in these areas. Nevertheless, there are still thousands of farms with better classifications. Even though the categories for these areas may underestimate the potential of using wind energy in Texan farms, real-life events have shown considerable potential. For the past decade, the number of wind farms has continuously grown around the state. Thus, even if the wind energy potential may fall into one of the lower categories, there is still some potential and benefits for the installation of wind turbines in farms.
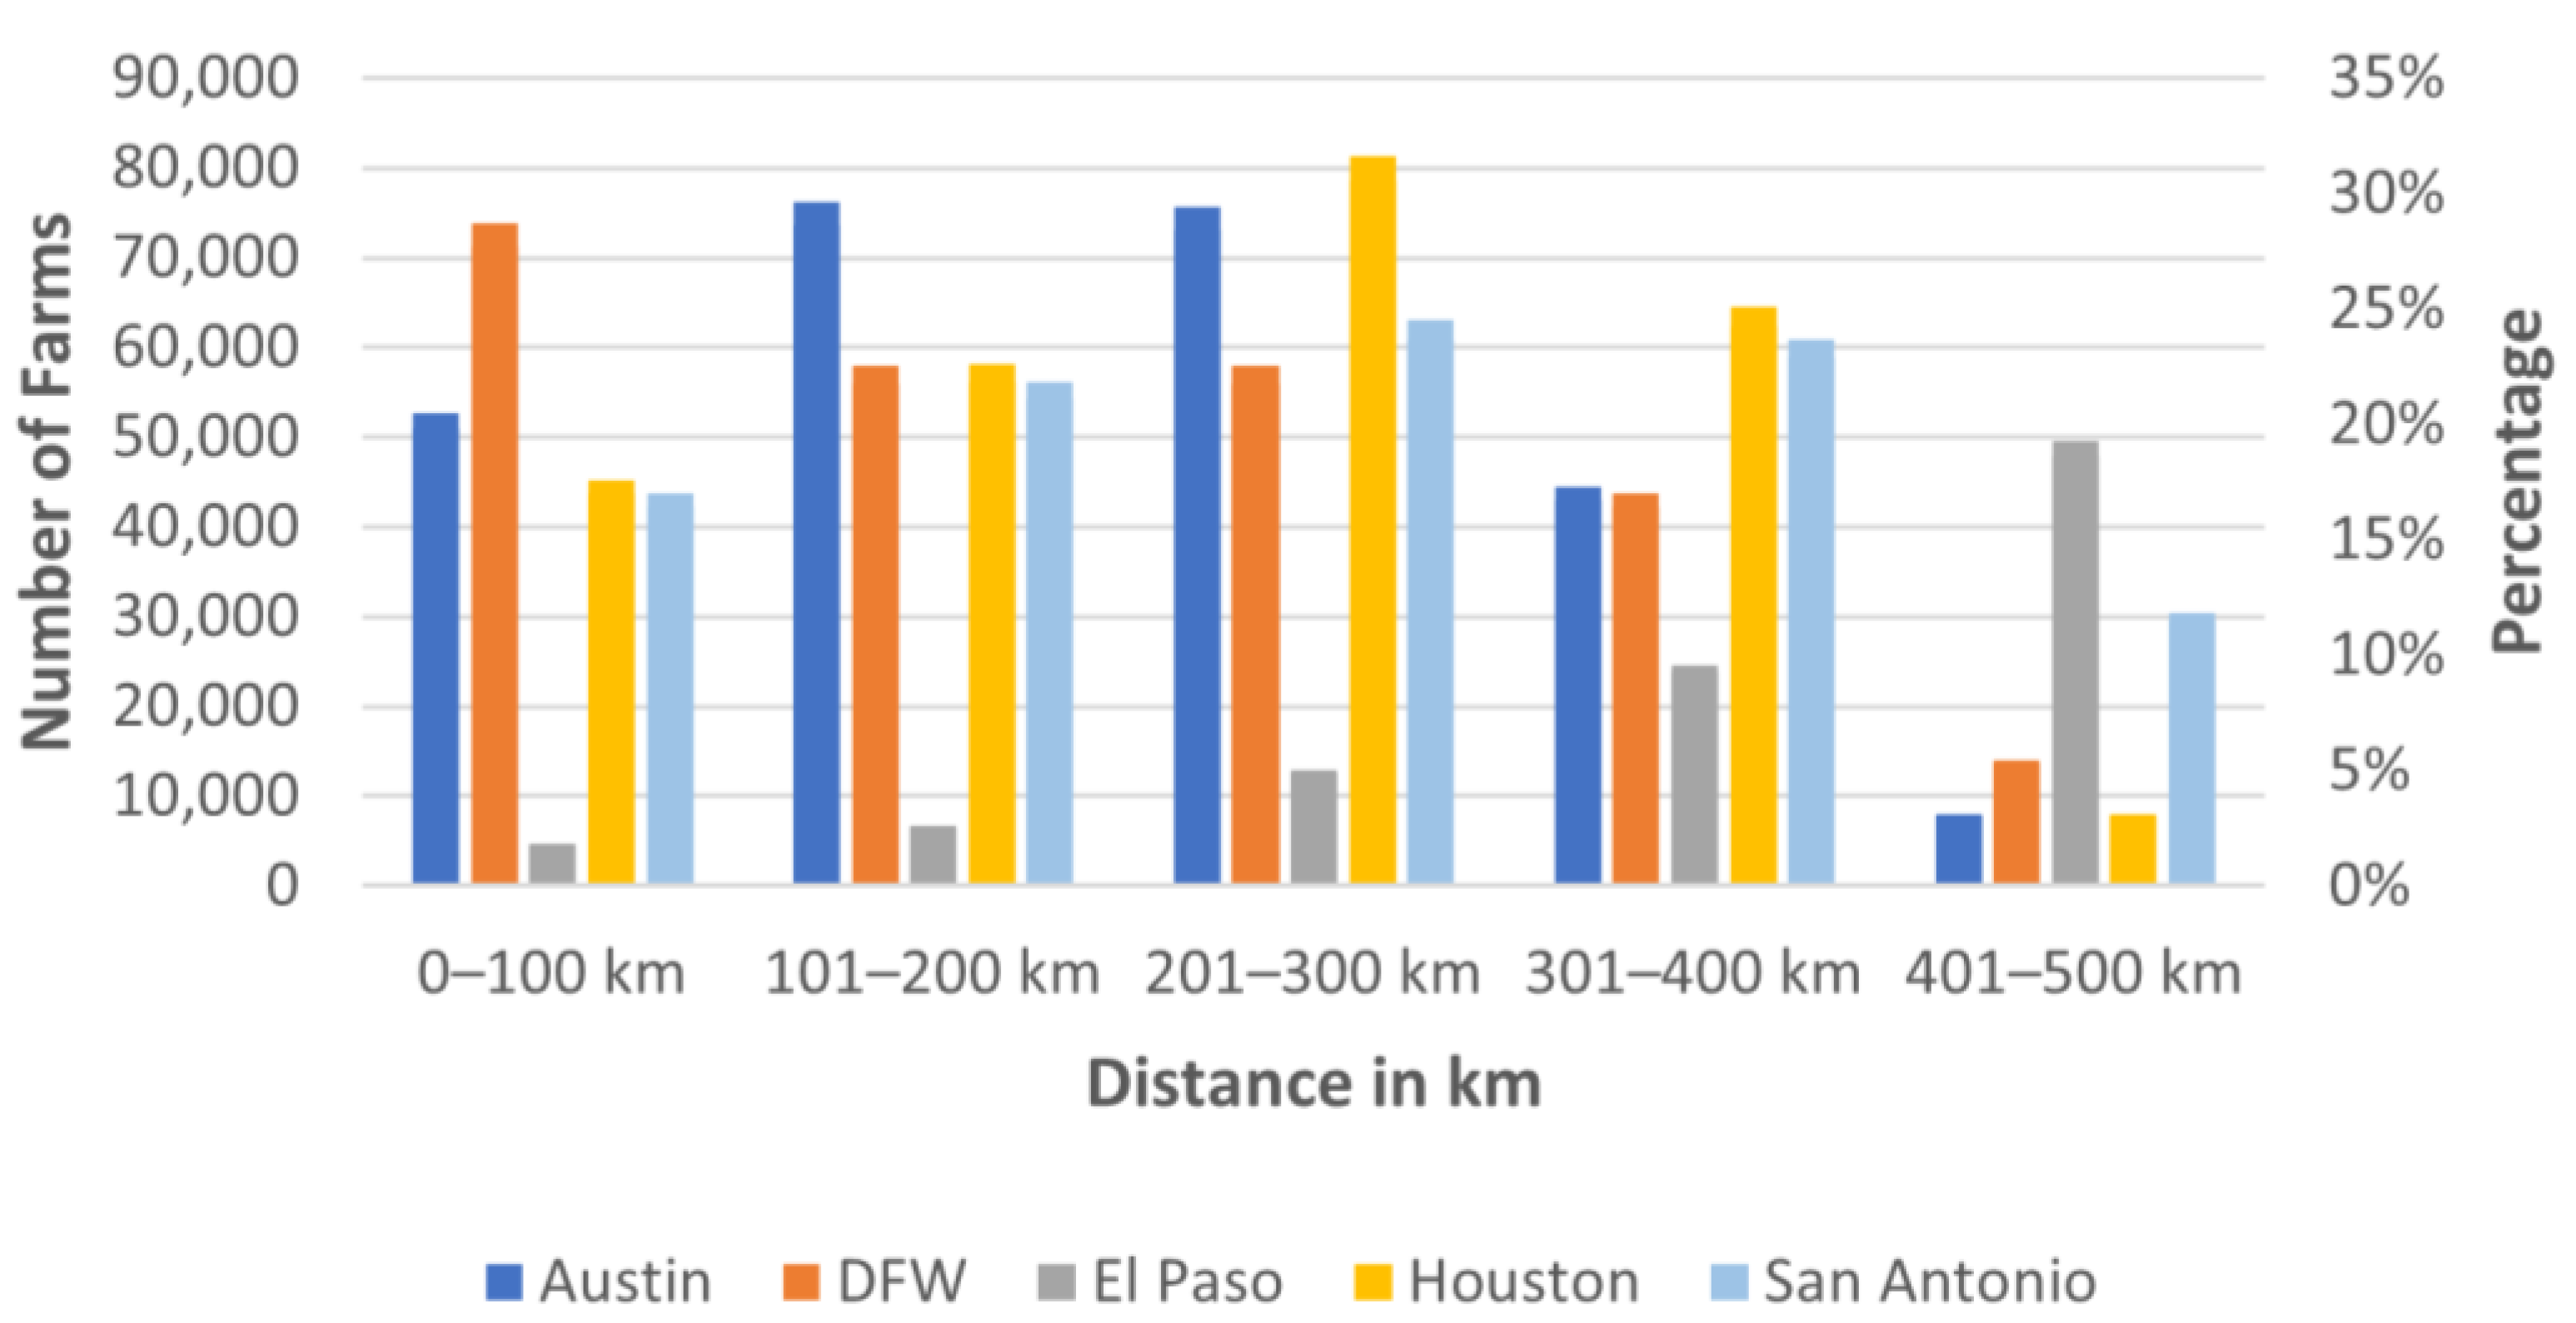
Besides the solar and wind energy analysis, other trends were studied regarding the farm distribution in Texas. As is well-known, agriculture has always had a significant impact on Texas’ economy and land distribution. From the study of the 248,411 total farms distributed across the state, one of the trends is in the distance and distribution of farms and major cities across Texas (Figure 7). The cities selected for this analysis were the largest cities in Texas according to the US Census. These cities were Austin, Dallas-Fort Worth, Houston, San Antonio, and El Paso. It was observed that the Dallas-Fort Worth metropolitan area was the city with the closest farms, with 71,341 farms in a perimeter of 0 to 99 km. Moreover, Austin takes the second place among these five cities in terms of the closest farms. On the other hand, it was observed that the city with the longest distance between the farms and the city was El Paso, with 47,853 farms 400 to 499 km apart. Furthermore, Figure 7 shows the distance patterns calculated with ArcMap after performing the Spatial Join. The average distance between the farms and the largest five cities in Texas is around 200 to 299 km, and each major city falls in the range of 20 to 30 percent of the distance from farms to cities. Furthermore, it can be perceived that Houston is the city with approximately the highest average distance for all of the distance categories used for this analysis, while El Paso is the city with the lowest distances for the first four categories studied. The analysis of the distance between the farms and cities plays an important role when selecting the locations for renewable energy devices. Moreover, the multiple analyses performed show that most of the farms are located in a small perimeter around the largest cities in Texas. This result shows that if photovoltaic modules or wind farms were to be installed in the farms, these could also contribute to powering some of the cities in Texas using renewable energy.
On the other hand, the solar energy potential results determined that the counties under the top 50% with higher solar energy potential are mostly located in the West and Central Texas regions. Furthermore, a smaller part of the counties in North Texas show an important potential for solar energy generation. Based on the calculations performed for solar energy output, counties like El Paso, Hudspeth, Culberson, Dallam, and Hartley County would achieve the greatest solar energy output, with values above 1020–1100 kWh. Counties on this ranking with less solar energy potential would be in North and Southeast Texas. These are Somervell, Maverick, Dimmit, Cooke, and Hood County, with an average energy output of 820 kWh. For the top 25%, similar patterns were found. However, all of the counties located in the West Texas region would be the only ones to achieve a greater energy potential. In fact, twenty-six counties in West Texas, under the top 10%, would have a solar energy output greater than or equal to 1000 kWh. The results for the top 50% of wind energy output demonstrated that the counties in the West and North Texas regions would have an optimal wind energy production, as a significant percentage of farms in these regions would have a wind energy output above 540 kWh, and could achieve up to the 1435 kWh. Like the results obtained for solar energy potential, the top 25% and top 10% of counties with higher wind energy potential would be in the North and Northwest areas of the state. Even though not all of the counties produce as much energy as others, the lowest energy potential for solar and wind energy were 678 kWh for solar and 132 kWh for wind energy.
As previously discussed, when the population increases, the energy demand will proportionally increase. Thus, a more stable and easily accessed grid is needed in order to satisfy the consumer’s energy demands. Heavily populated areas in Texas were analyzed in order to determine the counties which would achieve a high energy output through on-farm energy generation. Employing GIS methodologies, the distance between the five largest cities in Texas and the counties under the top 50%, 25%, and 10% of solar and wind energy potential were analyzed. Through the application of these methodologies, the counties with highest energy and solar potential were analyzed in order to find the counties intersecting with the most populated areas in the state (Figure 8). The results were obtained through an overlay analysis using the “Intersection” tool. The results show that there are 14 counties with 50% solar energy potential, five counties with 25% solar energy potential, and four counties with 10% solar energy potential. Meanwhile, for wind energy, the results show that there are 28 counties with 50% wind energy potential, nine counties with 25% solar energy potential, and one county with 10% solar energy potential. In fact, there is only one county under the top 10% of wind and solar energy potential, which is Randall, located in the West Texas Region.
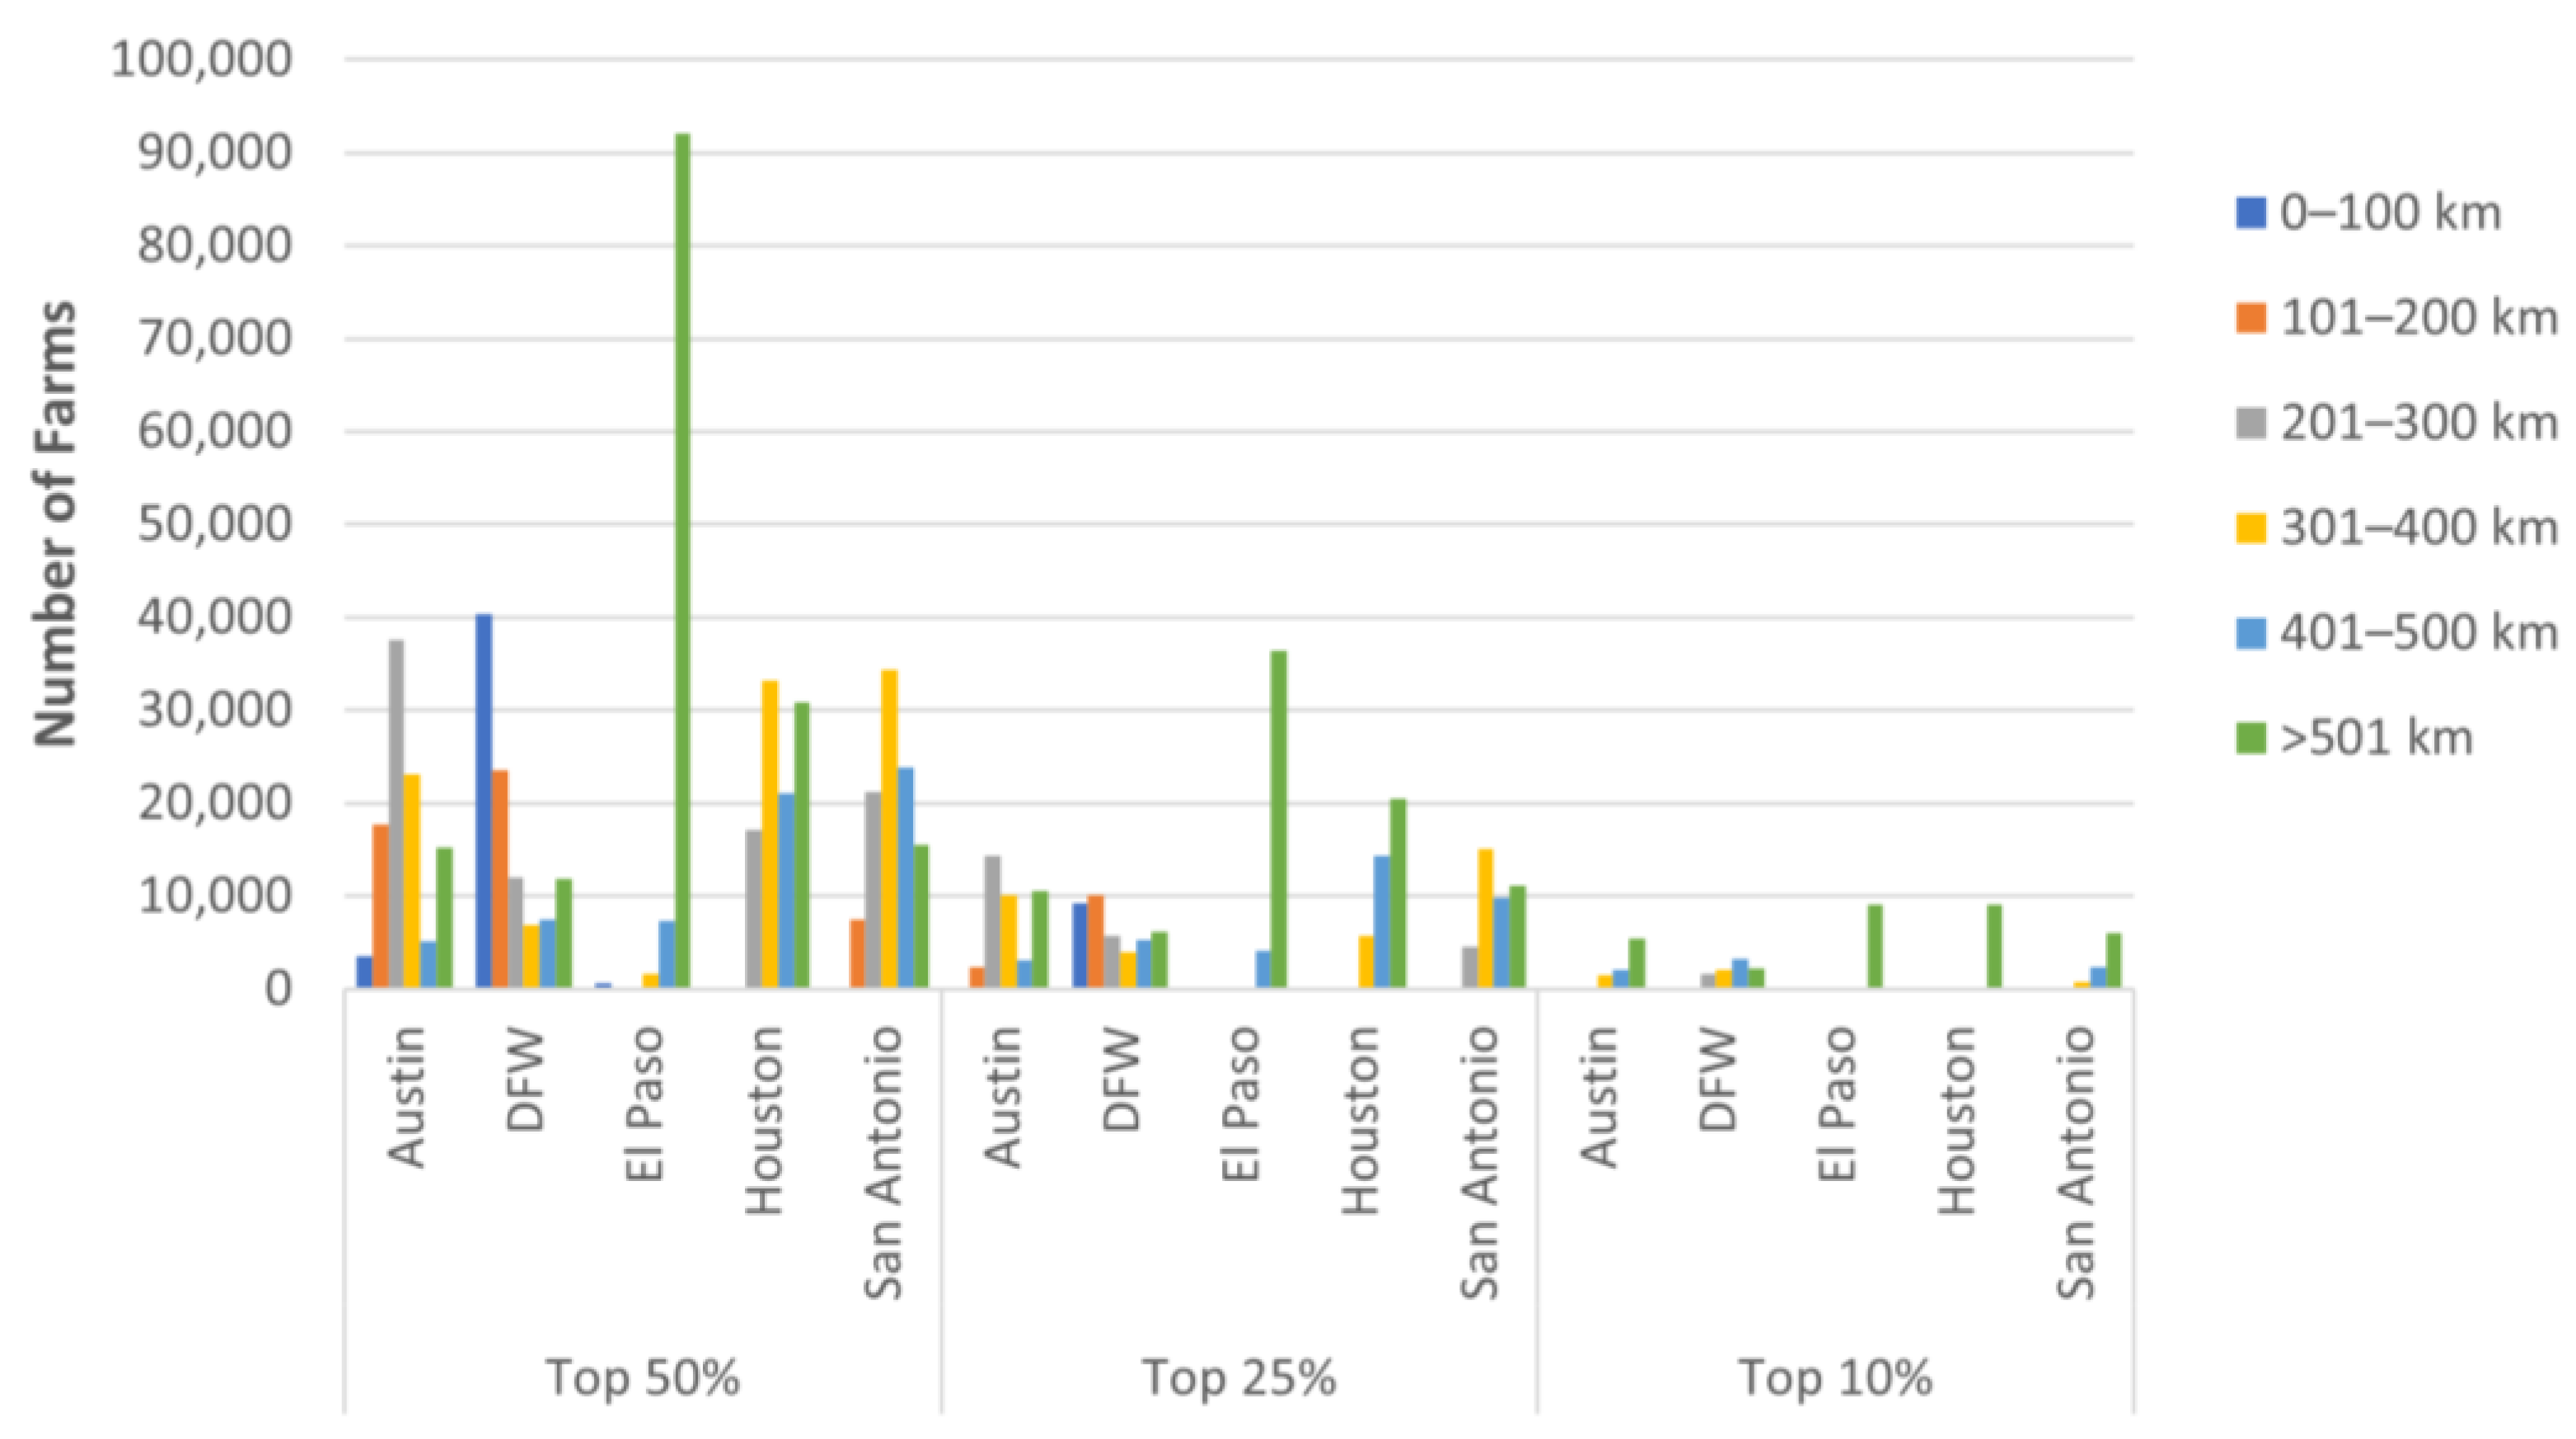
The results obtained from the analysis performed to determine the distance between the highest solar energy potential and the five largest cities in Texas (Austin, DFW, Houston, El Paso, and San Antonio) are shown in Figure 9. Based on the results, the Dallas-Fort Worth Metropolitan area was the city with the greatest proximity (0–100 km) to farms under 50% solar energy potential, with 12,135 farms. It was followed by the city of San Antonio, with a significant decrease of farms, with 2079 farms total in a perimeter of 0–100 km. Nevertheless, El Paso was the only city with the greatest number of farms in a perimeter of 0–300 km, where 5% of the total farms were in a perimeter in the top 25% energy potential category. At the same time, El Paso remains the closest city to farms under the top 10% of solar energy generation, with about 15% of the total number of farms at 0 to 300 km. In contrast, the furthest city to counties with the top 25% and 10% solar energy potential is Houston.
When estimating the distance between farms and counties with higher wind energy potential, the results showed that the Dallas-Fort Worth Metropolitan area is the city with the greatest number of wind farms in the 50% wind energy potential category. Likewise, Dallas-Fort Worth remains as the closest city with the greatest number of farms within a 200–300 km radius. The furthest cities are Houston and El Paso, where 100% of the farms are located 500+ km from the higher wind energy potential counties. The results are summarized in Figure 10.
Although the current century has brought new challenges to the agricultural sector, agriculture has adapted from its traditional practices to the incorporation of new sources of energy in order to meet the industry’s demands. Overall, the outcomes of this study support the technical feasibility analysis of utilizing renewable energy sources for on-farm energy generation practices. The solar and wind energy potential calculations indicate that there over 71,600 farms in Texas counties that can deliver half of the energy potential, whereas more than 102,000 farms are in areas with a significant amount of wind energy potential. However, one of the main dilemmas that has risen is the loss of agricultural land to provide access for renewable energy generation sites. Nevertheless, in the last decade, Texan farmers have embraced the incorporation of wind turbines and photovoltaic modules in their landscapes as a method to decrease economic costs and improve profit margins. Moreover, on-farm energy generation has allowed farmers not only to produce electricity for self-consumption but also to sell it to the grid. Through the initiative “Rural Energy for America Program” from the Department of Agriculture, which focuses on supporting small farm owners to produce energy for their own personal consumption in order to reduce energy-related costs, about 530,000 MWhs of electricity were generated in 2015 [17]. In the last year, the USDA announced the investment of $464 million to improve renewable energy infrastructure in rural areas of America, of which $129 million of these investments will come from the “Rural Energy for America Program” [20]. This new initiative will seek to generate 379 million kWh of energy in rural communities across the nation. Furthermore, the uncertainty that relies on the annual success of crop harvesting compared to the stable earnings from agricultural lands producing energy has been an important consideration in the adoption of green farming practices. Therefore, the growth of on-farm energy generation in the future seems to be an adequate method to increase farmers’ revenues by diminishing energy-related expenses while meeting the demand to feed the population.
4. Conclusions
Energy is an essential component of human life in the delivery of basic needs and the performance of daily activities. At the same time, agriculture is one of the five industries with the highest energy consumption in the US. In the agricultural sector, renewable energy sources represent a solution for the current need of the industry to continue providing the necessary products for human consumption while decreasing the costs of electrical energy and the impact of certain agricultural practices on the environment. In this research, the potentials of solar and wind energy were calculated in order to determine the technical feasibility of the installation of wind turbines and photovoltaic modules. The results showed that Texas is a state with a significant potential to rely on renewable energy sources for energy consumption. The analysis performed supports the state of Texas’ success as one of the top five renewable energy producers in the nation through the estimation of energy potential, and provides calculations for the energy outputs of every county by considering the installation of wind turbines and photovoltaic modules in the thousands of farms across the state. The outcomes described promote the use of renewable energies in farms due to their land availability and energy potential.
From the numerical and geospatial analyses discussed in the methodology section, the results show that farms in Texas have greater wind and solar energy potentials. According to this analysis, it was observed that counties surrounding some of the largest cities in Texas would tend to have the greatest number of farms. Although this research focused on the ways in which farms in Texas could take advantage of the use of renewable energy to support their activities, it is important to mention that there would be enough land availability and opportunity to install wind turbines or photovoltaic modules in the farms to power thousands of Texas homes at the same time. The average area of farms in Texas is about 400 acres. Therefore, if only some of these areas were to be used for the installation of such renewable energy devices, it would still lower the costs of energy and pollution levels for these populations.
Most counties in Texas have “Excellent” solar energy potential, with more than 200,000 farms falling into this category. The installation of photovoltaic modules in this area seems feasible. On the other hand, most farms are under the “Marginal” category for wind power potential. Nevertheless, falling under this category does not mean that there is not enough potential to generate energy, but that the location or characteristics are not ideal. As is well-known, the number and capacity of wind farms in Texas are still growing because of the significant potential they can provide as a cleaner and less-expensive type of energy. Furthermore, the availability of lands and rural areas make the five regions in Texas possible candidates for the installation of wind turbines.
Nevertheless, there are still challenges in this novel industry that need to be overcome and addressed in future research for the proper co-existence of renewable energy devices in the agricultural sector. It is well known that the use of renewable energy in agriculture is still minimal. However, the use of renewable energy in agriculture has doubled in the last five years, and is continuously growing. Through our research, we planned to evaluate the potential regions in order to determine where it would be feasible to implement this type of technology. Although, in this analysis, we only focused on the technical feasibility of employing wind and solar energy to generate electricity, in the future we plan to evaluate the economic aspects of it. Furthermore, it will be important to identify the financial components of the utilization of these technologies in order to understand their costs, economic advantages, and pay-back periods. Besides economic policies, it will be necessary to consider how to aid farmers to achieve this transition by providing them information on the possible applications of solar or wind energy in their daily activities. In addition, it will be important to expand the technical analysis through an advanced power simulation, and to address the evaluation of the optimal ratio between the operation of wind turbines and solar panels simultaneously, which will be further developed.
Author Contributions
Conceptualization, H.L.; methodology, H.L., M.C.M. and E.M.-G.; software, M.C.M. and E.M.-G.; validation, H.L., M.C.M. and E.M.-G.; formal analysis, M.C.M. and E.M.-G.; investigation, M.C.M. and E.M.-G.; resources, H.L.; data curation, M.C.M. and E.M.-G.; writing—original draft preparation, M.C.M.; writing—review and editing, H.L.; visualization, M.C.M. and E.M.-G.; supervision, H.L.; project administration, H.L.; funding acquisition, H.L. All authors have read and agreed to the published version of the manuscript.
Funding
This research was partially funded by the US Department of Agriculture, grant # 2020-67037.
Institutional Review Board Statement
Not applicable.
Informed Consent Statement
Not applicable.
Data Availability Statement
Publicly available datasets were analyzed in this study. This data can be found here: https://www.texasagriculture.gov/about/texasagstats.aspx, https://texasfarmbureau.org/advocacy/small-farm-ranch/, and https://geodata.lib.utexas.edu/catalog/stanford-wp386wc6721 (accessed on 12 December 2021).
Conflicts of Interest
The authors declare no conflict of interest.
References
- Ahmad, T.; Zhang, D. A critical review of comparative global historical energy consumption and future demand: The story told so far. Energy Rep. 2020, 6, 1973–1991. [Google Scholar] [CrossRef]
- Chel, A.; Kaushik, G. Renewable energy for sustainable agriculture. Agron. Sustain. Dev. 2011, 31, 91–118. [Google Scholar] [CrossRef]
- Peake, G.E. U.S. Energy: Overview of the Trends, Statistics, Supply and Consumption; Nova Science Publishers, Inc.: Hauppauge, NY, USA, 2010. [Google Scholar]
- Gleaton, C.S.; Robinson, J. Facts about Texas and US Agriculture; Texas Cooperative Extension Department of Agricultural Economics, The Texas A&M University System: College Station, TX, USA, 2016. [Google Scholar]
- Pimentel, D. Handbook of Energy Utilization in Agriculture; CRC Press: Boca Raton, FL, USA, 2019. [Google Scholar]
- U.S. Energy Information Administration. Use of Energy Explained: Energy Use in Industry. Use of Energy in Industry-U.S. Energy Information Administration (EIA). 22 August 2021. Available online: https://www.eia.gov/energyexplained/use-of-energy/industry.php#:~:text=Within%20the%20industrial%20sector%2C%20manufacturing,%2C%20oil%2C%20and%20natural%20gas (accessed on 12 December 2021).
- The Food and Agriculture Organization of the United Nations (FAO). “Energy-Smart” Agriculture Needed to Escape Fossil Fuel Trap; FAO: Rome, Italy, 2011; Available online: https://www.fao.org/news/story/en/item/95161/icode/ (accessed on 12 December 2021).
- Hitaj, C.; Suttles, S. Trends in U.S. Agriculture’s Consumption and Production of Energy: Renewable Power, Shale Energy, and Cellulosic Biomass, EIB-159; U.S. Department of Agriculture, Economic Research Service: Washington, DC, USA, 2016. [Google Scholar]
- U.S. Department of Agriculture. Ag and Food Sectors and the Economy. 2019. Available online: https://www.ers.usda.gov/data-products/ag-and-food-statistics-charting-the-essentials/ag-and-food-sectors-and-the-economy/ (accessed on 14 November 2019).
- Brown, E.; Elliott, R.N. On-Farm Energy Use Characterizations; American Council for an Energy-Efficient Economy: Washington, DC, USA, 2005. [Google Scholar]
- U.S. Department of Agriculture Census of Agriculture. 2017. Available online: https://www.nass.usda.gov/AgCensus/ (accessed on 12 December 2021).
- Schultz, C.D.; Man, J.; Rosenfeld, M.; McCurdy, M.; Anderson, K.; Jaglo, B.; Goossen, M.; Kaffel, J.M.; Farrell, F.; Wissell, T.; et al. Renewable Energy Trends, Options, and Potentials for Agriculture, Forestry, and Rural America; U.S. Department of Agriculture, Office of the Chief Economist: Washington, DC, USA, 2021. [Google Scholar]
- U.S. Department of Agriculture. History of Wind Power. U.S. Energy Information Administration (EIA). Washington, DC, USA. 17 March 2021. Available online: https://www.eia.gov/energyexplained/wind/history-of-wind-power.php (accessed on 27 January 2022).
- Energy Information Administration. Texas-State Energy Profile. State Profile and Energy Investments. April 2021. Available online: https://www.eia.gov/state/?sid=TX#:~:text=Texas%20leads%20the%20nation%20in,power%20plants%20combined%20in%202020 (accessed on 25 January 2022).
- Solar Energy Industries Association. Texas Solar; SEIA. Available online: https://www.seia.org/state-solar-policy/texas-solar (accessed on 27 January 2022).
- United States Department of Agriculture. Energy Investment Report. USDA Energy Investments. Available online: https://www.wctsservices.usda.gov/Energy/maps/EnergyReport (accessed on 25 January 2022).
- Krishnamurthy, A.; Serpell, O. Harvesting the Sun: On-Farm Opportunities and Challenges for Solar Development; Kleinman Center for Energy Policy: Philadelphia, PA, USA, 2021; Available online: https://kleinmanenergy.upenn.edu/research/publications/harvesting-the-sun-on-farm-opportunities-and-challenges-for-solar-development/ (accessed on 27 January 2022).
- Tomascik, J. Solar Panels Crop Up across Texas, Divide Rural Communities. Texas Farm Bureau. 23 August 2021. Available online: https://texasfarmbureau.org/solar-panels-crop-up-across-texas-divide-rural-communities/ (accessed on 25 January 2022).
- International Renewable Energy Agency (Irena). Renewable Energy Benefits: Measuring the Economics; International Renewable Energy Agency (Irena): Masdar City, Abu Dhabi, 2016. [Google Scholar]
- United States Department of Agriculture. USDA Invests $464 Million in Renewable Energy Infrastructure to Help Rural Communities, Businesses and Ag Producers Build Back Better; USDA: Washington, DC, USA, 21 September 2021. Available online: https://www.usda.gov/media/press-releases/2021/09/09/usda-invests-464-million-renewable-energy-infrastructure-help-rural#:~:text=These%20climate%2Dsmart%20investments%20will,through%20the%20Electric%20Loan%20Program (accessed on 25 January 2022).
Figure 1.
Energy potential in Texas: (a) wind (MWh/year) and (b) solar (kWh/year).

Figure 2.
Texas 2020 Census of Population Data (in quartiles).

Figure 3.
Number of farms in Texas.

Figure 4.
Chart representing the solar potential by category.

Figure 5.
Number of farms by solar energy potential.

Figure 6.
Number of farms by wind energy potential.

Figure 7.
Chart representing the distance between farm and cities in Texas.

Figure 8.
The most populated counties with higher energy potential: (a) solar and (b) wind.

Figure 9.
Distance (km) between counties with higher solar energy potential and the five largest cities in Texas.
Figure 9.
Distance (km) between counties with higher solar energy potential and the five largest cities in Texas.

Figure 10.
Distance (km) between the counties with higher wind energy potential and the five largest cities in Texas.
Figure 10.
Distance (km) between the counties with higher wind energy potential and the five largest cities in Texas.


Table 1.
Number of farms by region in Texas.
| Region | Number of Farms |
|---|---|
| Central | 72,196 |
| East | 63,272 |
| North | 75,666 |
| South | 18,936 |
| West | 18,346 |
| Total | 248,416 |
Publisher’s Note: MDPI stays neutral with regard to jurisdictional claims in published maps and institutional affiliations. |
© 2022 by the authors. Licensee MDPI, Basel, Switzerland. This article is an open access article distributed under the terms and conditions of the Creative Commons Attribution (CC BY) license (https://creativecommons.org/licenses/by/4.0/).
Share and Cite
MDPI and ACS Style
Cruz Mendoza, M.; Martinez-Gomez, E.; Li, H. Feasibility Analysis of Promoting Wind and Solar Energy in Texas Farms. Sustainability 2022, 14, 2222. https://0-doi-org.brum.beds.ac.uk/10.3390/su14042222
AMA Style
Cruz Mendoza M, Martinez-Gomez E, Li H. Feasibility Analysis of Promoting Wind and Solar Energy in Texas Farms. Sustainability. 2022; 14(4):2222. https://0-doi-org.brum.beds.ac.uk/10.3390/su14042222
Chicago/Turabian StyleCruz Mendoza, Mariee, Erick Martinez-Gomez, and Hua Li. 2022. "Feasibility Analysis of Promoting Wind and Solar Energy in Texas Farms" Sustainability 14, no. 4: 2222. https://0-doi-org.brum.beds.ac.uk/10.3390/su14042222
Note that from the first issue of 2016, this journal uses article numbers instead of page numbers. See further details here.