Article

Sustainable Diet Optimization Targeting Dietary Water Footprint Reduction—A Country-Specific Study

1
Department of Agricultural Business and Economics, Institute of Agricultural and Food Economics, Hungarian University of Agriculture and Life Sciences, 1118 Budapest, Hungary
2
Faculty of Education and Psychology, ELTE Eötvös Loránd University, 1075 Budapest, Hungary
3
Department of Science Policy and Scientometrics, Library and Information Centre of the Hungarian Academy of Sciences, 1051 Budapest, Hungary
4
MS-Nutrition, 13005 Marseille, France
5
Division of Nutritional Epidemiology, National Institute of Pharmacy and Nutrition, 1051 Budapest, Hungary
*
Author to whom correspondence should be addressed.
Sustainability 2022, 14(4), 2309; https://0-doi-org.brum.beds.ac.uk/10.3390/su14042309
Submission received: 6 January 2022 / Revised: 13 February 2022 / Accepted: 15 February 2022 / Published: 17 February 2022

Abstract

:
Food production creates 70% of the total anthropogenic water footprint, and it is the main cause of water pollution. Thus, more sustainable diets could contribute to the achievement of the Sustainable Development Goals. A linear programming-based stepwise optimization was designed to create dietary water footprint-reduced, culturally acceptable, and healthier diets in the case of Hungary based on a representative dietary survey. Optimization resulted in a considerable total dietary water footprint reduction (women: 18%; men: 28%) with a moderate dietary shift (~32%). Milk and dairies (observed: ~31.5%, optimized: ~20.5%) and meats and meat products (observed: ~28.0%, optimized: 28.9%) contributed the most to the dietary water footprint. In the water footprint–healthiness synergy, the vegetables, eggs, poultries, and fermented dairies were the most beneficial, increasing in amount, while fatty dairies, foods high in added sugar, and meat products were the most non-beneficial food sub-groups, decreasing in amount in the optimized diets. The problematic nutrients to fulfill in the optimized diets were energy, dietary fibers, sodium, vitamin D, zinc, vitamin B12, calcium, iron, and potassium at the maximum water footprint reduction. The study provides supporting evidence about the dietary water footprint–healthiness synergy for the further improvement of the national food-based dietary guideline.

1. Introduction

The Sustainable Development Goals (SDGs) were defined to address the threatening global challenge of population growth, depleting natural resources, and climate change. In order to achieve the SDGs, several acts and action plans were developed to protect the environment and natural resources and to keep human activity within the local and planetary boundaries [1,2]. Pressures on the environment created by mankind can be measured by the footprint family and other metrics that help to resolve challenges towards a more sustainable future [1,3]. According to the concept of Water–Energy–Food (WEF) nexus, water, energy, and food security are closely connected to each other and related to the consumer level, and the issues linked to this nexus are targeted by the 2nd, 6th, and 7th SDGs [1]. Furthermore, The European Union policymakers set a target to ensure Europe’s food and nutrition security through the SUSFANS (Food system for health, environment and enterprise in the EU) project, that connects food production and consumption based on the “farm to fork” principle [4]. Sustainable nutrition is a holistic and complex approach to address the harmful environmental pollution and resource use related to food production and consumption. It is defined as “…protective and respectful of biodiversity and ecosystems, culturally acceptable, accessible, economically fair and affordable; nutritionally adequate, safe and healthy; while optimizing natural and human resources” [5]. Water use and pollution are among the main critical problems, as water resources are limited to access [1] and profoundly essential for food production, that is creating as much as 70% of the total anthropogenic water footprint and being the main cause of water pollution [6]. In addition, the (mainly blue) water footprint often shows different trade-offs compared to other footprints [7,8,9,10,11,12]. On the other hand, dietary risk factors are the second largest (after tobacco use) contributors to the development of Noncommunicable diseases (NCDs), that are the leading cause of death in the developed countries [13], and thus a shift towards a healthier diet would also be critically important regarding the issue of health.
There are different conceptual approaches to study the theoretical shift towards a more sustainable diet on a local or global level. The two main methods are the dietary scenario analysis and diet optimization studies [10,14,15,16,17], and they are primarily focused on the reduction of dietary greenhouse gas emission (GHGE) as the environmental impact category, among several other metrics. Numerous studies have concentrated on the water footprint consequences of dietary shifts towards healthier diets based on scenario analyses. According to the review by Harris et al. [18], a 25.2% total water footprint reduction could be reached by changing to a plant-based diet, and 6.0% by changing to healthier diets in a global context [18]. To date, relatively few studies have applied diet optimization focusing on a water footprint reduction; Chaudhary et al. [11] optimized diets with five environmental impact categories (including water footprint) for 152 countries [11]; Gephart et al. [12] also applied more environmental impact categories in a population study in the United States of America (USA) [12], while Milner et al. [19] focused on India and a blue water footprint [19]. Jalava et al. [20] focused on a diet optimization fulfilling the World Health Organization’s (WHO) dietary recommendations for 176 countries, which resulted in a 100–0 l/capita/day blue water and 500–1000 l/capita/day green water footprint reduction for the region of Hungary [20]. Diet optimization based on linear programming is a well-proven method to resolve dietary problems and could provide the advantage of controlling every desired aspect of sustainable nutrition [15,16]. Furthermore, sustainable diet optimization should be context-specific [7] due to such aspects as the traditional diet, health status, and water consumption of different countries. Based on a review of the most relevant studies, it seems that the majority of sustainability-related publications used a diet optimization focus on GHGE problems or several environmental impact categories at the same time [15,16,17]. Besides, they focused on diet optimization to reduce the water footprint on a multi-country scale or non-European countries [11,12,19,20]. Furthermore, regarding the results in the context of Hungary, the studies either ran analyses only on freshwater use (i.e., blue water) or did not conduct a detailed assessment of the food subgroups and problematic nutrients. Moreover, they considered food supply values and not dietary survey data, that are more accurate in the terms of direct food consumption [11,20]. The present paper introduces a comprehensive and a country- and context-specific assessment of the dietary water footprint, accounting for both water-use and water-pollution indicators (blue, green, and grey water footprint) and a detailed analysis of the food subgroup level and problematic nutrients.
This study aimed to apply the state-of-the-art methods [15,16] of diet optimization on a country-specific case based on the methodology used in French population studies [21,22] that aimed to reduce greenhouse gas emission (GHGE) while fulfilling nutritional recommendations and cultural acceptability. In this study, diet optimization was designed to reduce the total dietary water footprint, provide a healthier diet, and adhere to the observed diet based on the data from the representative Hungarian Diet and Nutritional Status Survey (HDNSS) carried out in 2014 [23].
The objective of the study was twofold: first, the methodological approach applied in this study could contribute to further studies on sustainable nutrition in Hungary. Besides, it also aims to provide supporting scientific evidence for the further improvement of sustainability-focused national food-based dietary guidelines by assessing the following research questions, that determined the design of this study:
(Q1)
What is the maximum total dietary water footprint reduction possible in diets designed to be nutritionally adequate and respect cultural acceptability?
(Q2)
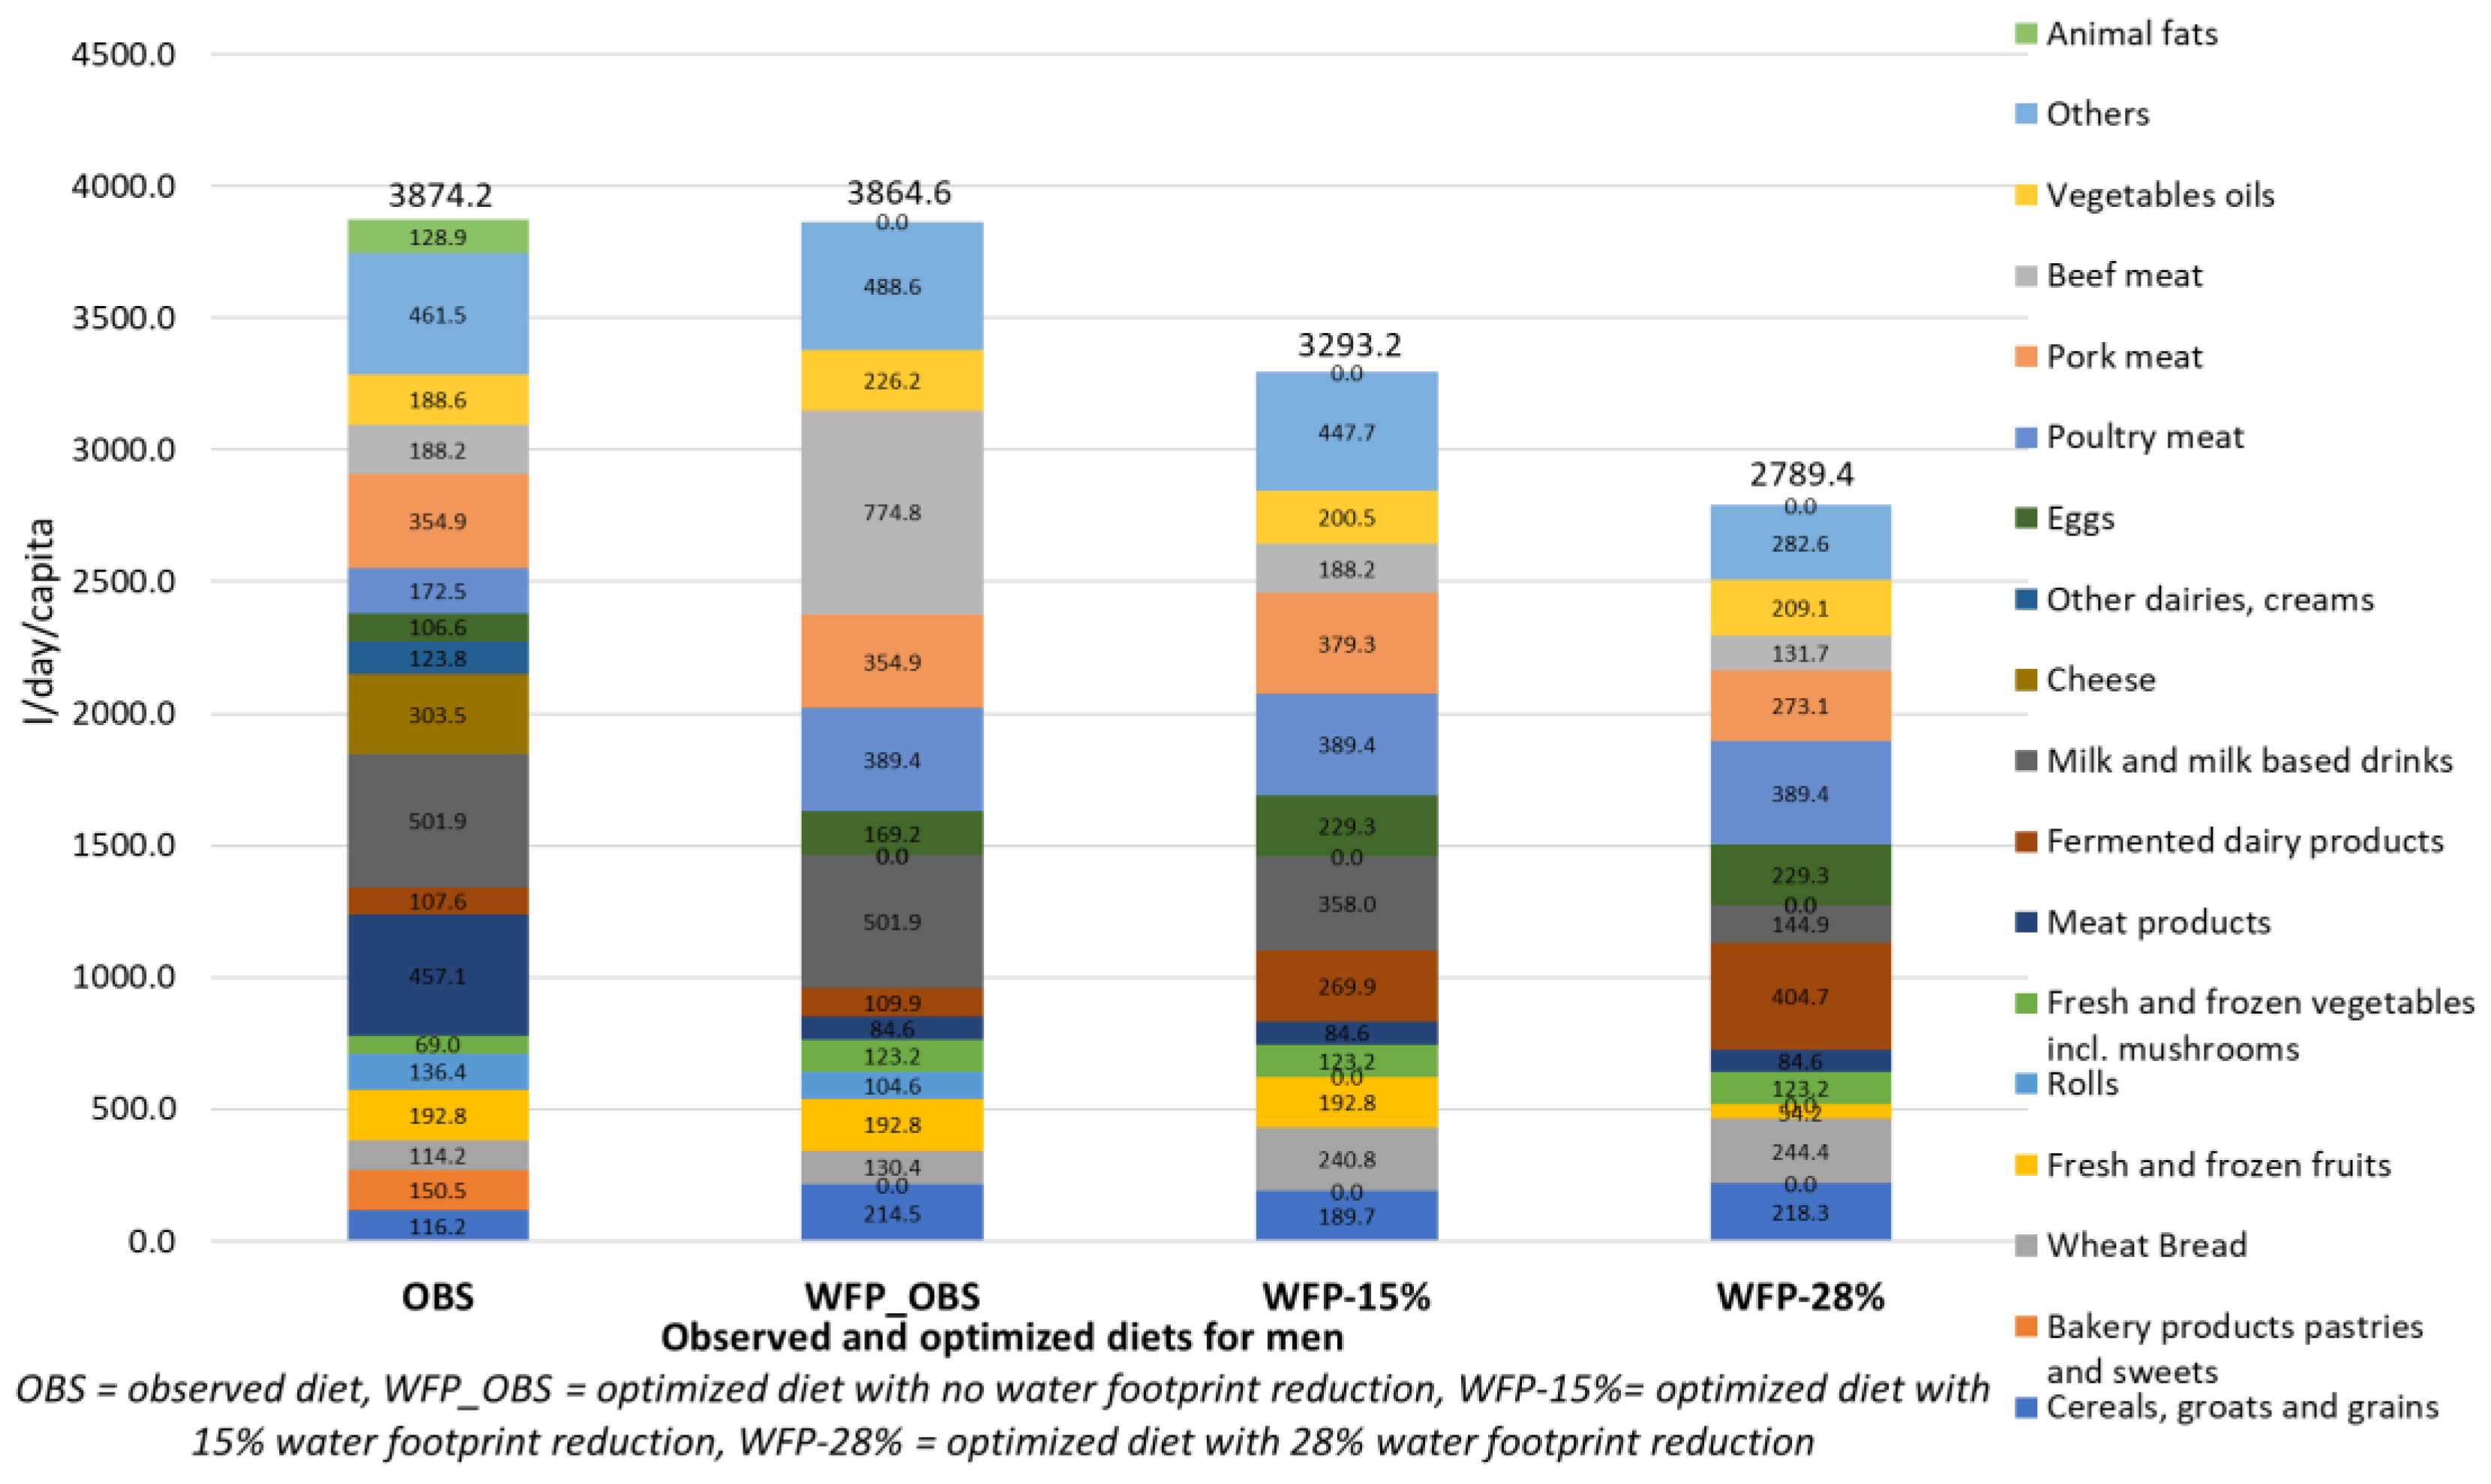
What are the major total dietary water footprint contributors among food groups and subgroups in the observed and optimized diets?
(Q3)
What dietary shift is needed for the optimized diets designed to be nutritionally adequate, water-footprint-reduced, and cultural-acceptability-focused?
(Q4)
What are the problematic nutrients to fulfill in the optimized diets designed to be nutritionally adequate, water-footprint-reduced and cultural-acceptability-focused?

2. Materials and Methods

In short, the study was based on an optimization model using linear programming. As the input of this model, a country-specific database was created that included the following datatypes: (1) food consumption data, (2) energy and nutrient composition of foods, (3) recommended dietary intake values (RDIs), and (4) blue, green, and total water footprint as environmental impact measures.

2.1. Food Consumption Data

Food consumption data originated from the Hungarian Dietary and Nutritional Status Survey’s cross-sectional study, conducted by the National Institute of Pharmacy and Nutrition in 2014, and a more detailed description of the survey design is provided elsewhere [23]. This study was representative of the Hungarian adult population (≥18 years) by gender and age and included a 3-day dietary record analysis from which the mean food intake amounts were estimated (n = 857). These were the newest data at the time of analysis. For this study, the food intake values classified as „dietetic sub-groups” were used as input data. In these sub-groups, the food items consumed by the individuals were originally aggregated by the diet analysis software (“Nutricomp Étrend 4.0”) used in the HDNSS 2014 survey [24]. This software was developed as a country-specific diet analysis tool and includes traditional Hungarian foods and meals, and “dietetic-groupings” refers to the food classification typically used among nutritionists and dietitians. Only food sub-groups with the mean intake >4 g/day/capita were included in the model. After the further aggregation of some food categories (e.g., mushrooms and vegetables), the database included 35 food sub-groups that could be further aggregated into 11 major food groups (Supplementary Materials, Table S1).

2.2. Nutritional Composition Values

The nutritional composition data of the food sub-groups were acquired from the Food and Nutrient Database for Dietary Studies (FNDDS) of the US Department of Agriculture (USDA) [25]. These included energy and nutrient values for 26 nutrients of each food sub-group for a 100 g edible food portion. The added sugar (g/100 g) content was estimated from the total sugar content (g/100 g) originated from the method by Louie et al. [26], distinguishing four groups: (1) no sugars (added sugars = 0, e.g., animal fats), (2) no added sugars (added sugars = 0, e.g., legumes), (3) all sugars added (added sugars = total sugars, e.g., carbonated soft drinks), and (4) both natural and added sugars (added sugars = 50% of total sugars, e.g., jams). This estimation was necessary because the FNDDS database does not include added sugars, and Hungarian recommendations are traditionally considered in this category among sugars [23].

2.3. Recommended Dietary Intake Values (RDIs)

Recommended dietary intake values were applied in this study as minimum and/or maximum constraints in the diet optimization models related to all included nutrients (n = 26). Most RDI values were based on the work of Vieux et al. [21] applied to European countries, and the majority of values are originally from the recommendations of the European Food Safety Authority (EFSA) [27], but the Food and Agriculture Organization of the U.S. (FAO)/WHO’s joint recommendation [28], the WHO’s recommendation [29] and Hungarian recommendation [30] were also used in specific cases. Energy values were specifically estimated based on the Hungarian recommendations, anthropometric data [31], and the mean range of age of the analyzed population (age groups 40–49) and assuming a moderate physical activity as maximum values and 300 kcal reduction from maximum as the minimum value, close to the low physical activity energy requirements (men: 2300–2600 kcal/day, women: 1700–2000 kcal/day). For micronutrients, RDIs were considered in the unit of g, mg, or μg/100 g, and for macronutrients the energy share (of total dietary energy intake) was considered, in percent. Further details on the RDI values and sources are presented in the Supplementary Materials, Table S2.

2.4. Dietary Water Footprint Data

The water footprint is an environmental impact indicator that measures both fresh water used as a resource (blue and green water) and pollution, precisely, assimilating waste water (grey water) [1,32]. Regarding food products, water footprint measures the volume of water used to produce a kg of food item that includes direct and indirect water use, such as the embodied fresh water to produce feed for livestock. There are three types of water footprint value: (1) green water originates mainly from precipitation and water stored in the soil, which is the most important for agricultural production, (2) blue water that is, ground or surface water, is the most relevant for irrigation and industrial and domestic use, and (3) grey water is used for diluting polluted water to meet the legal standards [33]. Traditionally, blue water is considered for sustainable nutrition studies. However, in recent years, the inclusion of green water has been supported and applied [18,32,34,35,36,37]. In this study, the blue, green, and total water footprints were regarded as separate metrics, among which the focus was put on the total water footprint value (that includes grey water) expressed as l/kg of food items that were transformed to diets as l/day/capita. Dietary water footprint data on crops (plant-based) and livestock (animal-based) foods were acquired from the Water Footprint Network (WFN) Database [38,39]. This database is frequently used for dietary water footprint analyses that make comparisons reasonable between different studies [18,34]. Water footprint values from the WFN database are country- and region-specific. For this analysis, the Hungarian national average values were considered for livestock, the weighted average of grazing, and mixed and industrial husbandry. For the water footprint value of fishes, Pahlow et al.’s [40] estimation was applied, since the WFN database does not contain values for fishes. Hungary has a high agricultural production potential, which is why we assumed that the products that can be produced in Hungary were actually produced there. This hypothesis does not necessarily reflect the reality, because, due to cost differences, Hungary imports food products which could be produced in the country (e.g., potatoes, apples). The global average of the dietary water footprint was considered for those food items that are not produced in Hungary (e.g., olive oil). Consequently, the estimation of the dietary water footprint was based on the so-called “bottom-up” approach, in which the dietary water footprint is calculated by considering the national food consumption values multiplied by the specific water footprint values of food items [41].

2.5. Data Compilation

The database was composed by matching the 35 food sub-groups with the metrics that included the nutritional composition and water footprint values. When a food sub-group had an equivalent in the nutritional composition and/or water footprint (e.g., eggs), they were simply matched. In case there were several matches, food items were related following the methods of Gazan et al. [42]: briefly, either the population mean intake (g/day/capita) weighted average was considered (e.g., vegetables), or a most commonly consumed food item was chosen as representative of the sub-group (e.g., liver for the offals food sub-group). In some cases, when further specification was needed to calculate the metrics for a food sub-group, other, Hungary-specific data sources were applied (e.g., data from the Central Statistical Office of Hungary [43] for the weighted average of vegetables, the Food Balance Sheets of FAO [44] for the type of cereals, or the Hungarian School Catering Recipes Book for the recipe of baked pastries [45]).

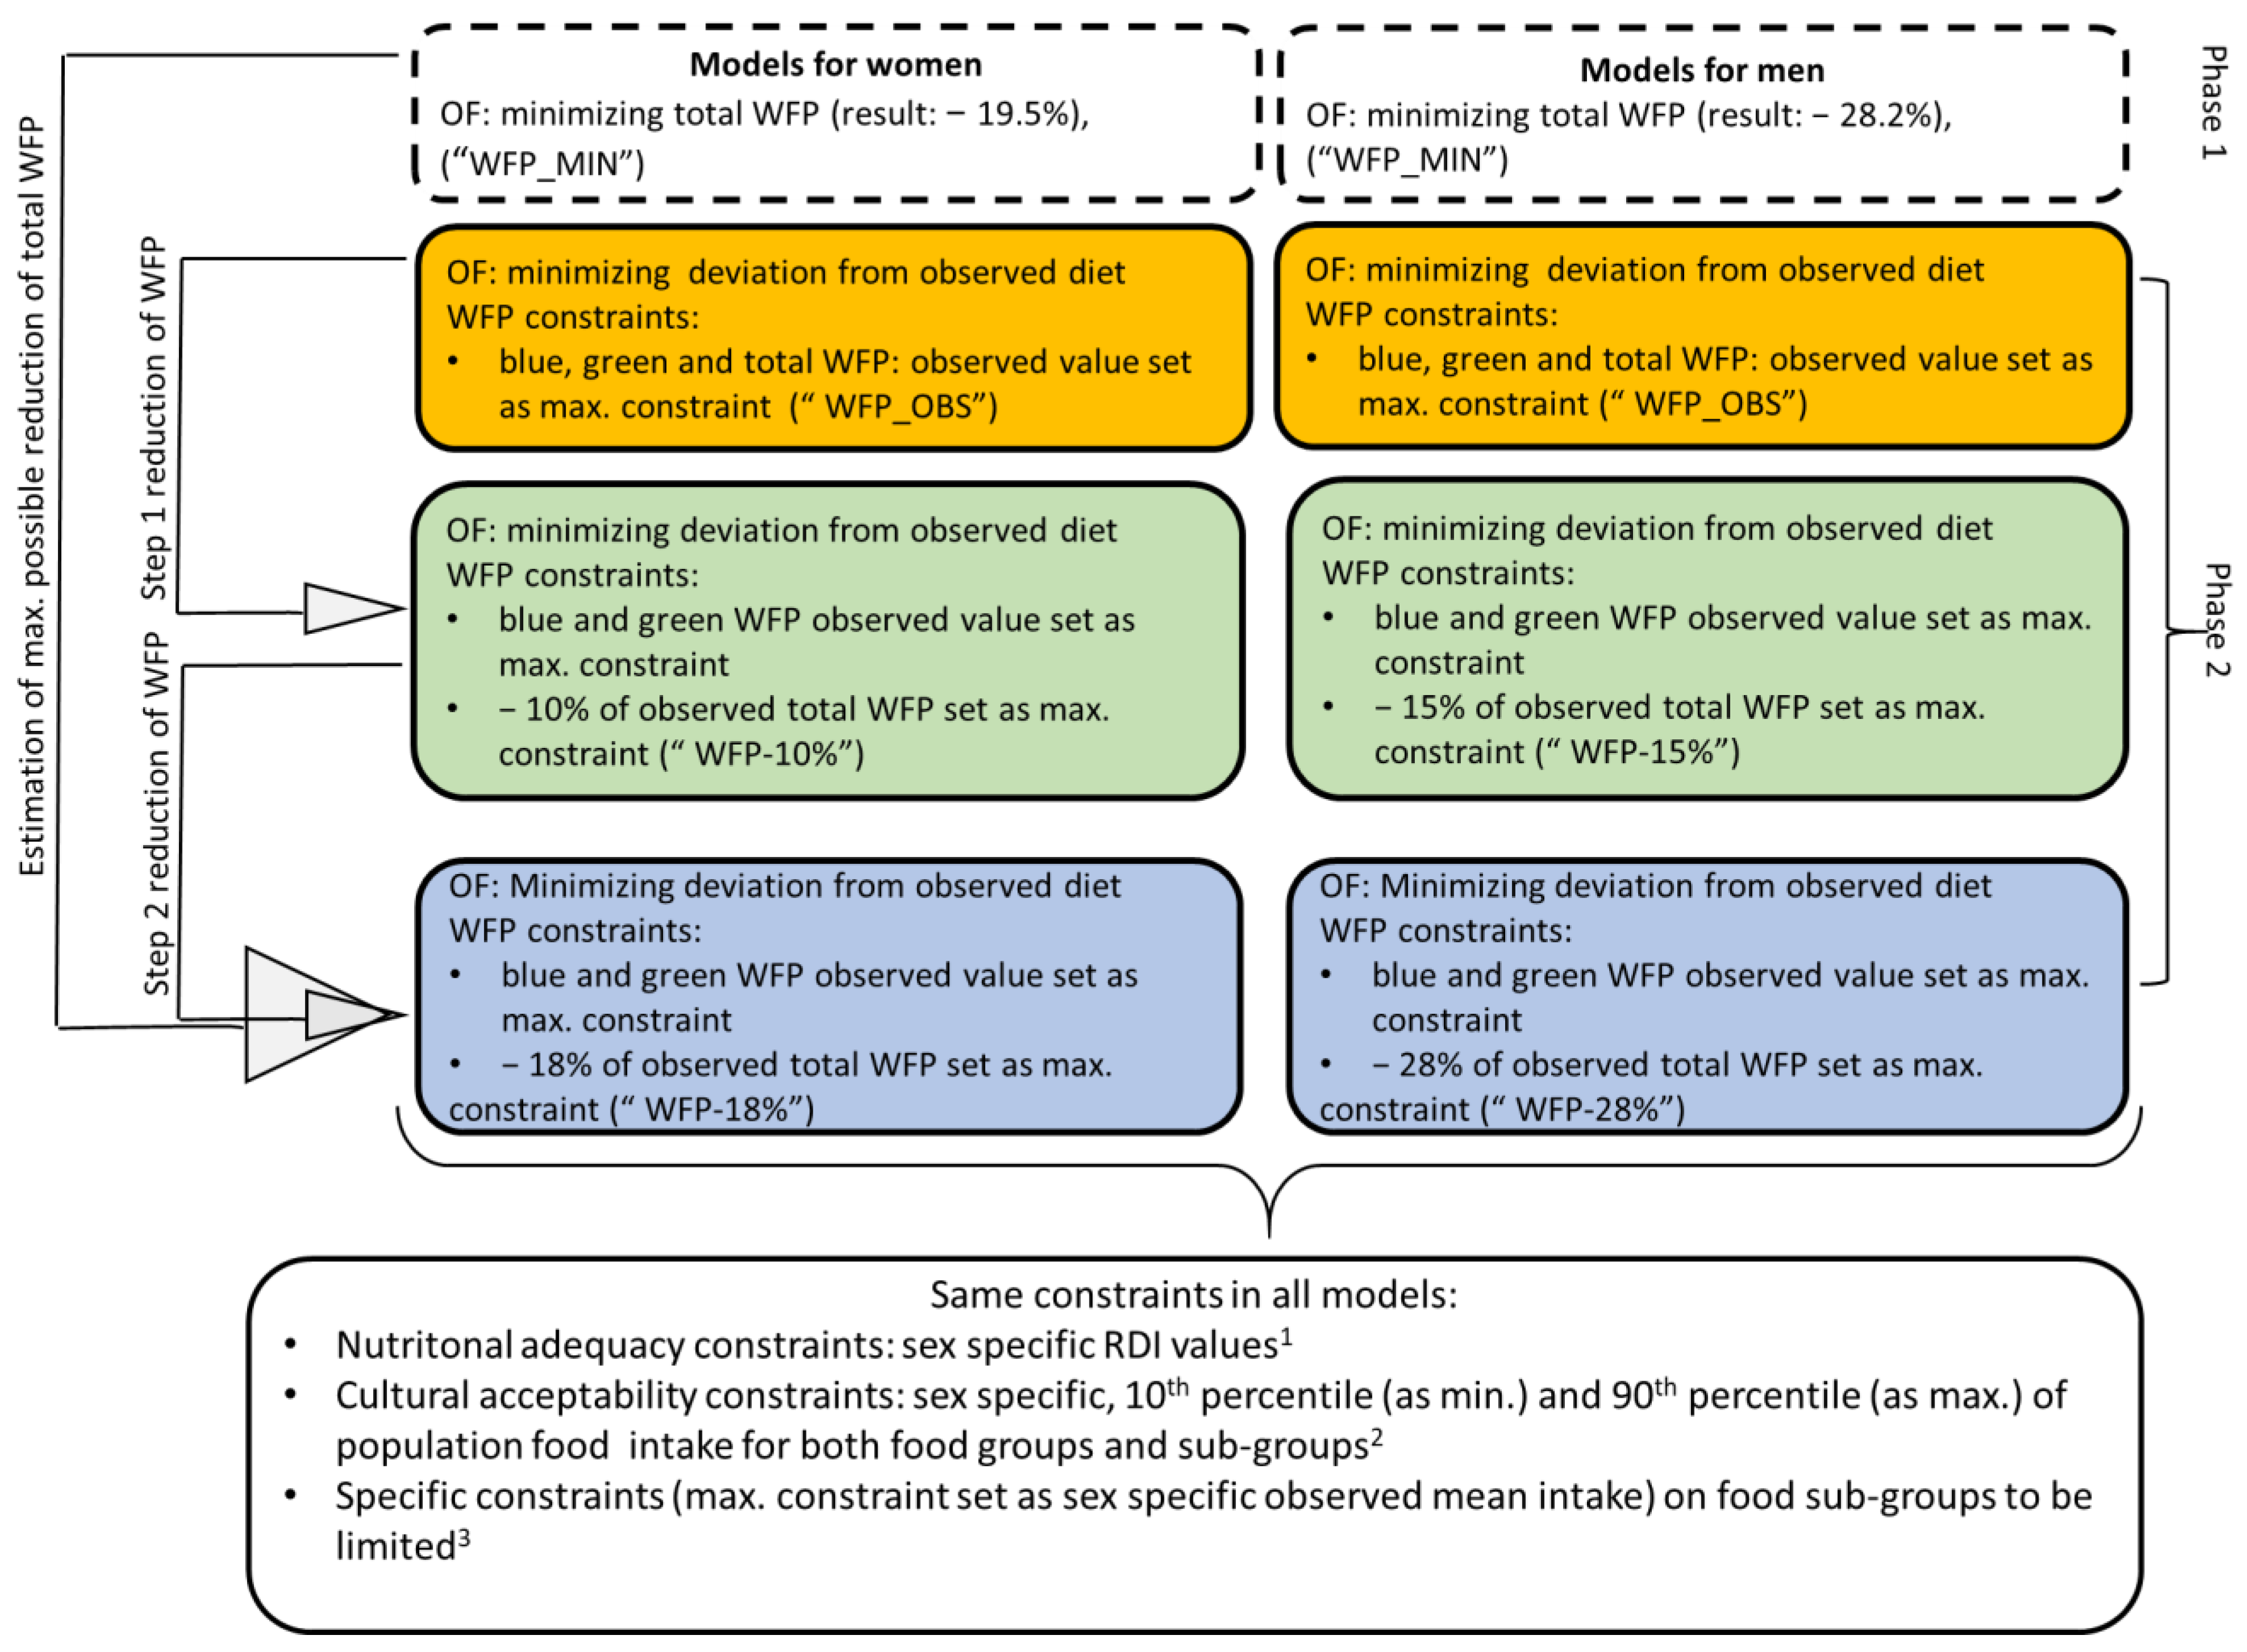
2.6. Diet Optimization Model

The diet optimization was population-based, meaning that the model was based on an average observed diet (n = 1) [15]. The optimization process was conducted separately for men and women, and thus there were different sex-specific models. The model is originally based on Perignon et al.’s [22] work on optimization with linear programming, that aims to reach nutritional adequacy and a stepwise reduction of GHGE while staying as close as possible to the observed diet (i.e., culturally acceptable) [22]. Vieux et al. [21] later adopted this methodology, on European countries that provided another rationale for this study [21]. Similarly, this model was designed to ensure nutritional adequacy and cultural acceptability, by staying close to the observed diet, and targeted a stepwise reduction in the dietary water footprint.

2.7. Parameters of the Model

Linear programming-based optimization models were created, consisting of the following input parameters: (1) decision variables (food sub-groups), (2) constraints defining the targets for the optimized diet, and (3) an objective function (to be minimized or maximized) that drives the dietary shift to reach the constraints [15,16]. The decision variables were the 35 food sub-groups with the sex-specific mean intake values from the HDNSS 2014 study [23]. There were three types of often described [15,16] constraints: nutritional adequacy (Supplementary Materials, Table S2), cultural acceptability (Supplementary Materials, Tables S3–S6), and stepwise environmental impact reduction. In our study, the environmental measure was based on the water footprint, and different levels of reduction were tested, while nutritional adequacy and cultural acceptability constraints were the same in all models. Two different objective functions were defined: the first one was set to minimize the total water footprint values (Equation (1)):
m i n i m i z e   f = i = 1 35 Q i W i
where i represents the 35 food sub-groups, Q is the quantity of food sub-groups (g/day/capita), and W is the total water footprint (l/g) of food sub-groups. The second objective function was defined to minimize the relative deviation from the observed diets to fulfill the cultural acceptability aspect as much as possible (Equation (2)):
m i n i m i z e   f = i = 1 35 A B S Q o p t , i Q o b s , i Q o b s , i
where i represents the 35 food sub-groups, ABS refers to the absolute value, Qopt is the optimized quantity of food sub-groups, and Qobs is the mean observed quantity of food sub-groups. Calculating the relative deviation from the observed value allowed us to consider the proportion of each food sub-group (%) instead of the absolute change (g). This decision was based on considering the weight change in different food sub-groups to be more equal (i.e., “relative”) and to benefit food sub-groups with a lower intake to keep the optimized diets more diverse. The explanation is that even small changes in a low amount of food sub-groups cost considerably in this model (compared to models operating based on the absolute weight change), and thus these sub-food-groups were less likely excluded. Besides, this objective function favors a larger variation on fewer foods [15], which is advantageous in this model, since there are several food sub-groups with low intake and 0 in the 10th percentile (i.e., the minimum limit).

2.8. Phases of Optimization and Models

In phase 1, the maximum possible reduction (minimizing the water footprint as an objective function (Equation (1)) in the water footprint was estimated for both sexes (WFP_MIN models) to set target values for the stepwise reduction for phase 2. In phase 2, the objective functions were set to minimize the relative deviation from the observed diets (Equation (2)), starting with a “zero” model with no reduction in the water footprint, by setting the maximum water footprint constraints as lower or equal to the observed values while fulfilling the recommended nutritional requirement limits, resulting in a healthier diet (WFP_OBS models). Step 1 reduction was around 50% of the maximum possible reduction for both sexes, while step 2 reduction was set as the maximum possible reduction value (WFP-X% models). The 8 models (4 for women and 4 for men) were designed to be nutritionally adequate (i.e., healthier diets) and culturally acceptable, ensured by the constraints (details on the models are shown in Figure 1).

2.9. Analysis of Results

Population-based diet optimization is not suitable for statistical analyses, since there is only one average observed and optimized diet [15]. The dietary water footprint of observed and optimized diets was calculated in relative (in percent) and absolute water footprint change (l/day/capita) values for a comparison of the observed diets and 3–3 sex-specific models in phase 2. The “measure of change” or “dietary shift” for phase-2 optimization was the value of the objective function value (Equation (2)) that shows the difference between observed and optimized diets in the absolute sum of weight change of the food sub-groups, in %. Food groups’ and sub-groups’ contributions to the total dietary water footprint were represented with stacked column diagrams based on absolute amounts (l/day/capita). The dietary shift between the observed and the optimized diet was described with data tables showing the positive or negative change in the amount of food sub-groups (g/day/capita), where the observed diet equals 0 g/day/capita as the baseline value (the observed intake values of main and sub-food groups are listed in the Supplementary Materials, Tables S3–S6). Finally, the “strength” of nutrient adequacy constraints was evaluated by indicating whether they reached the minimum and/or maximum value in the optimized diets. For data management and database compilation, the MS Excel software and R programming [48] with Tidyverse package [49] were used, and for optimization R programming with the ROI lpSolve package [50] was used.

3. Results

At phase-1 optimization (WFP_MIN models), the maximum possible total dietary water footprint reduction was 19.5% (557.0 l/day/capita) for women and 28.2% (1084.8 l/day/capita) for men, respectively. These values provided the target values for the stepwise optimization, aiming at a water footprint reduction. Since further changes in water footprint values were defined in each model (not to exceed those observed in WFP_OBS and the stepwise reduction in WFP-X% models), the total water footprint values are changed according to the model design. Table 1 shows that green water footprints, as the type of water that makes up the considerable majority (86–87%) of the total water footprint values, were simultaneously decreasing with them. Notably, in the case of step1 water footprint reduction for women (WFP-10%), blue water showed a greater decrease than at step 2 reduction (WFP-18%) despite the green and total values and the consistent decrease in the optimized diet for men. The proportion of the blue water footprint was consistently ~2% in each model for both sexes. The value of the “dietary shift” (relative change in weight) showed that the change towards a healthier diet (WFP_OBS models) required a greater diet change for women; furthermore, the step 2 reduction (WFP-18% and WFP-28%) caused a similar diet change for the two sexes (~31%), despite a 10% greater decrease in the water footprint for men.

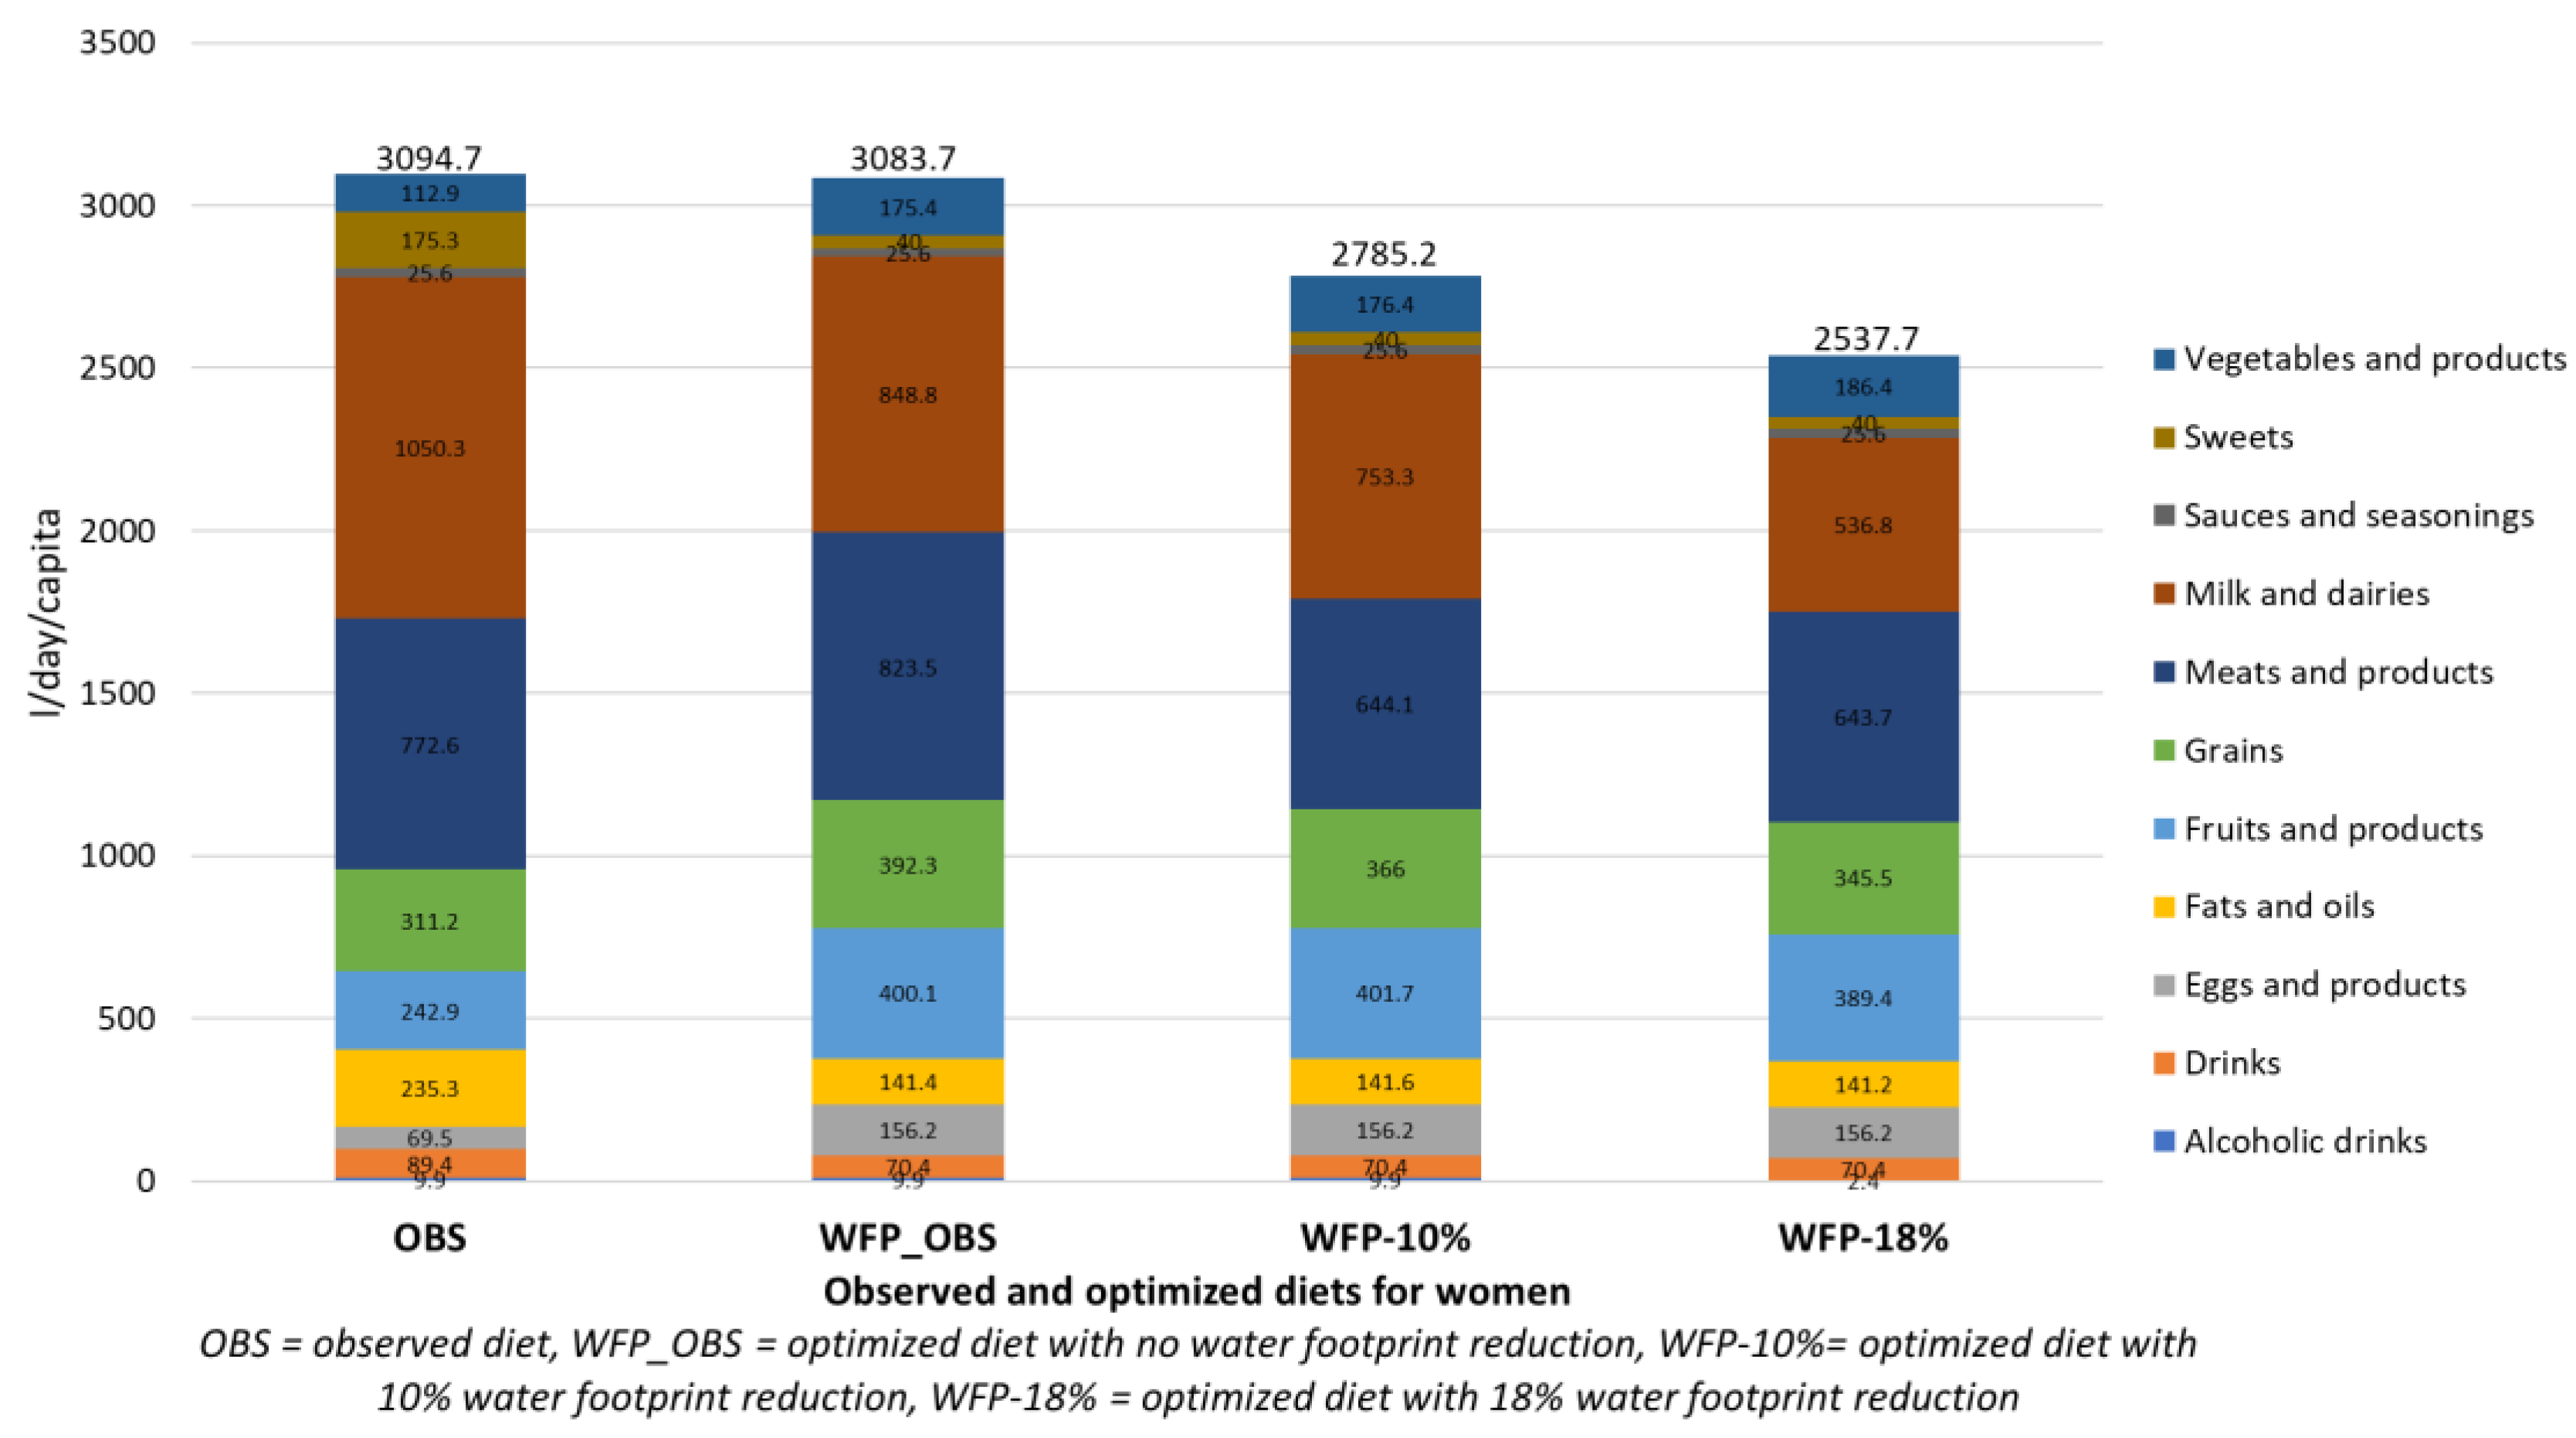
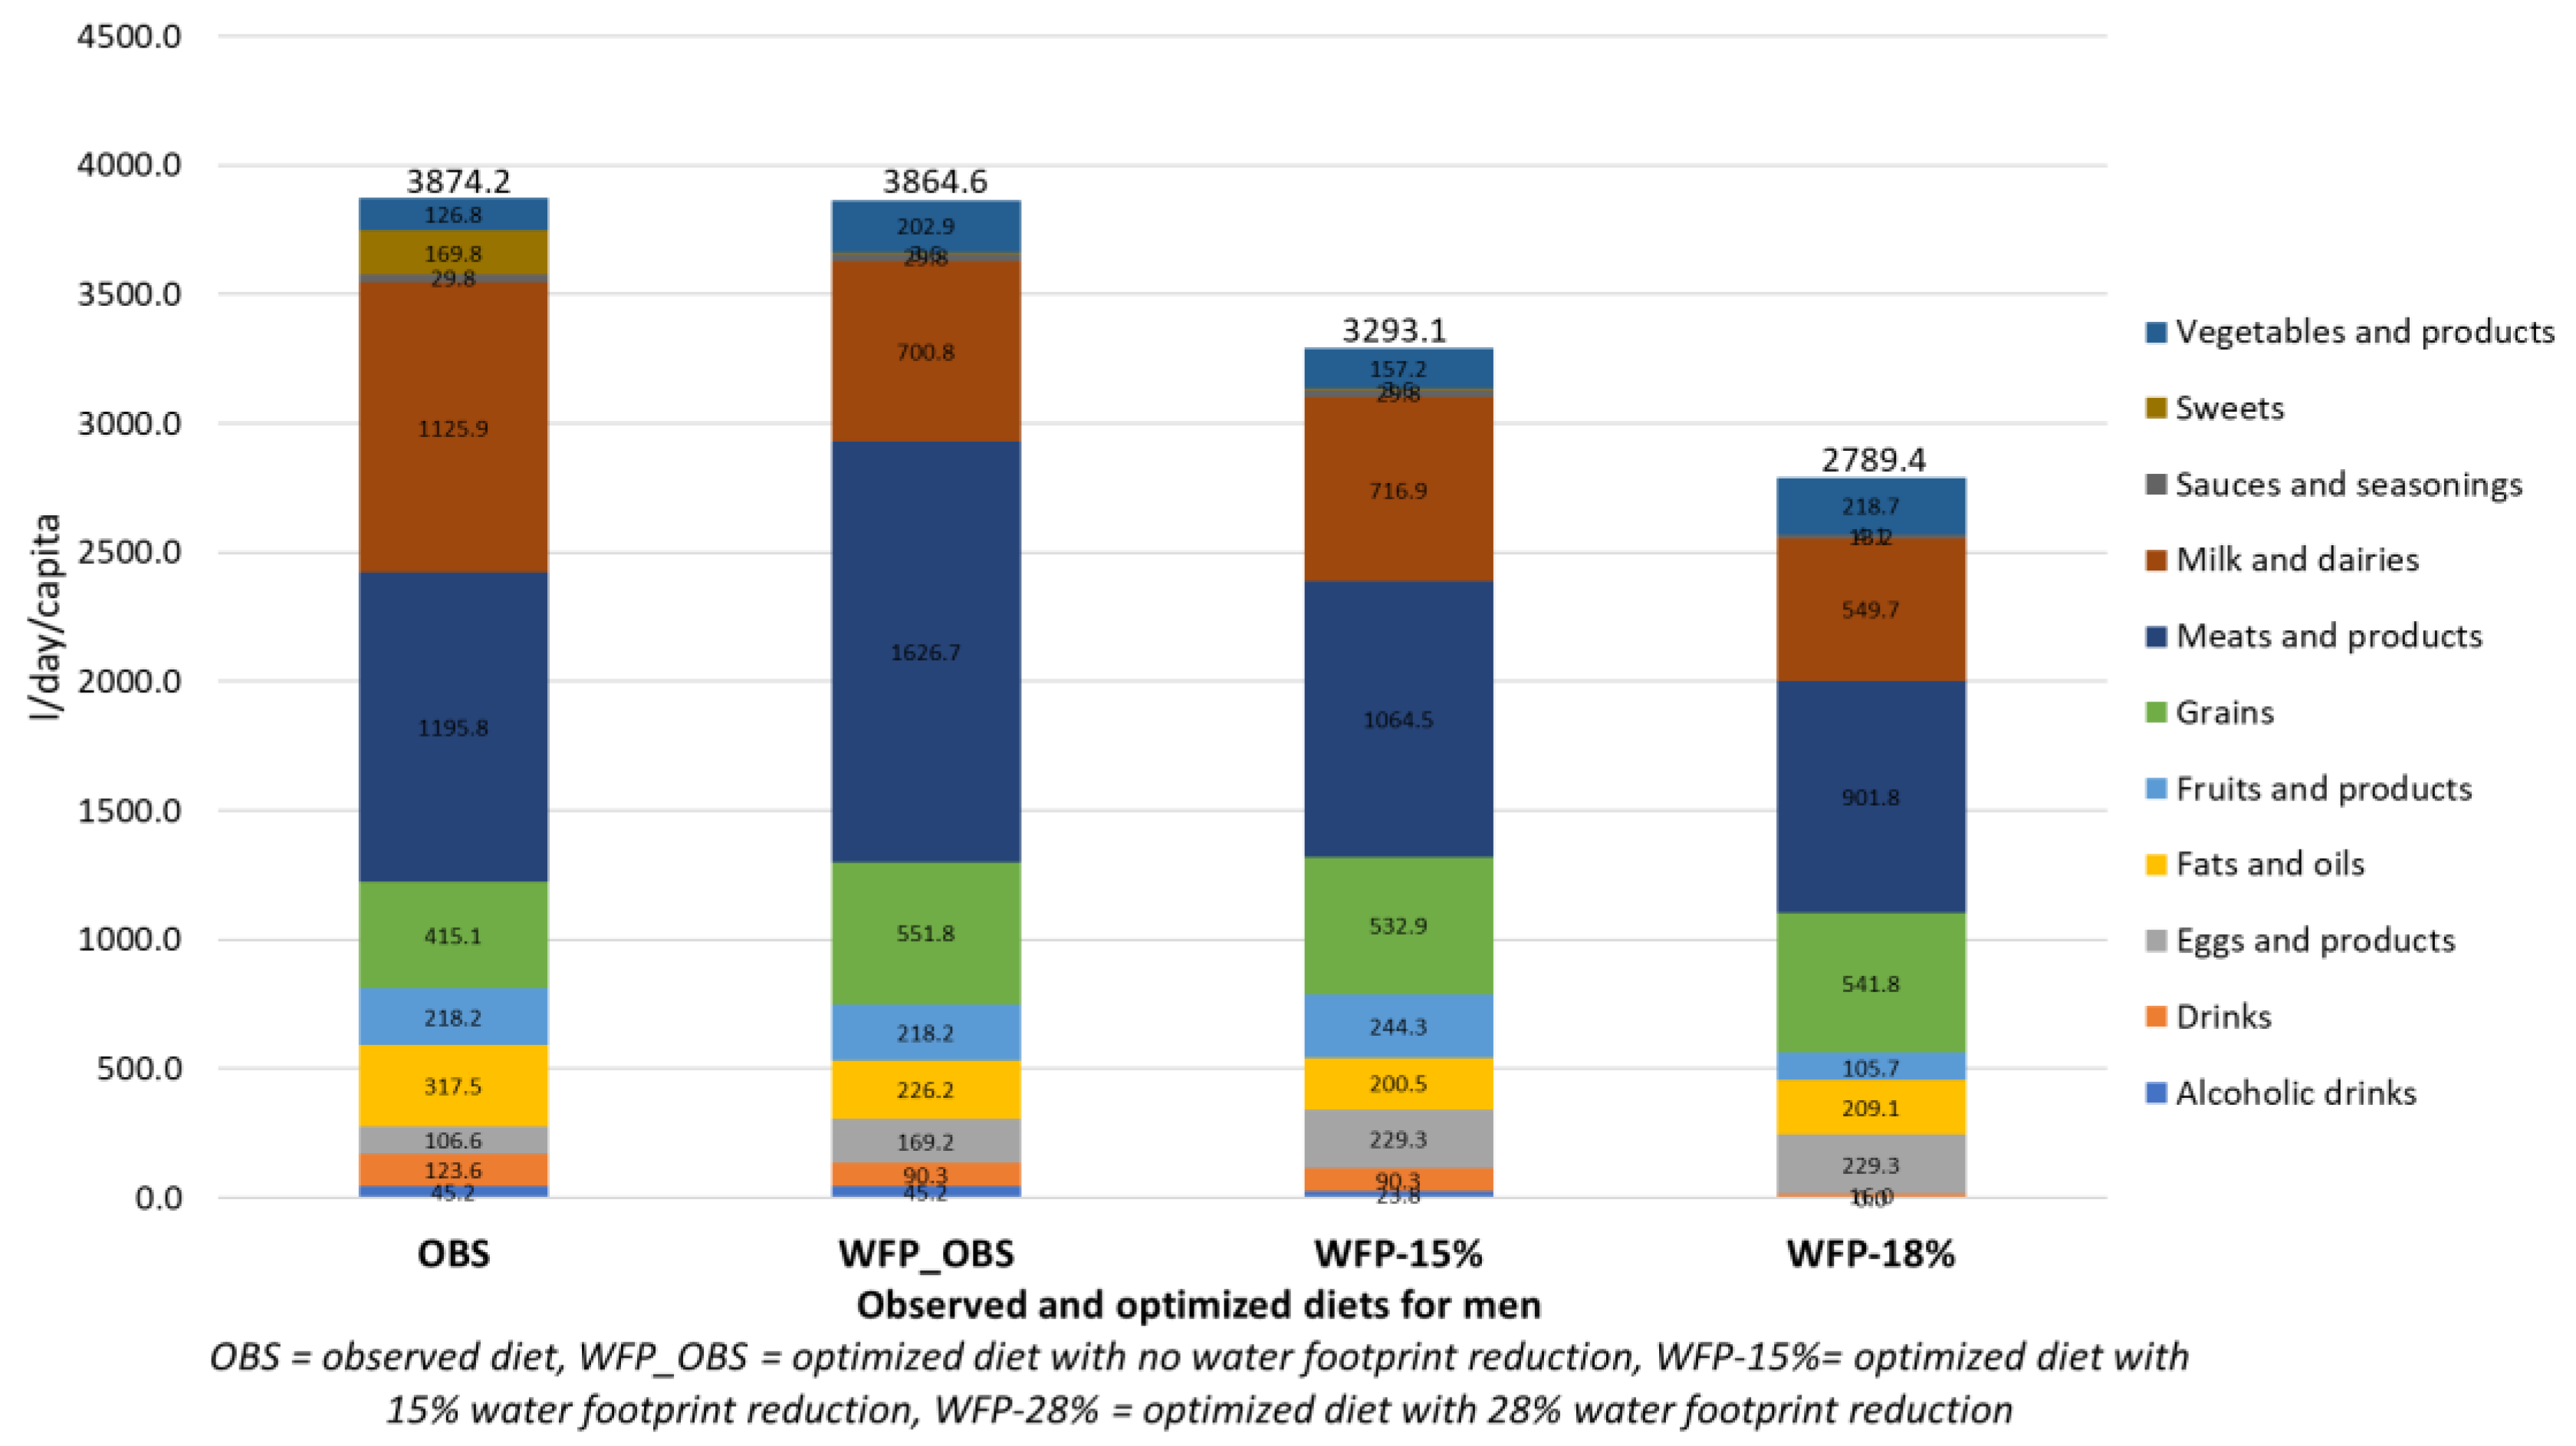
3.1. Contribution to the Total Dietary Water Footprint by the Main Food Groups

The analyses on the total water footprint contribution of the main food groups in the observed diet showed that in the case of women the “milk and diaries” group (1050.3 l/day/capita; 33.9%) followed by the “meats and products” group (772.6 l/day/capita; 25.0%), while in the case of men the “meats and products” group (1195.8 l/day/capita; 30.9%) closely followed by the “milk and diaries” group (1125.9 l/day/capita; 29.0%) were the major contributors to the total dietary footprint. In the optimized models with the step 2 reduction of the water footprint (WFP-18%, WFP-28%) for both sexes, the contribution of “milk and dairies” decreased considerably decreased (−576.2 l/day/capita for women and −513.5 l/day/capita for men), while “meats and products” decreased moderately (−128.9 l/day/capita for women and −294.0 l/day/capita for men). Thus, meats and products were still the major contributors to the total water footprint, with 25.4% for women and 32.3% for men, respectively. Another notable change in the main food groups to the dietary water footprint contribution was an increase in “fruits and products” (+146.5 l/day/capita) for women and “grains” (+126.7 l/day/capita) for men in the optimized diets, compared to the observed diets, which made them the 3rd greatest dietary water footprint contributor. In the “sweets” food groups, a considerable water footprint contribution decrease was observed for both sexes: −135.3 l/day/capita for women and −165.7 l/day/capita for men (Figure 2 and Figure 3).

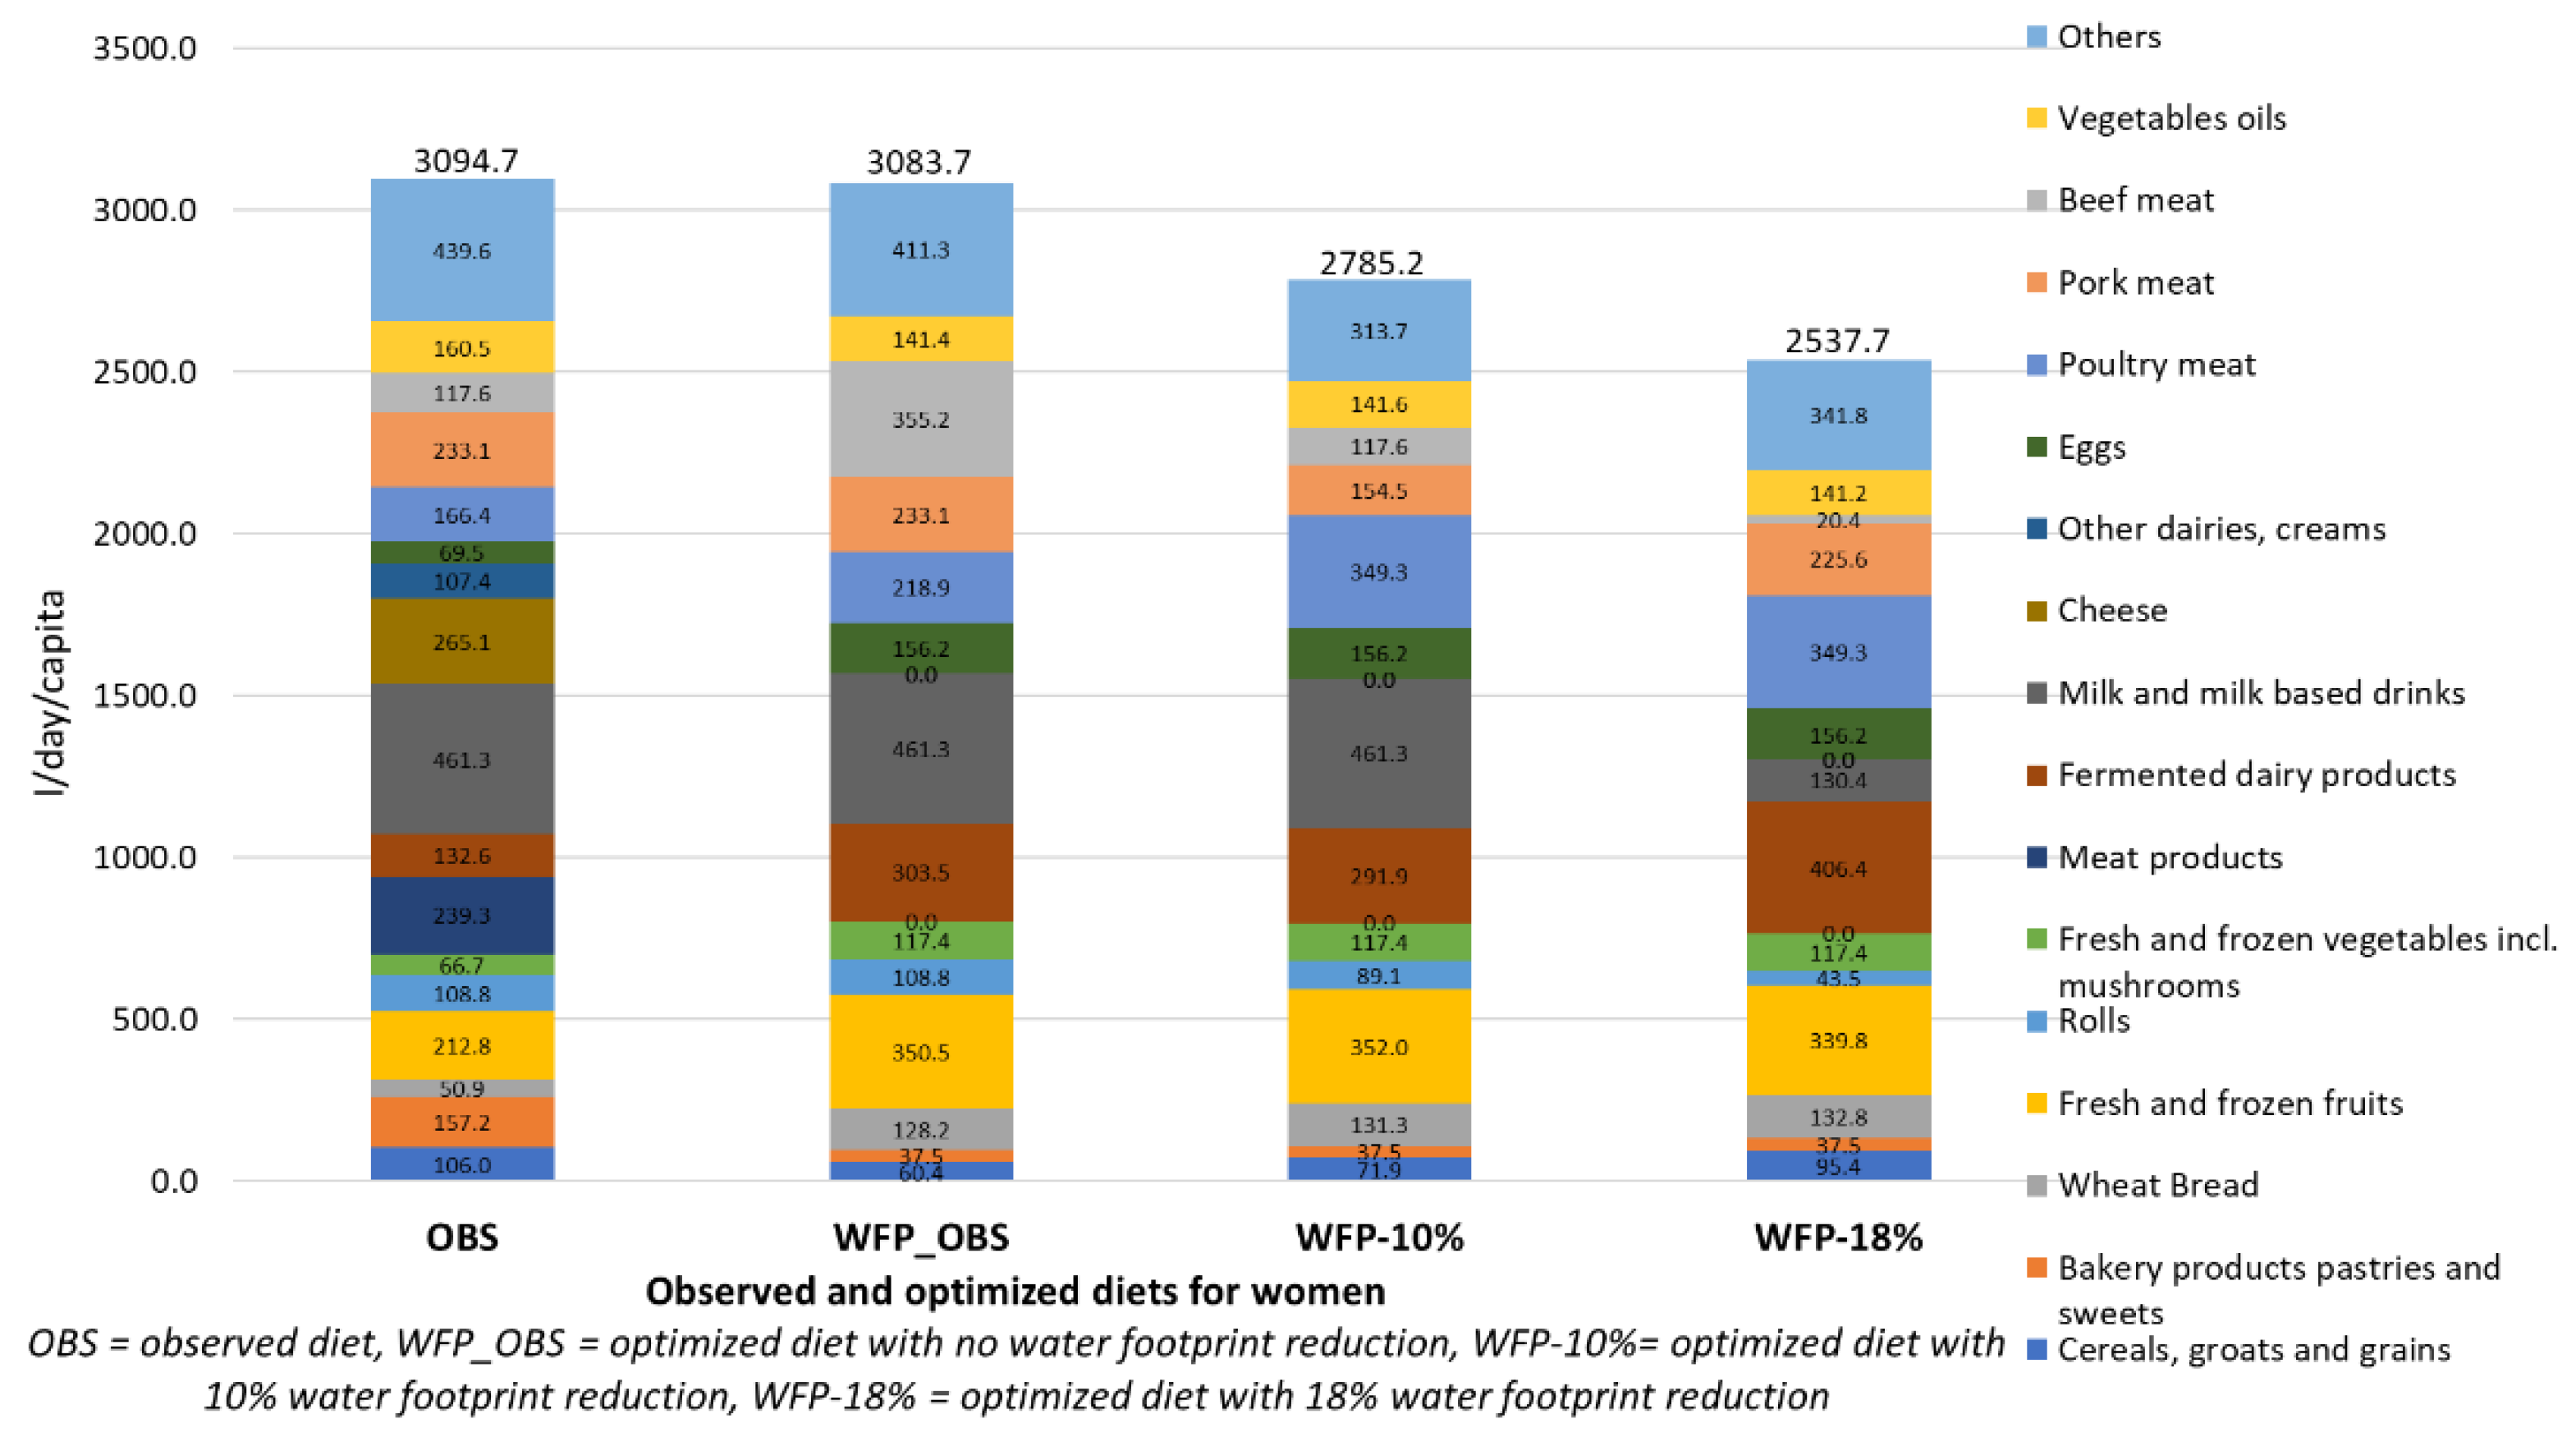
3.2. Contribution of Food Sub-Groups to the Total Dietary Water Footprint

In the case of the observed and optimized diets for women, the greatest contributors among food sub-groups were the “milk and milk-based drinks” (except in the WFP-18%). Their amount was the same as that observed for the WFP_OBS and WFP-10% models, but showed a considerable decrease in the WFP-18% model. Furthermore, the water footprint contribution of “cheese” and “meat products” dropped to 0 l/day/capita in all optimized models. On the other hand, “poultry meat” (in WFP-10% and WFP-18%), “fresh and frozen fruits” (in the WFP_OBS, WFP-10% and WFP-18% models), and “fermented dairy products” (a big growth in WFP_OBS and WFP-10% and even greater in the WFP-18% model) showed a notable increase in the water footprint contribution to the total optimized diets compared to the observed diet. “Fermented dairies products” became the largest contributor in the WFP-18% model for women. “Beef meat” was dominant in the WFP_OBS model (but not in any other), despite its very low intake amount (9.7 g/day/capita), and pork meat represented a moderate part of the water footprint contribution in the observed and optimized diets. (Figure 4).
Moreover, in the case of models for men, “milk and milk-based drinks” were the greatest contributor in the observed and WFP_OBS and WFP-15% optimized diets, which shows a considerable stepwise reduction, until in the WFP-28% they were not the greatest contributor (“fermented dairy products” replaced them). “Fermented dairy products” showed a stepwise growth through the optimized diets in parallel with the stepwise reduction of the water footprint (Figure 5). As in to models for women, “cheese” dropped to 0 l/day/capita in all optimized diets, while “meat products” took the minimum possible value (min. constraints set as the 10th percentile), resulting in a less influential contribution to the total dietary water footprint in the optimized models. Contrarily, “poultry meat” increased (max. constraints set as the 90th percentile), resulting in a heavy contribution to the total dietary water footprint in all three optimized diets. “Beef meet” was the first major contributor in the WFP_OBS model, again despite its low intake (21.1 g/day/capita). In the other models its intake was somewhat low (3.6–5.1 g/day/capita), but its contribution to the total dietary water footprint was still notable (Figure 5). See further details on the 10th and 90th values in the Supplementary Materials, Tables S3–S6.

3.3. Dietary Shift: Differences between Optimal and Observed Dietary Patterns on a Sub-Group Level

There were mainly similarities but also some differences in the variation of food sub-groups for the two sexes. Starting with the similarities, in the synergy of healthiness and dietary water footprint, the “beneficial” sub-groups that increased as a trend in optimized diets were the “whole grain bread”, “canned vegetables and vegetable products”, “wheat bread”, “fresh and frozen vegetables incl. mushrooms”, “fermented dairy products”, “poultry meat”, “eggs”, and “nuts and seeds” (except for WFP_OBS for men). On the other hand, the food sub-groups that either decreased in all optimized models or stayed at the observed value were the following: “bakery products, pastries, and sweets”, “fruit products”, “dry pasta”, “rolls”, “potatoes”, “jams”, “fruit and vegetable juices”, “sauces and seasoning", “cottage cheese”, “cheese”, “other dairies and creams”, “offals and products”, and “animal fats”. Alcoholic and non-alcoholic drinks both either decreased considerably or reached the 0 g/day/capita variation value. Some differences were found between men and women. The “cereals, groats, and grains” sub-group grew for men but dropped for women, “vegetable oils” increased for men but decreased for women, “fresh and frozen fruits” showed a great increase for women but was lowered for men in step 2 reduction (WFP-28%), and “fishes incl. canned fishes” were elevated for women but equaled to the observed value for men. Legumes did not change in quantity, except for step 2 water footprint reduction models for both sexes (WFP-18% and WFP-28%), where they increased. Furthermore, “carbonated soft drinks” did not change for women but decreased considerably in all optimized diets for men. Besides, “beef meat” and “pork meat” showed all possible variations in the different models with small changes, but lowered at the step 2 reduction for both sexes (WFP-18% and WFP-28%) (Table 2). The dietary shift by the main food groups is in the Supplementary Materials, Figures S1 and S2.

3.4. Evaluation of the Constraints: Binding Nutrients

For both sexes, energy and sodium reached the maximum value in all optimized diets; in addition, the maximum limit of total fat in the WFP-28% model for men was also realized. On the other hand, dietary fiber was the only nutrient that was at the minimum constraint value in all models for both sexes. For women, vitamin B12 was at the minimum value in each optimized diet, while calcium, iron, zinc, and potassium were also at the bottom limit in step 2, the maximum water footprint reduction model (WFP-18%). In models for men, vitamin D in WFP_OBS and WFP-28% models and zinc in WFP-28% equaled the minimum constraint value (Supplementary Materials, Table S7. The constraints on the main food groups and food sub-groups are in the Supplementary Materials, Tables S3–S6).

4. Discussion

4.1. Possible Reduction of the Dietary Water Footprint by Changing to a Healthier Diet

There is no clear agreement on the association of healthiness and the environmental impact of diets in general [9,15,51,52,53,54], but the synergy between a healthier diet and a lower dietary footprint does exist. This has also proven true for the dietary water footprint by this and numerous other studies analyzing the shift between the observed and healthier diets [9,18,19,20,35,41,55,56,57]. However, this association is neither linear nor general, which is also well presented in this study. Based on our results, the blue water footprint of the WFP_OBS models optimized to be nutritionally adequate showed a considerable decrease (~12%), but not the green or total water footprint values (the increase was not feasible due to the maximum constraints) in the models. On the other hand, it was possible to reduce the dietary water footprint by 19.5% (for women) and 28.2% (for men) and still fulfill the dietary recommendations. This contradiction is also supported by other studies where a shift to a healthier and more sustainable diet resulted in only a small reduction or increase in the blue water footprint (unlike other food-related footprints [7,8,9,10,11,12]), but these studies did not evaluate the total or green water footprint that is recently suggested and applied [18,32,34,36,37,58]. When adding the third focused aspect, cultural acceptability, these results also show that it is possible to reach a great reduction in the water footprint and ensure nutritional adequacy while accounting for the adherence to the observed dietary patterns. This fact strengthens the idea that sustainable diet optimization should include cultural acceptability [15,16,22,59], since the environmental burden can be eased when controlling this aspect as well. Chaudhary et al. [11] optimized diets to lower different food-related footprints that resulted in an increase in the blue water footprint (unlike other footprints [7,8,10,11,12]) by 12% while causing a 45% dietary shift for Hungary [11]. On the contrary, this study resulted in a blue water footprint change of −12.4% from women and −24% for men, with a ~32% dietary shift at the step 2 water footprint reduction. Vanham et al. [41] estimated a −11% reduction in the total water footprint by shifting to a healthy diet scenario (and −27% shift to a vegetarian diet) for the Eastern region of Europe [41], which seems to be a similar result to the 23.9% (both sexes) total water footprint decrease in this study, adding that no main food group (e.g., meats) was eliminated (Supplementary Materials, Tables S5 and S6). A study concentrating on Hungary, but applying different databases and scenario analyses, estimated the “sustainable scenario” as the most advantageous in the water footprint and health synergy, with −42% in green water and −29% in blue water change, and the ketogenic scenario as the most disadvantageous, with +16% in green water and +18% in blue water change for both sexes with considerable dietary shifts [55]. Harris et al. [18] estimated in a meta-analysis that the studies could reach up to a 25.2% total, 26.1% green, and 11.6% blue water footprint reduction with no animal-based foods, and around a ~6% total, green, and blue water change with the shift to healthier diets [18]. Similarly, this model could create the smallest reduction in the blue water footprint (19.1%) compared to the green (24.7%) and total (23.8%) water footprint as the mean of both sexes, although designing only healthy diets and not eliminating the main animal-based food groups. Instead, it resulted in a change in the quality of meat and meat products and milk and dairies. Jalava et al. [20], using quadratic programming, could reach a reduction from 0 to −100 l/day/capita in blue water and from −1000 to −500 l/day/capita in green water by shifting from the original diet to a healthier diet for Hungarian consumers by minimizing the deviation from the observed diets [20]. While averaging the two sexes, there was a water change of −15.3 l/day/capita in blue water and −739.3 l/day/capita in green water in the present model, that lies in the estimated range. The proportion of the dietary blue water footprint, compared to the total water footprint value, was ~2% in each model for both sexes, resembling the estimated range (2.3–7%) from the review of Harris et al. [18]. The existing differences in the mentioned studies could be partly originated in the profound methodological differences (e.g., scenario analyses vs. diet optimization). However, they support the conclusion [7,14] that a context-specific approach could be more efficient in finding the existing healthiness-environment synergy.

4.2. Contribution of the Food Groups and Sub-Groups to the Total Dietary Water Footprint

In the observed diets, the total water footprint contribution showed that the pure animal-based food groups weighted the most, but not the “meats and products” (especially the “meat products” sub-group). Instead, the “milk and dairies” (especially the “milk and milk-based drinks” sub-group) main group was the greatest contributor. These results are reasonable based on the high water footprint value and high consumption. Thus, “milk and dairies” is the major contributor, since it is consumed in a high quantity (women: 249.8 and men: 262.7 g/day/capita) (Supplementary Materials, Tables S5 and S6), and the mean water footprint value of dairies and milk is considerably higher in Hungary (cheese: 13,841 l/kg, milk: 2890 l/kg) compared to the global average (cheese: 5060 l/kg, milk: 1054 l/kg) [39]. Besides, the intake of beef meat is relatively low on the population level (~4.14 g/day/capita), that typically elevates the mean dietary water footprint value of the meat food group. A previous analysis on the water footprint consequences of the shift to different dietary scenarios already pointed out that just reducing the amount of meat by 50% and replacing it with dairies and eggs would not lead to a great difference either in the water footprint or in the dietary quality [55] in Hungary. Two purely plant-based food groups followed in the rank of contributors: “grains” and “fruits and products”. Similarly, other studies concentrating on European countries and the total water footprint usually found meats and dairies [35,41,57] as the main contributors, followed by cereals and vegetable oils. On the global level, green water, meats, and cereals, considered separately, are the main contributors, along with plant-based foods (especially cereals, nuts, and sugars), for the blue water footprint. If the scenario is changed to a healthier one, plant-based foods take the place of the main contributors [18]. Considering the more detailed analysis of this study, it turned out that while the amount of the “meats and products” group only moderately decreased as the dietary water footprint contributor (and also in weight) in the optimized diets, there was a quality change inside the group favoring the healthier choices [46]: more poultry and less meat products (i.e., sausages). Similarly, while the contribution of “milk and dairies” decreased steadily in parallel with the water footprint reduction, there was also a quality change: “fermented dairy products” appeared to be the most favorable, while all other “milk and dairies” sub-groups dropped (except for cottage cheese, which did not change in WFP_OBS for men and WFP_OBS and WFP-10% for women).

4.3. Dietary Shift

A diverse picture characterized the dietary shift between the observed and optimized diets. In the dimension of the health-dietary water footprint, the most beneficial main food groups were the “grains”, “eggs and products”, and “vegetables and products”, that showed a clear growth—and varying only slightly—in all models for both sexes. “Fruits and products” showed a great difference between the sexes: increased for women and decreased for men, which could be explained by the fact the “cereals, groats, and grains” grew more for men to cover dietary fiber requirements, that were one of the most binding nutrient constraints. Besides, “fruits and products” has relatively high blue water footprint values [55,60,61]. Thus, these two factors could explain why the model did not favor it. Except for “fruits and products”, these results are mostly in line with the review results of Steenson et al. [10]; grains, cereals, vegetables, and fruits seemed to be advantageous in the environment–health synergy most of the time, while eggs were less advantageous. They concluded that in optimization studies, the results on eggs and milk and dairies are inconsistent, probably due to the trade-offs of environmental burden and nutrient content. Legumes and nuts seemed mostly beneficial, and they were also favored in this study: “nuts and seeds” were elevated in most models, while “legumes” only in the step 2 water footprint reduction models (WFP-18% and WFP-28%). On the other hand, “drinks”, “fats and oils”, “sweets”, “alcoholic drinks”, and “milk and dairies” (the latter is an exception in WFP_OBS for women) dropped as a trend (Supplementary Materials Tables S3 and S4), meaning that they are non-beneficial regarding the healthiness and dietary water footprint synergies that are supported by Steenson et al.’s [10] findings. The results partly agree with Chaudhary et al.’s [11] sustainable diet optimization, which resulted in the elevation of fruits and vegetables and pulses and roots, while cereals did not change and meat, dairies and eggs decreased in Europe and Central Asia. Regarding Hungary, the main differences with this study were that the meat groups did not decrease drastically and the eggs and products were elevated in each case, which could be due to the methodological differences, especially since they included five environmental metrics [11]. Contrary to Steenson et al.’s [10] summary, meats groups showed a versatile picture: they were increased in the WFP_OBS models, decreased slightly for men, and increased for women (originated in the growth of the poultries sub-group) in the step 2 models reducing the water footprint. Besides, a quality change could be observed: “poultry meat” increased, while “meat products” fell to a minimum, and the trend for “pork meat” and “beef meat” showed a small variation. However, both red meats dropped for the step 2 water footprint reduction. Regarding “milk and dairies”, the models favored “fermented products”, while all others dropped (except for “cottage cheese” in WFP_OBS and WFP-15% for men, and WFP_OBS for women), which is similar to the tendency found in other studies, except for fermented dairies. The difference with the mentioned studies could be that, besides the methodological differences, these studies have only accounted for the water footprint (especially including green water) and have not conducted in-depth analyses on the food sub-groups [10].
These trends, emphasizing the quality change in the “meats and products” and “milk and dairies” groups, are in line with the Hungarian FBDG to choose lean meat (e.g., poultries) and dairies (e.g., fermented dairies) more often than high-fat content ones. Nevertheless, the Hungarian population’s nutrition is characterized by high total fat and SFA intake [23]. Furthermore, these results also agree with the Hungarian FBDG to avoid products with high added sugar content (“sweets”), keep eggs and fish in the diet to make protein sources more diverse, and eat plenty of grains, vegetables, and fruits. “Fruits and products” might be an exception, but the drop between the observed and the step 2 reduction for men (WFP-28%) did not equal a 0 value. The intake amount of the “fruits and products” group was still 76–178 g/day/capita in the optimized models for men, and most of it was the “fresh and frozen fruits” sub-group (Supplementary Materials, Tables S3–S6). Besides, in the WFP-28% model, where the “fruits and products” group was decreased, the overall amount of fruits and vegetables was 568.9 g/day/capita (Supplementary Materials, Table S6), which is above the recommendation [46]. Even though the lowering of the “fruits and products” group is reasonable in the step 2 dietary water footprint reduction for men (WFP-28) due to the blue water “cost”, it cannot be recommended as a dietary shift to a healthier diet. The optimized intake of red meats (beef and pork meat) is also in line with the Hungarian FBDG: the daily intake amount in the optimized diets for women was between 25.2 g/day/capita (WFP_OBS) and 41.9 g/day/capita (WFP-10%) and for men between 42.6 g/day/capita (WFP_OBS) and 71.7 g/day/capita (WFP-28%), which is similar to, or lower than, the maximum recommendation of 50–71.4 g/day/capita [46]. The drop in the intake amount of “milk and dairies” in the optimized diets could conflict with the recommendation of the Hungarian FBDG about the 500 mg/day/capita calcium equivalent intake from milk-based sources [46], adding that calcium was only a problematic nutrient in the WFP-18% model for women and that the “milk and dairies” sub-group was still in the range of 170.1–262.6 g/day/capita in the optimized models (Supplementary Materials, Tables S5 and S6). Finally, these results support the conclusion that a shift to the recommended diet with specification in the food sub-groups could simultaneously provide health and dietary water footprint benefits [9,18,20,35,41,55,56,57].

4.4. Binding Nutrients

The maximum energy constraint was problematic in each model, which could be due to the fact that energy and nutrient-dense foods are advantageous in the models [62]. Comparing the two sexes, a greater reduction of the total dietary water footprint was possible for men, since the higher energy range (2300–2600 kcal versus 1700–2000 kcal for women) of diets provided more space for a feasible solution. Besides, the minimum constraint on dietary fibers and the maximum on sodium were also binding in each model for both sexes, which is in agreement with the Hungarian population intake, that is typically low in dietary fibers [23] and high in sodium [63]. For women, the minimum limit for vitamin B12 in each model and potassium, iron, and zinc in WFP-18% were binding constraints, demonstrating that the greater the reduction in the dietary water footprint, the more binding the nutrients. The potassium, zinc, and iron intake of women is indeed a problem on the population level, but the B12 intake is adequate [63,64]. The reason could be that otherwise nutritionally and/or environmentally non-beneficial food groups (e.g., meat products, offals, cheese) were limited or decreased in the models that are a common source of the intake of vitamin B12. For men, the minimum constraint of vitamin D (WFP-28%) and zinc (WFP_OBS and WFP-28%) and the maximum for total fat (WFP-28%) were limiting factors. The population intake is problematic in the case of each nutrient, and, again, the step 2 reduction in the dietary water footprint meant that the limit in nutrient constraints was reached. Similarly, Perignon et al. [22] found that in the stepwise lowering of dietary GHGE at the point of a 30% reduction and nutritional adequacy (with cultural acceptability constraints) in the optimized diet led to the lower limit for dietary fibers, vitamin D, and zinc, while the upper limit for SFA and sodium were also problematic, among others. With further GHGE reduction, more problematic nutrients could be identified [22]. These results point to the conclusion that the higher the reduction in environmental impact, the more trade-offs should be taken into consideration (e.g., micronutrient deficiency and cultural acceptability) and controlled by the constraints or output measures [15].

4.5. Wider Perspectives

A more sustainable diet is directly related to the consumer level, but a shift towards it would also affect the other stakeholders in the agri-food sector and water technologies. The harmonization of these different parties of the food chain and water technology could best serve related SDGs and EU goals on sustainable food and nutrition security [1,2,4,58,65]. In the case of water use, the WEFE (water–energy–food–ecology) nexus is also a closely connected system, and thus an intervention in one affects the others [1]. A more sustainable diet could be well implemented if the EU and the national policy would favor the production of more sustainable food products (e.g., vegetables and grains) and limit those that are not considered healthy and burden the environment (e.g., alcoholic drinks and processed meats). Hungary already provided a good practice on implementing a public health product tax on food products containing unhealthy levels of sugar, salt, and other ingredients (the so-called “chips tax”) [66], thus presenting a precedent for legislation that aims to protect the health of consumers, and pressured food producers to adapt to it. Moreover, adjusting towards a healthier and more environmentally friendly food consumption could be more effective by publishing government-backed and sustainability-focused food-based dietary guidelines that are still rare worldwide [6,67,68]. In Hungary, the first steps have already been made to include sustainability as an aspect of the national FBDG [46]. Besides, as we have seen, the green water usage makes up the majority of the water use (86–87%) in food production in Hungary, and is higher than the blue water component (~2%) by one (in some cases two) order of magnitude [18,55]. From this it follows that the management of the water from precipitation is rapidly gaining in importance.

4.6. Limitation

The limitations of this study are mainly related to the methodological differences of this field of research (dietary scenario analysis versus diet optimization), the choice of being more specific or more complex (focusing on a multi-country level and including several environmental impact category levels or just one), and the available data (dietary and environmental):
  • The comparison with other studies is difficult due to different data and methodologies affecting every phase of the study: dietary data included metrics, a bottom-up or top-down estimation of the water footprint [41], scenario analysis or optimization, parameters of the diet optimization model. However, most studies on the dietary water footprint apply the database of WFN, that is country-specific [38,39] and comparable;
  • In this study, the majority of data are country-specific (dietary data, water footprint), except for the nutrient composition acquired from the USDA FNDDS database that was initially compiled for nutrition science studies [25];
  • In the estimation of the observed diet, the “other foods” (277 g/day/capita) sub-group was excluded, since it was mostly composed of ultra-processed foods (e.g., soup powder) impossible to aggregate and compile due to their heterogeneity and intake level, which was often under 1 g/day/capita;
  • As argued in this study, other environmental footprints could also result in a different effect on the healthiness–environment synergies [9,10,35,56,57]. On the one hand, a separate, more detailed analysis could reveal important details to consider about a sole member of the footprint family that could be covered in a multifactorial and less context-specific analysis. On the other hand, a further aim could be to find the agreement between the different footprints [1].

5. Conclusions

To address the research questions of this study, by applying a country- and context-specific diet optimization on a representative Hungarian sample, a greater measure of the total dietary water footprint reduction was possible (~18% for women and ~28% for men) while satisfying the dietary recommendations and minimizing the dietary shift (~32%). Dairies and milk were the major contributors to the total dietary water footprint for both sexes in the observed diets, while in the optimized diets the meats for men and dairies and milk for women indicated that meat consumption is not necessarily the center of the sustainable diet problem in the context of Hungary and the water footprint. The more detailed analyses on the food sub-groups on the water footprint–healthiness synergy revealed that the vegetables, eggs, poultries, and fermented dairies were the most beneficial, increasing in intake amount, while fatty dairies, foods high in added sugar, and meat products were the least beneficial food sub-groups, with a decreasing intake amount in the optimized diets, thereby supporting the point that a quality change, and not only a quantity change within the main food groups can result in a great difference. In the water-footprint-reduced, nutritionally adequate, and cultural-acceptability-focused diets, the problematic nutrient constraints were not to exceed the maximum in case of energy, sodium, and total fat, while reaching the minimum for dietary fibers, vitamin D, zinc, B12, iron, calcium, and potassium varying among sexes and optimized diets. These results show which nutrients could be at risk for deficiency in case of shifting to a more sustainable diet. Our study and other international studies demonstrated that a healthier diet can provide water footprint benefits, and thus a synergy between these two aspects. However, it is not as simple as the healthier, more environmentally friendly diet, and so a further specified version of a healthy diet is needed to reach a more sustainable diet. Diet optimization with linear programming is an efficient tool to resolve this “diet problem”, namely, to reach environmental-impact-reducing aims while fulfilling dietary recommendations and minimizing the dietary shift from the culturally accepted observed diet. Furthermore, diet optimization is more efficient if context-specific, because the definition of a sustainable diet includes aspects unique for the analyzed population, such as health status, traditional diet, and water use for food production. These results can provide supporting scientific evidence for the further improvement of the sustainability-focused national food-based dietary guidelines.

Supplementary Materials

The following supporting information can be downloaded at: https://0-www-mdpi-com.brum.beds.ac.uk/article/10.3390/su14042309/s1, Figure S1: Dietary shift: change between the observed and optimized diets for women in g/day/capita by the main food groups; Figure S2: Dietary shift: change between the observed and optimized diets for men in g/day/capita by the main food groups; Table S1: Classification of food groups and sub-groups; Table S2: Nutrients as constraints; Table S3: Cultural acceptability constraints on food sub-groups: 10th (as a minimum constraint) and 90th (as a maximum constraint) percentiles, observed (as a maximum constraint in specific cases) and optimized amount (g/day/capita) of food sub-groups for women; Table S4: Cultural acceptability constraints on food sub-groups: 10th (as a minimum constraint) and 90th (as a maximum constraint) percentiles, observed (as a maximum constraint in specific cases) and optimized amount (g/day/capita) of food sub-groups for men; Table S5: Cultural acceptability constraints on main food groups: 10th (as a minimum constraint) and 90th (as a minimum constraint) percentiles, observed (as a maximum constraint in specific cases) and optimized amount (g/day/capita) of food sub-groups for women; Table S6: Cultural acceptability constraints on the main food groups: 10th (as a minimum constraint) and 90th (as a minimum constraint) percentiles, observed (as a maximum constraint in specific cases) and optimized amount (g/day/capita) of food sub-groups for men; Table S7: Binding nutrients: evaluation of nutritional adequacy constraints expressed as % of the RDI.

Author Contributions

Conceptualization, O.T.; methodology, O.T.; validation, Z.L. and M.M.; formal analysis, O.T.; investigation, Z.L. and A.K.; data curation, E.S.N.; writing—original draft preparation, O.T.; writing—review and editing, E.S.N., A.K., M.M. and Á.T.; visualization, A.K. and M.M.; funding acquisition, Á.T. All authors have read and agreed to the published version of the manuscript.

Funding

Supported by the ÚNKP-21-3. New National Excellence Program of the Ministry for Innovation and Technology from the source of the National Research, Development and Innovation Fund. The study was supported by the Doctoral School of Food Sciences at the Hungarian University of Agriculture and Life Sciences. The project is supported by the European Union and co-financed by the European Social Fund (grant agreement no. EFOP-3.6.3-VEKOP-16-2017-00005).
Sustainability 14 02309 i002

Institutional Review Board Statement

Not applicable.

Informed Consent Statement

Not applicable.

Data Availability Statement

The data presented in this study are available in the Supplementary Materials, here.

Acknowledgments

Thanks to the team MS-Nutrition, especially Rozenn Gazan, for contributing to the creation of this study both professionally and personally.

Conflicts of Interest

The authors declare no conflict of interest. The funders had no role in the design of the study; in the collection, analyses, or interpretation of the data; in the writing of the manuscript, or in the decision to publish the results.

References

  1. Vanham, D.; Leip, A.; Galli, A.; Kastner, T.; Bruckner, M.; Uwizeye, A.; van Dijk, K.; Ercin, E.; Dalin, C.; Brandão, M.; et al. Environmental footprint family to address local to planetary sustainability and deliver on the SDGs. Sci. Total Environ. 2019, 693, 133642. [Google Scholar] [CrossRef] [PubMed]
  2. United Nation. Sustainable Development Goals. 2015. Available online: https://sdgs.un.org/goals (accessed on 10 December 2021).
  3. Gustafson, D.; Gutman, A.; Leet, W.; Drewnowski, A.; Fanzo, J.; Ingram, J. Seven food system metrics of sustainable nutrition security. Sustainability 2016, 8, 196. [Google Scholar] [CrossRef] [Green Version]
  4. Rutten, M.; Achterbosch, T.J.; de Boer, I.J.M.; Cuaresma, J.C.; Geleijnse, J.M.; Havlík, P.; Heckelei, T.; Ingram, J.; Leip, A.; Marette, S.; et al. Metrics, models and foresight for European sustainable food and nutrition security: The vision of the SUSFANS project. Agric. Syst. 2018, 163, 45–57. [Google Scholar] [CrossRef]
  5. Food and Agriculutral Organization of the United States (FAO); World Health Organization (WHO). Sustainable Healthy Diets; FAO: Rome, Italy; WHO: Geneva, Switzerland, 2019; ISBN 978-92-5-131875-1. [Google Scholar]
  6. Fischer, C.G.; Garnett, T. Plates, Pyramids, Planet; FAO: Rome, Italy, 2016; ISBN 978-92-5-109222-4. [Google Scholar]
  7. Springmann, M.; Wiebe, K.; Croz, D.M.; Sulser, T.B.; Rayner, M.; Scarborough, P. Articles Health and nutritional aspects of sustainable diet strategies and their association with environmental impacts: A global modelling analysis with country-level detail. Lancet Planet. Health 2018, 2, e451–e461. [Google Scholar] [CrossRef] [Green Version]
  8. Hess, T.; Andersson, U.; Mena, C.; Williams, A. The impact of healthier dietary scenarios on the global blue water scarcity footprint of food consumption in the UK. Food Policy 2015, 50, 1–10. [Google Scholar] [CrossRef]
  9. Tom, M.S.; Fischbeck, P.S.; Hendrickson, C.T. Energy use, blue water footprint, and greenhouse gas emissions for current food consumption patterns and dietary recommendations in the US. Environ. Syst. Decis. 2015, 36, 92–103. [Google Scholar] [CrossRef]
  10. Steenson, S.; Buttriss, J.L. Healthier and more sustainable diets: What changes are needed in high-income countries? Nutr. Bull. 2021, 46, 279–309. [Google Scholar] [CrossRef]
  11. Chaudhary, A.; Krishna, V. Country-specific sustainable diets using optimization algorithm. Environ. Sci. Technol. 2019, 53, 7694–7703. [Google Scholar] [CrossRef]
  12. Gephart, J.A.; Davis, K.F.; Emery, K.A.; Leach, A.M.; Galloway, J.N.; Pace, M.L. The environmental cost of subsistence: Optimizing diets to minimize footprints. Sci. Total Environ. 2016, 553, 120–127. [Google Scholar] [CrossRef] [Green Version]
  13. Global Burden of Disease (GBD). Cause of Death in Both Sexes at All Ages and Related Risk Factors in Hungary. 2019. Available online: https://vizhub.healthdata.org/gbd-compare/ (accessed on 10 December 2021).
  14. Hallström, E.; Carlsson-Kanyama, A.; Börjesson, P. Environmental impact of dietary change: A systematic review. J. Clean. Prod. 2015, 91, 1–11. [Google Scholar] [CrossRef]
  15. Gazan, R.; Brouzes, C.M.C.; Vieux, F.; Maillot, M.; Lluch, A.; Darmon, N. Mathematical Optimization to Explore Tomorrow’s Sustainable Diets: A Narrative Review. Adv. Nutr. 2018, 9, 602–616. [Google Scholar] [CrossRef]
  16. Van Dooren, C. A Review of the Use of Linear Programming to Optimize Diets, Nutritiously, Economically and Environmentally. Front. Nutr. 2018, 5, 48. [Google Scholar] [CrossRef] [Green Version]
  17. Jones, A.D.; Hoey, L.; Blesh, J.; Miller, L.; Green, A.; Shapiro, L.F. A Systematic Review of the Measurement of Sustainable Diets. Adv. Nutr. 2016, 7, 641–664. [Google Scholar] [CrossRef] [Green Version]
  18. Harris, F.; Moss, C.; Joy, E.J.M.; Quinn, R.; Scheelbeek, P.F.D.; Dangour, A.D.; Green, R. The Water Footprint of Diets: A Global Systematic Review and Meta-analysis. Adv. Nutr. 2020, 11, 375–386. [Google Scholar] [CrossRef]
  19. Milner, J.; Joy, E.J.M.; Green, R.; Harris, F.; Aleksandrowicz, L.; Agrawal, S.; Smith, P.; Haines, A. Articles Projected health effects of realistic dietary changes to address freshwater constraints in India: A modelling study. Lancet Planet. Health 2017, 1, e26–e32. [Google Scholar] [CrossRef] [Green Version]
  20. Jalava, M.; Kummu, M.; Porkka, M.; Siebert, S.; Varis, O. Diet change—A solution to reduce water use? Environ. Res. Lett. 2014, 9, 074016. [Google Scholar] [CrossRef]
  21. Vieux, F.; Perignon, M.; Gazan, R.; Darmon, N. Dietary changes needed to improve diet sustainability: Are they similar across Europe? Eur. J. Clin. Nutr. 2018, 72, 951–960. [Google Scholar] [CrossRef]
  22. Perignon, M.; Masset, G.; Ferrari, G.; Barré, T.; Vieux, F.; Maillot, M.; Amiot, M.J.; Darmon, N. How low can dietary greenhouse gas emissions be reduced without impairing nutritional adequacy, affordability and acceptability of the diet? A modelling study to guide sustainable food choices. Public Health Nutr. 2016, 19, 2662–2674. [Google Scholar] [CrossRef] [Green Version]
  23. Sarkadi Nagy, E.; Bakacs, M.; Illés, É.; Nagy, B.; Varga, A.; Kis, O.; Schreiberné Molnár, E.; Martos, É. Országos Táplálkozás és Tápláltsági Állapot Vizsgálat–OTÁP2014. II. A magyar lakosság energia- és makrotápanyag-bevitele. Orv. Hetil. 2017, 158, 587–597. [Google Scholar] [CrossRef]
  24. Nutricomp, Étrend 4.0, Nutricomp Bt. Budapest. Available online: https://www.nutricomp.hu/ (accessed on 10 December 2021).
  25. U.S. Department of Agriculture (USDA). Food and Nutrient Database for Dietary Studies 2017–2018. Available online: https://www.ars.usda.gov/northeast-area/beltsville-md-bhnrc/beltsville-human-nutrition-research-center/food-surveys-research-group/docs/fndds/ (accessed on 10 December 2021).
  26. Louie, J.C.Y.; Moshtaghian, H.; Boylan, S.; Flood, V.M.; Rangan, A.M.; Barclay, A.W.; Brand-Miller, J.C.; Gill, T.P. A systematic methodology to estimate added sugar content of foods. Eur. J. Clin. Nutr. 2015, 69, 154–161. [Google Scholar] [CrossRef]
  27. EFSA (European Food Safety Authority). Dietary Reference Values for Nutrients Summary Report. EFSA Support Public 2017, 14, e15121. [Google Scholar] [CrossRef] [Green Version]
  28. Food and Agriculutral Organization of the United States (FAO); World Health Organization (WHO). From the Joint FAO/WHO Expert Consultation on Fats and Fatty Acids in Human Nutrition; WHO: Geneva, Switzerland, 2008; pp. 10–14. [Google Scholar]
  29. World Health Organization (WHO); Food and Agriculutral Organization of the United States (FAO); United Nation University (UNU). Expert Consultation Protein and Amino Acid Requirements in Human Nutrition; WHO: Geneva, Switzerland, 2007; pp. 1–265. ISBN 92-4-120935-6. [Google Scholar]
  30. Antal, M. Nutrient Requirements. In New Food Compositon Table; Rodler, I., Ed.; Medicina Könyvkiadó: Budapest, Hungary, 2005. [Google Scholar]
  31. Eszter, S.N.; Bakacs, M.; Illés, E.; Varga, A.; Martos, E. Az Országos Táplálkozás és Tápláltsági Állapot Vizsgálat OTÁP2014 Főbb Eredményei, A Magyar Lakosság Energia- és Makrotápanyag-Bevitele. 2016. Available online: https://ogyei.gov.hu/dynamic/5_sarkadi_otap2014_makrotap.pdf (accessed on 10 December 2021).
  32. Hoekstra, A.Y. Water Footprint Assessment: Evolvement of a New Research Field. Water Resour. Manag. 2017, 31, 3061–3081. [Google Scholar] [CrossRef] [Green Version]
  33. Water Footrpint Network (WFN). What Is Waterfootprint? 2020. Available online: https://waterfootprint.org/en/water-footprint/what-is-water-footprint/ (accessed on 10 December 2021).
  34. Vanham, D. Water resources for sustainable healthy diets: State of the art and outlook. Water 2020, 12, 3224. [Google Scholar] [CrossRef]
  35. Capone, R.; Iannetta, M.; El Bilali, H.; Colonna, N.; Debs, P.; Dernini, S.; Maiani, G.; Intorre, F.; Polito, A.; Turrini, A.; et al. A Preliminary Assessment of the Environmental Sustainability of the Current Italian Dietary Pattern: Water Footprint Related to Food Consumption. J. Food Nutr. Res. 2013, 1, 59–67. [Google Scholar] [CrossRef]
  36. Hoff, H.; Falkenmark, M.; Gerten, D.; Gordon, L.; Karlberg, L.; Rockström, J. Greening the global water system. J. Hydrol. 2010, 384, 177–186. [Google Scholar] [CrossRef]
  37. Falkenmark, M.; Rockström, J. The New Blue and Green Water Paradigm: Breaking New Ground for Water Resources Planning and Management. J. Water Resour. Plan. Manag. 2006, 132, 129–132. [Google Scholar] [CrossRef]
  38. Mekonnen, M.M.; Hoekstra, A.Y. The Green, Blue and Grey Water Footprint of Crops and Derived Crop Products; UNESCO-IHE Delft Institute for Water Education: Delft, The Netherlands, 2010; pp. 1–42. [Google Scholar]
  39. Mekonnen, M.M.; Hoekstra, A.Y. The Green, Blue and Grey Water Footprint of Farm Animals and Animal Products; UNESCO-IHE Delft Institute for Water Education: Delft, The Netherlands, 2010; pp. 1–50. [Google Scholar]
  40. Pahlow, M.; van Oel, P.R.; Mekonnen, M.M.; Hoekstra, A.Y. Increasing pressure on freshwater resources due to terrestrial feed ingredients for aquaculture production. Sci. Total Environ. 2015, 536, 847–857. [Google Scholar] [CrossRef] [Green Version]
  41. Vanham, D.; Hoekstra, A.Y.; Bidoglio, G. Potential water saving through changes in European diets. Environ. Int. 2013, 61, 45–56. [Google Scholar] [CrossRef]
  42. Gazan, R.; Barré, T.; Perignon, M.; Maillot, M.; Darmon, N.; Vieux, F. A methodology to compile food metrics related to diet sustainability into a single food database: Application to the French case. Food Chem. 2018, 238, 125–133. [Google Scholar] [CrossRef]
  43. Central Statistical Office of Hungary (CSO). Amount of Food Consumption per Capita per Year Classified by Income and Type of Region into Deciles. 2018. Available online: https://www.ksh.hu/stadat_files/jov/hu/jov0051.html (accessed on 10 December 2021).
  44. Food and Agriculture Organization (FAO). Food Balance Sheet. 2019. Available online: https://www.fao.org/faostat/en/#data/FBS (accessed on 10 December 2021).
  45. Mák, E. Közétkeztetési Szakácskönyv [Recipe Book for School Catering]; Akadémia Kiadó: Budapest, Hungary, 2020. [Google Scholar]
  46. Okostányér® [Smartplate]. Available online: http://www.okostanyer.hu/wp-content/uploads/2018/08/mdosz_kreativ_v25.pdf (accessed on 10 December 2021).
  47. European Comission (EC). Food-Based Dietary Guidelines in Europe. Available online: https://knowledge4policy.ec.europa.eu/health-promotion-knowledge-gateway/food-based-dietary-guidelines-europe-table-8_en (accessed on 10 December 2021).
  48. R Core Team R. A Language and Environment for Statistical Computing; R Foundation for Statistical Computing: Vienna, Austria, 2021; Available online: https://www.R-project.org/ (accessed on 10 December 2021).
  49. Wickham, H.; Averick, M.; Bryan, J.; Chang, W.; McGowan, L.; François, R.; Grolemund, G.; Hayes, A.; Henry, L.; Hester, J.; et al. Welcome to the Tidyverse. J. Open Source Softw. 2019, 4, 1686. [Google Scholar] [CrossRef]
  50. lpSolve, Version 6.5.15, Software for Solving Linear, Integer and Mixed Integer Programs. 2020. Available online: https://cran.r-project.org/web/packages/lpSolve/index.html (accessed on 10 December 2021).
  51. Vieux, F.; Soler, L.-G.; Touazi, D.; Darmon, N. High nutritional quality is not associated with low greenhouse gas emissions in self-selected diets of French adults. Am. J. Clin. Nutr. 2013, 97, 569–583. [Google Scholar] [CrossRef] [PubMed] [Green Version]
  52. MacDiarmid, J.I. Is a healthy diet an environmentally sustainable diet? Proc. Nutr. Soc. 2013, 72, 13–20. [Google Scholar] [CrossRef] [PubMed] [Green Version]
  53. Downs, S.M.; Fanzo, J. Is a Cardio-Protective Diet Sustainable? A Review of the Synergies and Tensions Between Foods That Promote the Health of the Heart and the Planet. Curr. Nutr. Rep. 2015, 4, 313–322. [Google Scholar] [CrossRef] [PubMed] [Green Version]
  54. Perignon, M.; Vieux, F.; Soler, L.G.; Masset, G.; Darmon, N. Improving diet sustainability through evolution of food choices: Review of epidemiological studies on the environmental impact of diets. Nutr. Rev. 2017, 75, 2–17. [Google Scholar] [CrossRef] [PubMed] [Green Version]
  55. Tompa, O.; Lakner, Z.; Oláh, J.; Popp, J.; Kiss, A. Is the sustainable choice a healthy choice?—Water footprint consequence of changing dietary patterns. Nutrients 2020, 12, 2578. [Google Scholar] [CrossRef] [PubMed]
  56. Alessandra, D.M. The Adherence of the Diet to Mediterranean Principle and Its Impacts on Human and Environmental Health. Int. J. Environ. Prot. Policy 2014, 2, 64. [Google Scholar] [CrossRef]
  57. Sáez-Almendros, S.; Obrador, B.; Bach-Faig, A.; Serra-Majem, L. Environmental footprints of Mediterranean versus Western dietary patterns: Beyond the health benefits of the Mediterranean diet. Environ. Health 2013, 12, 118. [Google Scholar] [CrossRef] [PubMed] [Green Version]
  58. Hoekstra, A.Y. The Water Footprint of Industry; Elsevier Inc.: Amsterdam, The Netherlands, 2015; ISBN 978-0-12802-233-7. [Google Scholar]
  59. Vieux, F.; Privet, L.; Soler, L.G.; Irz, X.; Ferrari, M.; Sette, S.; Raulio, S.; Tapanainen, H.; Hoffmann, R.; Surry, Y.; et al. More sustainable European diets based on self-selection do not require exclusion of entire categories of food. J. Clean. Prod. 2020, 248, 119298. [Google Scholar] [CrossRef]
  60. Meier, T.; Christen, O. Gender as a factor in an environmental assessment of the consumption of animal and plant-based foods in Germany. Int. J. Life Cycle Assess. 2012, 17, 550–564. [Google Scholar] [CrossRef]
  61. Scheelbeek, P.; Green, R.; Papier, K.; Knuppel, A.; Alae-Carew, C.; Balkwill, A.; Key, T.J.; Beral, V.; Dangour, A.D. Health impacts and environmental footprints of diets that meet the Eatwell Guide recommendations: Analyses of multiple UK studies. BMJ Open 2020, 10, e037554. [Google Scholar] [CrossRef]
  62. Darmon, N.; Ferguson, E.; Briend, A. Do economic constraints encourage the selection of energy dense diets? Appetite 2003, 41, 315–322. [Google Scholar] [CrossRef]
  63. Nagy, B.; Nagy-Lőrincz, Z.; Bakacs, M.; Illés, É.; Sarkadi Nagy, E.; Erdei, G.; Martos, É. Országos Táplálkozás és Tápláltsági Állapot Vizsgálat–OTÁP2014. IV. A magyar lakosság mikroelem-bevitele. Orv. Hetil. 2017, 158, 803–810. [Google Scholar] [CrossRef]
  64. Schreiberné Molnár, E.; Nagy-Lőrincz, Z.; Nagy, B.; Bakacs, M.; Kis, O.; Sarkadi Nagy, E.; Martos, É. Országos Táplálkozás- és Tápláltsági Állapot Vizsgálat–OTÁP2014. V. A magyar lakosság vitaminbevitele. Orv. Hetil. 2017, 158, 1302–1313. [Google Scholar] [CrossRef] [Green Version]
  65. Ercin, A.E.; Hoekstra, A.Y. Water footprint scenarios for 2050: A global analysis. Environ. Int. 2014, 64, 71–82. [Google Scholar] [CrossRef]
  66. National Tax and Custom Administration. Act CIII of 2011 on Public Health Product Tax. 2011. Available online: https://extranet.who.int/nutrition/gina/en/node/26174 (accessed on 10 December 2021).
  67. Aranceta-Bartrina, J.; Partearroyo, T.; López-Sobaler, A.M.; Ortega, R.M.; Varela-Moreiras, G.; Serra-Majem, L.; Pérez-Rodrigo, C. Updating the food-based dietary guidelines for the Spanish population: The Spanish society of community nutrition (senc) proposal. Nutrients 2019, 11, 2675. [Google Scholar] [CrossRef] [Green Version]
  68. Fernandez, M.L.; Raheem, D.; Ramos, F.; Carrascosa, C.; Saraiva, A.; Raposo, A. Highlights of current dietary guidelines in five continents. Int. J. Environ. Res. Public Health 2021, 18, 2814. [Google Scholar] [CrossRef]
Figure 1. Schematic flowchart of the optimization phases, models, and parameters, own edition. 1 Recommended dietary intakes based on EFSA [27], FAO and WHO [28], WHO [29], and the Hungarian recommendation [30] (details on RDIs are presented in the Supplementary Materials, Table S2); 2 The 10th and 90th percentiles of population intake of food sub-group and group intake were estimated based on the representative population sample (men: n = 372, women: n = 485) from the HDNSS 2014 study [23] (details on the percentile values are presented in the Supplementary Materials, Tables S3–S6). 3 Specific food sub-groups to be limited (max. constraint set as observed intake value) were based on country-specific aspects: (1) “wines” and “beers”: only energy and water footprint values were included in the calculation, since nutrient intake cannot be recommended from these sources due to their “behavioral risk” status, contributing to the development of non-communicable diseases [13], (2) recommended limitation on “offals and products” [46,47], (3) recommended limitation on foods with high added sugar content (“bakery products, pastries and sweets”, “sugar and honey”, and “carbonated soft drinks”) [46] and (4) “meat products” due to the preference of leaner meats by the Hungarian Food-Based Dietary Guideline (FBDG) [Okostányér®], several European official guidelines and their status as an individual dietary risk factor contributing to the development of non-communicable diseases [13,46,47]. OF = objective function, WFP = water footprint, RDI = recommended intake value.
Sustainability 14 02309 g001
Figure 2. Contribution of the main food groups (n = 11) to the total water footprint in the observed and optimized diets for women.
Sustainability 14 02309 g002
Figure 3. Contribution of the main food groups (n = 11) to the total water footprint in the observed and optimized diets for men.
Sustainability 14 02309 g003
Figure 4. Major contributors to the total water footprint among food sub-groups (n = 17) in the observed and optimized diets for women. Major contributors: food sub-groups that contributed to the total dietary water footprint of diets over the average of food sub-groups in the observed diet; food sub-group > mean of the dietary water footprint contribution value of the food sub-groups (88.42 l/day/capita) in the observed diet or at least one model. (The list of all food sub-groups is in the Supplementary Materials, Table S1).
Sustainability 14 02309 g004
Figure 5. Major contributors to the total water footprint among the food sub-groups (n = 18) in the observed and optimized diets for men. Major contributors: food sub-groups that contributed to the total dietary water footprint of diets over the average of food sub-groups in the observed diet; food sub-group > mean of the dietary water footprint contribution value of the food sub-groups (110.69 l/day/capita) in the observed diet or at least one model. (The list of all food sub-groups is in the Supplementary Materials, Table S1).
Sustainability 14 02309 g005
Table 1. Change in the absolute and relative water footprint, proportion of blue water footprint, and relative weight between the observed and optimized diets.
Blue WFP 1Green WFP 1Total WFP 1Relative Change in Total WFP 1The Proportion of Blue WFP 1 to Total WFP 1Relative Change in the Weight of Diet 2
l/Day/Capita%
Women
Observed diet62.02710.33094.7baseline2.0baseline
WFP_OBS54.52710.33083.7−0.41.823.1
WFP-10%52.52427.42785.2−10.01.925.4
WFP-18%54.32195.22537.7−18.02.131.9
Men
Observed diet78.43367.73874.2baseline2.0baseline
WFP_OBS68.33367.73864.6−0.21.818.0
WFP-15%65.82861.73293.1−15.02.021.6
WFP-28%55.62404.12789.4−28.02.031.5
1 WFP = water footprint; 2 Value of the objective function (Equation (2)), the measure of the dietary shift.
Table 2. Dietary shift: change between observed and optimized diets in g/day/capita by food sub-groups.
Optimized Diets for MenOptimized Diets for Women
WFP_OBSWFP-15%WFP-28%WFP_OBSWFP-10%WFP-18%
Food sub-groupsChange compared to the observed diet in g/day/capita
Cereals, groats, and grains+51.8+38.7+53.8−24.0−18.0−5.6
Nuts and seeds0.0+13.6+13.6+13.0+13.0+13.0
Legumes and products0.00.0+12.40.00.0+5.8
Whole grain bread+49.0+49.0+49.0+48.4+48.4+48.4
Canned vegetables and vegetable products+57.5+9.9+27.2+41.4+55.7+42.1
Bakery products, pastries, and sweets−18.1−18.1−18.1−14.4−14.4−14.4
Wheat Bread+14.6+114.3+117.6+69.8+72.6+74.0
Fruit products0.00.00.00.00.00.0
Fresh and frozen fruits0.00.0−115.6+114.8+116.1+105.8
Dry pasta0.00.0−18.4−3.3−19.8−19.8
Rolls−12.1−51.9−51.90.0−7.5−24.8
Fresh and frozen vegetables incl. mushrooms+142.1+142.1+142.1+132.9+132.9+132.9
Potatoes0.0−87.00.0−12.7−26.9−19.2
Jams0.00.00.0−4.6−4.6−4.6
Fruit and vegetable juices0.00.0−46.90.00.00.0
Sauces and seasonings0.00.0−7.20.00.00.0
Meat products−66.1−66.1−66.1−42.4−42.4−42.4
Fermented dairy products+0.7+49.9+91.4+52.6+49.0+84.2
Milk and milk-based drinks0.0−49.8−123.50.00.0−114.5
Cottage cheese0.00.0−10.20.0−9.6−9.6
Cheese−21.9−21.9−21.9−19.2−19.2−19.2
Other dairies creams−23.8−23.8−23.8−20.6−20.6−20.6
Eggs+20.4+40.1+40.1+28.3+28.3+28.3
Poultry meat+70.4+70.4+70.4+17.0+59.4+59.4
Pork meat0.0+3.5−11.70.0−11.2−1.1
Beef meat+16.00.0−1.5+6.50.0−2.7
Fishes inc. canned fishes0.00.00.00.0+3.5+17.3
Offals and products0.00.00.00.00.00.0
Animal fats−16.9−16.9−16.9−9.8−9.8−9.8
Vegetable oils+7.3+2.3+3.9−3.7−3.6−3.7
Sugar and honey−20.7−20.7−19.9−20.4−20.4−20.4
Wines0.00.0−30.10.00.0−9.5
Beers0.0−99.9−99.90.00.00.0
Carbonated soft drinks0.00.00.0−42.2−42.2−42.2
Smoothies−14.9−14.9−14.9−4.6−4.6−4.6
OBS = observed diet, WFP_OBS = optimized diet with no water footprint reduction, WFP-10% = optimized diet with 10% water footprint reduction, WFP-18% = optimized diet with 18% water footprint reduction, WFP-15% = optimized diet with 15% water footprint reduction, WFP-28% = optimized diet with 28% water footprint reduction. Color scale: the values are expressed in g/day/capita: Sustainability 14 02309 i001.
Publisher’s Note: MDPI stays neutral with regard to jurisdictional claims in published maps and institutional affiliations.

