
Impact of China’s National Sword Policy on the U.S. Landfill and Plastics Recycling Industry


1
School of Management, University at Buffalo, Buffalo, NY 14260, USA
2
Environmental/Ecological Economist, RENEW, University at Buffalo, Buffalo, NY 14260, USA
*
Author to whom correspondence should be addressed.
Sustainability 2022, 14(4), 2456; https://0-doi-org.brum.beds.ac.uk/10.3390/su14042456
Submission received: 17 January 2022
/
Revised: 8 February 2022
/
Accepted: 14 February 2022
/
Published: 21 February 2022
(This article belongs to the Topic Solid Waste Management)
Abstract
:This paper analyzes the impacts of China’s Green Fence and National Sword Programs, under which strict contamination limits were imposed on recyclable materials, besides prohibiting imports of low quality recyclables. Specifically, this study investigates the impacts of this policy on landfills, and the risks to the U.S. plastics secondary materials market and material recovery facilities (MRFs). A hierarchical regression analysis reveals the significant impacts of China’s Green Fence and National Sword polices on the amount landfilled plastic. Controlling for oil prices, producer price index (PPI), and amount of plastic scrap exported, our findings show that the Green Fence had no statistically significant impact on the amount of plastic landfilled in the U.S. However, the quantity of plastic landfilled in the U.S. increased by 23.2% following the implementation of National Sword. Furthermore, analysis of the annual reports submitted by registered MRFs in New York (NY) state reveals that the total amount of plastic recovered by them has decreased. We suggest that demand creation and investments that improve the quality of bales are needed to help solve this economic dilemma.
1. Introduction
The environmental impact of the improper disposal of plastics has received considerable attention in recent years due to the adverse effects of plastic waste on health and the environment [1]. Plastics constitute a nonrenewable resource; therefore, nongovernmental organizations (NGOs), governments, and industry have been advocating for reducing, reusing, and recycling plastics [2]. However, anecdotal evidence tends to suggest that a majority of plastics are landfilled [3]. Particularly, increasing recycling and reuse of plastics is crucial to plastic waste management and the avoidance of landfilling [4]. For example, recognizing the sustainability gains of increased plastic recycling, the European Commission has elevated plastic waste to a priority waste stream in its recent Action Plan for the Circular Economy, promoting plastic recycling in Europe [5].
In the United States (U.S.), one of the largest consumers of plastics in the world [6], almost 26,970 tons of plastic waste is landfilled annually [7]. Historically, the U.S. shipped most of its plastic scrap overseas, particularly to China [8]. In 2013, China introduced the “Green Fence”, which involved more intensive inspections of incoming loads of scrap material. Later, in 2016, China announced that secondary material commodity imports from the U.S. would be restricted and followed this with the launch of the National Sword program in 2017. Finally, in March 2018, China introduced a 0.5 percent contamination limit along with an outright ban on many recyclables, including plastics [9]. Recent research has highlighted the positive ecological impacts of lowered shipping of plastic scrap over large distances as a positive effect of China’s Sword [10]. However, the glut of plastic waste has caused some to speculate that the landfilling of plastics has increased in the U.S. [11].
Since the National Sword policy imposed contamination limits on recyclable materials sent to China, the cost and risk of exporting plastic material has increased considerably for the U.S. material recovery facilities (MRFs) and processors [12]. This is due to the increased possibility that shipping containers containing mixed plastic scrap could be sent back by China if the stringent contamination limits are not met. As a result, the 0.5% contamination standard has proven hard to meet economically by facilities in the U.S. However, it is not clear whether China’s import restrictions for plastics have led to the increased landfilling of these materials in the U.S. On the one hand, virgin plastic is viewed as a cheaper alternative than recycled plastic for manufacturers, due to the U.S.’s increasing petrochemical production [13]. The reduced demand for recycled plastics may lower the incentives for MRFs to recycle, resulting in increased landfilling. However, on the other hand, with emerging alternative recycling techniques [14], demand incentives for purchasing recycled plastics (e.g., the U.S. Plastics Pact [15]), and robust prices for some recycled plastics (e.g., polyethylene terephthalate (PET) and high density polyethylene (HDPE)) [16], MRFs may also have a higher incentive to process plastic scrap domestically despite National Sword, thereby lowering the landfilling of plastic waste.
Recent research has studied the impacts of China’s National Sword on global waste markets. The authors of [9] focus on the import of waste plastic and used paper by China and find that China’s import volumes of waste plastic and used paper decreased by 92% and 56%, respectively, after the National Sword. The authors of [17] study the effects of China’s National Sword Policy on the U.S. recycling system and examine the waste management and recycling systems in different countries. The authors of [18] present two alternative approaches to reusing matrix trays (single use plastic carriers) in the U.S. as an alternative to landfilling used trays after China’s National Sword Policy. However, none of these papers examine the impact of China’s National Sword policy on U.S. landfilling of plastic waste.
Therefore, this paper represents the first attempt, to the best of our knowledge, to provide an econometric analysis to test the impacts of China’s National Sword policy on the amount of plastic landfilled in the U.S. In doing so, we provide a data driven approach to assess the extent of the impact of the Sword restrictions on plastics, which may be useful to U.S. policymakers in formulating public policy around plastic recycling. Our analysis controls for several factors, such as oil prices, the prices of recycled plastics, exports, and the timing of China’s import restrictions. In addition to theoretical arguments, our hypotheses are driven by anecdotal observations from MRF managers. We also supplement our analysis with interviews with MRFs and analysis of annual MRF forms in New York State (NYS). Finally, we provide evidence from company annual reports to assess the risk to U.S. plastic companies.
The rest of the paper is structured as follows. In Section 2, we formulate key hypotheses. In Section 3 and Section 4, we discuss the econometric model and present the key results, respectively. Section 5 supplements our analysis with a focused analysis of recycling and recovery in New York State. In Section 6, we provide additional anecdotal evidence with industry perspectives. Finally, concluding remarks are provided in Section 7.
2. Hypothesis Development
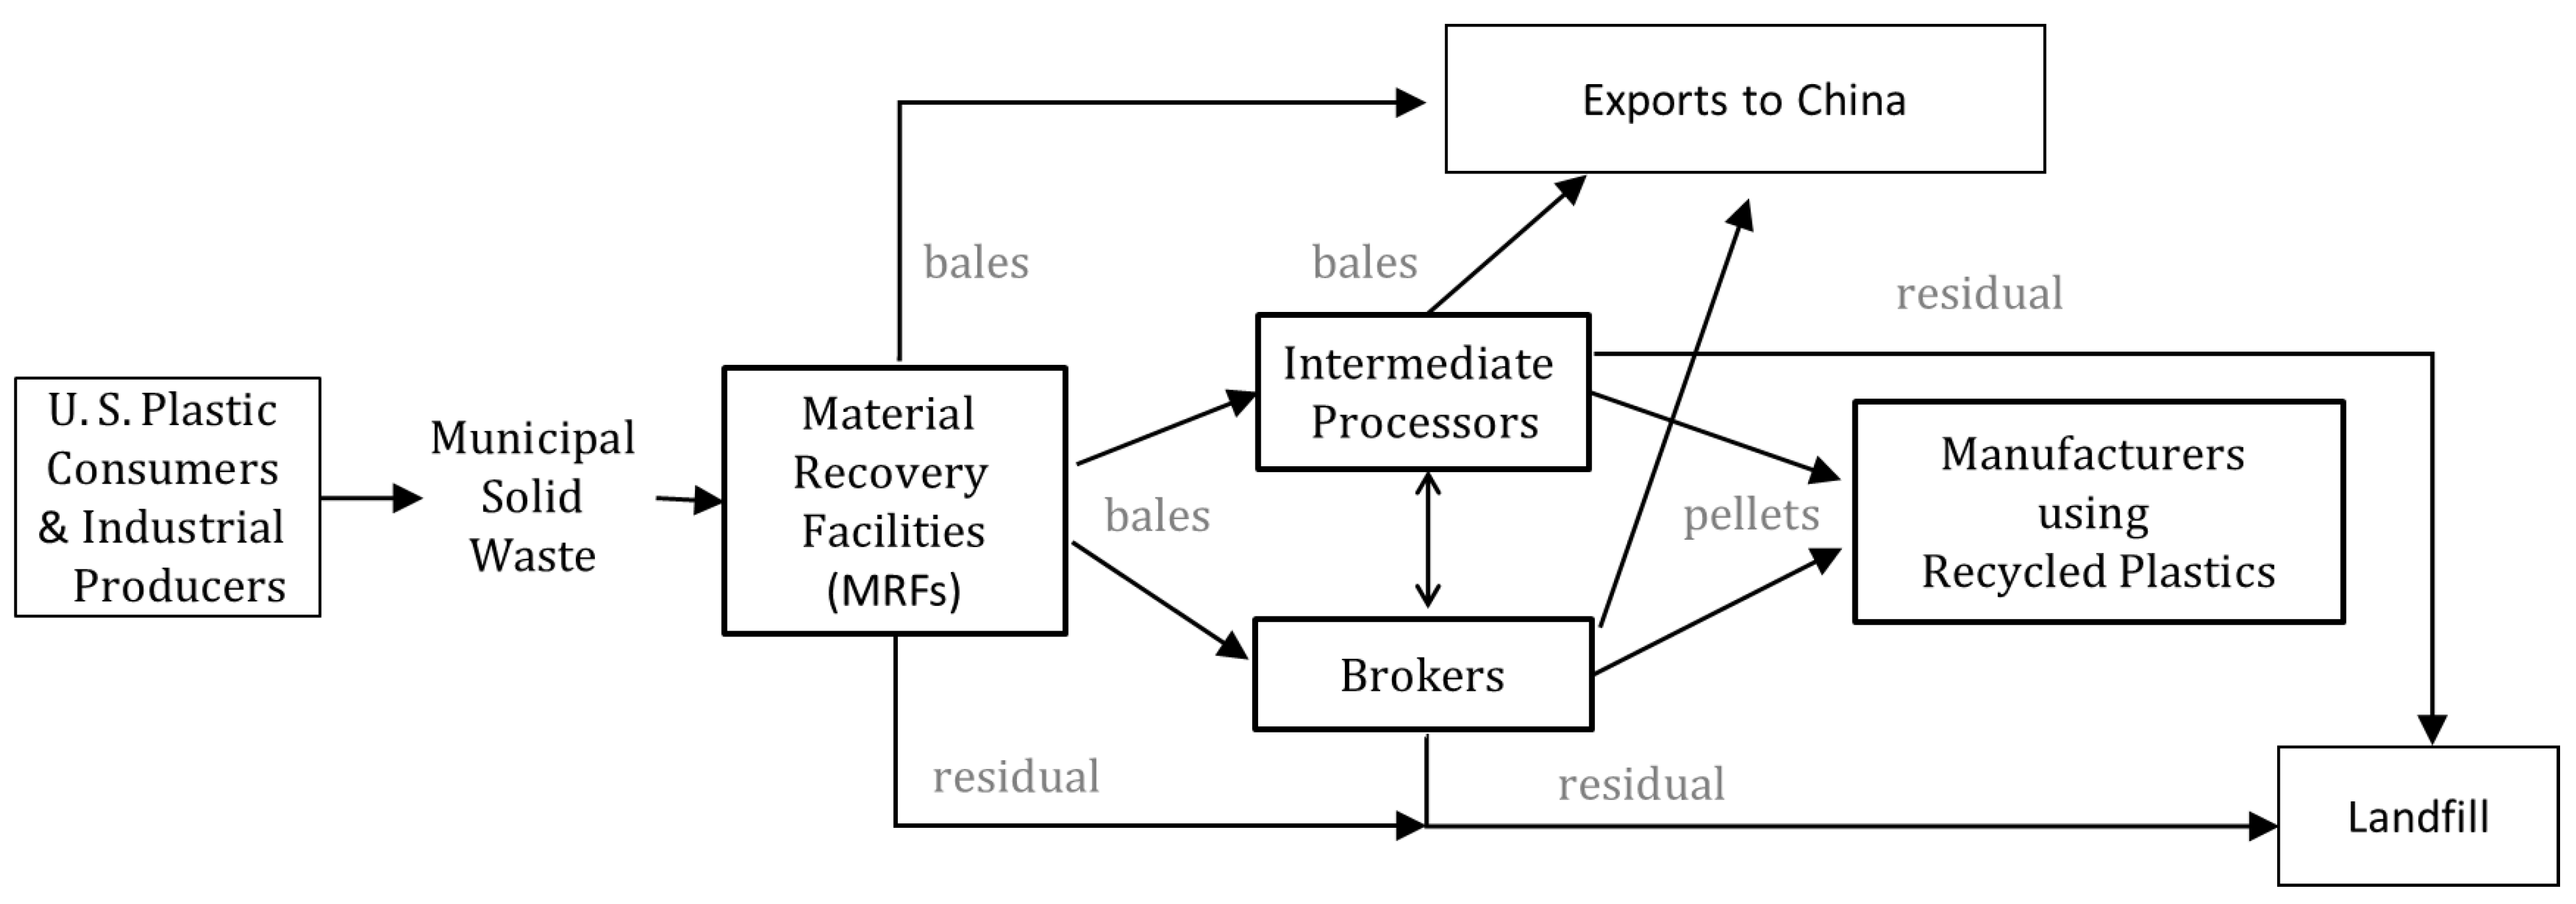
There is growing interest in integrating sustainability principles into supply chain management [19,20,21], particularly reverse supply chains. The reverse supply chain is the series of activities necessary to retrieve a product from a customer and either dispose of it or recover value [22,23,24]. For example, the reverse supply chain for plastics (as depicted in Figure 1) starts with individual consumers of plastic containers and packaging and industrial producers who place recyclables at the curbside for collection. Municipalities that collect these recyclable materials contract with MRFs to sort the recovered plastic and other recyclable materials and convert them into bales. The recovered plastic bales from the MRFs are then sent to intermediate plastic processors. The plastic bales are processed and converted into recyclable inputs, such as pellets and flakes, or directly to brokers who export the reclaimed material. In addition, manufacturers using recycled plastics in their branded products demand recyclable plastics [25]. The residuals, consisting of mixed plastic waste generated at MRFs, brokers, and processors, are typically landfilled.
China’s National Sword policy appears to have had both direct and indirect impacts on the plastics recycling industry. The immediate impact has been the sudden loss of recyclable plastic customers [26]. The strict contamination standard imposed by China in 2018, in particular, led to a significant decline in exports of plastic scrap [27]. The reduction was substantial, as China had historically been the biggest customer for U.S. scrap plastic. The indirect impact of the Sword policy may have been to create a significant imbalance between demand for recycled plastic and the supply of plastic scrap within the U.S. This has been mainly due to the high quality standards (e.g., contamination limits) on recycled plastic by U.S companies, which is challenging to meet for a majority of the plastic scrap due to quality contamination along the supply chain (e.g., due to single stream recycling and commingled collection), changes in packaging design, and greenwashing. With waste generation consistently growing, coupled with fewer options to export plastic scrap, the growth in the domestic supply of plastic scrap drastically exceeded existing demand, resulting in a decline in prices [28]. The reduced prices reduced the profitability of recycling and increased the attractiveness of alternate disposal options, such as landfilling. The above discussion indicates a link between China’s Sword policy and the use of alternate disposal options, such as landfilling, in the U.S.
Therefore, a primary focus of interest in this study is to investigate the impact of China’s Sword policy on the amount of plastics landfilled in the U.S. There has been a glut of plastic waste in the U.S. since China’s ban [29]. Although several industry associations have come together to create demand-side incentives for recycled plastic (e.g., the U.S. Plastics Pact [30]), there is a dearth of processing capacity in the U.S., especially for mixed plastics (#3-#7), due to lower market prices, high sorting costs, and insufficient demand [31]. Furthermore, since landfilling is a conventional approach to waste management [25], we posit that China’s Sword restrictions must have led to increased landfilling of plastic waste [17]. Hence, we hypothesize that:
Hypothesis 1 (H1).
China’s National Sword restriction is positively related to the amount of plastic waste landfilled in the U.S.
It has been observed that China’s policies have also had a notable impact on global plastic scrap trade flows. For example, in 2018, China’s imports plunged by 95.4% compared to baseline levels and the trade flow of global plastic scrap plummeted by 45.5% [11]. In addition, the China ban affected nearly all major exporters, with total exports declining. Thus, it may be inferred that the greater a country’s reliance on the Chinese market (before the ban), the more dramatic will be the decrease in its plastic scrap exports and increased attractiveness of landfilling as a treatment option [11]. Based on this, we hypothesize that:
Hypothesis 2 (H2).
The amount of plastic scrap exported is negatively related to the amount of plastic waste landfilled in the U.S.
The price difference between recycled plastic and virgin plastic has been argued to play a key role in plastic producers’ demand for recycled plastics [32]. Furthermore, this price differential is repeatedly identified in executive interviews as a significant barrier to recycling plastics ([33] and T. Keel, personal communication, 6 May 2020). In this context, it may be noted that plastics are almost completely derived from petrochemicals produced from fossil oil and gas. Therefore, the price of virgin plastics is significantly influenced by the oil price [25]. Consequently, it may be posited that with higher oil prices and a higher price of virgin plastics, the demand for recycled plastics may increase, which may decrease the landfilling of plastics. Based on this reasoning, we posit that:
Hypothesis 3 (H3).
Oil prices are negatively related to the amount of plastic waste landfilled in the U.S.
Other literature has found that the volatility spillover between the oil price and recycled plastic prices may be significant [34]. However, higher oil prices also increase the operational cost and affect all material streams at MRFs [35]. For example, Miller [35] states that:
“Higher oil prices can also hurt recyclers by driving up operational costs. It takes a great deal of oil to transport materials and run processing equipment, so rising prices may put a dent in the profits generated by a robust market for recycled plastic. Furthermore, the manufacturers who buy recycled materials also struggle to operate when energy costs are high.”
Therefore, a counterargument can be advanced whereby higher oil prices may also result in increased landfilling of plastic scrap due to higher operating costs for recyclers. Based on this, we also test the following reverse hypothesis:
Hypothesis 4 (H4).
Oil prices arepositively associated with the amount of plastic waste landfilled in the U.S.
In prior literature, the producer price index (PPI) has been used to measure the average changes in prices that domestic establishments receive for their output [36]. For example, Huang et al. [37] use the PPI to transform current prices into constant prices for time series analysis for input–output analysis. Therefore, we control for the potential impact of recycled plastic prices on treatment options with a producer price index (PPI), specifically for manufacturers of plastic products containing recyclable materials [38]. We posit that if prices received by domestic producers of recycled plastics decrease, then incentives for recycling as a treatment option will be lower, and there will be increased landfilling. Based on this reasoning, we posit that:
Hypothesis 5 (H5).
The producer price index (PPI) for manufacturers of plastic products is negatively related to the amount of plastic waste landfilled in the U.S.
3. Research Methods
To test the above hypotheses, we used annual data from the U.S. Environmental Protection Agency (EPA) on the amount of plastic landfilled in the U.S. between 2008 and 2018. We supplemented this data with other data on oil prices, PPI, the amount of plastic scrap exported, and the timing of China’s policy restrictions. Since the data on the oil price, PPI, exports, and the timing of China’s policy restrictions were on a monthly time scale, we converted the annual U.S. plastic landfill data [39] into a monthly time scale by allocating the yearly plastic discarded equally between the months of the year.
3.1. Dependent Variable (Landfill)
Although there are many economic indicators for plastic secondary material markets (such as recovery rates and plastic scrap prices), we use the amount of plastic landfilled as the dependent variable in this analysis. The amount of plastic landfilled was obtained from U.S. EPA data and is reported in thousands of tons [39]. Since this is of a different magnitude from the other independent variables, this value was log transformed for the regression analysis. The use of “Landfill” as a dependent variable allows us to make appropriate policy recommendations, and it is deemed to be an important metric to assess the sustainability and environmental implications of U.S. secondary material markets.
3.2. Independent Variables
3.2.1. National Sword Restriction (“Restriction”)
The advent of China’s policy restrictions was categorized into three time-frames: (i) the time before the Green Fence was initiated (i.e., before February 2013), (ii) the time after the Green Fence was initiated, but before the announcement of National Sword (i.e., from February 2013 till March 2017), and (iii) the time after National Sword was implemented, (i.e., from March 2017). We represent these time-frames of China’s restrictions via an ordinal variable (“Restriction”) that takes on the values of 0, 1, or 2 for (i), (ii), and (iii), respectively.
3.2.2. Plastic Scrap Exports (“Plastic Scrap Export”)
Global plastic scrap export data (in thousands of tons) was obtained from the United States International Trade Commission (USITC) DataWeb [40], which provides U.S. merchandise trade and tariff data. Trade data for 1989 to the present are available monthly, quarterly, annual, or year to date. They can be retrieved using a sophisticated querying tool with features such as user defined country and commodity groups. We used the data for “Waste, parings, and scrap, of plastics,” captured by the Harmonized Tariff Schedule (HTS) (2021 Basic Revision 6) with code 3915. Like the landfill dependent variable mentioned above, this variable was log transformed.
3.2.3. Oil Price (“Oil Price”)
Historical crude oil prices (in USD) were represented by the West Texas Intermediate (WTI) crude oil price per barrel [41].
3.2.4. Producer Price Index for Recycled Plastics (“PPI”)
Obtained from the Bureau of Labor Statistics (BLS), PPI is a family of indices that measures the average change over time in prices received by producers for domestically produced goods and services [42].
4. Results
Table 1 shows the pairwise correlation coefficients between the variables. First, we observe that China’s import restrictions and the amount of plastic landfilled are positively correlated. Further, oil prices, PPI, and plastic exports have a significant negative correlation with the amount of plastic landfilled. Some of the independent variables are seen to be correlated with each other. For example, PPI is positively correlated with oil price, whereas “Sword Restriction” is negatively correlated with both oil price and PPI. However, tests for multicollinearity show that the variance inflation factors (VIFs), which measure the severity of the impact of multicollinearity on linear regression equations, were all below the prescribed value of 5.0, as seen in Table 2. Therefore, multicollinearity was not an issue of concern.
To ascertain if China’s import restrictions increased the amount of plastic landfilled in the U.S. while controlling for other factors that may influence this relationship, we ran an econometric analysis using hierarchical regression [43,44]. Hierarchical regression is a statistical regression method wherein a specified set of variables is added progressively to determine if a statistically significant amount of variance is explained in the dependent variable. Several regression models are tested by adding variables in succession to a prior model at each step. This helps determine if newly added variables significantly improve the proportion of explained variance in the dependent variable. The analysis also examines if an independent variable significantly influences the dependent variable when grouped with other independent variables. The limitations of a hierarchical linear regression approach are the customary limitations of linear regression by way of ensuring that its assumptions are not violated. These include linear relationships, multivariate normality, little or no multicollinearity, no autocorrelation, and ensuring homoscedasticity.
We implemented a hierarchical regression model with the total amount of plastic landfilled (log transformed) as the dependent variable and key explanatory variables, as seen below:
Table 2 contains four hierarchical regression equations showing the incremental effects of the key independent variables in explaining the variance in the dependent variable. First, it is seen that, in all four models reported in Table 2, the relationship between the amount of plastic landfilled and the Sword restriction is positive and significant (with regression coefficients ranging between 0.062 and 0.082, all at p < 0.01). This result thus strongly supports H1. Regression models 2, 3, and 4 reveal that the relationship between the amount of plastic landfilled and plastic scrap exports is negative and significant (with regressions coefficients ranging between −0.069 and –0.057, p < 0.01). Thus, H2 is supported. However, the relationship between oil price and plastic landfilled is not significant in Models 3 and 4. Thus, H3 and H4 are not supported. In other words, our analysis indicates that there is no significant association between oil prices and the amount of plastic waste landfilled in the U.S. Model 4 also shows that the relationship between PPI and the amount of plastic landfilled is not significant, thus yielding no support for H5.
Next, a post hoc analysis was conducted to identify the most impactful phase of China’s restrictions with respect to landfill. A Tukey’s HSD test was performed to test whether the three phases led to significant differences in landfill. These pair-wise comparison results are seen in Table 3.
It is seen from Table 3 that the Green Fence had no statistically significant impact on the amount of plastic landfilled. However, the implementation of the National Sword did have a statistically significant effect on the amount of plastic landfilled. The results in Table 3 indicate that the amount of plastic landfilled increased by 23.2% (i.e., {exp(0.2088) − 1] × 100) following the implementation of the National Sword. The mean amount of plastic landfilled during restriction period 2 was 23.35% higher than for restriction period 0, which is statistically significant at a 99% confidence level. The mean amount landfilled during restriction period 2 was 23.22% higher than for restriction period 1, which is statistically significant at a 99% confidence level. However, there is very little change in the amount of plastic landfilled between restriction 0 and restriction 1. This indicates that a bulk of the increase in the landfilling of U.S. plastic scrap occurred immediately after the National Sword was announced.
The analysis thus far has explored the impact of China’s National Sword policy on the amount of plastic landfilled in the U.S. The econometric analysis extended only until 2018, since the plastic landfill data from EPA is available only until 2018. However, in the next section, we provide a regionally focused analysis of plastics recycled in New York State (NYS), including 2019 data. We also describe results from some descriptive analyses for MRFs in NYS.
5. Analysis of NYS Annual Recyclable Handling and Recovery
In light of the above analysis, a focused study of recycling and recovery efforts in New York, one of the country’s larger states, with relatively higher population and economic activity, is of added interest. In 2014, 37.0 million tons of waste were generated in NYS, representing a per capita annual generation of 1.9 tons [45]. To gauge how plastic recyclable materials recovery has been impacted since China’s National Sword Policy, the authors created a database of information obtained from annual reports submitted by registered MRFs in New York state provided by the state’s Department of Environmental Conservation. The annual reports are in portable document format (PDF) files, relevant parts of which we transcribed to an Excel workbook. These forms contain data about how plastic is collected and recovered by the MRFs. Our database includes this information for the years from 2016 to 2019 inclusive.
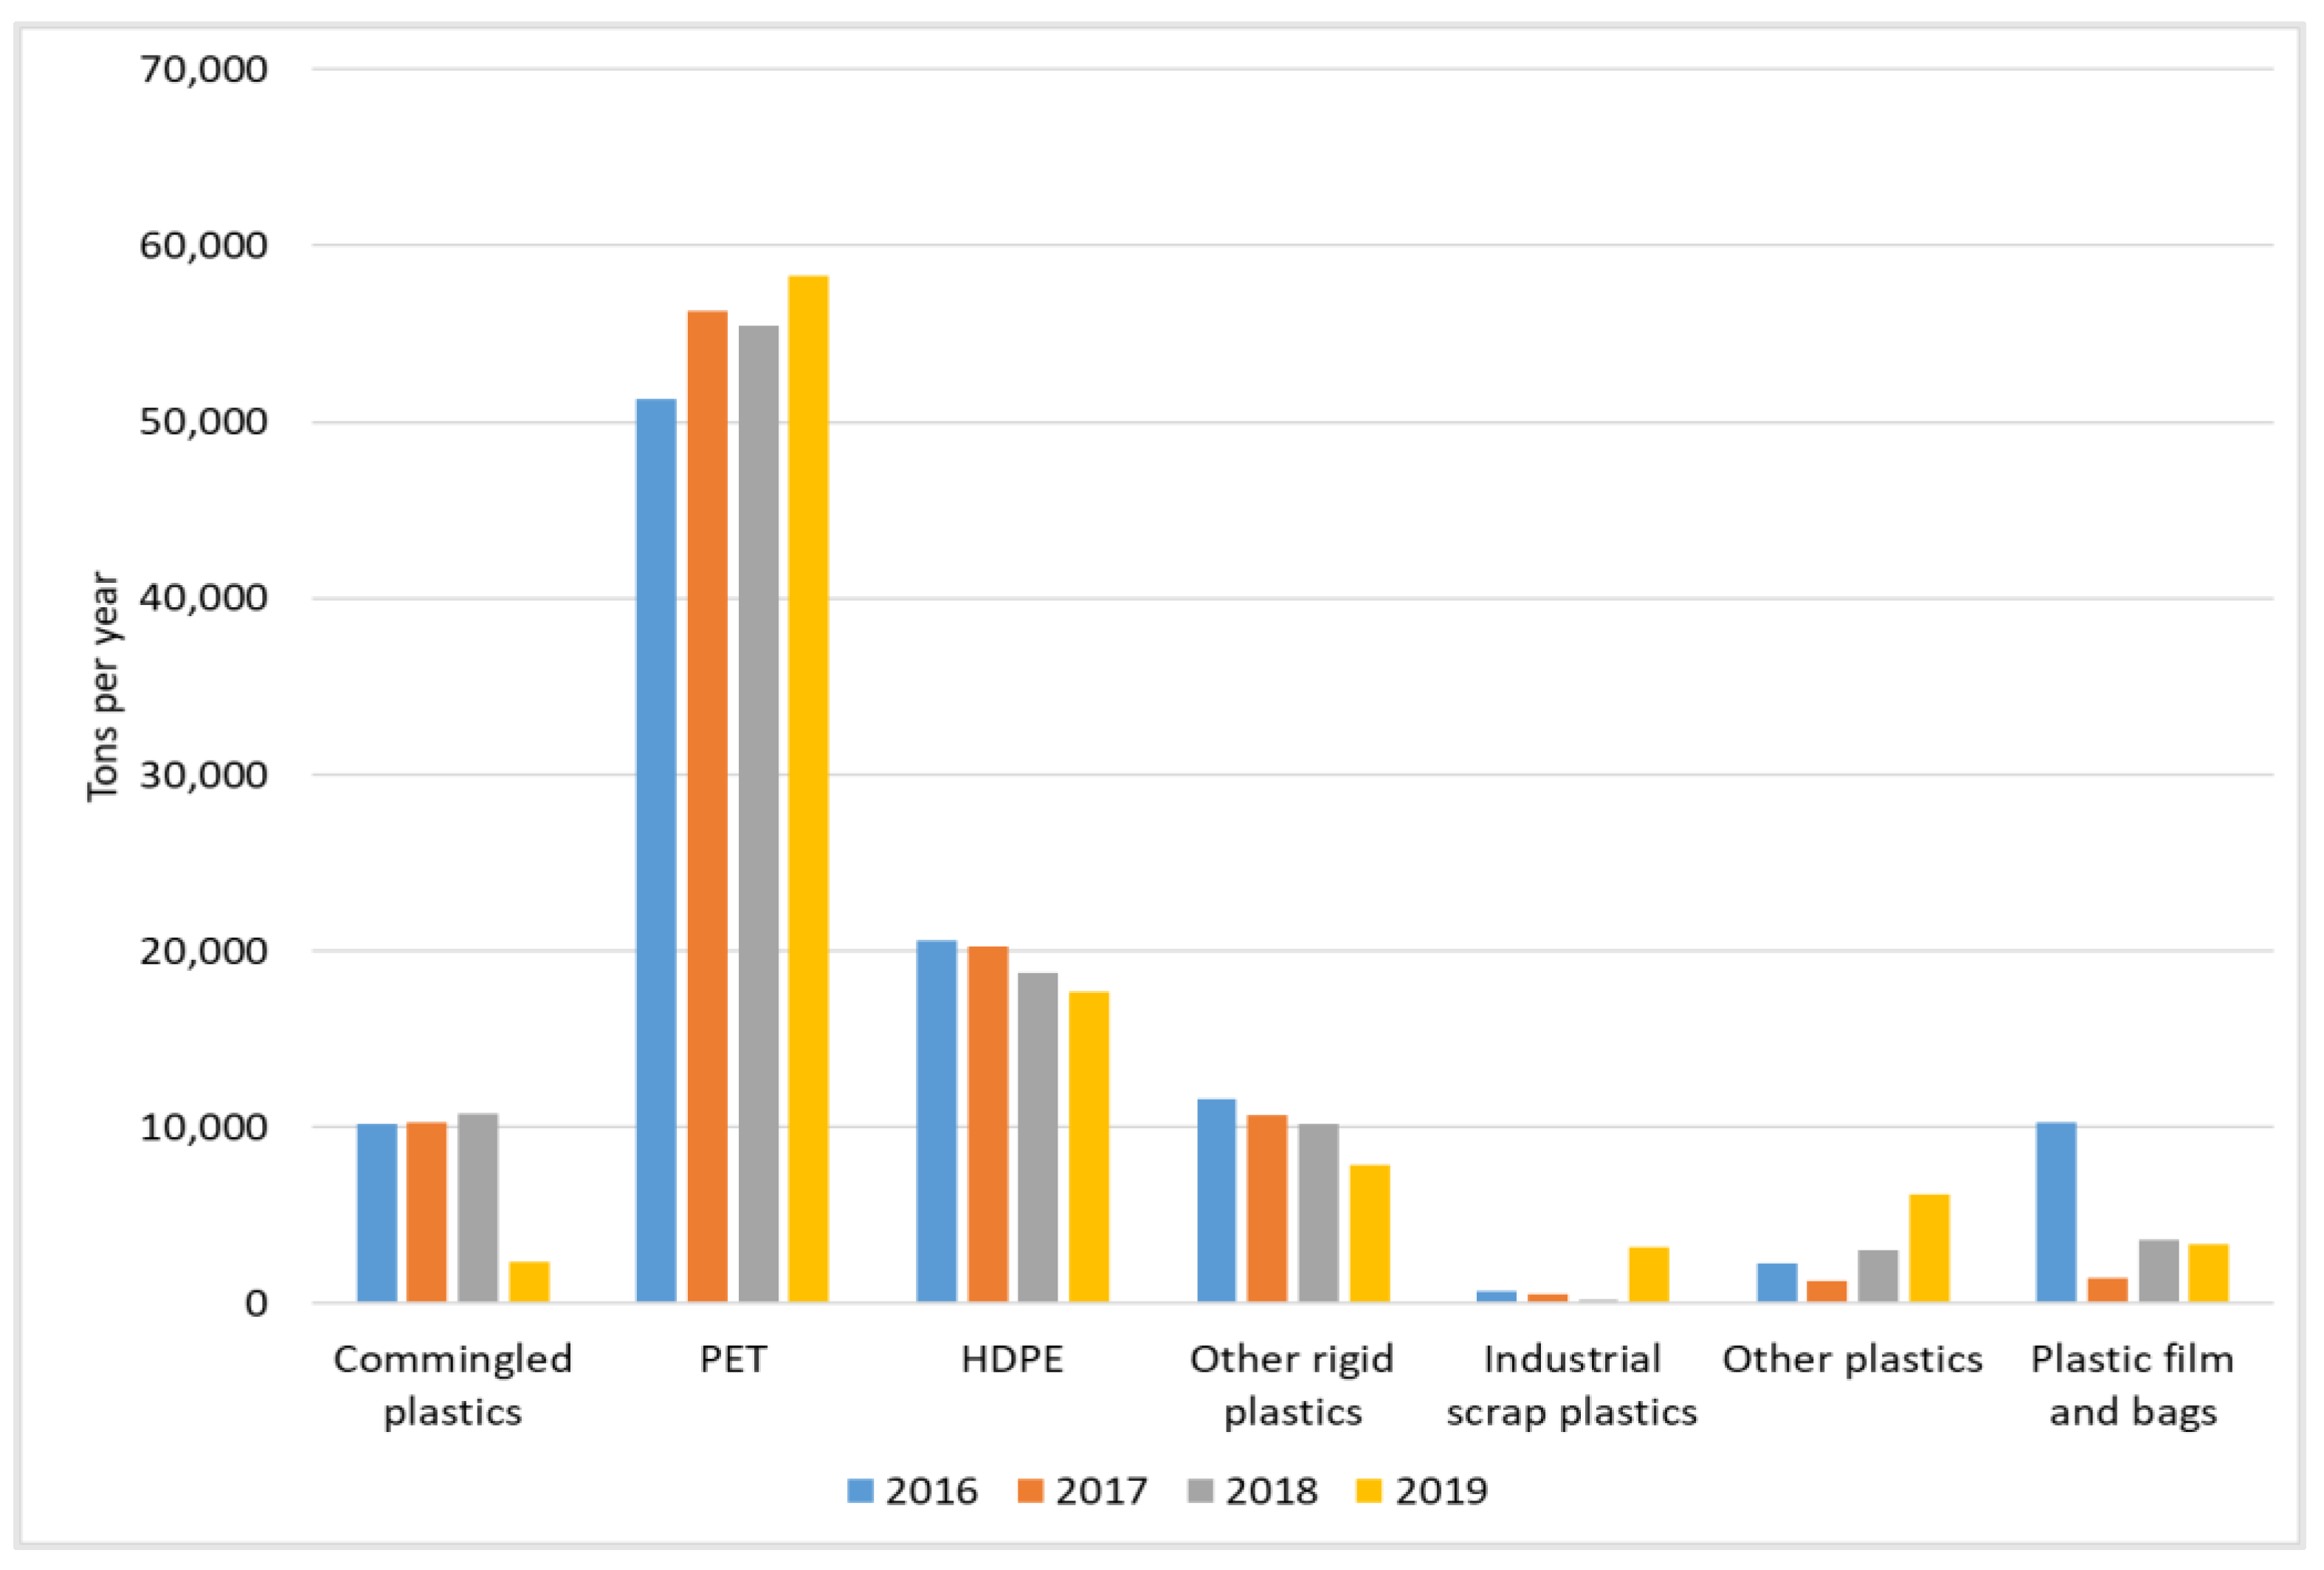
Figure 2, below, shows the amount of plastic recovered and sent out by MRFs during the time frame and how different plastic polymers varied. We see that the amount of PET recovered by the MRFs increased in 2016–2017 and then decreased from 2017–2019. The quantity of HDPE and other rigid plastics recovered at NYS MRFs consistently declined from 2016 to 2019. For other plastics, the amount recovered was greater in 2019 than in 2016, while the amount of plastic film and bags and commingled plastics decreased over the period.
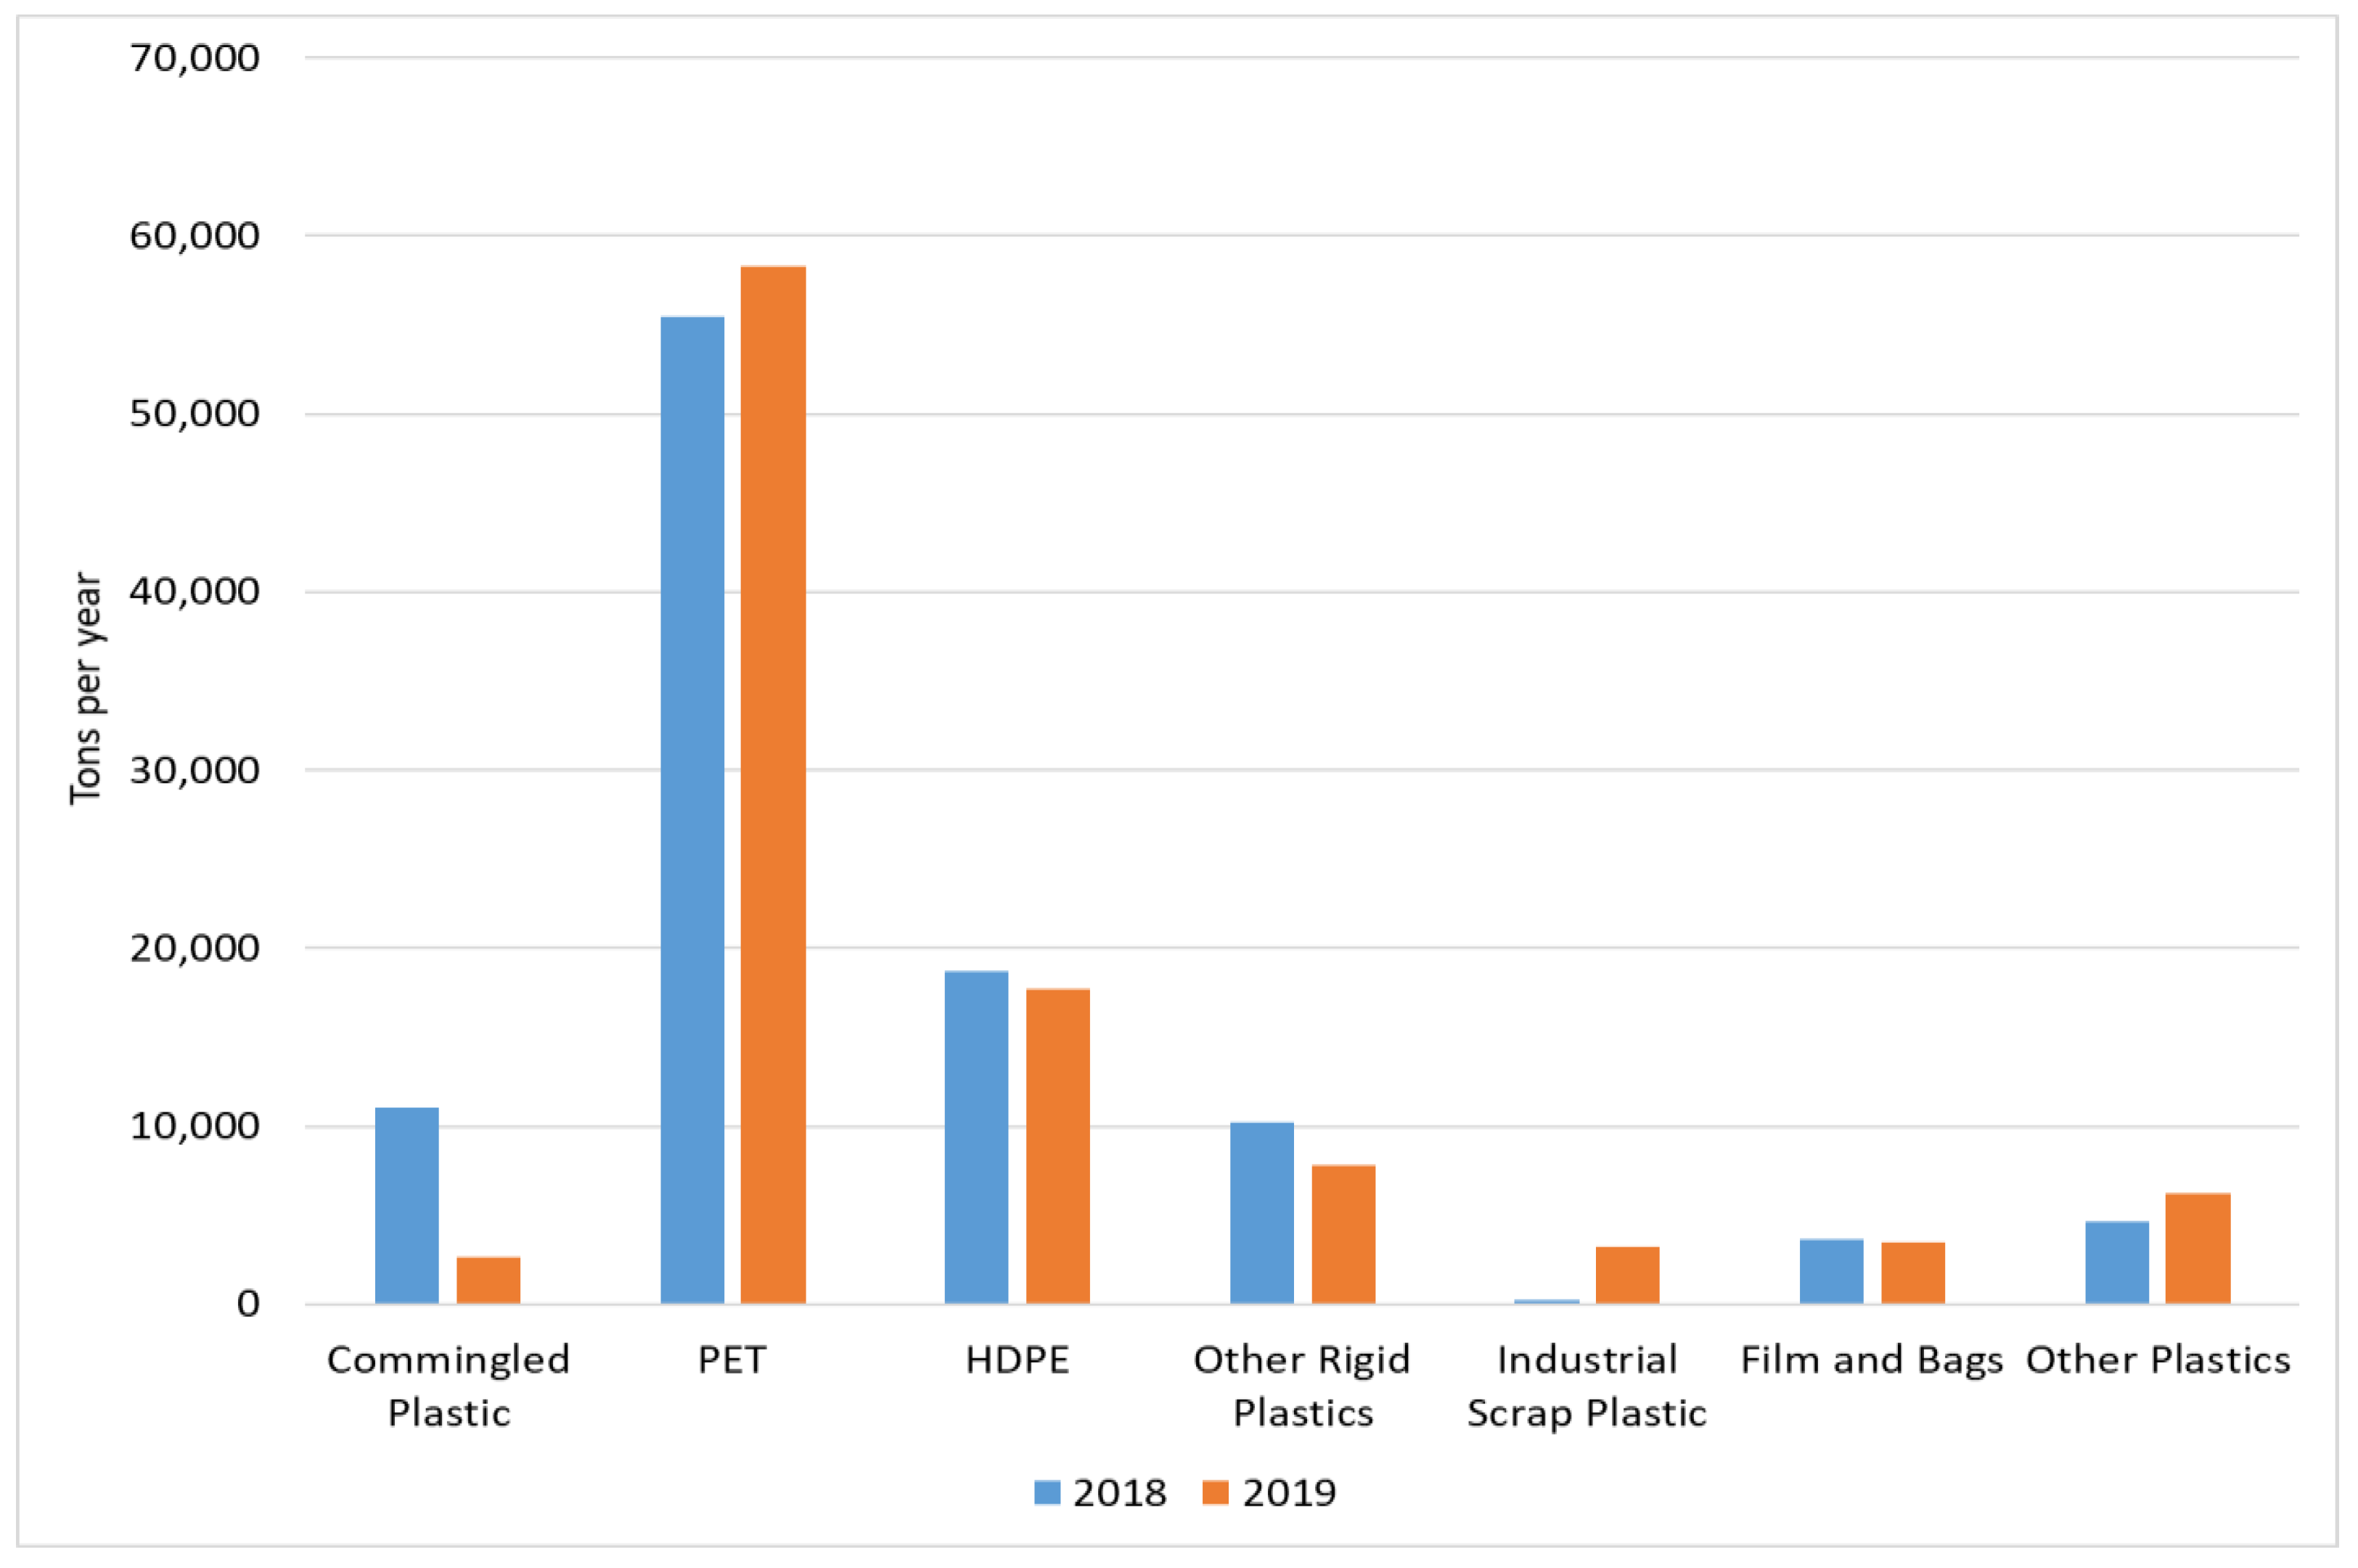
Figure 3 depicts the change in plastics recovered by MRFs in 2018 and 2019 to show the changes in the amounts of plastic recovered after National Sword’s implementation. It can be seen that the amounts of commingled plastic, HDPE, and other rigid plastics declined between 2018 and 2019. It appears that, even though China’s restrictions increased the supply of plastic available domestically, the amount that was recovered still went down, which indicates that other economic and market factors, such as demand, prices, and the economic feasibility of these materials, are influencing decisions at MRFs.
We analyzed the amount of plastic that the facilities recover. To avoid bias caused by missing data, we only considered MRFs that had: (i) submitted MRF forms for all four years, and (ii) had also reported their incoming material and plastics being sent out for those years.
Table 4 shows that the total amount of recovered plastics decreased over time, while the total amount of incoming material increased. Based on our interviews with MRFs, incoming material that is not sent out to brokers, transfer stations, and reclaimers is most likely incinerated or landfilled.
6. Industry Perspectives
From structured interviews with NYS MRFs and industry experts, we discovered that there had been an increase in the risks faced by U.S recycling businesses. For instance, most MRFs’ costs increased as they improved the quality of materials sorted and met contamination standards. For example, one MRF we spoke with had to increase the number of sorters and slow down its sorting line by 40% to improve the quality of their sorted plastics and paper, leading to a doubling of operating costs (A. Davis, personal communication, 26 November 2019). The respondent also claimed that it was hard to meet the minimum weight limit for containers, since plastic tends to be bulky and light. In addition, the respondent worried about having a load rejected in China and not receiving payment and expressed concerns about any potential negative publicity.
Casella Recycling, a solid waste collection, transfer, recycling, and disposal facility, when referring specifically to China’s National Sword policy, stated in its 2018 Annual report that: “The global recycling market has experienced negative commodity pricing pressure resulting from China’s National Sword program in 2017. Markets continued to decline in 2018, leveling off at historical lows compared to prior years. We expect markets to remain depressed into the foreseeable future.” Casella also reported that it was able to offset most of the commodity prices’ decline through risk mitigation programs; however, its operating income in 2018 was still significantly down “mainly due to several legacy contracts pursuant to which we absorbed the commodity price risk” [46].
SIMS Ltd., which manages most of the recyclables generated in New York City and deals with the recycling of bottles, cans, plastics, and paper, adopted an expansion strategy to tackle China’s import restrictions by processing mixed plastics from other MRFs. In its 2018 annual report, it stated that “With greater restrictions on plastic imports into China, SIMS has recently expanded its business of processing mixed plastics produced by other MRFs into sorted, saleable resins. Our capital […] spend included investment in several National Sword initiatives, including ICW (insulated copper wire) upgrades, cable granulation, and Zorba separation plants, some of which will carry over into the fiscal year 2019. These investments will contribute to our downstream strategy of producing better quality product for customers” [47].
Waste Connections Inc., a nonhazardous solid waste services company, also discussed China’s National Sword policy in its annual report and stated that China’s highly restrictive quality requirements are difficult for the industry to satisfy. It further discussed the financial implications of the policy and stated that “The new quality standards imposed by China and the restrictions on import licenses have made the sale of recycled commodities more difficult and have resulted in lower prices for such commodities, higher operating costs, or additional capital expenditures to meet the requirements. As a result, we have increased the fees we charge customers at our recycling facilities to recover the higher processing costs for recyclables. This may result in lower recycled commodity volumes at our MRFs, as customers may choose to pursue cheaper processing or disposal alternatives. Any such reduction could impact revenues, operating results, and cash flow. In addition, some of our recycling operations offer rebates to customers based on the market prices of commodities we buy to process for resale. Therefore, if we recognize increased revenues resulting from higher prices for recyclable commodities, the rebates we pay to suppliers will also increase, which also may impact our operating results” [12].
Similarly, Republic Services Inc., a solid waste collection, transfer, recycling and disposal facility, shared its concerns about decreased demand for recyclable materials and the lower commodity prices that resulted as a consequence [48]. Furthermore, Waste Management Inc., discussed price volatility as a consequence of China’s Sword policy and stated in its 2018 annual report that, “The Chinese government began to limit the flow of material into the country by restricting the issuance of required import licenses. The use of restrictions on import licenses to restrict flow into China continued in 2018 and is expected to continue to constrict in 2019. Additionally, increased container weight tracking and port fees have driven up operating costs in the recycling industry and have resulted in increased price volatility”. The company responded by “… revising our service agreements to address increased costs and working with stakeholders to educate the public on the need to recycle properly. However, there is uncertainty about the industry’s ability to adapt to the stricter quality expectations…it is possible there may not be sufficient demand for all of the material we produce, resulting in price decreases and volatility” [49].
Ultimately, the key risks that the changes in Chinese trade regulations have exposed to U.S plastic companies include price volatility for recyclable commodities, a lack of buyers for low quality plastic bales, higher operating costs, and lower profitability. This conclusion was substantiated during one of our interviews with an NYS MRF, which claimed that its primary MRFs used to do more intensive sorting until China’s National Sword Program reduced plastic recyclables’ prices. Moreover, MRFs typically do not find it economical to invest in sorting equipment (average cost USD 250–USD 500 K) for mixed plastics due to mixed plastic waste’s low volume and value (S. Farling, personal communication, 4 June 2020). Thus, we note that many of the mixed plastics (with minor exceptions) are either landfilled or baled together and sold at low prices.
7. Conclusions
This paper provides important empirical evidence that validates the claim that implementing China’s National Sword policy resulted in an increased amount of plastic waste being landfilled in the U.S. We also supplement our empirical analysis with evidence gathered from interviews with NYS MRFs. Our findings provide a counterpoint to the viewpoint that China’s National Sword policy improved the impact on the environment [10]. The above analyses substantiate the claim that, since China’s National Sword policy, the amount of plastic recycled in the U.S has gone down and the amount of plastic that is landfilled has increased. This underlines the importance of improving domestic plastic recyclability and recycling rates.
The old model of relying on exports to solve the problem of recycling plastic scrap is no longer available to the U.S. China’s restrictions have highlighted the need to invest in and improve recycling in the U.S. Overall, the plastics recycling industry faces an “economic” problem. Sophisticated machinery and a sufficient supply of materials are available. Still, due to low market prices of plastics (particularly, the mixed #3–#7 plastics), there is little incentive to invest in expanded and improved plastics recycling. Margolis [50] highlights that, even though the technology is available to allow facilities to meet China’s 0.5 percent contamination limit, the additional needed investment in machinery, time, and workforce is not economically feasible at present recyclables prices. Furthermore, Hocevar [11] suggests that, individually, most plastics #3–#7 are not available in the quantities necessary to justify investments in optical sorting and are challenging to sort manually due to a variety of resins used for a wide range of similar applications.
Over the last few decades, the rise in waste production has had substantial implications for policy regulation in the waste management sector [4,51]. For example, recognizing the potential sustainability gains of increased plastic recycling, the European Commission has elevated plastic waste to a priority waste stream in its recent Action Plan for the Circular Economy, promoting plastic recycling in Europe [5]. The authors of [52] study the impacts of implementing Extended Producer Responsibility (EPR) policies for packaging waste in two member states of the European Union (EU)—Portugal and Spain. They find that implementing EPR policies has reduced waste and increased recycling. Others, such as [53], have argued that EPR policies have had a limited impact in promoting green innovation. Furthermore, EU member states with statutory landfill restrictions of recyclable and recoverable waste have high recycling rates of plastic, which indicates that a landfill ban can act as a driver for increasing recycling as an alternative waste management option [54]. The authors of [55] suggest that an effective way to decrease incineration could be to implement a carbon tax specifically for the incineration of plastics. In the U.S., several states, such as Washington, Maine, Maryland, and California, have adopted legislation to ban single use plastic bags with bills around plastic packaging legislation on the way [56]. However, a comprehensive regulatory solution may be needed in the U.S., on the scale of the EU Circular Economy Package, to turn the tide on plastic pollution.
Another important step in improving recyclability is by reducing contamination levels in plastic processing. Higher quality bales and resins have higher demand and fetch higher prices. The emergence of recent business models such as secondary sortation, where residuals from primary MRFs are aggregated at secondary sortation facilities that have the equipment and capacity to handle more significant aggregated volumes, shows what is possible. However, there is also a pressing need for industry organizations and policymakers to encourage demand creation for scrap plastic to improve the economic feasibility of recycling by raising prices for recycled plastic resins and plastic bales. Recycled content commitments by states and companies in recent years are examples of positive steps that are helping to create demand for recycled plastic and improving recycling’s economic feasibility. Many efforts are already underway—the Polypropylene Recycling Coalition and US Plastics Pact are examples of a supply response where industry bodies are committing to using recycled materials. Further, human behavioral science and outreach/education initiatives are being employed to decrease contamination and improve recycling in NYS.
Our study only considers the landfilling of plastic waste within the U.S. It is possible that, even though more plastic was being disposed of domestically in the U.S., plastic waste disposal is better controlled and regulated in the U.S. than in other parts of the world. Further research can study the adverse impact of plastic waste disposal in other countries vis à vis the U.S. to evaluate the social and environmental consequences of the National Sword.
Author Contributions
Conceptualization, A.V. and N.C.S.; methodology, A.V., N.C.S. and K.A.; software, A.V., N.C.S. and K.A.; validation, A.V., N.C.S., K.A. and M.S.; formal analysis, A.V. and N.C.S.; investigation, A.V. and N.C.S.; resources, A.V. and M.S.; data curation, K.A. and M.S.; writing—original draft preparation, A.V. and K.A.; writing—review and editing, A.V., N.C.S., K.A. and M.S.; visualization, K.A.; supervision, A.V. and N.C.S.; project administration, A.V. and N.C.S..; funding acquisition, A.V. All authors have read and agreed to the published version of the manuscript.
Funding
New York State Department of Environmental Conservation: Memorandum of Understanding (MOU) AMI 1642.
Institutional Review Board Statement
Not applicable.
Informed Consent Statement
Not applicable.
Data Availability Statement
Data used for this study is available and can be provided by the corresponding author upon request.
Acknowledgments
The authors would like to thank the editor and the anonymous reviewers for their valuable comments and suggestions. The authors also thank New York’s Environmental Protection Fund, the New York State Department of Environmental Conservation (NYSDEC), and the Institute for Research and Education in Energy, Environment, and Water (RENEW) at the University at Buffalo (UB) for support. The work was supported by a grant from NYSDEC to the University at Buffalo, under Memorandum of Understanding (MOU) AMI 1642. The authors acknowledge useful discussions with Amit Goyal, Project Director of this grant. The authors also acknowledge useful discussions with John Atkinson (UB Civil, Structural and Environmental Engineering), Paschalis Alexandridis (UB Chemical Engineering) as well as Amy Bloomfield, Terry Laibach, Jaime Lang, Kayla Montanye, and David Vitale at NYSDEC.
Conflicts of Interest
The authors declare no conflict of interest.
References
- Thompson, R.C.; Moore, C.J.; Saal, F.S.; Swan, S.H. Plastics, the environment and human health: Current consensus and future trends. Philos. Trans. R. Soc. B Biol. Sci. 2009, 364, 2153–2166. [Google Scholar] [CrossRef] [PubMed]
- Nielsen, T.D.; Hasselbalch, J.; Holmber, K.; Stripple, J. Politics and the plastic crisis: A review throughout the plastic life cycle. WIREs Energy Environ. 2019, 9, e360. [Google Scholar] [CrossRef] [Green Version]
- Geyer, R.; Jambeck, J.R.; Law, K.L. Production, use, and fate of all plastics ever made. Sci. Adv. 2017, 3, e1700782. [Google Scholar] [CrossRef] [PubMed] [Green Version]
- da Cruz, N.F.; Ferreira, S.; Cabral, M.; Simões, P.; Marques, R.C. Packaging waste recycling in Europe: Is the industry paying for it? Waste Manag. 2014, 34, 298–308. [Google Scholar] [CrossRef] [PubMed] [Green Version]
- Friant, M.C.; Vermeulen, W.J.; Salomone, R. Analysing European Union circular economy policies: Words versus actions. Sustain. Prod. Consum. 2021, 27, 337–353. [Google Scholar] [CrossRef]
- Heller, M.C.; Mazor, M.H.; Keoleian, G.A. Plastics in the US: Toward a material flow characterization of production, markets and end of life. Environ. Res. Lett. 2020, 15, 094034. [Google Scholar] [CrossRef]
- U.S. Environmental Protection Agency (EPA). Available online: https://www.epa.gov/facts-and-figures-about-materials-waste-and-recycling/national-overview-facts-and-figures-materials#13-14Trends (accessed on 2 February 2022).
- He, K.; Tan, Q.; Zheng, L.; Li, J. Adapting to new policy environment—Past pattern and future trend in us-sino waste plastic trade flow. Int. J. Sustain. Dev. World Ecol. 2018, 25, 703–712. [Google Scholar] [CrossRef]
- Tran, T.; Goto, H.; Matsuda, T. The impact of China’s tightening environmental regulations on international waste trade and logistics. Sustainability 2021, 13, 987. [Google Scholar] [CrossRef]
- Wen, Z.; Xie, Y.; Chen, M.; Dinga, C.D. China’s plastic import ban increases prospects of environmental impact mitigation of plastic waste trade flow worldwide. Nat. Commun. 2021, 12, 425. [Google Scholar] [CrossRef]
- Hocevar, J. Circular Claims Fall Flat: Comprehensive U.S. Survey of Plastics Recyclability. Greenpeace Report. 2020. Available online: Greenpeace.org/usa/plastic_recycling (accessed on 28 January 2022).
- Waste Connections. Annual Report. Waste Connections. 2019. Available online: https://www.annualreports.com/Company/waste-connections-inc (accessed on 22 January 2022).
- Woodring, D.; Hyde, T.; McLennan, J. There’s Demand for Recyclate, But Little Supply. Plast. Eng. 2021, 77, 39–41. [Google Scholar] [CrossRef]
- Rahimi, A.; García, J. Chemical recycling of waste plastics for new materials production. Nat. Rev. Chem. 2017, 1, 0046. [Google Scholar] [CrossRef]
- U.S. Plastics Pact. 2020. Available online: https://usplasticspact.org/about/ (accessed on 20 January 2022).
- Hundertmark, T.; Prieto, M.; Ryba, A.; Simons, T.J.; Wallach, J. Accelerating Plastic Recovery in the United States. McKinsey & Company. December 2019. Available online: https://www.mckinsey.com/industries/chemicals/our-insights/accelerating-plastic-recovery-in-the-united-states (accessed on 13 December 2021).
- Luczak, E. The Effects of China’s National Sword Policy on the United States Recycling System and What the United States can Do with the Buildup of Recycling in the Recycling Centers. Ph.D. Thesis, Carthage College, Kenosha, WI, USA, 2020. [Google Scholar]
- Ali, A.K.; Layton, A.; Kio, P.; Williams, J. Matrix Trays: From waste to opportunities. J. Clean. Prod. 2021, 300, 126813. [Google Scholar] [CrossRef]
- Kleindorfer, P.R.; Singhal, K.; Van Wassenhove, L.N. Sustainable operations management. Prod. Oper. Manag. 2005, 14, 482–492. [Google Scholar] [CrossRef]
- Integration of Sustainability Principles into Supply Chain Management Processes and Practices; Benchmarking: An International Journal; Emerald Group Publishing Limited: Bingley, UK, 2016; Volume 23.
- Kachitvichyanukul, V.; Sethanan, K.; Golinska-Dawson, P. (Eds.) Toward Sustainable Operations of Supply Chain and Logistics Systems; Springer International Publishing: Cham, Switzerland, 2015. [Google Scholar] [CrossRef]
- Guide, J.V.; Van Wassenhove, L.N. The reverse supply chain. Harv. Bus. Rev. 2002, 80, 25–26. [Google Scholar]
- Kocabasoglu, C.; Prahinski, C.; Klassen, R.D. Linking forward and reverse supply chain investments: The role of business uncertainty. J. Oper. Manag. 2007, 25, 1141–1160. [Google Scholar] [CrossRef]
- Mokhtar, A.R.M.; Genovese, A.; Brint, A.; Kumar, N. Improving reverse supply chain performance: The role of supply chain leadership and governance mechanisms. J. Clean. Prod. 2019, 216, 42–55. [Google Scholar] [CrossRef] [Green Version]
- Hopewell, J.; Dvorak, R.; Kosior, E. Plastics recycling: Challenges and opportunities. Philos. Trans. R. Soc. B Biol. Sci. 2009, 364, 2115–2126. [Google Scholar] [CrossRef] [Green Version]
- Staub, C. Local Programs Feel the ‘Dire’ Effects of China’s Ban. Resource Recycling. 2017. Available online: https://resource-recycling.com/recycling/2017/10/03/local-programs-feel-dire-effects-chinas-ban/ (accessed on 15 December 2021).
- Nzayiramya, S.; Beghin, J.C. The Impact of China’s Environmental and Trade Policies on U.S. Plastic and Paper Waste Exports. Cornhusker Economics. 2021. Available online: https://digitalcommons.unl.edu/agecon_cornhusker/1096 (accessed on 3 February 2022).
- Keller, H. The Impact of National Sword on North America’s Front Lines. Plastic News. 2018. Available online: https://www.plasticsnews.com/article/20180503/BLOG13/180509954/the-impact-of-national-sword-on-north-america-s-front-lines (accessed on 3 February 2022).
- Greenberg, A. The DOUBLE-EDGED SWORD: Facing Our Plastic Crisis in a Changing Global Market. 2019. Available online: https://scholarsbank.uoregon.edu/xmlui/handle/1794/26226 (accessed on 15 December 2021).
- Kleinhans, K.; Demets, R.; Dewulf, J.; Ragaert, K.; Meester, S.D. Non-household end-use plastics: The ‘forgotten’ plastics for the circular economy. Curr. Opin. Chem. Eng. 2021, 32, 100680. [Google Scholar] [CrossRef]
- Staub, C. What’s Driving the 3-7 Plastic Market? Resource Recycling. 2021. Available online: https://resource-recycling.com/recycling/2021/05/18/whats-driving-the-3-7-plastic-market/ (accessed on 18 January 2022).
- Milios, L.; Christensen, L.H.; McKinnon, D.; Christensen, C.; Rasch, M.K.; Eriksen, M.H. Plastic recycling in the Nordics: A value chain market analysis. Waste Manag. 2018, 76, 180–189. [Google Scholar] [CrossRef]
- Merrington, A. 9-Recycling of Plastics. In Applied Plastics Engineering Handbook, 2nd ed.; William Andrew Publishing: Burlington, MA, USA, 2017; pp. 167–189. ISBN 9780323390408. [Google Scholar] [CrossRef]
- Gu, F.; Wang, J.; Guo, J.; Fan, Y. Dynamic linkages between international oil price, plastic stock index and recycle plastic markets in China. Int. Rev. Econ. Financ. 2020, 68, 167–179. [Google Scholar] [CrossRef]
- Miller, R. Oil Prices and the Recycled Industry: A Tricky Balance. 2017. Available online: https://millerrecycling.com/oil-prices-recycling/ (accessed on 1 February 2022).
- Doherty, M.P. The behavior of the Producer Price Index in a global economy. Mon. Lab. Rev. 2012, 134, 14–27. [Google Scholar]
- Huang, Q.; Chen, G.; Wang, Y.; Xu, L.; Chen, W. Identifying the socioeconomic drivers of solid waste recycling in China for the period 2005–2017. Sci. Total Environ. 2020, 725, 138137. [Google Scholar] [CrossRef] [PubMed]
- Weerdt, L.D.; Sasao, T.; Compernolle, T.; Passel, S.V.; Jaeger, S.D. The effect of waste incineration taxation on industrial plastic waste generation: A panel analysis. Resour. Conserv. Recycl. 2020, 157, 104717. [Google Scholar] [CrossRef]
- EPA. Advancing Sustainable Materials Management: Facts and Figures Report. 2021. Available online: https://edg.epa.gov/data/PUBLIC/OLEM/Materials_Municipal_Waste_Stream_1960_2018.xlsx (accessed on 23 January 2022).
- United States International Trade Commission (USITC) DataWeb. Available online: https://dataweb.usitc.gov/ (accessed on 5 February 2022).
- WTI. Current West Texas Intermediate Crude Oil (WTI) Prices. 2022. Available online: https://www.up.com/customers/surcharge/wti/prices/index.htm (accessed on 6 February 2022).
- BLS. U.S. Bureau of Labor Statistics. 2022. Available online: https://www.bls.gov/ (accessed on 11 January 2022).
- Lee, J.; Pati, N.; Roh, J.J. Relationship between corporate sustainability performance and tangible business performance: Evidence from oil and gas industry. Int. J. Bus. Insights Transform. 2011, 3, 72–82. [Google Scholar]
- Neter, J.; Kutner, M.H.; Nachtsheim, C.J.; Wasserman, W. Applied Linear Statistical Models, 4th ed.; WCB McGraw-Hill: New York, NY, USA, 1996. [Google Scholar]
- Dinapoli, T.P. Local Governments and the Municipal Solid Waste Landfill Business. 2018. Available online: https://www.osc.state.ny.us/files/local-government/publications/pdf/landfills-2018.pdf (accessed on 2 February 2022).
- Casella Waste Systems. Annual Report. Casella Recycling. 2018. Available online: https://ir.casella.com/static-files/e70f1953-b416-408c-ac0b-fa7ac671d93d (accessed on 2 February 2022).
- SIMS Limited. Annual Report. SIMS Limited. 2018. Available online: https://smm-corporate.s3.amazonaws.com/Annual+Report+2018.pdf (accessed on 2 February 2022).
- Republic Services. Annual Report. Republic Services. 2019. Available online: https://investor.republicservices.com/financial-information/annual-reports (accessed on 2 February 2022).
- Waste Management. Annual Report. Waste Management. 2018. Available online: https://investors.wm.com/ (accessed on 2 February 2022).
- Margolis, J. New Chinese Policy Is Forcing People to Think: Is There a Better Way to Recycle? The World. 14 December 2018. Available online: https://www.pri.org/stories/2018-12-14/new-chinese-policy-forcing-people-think-there-better-way-recycle (accessed on 24 January 2022).
- Simões, P.; Marques, R.C. Influence of regulation on the productivity of waste utilities. What can we learn with the Portuguese experience? Waste Manag. 2012, 32, 1266–1275. [Google Scholar] [CrossRef]
- Rubio, S.; Ramos, T.R.P.; Leitão, M.M.R.; Barbosa-Povoa, A.P. Effectiveness of extended producer responsibility policies implementation: The case of Portuguese and Spanish packaging waste systems. J. Clean. Prod. 2019, 210, 217–230. [Google Scholar] [CrossRef]
- Massarutto, A. The long and winding road to resource efficiency—An interdisciplinary perspective on extended producer responsibility. Resour. Conserv. Recycl. 2014, 85, 11–21. [Google Scholar] [CrossRef]
- Plastics Europe. Plastics—The Facts 2016. In An Analysis of European Plastics Production, Demand and Waste Data; Plastics Europe—Association of Plastics Manufacturers: Brussels, Belgium, 2017. [Google Scholar]
- Milios, L.; Esmailzadeh Davani, A.; Yu, Y. Sustainability impact assessment of increased plastic recycling and future pathways of plastic waste management in Sweden. Recycling 2018, 3, 33. [Google Scholar] [CrossRef] [Green Version]
- LaMotte, K.R.; Kettenmann, S.A.; Munger, S.N.; Waxman, N.J. States and Federal Government Continue to Advance Plastics Recycling and Minimum Recycled Content Mandates. National Review, Volume 11.1. 2021. Available online: https://www.natlawreview.com/article/states-and-federal-government-continue-to-advance-plastics-recycling-and-minimum (accessed on 15 February 2022).
Figure 1.
Reverse supply chain for plastics: a simplified representation.

Figure 2.
Tons of plastic recovered by NYS MRFs by plastic type and year.

Figure 3.
Comparison of tons of plastics recovered by NYS MRFs by plastic type in 2018 and 2019.


Table 1.
Correlations.
| Log (Landfill) | Oil Price | PPI | Sword Restriction | Log (Plastic Scrap Exports) | |
|---|---|---|---|---|---|
| Log (Landfill) | 1.000 | ||||
| Oil Price | −0.293 ** | 1.000 | |||
| PPI | −0.219 ** | 0.825 ** | 1.000 | ||
| Sword Restriction | 0.563 ** | −0.439 ** | −0.232 ** | 1.000 | |
| Log (Plastic Scrap Exports) | −0.491 ** | 0.632 * | 0.489 * | −0.544 * | 1.000 |
** Significant at p < 0.01 (2-tailed); * Significant at p < 0.05 (2-tailed).
Table 2.
Hierarchical regression analysis—DV = Log (plastic landfilled).
| Model | Unstandardized Coefficient (B) | Std. Error | Standardized Coefficient (β) | T | Sig. | VIF | |
|---|---|---|---|---|---|---|---|
| 1 | (constant) | 7.643 *** | 0.011 | 714.107 | 0.000 | ||
| Restriction | 0.082 *** | 0.011 | 0.563 | 7.761 | 0.000 | 1.000 | |
| 2 | (constant) | 8.727 *** | 0.346 | 25.253 | 0.000 | ||
| Restriction | 0.062 *** | 0.012 | 0.420 | 5.020 | 0.000 | 1.421 | |
| Log (plastic scrap export) | −0.057 *** | 0.018 | −0.262 | −3.139 | 0.002 | 1.421 | |
| 3 | (constant) | 8.914 *** | 0.388 | 22.999 | 0.000 | ||
| Restriction | 0.063 *** | 0.012 | 0.433 | 5.124 | 0.000 | 1.452 | |
| Log (plastic scrap export) | −0.069 *** | 0.021 | −0.317 | −3.234 | 0.002 | 1.951 | |
| Oil price | 0.000 | 0.000 | 0.097 | 1.063 | 0.290 | 1.701 | |
| 4 | (constant) | 8.936 *** | 0.388 | 23.056 | 0.000 | ||
| Restriction | 0.067 *** | 0.013 | 0.458 | 5.254 | 0.000 | 1.547 | |
| Log (plastic scrap export) | −0.069 *** | 0.021 | −0.314 | −3.204 | 0.002 | 1.953 | |
| Oil price | 0.001 | 0.001 | 0.227 | 1.560 | 0.121 | 4.319 | |
| PPI | 0.000 | 0.000 | −0.147 | −1.146 | 0.254 | 3.345 | |
*** p < 0.01.
Table 3.
Post hoc analysis: amount of plastic landfilled vs. restriction phase.
| Contrast | Std. Error | Tukey Test | |||
|---|---|---|---|---|---|
| Restriction | [95% Conf. Interval] | ||||
| 1 vs. 0 | 0.0011 | 0.0143 | 0.997 | −0.2551 | −0.1626 |
| 2 vs. 0 | 0.2099 *** | 0.0190 | 0.000 | 0.1649 | 0.2549 |
| 2 vs. 1 | 0.2088 *** | 0.0195 | 0.000 | 0.1626 | 0.2551 |
Restriction: 0 = Time before Green Fence (before February 2013). 1 = Time after Green Fence but before National Sword (February 2013–March 2017). 2 = Time after National Sword was implemented (after March 2017). *** p < 0.01.
Table 4.
Incoming material and plastics recovered at MRFs in NYS.
| Year | Incoming Material (tons) | Plastics Recovered (tons) |
|---|---|---|
| 2016 | 633,995 | 99,904 |
| 2017 | 760,347 | 93,557 |
| 2018 | 757,005 | 93,662 |
| 2019 | 812,569 | 91,005 |
Publisher’s Note: MDPI stays neutral with regard to jurisdictional claims in published maps and institutional affiliations. |
© 2022 by the authors. Licensee MDPI, Basel, Switzerland. This article is an open access article distributed under the terms and conditions of the Creative Commons Attribution (CC BY) license (https://creativecommons.org/licenses/by/4.0/).
Share and Cite
MDPI and ACS Style
Vedantam, A.; Suresh, N.C.; Ajmal, K.; Shelly, M. Impact of China’s National Sword Policy on the U.S. Landfill and Plastics Recycling Industry. Sustainability 2022, 14, 2456. https://0-doi-org.brum.beds.ac.uk/10.3390/su14042456
AMA Style
Vedantam A, Suresh NC, Ajmal K, Shelly M. Impact of China’s National Sword Policy on the U.S. Landfill and Plastics Recycling Industry. Sustainability. 2022; 14(4):2456. https://0-doi-org.brum.beds.ac.uk/10.3390/su14042456
Chicago/Turabian StyleVedantam, Aditya, Nallan C. Suresh, Khadija Ajmal, and Michael Shelly. 2022. "Impact of China’s National Sword Policy on the U.S. Landfill and Plastics Recycling Industry" Sustainability 14, no. 4: 2456. https://0-doi-org.brum.beds.ac.uk/10.3390/su14042456
Note that from the first issue of 2016, this journal uses article numbers instead of page numbers. See further details here.