Article

Spatiotemporal Evolution and Prediction of AOT in Coal Resource Cities: A Case Study of Shanxi Province, China

1
School of Management, Tianjin University of Technology, Tianjin 300384, China
2
College of Management and Economy, Tianjin University, Tianjin 300072, China
*
Author to whom correspondence should be addressed.
Sustainability 2022, 14(5), 2498; https://0-doi-org.brum.beds.ac.uk/10.3390/su14052498
Submission received: 19 November 2021 / Revised: 26 December 2021 / Accepted: 27 December 2021 / Published: 22 February 2022
(This article belongs to the Topic Climate Change and Environmental Sustainability)

Abstract

:
As aerosols in the air have a great influence on the health of residents of coal resource-based cities, these municipalities are confronting the dilemma of air pollution that is caused by the increase of suspended particles in the atmosphere and their development process. Aerosol optical thickness could be used to explore the aerosol temporal and spatial variations and to develop accurate prediction models, which is of great significance to the control of air pollution in coal resource-based cities. This paper explored the temporal spatial variation characteristics of aerosols in coal resource-based regions. A total of 11 typical coal-resource prefecture-level cities in the Shanxi Province were studied and inverted the aerosol optical thickness (AOT) among these cities based on MODIS (Moderate Resolution Imaging Spectroradiometer) data and analyzed the significant factors affecting AOT. Through inputting significant correlation factors as the input variables of NARX (nonlinear auto regressive models with exogenous inputs) neural network, the monthly average AOTs in the Shanxi Province were predicted between 2011 and 2019. The results showed that, in terms of time series, AOT increased from January to July and decreased from July to December, the maximum AOT was 0.66 in summer and the minimum was 0.2 in autumn, and it was related to the local monsoon, temperature, and humidity. While as far as the space alignment is concerned, the figure for AOT in Shanxi Province varied significantly. High AOT was mainly concentrated in the centre and south and low AOT was focused on the northwestern part. Among the positively correlated factors, the correlation coefficient of population density and temperature exceeded 0.8, which was highly positive, and among the negatively correlated factors, the correlation coefficient of NDVI exceeded -0.8, which was highly negative. After improving the model by adding the important factors that were mentioned before, the error between the predicted mean value and the actual mean value was no more than 0.06. Considering this charge, the NARX neural network with multiple inputs can contribute to better prediction results.

1. Introduction

Aerosol is a colloidal dispersion of solid and liquid particles that are suspended in the atmosphere and has dimensions covering about four orders of magnitude, from 1 nm to about hundreds of nm. Urban particulate matter pollution increases the concentration of aerosols and is one of the biggest environmental problems affecting human survival. Therefore, its impact is particularly prominent in areas that are dominated by the development of coal resources [1]. The principle of the effect of aerosols on air pollution is mainly reflected in: (1) as an absorber and scatterer of solar radiation, it affects the balance of atmospheric radiation [2]; (2) as the condensation nucleus of cloud, it participates in the cloud formation process, thereby affecting the water cycle [3]; and (3) aerosols are the source of the greenhouse effect through reacting with various physical and chemical components in the atmosphere, which has an important impact on climate change [4]. At the same time, the intensity of human activities in urban areas leads to a complex structure of aerosols and differences in aerosol concentrations, which means the higher the population density, the more serious the air pollution that is caused by aerosols. This phenomenon, therefore, is widespread in large cities in China [5]. The Shanxi Province is the main area of coal mining and belongs to the continental monsoon climate zone. The diffusion and drift of atmospheric pollutants in the downward wind direction will inevitably affect the atmospheric environment of its surrounding areas [6,7]. This issue has attracted great attention from the government. To improve air quality, China’s 14th Five-Year Plan proposed to enhance the coordinated management of multiple pollutants and regional coordinated management and strengthened coordinated management of fine particulate matter and ozone.
At present, there are mainly two methods for obtaining aerosol optical thickness: ground monitoring and satellite remote sensing monitoring [8,9]. In the study of verification and comparison between MISR (multi-angle imaging spectroradiometer) and MODIS (moderate-resolution imaging spectroradiometer), compared to satellite monitoring, ground monitoring showed high accuracy and small error [10,11]. However, satellite remote sensing monitoring is not limited by temporal and spatial changes, especially in supervising the temporal and spatial changes of AOT(aerosol optical thickness) [12,13], which has the trait of high accuracy and wide monitoring range. The Terra and Aqua satellites are equipped with MODIS instruments [14,15,16] which have been widely used in studying the impact of AOT on the environment and climate. For example, some scholars used MODIS data to analyze the spatial distribution of particulate matter in Northeast China, Beijing-Tianjin-Hebei, the South China Sea, and other regions, where good results have been achieved [17,18,19]. With the expansion of the research scope, combined with dark targets and deep blue MODIS products, the AOT distribution law over mainland China has been analyzed and obvious seasonal changes in AOT have been observed [20]. Compared with the previous MODIS data products, NASA’s newly released MOD04_3k is better than MOD04_10k in describing aerosol gradient distribution, cloud detection, and identifying small water bodies, and its adaptability has also been verified [21]. In terms of influencing factors, AOT is affected by many factors such as geographic location, topography, meteorological conditions, and human activities. The human activity factors of AOT mainly include the urbanization rate [22], population density [23], energy consumption [24], and physical geographic factors mainly include air pressure, temperature, relative humidity, wind speed, precipitation, sunshine hours, and SO2, NO2, CO, O3 concentration, etc. [25]. In addition, the combination of aerosol type qualitative analysis and air mass trajectory analysis can infer the type of AOT in the study area, which also verified that AOT is also affected by the long-distance migration of aerosols and offshore sea salt aerosols [26].
In recent years, the use of deep learning technology predicting air quality has become a common research method where the recursive model of neural network (RNN) and its variants are widely employed. To improve the prediction accuracy, some scholars built a polynomial nonlinear auto regressive models with exogenous inputs (NARX) model on the basis of RNN to predict the air pollution level under peak conditions [27]. NARX was applied to predict waste gas emissions from sewage treatment plants through improving the accuracy of prediction by network output feedback [28]. To improve the accuracy of prediction, multi-layer perceptual neural network (MLP) that was combined with genetic algorithm predicted the gas emissions of internal combustion engines. Moreover, NARX neural network was used to estimate the impact of urban air pollution on mortality and morbidity, and it has achieved good results [29,30].
Based on the above, this study uses the Shanxi Province as the research area and uses the MODIS inversion algorithm and a GIS statistical analysis method to study the temporal and spatial changes of aerosol optical thickness in the Shanxi Province and adopts Pearson correlation coefficient to screen the significant influencing factors of AOT. From a constructed open-loop structure AOT prediction model, the trend of AOT in Shanxi Province from 2011 to 2019 was examined. We analyzed and studied the air pollution characteristics of key regions in China and provided reference for the research of related departments.

2. Materials and Methods

2.1. Research Area and Data Source

Shanxi Province is located in the middle and west of North China and in the eastern part of the Loess Plateau containing 11 prefecture-level cities. The terrain conditions are complex and diverse. There are Luliang Mountain and Taihang Mountain on the east and west sides, and 5 fault basins in the middle with large elevation differences, as shown in Figure 1. The value of the coal industry accounted for about 50% of the five major industries in 2015 and 2020, which indicated that the coal industry is still the major industry in the Shanxi Province [31]. Since 2020, the coal industry has produced carbon monoxide, carbon dioxide, sulfur dioxide, and smoke and dust pollutants, and its emissions are 1.56 billion tons, which increased by 20% from 2015 to 2020. There are many sources of pollutants and large emissions that determine serious air pollution [32].

2.1.1. MODIS Data

The traditional ground monitoring networks mean that one can get the local AOT data with high accuracy, but due to the limitation of its coverage, it does not reflect the AOT situation of the whole region; the remote sensing satellite monitoring appropriately makes up for this defect [33,34]. Thus, this paper selects the MODIS remote sensing data product MOD04_3K that is officially issued by NASA, with a spatial resolution of 3 km, a time resolution of 1d, high accuracy, and a wide range of inversion. The aerosol optical properties that are retrieved through various algorithms such as deep blue and dark targets, compensates for invalid values in some data due to weather conditions such as cloud cover for the current C6 version of the latest products, to make up the defects of deep blue and dark target algorithm. Affected by weather conditions such as cloud coverage, there are many invalid values in some daily data. Therefore, on the basis of excluding invalid values, the effective time in 2011, 2013, 2015, 2017, and 2019 was calculated, and the effective values were added and summed to accurately reflect the temporal and spatial changes of AOT in Shanxi Province.

2.1.2. Meteorological Data

To explore the influencing factors that were related to AOT [35], the conventional meteorological data from Shanxi Province from January 2011 to December 2019 were obtained from the Earth Data Center (https://giovanni.gsfc.nasa.gov/, accessed on 4 October 2020) and “Shanxi Statistical Yearbook” (https://data.cnki.net/Area/Home/Index/D04, accessed on 3 October 2020) and used to analyze the relationship with air pollution. In terms of natural factors, observational data included monthly precipitation (PRE), monthly surface wind speed (WS), monthly average temperature (TEM), and monthly average vegetation index (NDVI); in terms of human factors, observational data included the annual average gross domestic product (GDP) and the annual average population density (PD).

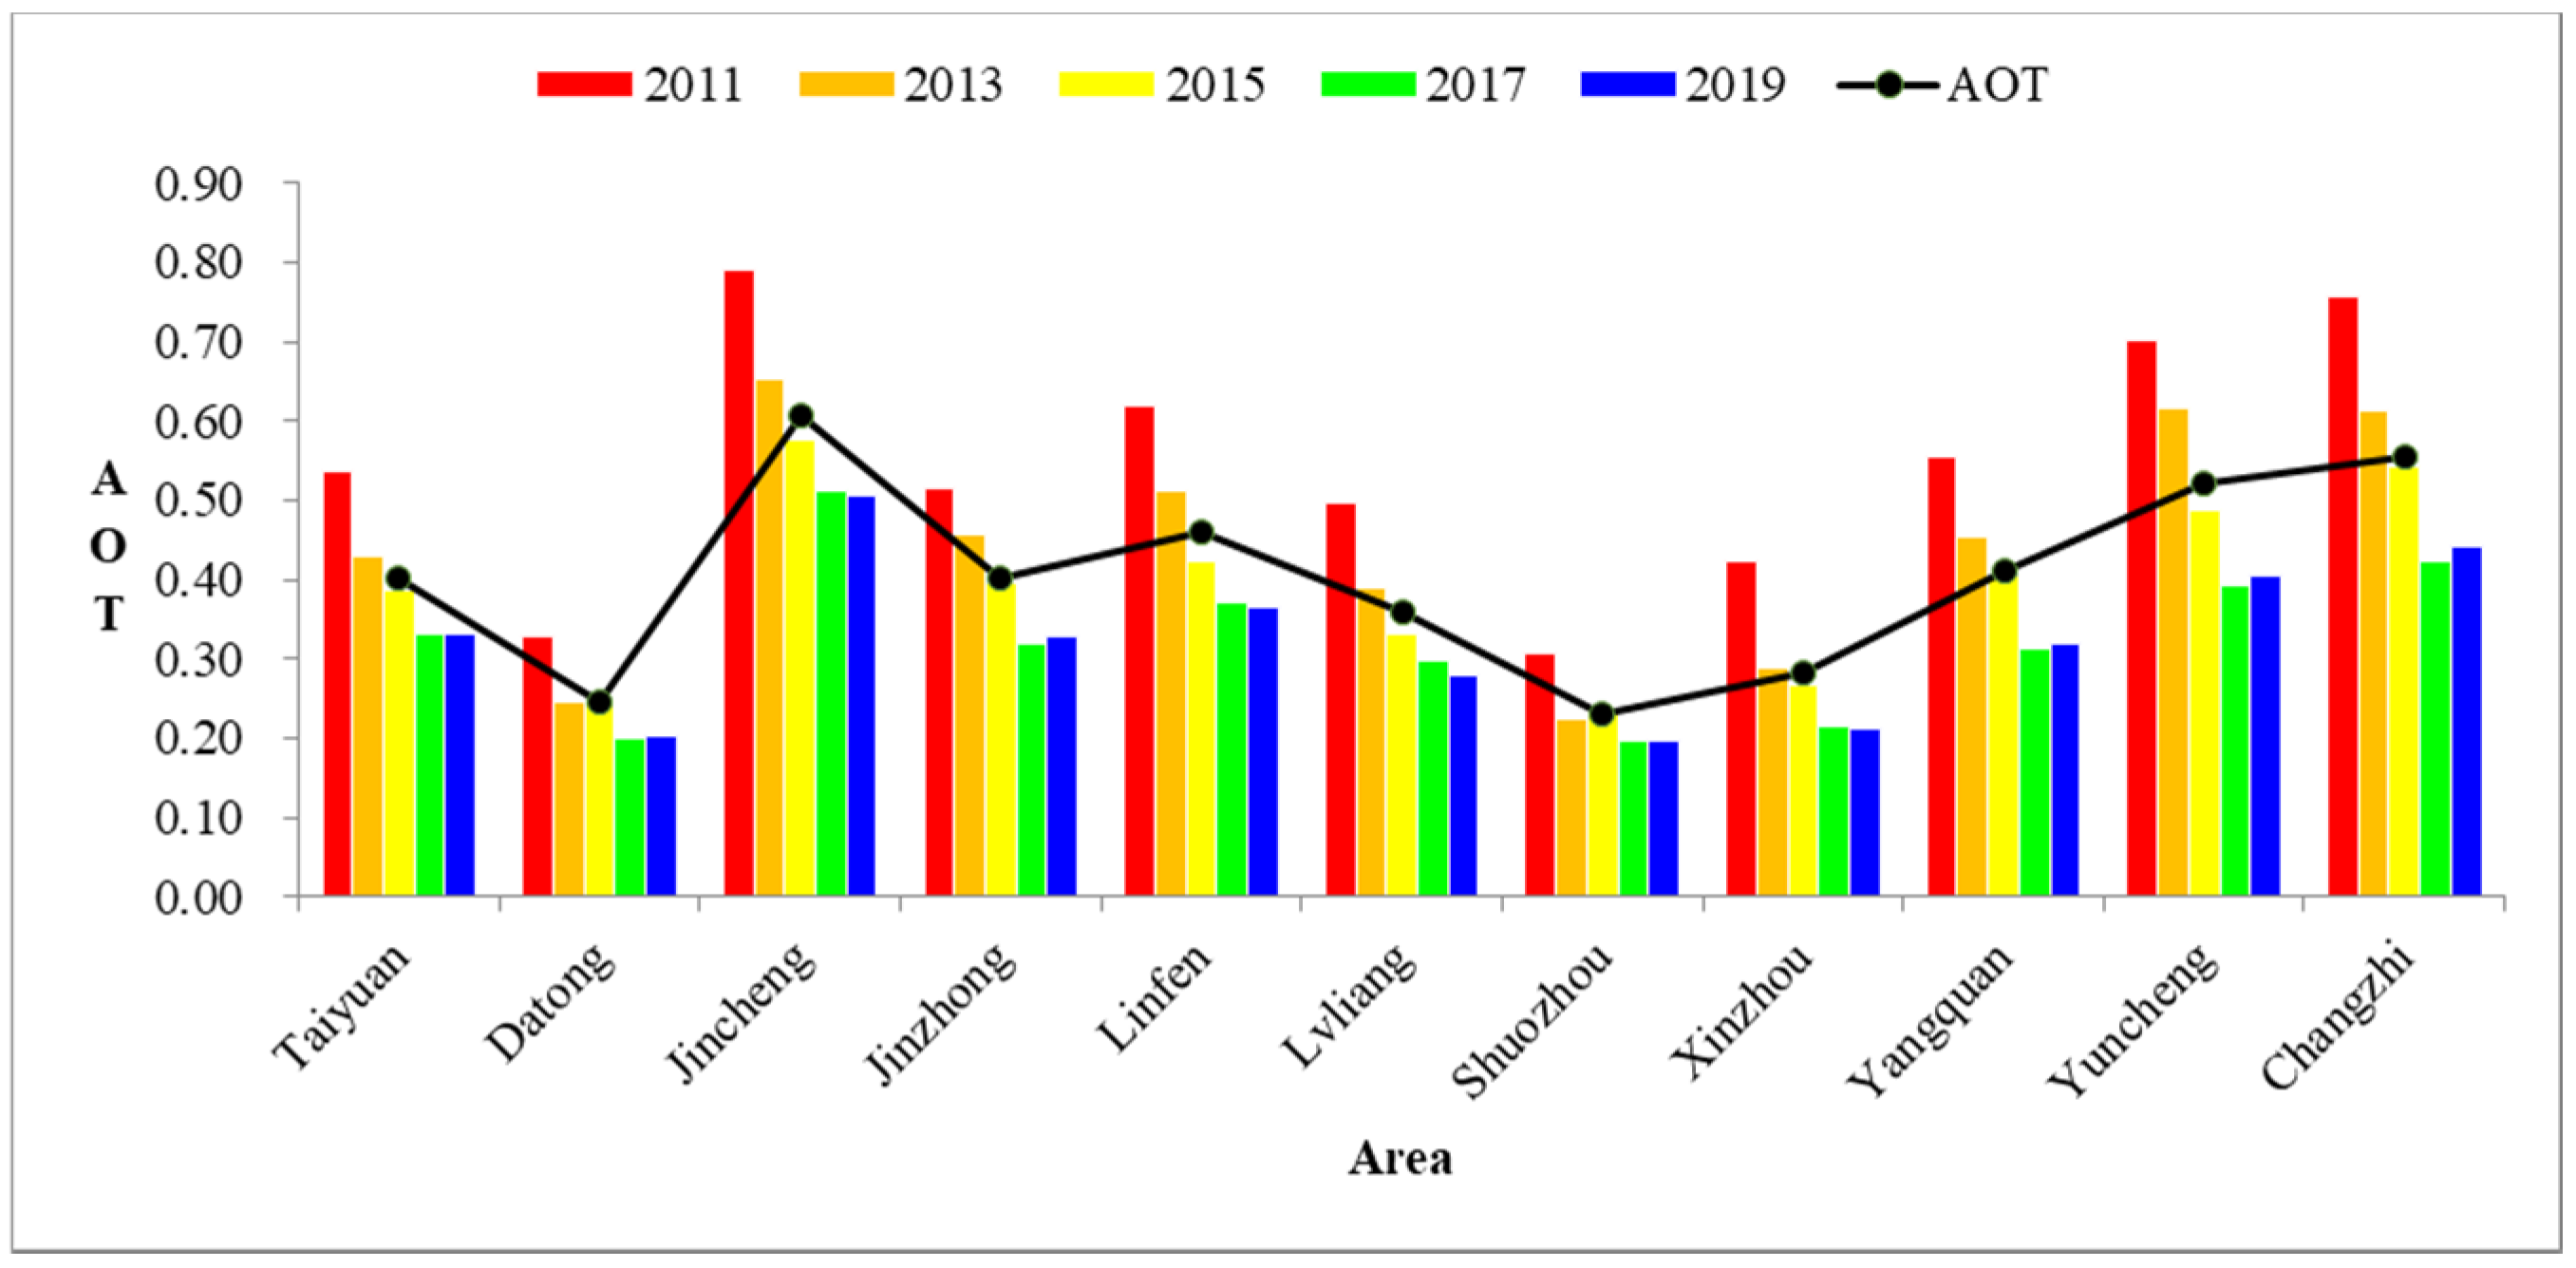
2.2. Current Situation Analysis

Taking 11 cities in Shanxi Province as the research unit, the AOT statistics are based on different regions, different years, different seasons, and different values. For the convenience of time to study the characteristics of different seasons, the specific results are as follows.
Figure 2 showed the regional statistics of AOT in different years in Shanxi Province. The black line represents the mean AOT for the odd years in the period 2011–2019. It can be seen from Figure 2 that the AOT in 2011 and 2013 were higher than the average AOT in each region, while the AOT in 2015, 2017, and 2019 were lower than the average AOT in each region. The maximum AOT appeared in 2011 and the minimum AOT in 2017 and 2019, and the difference was small. It can be known that there were significant differences between the regions where the areas which had higher AOT had more significant inter-annual changes. Among them, the three prefecture-level cities with the highest AOT were Jincheng, Changzhi, and Yuncheng, with 0.61, 0.56, and 0.52, respectively. The three prefecture-level cities with the lowest AOT were Shuozhou, Datong, and Xinzhou, with 0.23, 0.24, and 0.28, respectively.
Figure 3 shows the regional statistics of the change in the mean AOT by month in the Shanxi Province for the odd years 2011–2019. On the whole, the annual change trend of AOT in different regions of the Shanxi Province showed that the fluctuation range is relatively large from January to July, and the fluctuation is small from July to December. The AOT was the highest from July to August and the lowest from November to December. The three peaks, in February, April, and July, showed obvious trends. From the perspective of the seasonal dimension, AOT presents the highest in summer, followed by spring, and the lowest in autumn and winter. At the same time, there were significant differences in AOT of different cities within the year. Jincheng and Changzhi had higher AOT, while the average AOT of Datong, Xinzhou, and Shuozhou were relatively low. It is worth noting that, the maximum AOT of each city appeared in summer, mainly due to the temperate monsoon climate in the Shanxi Province, with high summer temperatures and high humidity, and increased emissions of pollutants, resulting in high aerosol concentration [36,37]. At the same time, summer was the harvest season for corn and wheat in the Shanxi Province, and a large amount of straw burning was also an important reason for the high AOT. The northwest wind which prevails in the spring, which leads to the formation of sand and dust, promoted the increase of AOT [38,39]. The AOT in winter was higher than that in autumn, mainly because the area is colder in winter and coal-fired heating methods produce a lot of gas emissions which increases the aerosol concentration [40].

2.3. Processing and Analysis Methods

The experimental design of AOT consists of three parts: image processing, time-series prediction model, and test of prediction results. Firstly, the spatial and temporal variation characteristics of aerosols in the Shanxi Province were analyzed on this basis. Secondly, GIS statistical analysis and Pearson correlation coefficient analysis were used to derive AOT significant correlation factors, and then the AOT time-series prediction model that was adapted to this study was constructed. Finally, the results were analyzed according to the obtained results using error test to verify the validity of the model.

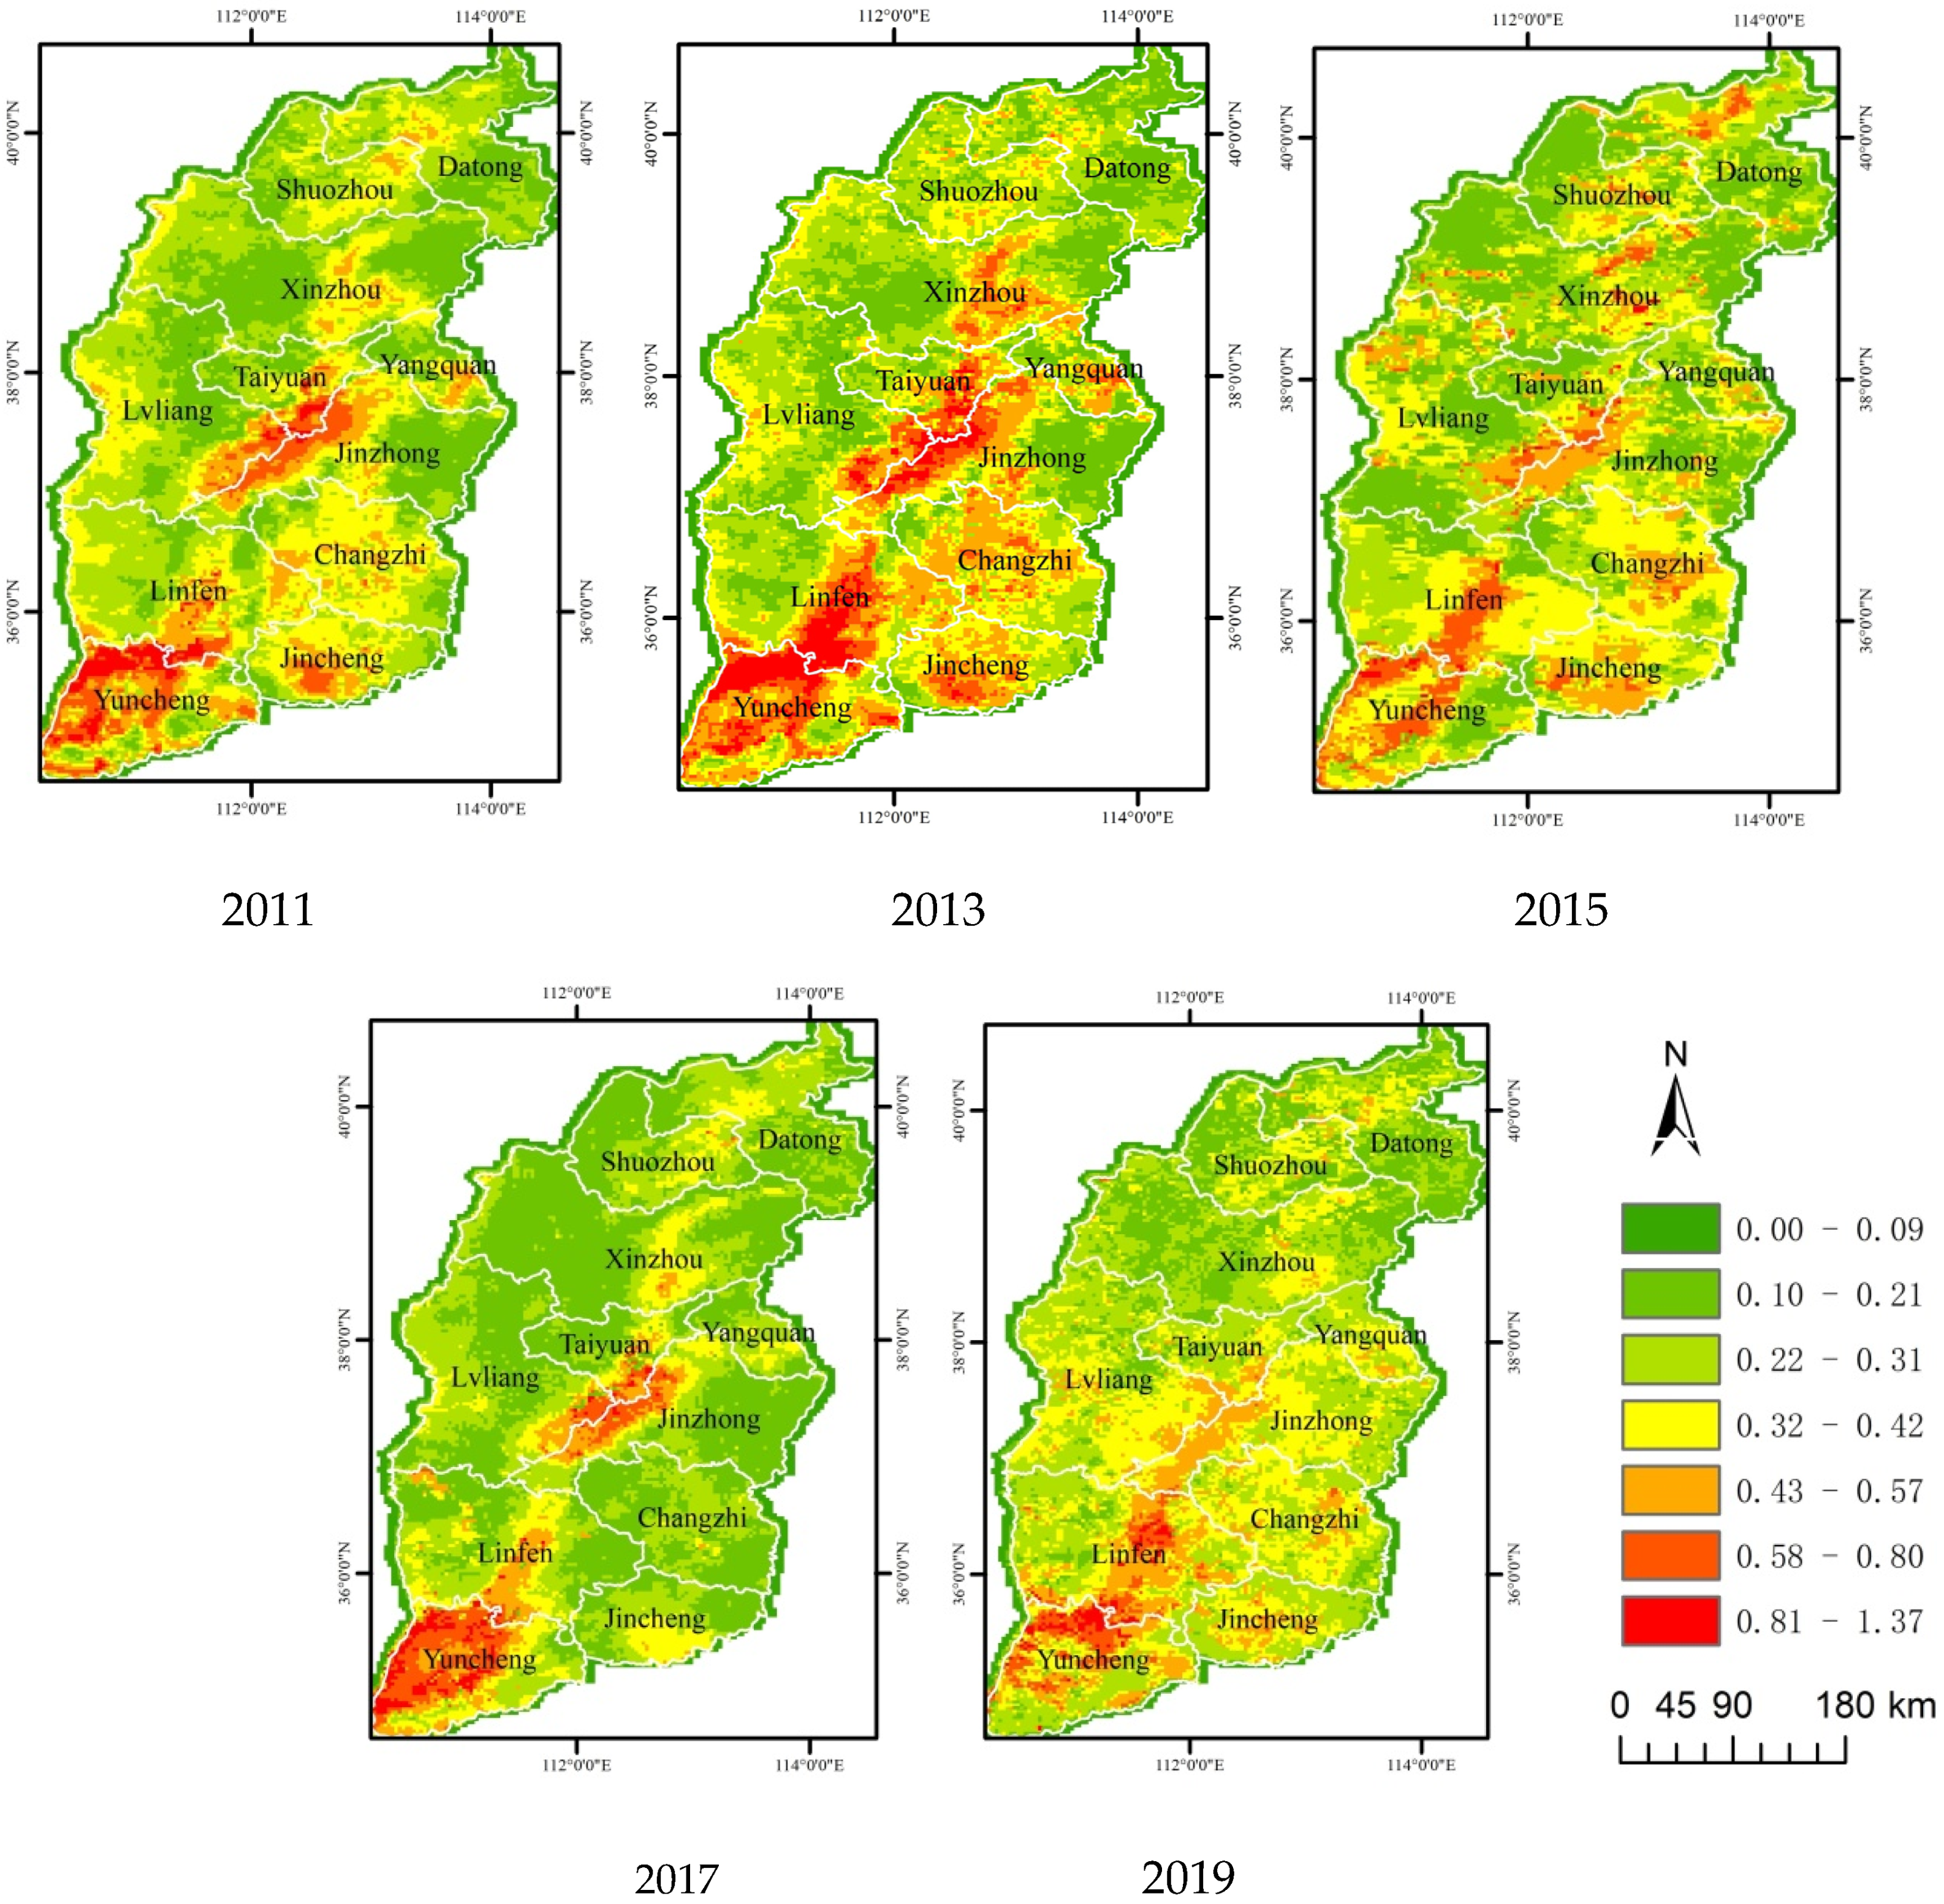
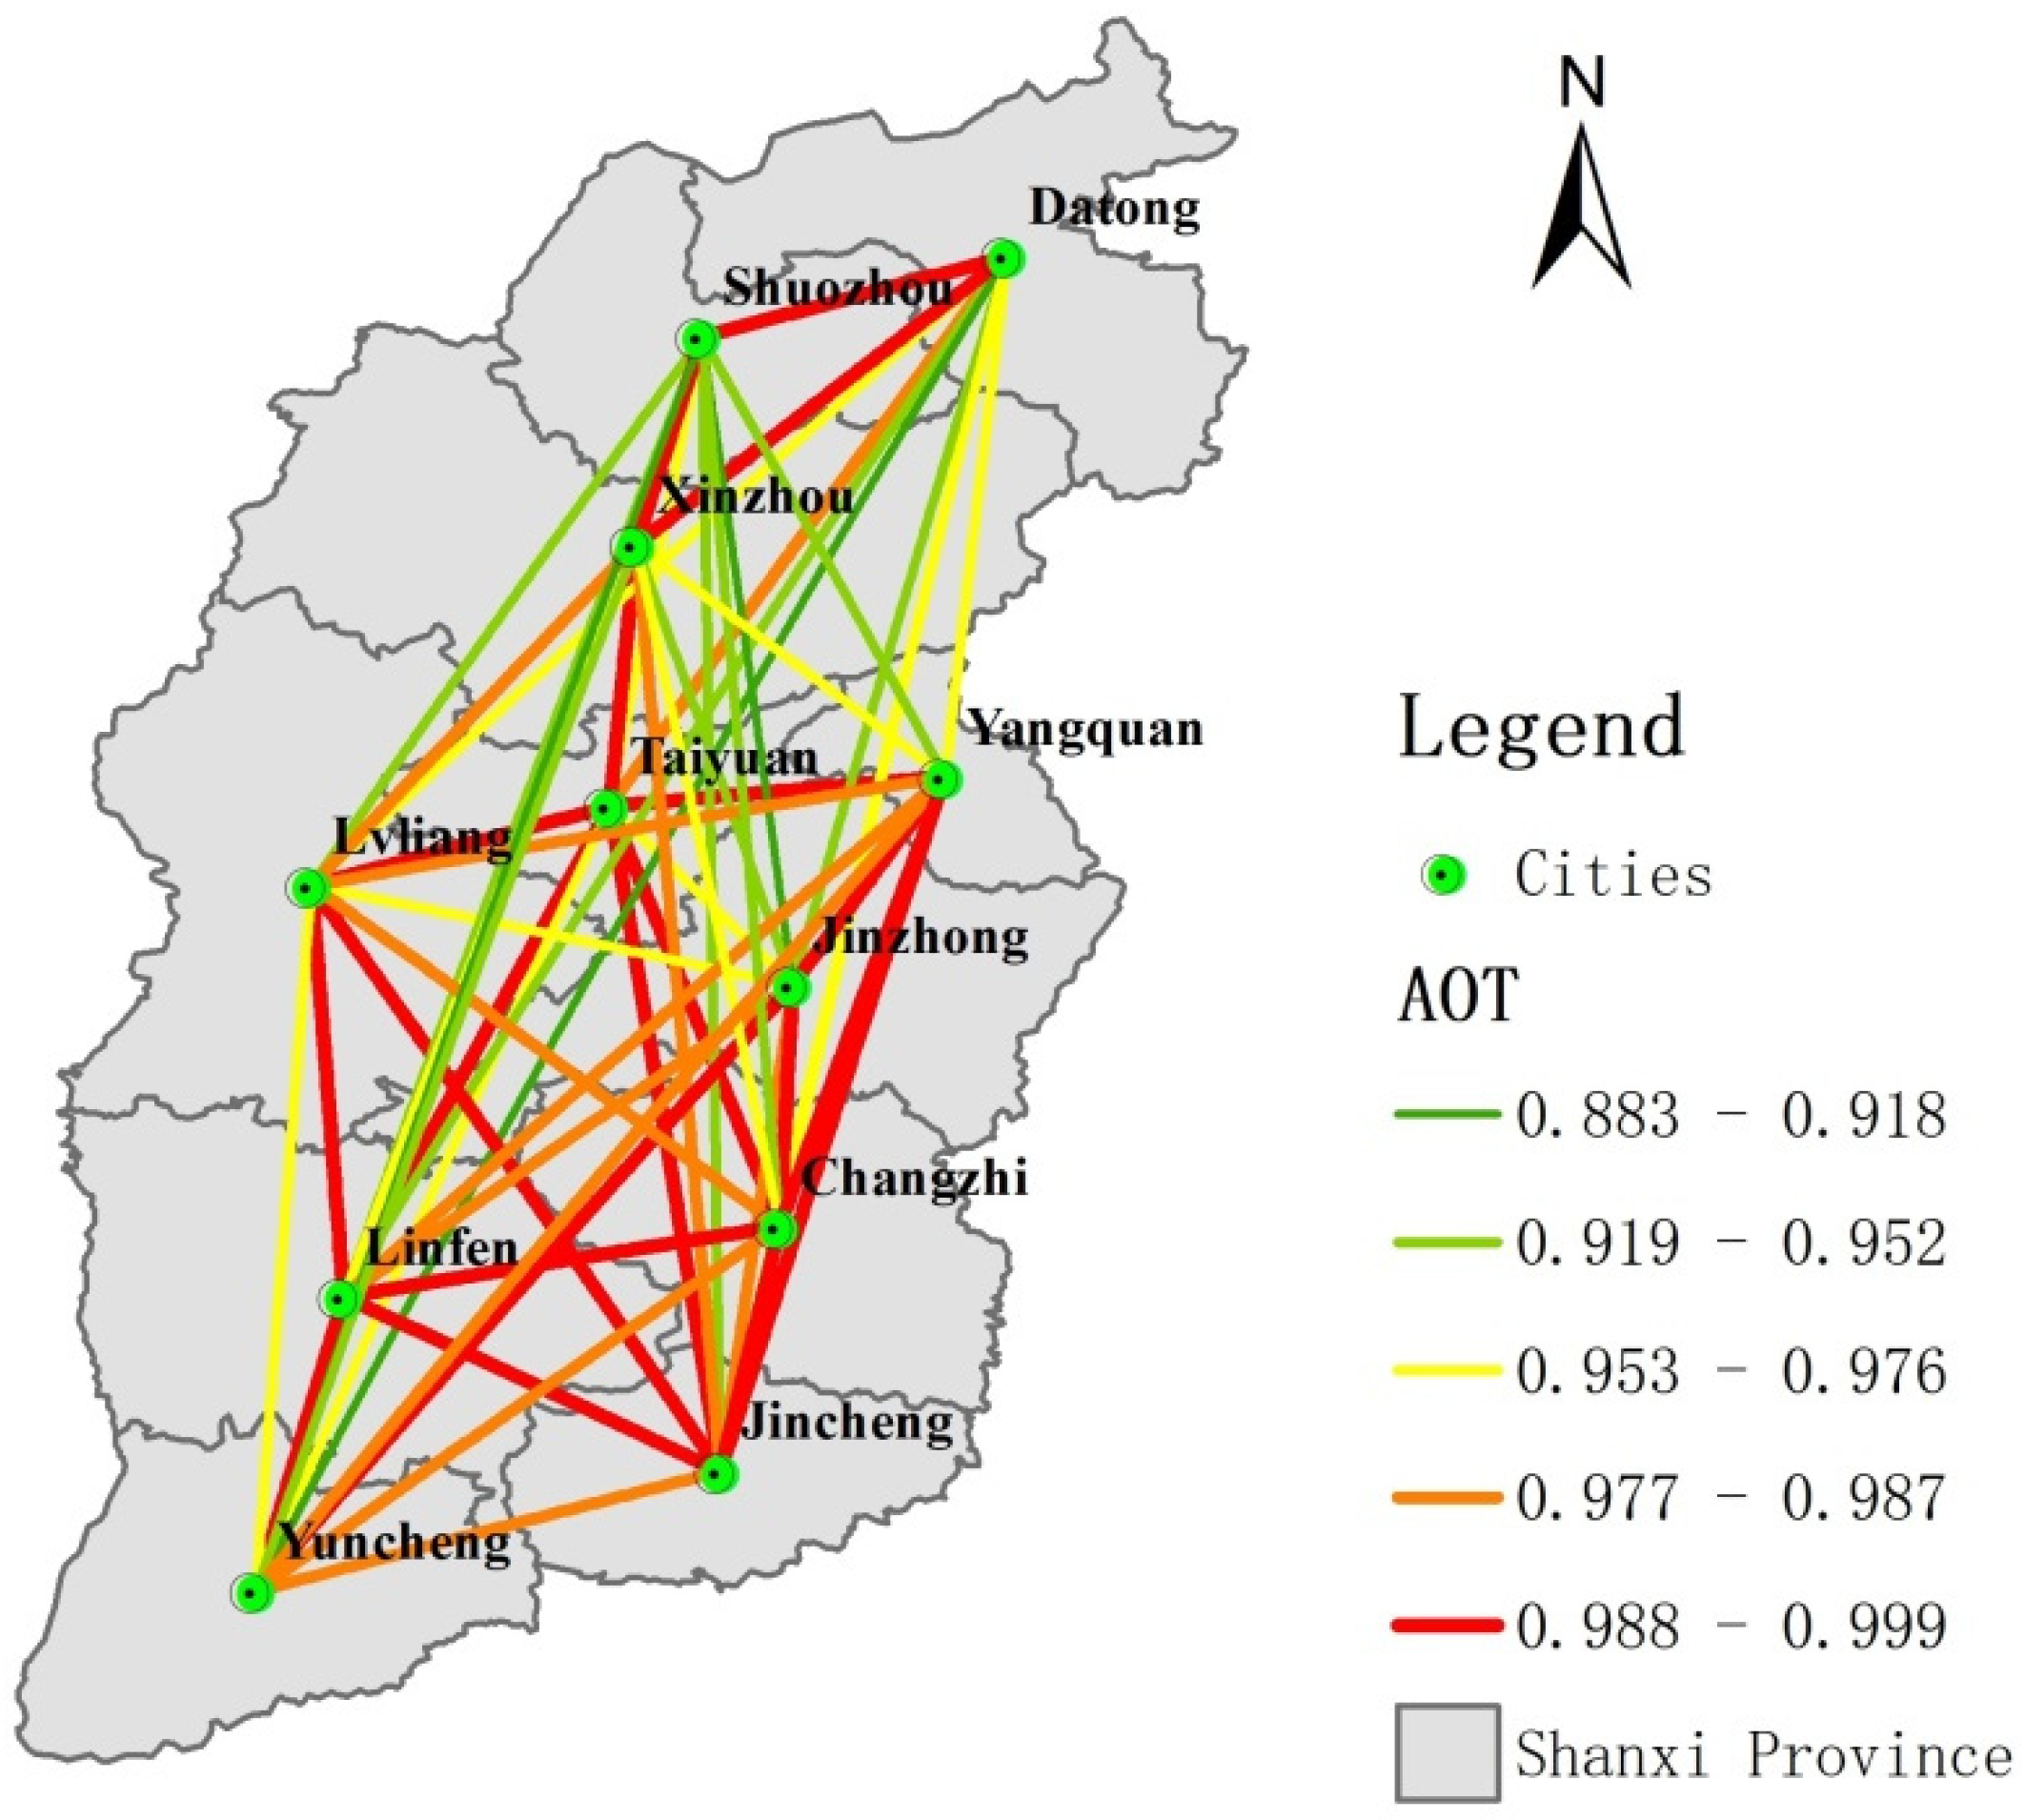
2.3.1. Spatial Distribution Characteristics

Based on the daily AOT of Shanxi Province in 2011, 2013, 2015, 2017, and 2019 as the basic data, a GIS statistical analysis method was used to calculate the average value of each pixel to obtain the spatial distribution of AOT. Figure 4 shows the spatial distribution of AOT in the Shanxi Province. As can be seen from Figure 4, the spatial pattern of AOT in the Shanxi Province is relatively stable, showing higher AOT values that were obtained in the southern areas, while in the northern areas, the AOT are lower, high in the middle, and low on both sides, and its AOT is relatively low on the whole. According to statistics, the average AOT of the Shanxi Province is 0.22, slightly higher than the global average of 0.19. However, the AOT of some regions is relatively high. AOT that was greater than or equal to 0.58 for high value area, 0.32~0.57 for higher value area, less than 0.32 is the low AOT in Shanxi Province, and the high AOT area are mainly distributed in Yuncheng and Linfen regions where the AOT is about 0.6; these two areas of the Shanxi Province are industrial developed areas, the terrain is flat and closed, air dispersion is difficult, and they are densely populated, making the AOT at higher levels. The second highest AOT was mainly distributed in the border areas of Jincheng, Changzhi, Taiyuan, Lvliang, and Jinzhong, with the AOT about 0.45. These areas have relatively flat terrain, large populations, and frequent production activities that resulted in a relatively high AOT [41]. The rest areas are low AOT areas in Shanxi Province, which is related to relatively high terrain, low population density, and relatively few industrial production activities [42].

2.3.2. NARX Neural Network Model

The NARX neural network, as a time series prediction network, has fast and accurate training response and is suitable for dynamic system use [43]. NARX has a flexible architecture that combines simplicity (e.g., feedforward neural networks) and time series prediction (e.g., recurrent dynamic neural networks.) NARX is ideal for modeling complex nonlinear systems due to its long-term dependencies and computational power [44,45]. NARX neural network structure is shown in Figure 5.
Where x ( t ) denotes the external input of the neural network;   y ( t ) is the output of the neural network; 1:2 denotes the delay order;   w is the coupling weight; and b is the threshold value. The formula is shown in formula (1). The subsequent y ( t ) values depend on the previous y ( t ) and x ( t ) .
y ( t ) = f ( y ( t 1 ) , y ( t 2 ) , , y ( t n y ) , u ( t 1 ) , u ( t 2 ) , , u ( t n u ) )
The fitted prediction of AOT is the process of continuously approximating the time series. We used the toolbox of MATLAB programming software to construct the NARX neural networks for time series prediction. Its parameters consisted of a hidden layer of 6, a delay factor of 2, 70% of the training sample data, 15% of the validation sample data, and 15% of the test sample data, train using Levenberg-Marquardt. The processed data as well as the influencing factors were the input to the NARX neural network as input variables for experimental prediction of AOT data, and the flow of the prediction model is shown in Figure 6. The proposed model can be mainly divided into six steps:
Step 1. Sample classification: By using ENVI’s MCTK toolbox, the MODIS products for the 2011, 2013, 2015, 2017, and 2019 study areas were collected and collated, and the images were batch geometrically corrected. The processed images were stitched and masked to extract the study area and generate an annual average AOT data layer. The AOT data of each prefecture-level city in the Shanxi Province were divided into test samples, training samples, processed by MATLAB Neural Network Toolbox, the samples are normalized, and input to the initial network.
Step 2. Configuring the NARX Network: Configured the input layer, output layer, delay order of input and output, and hidden layer neurons of the NARX network. The architecture of the NARX network is a series parallel type where the weights and biases are adjusted by applying training procedures to build a nonlinear load model.
Step 3. Training the NARX network: Using NDVI, wind speed, temperature, and pressure inputs to the NARX network, the AOT are targeted. The Levenberg Marquardt back propagation training algorithm was applied to train the designed NARX network.
Step 4. NARX Network Inspection: Compare the NARX output with the target AOT. If the difference between the actual and predicted root mean square values were less than a predetermined acceptable value, the process moves to step 5. In case the difference value exceeds the set value, the parameters of the training network need to be adjusted until the root mean square difference value is acceptable.
Step 5. The decoded training samples are normalized and input to the exact network that was debugged by the test samples and the obtained prediction data are mapped by inverse normalization to obtain the final prediction results.

3. Results and Analysis

In this section, we performed Pearson correlation analysis on the AOT and various influencing factors of 11 prefecture-level cities in the Shanxi Province by using SPSS software. The significant influence factors of AOT were extracted and used as the input side of the AOT time-series prediction model to calculate the AOT fitting prediction results. The mean value of the fitting superiority of the 11 prefecture-level cities reached 0.81, indicating that the AOT prediction model using the significant influence factors as the input side has some scientific validity.

3.1. Impact Factor Analysis

The Pearson correlation analysis between AOT and various influencing factors are shown in Table 1. The monthly average of AOT in odd years in the Shanxi Province from 2011 to 2019 has significant correlation coefficients with various influencing factors. The analysis shows that the monthly mean AOT is positively correlated with GDP, temperature, and population density; it is negatively correlated with NDVI, precipitation; and that the wind speed, NDVI, precipitation, population density, temperature, and GDP have great influence on AOT; however, wind speed has less influence. The results of the correlation degree of each influence factor are in general agreement with Jing [46].
The correlation intensity analysis of AOT for each city in the Shanxi Province was shown in Figure 7. Within the regions of the Shanxi Province, it was divided into three categories according to AOT association strength analysis: the low correlation was centered on Shuozhou and Datong in northern Shanxi Province, the medium correlation is centered on Luliang and Yangquan in central Shanxi Province, and the high correlation was centered on Jincheng in southern Shanxi Province. In general, it showed that the strength of the AOT correlation was weak between the cities that are far apart and strong between cities that were close to each other. However, the strength of the AOT was highly correlated between Jinzhong and Yuncheng, which were distant cities from each other; prompting us to explore the particular relevance as well as analyze the air pollution and emissions from heavy industries and natural climatic conditions in Jinzhong and Yuncheng. According to the spatial distribution characteristics of AOT in the Shanxi Province, generally high AOT in southern Shanxi leads to the emergence of AOT-associated high intensity radiation centers. Next, the topography of south-central Shanxi Province was complex, with significant relative height differences and a combination of rolling mountain ranges forming a low-latitude channel between Yuncheng and Jinzhong, and the main traffic arteries between the cities converge here. The combination of these scenarios leads to a high intensity of AOT correlation between Jinzhong and Yuncheng. In addition, the influence of the surrounding areas also led to more serious air pollution in some areas of south-western Shanxi.

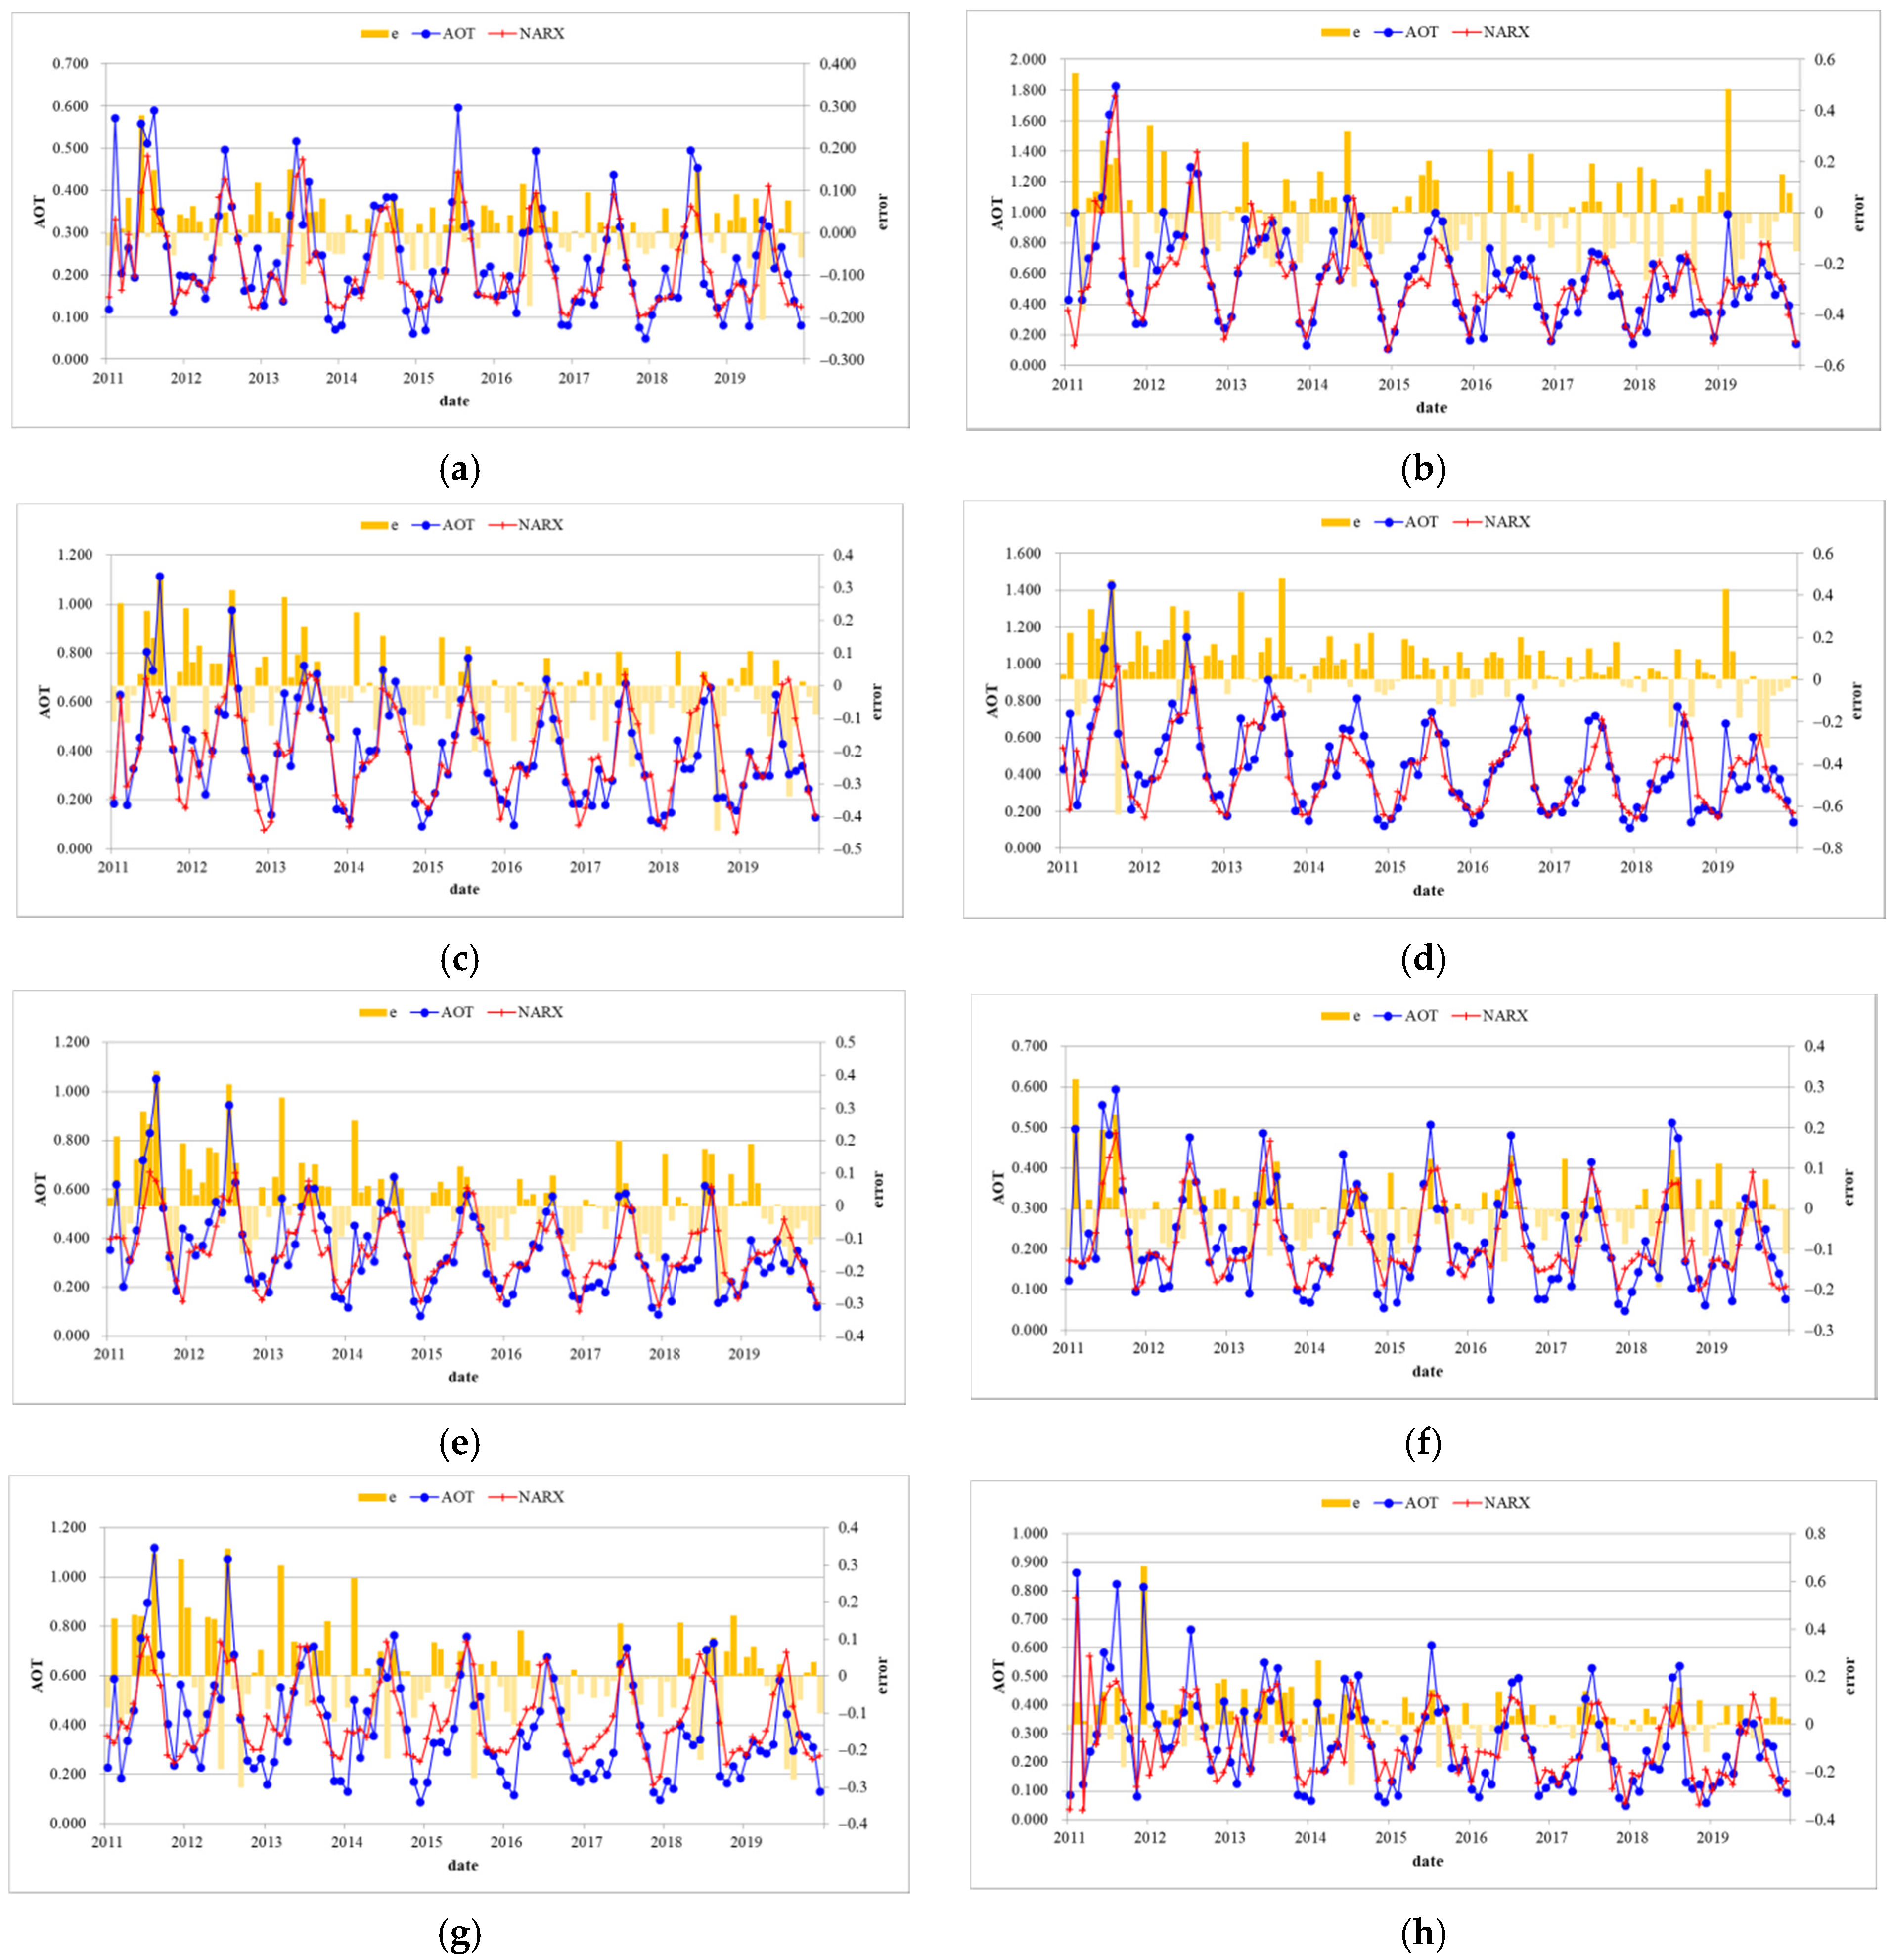
3.2. Prediction Results Testing

3.2.1. Pearson Correlation Coefficient

A Pearson Correlation Coefficient is used to measure the degree of linear association between two sets of continuous variables of AOT and impact factor [47].
r x , y = n   x i y i   x i   y i n   x i 2 (   x i ) 2 · n   y i 2 (   y i ) 2
To evaluate the prediction effect of the model, the root mean square error RMSE is used as the evaluation index to evaluate the AOT prediction model. The index calculation formula is shown in formula (3). y i is the true value, y ^ i is the predicted value, and m is the total sample size.
RMSE = 1 m i = 1 m ( y i y ^ i ) 2

3.2.2. Result Test

The impact factors were input into the NARX neural network along with the AOT training data and the results of the R determination coefficients for the training number set, validation number set, and the test number set that were obtained are shown in Figure 8. There were seven groups with coefficients R that were greater than 0.8 and four groups with 0.7–0.8, indicating that the AOT prediction model with the influencing factors as input variables (NARX) achieved better results. There were two sets of determination coefficients R that were less than 0.7, indicating that the main influencing factors of AOT for local areas are other factors or that the parameter settings of the network in NARX neural network such as hidden layer, training sample set, etc. need to be adjusted accordingly, and the saturation function also needs to be selected and adjusted appropriately.
The predicted results of AOT for each prefecture-level city in the Shanxi Province are shown in Figure 9. The graph shows the fit of the actual AOT trend in monthly values to the NARX neural network prediction output from 2011–2019. In terms of time series, the peak of AOT in each region occurs in June and July in summer each year while the trough occurs in November and December each year, showing a strong regularity. This is better adapted to the NARX neural network where the whole neuron will change according to the complexity of the type of each load and its data change trend [48].
The descriptive statistics of AOT prediction results for each prefecture-level city in Shanxi Province are shown in Table 2. TY, DT, JC, JZ, LF, LL, SZ, XZ, YQ, YC, and CZ denote Taiyuan, Datong, Jincheng, Linfen, Lvliang, Shuozhou, Xinzhou, Yangquan, Yuncheng, and Changzhi, respectively.

4. Conclusions

This paper is mainly based on the annual average data of AOT from MODIS inversion. Here we analyzed the temporal and spatial changes of AOT in typical coal resource-based cities within China and used the NARX model to predict the monthly AOT in Shanxi Province from 2011 to 2019. The results found that the MODIS04_3K product inversion results are promising, which more accurately reflected the AOT distribution of the study area. Affected by the monsoon climate, temperature, precipitation, and human factors, the annual average AOT of the Shanxi Province generally showed a rise first and then a fall, however, it had obvious regional differences. The spatial pattern was relatively stable, showing higher AOD that were obtained in the southern areas, while in the northern areas, the AOD were lower, and high in the center and low in the periphery. The high AOT are mainly distributed in Yuncheng, Linfen, and Taiyuan. There is a high correlation between the cities which is mainly related to the unique topography of the Shanxi Province and the layout of its own traffic road network. Using meteorological factors with significant correlation as the multiple input terminal of the NARX model to predict the monthly average AOT in Shanxi Province from 2011 to 2019, the RMSE did not exceed 0.3, the standard deviation between the predicted mean and the actual mean did not exceed 0.06. It is shown that better prediction results were obtained using significantly correlated AOT impact factors as input variables to the NARX neural network. The results of this research can be used for air pollution control in typical coal resource-based areas, as well as provided some help and reference.

Author Contributions

Conceptualization, Y.T.; Data curation, R.X.; Formal analysis, R.X. and M.X.; Funding acquisition, Y.T.; Investigation, R.X. and Y.W.; Methodology, R.X.; Resources, Y.T.; Software, Y.W.; Supervision, Y.T. and J.L.; Validation, Y.Z.; Visualization, R.X.; Writing—original draft, R.X.; Writing—review & editing, Y.T., M.X., Y.W. and Y.Z. All authors have read and agreed to the published version of the manuscript.

Funding

The relevant research in this paper was supported by the Humanity and Social Science foundation of Ministry of Education of China (20YJA630056).

Institutional Review Board Statement

Not applicable.

Informed Consent Statement

Not applicable.

Data Availability Statement

Shanxi AOD, wind speed, precipitation, temperature, NDVI data in earthdata data open platform, website: https://giovanni.gsfc.nasa.gov/ (accessed on 4 October 2020). GDP, population density data in China Shanxi Statistical Yearbook, website: https://data.cnki.net/Area/Home/Index/D04 (accessed on 3 October 2020). The above data are provided free of charge.

Acknowledgments

We thank the editors and anonymous reviewers for their careful reading of our manuscript and their many constructive comments and suggestions.

Conflicts of Interest

The authors declare no conflict of interest.

Correction Statement

This article has been republished with some minor corrections to the existing affiliation information and the Funding statement. These changes do not affect the scientific content of the article.

References

  1. Niu, Y.; Yan, Y.; Li, J.; Liu, P.; Liu, Z.; Hu, D.; Peng, L.; Wu, J. Establishment and verification of anthropogenic volatile organic compound emission inventory in a typical coal resource-based city. Environ. Pollut. 2021, 288, 117794. [Google Scholar] [CrossRef]
  2. Kaiser, D.P.; Qian, Y. Decreasing trends in sunshine duration over China for 1954–1998: Indication of increased haze pollution? Geophys. Res. Lett. 2002, 29, 38-1–38-4. [Google Scholar] [CrossRef]
  3. Rosenfeld, D.; Dai, J.; Yu, X.; Yao, Z.; Xu, X.; Yang, X.; Du, C. Inverse Relations between Amounts of Air Pollution and Orographic Precipitation. Science 2007, 315, 1396–1398. [Google Scholar] [CrossRef] [PubMed]
  4. Gui, K.; Che, H.; Chen, Q.; Zeng, Z.; Zheng, Y.; Long, Q.; Sun, T.; Liu, X.; Wang, Y.; Liao, T.; et al. Water vapor variation and the effect of aerosols in China. Atmos. Environ. 2017, 165, 322–335. [Google Scholar] [CrossRef]
  5. Liang, L.; Wang, Z.; Li, J. The effect of urbanization on environmental pollution in rapidly developing urban agglomerations. J. Clean. Prod. 2019, 237. [Google Scholar] [CrossRef]
  6. Zheng, B.; Tong, D.; Li, M.; Liu, F.; Hong, C.; Geng, G.; Li, H.; Li, X.; Peng, L.; Qi, J.; et al. Trends in China’s anthropogenic emissions since 2010 as the consequence of clean air actions. Atmos. Chem. Phys. 2018, 18, 14095–14111. [Google Scholar] [CrossRef]
  7. Wang, Y.; Guo, W.; Yan, S.; Li, Y. Analysis of Spatio-temporal variation of aerosol optical depth and climatic effects in Shanxi Province. Ecol. Environ. Sci. 2018, 27, 900–907. [Google Scholar]
  8. You, Y.; Zhao, T.; Xie, Y.; Zheng, Y.; Zhu, J.; Xia, J.; Cao, L.; Wang, C.; Che, H.; Liao, Y.; et al. Variation of the aerosol optical properties and validation of MODIS AOD products over the eastern edge of the Tibetan Plateau based on ground-based remote sensing in 2017. Atmos. Environ. 2020, 223, 117257. [Google Scholar] [CrossRef]
  9. Carra, E.; Marzo, A.; Ballestrín, J.; Polo, J.; Barbero, J.; Alonso-Montesinos, J.; Monterreal, R.; Abreu, E.F.; Fernández-Reche, J. Atmospheric extinction levels of solar radiation using aerosol optical thickness satellite data. Validation methodology with measurement system. Renew. Energy 2019, 149, 1120–1132. [Google Scholar] [CrossRef]
  10. Alam, K.; Qureshi, S.; Blaschke, T. Monitoring spatio-temporal aerosol patterns over Pakistan based on MODIS, TOMS and MISR satellite data and a HYSPLIT model. Atmos. Environ. 2011, 45, 4641–4651. [Google Scholar] [CrossRef]
  11. Muhammad, Z.; Thi, K.O.N.; Zeeshan, M.; Oanh, N.K. Relationship of MISR component AODs with black carbon and other ground monitored particulate matter composition. Atmos. Pollut. Res. 2015, 6, 62–69. [Google Scholar] [CrossRef]
  12. Zaman, S.U.; Pavel, R.S.; Joy, K.S.; Jeba, F.; Islam, S.; Paul, S.; Bari, A.; Salam, A. Spatial and temporal variation of aerosol optical depths over six major cities in Bangladesh. Atmos. Res. 2021, 262, 105803. [Google Scholar] [CrossRef]
  13. Xu, J.; Han, F.; Li, M.; Zhang, Z.; Xiaohui, D.; Wei, P. On the opposite seasonality of MODIS AOD and surface PM2.5 over the Northern China plain. Atmos. Environ. 2019, 215, 116909. [Google Scholar] [CrossRef]
  14. Dadashi-Roudbari, A.; Ahmadi, M. Evaluating temporal and spatial variability and trend of aerosol optical depth (550 nm) over Iran using data from MODIS on board the Terra and Aqua satellites. Arab. J. Geosci. 2020, 13, 1–23. [Google Scholar] [CrossRef]
  15. Kumar, A. Spatio-temporal synoptic variability of aerosol optical depth and cloud properties over the Central North region of India through MODIS collection V satellite sensors. Indian J. Phys. 2015, 90, 613–625. [Google Scholar] [CrossRef]
  16. Kang, N.; Kumar, K.R.; Hu, K.; Yu, X.; Yin, Y. Long-term (2002–2014) evolution and trend in Collection 5.1 Level-2 aerosol products derived from the MODIS and MISR sensors over the Chinese Yangtze River Delta. Atmos. Res. 2016, 181, 29–43. [Google Scholar] [CrossRef]
  17. Liu, Y.; Zhao, H.; Ma, Y.; Yang, H.; Wang, Y.; Wang, H.; Zhang, Y.; Zou, X.; Wang, H.; Wen, R.; et al. Characteristics of particulate matter and meteorological conditions of a typical air-pollution episode in Shenyang, northeastern China, in winter 2017. Atmos. Pollut. Res. 2020, 12, 316–327. [Google Scholar] [CrossRef]
  18. Ma, X.; Wang, J.; Yu, F.; Jia, H.; Hu, Y. Can MODIS AOD be employed to derive PM2.5 in Beijing-Tianjin-Hebei over China? Atmos. Res. 2016, 181, 250–256. [Google Scholar] [CrossRef]
  19. Qin, H.; Chen, G.; Wang, W.; Wang, D.; Zeng, L. Validation and application of MODIS-derived SST in the South China Sea. Int. J. Remote Sens. 2014, 35, 4315–4328. [Google Scholar] [CrossRef]
  20. Filonchyk, M.; Yan, H.; Zhang, Z. Analysis of spatial and temporal variability of aerosol optical depth over China using MODIS combined Dark Target and Deep Blue product. Arch. Meteorol. Geophys. Bioclimatol. Ser. B 2018, 137, 2271–2288. [Google Scholar] [CrossRef]
  21. Remer, L.A.; Mattoo, S.; Levy, R.C.; Munchak, L.A. MODIS 3 km aerosol product: Algorithm and global perspective. Atmos. Meas. Tech. 2013, 6, 69–112. [Google Scholar] [CrossRef]
  22. Wang, Z.B.; Fang, C.L. Spatial- temporal characteristics and determinants of PM2.5 in the Bohai Rim Urban Agglomeration. Chemosphere 2016, 148, 148–162. [Google Scholar] [CrossRef] [PubMed]
  23. Yang, M.; Wang, Y. Temporal and spatial characteristics and influencing factors of PM2.5 in the Yangtze River Economic Belt. China’s Popul. Resour. Environ. 2017, 27, 91–100. [Google Scholar] [CrossRef]
  24. Wu, J.; Wang, Q.; Li, J.; Tu, Y. Comparison of spatial differentiation simulation models of PM2.5 concentration: Taking the Beijing-Tianjin-Hebei region as an example. Environ. Sci. 2017, 38, 2191–2201. [Google Scholar] [CrossRef]
  25. He, X.; Lin, Z. Analysis of the influence of the interaction of influencing factors on the change of PM2.5concentration based on GAM model. Environ. Sci. 2017, 22–32. [Google Scholar] [CrossRef]
  26. Guo, J.; Luo, Y.; Yang, J.; Furtado, K.; Lei, H. Effects of anthropogenic and sea salt aerosols on a heavy rainfall event during the early-summer rainy season over coastal Southern China. Atmos. Res. 2021, 265, 105923. [Google Scholar] [CrossRef]
  27. Chang, Y.-S.; Chiao, H.-T.; Abimannan, S.; Huang, Y.-P.; Tsai, Y.-T.; Lin, K.-M. An LSTM-based aggregated model for air pollution forecasting. Atmos. Pollut. Res. 2020, 11, 1451–1463. [Google Scholar] [CrossRef]
  28. Zounemat-Kermani, M.; Stephan, D.; Hinkelmann, R. Multivariate NARX neural network in prediction gaseous emissions within the influent chamber of wastewater treatment plants. Atmos. Pollut. Res. 2019, 10, 1812–1822. [Google Scholar] [CrossRef]
  29. Khojasteh, D.N.; Goudarzi, G.; Taghizadeh-Mehrjardi, R.; Asumadu-Sakyi, A.B.; Fehresti-Sani, M. Long-term effects of outdoor air pollution on mortality and morbidity–prediction using nonlinear autoregressive and artificial neural networks models. Atmos. Pollut. Res. 2021, 12, 46–56. [Google Scholar] [CrossRef]
  30. Dehghan, A.; Khanjani, N.; Bahrampour, A.; Goudarzi, G.; Yunesian, M. The relation between air pollution and respiratory deaths in Tehran, Iran- using generalized additive models. BMC Pulm. Med. 2018, 18, 1–9. [Google Scholar] [CrossRef]
  31. Li, L.; Lei, Y.; Wu, S.; He, C.; Yan, D. Study on the coordinated development of economy, environment and resource in coal-based areas in Shanxi Province in China: Based on the multi-objective optimization model. Resour. Policy 2018, 55, 80–86. [Google Scholar] [CrossRef]
  32. Wu, J.; Wang, X. Research progress of retrieval ground-level PM2.5 concentration based on AOD data. Environ. Sci. Technol. 2017, 40, 68–76. [Google Scholar]
  33. Van Donkelaar, A.; Martin, R.V.; Brauer, M.; Kahn, R.; Levy, R.C.; Verduzco, C.; Villeneuve, P.J. Global Estimates of Ambient Fine Particulate Matter Concentrations from Satellite-Based Aerosol Optical Depth: Development and Application. Environ. Health Perspect. 2010, 118, 847–855. [Google Scholar] [CrossRef] [PubMed]
  34. Xu, Z.; Cheng, S.; Zhen, L. Interregional coal flow and its environmental loads transfer in Shanxi Province. J. Geogr. Sci. 2011, 21, 757–767. [Google Scholar] [CrossRef]
  35. He, Q.; Li, C.; Geng, F.; Lei, Y.; Li, Y. Study on Long-term Aerosol Distribution over the Land of East China Using MODIS Data. Aerosol Air Qual. Res. 2012, 12, 304–319. [Google Scholar] [CrossRef]
  36. Wang, J.; Zhao, B.; Wang, S.; Yang, F.; Xing, J.; Morawska, L.; Ding, A.; Kulmala, M.; Kerminen, V.-M.; Kujansuu, J.; et al. Particulate matter pollution over China and the effects of control policies. Sci. Total Environ. 2017, 584–585, 426–447. [Google Scholar] [CrossRef] [PubMed]
  37. Song, H.; Zhuo, H.; Fu, S.; Ren, L. Air pollution characteristics, health risks, and source analysis in Shanxi Province, China. Environ. Geochem. Health 2020, 43, 391–405. [Google Scholar] [CrossRef] [PubMed]
  38. Liu, H.Z.; Guo, H.Y.; Ma, Z.F. Xu, H.; Bao, H.; Xu, C. Temporal-Spatial Characteristics and Variability in Aerosol Optical Depth over China During 2001-2017. Environ. Sci. 2019, 40, 3886–3897. [Google Scholar] [CrossRef]
  39. Liu, C.; Zhao, T.; Xiong, J.; Liu, Y.; Han, Y.; Liu, F. A simulated climatology of dust aerosol emissions over 1991-2010 and the influ-encing factors of atmospheric circulation over the major deserts in the world. J. Desert Res. 2015, 35, 959–970. [Google Scholar]
  40. Carmichael, G.R.; Streets, D.G.; Calori, G.; Amann, M.; Jacobson, M.Z.; Hansen, J.; Ueda, H. Changing Trends in Sulfur Emissions in Asia: Implications for Acid Deposition, Air Pollution, and Climate. Environ. Sci. Technol. 2002, 36, 4707–4713. [Google Scholar] [CrossRef]
  41. Bai, X.; Tian, H.; Liu, X.; Wu, B.; Liu, S.; Hao, Y.; Luo, L.; Liu, W.; Zhao, S.; Lin, S.; et al. Spatial-temporal variation characteristics of air pollution and apportionment of contributions by different sources in Shanxi province of China. Atmos. Environ. 2020, 244, 117926. [Google Scholar] [CrossRef]
  42. Li, H.; Gao, X.; Li, H.; Yan, Y.; Guo, L.; He, Q. Spatial-temporal distribution and variation characteristics of PM2.5 in Shanxi. Environ. Chem. 2018, 37, 913–923. [Google Scholar]
  43. Hashmi, U.; Arora, V.; Priolkar, J.G. Hourly electric load forecasting using Nonlinear AutoRegressive with eXogenous (NARX) based neural network for the state of Goa, India. In Proceedings of the 2015 International Conference on Industrial Instrumentation and Control (ICIC), Pune, India, 28–30 May 2015; pp. 1418–1423. [Google Scholar] [CrossRef]
  44. Baghaee, H.R.; Mirsalim, M.; Gharehpetan, G.B.; Talebi, H.A. Nonlinear Load Sharing and Voltage Compensation of Microgrids Based on Harmonic Power-Flow Calculations Using Radial Basis Function Neural Networks. IEEE Syst. J. 2017, 12, 2749–2759. [Google Scholar] [CrossRef]
  45. Liu, Y.; Wang, X.; Liu, Y. Asynchronous harmonic analysis based on out-of-sequence measurement for large-scale residential power network. In Proceedings of the 2015 IEEE International Instrumentation and Measurement Technology Conference (I2MTC), Pisa, Italy, 11–14 May 2015; pp. 1693–1698. [Google Scholar] [CrossRef]
  46. Jing, Y.; Sun, Y.; Fu, H.; Ma, H.; Teng, Q.; Cui, Y. Temporal and spatial variation of aerosol optical depth and analysis of influencing factors in Beijing-Tianjin-Hebei region from 2010 to 2016. Environ. Sci. Technol. 2018, 41, 104–113. [Google Scholar] [CrossRef]
  47. Edelmann, D.; Móri, T.F.; Székely, G.J. On relationships between the Pearson and the distance correlation coefficients. Stat. Probab. Lett. 2021, 169, 108960. [Google Scholar] [CrossRef]
  48. Hatata, A.; Eladawy, M. Prediction of the true harmonic current contribution of nonlinear loads using NARX neural network. Alex. Eng. J. 2018, 57, 1509–1518. [Google Scholar] [CrossRef]
Figure 1. The location and distribution of topographic maps in Shanxi Province.
Sustainability 14 02498 g001
Figure 2. Statistical chart of AOT partition in different years.
Sustainability 14 02498 g002
Figure 3. Multi-month AOT average change statistics chart.
Sustainability 14 02498 g003
Figure 4. Spatial distribution of AOT in Shanxi Province.
Sustainability 14 02498 g004
Figure 5. NARX neural network structure diagram.
Sustainability 14 02498 g005
Figure 6. Process design of AOT prediction model combining impact factors.
Sustainability 14 02498 g006
Figure 7. Correlation chart of AOT intensity in Shanxi Province.
Sustainability 14 02498 g007
Figure 8. Determination coefficient by region R. (a) Datong. (b) Jincheng. (c) Jinzhong. (d) Linfen. (e) Lvliang. (f) Shuozhou. (g) Taiyuan. (h) Xinzhou. (i) Yangquan. (j) Yuncheng. (k) Changzhi.
Sustainability 14 02498 g008aSustainability 14 02498 g008b
Figure 9. The AOT forecast results by prefecture-level cities in the Shanxi Province. (a) Datong. (b) Jincheng. (c) Jinzhong. (d) Linfen. (e) Lvliang. (f) Shuozhou. (g) Taiyuan. (h) Xinzhou. (i) Yangquan. (j) Yuncheng. (k) Changzhi.
Sustainability 14 02498 g009aSustainability 14 02498 g009b
Table 1. AOT impact factor correlation coefficient.
TaiyuanDatongJinchengJinzhongLinfenLvliangShuozhouXinzhouYangquanYunchengChangzhi
GDP0.9040.9460.8580.8980.7660.3650.7420.8500.8170.8830.668
people density0.9350.9340.9620.9860.9830.9720.9100.9550.9840.9830.982
precipitation−0.390−0.971−0.945−0.563−0.683−0.142−0.831−0.357−0.441−0.446−0.769
temperature0.9520.9650.6080.8790.9720.9870.9950.9850.9040.6770.808
wind speed−0.150−0.097−0.201−0.239−0.267−0.336−0.020−0.272−0.270−0.280−0.225
NDVI−0.950−0.885−0.818−0.801−0.919−0.790−0.872−0.894−0.984−0.775−0.718
Table 2. Descriptive statistics.
TYDTJCJZLFLLSZXZYQYCCZ
RMSE0.0150.0050.0280.0170.0270.2870.0070.0120.0190.0190.031
F-average0.4300.2220.5680.3980.4300.3510.2220.2640.3620.5100.491
average0.3940.2380.5880.3920.4480.3540.2270.2740.4030.5080.550
F-standard deviation0.1480.0970.2730.1800.2010.1270.0950.1290.1560.1560.203
standard deviation0.2100.1280.3040.2020.2420.1820.1260.1720.2030.2160.278
Publisher’s Note: MDPI stays neutral with regard to jurisdictional claims in published maps and institutional affiliations.

