
Economic Impacts of Public Air Transport Investment: A Case Study of Egypt


1
Department of Logistics, Marketing, Hospitality and Analytics, The Business School, University of Huddersfield, Queensgate, Huddersfield HD1 3DH, UK
2
Tourism Studies Department, Faculty of Tourism and Hotels, Minia University, Minia 61519, Egypt
*
Author to whom correspondence should be addressed.
Sustainability 2022, 14(5), 2651; https://0-doi-org.brum.beds.ac.uk/10.3390/su14052651
Submission received: 8 January 2022
/
Revised: 16 February 2022
/
Accepted: 22 February 2022
/
Published: 24 February 2022
(This article belongs to the Special Issue Re-defining the Role of Transport in Sustainable Tourism Development)
Abstract
:This paper applies an input–output (I-O) approach and a dynamic computable general equilibrium (CGE) model to examine the economy-wide short- and long-run impacts of an increase in public capital investment in air transport infrastructure. The results of the I-O analysis reveal that air transport has above-average backward linkages with other sectors in the economy, with mining being the most intensive industry in intermediate input demand for air transport. The results of the CGE simulation show that at the macroeconomic level, expanding public air transport stock induces modest growth in GDP, employment, income, consumption, private investment, and trade. The findings show that the estimated impact of air transport investment is lower than estimated in studies on the “multiplier effect” of the investment using partial equilibrium techniques.
1. Introduction
Although air transport remains relatively underdeveloped in many regions of the emerging world, investment in air transport infrastructure has grown strongly in emerging markets over the past two decades, spurred by an increase in traffic facilitated principally by economic and institutional reforms [1,2]. Moreover, high gross domestic product (GDP) growth, coupled with the growth of the middle class and increased regional and global economic integration of developing and emerging economies, indicate that the aviation sector in these regions will continue to grow at a healthy rate over the next few decades, provided that adequate investment is made in infrastructure development [3]. Despite recent high growth rates, African countries continue to experience significant gaps in supplies of key infrastructure, including air transport infrastructure. It has been argued that Africa will need to expand several airports to meet an anticipated growth in demand of over three million additional passengers per year by 2040 [4]. Reports by the International Air Transport Association (IATA) [5] also highlight the need for improvements to Africa’s international airports. The International Monetary Fund (IMF) [6] indicates that additional investment is needed in Egypt to improve transport infrastructure further and ensure functional connectivity between ports, airports, and markets through well-connected road and railroad networks. Egypt’s cumulative investment gap in transport infrastructure over the next 10 years is estimated at USD 70 billion, or about 27% of the current GDP [6].
Besides the role of airports in supporting airline operations, they also play a significant role in supporting the growth of other sectors, such as agriculture, construction, photography, surveying, observation and patrol, and aerial advertisement [7]. For example, Tsui and Henderson [8] found that the expansion of New Zealand’s airports between 2001 and 2016 supported the transport of agricultural products by air, which in turn resulted in the growth of its sizeable agricultural and horticultural sectors. Furthermore, airports contribute to the development of non-commercial aviation operations. According to Sobieralski [9], niche aviation, with most flights being personal or recreational (private pilot tourists), contributed over 1% to the USA’s GDP and generated more than 1.2 million jobs in 2013. In addition, Henderson and Tsui [10] discussed the relationship between niche aviation operations and tourism, concluding that niche aviation operations help to promote and offer exceptional tourism experiences, including adventure, scenic, heritage, and space tourism.
Governments are making efforts to close this infrastructure gap, with rapid growth in spending on air transport infrastructure in emerging and developing countries in recent years, including in Egypt [3]. Driven by long-term tourism opportunities and high demand, Egypt has recently developed and modernised several aviation facilities, including runway renovations and a new control tower at Cairo Airport (USD 19 million), a new USD 18 million airport to the west of Cairo that opened in January 2019 [11], the renovation of Cairo International Terminal 2 (USD 500 million), the expansion of Sharm El-Sheikh Airport (USD 370 million), and the renovation of Alexandria International Airport at a cost of USD 120 million [12]. An additional airport, covering an area of up to 26 square kilometres and costing approximately USD 14.5 billion, is planned for Egypt’s “new capital city,” which is set to become the country’s new administrative and financial capital [11].
There is some evidence that economic performance correlates robustly with the quantity and quality of and access to air transport infrastructure. For instance, the World Bank [13] indicates that if all African countries were to catch up with the level of infrastructure in Mauritius, the region’s GDP growth per capita might increase by 2.2%. Early studies of the relationship between air transport and economic growth were conducted by Benell and Prentice [14] and Button et al. [15], with more recent contributions by Khadaroo and Seetanah [16], Allroggen and Malina [17], and Profillidis and Botzoris [18]. These studies typically rely on econometric techniques to examine the relationship between air traffic and employment levels [15,19,20,21,22,23,24]. Other studies investigate the relationship between airport growth and metropolitan economies [25,26,27]. Oxford Economic Forecasting [28] suggests that improvements to air transport infrastructure can play a key role in facilitating and complementing policies that aim to improve living standards and alleviate poverty. Expanding air transport infrastructure may serve as a policy lever to diversify the country’s export base and expand tourism. Time savings from improving the air transport infrastructure and network are potentially considerable in developing and emerging countries that have poor surface transport systems [29]. In recent years, academic and policy-oriented literature has focused increasingly on the wider impact of air transport infrastructure investment [30]. Dimitrios and Maria’s [31] economic impact analysis indicates that investment in air transport infrastructure spurs economic growth and strengthens social values, and also generates employment both directly and through indirect and induced multiplier effects across the economy.
Despite Egypt’s considerable investment in air transport infrastructure recently, the wider economic consequences of these projects have received limited attention in the literature. In research on the economic contributions of air transport, studies of the distribution of investments in the sector are notably lacking. Moreover, few studies [32,33] have estimated the impact of air transport investment using a general equilibrium modelling (CGE) approach. Most existing studies focus on advanced economies, mainly the United Kingdom (UK) and Australia. Given scarce resources in developing economies, it is critical to undertake a detailed investigation of the impacts of investments in infrastructure. CGE modelling is suited to this analysis. Thus, general equilibrium analysis of air transport is needed to shed light on the inter-institutional, inter-industry and dynamic effects of air transport investment.
This paper adopts a multi-method approach to evaluate the wider economic impact of air transport investment in Egypt. It computes the backward and forward linkages of the air transport industry to provide insights into the interdependence of air transport and the rest of the economy. Backward and forward linkages can be used as a first step toward identifying potential areas for public investment and as a tool for policymaking. We then conduct dynamic CGE analysis to estimate the short- and long-term macroeconomic and sectoral effects of an investment in air transport infrastructure. This study builds on previous research on links between transport investment and economic growth and contributes to the literature by enriching understanding of the short- and long-term impacts of air transport infrastructure, specifically its impact on individual firms’ productivity. Existing CGE transport studies (see Arman et al. [34]; Van Truong and Shimizu [35]; Rokicki et al. [36]) are too aggregated, whereby transport is not disaggregated by modes, and fail to shed light on the sectoral linkages and distributional impacts of air transport investment.
Furthermore, this research contributes to the existing literature by investigating the economy-wide short- and long-run impacts of investment in air transport infrastructure in developing economies such as Egypt, where less research has been conducted.
2. Literature Review
Four approaches have dominated economic research on the linkages between air transport investment and economic transformation. The next sub-sections briefly introduce econometric and CGE studies of air transport expansion and economic growth.
General Equilibrium Analyses of Air-Transport Infrastructure Investments
Four approaches have dominated economic research on the linkages between air transport investment and economic transformation: econometrics, cost–benefit analysis (CBA), economic impact analysis, and more recently, CGE models. It is worth noting that although CBA is commonly used to evaluate investments in the social sector, it is rarely employed in the transportation sector [37] (for more review of CBA and economic impact studies, see Forsyth et al. [30]). The first three techniques are partial equilibrium approaches, whereas the last one is general equilibrium analysis. Partial equilibrium analyses may be the best approach for analysing the economic impacts of small changes in air transport policies and infrastructure, which are unlikely to have a significant effect on the prices of other goods and services throughout the economy. However, for non-marginal changes in air transport investments, the direct and secondary influences on other industries and factor markets may be of consequence. In contrast to the partial equilibrium approach, CGE models are not limited to aggregate outputs, but are able to account for secondary effects and can be used to assess many parameters, including sectoral output, income distribution, price effects, factor allocation, and welfare. This was supported by Dwyer and Forsyth [38], who said that CGE models hold considerable promise for improving the assessment of infrastructure projects and their associated public finance, as they can be customised to accommodate a variety of different conditions, including flexible or fixed prices, alternate exchange rate regimes, variances in the degree of factor mobility, and other forms of competition. The fundamental difference between CGE models and input–output (I-O) models is that in the former, the prices of commodities are endogenous and the economy faces resource constraints that result in upward-sloping supply curves for all production sectors [39,40].
Laird et al. [41] indicated that transport developments affect accessibility and land use, in turn altering patterns of outputs, prices, and wages. Estimates of the effects of significant investments in air transport infrastructure using partial equilibrium approaches are likely to lead to over- or underestimates of the resulting changes in key economic variables, depending on the extent and type of links between air transport and the rest of the economy. CGE models are built specifically to represent interrelationships between markets and sectors in the local economy, where changes in air transport services may affect multiple markets and sectors in non-marginal ways.
Although CGE models have been widely used to estimate the economic impacts of investment in other modes of transport [42,43,44], relatively few CGE models have been built and used to evaluate air transport interventions or infrastructure projects [30]. Air transport-related CGE models have been applied in Australia to examine the benefits of an airport’s curfew-free status [45], the economy-wide impact of an additional runway [46], the impacts of price-reducing reforms in air transport in Egypt [47], and the economic effect of a new airport for Sydney [48]. Also employing this approach, Forsyth et al. [30] estimated the flow and expenditure effects, as well as the economic impacts on the Australian economy and the tourism industry, of an increase in Australia’s passenger movement charge, and a multi-regional CGE model of the Australian economy was used in a study of the costs and benefits of subsidies to airports [49].
CGE models have also been used in Japan to estimate the welfare and spillover effects of deregulation and expansion of the capacity of Tokyo’s Haneda International Airport [50,51]. Yamaguchi et al. [52] suggested that spillover effects account for 30% of the total social welfare derived from deregulation and airport capacity expansion, and concluded that both factors must play a significant role in increasing social welfare using domestic air transport reforms. Other applications of CGE models to airport infrastructure include a recent study by the UK’s Airports Commission [53], using a spatial computable general equilibrium (S-CGE) model to estimate the effects on GDP of proposed airport capacity increases at Gatwick and Heathrow. This technique, using a multi-regional, dynamic CGE model, was also applied to examine the potential benefits of abolishing air passenger tax in the UK and Germany [53,54]. Harback et al.’s [55] air transport CGE model for the United States (US) economy was used to investigate the impact of air transport congestion, using a technology variable that is a function of the output of the air transportation industry. Chen and Haynes’s [56] static CGE model indicated that public transportation capital generally has a positive impact on both economic growth and social welfare and that, unlike the values obtained using partial equilibrium models, the output elasticity of transportation capital is only 0.004, meaning that a 1% increase in public transportation capital input leads to a 0.004% increase in value-added GDP. The authors showed that an exogenous increase in public air transport capital is likely to increase GDP by 0.012% and air transport service consumption by 0.177%, but with an increase of only around 0.01% in other sectors. Njoya and Nikitas [57] recently used static CGE models to analyse the distributional impacts of public air capital expansion in South Africa.
This study uses input–output (I-O) analysis to measure sectoral interdependencies and deploys a dynamic CGE model to capture the economy-wide impact of air transport infrastructure investments. The two techniques are used in a strictly complementary way.
3. Methods
As mentioned above, this paper used the I-O analysis method to identify sectors with the highest backward and forward linkages, and hence determined the potential of air transport as a driver of economic growth in Egypt. It also used a CGE model to simulate the economy-wide impact of public air capital expansion. The most recent available disaggregated Egypt Social Accounting Matrix (2010/2011 SAM) was used, where the transport sector is disaggregated by modes. This was particularly appropriate for air transport investment analysis. At this point, it is worth noting that Egypt’s 2011 revolution caused a challenging transition phase for the Egyptian economy [58]. Egypt’s economy had been under severe strain since the revolution and has been subject to prolonged uncertainty and resource-constrained macroeconomic policies, all of which delayed responses to necessary stimulus packages, which adversely affected economic recovery in the wake of that revolution [59]. According to Echevarría and García-Enríquez [60] uncertainty during the years 2011–2017 resulted in reduced levels of domestic and foreign direct investment. They estimated a 1.6% loss in the annual growth rate of per capita real GDP, which amounted to a loss of USD 897 and an annual loss of USD 83.2 billion in the aggregate real GDP. However, by using a dynamic model, we replicated, to some extent, the economic structure of Egypt from 2011 onwards.
The dynamic setting considers accumulation and growth effects. It is established by updating exogenous variables and parameters that are either fixed or absent in the base-year solution. These variables and parameters include population (we used the most recent estimates by the World bank of 1.9% yearly population growth rate) and labour supply. Other variables that grow at the population growth rate include the current account balance, current government expenditures, public investment by category and by public sector industry, changes in inventories, and finally, the minimum level consumption within the LES function. Unlike the static model, capital stock is endogenous in the dynamic model. Capital stock is the stock of the preceding period, minus depreciation, plus the volume of new capital investment in the preceding period. Accordingly, the calibration of this model to a more recent database is likely to produce similar results in terms of sectoral linkages and distributional impacts, although the magnitude of changes might be slightly different.
3.1. Linkage Analysis
Whether or not air transport expansion may be an enabler of broad-based growth depends on the degree of interconnectedness of the air transport sector with the rest of the economy. Linkage computations can help depict the extent of such interconnectedness. In the social accounting matrix framework, activities have two types of economic linkages: as purchaser of inputs from other activities and as seller of output to other sectors. Different measures of sectoral linkages have been proposed, with early work including that by Chenery and Watanabe [61], Hirschman [62], and Rasmussen [63]. We adopted the Hirschman–Rasmussen backward linkage index to identify key sectors in a social accounting matrix for Egypt for the year 2010–1011 (hereafter Egypt SAM [64]). Analysis of sectoral linkages relies on input–output coefficients, which provides a snapshot of links across production sectors in national, regional, or village economies [65]. The Leontief inverse (L) matrix can be expressed as follows:
where the coefficients represent the effect of an exogenous unit change in the final demand of a sector. From the Leontief inverse (Equation (1)) the direct backward linkage can be estimated by summing along the ith column, as in Equation (2):
The direct forward linkage is given by the sum of the elements in the jth row, as in Equation (3):
Let v be the global intensity of the Leontief inverse matrix:
Then, the hierarchy of economic sectors can be measured using the input-output multiplier product matrix (MPM) (Equation (5)), also known as first-order intensity field of influence, which ranks sectors according to backward and forward linkages. MPM is defined as:
Matrix has similar features to the Leontief inverse. The backward linkage index of sector j, which measures the relative importance of a sector as a purchaser of inputs from other sectors in the economy, is given by Equation (6):
The forward linkage index of sector j, which is a measure of the relative importance of a sector as a supplier of outputs to other sectors in the economy, is given by Equation (7):
The average value of and is unity, so sectors with BLj > 1 and FLj > 1 are considered strong or key sectors, whereas those with backward and forward indices below the average are viewed as weak sectors.
3.2. CGE Model Structure
We drew on Decaluwé et al.’s [66] recursive dynamic PEP-1-t (1 country – t periods) model to construct a CGE model that reflects the structural characteristics of the Egyptian economy and is capable of capturing the dynamic effects of changes to the air transport infrastructure. The model was calibrated to the Egypt SAM [64]. Our modifications to the standard model are presented below. The Egypt SAM disaggregates the transport sector into three sub-sectors (air, water, and land), making it particularly appropriate for transport sector analysis. The Egypt CGE model developed for use in this study contains 53 activity groups and 78 commodities. Three factors of production were identified: labour, capital, and land.
Production is represented by a three-level constant elasticity of substitution (CES) production function, where the bottom level of nesting combines different types of labour, which relate to a CES nested function to produce composite labour (LDC). At the middle level of nesting, this composite labour is further combined with capital (KDC), which is determined by a CES technology to produce a value-added input composite. As in Boccanfuso et al. [67], an infrastructure externality parameter is added to value added, VA (Equation (9)), to capture production externalities associated with an air transport intervention (there is a vast literature on externalities stemming from increased infrastructure investment (see Aschauer, 1989; Munnell, 1990; Barro, 1990; Faini, 1994; Gramlich, 1994; Dessus and Herrera, 1996; Dumont and Mesplé-Somps, 2000; Yeaple and Golub, 2007)). The externality parameter () is defined in Equation (8) as the ratio of the new stock of public capital (KGt) to past public capital (KGt-1) with a sector-specific elasticity (ϵj).
where is the externality.
Following Aschauer [68], externality is built into the model by adjusting the value-added equation:
where and are the demand for composite labour and capital by activity j in period t, and is the elasticity parameter in the value added. Externalities of past public investment are calibrated in the scale parameter of the value-added function. The externality measure represents the portion associated with the new investment.
At the upper level of nesting, the final output is produced from aggregate value added, and the intermediates are combined according to a fixed-share Leontief assumption (see Decaluwé et al. [66]). The final output is allocated between domestic and export markets, under the assumption that suppliers maximize sales revenue for any given aggregate output level, subject to imperfect transformability between exports and domestic sales, expressed by a constant elasticity of transformation (CET) function.
Additional public spending on air transport infrastructure development and maintenance will affect the government budget. A critical issue in debates about the effect of public infrastructure spending is the government’s budgetary constraint on funding investments [67,69,70]. In Equation (10), this constraint is given as government income () spent on public services (), transfers to non-governmental agents ( and government savings (). Public spending and savings are assumed to be exogenous.
In this study, we assumed that investment demand consists only of public investment (KG), but in reality it consists of both private and public investment [71,72]. The former is determined by the sum of the savings of non-governmental domestic institutions and the rest of the world [67,69,70].
Maintenance expenditure resulting from an increase in public investment () can be estimated using Equation (11) below:
where represents current government expenditure on goods and services, and w is a parameter representing the level of investment required to maintain the capital stock. We used a value of 2% for w as the replacement cost of the capital stock for air transport infrastructure [73].
Other equations relating to production and factor demand, foreign trade and demand for goods and services, and the income and savings of households and other institutions, price equations, and equilibrium conditions were omitted. The consumer price index acts as the numeraire in the model. For the closure and the dynamic set-up of the model, this study followed Decaluwé et al. [66]. It was assumed that capital stock is endogenous and labour is mobile between sectors.
4. Findings and Discussion
4.1. Input–Output Results
Assessing sector linkages is important from an economic policy perspective because strong linkages catalyse a multiplier effect that generates broad-based economic benefits at both national and local levels [74]. Linkages serve as a starting point around which to structure analysis of the importance of air transport to individual industries and the wider economy. Laird et al. [41] argued that backward and forward transport linkages are highly relevant to transport pricing and investment policies, and are attributable to transport’s intermediary nature.
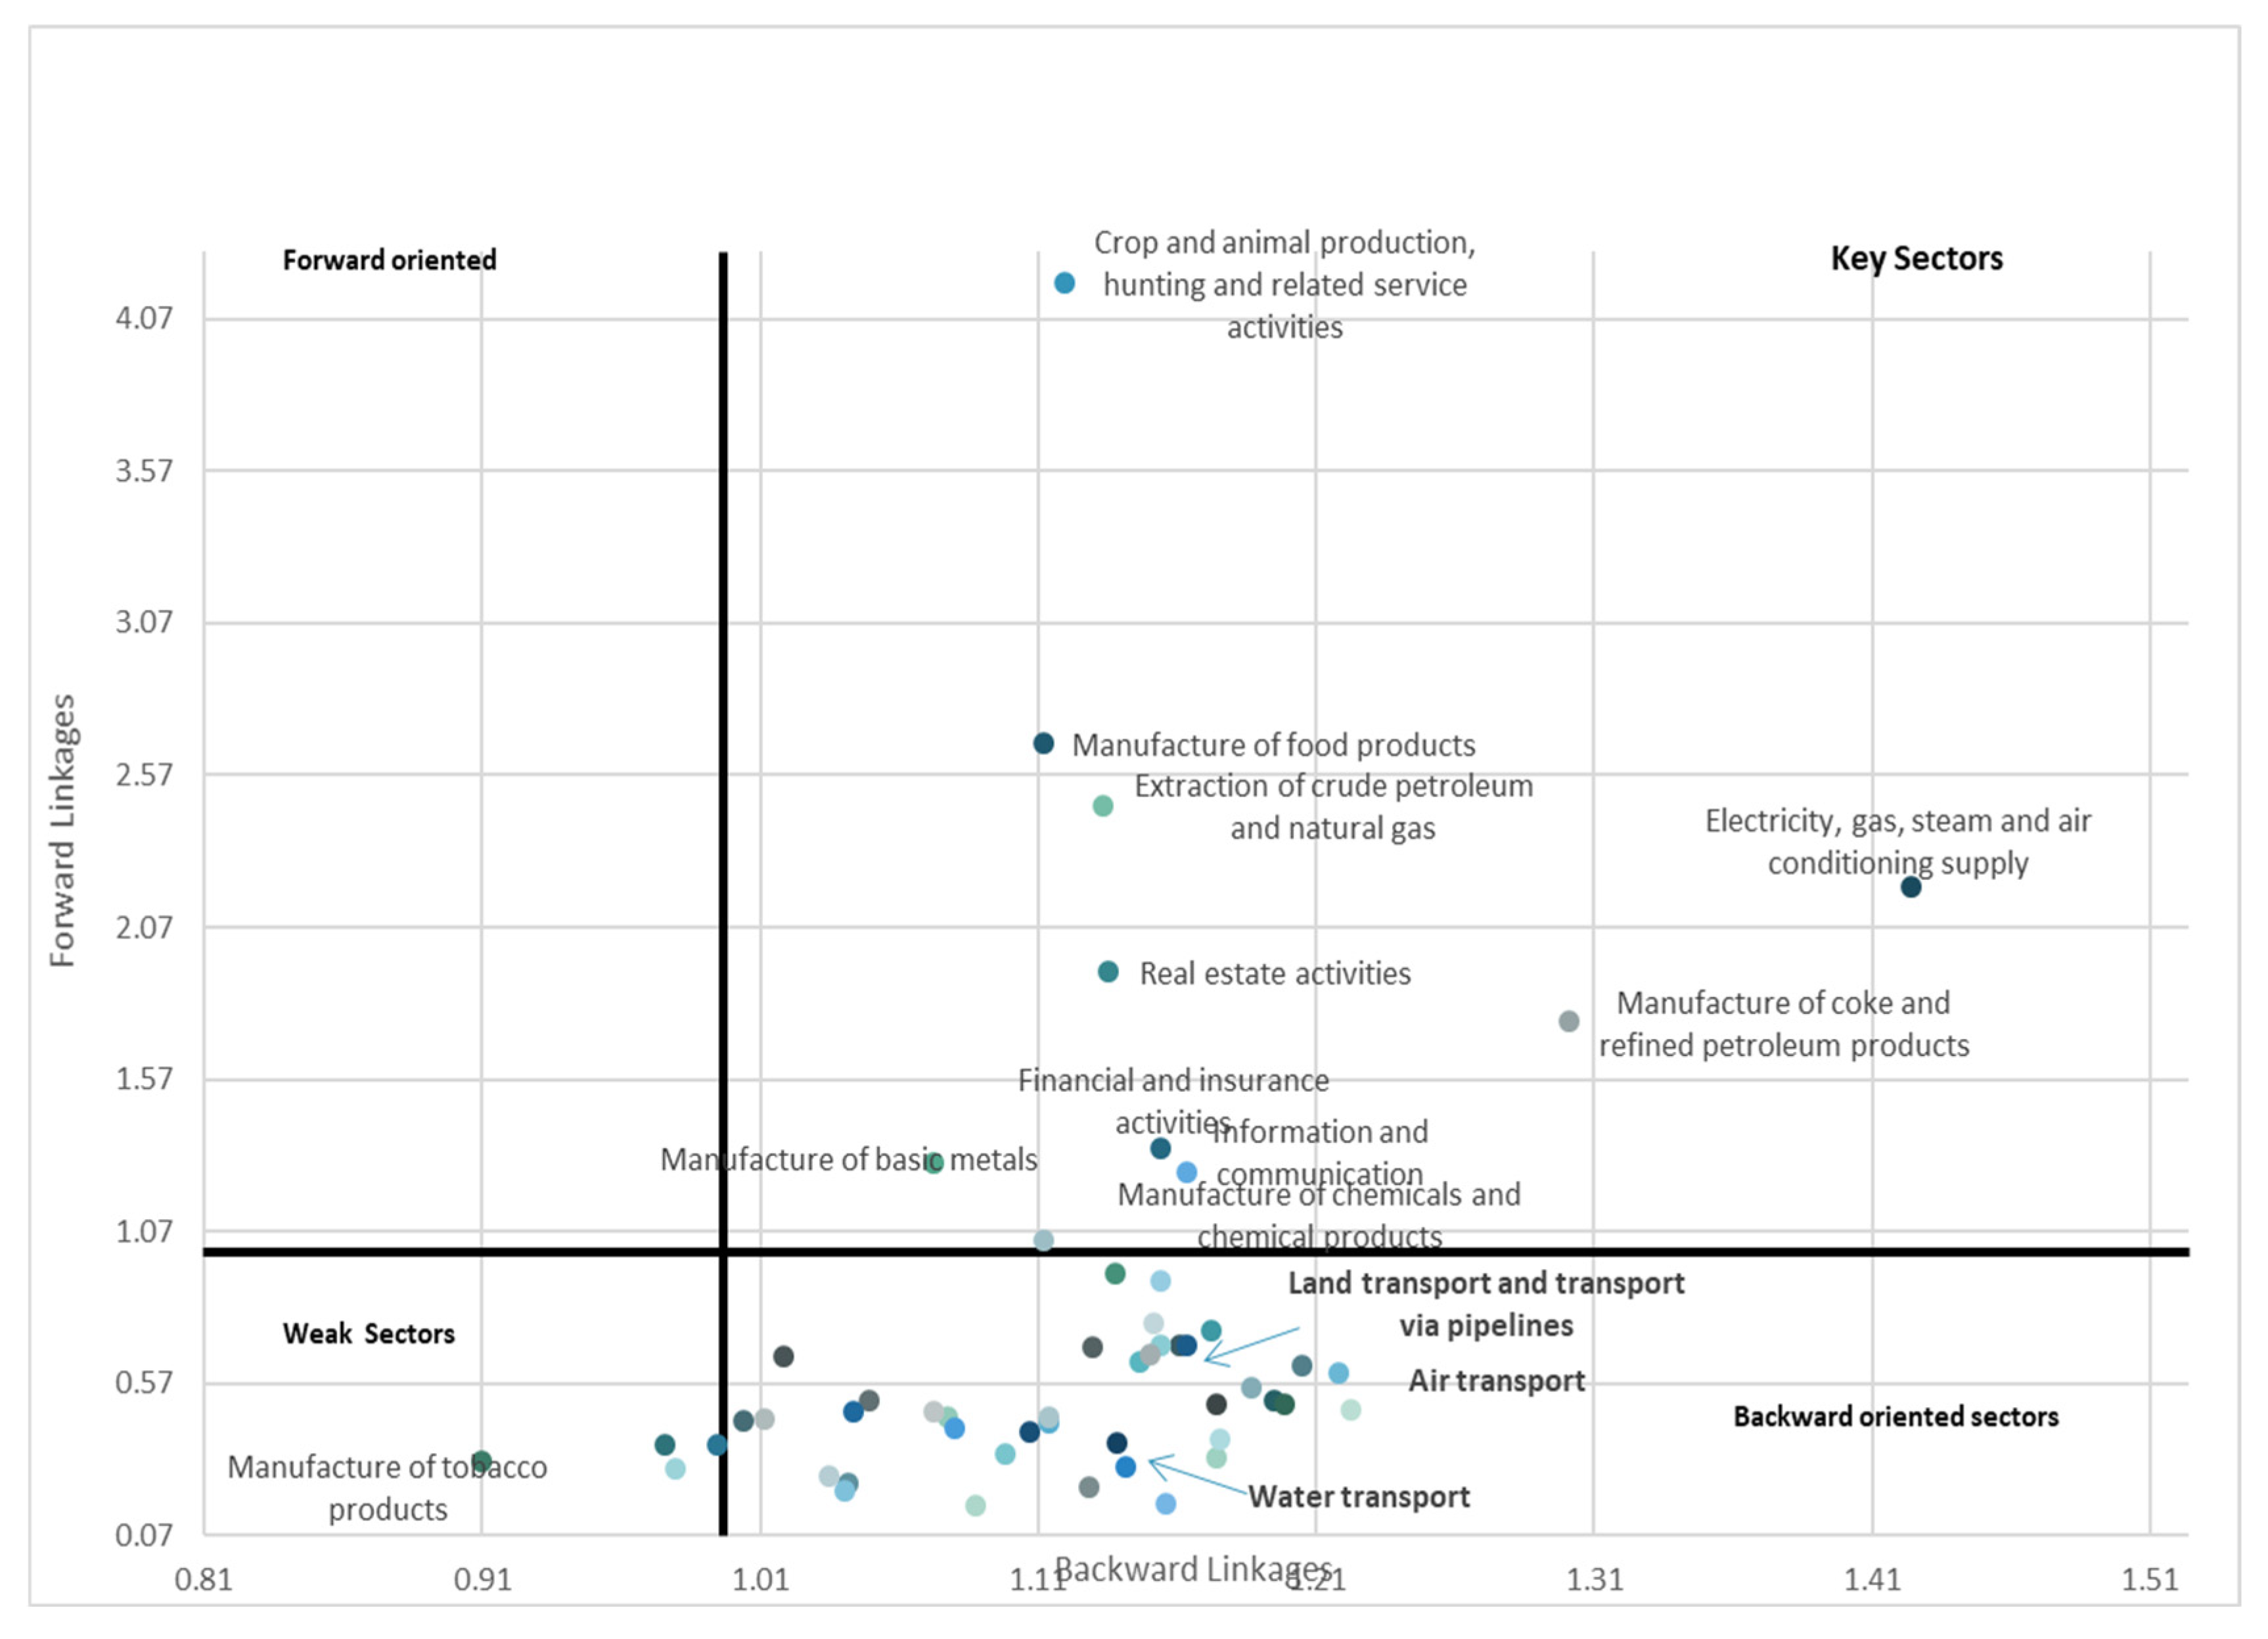
The results for backward and forward linkages are presented in Figure 1. In order to not overcrowd the graph, only key sectors and transport-related sectors are shown. All industries in the figure are classified into four quadrants based on their forward and backward linkage values. Sectors that stand out as key to backward and forward dependence are agriculture and forestry, electricity and gas supply, manufacturing of food and coke, manufacturing of chemicals and chemical products and refined petroleum products, extraction of crude petroleum and natural gas, financial and insurance activities, and information and communications. These sectors seem to be good candidates for promoting broad-based economic growth in Egypt, as they exhibit healthy interdependence with the rest of the economy.
Moreover, the results suggest that backward linkages are particularly strong for air transport (1.2) relative to other modes of transport (1.14 for water transport and 1.16 for land transport and transport via pipelines). This strong backward linkage implies that air transport is a relatively large local multiplier as a purchaser of raw materials and factor inputs. For instance, the airline industry purchases domestically produced and imported goods and services from other firms, including fuel, catering, repair and maintenance, ticketing and distribution from travel agents, freight forwarding, aircraft financing, cleaning services, and other ground handling services.
Despite its relatively strong backward linkages, air transport in Egypt is not a key sector owing to its weak forward linkages (0.6): The Egyptian air transport sector sells less of its output to downstream industries than other sectors. The low value of the forward linkage coefficient for air transport suggests that a large part of its output is destined for final demand purposes and is not primarily used as an input into production.
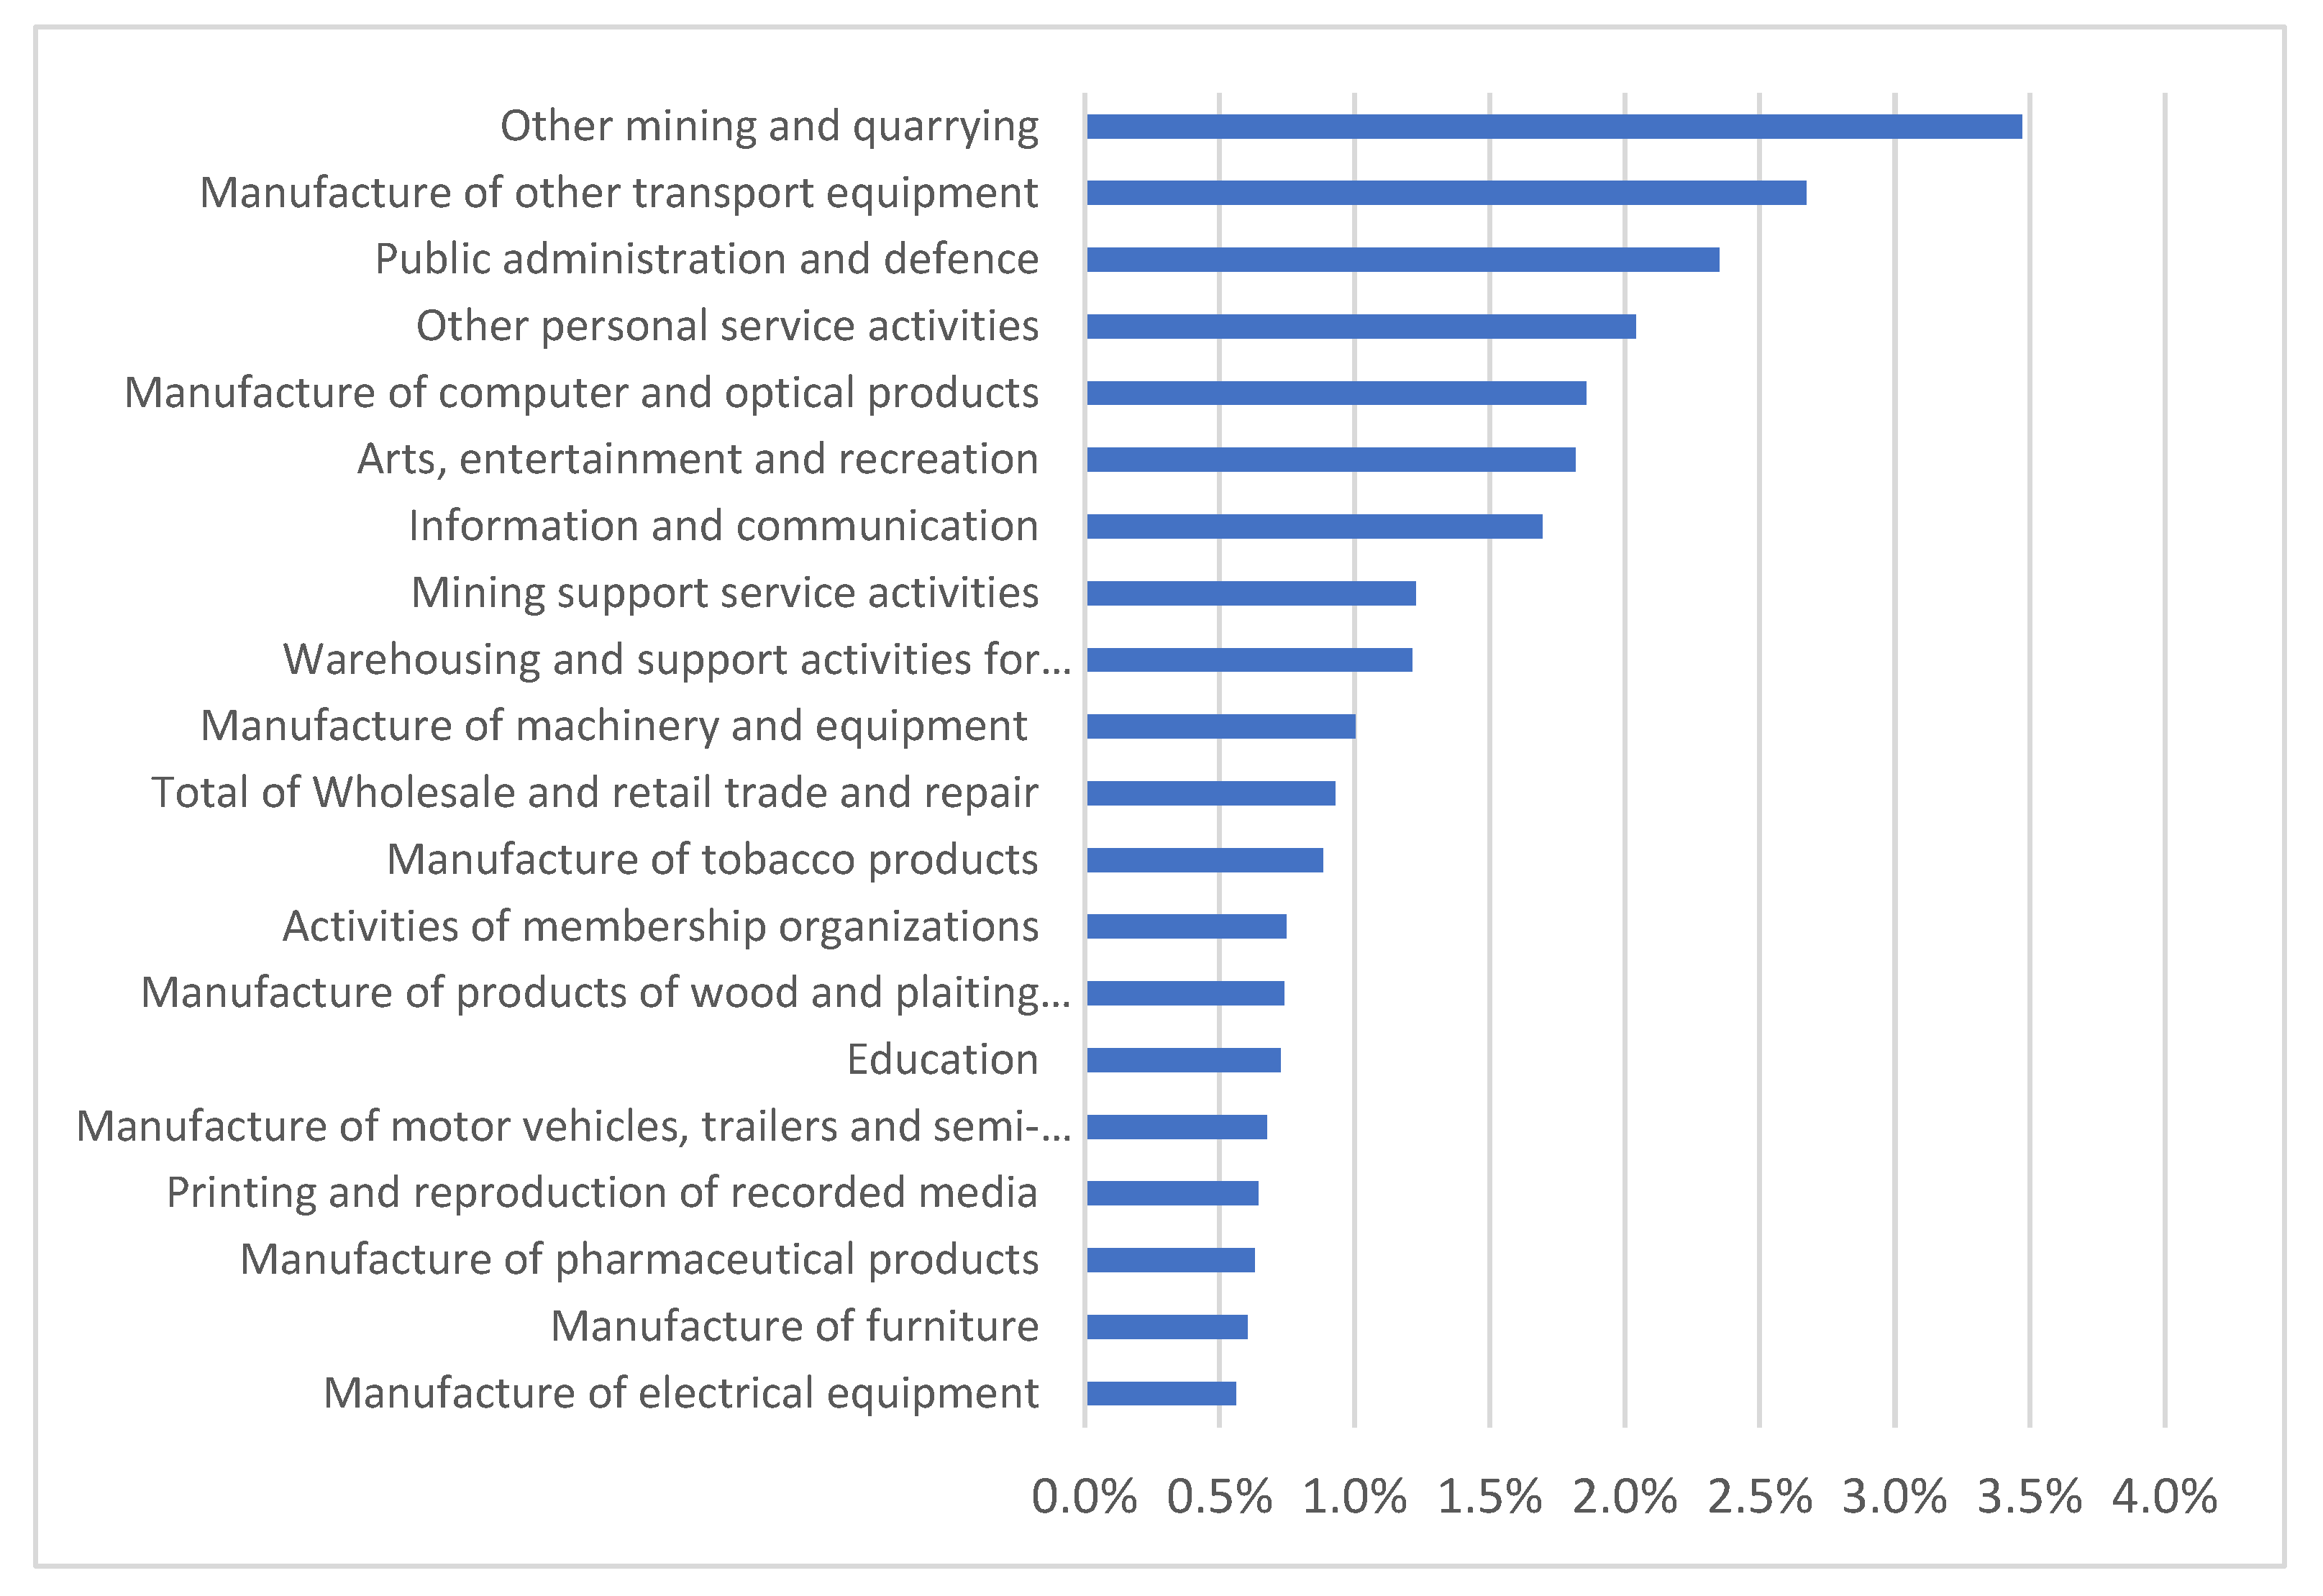
As illustrated in Figure 2, air transport plays a significant role in relatively few sectors in Egypt in terms of intermediate use. The figure shows that the mining and quarrying sector, manufacturing of transport equipment, and public administration and defence are the top intermediate users of air transport, accounting, respectively, for 3.5%, 2.7%, and 2.5% of total intermediate commodity use in 2010–2011 (see Supplementary Materials for further details on backward forward linkages). Stilwell [75] similarly reported that in the USA, there is weaker evidence of the use of air transportation as an intermediate component of production than initially hypothesised regarding the sector’s role in supporting productivity growth.
Moreover, a comparison of sectors’ expenditure on air transport services as a share of their total spending on transport services revealed that mining and quarrying, manufacturing, wholesale and retail trade, and information and telecommunications are intensive users of air transport services within their transport budgets. Thus, there is a strong relationship between the Egyptian air transport and mining industries (Figure 2). In the mining and quarrying industry, Fly-in fly-out (FIFO) is very widely used, as mines are mostly located in remote areas and are often at a distance from existing communities [76]. The mining employees are often flown to the worksites, where they work for several days and are then flown back to their hometowns for their days of rest. Pham et al. [77] stressed that mining growth resulted in increased demand for air transport as the mining industry brought workers from outside regions to the mining areas. Furthermore, they empirically proved that total tourism demand would increase, on an annual average, by 0.07 percentage points in response to FIFO demand for air transport and accommodation services.
The air transport sector’s weak forward linkages imply that its potential role in fostering broad-based economic growth in Egypt may be limited. Forward linkages refer to the part of the Egyptian sector that uses air transport output as an input. The distribution and processing of air transport outputs are fundamental components of forward linkages. For instance, airlines sell their final products, consisting mainly of seats and freight transport, directly via the internet or indirectly through travel agents and freight agents to consumers and firms. The weak forward linkages may be attributable to the fact that air transport outputs do not require processing before they can be sold, so no significant value is added through processing. Moreover, ownership is often seen as a factor that may influence the breadth and depth of linkages. Sub-sectors such as aerospace companies, aircraft manufacturers, airport constructors, travel agents, and global distribution systems that support aviation are often foreign-owned and are rarely based in developing countries, leading to weaker linkages.
4.2. CGE Results
4.2.1. Policy Simulation
In this model, public capital investment in air transport infrastructure was shocked sequentially at a consistent percentage level of change, namely, 10% each year from 2011 to 2030 (or 0.03% of the country’s GDP each time and 0.6% over the whole period), assuming that the investment was financed by international borrowing. Air transport infrastructure includes airport infrastructure such as runways and terminals, air traffic control (ATC) centres, and organisations involved in coordinating their provision and use, such as computer systems, maintenance facilities, and offices [78]. The investment scenario was compared to the business-as-usual scenario (BAU), i.e., with no investment. We present short-term (one year after the implementation of the investment plan, or 2012), medium-term (10 years after the implementation), and long-term (2030) results, with the latter representing the period defined in the government’s “Sustainable Development Strategy (SDS): Egypt Vision 2030” [79].
Macroeconomic Results
The impacts of public air capital expansion on macroeconomic variables such as employment, GDP, and trade are presented in Table 1.
Compared to the BAU, the macroeconomic results indicate that a 10% increase in public capital inputs into air transportation would increase value-added GDP (i.e., the difference between the value of gross outputs and the value of all intermediate consumption) by 0.064% relative to its baseline value in the first period; by 0.073% and 0.067% in periods 10 and 20, respectively; and by 1.388% over the entire period. GDP growth can be explained by several factors, including improved integration of production areas and markets and structural changes brought about by lower transport costs, time savings, and the resulting higher productivity. Welfare, as measured by equivalent variation, increased cumulatively by 19.439%. Moreover, expanding the air transport sector had both demand- and supply-side effects. On the demand side, investment increased public spending, which led to an increase in aggregate output (105.897% over the entire period, 6.130% in the short term, and 5.191% in the long run), which drove up income. On the supply side, expansion reduced production costs, facilitated the integration of production areas and markets into the broader economy, and increased efficiency and productivity.
There was an exchange appreciation in the short and medium term, accumulating to 0.894%. The increase was higher in the first period (0.072%) compared to the medium- (0.052%) and long-term (0.000%) effects. Despite real exchange rate appreciation, exports would increase by 1.254% in period 1, 1.370% in period 10, and 1.718% in period 20. Investment in air transport would generate changes in the growth rate of imports, which would grow by 0.036%, 0.150%, and 0.041% in periods 1, 10, and 20, respectively.
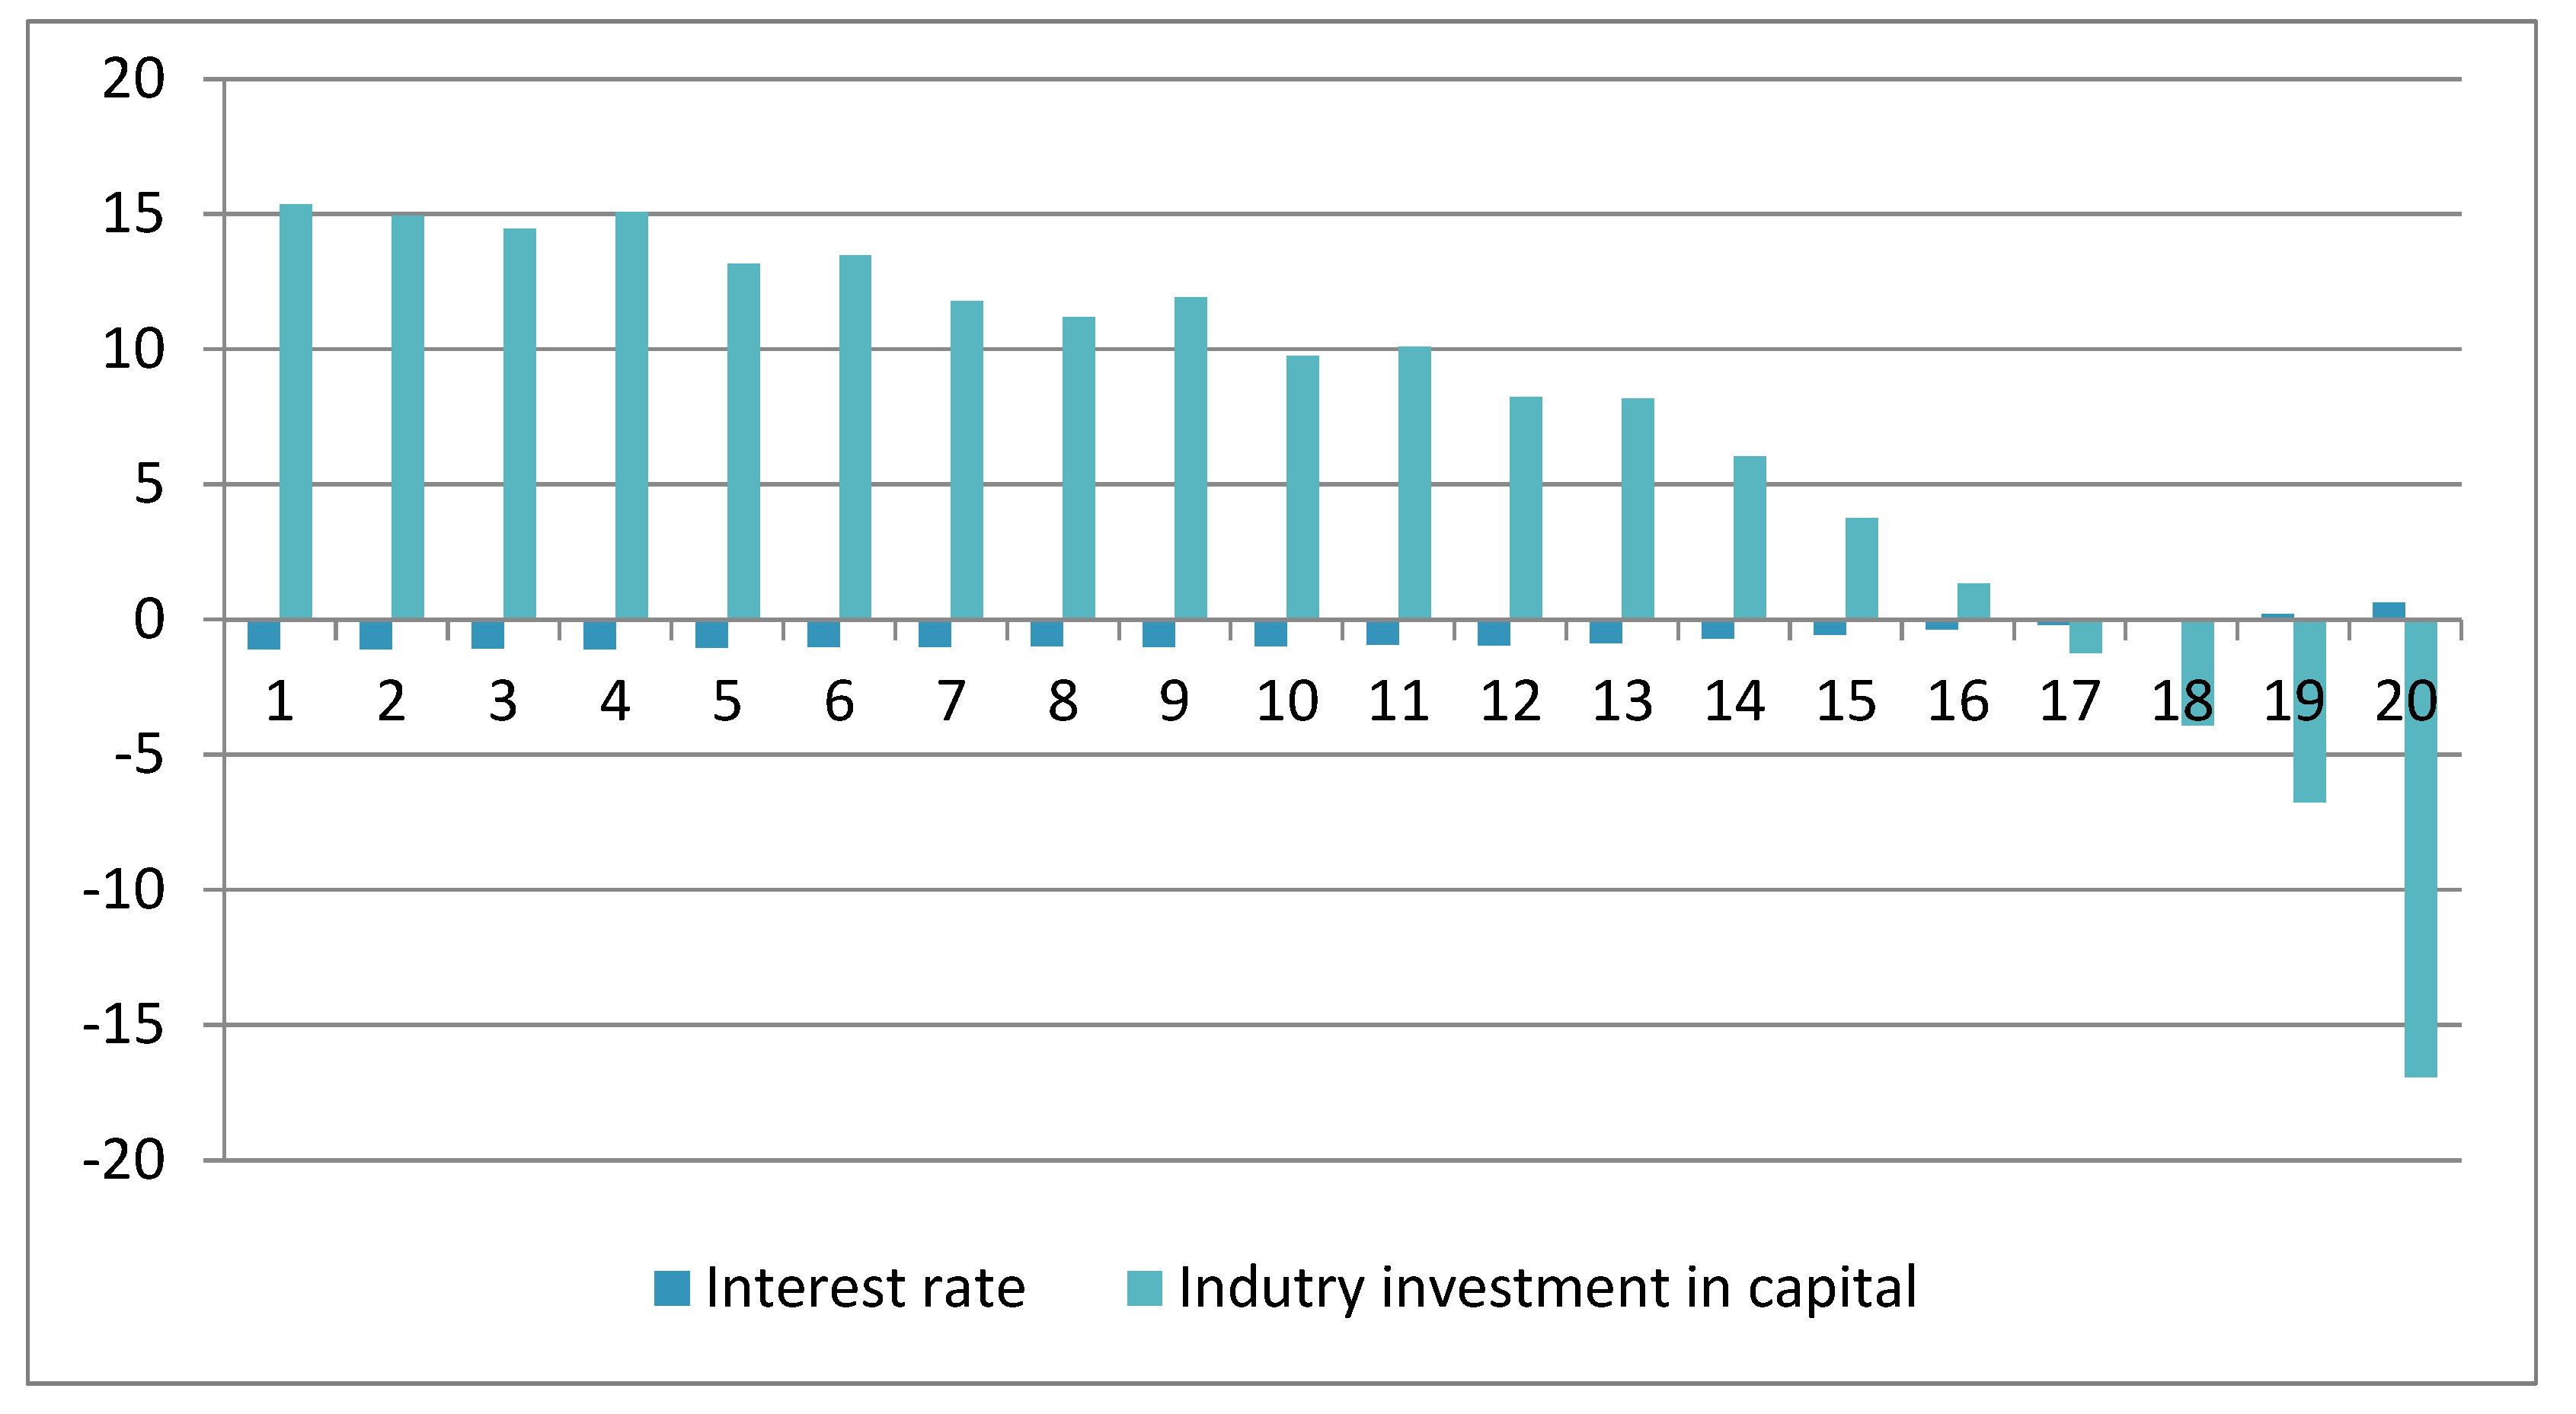
The impacts of the expansion on employment were relatively small compared to capital demand. Egyptian national aggregate labour demand would increase cumulatively by 22.083% relative to its baseline value (Table 1). Aggregate demand for capital would increase by 65.510% over the entire period. Figure 3 further shows the effects of expanding the sector on industry demand for capital and interest rate. The demand for capital for investment purposes increased in the short and medium term and decreased in the long run, whereas the interest rate moved in the opposite direction. Note that despite the rapid increase in public investment compared to private investment (Table 1), crowding-out effects were less likely to be observed, at least in the short and medium term, since the interest rate fell and total economic activity was stimulated. However, the increase in the interest rate in the long run and the corresponding decrease in investment may have crowded out private expenditures.
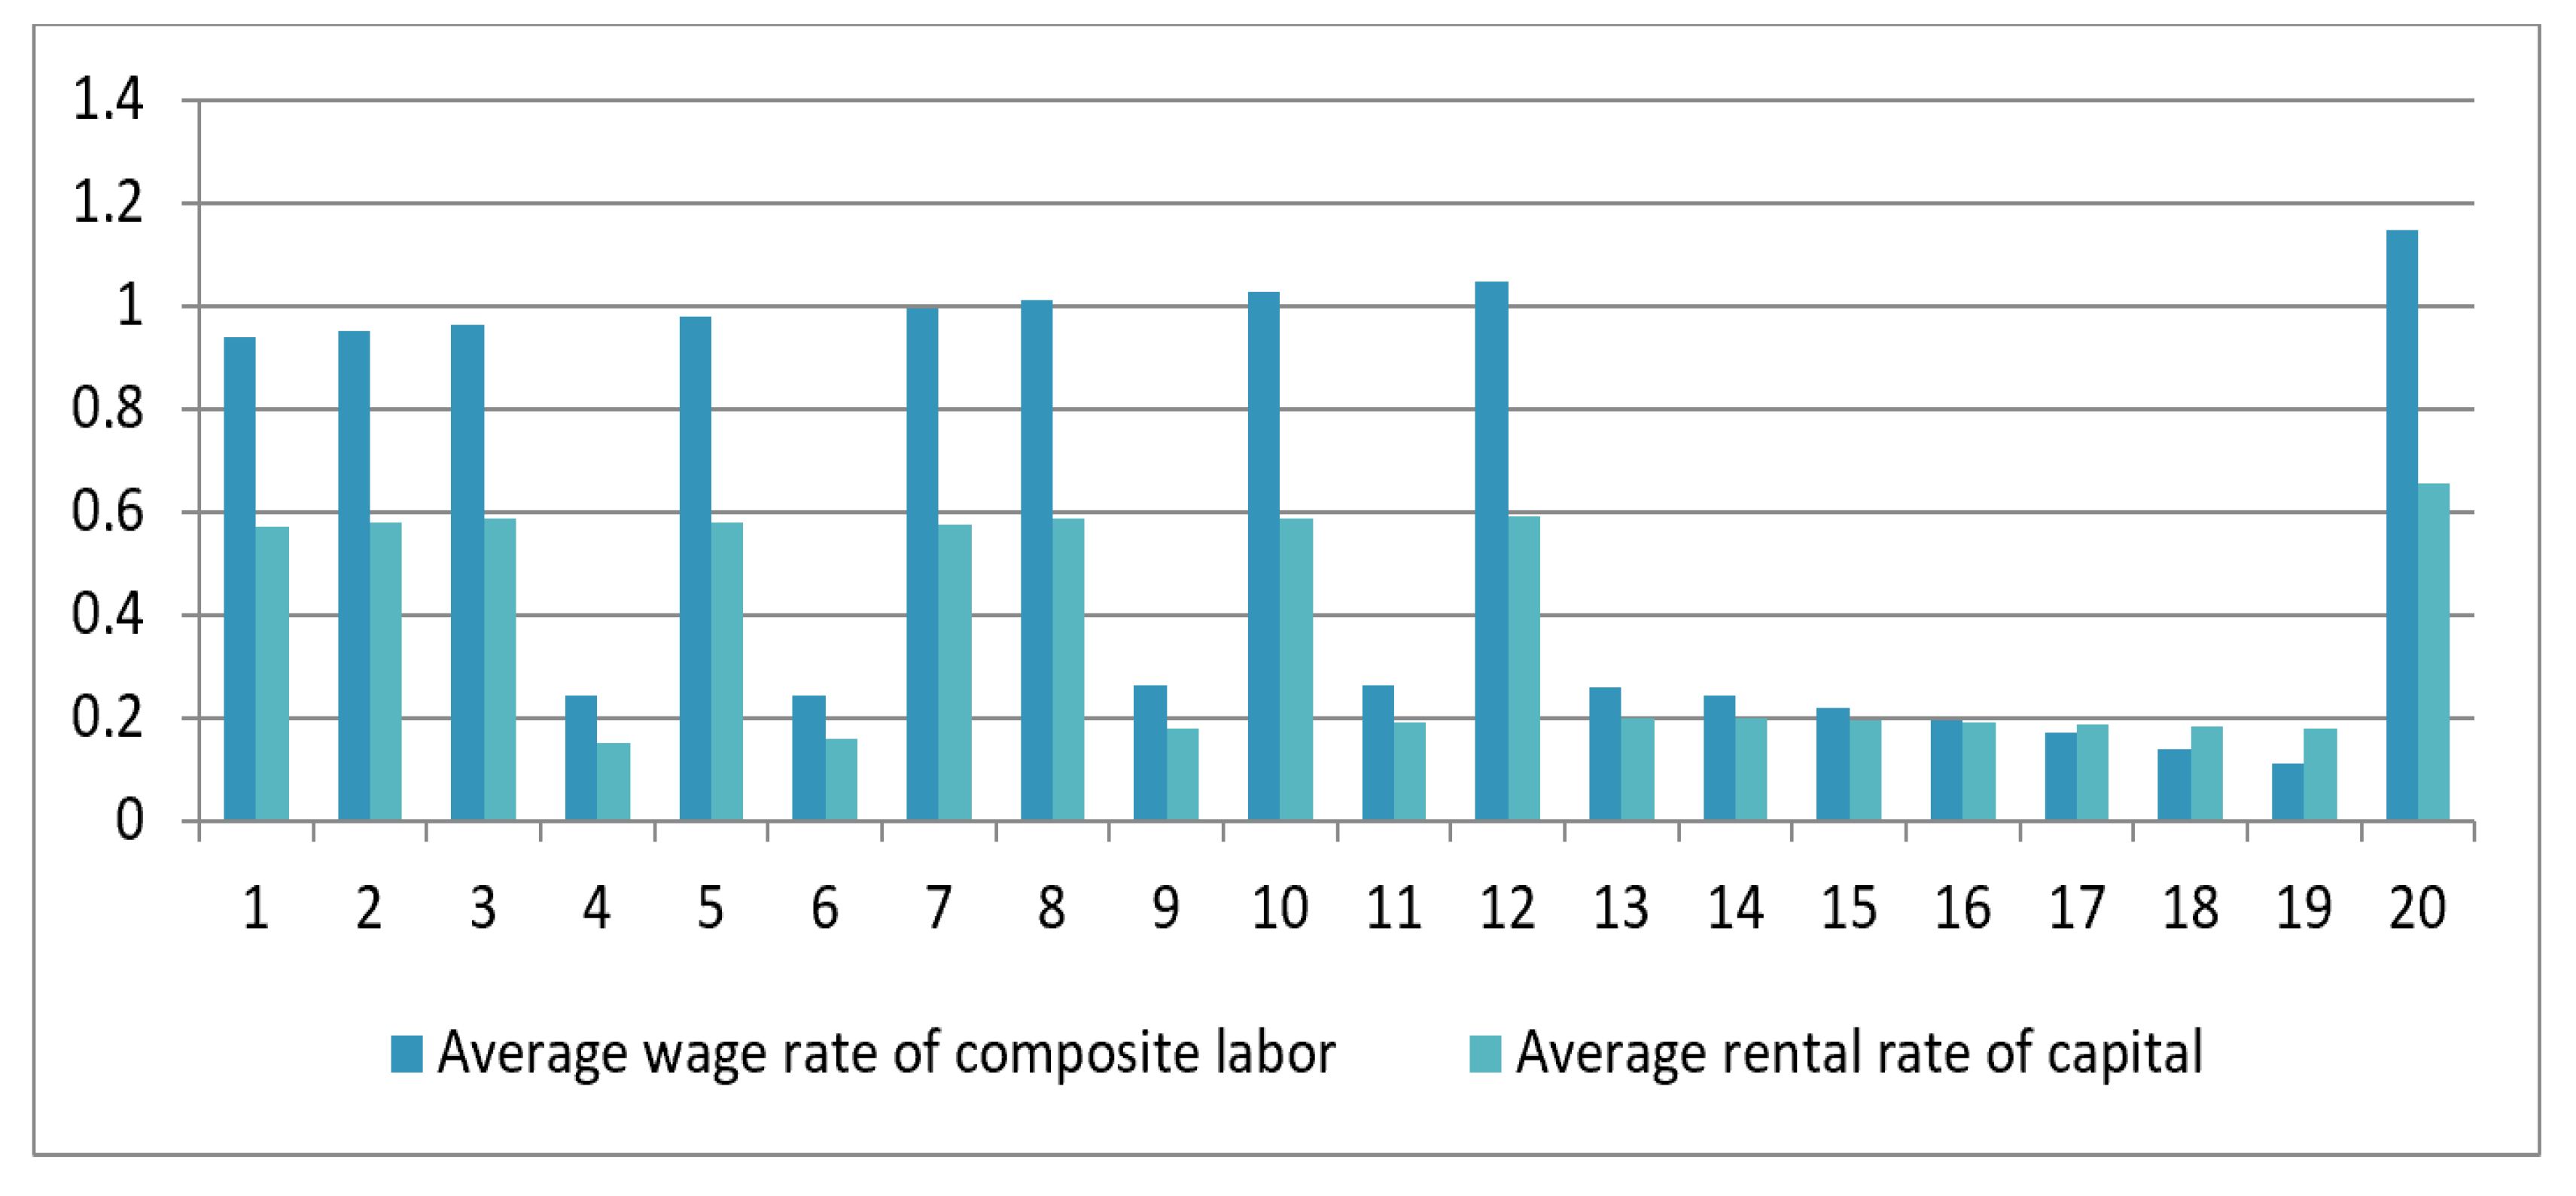
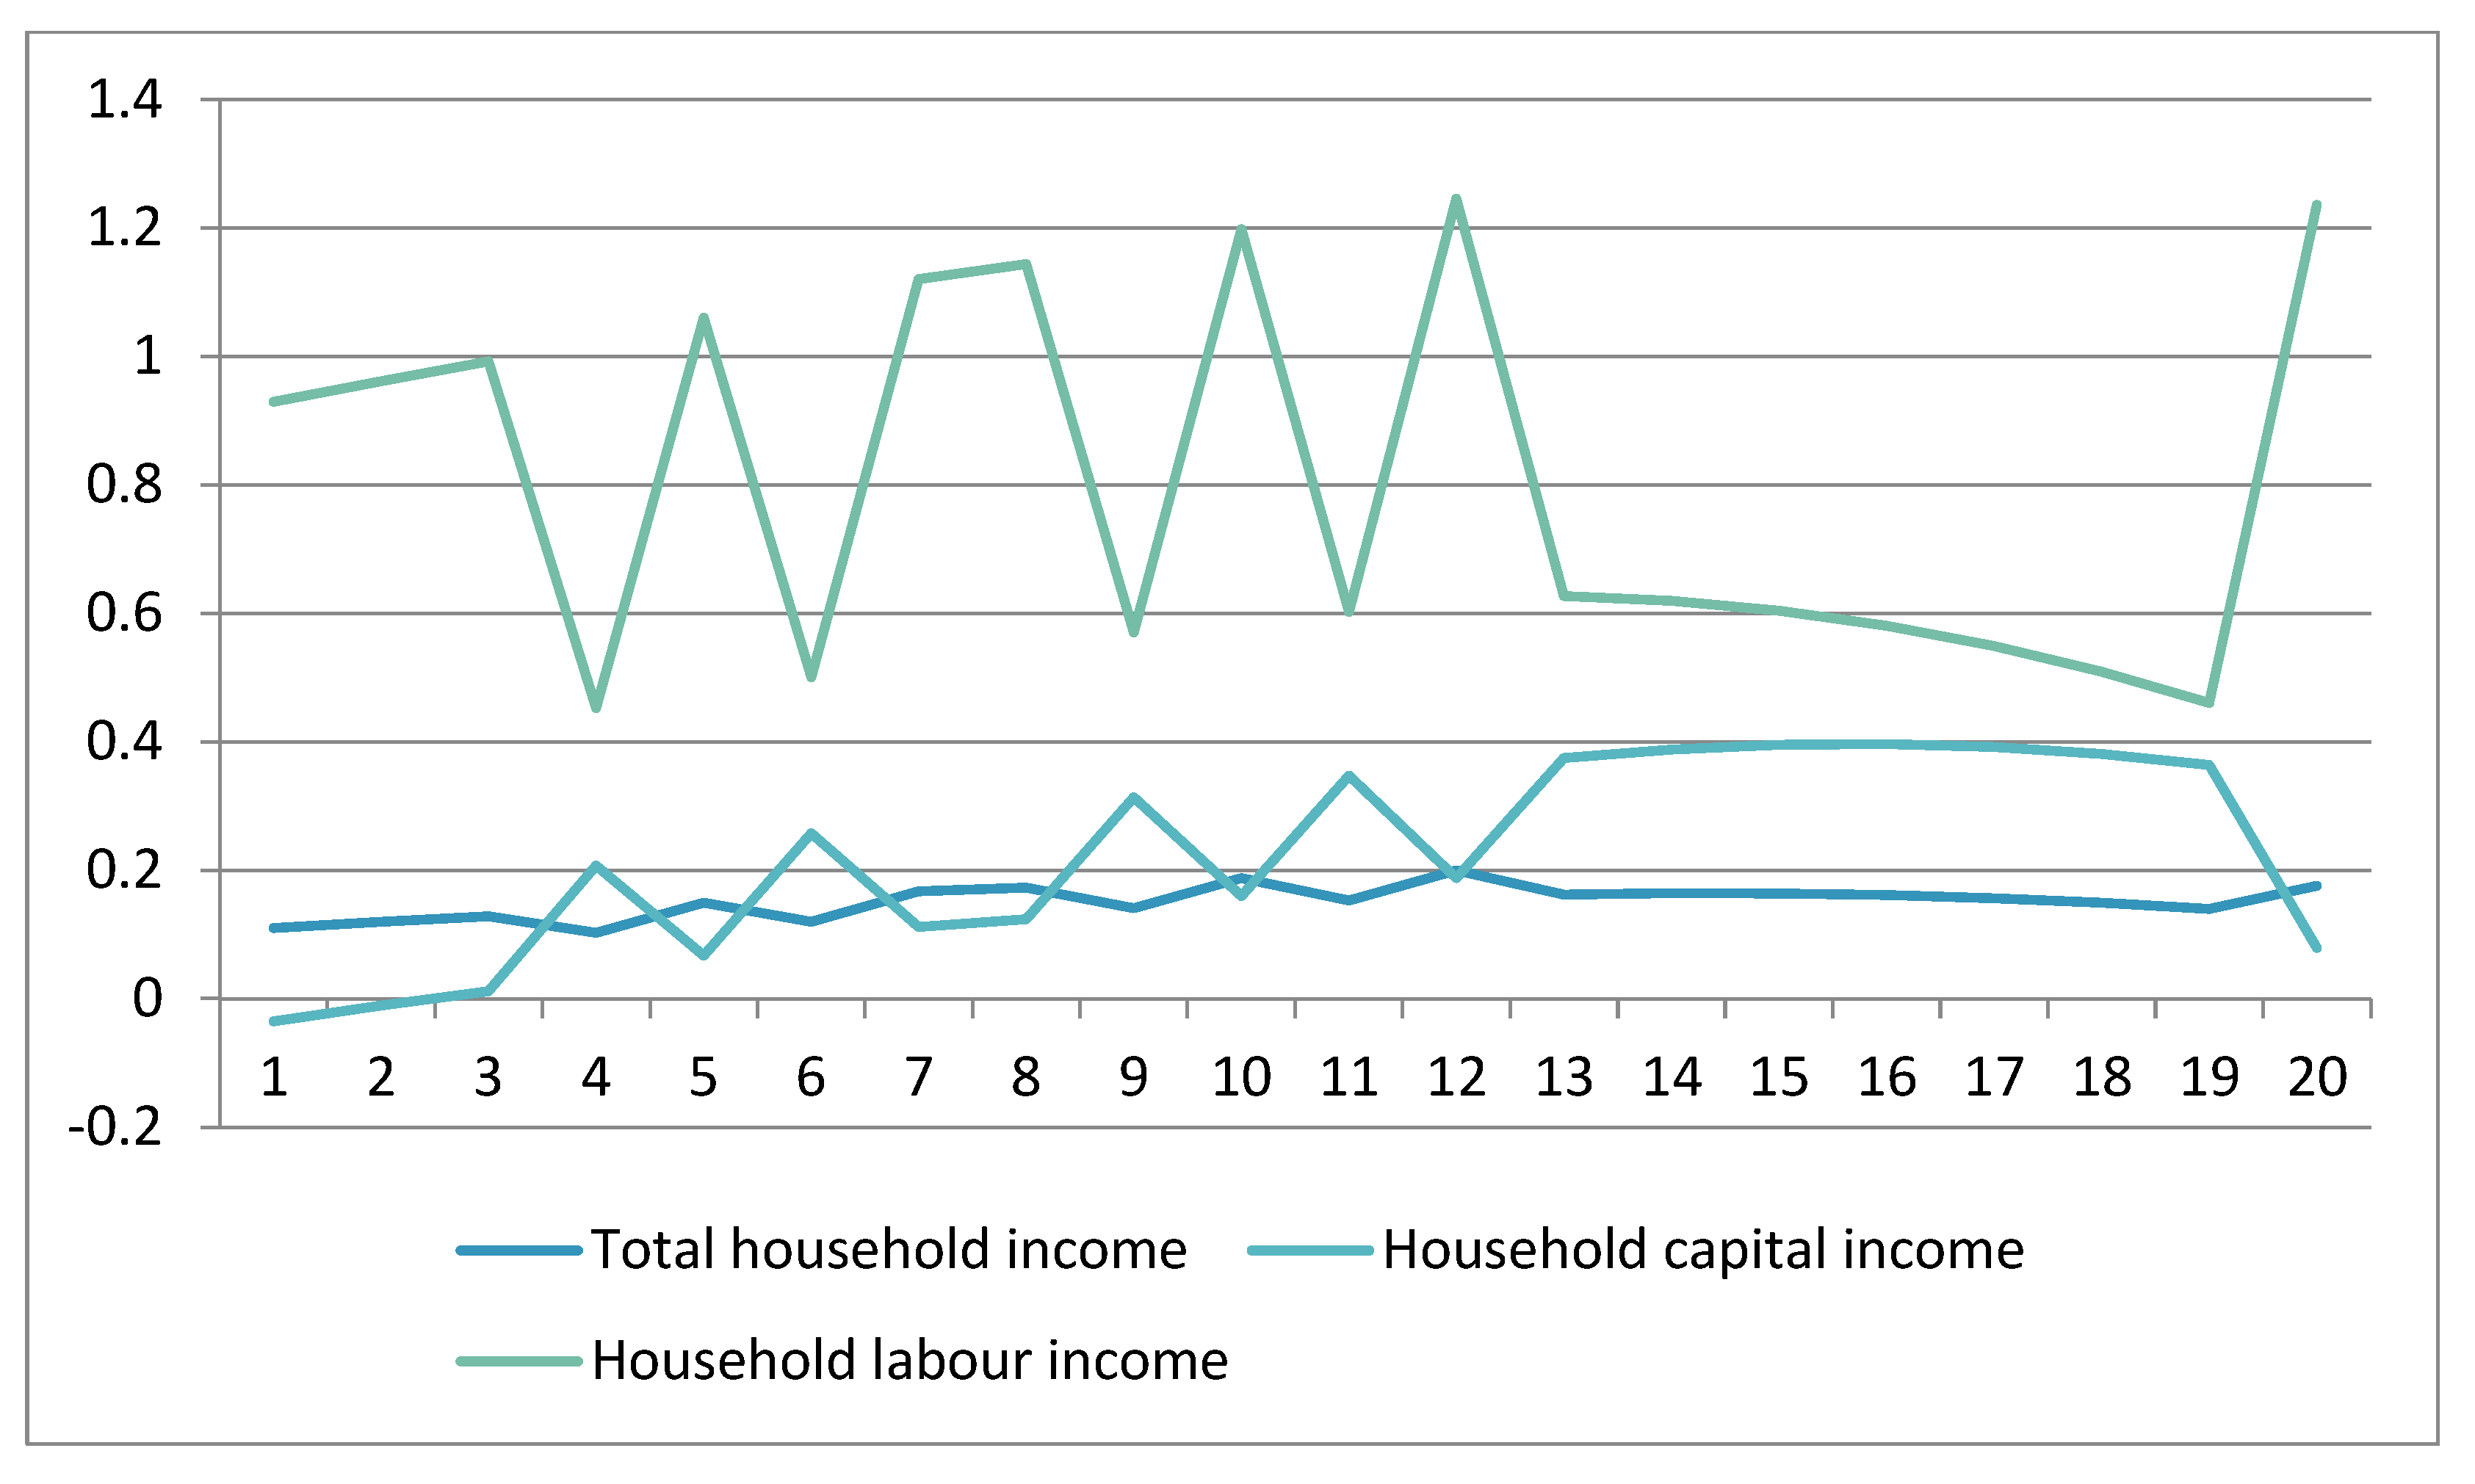
Expanding the sector would lead to an increase in fixed and variable factors of production—intermediate commodities, and labour and capital. The results reveal that an increase in the stock of air capital would lead to a decrease in the rental rate of capital in air transport relative to the price of labour. This would result in a decrease in demand for labour in the air transport sector, which in turn would depend on the degree of substitution between labour and capital. However, since capital is less abundant in other sectors, the rates of return in those industries would increase. Furthermore, the aggregate demand for labour would grow over the entire period owing to growth in outputs and the fixed level of capital stock in other sectors. Since labour supply is fixed in the short run but flexible in the long run, wages would increase in the short term and decrease in the long run. The increase in wages would result in a decline in labour demand, which would decrease by –0.946% in the first period and –0.587% in period 10. Overall, the aggregate wage rate and aggregate rental rate of capital would increase (Figure 4). The increased demand for variable factors would increase payments of labour and capital income to households (Figure 4), leading in turn to a rise in household consumption, as shown in Table 1. Thus, the expansion would increase total consumption by households in 2030 by 3.023% relative to the baseline value. Figure 4 illustrates changes in household consumption, household labour, and capital income. As a result of increased factor returns (Figure 5), incomes from both wage and capital returns experienced increases in their base values. Labour income increased strongly and faster than capital income, which, as shown above, may reflect the abundance of capital relative to labour. Thus, as a result of air capital expansion, the air transport sector would experience strong expansion in its output, and since labour is fixed in that sector, its rate of return would increase. According to Egypt SAM, the capital/labour ratio in Egypt’s air transport sector is 3.44, meaning that the sector uses 3.44 units of capital per unit of labour.
4.2.2. Sectoral Impacts
The results for sectoral impacts show that outputs, investment, domestic demand, household consumption, and intermediate and labour demand in all industries would increase relative to baseline levels in all periods (Table 2).
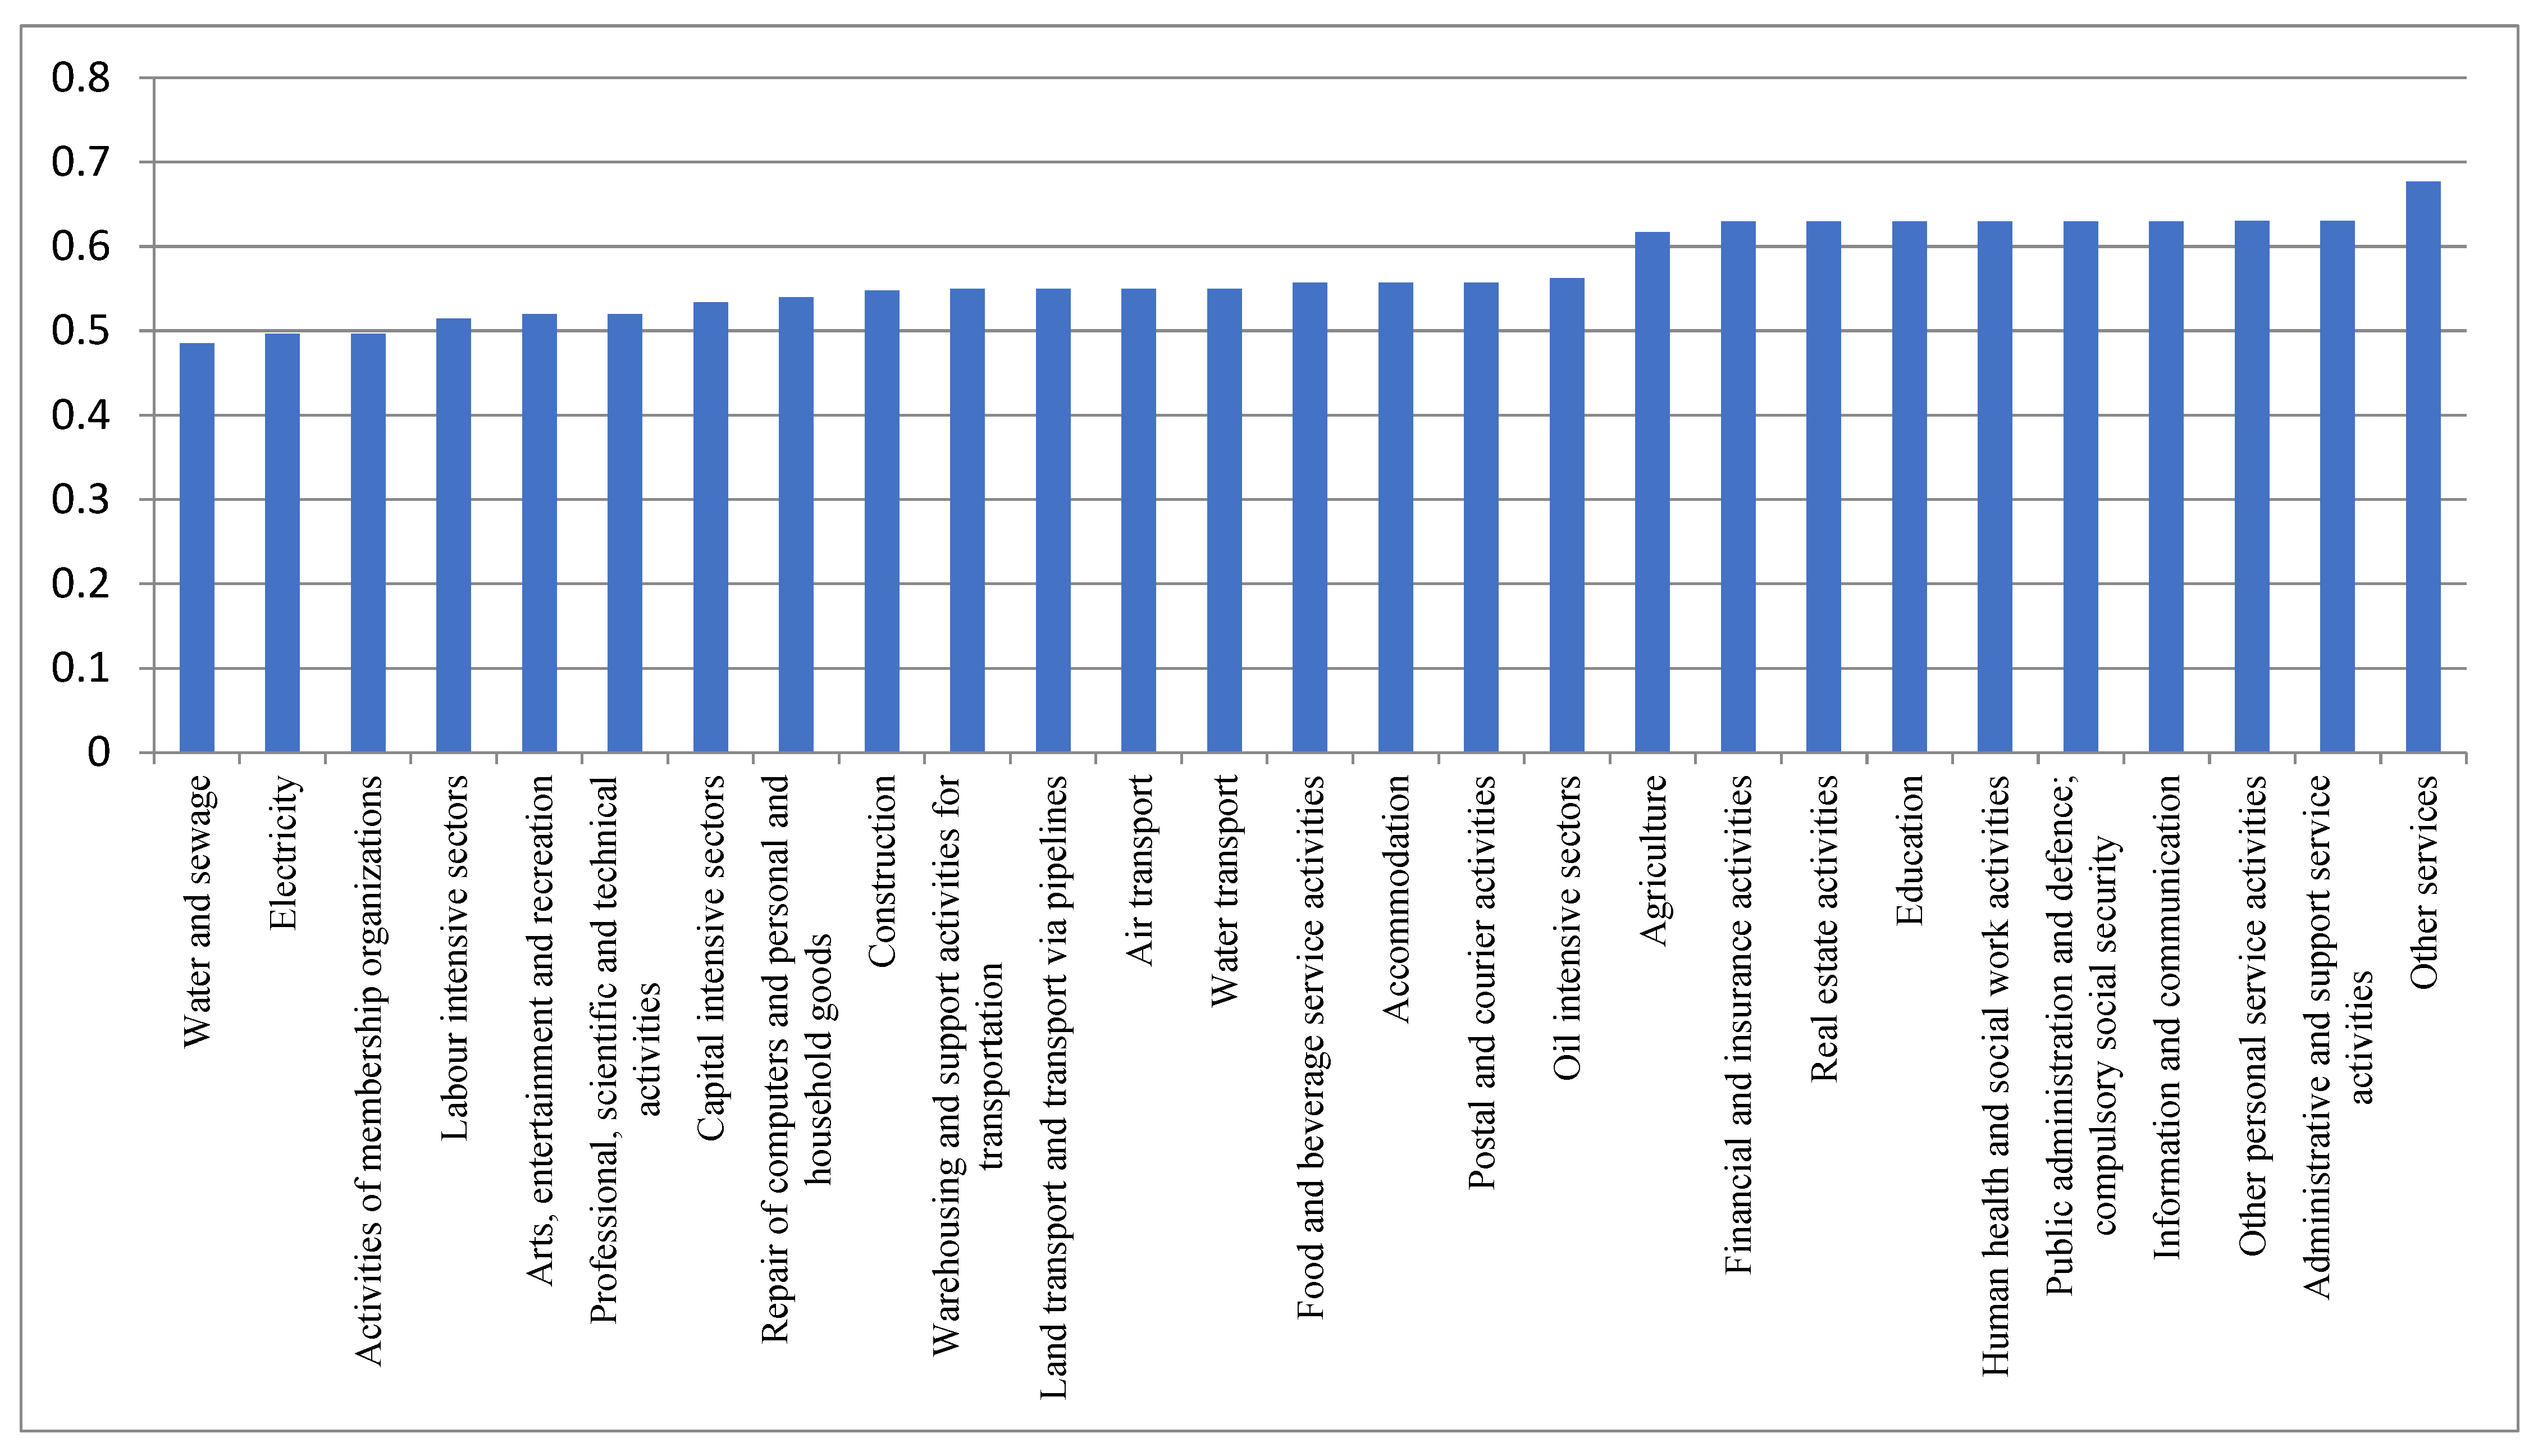
The most favourably affected sectors would be air transport-intensive industries (i.e., services, information and telecommunications, financial and insurance activities, public administration and defence, accommodation, and food and beverage services activities, as shown in Figure 6). Figure 7 shows that the wage rate in those sectors would increase faster compared to the wage rate in other sectors. The rise in wage rate would lead to a reduction in labour demand and an increase in labour productivity and output. Air transport prices would decline on average in the short and medium terms (Table 2), acting as a subsidy for these sectors, but would increase in the long run, which may be attributed to the increase in factor returns, a rapid increase in income relative to GDP, and the resulting increase demand. The increase in air transport infrastructure would increase intermediate input demand from most sectors, stimulating production and imports of these inputs.
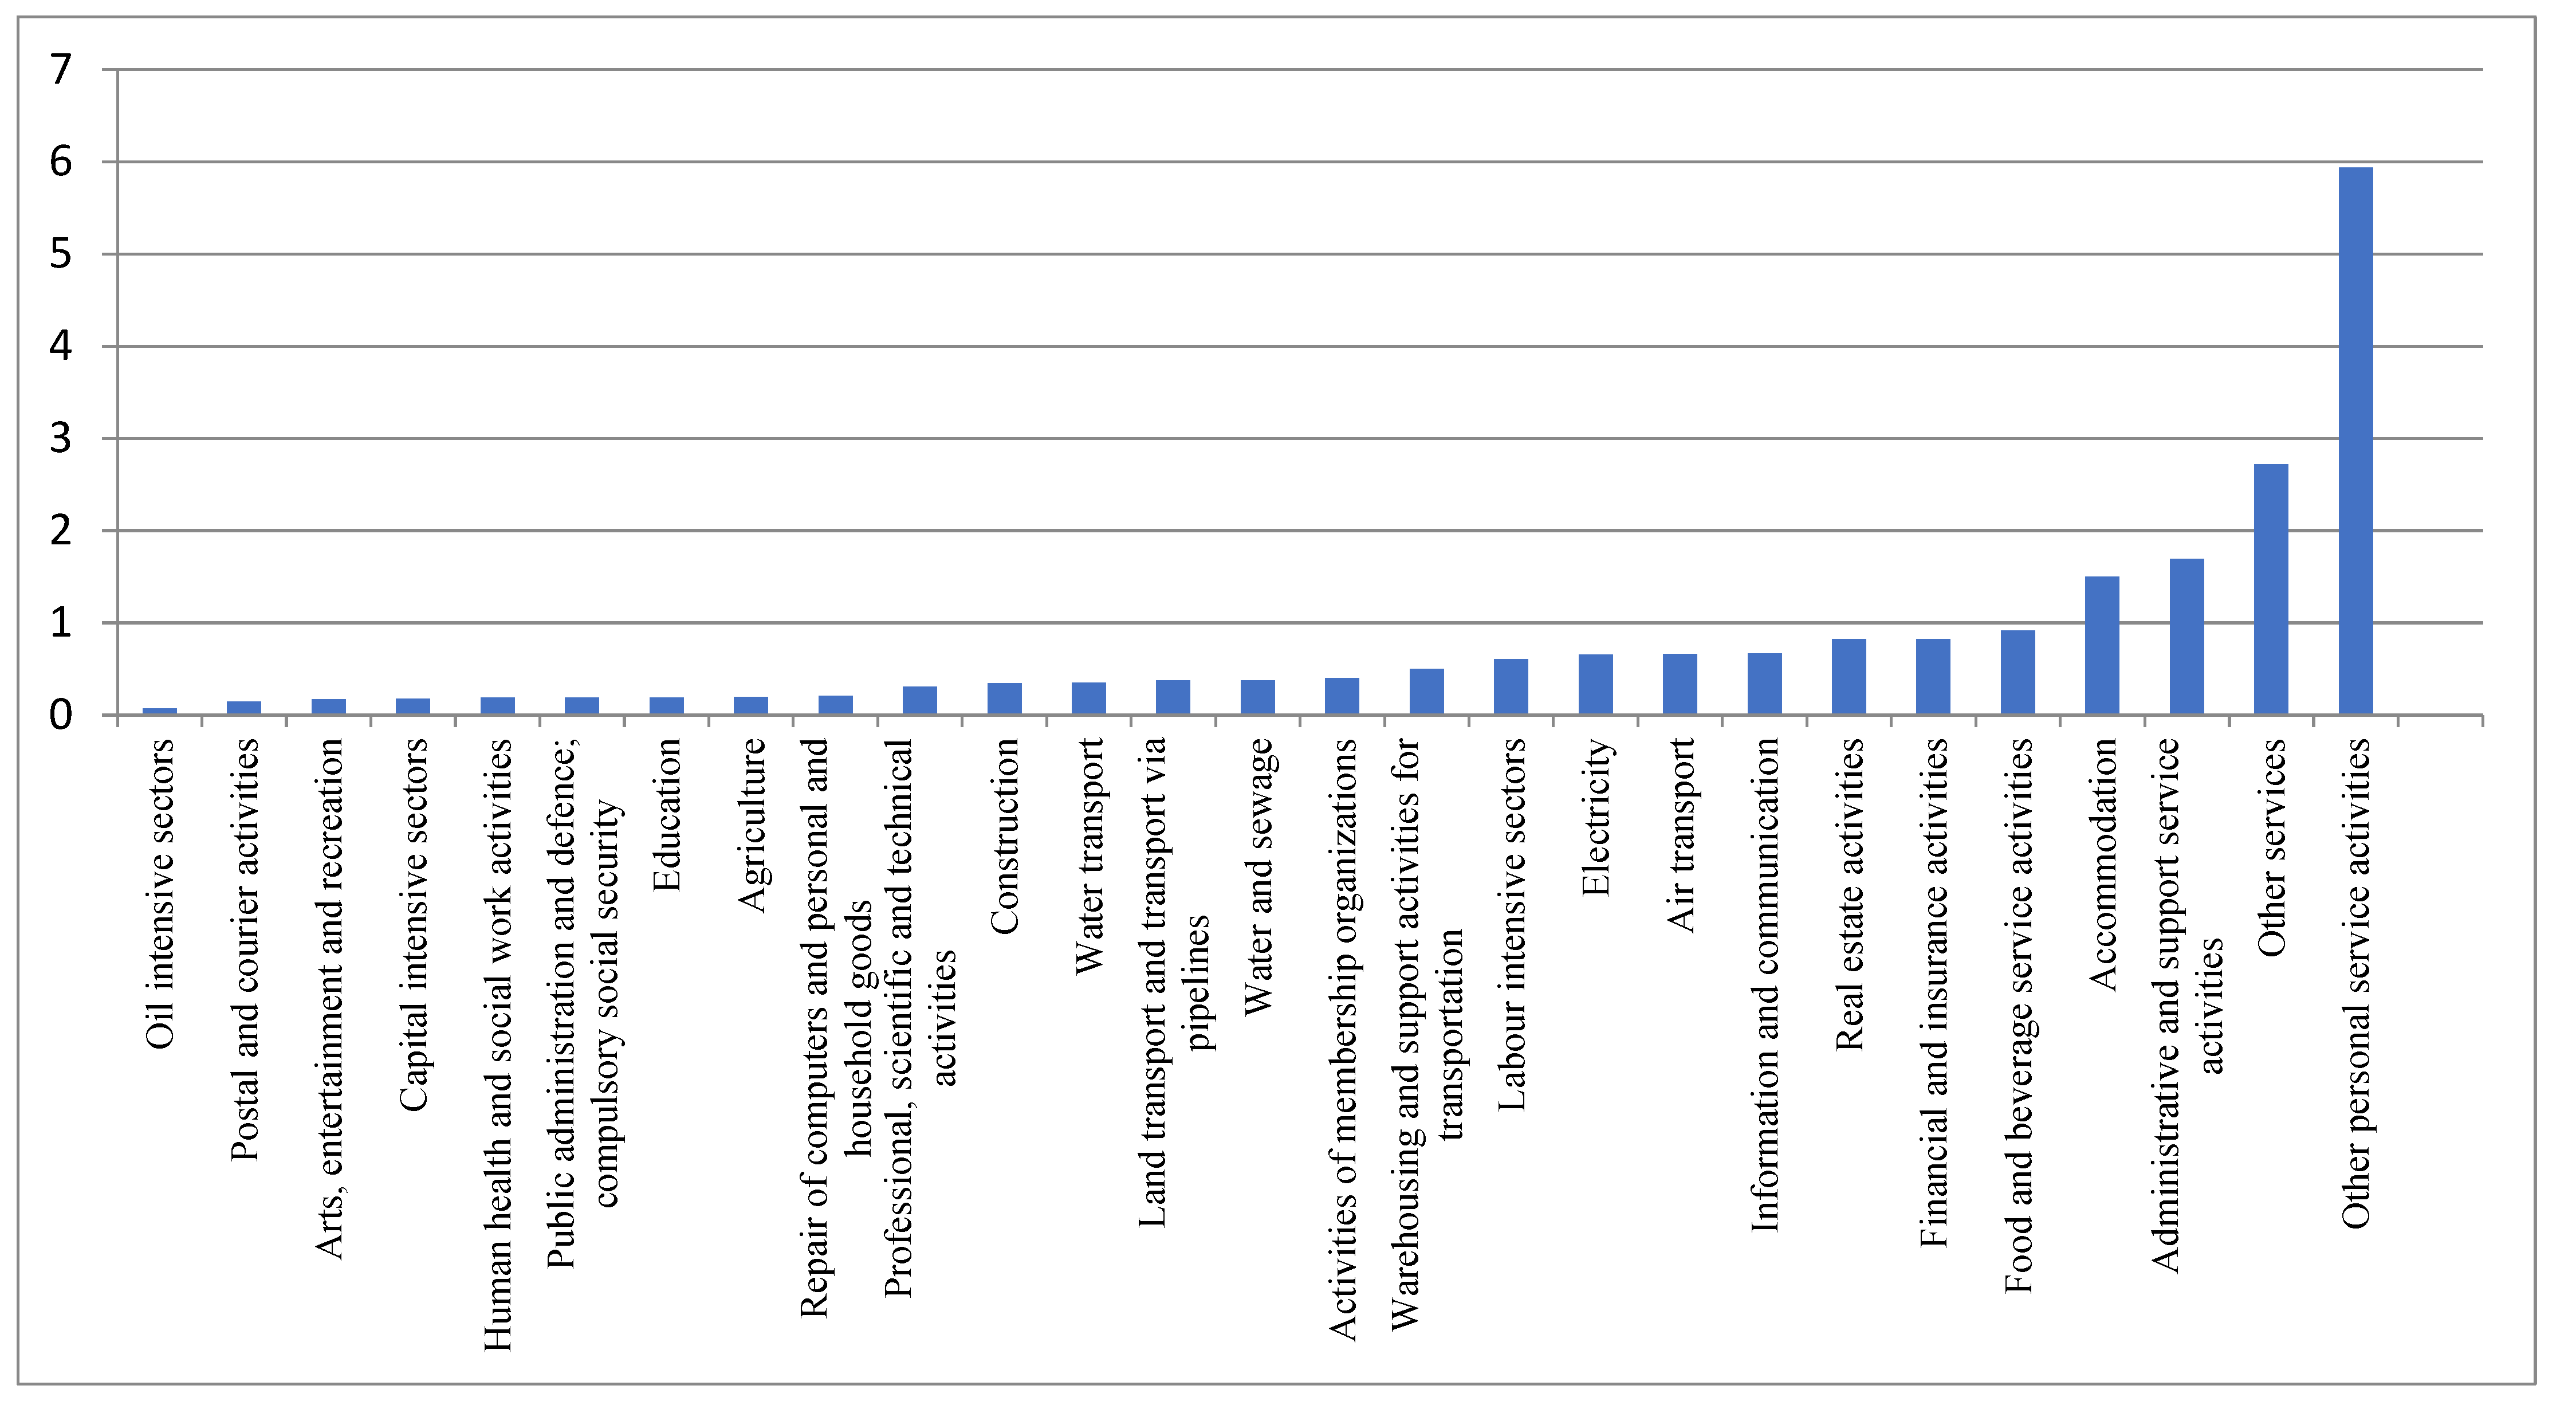
With expanded air transport infrastructure in place, demand for labour would increase in most sectors, and the air transport sector would experience the highest increase of 9.136% over the entire period. The expanded air transport infrastructure would have the biggest influence on other personal service activities, which would increase by 5.935% on average over the whole period. Furthermore, a 10% increase in public investment in air transport infrastructure would lead to an average (or annual) increase of 0.665% in air transport output and an increase of between around 0.070% to 5.935% in oil-intensive sectors, agriculture, information and telecommunications, and other personal service sectors (Figure 6). The air transport sector would also have a relatively concentrated sectoral influence on household consumption, investment, and intermediate demand. Sectors such as information and communication, real estate activities, financial and insurance activities, administrative and support service activities, and other services would also experience relatively high increases in household consumption, investment, and intermediate labour demand in both the short and long term, ranging from 0.001% to 0.224%.
These findings are consistent with those of both the partial and general equilibrium literature, indicating that air transport expansion positively affects economic growth, and with Chen and Haynes’s [56] findings. However, the simulations suggest that the impact of air transport expansion in Egypt would be slightly higher than an expansion on the same scale in the US. Thus, whereas Chen and Haynes [56] found that a 1% increase in US public air capital would lead to a 0.012% increase in value-added GDP, our findings suggest that the same shock on Egyptian air transport public capital would increase value-added GDP by 0.064%. The medium- and long-term impacts would be expected to be slightly higher, which can be explained by external effects on the efficiency and productivity of the economy. Ishutkina [80] argued that the role of air transportation in facilitating access to supporting firms, institutions, infrastructure, and knowledge centres appears to be critically important to sustaining a productive economy.
5. Conclusions
Improvements to the quantity and quality of and access to infrastructure are generally regarded as a prerequisite for economic growth. The Egyptian government has invested heavily in air transport infrastructure since the early 2000s, and further expansion is planned in order to meet the additional demand that will accompany Egypt’s expected economic growth over the next decades.
This paper investigates the economic impact of increased spending on air transport infrastructure in Egypt. Most previous research on the relationship between air transport infrastructure expansion and economic growth used econometric models. This paper contributes to knowledge of the economic impact of air transport infrastructure growth by using a general equilibrium framework rather than a partial equilibrium model. We used a linkage approach to analyse interdependence between the air transport sector and the rest of the Egyptian economy. Using the linkage approach is particularly important because it helps identify sectoral development priorities. Despite a growing body of research on the relationship between air transport expansion and economic growth, little attention has been given to developing and emerging economies or to the economy-wide impact of air transport infrastructure projects. We developed a CGE model of the Egyptian economy to simulate the economy-wide impacts of public investment in air transport, under the assumption that public expenditure is financed by debt.
The results indicate that air transport has above-average backward linkages with other sectors in the economy, but weak forward linkages. Based on the analysis, intermediate uses of air transport across industries in Egypt appear to be weak. Relatively few industries exhibit significant shares in intermediate air transport consumption. The results of the CGE simulation show that, at the macroeconomic level, air transport infrastructure expansion induces modest growth in GDP, labour demand, income, and consumption. Both labour and capital experience increased, which is attributable to higher total factor productivity and higher employment. Increased transport infrastructure also had positive effects on private investment and trade.
At the sectoral level, the primary beneficiaries are mining, manufacturing, public administration and defence, and other air transport-intensive industries such as information and telecommunications, financial services, and wholesale and retail trades. Overall, the effects of expanding the air transport infrastructure are significant and strong relative to the cost of investment over the whole period, and the long-term impacts are higher than the short-term effects owing to productivity improvements.
The virtual air bridge between cities provided by air transport services not only benefits users by giving a choice but also enables important economic flows and supports global supply chains. Air transport is essential for the modern economy and has been essential for getting personal protective equipment and vaccines around the world. According to figures released by the International Air Transport Association, a full return to 2019 air traffic levels is expected by 2024 [81]. It estimated that air transport will grow on average by 3.2% over the next few decades in Africa and by 4.8% if African states implement the “Single African Air Transport Market” [82,83]. As a result, further investment in air transport infrastructure in Egypt and across Africa [84] post-COVID-19 will be required to accommodate additional demand. Future air transport investment is particularly relevant in the case of Egypt, whose economic stability and prosperity are primarily reliant on tourism and air transport development. However, it is critical to consider the role of sustainable transport in tourism’s long-term development and sustainability given the unprecedented changes brought about by the COVID-19 pandemic, as concluded by Marek [85]. Furthermore, efficient transport infrastructure and the resultant contribution to trade and tourism expansion would significantly contribute to the achievement of Egypt’s development goals, i.e., Egypt Vision 2030. This vision was first introduced in 2014 to serve as a roadmap to maximising the utilisation of the available resources, raising the country’s competitive advantage, reviving Egypt’s historical role in leading the region, and providing a decent life for citizens. Nevertheless, the outbreak of COVID-19 placed significant social and economic pressures on Egypt’s economy, including the need to reformulate its Vision 2030. In 2021, Egypt’s Ministry of Economic Development [86] updated the vision to focus more on green and sustainable initiatives. The air transport sector would need to become greener and more resilient to shocks such as COVID-19.
It should be noted that the 2011 social accounting matrix used in this study might not mirror the current structure of the Egyptian economy. Future research might improve upon the methodology by updating the SAM or using a more recent SAM. In addition, this study only examined the impact of public spending on air transport funded through foreign aid. Further work is required to establish how different funding channels for air transport infrastructure would affect the economy. Although infrastructure renewal in Africa has been implemented mainly through public spending, private-sector participation in air transport development has grown in recent years [78]. Therefore, future research might compare the impact of public and private investment. This research might be improved through econometric estimation of several of the elasticities used. Future research might also incorporate imperfect competition in sectors, unemployment, and different closure rules.
Supplementary Materials
The following supporting information can be downloaded at: https://0-www-mdpi-com.brum.beds.ac.uk/article/10.3390/su14052651/s1.
Author Contributions
Conceptualization, E.T.N. and A.M.R.; methodology, E.T.N.; software, E.T.N.; validation, E.T.N. and A.M.R.; formal analysis, E.T.N.; investigation, E.T.N.; data curation, E.T.N. and A.M.R.; writing—original draft preparation, E.T.N.; writing—review and editing, E.T.N. and A.M.R.; visualization, E.T.N. and A.M.R.; project administration, E.T.N. and A.M.R. All authors have read and agreed to the published version of the manuscript.
Funding
This research received no external funding.
Data Availability Statement
Not applicable.
Conflicts of Interest
The authors declare no conflict of interest.
References
- CAPA Airport Investment in Africa–Overlooked by Airport and Other Infrastructure Investors. 2014. Available online: https://centreforaviation.com/analysis/reports/airport-investment-in-africa---overlooked-by-airport-and-other-infrastructure-investors-181092 (accessed on 10 August 2020).
- CAPA Centre for Aviation. CAPA USD1 Trillion for Airport Construction Globally–But It’s Not Enough. 2017. Available online: https://centreforaviation.com/analysis/reports/usd1-trillion-for-airport-construction-globally---but-its-not-enough-capa-database-356495 (accessed on 10 August 2020).
- SH & E. Competitive Africa: Tourism Industry Research Phase II Air Transport Sector Study. Report World Bank: Washington, DC, USA, 2010; Unpublished work. [Google Scholar]
- SOFRECO. Study on Programme for Infrastructure Development in Africa (PIDA). In Africa’s Infrastructure Outlooks 2040; SOFRECO: Clichy, France, 2011. [Google Scholar]
- IATA Value of Aviation-Country Reports. 2019. Available online: https://www.iata.org/en/iata-repository/publications/economic-reports/egypt--value-of-aviation (accessed on 15 August 2020).
- IMF. Arab Republic of Egypt: 2017 Article IV Consultation. In IMF Country Report 2018; International Monetary Fund: Washington, DC, USA, 2018; Available online: www.imf.org (accessed on 10 August 2020).
- De Florio, F. Airworthiness: An Introduction to Aircraft Certification and Operations; Butterworth-Heinemann: Oxford, UK, 2016. [Google Scholar]
- Tsui, K.W.H.; Henderson, I.L. The Changing Dynamics and Roles of New Zealand’s Airports: An Overview. Adv. Airl. Econ. 2018, 245–266. [Google Scholar] [CrossRef]
- Sobieralski, J.B. The Economic Importance of Niche Markets for a Tourist Economy: The Case of Private Pilots in The Bahamas. J. Appl. Bus. Econ. 2013, 14, 120–129. [Google Scholar]
- Henderson, I.; Tsui, W.H.K. The Role of Niche Aviation Operations as Tourist Attractions. Air Transp. A Tour. Perspect. 2019, 233–244. [Google Scholar] [CrossRef]
- Airports Council International (ACI). Focus on Africa. ACI World Airpt. Dev. News 2018, 3, 8. Available online: http://www.mombergerairport.info/ (accessed on 20 August 2021).
- IQPC State of the Market: Transport Infrastructure Projects in Egypt. Air Transport Infrastructure Summit. 2015. Available online: https://medstonesa.files.wordpress.com/2015/11/egypt.pdf (accessed on 22 June 2021).
- Calderon, C.; Cantu, C.; Chuhan-Pole, P. Infrastructure Development in Sub-Saharan Africa: A Scorecard. Infrastruct. Dev. Sub-Sahar. Afr. A Scorec. 2018, 2018. [Google Scholar] [CrossRef]
- Benell, D.W.; Prentice, B.E. A regression model for predicting the economic impacts of Canadian airports. Logist. Transpor-Tation Rev. 1993, 29, 139. [Google Scholar]
- Button, K.; Lall, S.; Stough, R.; Trice, M. High-technology employment and hub airports. J. Air Transp. Manag. 1999, 5, 53–59. [Google Scholar] [CrossRef]
- Khadaroo, J.; Seetanah, B. Transport infrastructure and tourism development. Ann. Tour. Res. 2007, 34, 1021–1032. [Google Scholar] [CrossRef]
- Allroggen, F.; Malina, R. Do the regional growth effects of air transport differ among airports? J. Air Transp. Manag. 2014, 37, 1–4. [Google Scholar] [CrossRef]
- Profillidis, V.; Botzoris, G. Air passenger transport and economic activity. J. Air Transp. Manag. 2015, 49, 23–27. [Google Scholar] [CrossRef]
- Ivy, R.L.; Fik, T.J.; Malecki, E.J. Changes in Air Service Connectivity and Employment. Environ. Plan. A Econ. Space 1995, 27, 165–179. [Google Scholar] [CrossRef]
- Robertson, J.A. Airports and economic regeneration. J. Air Transp. Manag. 1995, 2, 81–88. [Google Scholar] [CrossRef]
- Green, R.K. Airports and Economic Development. Real Estate Econ. 2007, 35, 91–112. [Google Scholar] [CrossRef]
- Kasarda, J.D.; Sullivan, D.L. Air cargo, liberalization, and economic development. Ann. Air Space Law 2006, 31, 167–169. [Google Scholar]
- Cech, P. The Catalytic Effect of the Accessibility of Air Cargo Services. TIACA Graduate Research Paper Competition. 2004. [Google Scholar]
- Button, K.; Yuan, J. Airfreight Transport and Economic Development: An Examination of Causality. Urban Stud. 2013, 50, 329–340. [Google Scholar] [CrossRef]
- Irwin, M.D.; Kasarda, J.D. Air Passenger Linkages and Employment Growth in U.S. Metropolitan Areas. Am. Sociol. Rev. 1991, 56, 524. [Google Scholar] [CrossRef]
- Canaday, H. Planning the “Aerotropolis”: Henry Canaday talks to John Kasarda. Airpt. World 2000, 5, 52–53. [Google Scholar]
- Florida, R.; Mellander, C.; Holgersson, T. Up in the air: The role of airports for regional economic development. Ann. Reg. Sci. 2014, 54, 197–214. [Google Scholar] [CrossRef] [Green Version]
- Forecasting, O.E. The Contribution of Air Transport to Sustainable Development in Africa. Unpublished Final Report for the Air Transport Action Group. 2003. Available online: www.atag.org (accessed on 15 November 2020).
- Gibbons, S.; Wu, W. Airports, access and local economic performance: Evidence from China. J. Econ. Geogr. 2019, 20, 903–937. [Google Scholar] [CrossRef]
- Forsyth, P.; Niemeier, H.-M.; Njoya, E.T. Economic Evaluation of Investments in Airports: Recent Developments. J. Benefit-Cost Anal. 2021, 12, 85–121. [Google Scholar] [CrossRef]
- Dimitrios, D.; Maria, S. Assessing air transport socio-economic footprint. Int. J. Transp. Sci. Technol. 2018, 7, 283–290. [Google Scholar] [CrossRef]
- Chamber, N.S.W.B. Economic Impact of a Western Sydney Airport. NSW Busines Chamb. 2013. Available online: https://www2.deloitte.com/content/dam/Deloitte/au/Documents/finance/deloitte-au-fas-economic-impact-western-sydney-airport-240914.pdf (accessed on 15 November 2020).
- Njoya, E.T.; Forsyth, P. The use of CGE models in the evaluation of air transport policy and large-scale investment: A survey, In Air Transport and Regional Development Methodologies; Routledge: London, UK, 2020; pp. 108–128. [Google Scholar]
- Arman, S.A.; Manesh, A.S.; Izady, A.T. Design of a CGE Model to Evaluate Investment in Transport Infrastructures: An Application for Iran. Asian Econ. Financial Rev. 2015, 5, 532–545. [Google Scholar] [CrossRef] [Green Version]
- Van Truong, N.; Shimizu, T. The effect of transportation on tourism promotion: Literature review on application of the Computable General Equilibrium (CGE) Model. Transp. Res. Procedia 2017, 25, 3096–3115. [Google Scholar] [CrossRef]
- Rokicki, B.; Haddad, E.A.; Horridge, J.M.; Stępniak, M. Accessibility in the regional CGE framework: The effects of major transport infrastructure investments in Poland. Transportation 2021, 48, 747–772. [Google Scholar] [CrossRef] [Green Version]
- Mackie, P.; Nellthorp, J.; Laird, J. Where to Use Cost Effectiveness Techniques Rather Than Cost Benefit Analysis. 2005. Available online: https://openknowledge.worldbank.org/handle/10986/11795 (accessed on 22 June 2021).
- Dwyer, L.F. Peter International Handbook on the Economics of Tourism; Edward Elgar Publishing: Cheltenham, UK, 2007. [Google Scholar]
- Koks, E.E.; Carrera, L.; Jonkeren, O.; Aerts, J.C.J.H.; Husby, T.G.; Thissen, M.; Standardi, G.; Mysiak, J. Regional disaster impact analysis: Comparing input–output and computable general equilibrium models. Nat. Hazards Earth Syst. Sci. 2016, 16, 1911–1924. [Google Scholar] [CrossRef] [Green Version]
- Figini, P.; Patuelli, R. Estimating the Economic Impact of Tourism in the European Union: Review and Computation. J. Travel Res. 2021, 00472875211028322. [Google Scholar] [CrossRef]
- Laird, J.J.; Nellthorp, J.; Mackie, P.J. Network effects and total economic impact in transport appraisal. Transp. Policy 2005, 12, 537–544. [Google Scholar] [CrossRef] [Green Version]
- Haddad, E.A.; Hewings, G.; Perobelli, F.S.; Dos Santos, R.A.C. Regional Effects of Port Infrastructure: A Spatial CGE Application to Brazil. Int. Reg. Sci. Rev. 2010, 33, 239–263. [Google Scholar] [CrossRef]
- Legaspi, J.; Hensher, D.; Wang, B. Estimating the wider economic benefits of transport investments: The case of the Sydney North West Rail Link project. Case Stud. Transp. Policy 2015, 3, 182–195. [Google Scholar] [CrossRef]
- Chen, Z.; Xue, J.; Rose, A.Z.; Haynes, K.E. The impact of high-speed rail investment on economic and environmental change in China: A dynamic CGE analysis. Transp. Res. Part A Policy Pract. 2016, 92, 232–245. [Google Scholar] [CrossRef]
- Airport, M. Melbourne Airport Economic Impact Study; Sinclair Knight Merz: Melbourne, Australia, 2003. [Google Scholar]
- Airport, B. New Parallel Runway Draft EIS/MDP for Public Comment. 2007. Available online: https://www.bne.com.au/sites/default/files/docs/BNR_Supplementary_Report_Introduction.pdf (accessed on 17 June 2020).
- Njoya, E.T. An analysis of the tourism and wider economic impacts of price-reducing reforms in air transport services in Egypt. Res. Transp. Econ. 2020, 79, 100795. [Google Scholar] [CrossRef]
- Committee, S. Joint Study on Aviation Capacity in the Sydney Region. 2012. Available online: https://www.westernsydneyairport.gov.au/sydney_av_cap (accessed on 22 June 2021).
- Forsyth, P.; Campus, C. Estimating the costs and benefits of regional airport subsidies: A computable general equilibrium approach. In Proceedings of the German Aviation Research Society Workshop, Amsterdam, The Netherlands, 29–30 June 2006; Available online: https://dea.uib.cat/digitalAssets/123/123131_forsyth.pdf (accessed on 15 July 2020).
- Yamaguchi, K. Inter-regional air transport accessibility and macro-economic performance in Japan. Transp. Res. Part E Logist. Transp. Rev. 2007, 43, 247–258. [Google Scholar] [CrossRef]
- Ueda, T.; Koike, A.; Yamaguchi, J.; Tsuchiya, K. Spatial benefit incidence analysis of airport capacity expansion: Application of SCGE model to the Haneda Project. Res. Transp. Econ. 2005, 13, 165–196. [Google Scholar] [CrossRef]
- Yamaguchi, K.; Ueda, T.; Ohashi, T.; Takuma, F.; Tsuchiya, K.; Hikada, T. Economic Impact Analysis of Deregulation and AIRPORT Capacity Expansion in JAPANESE Domestic Aviation Market. 2001. Volume 2003. Available online: https://www.mlit.go.jp/pri/shiryou/pdf/ronbun.pdf (accessed on 20 November 2020).
- PwC The Economic Impact of Air Passenger Duty. 2013. Available online: https://airlinesuk.org/wp-content/uploads/2013/09/APD-study-Abridged.pdf (accessed on 24 June 2021).
- PWC The Economic Impact of Air Taxes in Europe: Germany. 2017. Available online: https://a4e.eu/wp-content/uploads/a4e-study-pwc-the-economic-impact-of-air-taxes-in-europe-european-economic-area-2017-10.pdf (accessed on 24 June 2021).
- Harback, K.; Martin, S.; Wojcik, L.; Tsao, S.; Welman, S.; Dixon, P.; Rimmer, M. Incorporating Air Transport Congestion into a Large CGE Model of the US Economy. 2015. Available online: https://www.gtap.agecon.purdue.edu/resources/download/7705.pdf (accessed on 23 April 2021).
- Chen, Z.; Haynes, K.E. Transportation capital in the United States: A multimodal general equilibrium analysis. Public Work. Manag. Policy 2014, 19, 97–117. [Google Scholar] [CrossRef]
- Njoya, E.T.; Nikitas, A. The role of air transport in employment creation and inclusive growth in the Global South: The case of South Africa. J. Transp. Geogr. 2020, 85, 102738. [Google Scholar] [CrossRef]
- Abdou, D.; Zaazou, Z. Impact of the Socio-Economic Situation Post the Egyptian Revolution (2011). Int. J. Serv. Sci. Manag. Eng. 2018, 5, 65–74. [Google Scholar]
- Hosny, A.; Kandil, M.; Mohtadi, H. What does Egypt’s Revolution Reveal about its Economy? Int. Econ. J. 2014, 28, 589–611. [Google Scholar] [CrossRef]
- Echevarría, C.A.; García-Enríquez, J. The economic cost of the Arab Spring: The case of the Egyptian revolution. Empir. Econ. 2020, 59, 1453–1477. [Google Scholar]
- Chenery, H.B.; Watanabe, T. International comparisons of the structure of production. Econometrica 1958, 26, 487–521. [Google Scholar] [CrossRef]
- Hirschman, A.O. The Strategy of Economic Development; Yale University: New Haven, CT, USA, 1958. [Google Scholar]
- Rasmussen, P.N. Studies in Inter-Sectoral Relations; North Holland: Amsterdam, The Netherlands, 1956; Volume 15. [Google Scholar]
- CAPMAS A Social Accounting Matrix for the Egyptian Economy 2010/2011. 2015. 2015/22401-73. Available online: https://www.ifpri.org/publication/egypt-disaggregated-social-accounting-matrix-201011 (accessed on 10 February 2020).
- Leontief, W. Input-output analysis. New Palgrave A Dict. Econ. 1987, 2, 860–864. [Google Scholar]
- Decaluwé, B.; Lemelin, A.; Robichaud, V.; Maisonnave, H. PEP-1-t. Standard PEP Model: Single-Country, Recursive Dynamic Version. Réseau Polit. Économique Et Pauvreté/Poverty Econ. Policy. 2010. Available online: https://www.pep-net.org/pep-1-t-single-country-recursive-dynamic-version (accessed on 10 April 2020).
- Boccanfuso, D.; Joanis, M.; Richard, P.; Savard, L. A comparative analysis of funding schemes for public infrastructure spending in Quebec. Appl. Econ. 2014, 46, 2653–2664. [Google Scholar] [CrossRef]
- Aschauer, D.A. Is public expenditure productive? J. Monet. Econ. 1989, 23, 177–200. [Google Scholar] [CrossRef]
- Estache, A. Infrastructure and development: A survey of recent and upcoming issues. Rethink. Infrastruct. Dev. 2008, 2, 47. [Google Scholar]
- Savard, L. Scaling up infrastructure spending in the Philippines: A CGE top-down bottom-up microsimulation approach. Int. J. Microsimul. 2010, 3, 43–59. [Google Scholar] [CrossRef]
- Roumboutsos, A.; Farrell, S.; Liyanage, C.L.; Macário, R. COST Action TU1001: Public Private Partnerships in Transport: Trends & Theory P3TCOST Action TU1001. 2013. Available online: https://citeseerx.ist.psu.edu/viewdoc/download?doi=10.1.1.669.8376&rep=rep1&type=pdf(accessed on 5 June 2021).
- Njoya, E.T.; Semeyutin, A.; Hubbard, N. Effects of enhanced air connectivity on the Kenyan tourism industry and their likely welfare implications. Tour. Manag. 2020, 78, 104033. [Google Scholar]
- Fay, M.; Yepes, T. Investing in Infrastructure: What is Needed from 2000 to 2010? World Bank Publications: Washington, DC, USA, 2003; Volume 3102, Available online: https://openknowledge.worldbank.org/handle/10986/18147 (accessed on 8 April 2021).
- UNCTAD Economic Development in Africa: Tourism for Transformative and Inclusive Growth. 2017. Available online: https://unctad.org/webflyer/economic-development-africa-report-2017(accessed on 19 February 2021).
- Stilwell, J.D.L. The Importance of Air Transportation to the US Economy: Analysis of Industry Use and Proximity to Airports. Master Thesis, Massachusetts Institute of Technology, Cambridge, MA, USA, 2013. [Google Scholar]
- Storey, K. Fly-in/fly-out: Implications for community sustainability. Sustainability 2010, 2, 1161–1181. [Google Scholar] [CrossRef] [Green Version]
- Pham, T.D.; Bailey, G.; Spurr, R. The Positive and Negative Effects of the Mining Boom–A Technical Paper; Tourism Research Australia: Canberra, Australia, 2013. [Google Scholar]
- Hussain, M.Z. Investment in Air Transport Infrastructure: Guidance for Developing Private Participation; The International Bank for Reconstruction and Development: Washington, DC, USA, 2010. [Google Scholar]
- Arab Development Portal, A. Sustainable Development Strategy (SDS): Egypt Vision 2030. 2015. Available online: https://arabdevelopmentportal.com/sites/default/files/publication/sds_egypt_vision_2030.pdf(accessed on 21 November 2021).
- Ishutkina, M.A.; Hansman, R.J. Analysis of the Interaction between Air Transportation and Economic Activity: A Worldwide Perspective, in Department of Aeronautics and Astronautics; Massachusetts Institute of Technology: Cambridge, MA, USA, 2011. [Google Scholar]
- IATA. Recovery Delayed as International Travel Remains Locked Down. 2020. Available online: https://www.iata.org/en/pressroom/pr/2020-07-28-02/(accessed on 21 November 2021).
- Embraer Single African Air Transport Market Benefits and Future Regional Fleet Requirements. 2019. Available online: https://www.embraercommercialaviation.com/a-single-african-air-transport-market-tapping-a-continent-of-potential/ (accessed on 22 November 2021).
- Njoya, E.T. Africa’s single aviation market: The progress so far. J. Transp. Geogr. 2016, 50, 4–11. [Google Scholar] [CrossRef]
- Sartzetaki, M.F.; Dimitriou, D.J. Criticality of a regional airport development to mitigate covid-19 economic effects. Case Stud. Transp. Policy, 2022; in press. [Google Scholar]
- Marek, W. Will the consequences of COVID-19 trigger a redefining of the role of transport in the development of sustainable tourism? Sustainability 2021, 13, 1887. [Google Scholar]
- Ministry of Planning and Economic Development, Egypt. Egypt’s Vision 2030. 2022. Available online: http://sdsegypt2030.com/?lang=en (accessed on 30 September 2021).
Figure 1.
Backward and forward linkages, Egypt 2011.

Figure 2.
Top 20 air transport intermediate uses by industry in 2011. Source: 2011 Egypt SAM. Note: air transportation use relative to total commodity intermediate use.
Figure 2.
Top 20 air transport intermediate uses by industry in 2011. Source: 2011 Egypt SAM. Note: air transportation use relative to total commodity intermediate use.

Figure 3.
Percentage change in industry investment in capital. Source: CGE simulation results.

Figure 4.
Percentage change in consumption. Source: CGE simulation results.

Figure 5.
Percentage change in wage and rental rate. Source: CGE simulation results.

Figure 6.
Percentage change in sectoral wage rate (average over the whole period). Source: CGE Simulation results.
Figure 6.
Percentage change in sectoral wage rate (average over the whole period). Source: CGE Simulation results.

Figure 7.
Percentage change in sectoral output (average over the whole period). Source: CGE simulation results.
Figure 7.
Percentage change in sectoral output (average over the whole period). Source: CGE simulation results.


Table 1.
Egyptian macroeconomic variables (% change from the BAU).
| Variables. | First Period | Period 10 | Period 20 | Total for the Whole Period |
|---|---|---|---|---|
| Value-added GDP | 0.064 | 0.073 | 0.067 | 1.388 |
| Exchange rate | 0.072 | 0.052 | 0.000 | 0.894 |
| Export volume | 1.254 | 1.370 | 1.718 | 21.441 |
| Import volume | 0.036 | 0.150 | 0.041 | 2.411 |
| Aggregate output | 6.130 | 6.290 | 5.191 | 105.897 |
| Aggregate labour demand | −0.946 | −0.587 | 0.769 | 22.083 |
| Aggregate demand for capital | 0.001 | 3.911 | 3.682 | 65.510 |
| Total investment | 0.145 | −0.031 | 1.547 | 6.916 |
| Private Public | 0.116 0.396 | 0.080 0.842 | 1.459 2.202 | 8.903 16.349 |
| Inflow of foreign savings | 1.635 | 1.435 | 1.380 | 13.006 |
| Household labour income | 0.963 | 1.038 | 1.156 | 11.449 |
| Household capital income | −0.144 | −0.027 | 0.224 | 1.487 |
| Household consumption | 0.109 | 0.187 | 0.175 | 3.023 |
| Equivalent variation | −2.533 | 0.678 | 0.293 | 19.439 |
Source: CGE simulation results.
Table 2.
Sectoral price effects.
| Period | Domestic Price of Air Transport Services (Incl. All Taxes and Margins) | Price of Exported Air Transport Services (Excl. Export Taxes) | Price of Imported Air Transport Services (Incl. All Taxes and Tariffs) |
|---|---|---|---|
| 1 | 0.040 | −1.074 | −1.781 |
| 2 | −0.003 | −1.097 | −1.753 |
| 3 | −0.036 | −1.111 | −1.728 |
| 4 | −0.057 | −0.256 | −0.260 |
| 5 | −0.072 | −1.091 | −1.649 |
| 6 | −0.074 | −0.218 | −0.178 |
| 7 | −0.073 | −1.045 | −1.590 |
| 8 | −0.061 | −1.024 | −1.585 |
| 9 | −0.040 | −0.130 | −0.119 |
| 10 | −0.013 | −0.937 | −1.545 |
| 11 | 0.020 | −0.019 | −0.058 |
| 12 | 0.063 | −0.827 | −1.516 |
| 13 | 0.107 | 0.116 | −0.004 |
| 14 | 0.159 | 0.218 | 0.066 |
| 15 | 0.217 | 0.324 | 0.134 |
| 16 | 0.281 | 0.433 | 0.199 |
| 17 | 0.349 | 0.547 | 0.262 |
| 18 | 0.423 | 0.664 | 0.322 |
| 19 | 0.501 | 0.785 | 0.380 |
| 20 | 0.608 | −0.194 | −1.495 |
Source: CGE simulation results.
Publisher’s Note: MDPI stays neutral with regard to jurisdictional claims in published maps and institutional affiliations. |
© 2022 by the authors. Licensee MDPI, Basel, Switzerland. This article is an open access article distributed under the terms and conditions of the Creative Commons Attribution (CC BY) license (https://creativecommons.org/licenses/by/4.0/).
Share and Cite
MDPI and ACS Style
Njoya, E.T.; Ragab, A.M. Economic Impacts of Public Air Transport Investment: A Case Study of Egypt. Sustainability 2022, 14, 2651. https://0-doi-org.brum.beds.ac.uk/10.3390/su14052651
AMA Style
Njoya ET, Ragab AM. Economic Impacts of Public Air Transport Investment: A Case Study of Egypt. Sustainability. 2022; 14(5):2651. https://0-doi-org.brum.beds.ac.uk/10.3390/su14052651
Chicago/Turabian StyleNjoya, Eric Tchouamou, and Ahmad Muhammad Ragab. 2022. "Economic Impacts of Public Air Transport Investment: A Case Study of Egypt" Sustainability 14, no. 5: 2651. https://0-doi-org.brum.beds.ac.uk/10.3390/su14052651
Note that from the first issue of 2016, this journal uses article numbers instead of page numbers. See further details here.