
The Application of a Pavement Distress Detection Method Based on FS-Net
by
 ,
,
Yun Hou
1,2,3, 
Yuanshuai Dong
1,2,3,*,
Yanhong Zhang
1,2,3,
Zuofeng Zhou
4,
Xinlong Tong
1,2,3,
Qingquan Wu
5,
Zhenyu Qian
1,2,3 and
Ran Li
5 1
China Highway Engineering Consulting Group Company Co., Ltd., Beijing 100089, China
2
Research and Development Center on Highway Pavement Maintenance Technology, China Communications Construction Company Limited, Beijing 100089, China
3
Research and Development Center of Transport Industry of Technologies, Materials and Equipment of Highway Construction and Maintenance, Beijing 100089, China
4
Xi’an Institute of Optics and Precision Mechanics, CAS Industrial Development Co., Ltd., Xi’an 710000, China
5
Key & Core Technology Innovation Institute of The Greater Bay Area, Guangzhou 510530, China
*
Author to whom correspondence should be addressed.
Sustainability 2022, 14(5), 2715; https://0-doi-org.brum.beds.ac.uk/10.3390/su14052715
Submission received: 22 December 2021
/
Revised: 21 February 2022
/
Accepted: 22 February 2022
/
Published: 25 February 2022
(This article belongs to the Special Issue Advances in Architectures, Big Data, and Machine Learning Techniques for Complex Internet of Things Systems)
Abstract
:In order to solve the problem of difficulties in pavement distress detection in the field of pavement maintenance, a pavement distress detection algorithm based on a new deep learning method is proposed. Firstly, an image data set of pavement distress is constructed, including large-scale image acquisition, expansion and distress labeling; secondly, the FReLU structure is used to replace the leaky ReLU activation function to improve the ability of two-dimensional spatial feature capture; finally, in order to improve the detection ability of this model for long strip pavement distress, the strip pooling method is used to replace the maximum pooling method commonly used in the existing network, and a new method is formed which integrates the FReLU structure and the strip pooling method, named FS-Net in this paper. The results show that the average accuracy of the proposed method is 4.96% and 3.67% higher than that of the faster R-CNN and YOLOv3 networks, respectively. The detection speed of 4 K images can reach about 12 FPS. The accuracy and computational efficiency can meet the actual needs in the field of road detection. A set of lightweight detection equipment for highway pavement was formed in this paper by purchasing hardware, developing software, designing brackets and packaging shells, and the FS-Net was burned into the equipment. The recognition rate of pavement distress is more than 90%, and the measurement error of the crack width is within ±0.5 mm through application testing. The lightweight detection equipment for highway pavement with burning of the pavement distress detection algorithm based on FS-Net can detect pavement conditions quickly and identify the distress and calculate the distress parameters, which provide a large amount of data support for the pavement maintenance department to make maintenance decisions.
1. Introduction
In recent years, with the continuous improvement of China’s road network and the increasing construction of expressways, the detection, maintenance and management of roads has become an important task in the field of China’s road construction. The structural distress of pavement often occurs along the wheel tracks of carriageways, first as small cracks, then chicken-wire cracks and deformation and finally becomes large-scale structural distress. With the increasing traffic volume of highways, the phenomenon of heavy loading and overloading is rather serious. Affected by various environmental factors such as pavement structure, climate, terrain, geological conditions and vehicle loading, cracks of different degrees and shapes occur in the base course, whether flexible or semi-rigid. At present, most of the pavement maintenance work of China’s road departments still stays at the level of manual detection, but manual detection has many disadvantages, such as huge cost of time, great safety hazards, low accuracy and poor consistency of evaluation results. Therefore, many researchers have proposed various methods to detect road pavement distress. These methods mainly fall into three categories: machine vision detection methods, machine learning detection methods and deep learning detection methods.
Machine vision detection methods usually use industrial cameras to collect images and then use image processing algorithms to get the results. For example, Sun [1] proposed the method of nonlinear filtering to enhance the images; Wang [2] and Wu [3] proposed a processing method of image denoising using Shearlet transform; Yan [4] first used a specific median filter to enhance the image and then used the edge detection algorithm based on gray morphological operator when detecting cracks. The advantage of these kinds of methods is their high detection speed, but the disadvantage is the limited types of detectable distresses and their weak generalization ability.
Machine learning detection methods usually first extract the image features of the input picture and then use pattern recognition method to make judgements. For example, Shi Y et al. [5] proposed CrackForest, a new road crack detection system based on random structured forests to solve the problems of serious nonuniformity of cracks, complex topology of cracks and noise with similar texture, and they achieved better detection accuracy; A Cubero-Fernandez [6] proposed that after image preprocessing, the decision-tree heuristic algorithm is applied to classify and detect the images, which can also obtain good detection accuracy. However, the features extracted by these kinds of methods are artificially designed, indicating a great possibility of interference, which also causes the loss of some image information and affects the final detection rate.
In recent years, with the continuous development and innovation of computer science and technology, the target detection method based on deep learning has gradually become the mainstream method. Its core ideas are mainly the deep feature extraction of images and target recognition and location of deep neural network, in which the deep neural network model is a convolution neural network. At present, target detection algorithms based on deep learning mainly fall into three categories: target detection algorithms based on region extraction, such as R-CNN [7], fast R-CNN [8], faster R-CNN [9] and mask R-CNN [10]; target detection algorithms based on regression, such as YOLO [11] and SSD [12]; target detection algorithms based on search, such as Attention Net [13]. The YOLO algorithm, proposed by J. Redmon, reduced the generation of candidate boxes and the classification of object features to one step for processing, at the same time enabling it to maintain a high accuracy and high detection speed; the YOLOv2 [14] network added batch normalization, bounding box clustering and multi-scale training to further improve accuracy and speed; YOLOv3 [15] replaced the softmax layer with the logistic regression layer to realize multi-label classification and added scale fusion to improve the detection performance of small objects, making it one of the networks with the highest detection accuracy, as well as high computational efficiency.
The starting point of this paper is to develop a set of lightweight detection equipment; the single camera is used to shoot the pavement and the pavement distress is quickly detected and evaluated, which is suitable for the daily pavement round check of road maintenance and management departments. In this paper, the deep learning method will be used to detect the cracks, potholes and repaired cracks in the pavement images, thus improving the YOLOv3 network. FReLU is used to replace the activation function in the original model; strip pooling replaced the maxing pooling in the original model. At the same time, the pavement distress data set is constructed to enhance the data and prevent overfitting; the ability to detect long strip cracks is enhanced through the improvements of the activation function and pooling method. The application tests were carried out in many provinces of China, and a large number of sample data were collected for algorithm training. The accuracy of the algorithm has been verified; at present, the recognition rate of cracks, potholes, repaired cracks and repaired potholes is more than 90%.
2. Darknet-53 Model
The Darknet-53 model is a backbone network for extracting image features in the YOLOv3 method, which is developed based on the Darknet-19 model in the YOLOv2 method. As shown in Figure 1, the Darknet-53 network model is similar to ResNet [16], which uses residual units to solve the gradient disappearance problem in back propagation. In addition, the network structure does not use a full connection layer, instead, the full convolution structure is adopted, which can greatly improve the calculation speed.
In the distress detection task, the loss function can be expressed as:
where: is the coordinate error; is the intersection over union (IOU) error; is the classification error.
where: is the weight of coordinate error; is the number of cells in the input image; is the number of bounding boxes predicted for each cell. The value of is 1 or 0, that is, whether there is a detection target in the j’th bounding box of i’th cell. If it exists, it is 1, otherwise it is 0; , and are the center coordinates, height and width of the predicted bounding box, respectively; , and are the center coordinates, height and width of the actual bounding box, respectively. In this method, , and are set to 5, 7 and 9, respectively.
where: is the weight of intersection union ratio error; is predictive confidence; is the actual confidence, and the value of the parameter can be set to 0.5.
In the above Equation (4): is the type of detection target; is the actual probability that the target in the cell belongs to category and is the prediction probability.
3. FS-Net
In order to make the Darknet-53 model better extract the feature information of different scales from the road image, especially for the detection ability of long strip distress, the structure of FS-Net proposed in this paper is shown in Figure 2. The overall network structure of FS-Net is similar to YOLOv3 [15]. This paper mainly introduces the two biggest differences between FS-Net and YOLOv3. The first point is that the convolution downsampling module in the original YOLOv3 network is changed into a strip pooling module in FS-Net to improve the recognition ability of long strip cracks on the road. The second point is that the leaky ReLU module in the original YOLOv3 network is replaced by the FReLU module in FS-Net to further improve the feature extraction ability of FS-Net for various cracks on the road. The specific implementation process of the FReLU module and strip pooling module is introduced in detail below.
3.1. FReLU Activation Function
FReLU is specially designed for visual tasks [17], and it is conceptually simple: the condition of ReLU is manually designed 0, and the condition of LReLU is parameterized . Therefore, it can be modified into a two-dimensional spatial condition according to the spatial context. Visual conditions help to extract the fine spatial layout of an object. The next part is mainly an introduction to the key elements of FReLU, including spatial conditions and pixel by pixel modeling ability, which are the main missing parts of ReLU and its variants.
ReLU: the form of ReLU is , using as the nonlinearity and manually designed zero point as the condition. Nonlinear transformation is the supplement of linear transformation such as convolution and the fully connected layer.
LReLU: as a variant of ReLU, the original form of LReLU is , where is a small parameter, usually set to 0.01. Since is a channel direction parameter, it can be interpreted as the convolution of depth direction without considering the deviation term.
Spatial conditions: FReLU uses the same as a simple nonlinear function. For the condition part, FReLU extends it to a 2D condition that depends on the spatial context of each pixel, as shown in Figure 3. This contrasts with most of the latest methods, whose conditions depend on the pixel itself or the channel context. This method follows the spirit of ReLU, that is, is used to obtain the maximum value between and the condition.
Formally, the spatial condition is defined as . In order to realize the spatial condition, a parameter pool window can be used to create spatial dependencies. Specifically, the activation function is defined as:
where is the input pixel of the two-dimensional spatial position of the nonlinear activated on the channel; the function represents spatial conditions, represents a parameter pool window of , the center point is , represents the coefficients shared by the window in the same channel and represents point multiplication.
Pixel-level modeling capability: the definition of spatial conditions allows the network to generate spatial conditions in the nonlinear activation of each pixel. The network performs a nonlinear transformation and produces spatial dependence at the same time. This is different from the usual method of separately conducting the generation of spatial dependence in the convolution layer and nonlinear transformation. In this case, activation does not explicitly depend on spatial conditions; however, under spatial conditions, it can depend on spatial conditions.
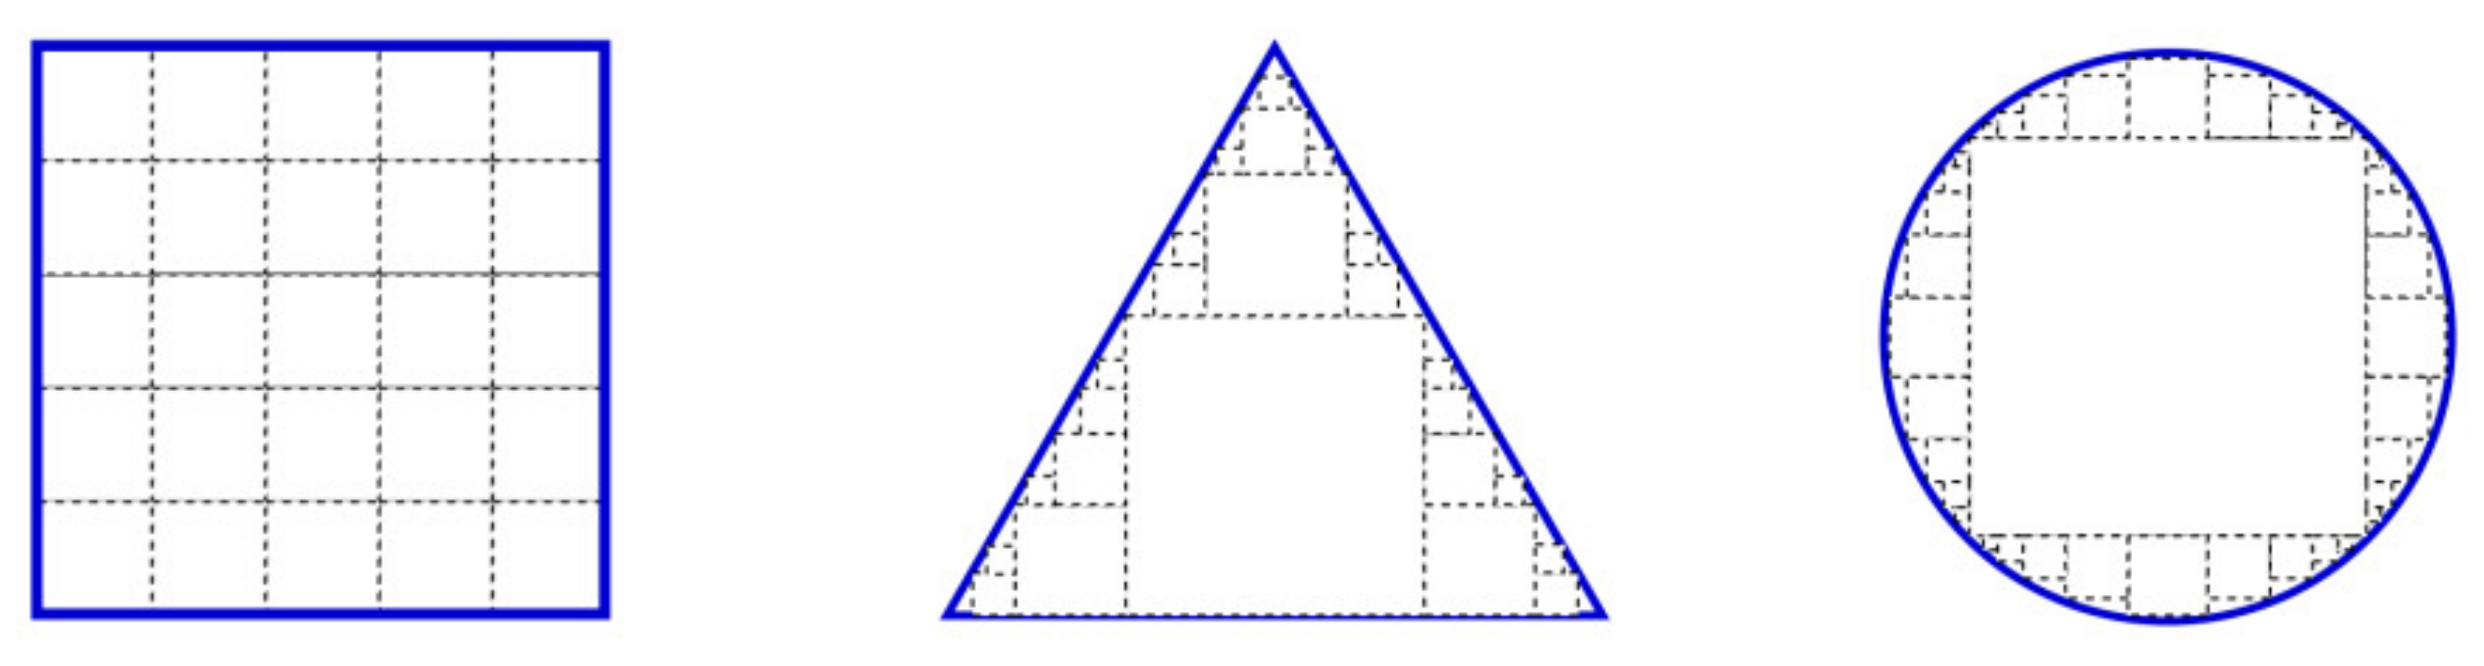
Therefore, pixel-level conditions enable the network to have pixel-level modeling capability. The function provides the choice of viewing spatial context or not for each pixel. Formally, consider a network with FReLU layers, and each FReLU layer has a parameterized window. For simplicity, only the FReLU layer can be analyzed without considering the convolution layer. Due to the maximum choice between and , each pixel after has an active field set . Through the layer, the set becomes , which provides more choices for each pixel. If is large enough, it can approximate any layout. Since the active field has multiple squares of different sizes, these squares of different sizes can approximate the shape of a slash and arc, as shown in Figure 4. As we all know, the layout of objects in the image is usually not horizontal or vertical. They are usually in the shape of a slash or arc. Therefore, the spatial structure of objects can be extracted naturally by using the pixel modeling ability provided by spatial conditions.
3.2. Strip Pooling
Before describing the equation of strip pooling, we can briefly review the average pooling operation.
Standard spatial average pooling: let be a two-dimensional input tensor, where and are spatial height and width, respectively. In the average pooling layer, the spatial range of pooling () is required. Take a simple example, where is divided by and is divided by . Then, the combined output is also a two-dimensional tensor with height and width . In fact, the average pooling operation can be written as:
where and . In Equation (7), each spatial location corresponds to a pooling window with the size of . The above pooling operation can be used to collect remote context information. However, when dealing with irregularly shaped objects, it will inevitably contain many irrelevant areas.
Strip pooling: in order to alleviate the above problems, the concept of strip pooling can be introduced [18], which uses a banded pooling window to pool along the horizontal or vertical dimension. Mathematically, given the two-dimensional tensor , in strip pooling, a pooled spatial range or is required. Unlike two-dimensional average pooling, strip pooling averages all eigenvalues in a row or column. Maximum pooling refers to selecting the largest pixel within the pixel range of as the output, while strip pooling refers to calculating the average value of pixels within the pixel range of or as the output.
Therefore, the output of horizontal strip pooling can be written as:
Similarly, the output of vertical strip pooling can be written as:
Because the core shape is long and narrow, under the horizontal and vertical strip pool layer, it is easy to establish a long-term dependence between discrete regions and encode the regions with a banded shape. At the same time, because of its narrow core shape along another dimension, it also focuses on capturing local details. These characteristics make strip pooling different from the traditional spatial pooling based on square core.
Strip pooling is used to help the backbone network capture remote context. Therefore, a new strip pooling module (SPM) can be used, which uses horizontal and vertical strip pooling operations to collect remote contexts from different spatial dimensions, as shown in the SPM in Figure 5. Let be the input tensor, where represents the number of channels. Firstly, is input into two parallel paths, each path contains a horizontal or vertical strip pool layer and then a one-dimensional convolution layer with core size of 3, which is used to adjust the current position and its adjacent features. This leads to and . In order to obtain more output with global priors, we can combine and to obtain :
Then, the calculation method of output is:
where represents element point multiplication, is the Sigmoid function and is the convolution. In the above process, each position in the output tensor is allowed to establish a relationship with various positions in the input tensor. For example, in Figure 5, a square surrounded by a black box in the output tensor is connected to all positions with the same horizontal or vertical coordinates (surrounded by red and purple boxes). Therefore, by repeating the above aggregation process several times, you can establish remote dependencies on the whole scenario. In addition, due to the point multiplication operation, the SPM can also be regarded as an attention mechanism, which can be directly applied to any pre-trained backbone network without training from scratch.
Compared with global average pooling, strip pooling considers a long and narrow range rather than the whole feature map, which avoids establishing most unnecessary connections between distant locations. Compared with the modules that need a lot of attention, SPM is lightweight in the calculation of establishing the relationship between each pair of locations and can be easily embedded into any module to improve the ability to capture remote spatial correlation and utilize the correlation between channels.
4. Experimental Results and Analysis
4.1. Experimental Platform
This experiment was completed in the Ubuntu 18.04 environment. The computer memory is 128 GB, the CPU is Intel Xeon Gold 6151 3.0 GHz, the GPU is NVIDIA TITAN RTX and the memory is 24 GB; the Python version is 3.7.6, CUDA 10.1 and cuDNN 8.0.4 are installed to support the use of GPU, and third-party libraries such as OpenCV 4.2.0 and Pytorch 1.6.0 are installed to support the operation of neural network.
4.2. Data Set
When constructing the data set of a pavement distress dataset, the first thing to be determined is the classification of pavement distress. According to the inspection requirements, the common distresses of asphalt pavement are mainly cracks and potholes. However, due to regular pavement maintenance, there are obvious repaired cracks on the ordinary pavement, which need to be distinguished from the pavement cracks. In pavement distress, cracks are in a state of continuous growth and development, from the initial single crack to dense chicken-wire cracks. Due to the high discrimination between chicken-wire crack and single cracks, these two characteristics need to be divided when dividing data. Therefore, when dividing the types of pavement distress data, this paper divides the distinguishable distress into four types: simple cracks, chicken-wire cracks, potholes and repaired cracks.
In the actual collected image data of pavement distress, a total of 85511 road pavement images were taken, and 14,641 images containing pavement distress were screened as effective samples to construct the data set. Generally, when the amount of data is small, the proportion of training set, verification set and test set in the traditional machine learning method is 6:2:2, while the proportion of deep learning method can also be set as 6:2:2 because it follows the machine learning method, but if the amount of data is large (for example, the total number of images is more than 10,000), we can appropriately increase the proportion of the training set in the deep learning method to better train the network model, so this paper finally sets the proportion of training set, verification set and test set to 8:1:1.
Because the four characteristics of pavement distress often appear in the form of crisscross in images, the simple cracks and repaired cracks have the characteristics of slender and large amplitudes and several cracks often cover the whole image. If it is marked according to the overall crack area, it is likely to bring other information in the pavement into the characteristic area of the distress, resulting in feature deviation or the over fitting of the training model. Therefore, the main marking criteria for road distress are as follows:
1. Single transverse and longitudinal cracks shall be marked as a whole. When the crack crosses the lane line, if the crack within the lane line has obvious characteristics and natural connection, it is regarded as a crack. If the crack characteristics cannot be observed within the lane line, the cracks on both sides of the lane line are divided into two for marking;
2. When the transverse crack and longitudinal crack are crisscrossed, if there is no chicken-wire crack in the intersection center, it shall be marked as a transverse crack and a longitudinal crack, respectively. If there are chicken-wire cracks in the intersection center, the center range shall be marked as chicken-wire cracks, and a total of four cracks in other positions shall be marked separately;
3. The determination of chicken-wire cracks is based on the number of chicken-wire holes surrounded by cracks greater than three. Attention should be paid to the extensibility of chicken-wire cracks during frame selection;
4. The overall area of the pothole must be covered when the pothole distress is marked;
5. The rule for the marking of repaired cracks is the same as that for simple cracks but does not distinguish chicken-wire repaired cracks. For a repaired pothole, the entire area of the repaired block should be included.
It should be noted that the deep learning algorithm in this paper uses images labeled with distress in the training process. Due to the large amount of data in the training set and verification set, the final generalization effect of the network model is good. It will not force the finding of distress from each image in practical use, and the images with distress will be found and marked with the location of distress and images without distress will not have any markers.
4.3. Model Evaluation
The parameters of the deep learning model (FS-Net) for pavement distress detection proposed in this paper are as follows: the momentum parameter is 0.9, the weight attenuation coefficient is 0.005, the learning rate is 0.001, the batch size is 2 and a total of 200 epochs are trained. The intersection union ratio and loss function value of the training set with the increase in the number of epochs, the variation tendency of the loss function and the intersection union ratio of the training set are shown in Figure 6.
It can be seen from Figure 6 that the loss function value in the training set is high at the beginning of the training and tends to converge around the 50’th epoch, and its value is stable in the range of 0.1~0.4. At the same time, the intersection union ratio also tends to converge in the 50’th epoch, which is stable in the range of 90~95%, showing that the training of the network model is effective. This paper also gives the loss function and intersection union ratio curve of the test set to check the performance of the neural network, as shown in Figure 7.
It can be seen from Figure 7 that the loss function value of the test set tends to converge around the 125’th epoch with the progress of training, and its value is stable in the range of 0.2~0.6. The intersection union ratio also converges around the 125’th epoch, and the center value of the converged curve is stable at about 90%. Comparing Figure 6 and Figure 7, the intersection union ratio and loss function value of the test set and the training set tend to converge with the progress of training, with the convergence speed of the test set being slower. However, from the performance of the test set, the proposed network model is effective. After the training is completed, the generated weight file is used to detect the pavement distress images. The result is shown in Figure 8.
The detection and recognition results of the FS-Net model for pavement distress detection built in this paper are shown in Figure 8. The recognition results of the model for simple cracks, chicken-wire cracks, potholes and repaired cracks are given, respectively, in the figure. The distress feature detection and positioning in the image is clear and the classification is accurate, showing good detection performance, showing that it can accurately and comprehensively detect and mark the distresses and their location information in the images.
4.4. Performance Comparison of the Algorithms
In order to verify the effectiveness of the proposed method, the performance of faster R-CNN, YOLOv3 and the network model proposed in this paper are compared. The specific evaluation criteria are the recall, the precision and the false negatives ratio (FNR). The recall refers to the ratio of correct results to the total number to be identified in the data set; the precision refers to the ratio of correct results in the identified results and the FNR is the ratio of unrecognized correct results to all real samples, and its equation is as follows:
In the above equations: TP means that if an instance is a positive class, and is also predicted to be a positive class, that is the number of real positive classes; FP indicates the number of false positive classes, that is, the case of an instance being a negative class but predicted to be a positive class; FN indicates the number of false negative classes, that is, the case of an instance being a positive class but predicted to be a negative class. In addition, in order to compare the performance of different networks, 1338 images in a verification set containing different kinds of distress were used for distress detection. The detection results are shown in Table 1.
It can be seen from Table 1 that compared with the faster R-CNN network and YOLOv3 network, the network structure proposed in this paper has increased the precision rate of all distress by 4.90% and 3.61% and the recall rate by 4.96% and 3.67%, and the FNR has also decreased by 0.58% and 0.39%. Compared with the faster R-CNN and YOLOv3 networks, the detection ability of this method for pothole distress is significantly improved, the precision rate is increased by 9.57% and 7.08%, respectively, the recall rate is increased by 12.71% and 11.09%, respectively and the FNR is also greatly reduced by 4.37% and 3.95%. In the other three types of distress, the precision rate and recall rate also increased to a certain extent, and the FNR also decreased. In terms of computational efficiency, the faster R-CNN network can only reach about 1.25 FPS in processing 4 K images, which is far lower than the computational speed of YOLOv3 and the network model proposed in this paper. At the same time, although the network model proposed in this paper has greatly improved the multi-scale detection ability of pavement distress, it does not affect the computational complexity of the network, and its running speed is consistent with YOLOv3; the detection of 4 K distress images can still reach about 12 FPS.
It can be seen from Figure 9 that under different distress images, the detection results of the faster R-CNN network are not comprehensive enough. For long strip distress or distress with a wide division area, it is difficult to detect the distress completely, and there is a large area of detection loss. Compared with the faster R-CNN network, the detection results of the YOLOv3 network have been greatly improved, and the distress detection on a large scale has been significantly improved, too. It can basically mark the overall location information of the distress, but it is easy to have overlapping frames, which will have a great impact on the accuracy of counting the true real number of road distress. Due to the great improvement of the FS-Net in terms of the activation function and the pooling methods, the ability of the network to capture large-scale pavement distress is greatly improved. It can not only accurately detect pavement distress at different scales but also has few repeated frames, which can better count the number of pavement distress.
4.5. Algorithm Performance Experiment under Different Shooting Conditions
When the camera is arranged above the detection vehicle to shoot the actual road, two situations often lead to poor image effects of the camera: the first is that when the detection vehicle passes through an uneven road, the camera shakes, resulting in the motion blur effect of the captured road images; the second is that the light intensity is often affected by shadow or direct sunlight, resulting in too dark or too bright images. However, the FS-Net can capture different types of pavement distress information and detect the accurate location under different shooting conditions by using the FReLU activation and strip pooling module. As shown in Figure 10, in the motion blurred image, the FS-Net accurately finds the location of the crack distress and is not affected by other interference factors; in the image with too dark or too bright light, it is difficult to distinguish the location of crack distress only through visual effect, but the FS-Net can still detect the distress area well. This fully shows that the FS-Net has good accuracy and generalization in the task of pavement distress detection.
5. Equipment Integration and Engineering Application
Based on the requirements of engineering applications, image acquisition devices that can identify the pavement cracks clearly, embedded platforms and GPS positioning devices were purchased, image acquisition software and data processing software were developed and triangular adsorption brackets and integrated central control devices were designed and produced in this paper, which formed a set of lightweight detection equipment for highway pavement, as shown in Figure 11.
The image acquisition device and the triangular adsorption bracket are installed at the rear of the vehicle. The camera is 2 m above the ground and the angle between the camera and the vertical direction is 30° as shown in Figure 12. The GPS positioning device is installed in parallel with the image acquisition device. The integrated central control device is a mechanical shell independently designed in this paper, where a GPS data processing module, power supply module, embedded platform and large capacity solid state hard disk are integrated, and the FS-Net was burned in an embedded platform for processing the image data by the image acquisition device collected. Some connecting holes were created on the shell of the device, so that the central control device could be efficiently connected with the image acquisition device, display, GPS positioning device and vehicle power supply device. The inspectors carry the integrated central control device and the collection operation display to implement pavement detection in the vehicle.
The pavement distress detection algorithm based on the FS-Net in this paper was tested in such places as Beijing and Heilongjiang in China. The cracks, mesh cracks, repaired cracks, potholes and repaired potholes can be identified with a recognition rate of more than 90%, and the measurement error of the crack width is within 0.5 mm, the distress identification process in the images as shown in the Figure 13.
The improved pavement disease detection algorithm of the FS-Net in this paper can efficiently identify cracks, chicken-wire cracks, repair cracks, potholes and repair potholes, as shown in Figure 14. The equipped lightweight detection equipment can detect road conditions at a high frequency, thus providing a large amount of data support for pavement maintenance departments to make maintenance decisions.
6. Conclusions
(1) FS-Net, which is a new deep learning method, was developed in this paper to solve the problem of pavement distress detection in the field of pavement maintenance. The network structure replaces the leaky RdeLU activation function in the original YOLOv3 with the FReLU module, enabling it to extract the characteristics of distress more effectively with different scales in the image space; the strip pooling module is used to replace the maximum pooling operation, so that the long strip distress targets can be detected by the network structure more efficiently and reduce the repeated frame operation greatly, while the number of pavement distress statistics can also be more accurate.
(2) A high-quality pavement distress image data set with accurate marking and a resolution of 4 K was established, which can improve the generalization ability of a neural network and prevent the occurrence of overfitting through the well-marked and large number of image data. It can be seen from the experimental results that the network proposed in this paper shows a higher detection accuracy for different types of pavement distress, stronger detection ability for distress at different scales and few repeated frames compared with the faster R-CNN and YOLOv3 networks. The precision and recall rate of FS-Net are improved, and the missed detection rate is reduced. At the same time, it has almost the same computational efficiency as the YOLOv3 network, and the detection speed for 4 K images can reach about 12 FPS.
(3) The lightweight detection equipment for highway pavement with the FS-Net can identify pavement distress early, save maintenance costs and protect environmental resources. The accuracy of crack width identification is 2 mm; 2 mm and above crack measurement error is ±1 mm. Lightweight detection equipment can be installed on ordinary vehicles to quickly identify pavement distress, which has the advantages of convenient carrying, installation and disassembly, therefore, pavement daily round checks can be carried out every day. Then, massive data can be accumulated with the portable device for the detection of diseases on the pavement, so as to establish an active maintenance mode to avoid the deterioration of distress and maintenance of large and medium repair and material waste, saving the cost of life-cycle maintenance while promoting the all-round development of the transportation industry in response to the call of the Party Central Committee to build a “resource-saving and environmentally friendly” society.
Author Contributions
Conceptualization, Y.H. and Z.Z.; formal analysis and methodology, Y.D.; investigation, Y.Z.; writing—original draft preparation, X.T. and R.L.; writing—review and editing, X.T.; software, Q.W.; validation, Z.Q.; data curation, R.L. All authors have read and agreed to the published version of the manuscript.
Funding
This paper is supported by the project “Research and development of highway intelligent detection technology and vehicle-mounted platform based on ubiquitous sensing: ZZKJ-2019-01” and the project “Research on rapid acquisition of remote sensing image and its application technology in commercial aerospace: ANSO-CR-KP-2020-15”.
Institutional Review Board Statement
Not applicable.
Informed Consent Statement
Not applicable.
Data Availability Statement
The datasets used and/or analyzed during the current study are available from the corresponding author on reasonable request.
Acknowledgments
The authors would like to express their thanks to everyone who offered help and advice in the creation of the paper.
Conflicts of Interest
The authors declare no conflict of interest.
References
- Sun, Y.; Salari, E.; Chou, E. Automated pavement distress detection using advanced image processing techniques. In Proceedings of the 2009 IEEE International Conference on Electro/Information Technology, Windsor, ON, Canada, 7–9 June 2009; pp. 373–377. [Google Scholar]
- Wang, X.; Feng, X. Pavement distress detection and classification with automated image processing. In Proceedings of the 2011 International Conference on Transportation, Mechanical, and Electrical Engineering, Changchun, China, 16–18 December 2011; pp. 1345–1350. [Google Scholar]
- Wu, C.; Lu, B.; Chen, D.; Wang, L. Pavement Image Denoising Based on Shearlet treansform. In Proceedings of the 2011 International Conference on Electronics and Optoelectronics, Dalian, China, 29–31 July 2011; pp. 721–724. [Google Scholar]
- Yan, M.; Bo, S.; Xu, K.; He, Y. Pavement Crack Detection and Analysis for High-grade Highway. In Proceedings of the 2007 8th International Conference on Electronic Measurement and Instruments, Xi’an, China, 16–18 August 2007; pp. 4-548–4-552. [Google Scholar]
- Shi, Y.; Cui, L.; Qi, Z.; Meng, F.; Chen, Z. Automatic Road Crack Detection Using Random Structured Forests. IEEE Trans. Intell. Transp. Syst. 2016, 17, 3434–3445. [Google Scholar] [CrossRef]
- Cubero-Fernandez, A.; Rodriguez-Lozano, F.; Villatoro, R.; Olivares, J.; Palomares, J.M. Efficient pavement crack detection and classification. Eurasip J. Image Video Process. 2017, 2017, 39. [Google Scholar] [CrossRef]
- Girshick, R.; Donahue, J.; Darrell, T.; Malik, J. Rich Feature Hierarchies for Accurate Object Detection and Semantic Segmentation. In Proceedings of the IEEE Conference on Computer Vision and Pattern Recognition (CVPR), Columbus, OH, USA, 23–28 June 2014; pp. 580–587. [Google Scholar]
- Girshick, R. Fast R-CNN. In Proceedings of the IEEE International Conference on Computer Vision (ICCV), Santiago, Chile, 7–13 December 2015; pp. 1440–1448. [Google Scholar]
- Ren, S.; He, K.; Girshick, R.; Sun, J. Faster R-CNN: Towards Real-Time Object Detection with Region Proposal Networks. IEEE Trans. Pattern Anal. Mach. Intell. 2017, 39, 1137–1149. [Google Scholar] [CrossRef] [PubMed] [Green Version]
- He, K.; Gkioxari, G.; Dollár, P.; Girshick, R. Mask R-CNN. In Proceedings of the IEEE International Conference on Computer Vision (ICCV), Venice, Italy, 22–29 October 2017; pp. 2961–2969. [Google Scholar]
- Redmon, J.; Divvala, S.; Girshick, R.; Farhadi, A. You Only Look Once: Unified, Real-Time Object Detection. In Proceedings of the IEEE Conference on Computer Vision and Pattern Recognition (CVPR), Las Vegas, NV, USA, 27–30 June 2016; pp. 779–788. [Google Scholar]
- Liu, W.; Anguelov, D.; Erhan, D.; Szegedy, C.; Reed, S.; Fu, C.-Y.; Berg, A.C. SSD: Single Shot MultiBox Detector. In Lecture Notes in Computer Science 2016, Proceedings of the European Conference on Computer Vision, Amsterdam, The Netherlands, 8–16 October 2016; Springer: Cham, Switzerland, 2016; pp. 21–37. [Google Scholar]
- Yoo, D.; Park, S.; Lee, J.-Y.; Paek, A.S.; Kweon, I.S. AttentionNet: Aggregating Weak Directions for Accurate Object Detection. In Proceedings of the IEEE International Conference on Computer Vision (ICCV), Santiago, Chile, 7–13 December 2015; pp. 2659–2667. [Google Scholar]
- Redmon, J.; Farhadi, A. YOLO9000: Better, Faster, Stronger. In Proceedings of the IEEE Conference on Computer Vision & Pattern Recognition, Honolulu, HI, USA, 21–26 July 2017; pp. 6517–6525. [Google Scholar]
- Zhou, J.; Tian, Y.; Yuan, C.; Yin, K.; Yang, G.; Wen, M. Improved UAV Opium Poppy Detection Using an Updated YOLOv3 Model. Sensors 2019, 19, 4851. [Google Scholar] [CrossRef] [PubMed] [Green Version]
- He, K.; Zhang, X.; Ren, S.; Sun, J. Deep Residual Learning for Image Recognition. In Proceedings of the IEEE Conference on Computer Vision and Pattern Recognition (CVPR), Las Vegas, NV, USA, 27–30 June 2016; pp. 770–778. [Google Scholar]
- Ma, N.; Zhang, X.; Sun, J. Funnel Activation for Visual Recognition. In Proceedings of the European Conference on Computer Vision, Glasgow, UK, 23–28 August 2020; pp. 351–368. [Google Scholar]
- Hou, Q.; Zhang, L.; Cheng, M.-M.; Feng, J. Strip Pooling: Rethinking Spatial Pooling for Scene Parsing. In Proceedings of the 2020 IEEE/CVF Conference on Computer Vision and Pattern Recognition (CVPR), Seattle, WA, USA, 13–19 June 2020; pp. 4002–4011. [Google Scholar]
Figure 1.
Darknet-53 network structure.

Figure 2.
FS-Net structure.

Figure 3.
Schematic diagram of different activation functions. (a) ReLU; (b) LReLU; (c) FReLU.

Figure 4.
Graphical description of how the spatial condition of each pixel realizes pixel-level modeling capability.
Figure 4.
Graphical description of how the spatial condition of each pixel realizes pixel-level modeling capability.

Figure 5.
Schematic diagram of the strip pooling module.

Figure 6.
Loss function and intersection union ratio curve of the network model proposed in this paper on the training set.
Figure 6.
Loss function and intersection union ratio curve of the network model proposed in this paper on the training set.

Figure 7.
Loss function and intersection union ratio curve of the network model proposed in this paper on the test set.
Figure 7.
Loss function and intersection union ratio curve of the network model proposed in this paper on the test set.

Figure 8.
The detection results of different types of pavement distress. (a) Simple cracks; (b) chicken-wire cracks; (c) potholes; (d) repaired cracks.
Figure 8.
The detection results of different types of pavement distress. (a) Simple cracks; (b) chicken-wire cracks; (c) potholes; (d) repaired cracks.

Figure 9.
Detection results of three networks under different pavement distress images. The experimental results obtained by the faster R-CNN, YOLOv3 and the network model proposed in this paper are in order from left to right. (a) Experimental results of distress image 1; (b) experimental results of distress image 2; (c) experimental results of distress image 3.

Figure 10.
Detection results of pavement distress under different shooting conditions. (a) Motion blurred image; (b) too dark image; (c) too bright image.
Figure 10.
Detection results of pavement distress under different shooting conditions. (a) Motion blurred image; (b) too dark image; (c) too bright image.

Figure 11.
Lightweight detection equipment for highway pavement with the burning pavement distress detection algorithm based on FS-Net.
Figure 11.
Lightweight detection equipment for highway pavement with the burning pavement distress detection algorithm based on FS-Net.

Figure 12.
Pavement detecting.

Figure 13.
Distress identification by the pavement distress detection algorithm based on FS-Net.

Figure 14.
Pavement distress identification results: (a) Mesh cracks; (b) repaired cracks;(c) potholes; (d) repaired potholes.
Figure 14.
Pavement distress identification results: (a) Mesh cracks; (b) repaired cracks;(c) potholes; (d) repaired potholes.


Table 1.
Performance comparison of different methods.
| Network Model | Faster R-CNN | YOLOv3 | FS-Net | ||||||
|---|---|---|---|---|---|---|---|---|---|
| Evaluating Indicator | Recall | Precision | FNR | Recall | Precision | FNR | Recall | Precision | FNR |
| Simple crack | 1.53% | 91.87% | 90.46% | 1.32% | 92.42% | 91.88% | 0.41% | 95.05% | 93.93% |
| Chicken-wire crack | 3.59% | 90.54% | 88.69% | 3.28% | 91.63% | 90.60% | 1.57% | 94.21% | 93.64% |
| Pothole | 6.51% | 81.34% | 75.86% | 6.09% | 83.83% | 77.48% | 2.14% | 90.91% | 88.57% |
| Repaired crack | 1.64% | 89.63% | 87.69% | 1.35% | 91.28% | 90.12% | 0.40% | 93.43% | 92.96% |
| All distress | 1.32% | 89.40% | 88.39% | 1.13% | 90.69% | 89.68% | 0.74% | 94.30% | 93.35% |
| Processing time | 0.794 s | 0.081 s | 0.083 s | ||||||
Publisher’s Note: MDPI stays neutral with regard to jurisdictional claims in published maps and institutional affiliations. |
© 2022 by the authors. Licensee MDPI, Basel, Switzerland. This article is an open access article distributed under the terms and conditions of the Creative Commons Attribution (CC BY) license (https://creativecommons.org/licenses/by/4.0/).
Share and Cite
MDPI and ACS Style
Hou, Y.; Dong, Y.; Zhang, Y.; Zhou, Z.; Tong, X.; Wu, Q.; Qian, Z.; Li, R. The Application of a Pavement Distress Detection Method Based on FS-Net. Sustainability 2022, 14, 2715. https://0-doi-org.brum.beds.ac.uk/10.3390/su14052715
AMA Style
Hou Y, Dong Y, Zhang Y, Zhou Z, Tong X, Wu Q, Qian Z, Li R. The Application of a Pavement Distress Detection Method Based on FS-Net. Sustainability. 2022; 14(5):2715. https://0-doi-org.brum.beds.ac.uk/10.3390/su14052715
Chicago/Turabian StyleHou, Yun, Yuanshuai Dong, Yanhong Zhang, Zuofeng Zhou, Xinlong Tong, Qingquan Wu, Zhenyu Qian, and Ran Li. 2022. "The Application of a Pavement Distress Detection Method Based on FS-Net" Sustainability 14, no. 5: 2715. https://0-doi-org.brum.beds.ac.uk/10.3390/su14052715
Note that from the first issue of 2016, this journal uses article numbers instead of page numbers. See further details here.