
Different Ground Subsidence Contributions Revealed by Integrated Discussion of Sentinel-1 Datasets, Well Discharge, Stratigraphical and Geomorphological Data: The Case of the Gioia Tauro Coastal Plain (Southern Italy)

 , , , , ,
  , and
, and 
Abstract
:1. Introduction

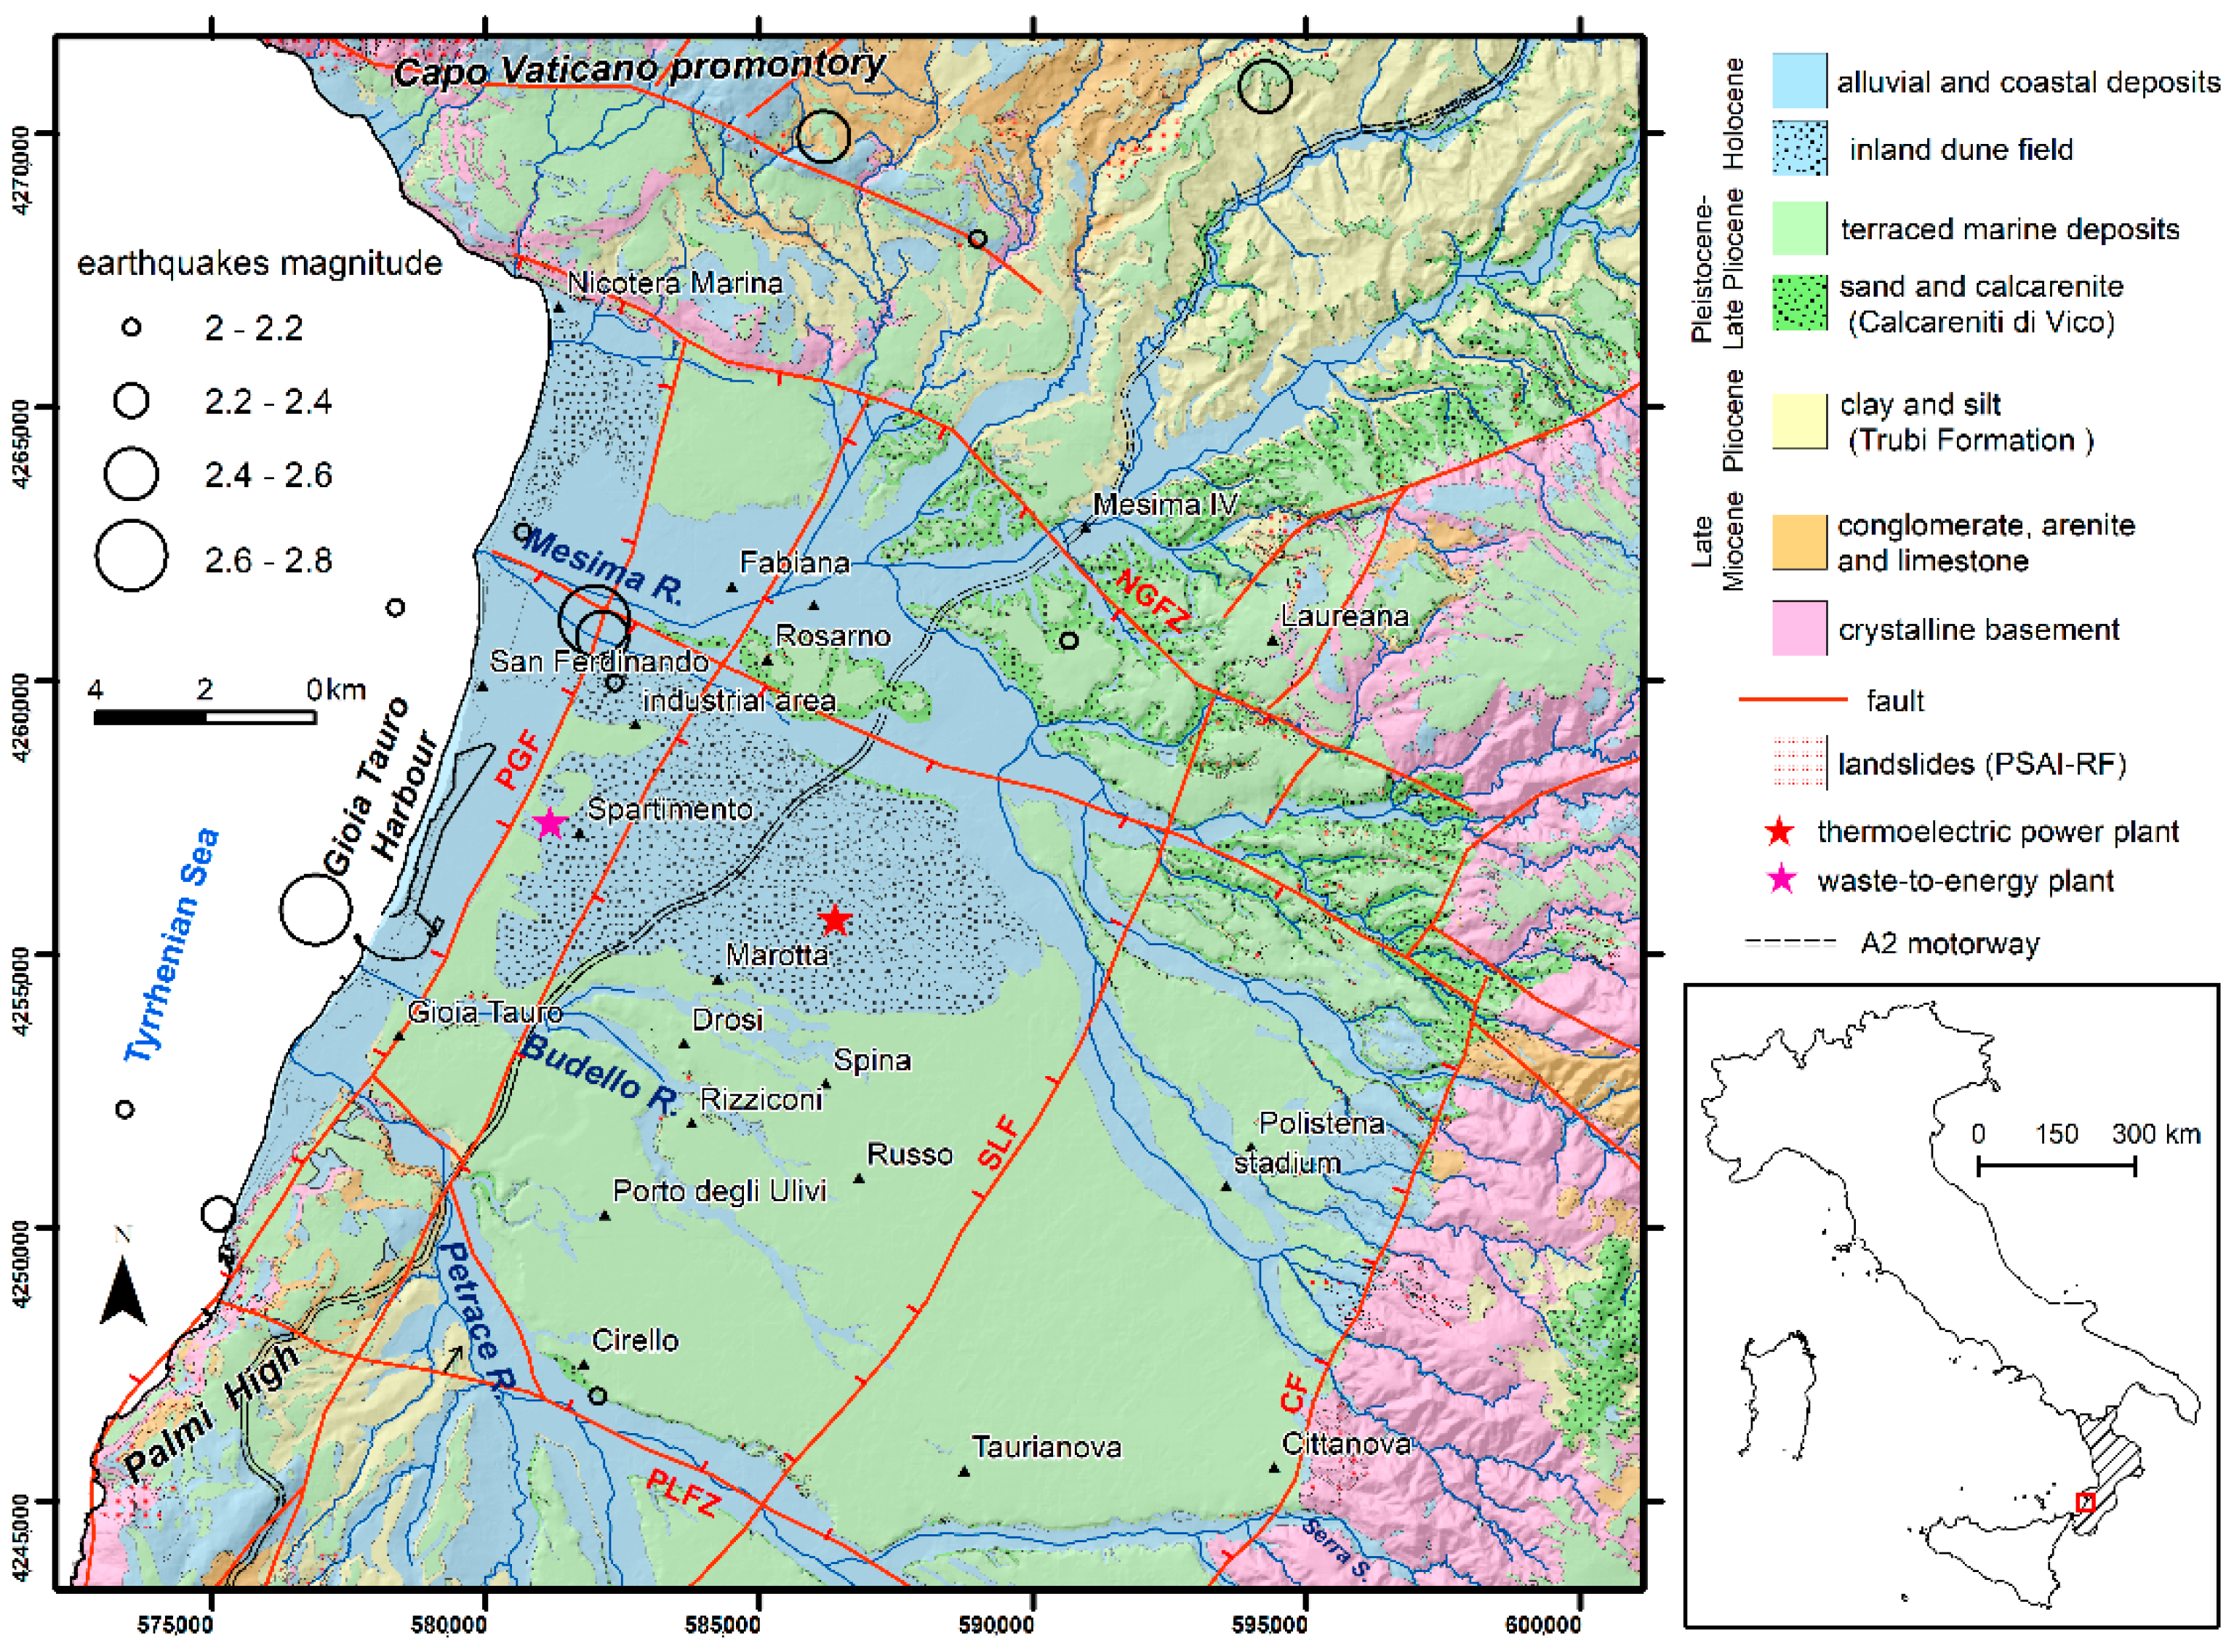
2. Study Area
3. Data and Methods
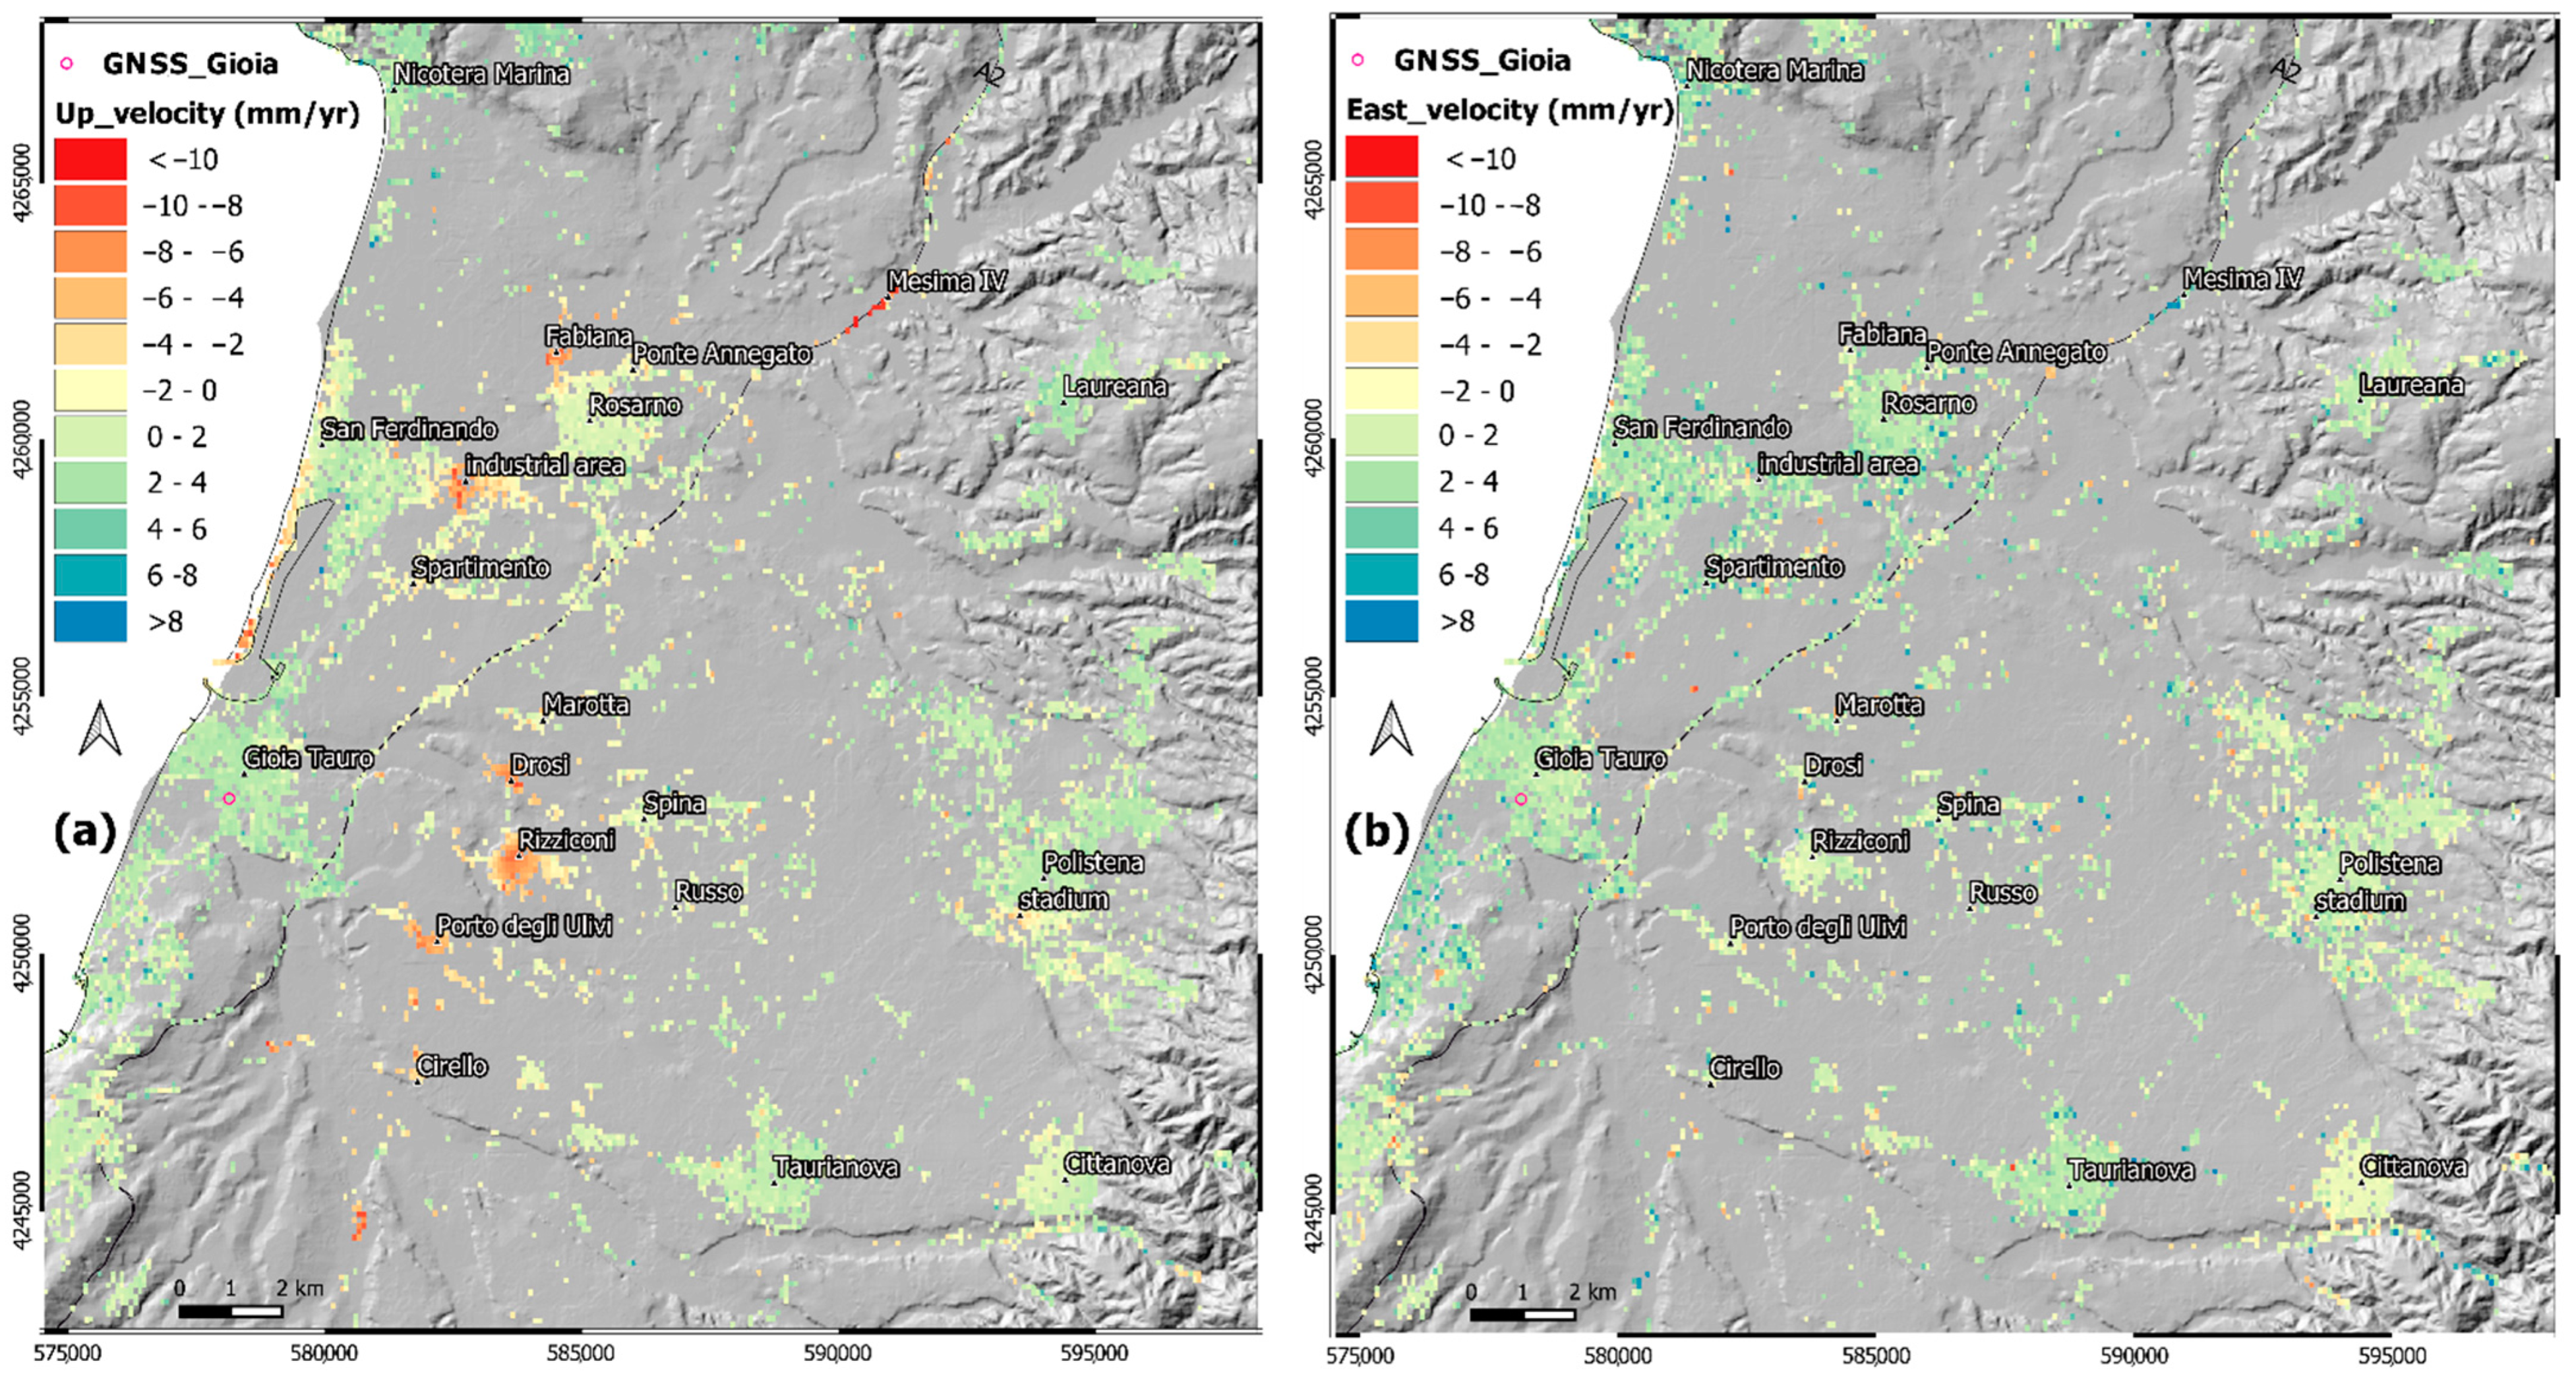
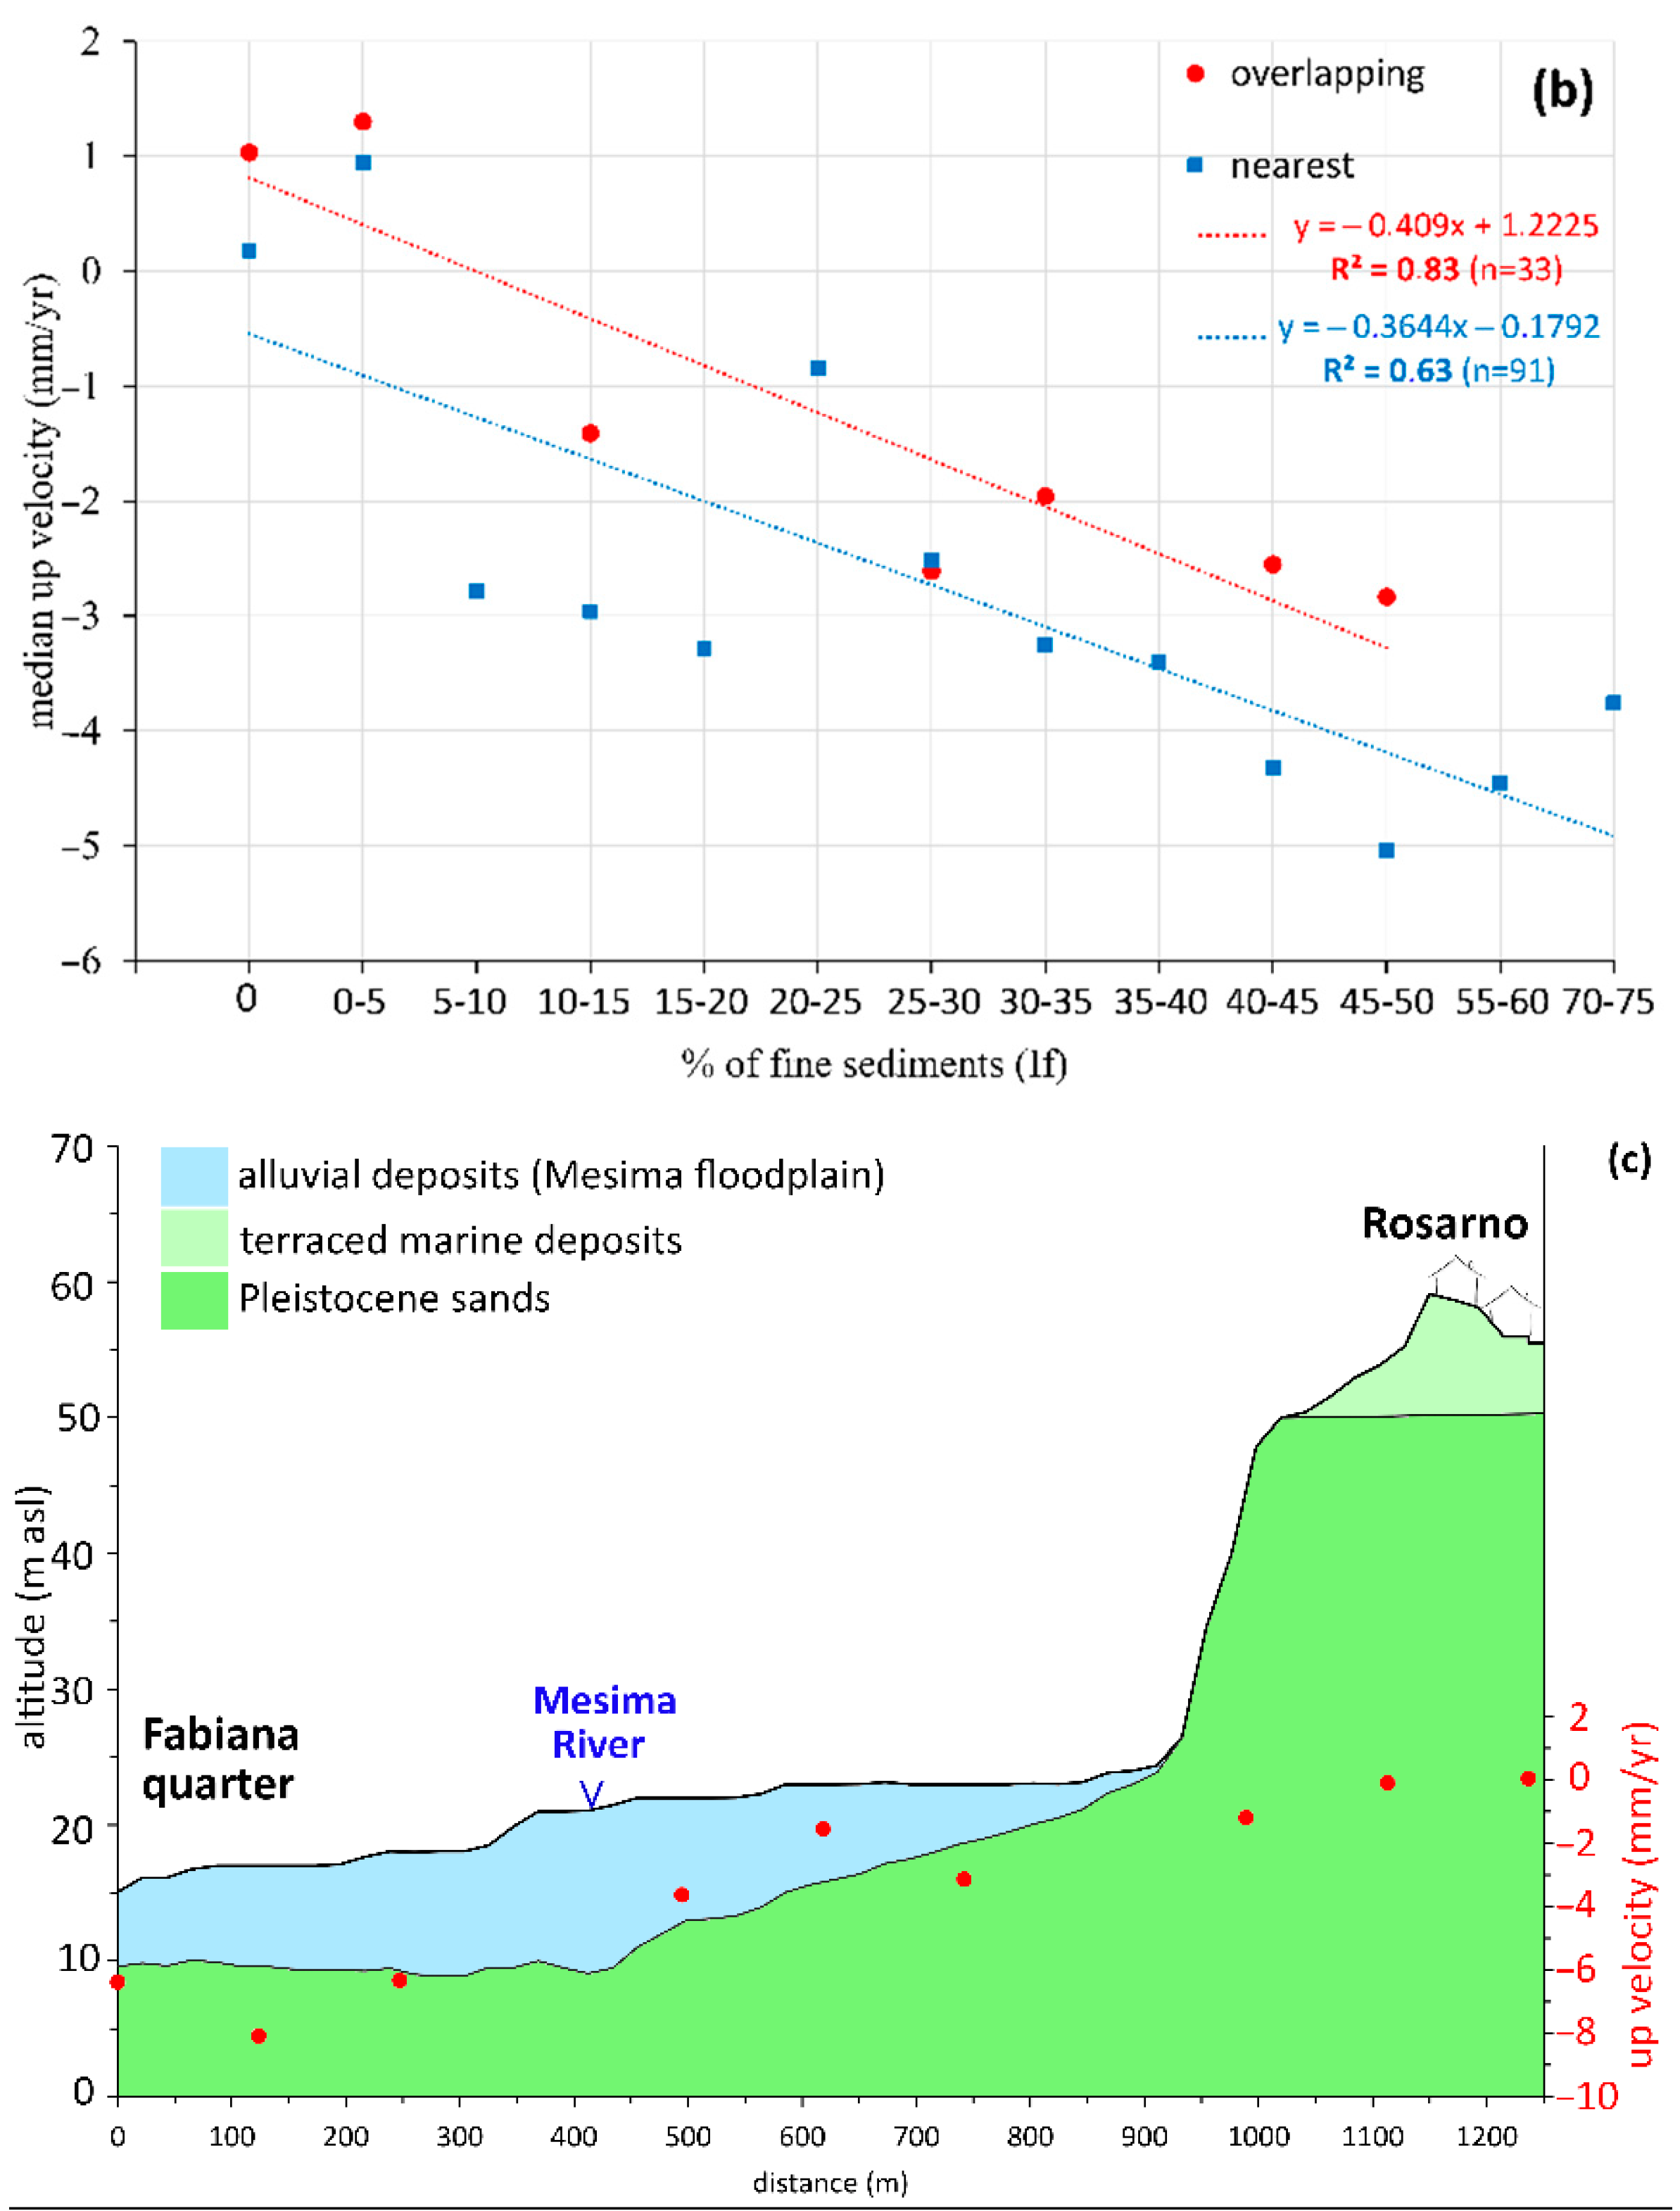
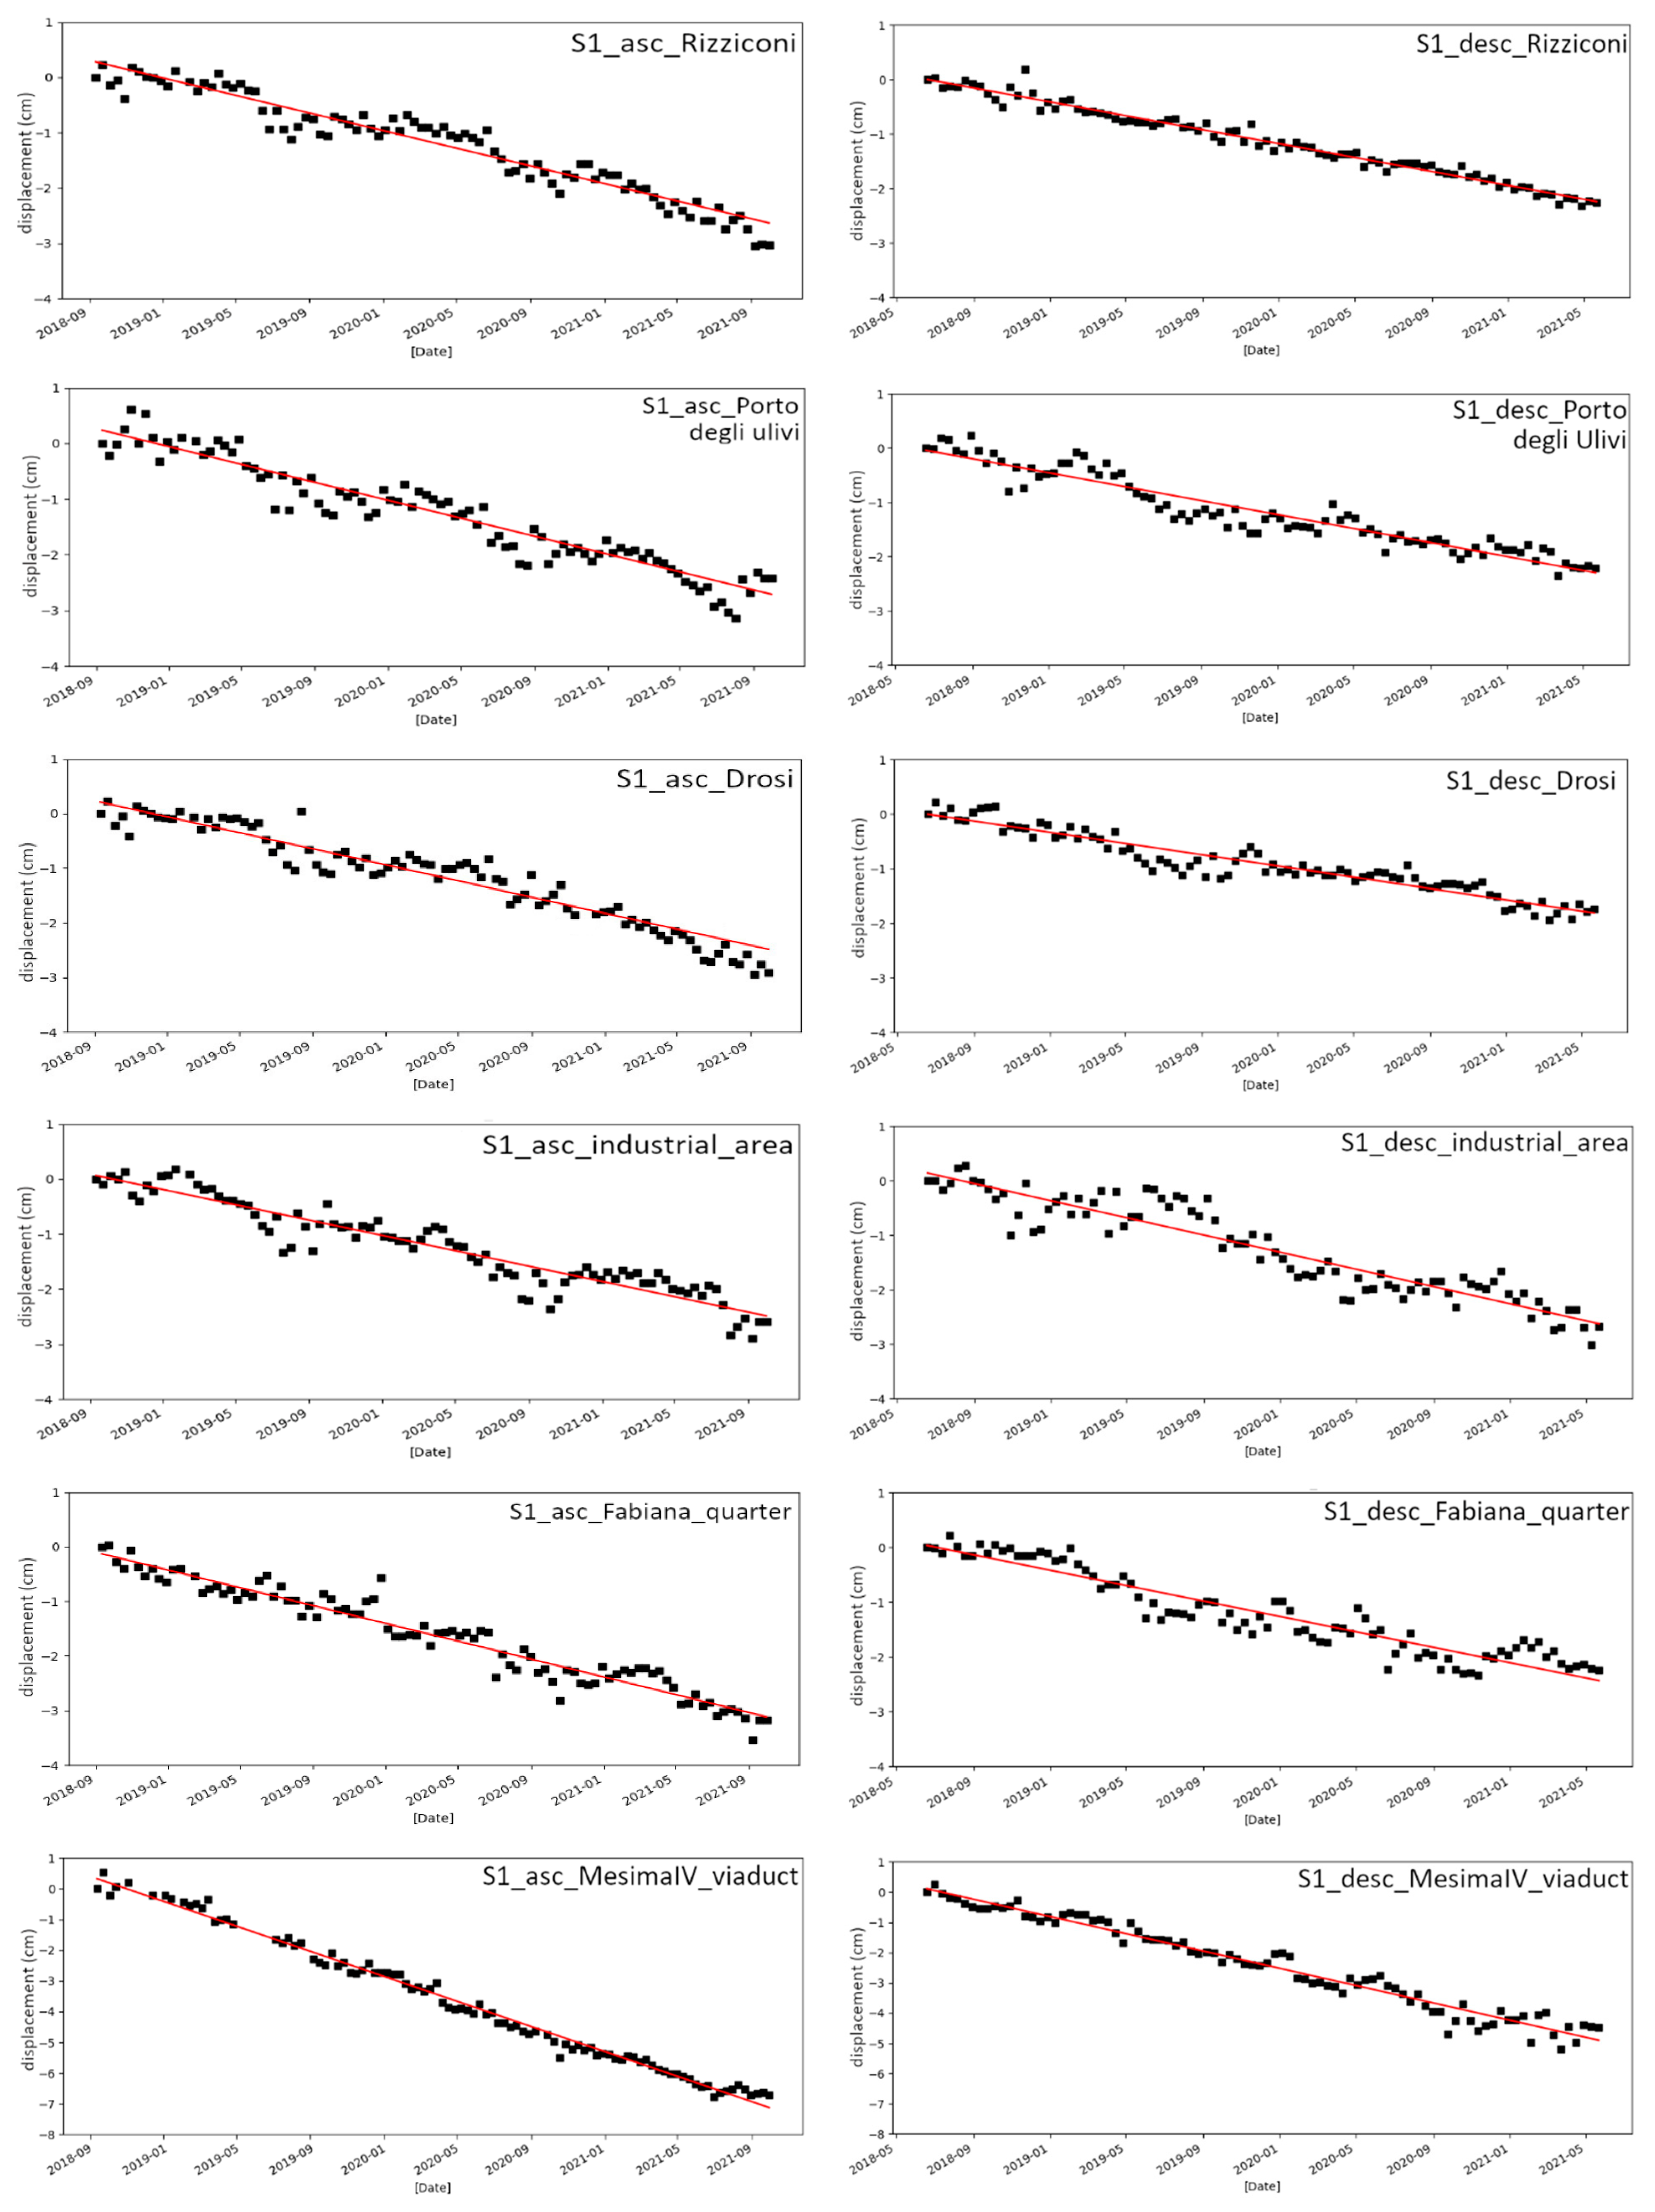
4. Results
5. Discussion

6. Concluding Remarks
Author Contributions
Funding
Institutional Review Board Statement
Informed Consent Statement
Data Availability Statement
Acknowledgments
Conflicts of Interest
References
- Martínez, M.L.; Intralawan, A.; Vázquez, G.; Pérez-Maqueo, O.; Sutton, P.; Landgrave, R. The coasts of our world: Ecological, economic and social importance. Ecol. Econ. 2007, 63, 254–272. [Google Scholar] [CrossRef]
- Costanza, R.; d’Arge, R.; de Groot, R.; Farber, S.; Grasso, M.; Hannon, B.; Naeem, S.; Limburg, K.; Paruelo, J.; O’Neill, R.V.; et al. The value of the world’s ecosystem services and natural capital. Nature 1997, 387, 253–260. [Google Scholar] [CrossRef]
- McGranahan, G.; Balk, D.; Anderson, B. The rising tide: Assessing the risks of climate change and human settlements in low elevation coastal zones. Environ. Urban. 2007, 19, 17–37. [Google Scholar] [CrossRef]
- Psaraftis, H.N. The Future of Maritime Transport. In International Encyclopedia of Transportation; Elsevier: Amsterdam, The Netherlands, 2021; pp. 535–539. ISBN 9780081026724. [Google Scholar]
- Melet, A.; Teatini, P.; Le Cozannet, G.; Jamet, C.; Conversi, A.; Benveniste, J.; Almar, R. Earth Observations for Monitoring Marine Coastal Hazards and Their Drivers. Surv. Geophys. 2020, 41, 1489–1534. [Google Scholar] [CrossRef]
- Polemio, M.; Zuffianò, L.E. Review of Utilization Management of Groundwater at Risk of Salinization. J. Water Resour. Plan. Manag. 2020, 146, 20. [Google Scholar] [CrossRef]
- Polemio, M. Monitoring and management of karstic coastal groundwater in a changing environment (Southern Italy): A review of a regional experience. Water 2016, 8, 148. [Google Scholar] [CrossRef] [Green Version]
- Vespasiano, G.; Cianflone, G.; Cannata, C.B.; Apollaro, C.; Dominici, R.; De Rosa, R. Analysis of groundwater pollution in the Sant’Eufemia Plain (Calabria—South Italy). Ital. J. Eng. Geol. Environ. 2016, 2, 5–15. [Google Scholar] [CrossRef]
- Vespasiano, G.; Cianflone, G.; Romanazzi, A.; Apollaro, C.; Dominici, R.; Polemio, M.; De Rosa, R. A multidisciplinary approach for sustainable management of a complex coastal plain: The case of Sibari Plain (Southern Italy). Mar. Pet. Geol. 2019, 109, 710–759. [Google Scholar] [CrossRef]
- Haruyama, S. Introduction-overview of natural disasters and coastal landforms. In Natural Disaster and Coastal Geomorphology; Haruyama, S., Sugai, T., Eds.; Springer: Cham, Switzerland, 2016; pp. 1–13. [Google Scholar] [CrossRef]
- Punzo, M.; Lanciano, C.; Tarallo, D.; Bianco, F.; Cavuoto, G.; De Rosa, R.; Di Fiore, V.; Cianflone, G.; Dominici, R.; Iavarone, M.; et al. Application of X-Band Wave Radar for coastal dynamic analysis: Case test of Bagnara Calabra (south Tyrrhenian Sea, Italy). J. Sens. 2016, 6236925. [Google Scholar] [CrossRef] [Green Version]
- Sanford, W.; Langevin, C.; Polemio, M.; Povinec, P. A new focus on groundwater seawater interactions. In A New Focus on Groundwater-Seawater Interactions; Sanford, W., Langevin, C., Polemio, M., Povinec, P., Eds.; IAHS Press: Wallingford, UK, 2007; Volume 312, pp. V–VI. [Google Scholar]
- Sarker, M.M.R.; Van Camp, M.; Hossain, D.; Islam, M.; Ahmed, N.; Karim, M.M.; Walraevens, K. Groundwater salinization and freshening processes in coastal aquifers from southwest Bangladesh. Sci. Total Environ. 2021, 779, 146339. [Google Scholar] [CrossRef]
- Guzy, A.; Malinowska, A.A. State of the Art and Recent Advancements in the Modelling of Land Subsidence Induced by Groundwater Withdrawal. Water 2020, 12, 2051. [Google Scholar] [CrossRef]
- Zhou, C.; Gong, H.; Chen, B.; Gao, M.; Cao, Q.; Cao, J.; Duan, L.; Zuo, J.; Shi, M. Land Subsidence Response to Different Land Use Types and Water Resource Utilization in Beijing–Tianjin–Hebei, China. Remote Sens. 2020, 12, 457. [Google Scholar] [CrossRef] [Green Version]
- Ferretti, A.; Prati, C.; Rocca, F. Permanent scatters in SAR interferometry. IEEE Trans. Geosci. Remote Sens. 2001, 39, 8–20. [Google Scholar] [CrossRef]
- Ferretti, A.; Fumagalli, A.; Novali, F.; Prati, C.; Rocca, F.; Rucci, A. A New Algorithm for Processing Interferometric Data-Stacks: SqueeSAR. IEEE Trans. Geosci. Remote Sens. 2011, 49, 3460–3470. [Google Scholar] [CrossRef]
- Berardino, P.; Fornaro, G.; Lanari, R.; Sansosti, E. A new algorithm for surface deformation monitoring based on small baseline differential SAR interferograms. IEEE Trans. Geosci. Remote Sens. 2002, 40, 2375–2383. [Google Scholar] [CrossRef] [Green Version]
- Hooper, A. A multi-temporal InSAR method incorporating both persistent scatterer and small baseline approaches. Geophys. Res. Lett. 2008, 35, 1–5. [Google Scholar] [CrossRef] [Green Version]
- Crosetto, M.; Monserrat, O.; Cuevas-González, M.; Devanthéry, N.; Crippa, B. Persistent Scatterer Interferometry: A Review. ISPRS J. Photogramm. Remote Sens. 2016, 115, 78–89. [Google Scholar] [CrossRef] [Green Version]
- Cianflone, G.; Tolomei, C.; Brunori, C.A.; Monna, S.; Dominici, R. Landslides and subsidence assessment in the Crati Valley (Southern Italy) using InSAR data. Geosciences 2018, 8, 67. [Google Scholar] [CrossRef] [Green Version]
- Cian, F.; Blasco, J.M.D.; Carrera, L. Sentinel-1 for Monitoring Land Subsidence of Coastal Cities in Africa Using PSInSAR: A Methodology Based on the Integration of SNAP and StaMPS. Geosciences 2019, 9, 124. [Google Scholar] [CrossRef] [Green Version]
- Sousa, J.J.; Liu, G.; Fan, J.; Perski, Z.; Steger, S.; Bai, S.; Wei, L.; Salvi, S.; Wang, Q.; Tu, J.; et al. Geohazards Monitoring and Assessment Using Multi-Source Earth Observation Techniques. Remote Sens. 2021, 13, 4269. [Google Scholar] [CrossRef]
- Poreh, D.; Pirasteh, S.; Cabral-Cano, E. Assessing subsidence of Mexico City from InSAR and LandSat ETM+ with CGPS and SVM. Geoenviron. Disasters 2021, 8, 7. [Google Scholar] [CrossRef]
- Raspini, F.; Cigna, F.; Moretti, S.; Casagli, N. Advanced Terrain Mapping of the Gioia Tauro Plain Calabria Region, Italy; ESA GMES Terrafirma, Proceedings and Report 78; Firenze University Press: Firenze, Italy, 2011. [Google Scholar] [CrossRef]
- Righini, G.; Raspini, F.; Moretti, S.; Cigna, F. Unsustainable use of groundwater resources in agricultural and urban areas: A Persistent Scatterer study of land subsidence at the basin scale. In Ecosystems and Sustainable Development, VIII; Brebbia, C.A., Tiezzi, E., Villacampa Esteve, Y., Eds.; WIT Press: Southampton, UK, 2011; Volume 144, pp. 81–92. [Google Scholar]
- Raspini, F.; Cigna, F.; Moretti, S. Multi-temporal mapping of land subsidence at basin scale exploiting Persistent Scatterer Interferometry: Case study of Gioia Tauro plain (Italy). J. Maps 2012, 8, 514–524. [Google Scholar] [CrossRef] [Green Version]
- Tripodi, V.; Muto, F.; Brutto, F.; Perri, F.; Critelli, S. Neogene-Quaternary evolution of the forearc and backarc regions between the Serre and Aspromonte Massifs, Calabria (southern Italy). Mar. Pet. Geol. 2018, 95, 328–343. [Google Scholar] [CrossRef]
- ISIDe Working Group. Italian Seismological Instrumental and Parametric Database (ISIDe); Istituto Nazionale di Geofisica e Vulcanologia (INGV): Rome, Italy, 2007. [CrossRef]
- PSAI-RF (Piano Stralcio per l’Assetto Idrogeologico—Rischio di Frana). Available online: http://www.distrettoappenninomeridionale.it/index.php/elaborati-di-piano-menu/ex-adb-calabria-menu/piano-stralcio-assetto-idrogeologico-rischio-da-frana-articolo (accessed on 10 October 2021).
- Monaco, C.; Tortorici, L. Active faulting in the Calabrian arc and eastern Sicily. J. Geodyn. 2000, 29, 407–424. [Google Scholar] [CrossRef]
- Cirrincione, R.; Fazio, E.; Fiannacca, P.; Ortolano, G.; Pezzino, A.; Punturo, R. The Calabria-Peloritani Orogen, a composite terrane in Central Mediterranean; its overall architecture and geodynamic significance for a pre-Alpine scenario around the Tethyan basin. Period. Mineral. 2015, 84, 701–749. [Google Scholar] [CrossRef]
- Jacques, E.; Monaco, C.; Tapponnier, P.; Tortorici, L.; Winter, T. Faulting and earthquake triggering during the 1783 Calabria seismic sequence. Geophys. J. Int. 2001, 147, 499–516. [Google Scholar] [CrossRef] [Green Version]
- Galli, P.; Bosi, V. Paleoseismology along the Cittanova fault: Implications for seismotectonics and earthquake recurrence in Calabria (southern Italy). J. Geophys. Res. 2002, 107, 2044. [Google Scholar] [CrossRef]
- Galli, P.; Peronace, E. Low slip rates and multimillennial return times for Mw 7 earthquake faults in southern Calabria (Italy). Geophys. Res. Lett. 2015, 42, 5258–5265. [Google Scholar] [CrossRef] [Green Version]
- Valensise, G.; D’Addezio, G. Il contributo della geologia di superficie all’identificazione delle strutture sismogenetiche della Piana di Gioia Tauro. In Internal Report 559; Istituto Nazionale di Geofisica: Bologna, Italy, 1994; 21p. [Google Scholar]
- ISPRA. Foglio 590-Taurianova. In Carta Geologica d’Italia alla Scala 1:50,000; Istituto Superiore per la Protezione e la Ricerca Ambientale: Roma, Italy, 2016. [Google Scholar]
- De Rosa, R.; Dominici, R.; Donato, P.; Barca, D. Widespread syn-eruptive volcaniclastic deposits in the Pleistocenic basins of South-Western Calabria. J. Volcanol. Geotherm. Res. 2008, 177, 155–169. [Google Scholar] [CrossRef]
- Longhitano, S.G.; Chiarella, D.; Di Stefano, A.; Messina, C.; Sabato, L.; Tropeano, M. Tidal signatures in Neogene to Quaternary mixed deposits of southern Italy straits and bays. Sediment. Geol. 2012, 279, 74–96. [Google Scholar] [CrossRef]
- Borrelli, L.; Antronico, L.; Le Pera, E.; Pisano, B.; Sorriso-Valvo, M. Morphology, properties, and source of windblown sediments of the coastal dune field in the Gioia Tauro Plain, Calabria, southern Italy. Catena 2021, 201, 105193. [Google Scholar] [CrossRef]
- Cianflone, G.; Vespasiano, G.; De Rosa, R.; Dominici, R.; Apollaro, C.; Vaselli, O.; Pizzino, L.; Tolomei, C.; Capecchiacci, F.; Polemio, M. Hydrostratigraphic Framework and Physicochemical Status of Groundwater in the Gioia Tauro Coastal Plain (Calabria—Southern Italy). Water 2021, 13, 3279. [Google Scholar] [CrossRef]
- Federico, S.; Avolio, E.; Pasqualoni, L.; De Leo, L.; Sempreviva, A.M.; Bellecci, C. Preliminary results of a 30-year daily rainfall data base in southern Italy. Atmos. Res. 2009, 94, 641–651. [Google Scholar] [CrossRef]
- Massonnet, D.; Feigl, K.; Rossi, M.; Adragna, F. Radar interferometric mapping of deformation in the year after the Landers earthquake. Nature 1994, 369, 227–230. [Google Scholar] [CrossRef]
- Zebker, H.A.; Rosen, P.A.; Goldstein, R.M.; Gabriel, A.; Werner, C.L. On the derivation of coseismic displacement fields using differential radar interferometry: The Landers earthquake. J. Geophys. Res. 1994, 99, 19617–19634. [Google Scholar] [CrossRef]
- Du, Z.; Ge, L.; Li, X.; Ng, A.H.-M. Subsidence monitoring in the Ordos basin using integrated SAR differential and time-series interferometry techniques. Remote Sens. Lett. 2016, 7, 180–189. [Google Scholar] [CrossRef]
- Kampes, B.M. Radar Interferometry: Persistent Scatterer Technique; Springer: Dordrecht, The Netherlands, 2006. [Google Scholar]
- Lanari, R.; Mora, O.; Manunta, M.; Mallorquí, J.J.; Berardino, P.; Sansosti, E. A small-baseline approach for investigating deformations on full-resolution differential SAR interferograms. IEEE Trans. Geosci. Remote Sens. 2004, 42, 1377–1386. [Google Scholar] [CrossRef]
- Casu, F.; Manzo, M.; Lanari, R. A quantitative assessment of the SBAS algorithm performance for surface deformation retrieval from DInSAR data. Remote Sens. Environ. 2006, 102, 195–210. [Google Scholar] [CrossRef]
- Cigna, F.; Esquivel Ramírez, R.; Tapete, D. Accuracy of Sentinel-1 PSI and SBAS InSAR Displacement Velocities against GNSS and Geodetic Leveling Monitoring Data. Remote Sens. 2021, 13, 4800. [Google Scholar] [CrossRef]
- Farr, T.G.; Rosen, P.A.; Caro, E.; Crippen, R.; Duren, R.; Hensley, S.; Kobrick, M.; Paller, M.; Rodriguez, E.; Roth, L. The shuttle radar topography mission. Rev. Geophys. 2007, 45, RG2004. [Google Scholar] [CrossRef] [Green Version]
- Bamler, R.; Just, D. Phase statistics and decorrelation in SAR interferograms. In Proceedings of the IGARSS 1993—IEEE International Geoscience and Remote Sensing Symposium, Tokyo, Japan, 18–21 August 1993. [Google Scholar] [CrossRef]
- Dalla Via, G.; Crosetto, M.; Crippa, B. Resolving vertical and east-west horizontal motion from differential interferometric synthetic aperture radar: The L’Aquila earthquake. J. Geophys. Res. 2012, 117, B02310. [Google Scholar] [CrossRef] [Green Version]
- INGV RING Working Group. Rete Integrata Nazionale GNSS; Istituto Nazionale di Geofisica e Vulcanologia (INGV): Rome, Italy, 2016. [CrossRef]
- Blewitt, G.; Hammond, W.C.; Kreemer, C. Harnessing the GPS data explosion for interdisciplinary science. Eos 2018, 99. [Google Scholar] [CrossRef]
- Polemio, M.; Casarano, D. Climate change, drought and groundwater availability in southern Italy. Geol. Soc. Spec. Publ. 2008, 288, 39–51. [Google Scholar] [CrossRef] [Green Version]
- Polemio, M.; Petrucci, O. The occurrence of floods and the role of climate variations from 1880 in Calabria (Southern Italy). Nat. Hazards Earth Syst. Sci. 2012, 12, 129–142. [Google Scholar] [CrossRef] [Green Version]
- Comerci, V.; Blumetti, A.M.; Di Manna, P.; Fiorenza, D.; Guerrieri, L.; Lucarini, M.; Serva, L.; Vittori, E. ITHACA Project and capable faults in the Po Plain (Northern Italy). Ing. Sismica 2013, 30, 36–45. [Google Scholar]
- ISPRA-Indagininel Sottosuolo (L. 464/84). Available online: http://sgi2.isprambiente.it/viewersgi2/?title=ITA_Indagini_sottosuolo464&resource=wms%3Ahttp%3A//sgi2.isprambiente.it/arcgis/services/servizi/indagini464/MapServer/WMSServer%3Frequest%3DGetCapabilities%26service%3DWMS (accessed on 27 August 2021).
- Facciorusso, J.; Vannucchi, G. Liquefaction hazard maps of the harbour area of Gioia Tauro (Italy) by geo-statistical methods. In Proceeding of the 4th International Conference of Earthquake Engineering and Seismology, Tehran, Iran, 12–14 May 2003. [Google Scholar]
- Portale Cartografico della Microzonazione Sismica e della Condizione Limite per l’Emergenza. Available online: https://www.webms.it/servizi/viewer.php (accessed on 18 September 2021).
- Capocecera, P.; Carillo, A.; Fels, V.; Gorelli, O.; Iacurto, O.; Marzi, C.; Musmeci, F.; Paciello, A.; Vitiello, F. Caratterizzazione Sismica e Geologica del Sito di Gioia Tauro; Technical Report; Enea Direzione Centrale Relazioni: Rome, Italy, 1990. [Google Scholar]
- Casmez (Cassa Speciale per il Mezzogiorno). Progetto Speciale 26; CMP: Roma, Italy, 1987. [Google Scholar]
- Medici, G.; Principi, P. Le Bonifiche di San Eufemia e di Rosarno; Nuova Zanichelli: Bologna, Italy, 1939. [Google Scholar]
- Cianflone, G.; Tolomei, C.; Brunori, C.A.; Dominici, R. InSAR time series analysis of natural and anthropogenic coastal plain subsidence: The case of Sibari (southern Italy). Remote Sens. 2015, 7, 16004–16023. [Google Scholar] [CrossRef] [Green Version]
- Bessis, F. Some remarks on the study of subsidence of sedimentary basins Application to the Gulf of Lions margin (Western Mediterranean). Mar. Petrol. Geol. 1986, 3, 37–63. [Google Scholar] [CrossRef]
- Morley, C.K.; Westaway, R. Subsidence in the super-deep Pattani and Malay basins of Southeast Asia: A coupled model incorporating lower-crustal flow in response to post-rift sediment loading. Basin Res. 2006, 18, 51–84. [Google Scholar] [CrossRef]
- Tosi, L.; Teatini, P.; Carbognin, L.; Brancolini, G. Using high resolution data to reveal depth-dependent mechanisms that drive land subsidence: The Venice coast, Italy. Tectonophysics 2009, 474, 271–284. [Google Scholar] [CrossRef]
- Tomás, R.; Herrera, G.; Cooksley, G.; Mulas, J. Persistent Scatterer Interferometry subsidence data exploitation using spatial tools: The Vega Media of the Segura River Basin case study. J. Hydrol. 2011, 400, 411–428. [Google Scholar] [CrossRef]
- Bonì, R.; Herrera, G.; Meisina, C.; Notti, D.; Béjar-Pizarro, M.; Zucca, F.; González, P.J.; Palano, M.; Tomás, R.; Fernández, J.; et al. Twenty-year advanced DInSAR analysis of severe land subsidence: The Alto Guadalentín Basin (Spain) case study. Eng. Geol. 2015, 198, 40–52. [Google Scholar] [CrossRef] [Green Version]
- Bonì, R.; Pilla, G.; Meisina, C. Methodology for Detection and Interpretation of Ground Motion Areas with the A-DInSAR Time Series Analysis. Remote Sens. 2016, 8, 686. [Google Scholar] [CrossRef] [Green Version]
- Holzapfel, E.; Merino, R.; Mariño, M.; Matta, R. Water production functions in kiwi. Irrig. Sci. 2000, 19, 73–79. [Google Scholar] [CrossRef]
- Agrumicoltura—Meeting Calabria Maggio 2011. Available online: https://pdf4pro.com/view/agrumicoltura-agroforcosenza-1202f3.html (accessed on 2 October 2021).
- Food and Agriculture Organization (FAO). Land & Water. Available online: https://www.fao.org/land-water/databases-and-software/crop-information/olive/en/ (accessed on 2 October 2021).
- Demanio Idrico Regione Calabria. Available online: https://portale.regione.calabria.it/website/organizzazione/dipartimento11/subsite/settori/gestione_demanio_idrico/ (accessed on 5 October 2021).
- Servizi per il Territorio della Regione Calabria. Available online: http://pr5sit.regione.calabria.it/navigatore-sirv/index.html (accessed on 10 October 2021).
- Zhu, L.; Gong, H.; Li, X.; Wang, R.; Chen, B.; Dai, Z.; Teatini, P. Land subsidence due to groundwater withdrawal in the northern Beijing plain, China. Eng. Geol. 2015, 193, 243–255. [Google Scholar] [CrossRef]
- Caló, F.; Notti, D.; Galve, J.P.; Abdikan, S.; Görüm, T.; Pepe, A.; Balik Şanli, F. DInSAR-Based Detection of Land Subsidence and Correlation with Groundwater Depletion in Konya Plain, Turkey. Remote Sens. 2017, 9, 83. [Google Scholar] [CrossRef] [Green Version]
- Ezquerro, P.; Guardiola-Albert, C.; Herrera, G.; Fernández-Merodo, J.A.; Béjar-Pizarro, M.; Bonì, R. Groundwater and Subsidence Modeling Combining Geological and Multi-Satellite SAR Data over the Alto Guadalentín Aquifer (SE Spain). Geofluids 2017, 2017, 1359325. [Google Scholar] [CrossRef]
- Figueroa-Miranda, S.; Tuxpan-Vargas, J.; Ramos-Leal, J.A.; Hernández-Madrigal, V.M.; Villasenor-Reyes, C.I. Land subsidence by groundwater over-exploitation from aquifers in tectonic valleys of central Mexico: A review. Eng. Geol. 2018, 246, 91–106. [Google Scholar] [CrossRef]
- Watson, K.M.; Bock, Y.; Sandwell, D.T. Satellite interferometric observations of displacements associated with seasonal groundwater in the Los Angeles basin. J. Geophys. Res. Solid Earth 2002, 107, ETG-8. [Google Scholar] [CrossRef]
- Colesanti, C.; Ferretti, A.; Novali, F.; Prati, C.; Rocca, F. SAR monitoring of progressive and seasonal grounded formation using the permanent scatterers technique. IEEE Trans. Geosci. Remote Sens. 2003, 41, 1685–1701. [Google Scholar] [CrossRef] [Green Version]
- Castellazzi, P.; Arroyo-Domínguez, N.; Martel, R.; Calderhead, A.I.; Normand, J.C.L.; Gárfias, J.; Rivera, A. Land subsidence in major cities of Central Mexico: Interpreting InSAR-derived land subsidence mapping with hydrogeological data. Int. J. Appl. Earth Obs. Geoinf. 2016, 47, 102–111. [Google Scholar] [CrossRef]
- Casalbore, D.; Romagnoli, C.; Bosman, A.; Anzidei, M.; Chiocci, F.L. Coastal hazard due to submarine canyons in active insular volcanoes: Examples from Lipari Island (southern Tyrrhenian Sea). J. Coast. Conserv. 2018, 22, 989–999. [Google Scholar] [CrossRef]
- Colantoni, P.; Gennesseaux, M.; Vanney, J.R.; Ulzeca, A.; Melegari, G.; Trombetta, A. Processi dinamici del canyon sottomarino di Gioia Tauro (Mare Tirreno). G. Geol. 1992, 54, 190–213. [Google Scholar]
- Talling, P.J.; Paull, C.K.; Piper, D.J.W. How are subaqueous sediment density flows triggered, what is their internal structure and how does it evolve? Direct observations from monitoring of active flows. Earth-Sci. Rev. 2013, 125, 244–287. [Google Scholar] [CrossRef] [Green Version]
- Tommasi, P.; Graziani, A.; Rotonda, T.; Bevivino, C. Preliminary analysis of instability phenomena at Vulcano Island, Italy. In Proceedings of the 2nd ISRM International Workshop on Volcanic Rocks, Ponta Delgada, Portugal, 14–15 July 2007; Malheiro, N., Ed.; Taylor & Francis Group: London, UK, 2007; pp. 147–154. [Google Scholar]
- Casalbore, D.; Romagnoli, C.; Bosman, A.; Chiocci, F.L. Study of recent small-scale landslides in geologically active marine areas through repeated multibeam surveys: Examples from the southern Italy. In Proceedings of the Advances in Natural and Technological Hazards Research; Yamada, T., Kawamura, K., Ikehara, K., Ogawa, Y., Urgeles, R., Mosher, D., Chaytor, J., Strasser, M., Eds.; Springer: Dordrecht, The Netherlands, 2012; pp. 573–582. [Google Scholar]
- Magic Project. Available online: https://github.com/pcm-dpc/MaGIC/blob/master/MaGIC-1/fogli/dati/15-Gioia/geotiff/15-shaded-batimetria.tfw (accessed on 15 October 2021).
- Bru, G.; Herrera, G.; Tomás, R.; Duro, J.; De la Vega, R.; Mulas, J. Control of deformationof buildings affected by subsidence using persistent scatterer interferometry. Struct. Infrastruct. Eng. 2010, 9, 188–200. [Google Scholar] [CrossRef]
- Lixin, Y.; Jie, W.; Chuanqing, S.; Guo, J.; Yanxiang, J.; Liu, B. Land subsidence disaster survey and its economic loss assessment in Tianjin, China. Nat. Hazards Rev. 2010, 11, 35–41. [Google Scholar] [CrossRef]


Publisher’s Note: MDPI stays neutral with regard to jurisdictional claims in published maps and institutional affiliations. |
© 2022 by the authors. Licensee MDPI, Basel, Switzerland. This article is an open access article distributed under the terms and conditions of the Creative Commons Attribution (CC BY) license (https://creativecommons.org/licenses/by/4.0/).
Share and Cite
Cianflone, G.; Vespasiano, G.; Tolomei, C.; De Rosa, R.; Dominici, R.; Apollaro, C.; Walraevens, K.; Polemio, M. Different Ground Subsidence Contributions Revealed by Integrated Discussion of Sentinel-1 Datasets, Well Discharge, Stratigraphical and Geomorphological Data: The Case of the Gioia Tauro Coastal Plain (Southern Italy). Sustainability 2022, 14, 2926. https://0-doi-org.brum.beds.ac.uk/10.3390/su14052926
Cianflone G, Vespasiano G, Tolomei C, De Rosa R, Dominici R, Apollaro C, Walraevens K, Polemio M. Different Ground Subsidence Contributions Revealed by Integrated Discussion of Sentinel-1 Datasets, Well Discharge, Stratigraphical and Geomorphological Data: The Case of the Gioia Tauro Coastal Plain (Southern Italy). Sustainability. 2022; 14(5):2926. https://0-doi-org.brum.beds.ac.uk/10.3390/su14052926
Chicago/Turabian StyleCianflone, Giuseppe, Giovanni Vespasiano, Cristiano Tolomei, Rosanna De Rosa, Rocco Dominici, Carmine Apollaro, Kristine Walraevens, and Maurizio Polemio. 2022. "Different Ground Subsidence Contributions Revealed by Integrated Discussion of Sentinel-1 Datasets, Well Discharge, Stratigraphical and Geomorphological Data: The Case of the Gioia Tauro Coastal Plain (Southern Italy)" Sustainability 14, no. 5: 2926. https://0-doi-org.brum.beds.ac.uk/10.3390/su14052926