
Concentration of Microplastics in Road Dust as a Function of the Drying Period—A Case Study in G City, Korea

1
Civil and Environmental Engineering, University of Science and Technology, Daejeon 34113, Korea
2
Department of Environment Research, Korea Institute of Civil Engineering and Building Technology (KICT), Goyang 10223, Korea
*
Author to whom correspondence should be addressed.
Sustainability 2022, 14(5), 3006; https://0-doi-org.brum.beds.ac.uk/10.3390/su14053006
Submission received: 1 December 2021
/
Revised: 2 February 2022
/
Accepted: 28 February 2022
/
Published: 4 March 2022
(This article belongs to the Topic Solid Waste Management)
Abstract
:Microplastics (MPs) are plastic particles < 5 mm in diameter, which are detected in air, soil, and water, causing various environmental problems. In total, 37.3% of MPs are generated from point pollution sources and 62.7% from non-point sources; most of the non-point-source MPs are from vehicles tires, road-marking paint, and bitumen used in road pavements. In this study, the concentrations of MPs generated from roads in Goyang city, South Korea, were examined in terms of the drying period (0, 1, 2, or 3 d). Road dust sampling was performed at the kerb and quantitative and qualitative analyses were conducted for each sample. The MP concentrations were 552 (±39) MPs g−1 for a 0 d drying period and 1530 (±602) MPs g−1 for a 3 d drying period, confirming that the MP concentration in road dust increased with the increase in drying period. Among the detected substances, black particles accounted for the highest proportion (72%) and were found to be bitumen and tyre particles. This study also confirmed that the MPs accumulated on roads were washed away when rainfall exceeded a certain amount.
1. Introduction
Microplastics (MPs) are plastic particles (<5 mm in size) that are either intentionally manufactured or generated from the breakdown of plastic debris [1]. MPs, which act as carriers of chemicals and pollutants, are detected in air, soil, and water, posing a threat to the environment and human health [2,3,4,5].
The sources of MPs are divided into point (e.g., effluent from factories and sewage treatment plants) and non-point (e.g., runoff from parking lots, roads, farms, etc.) pollution sources; 37.3% of MPs are generated from point sources, while 62.7% are from non-point sources [6]. Point pollution sources are usually treated emission sources that can be controlled. However, non-point pollution sources flow into aquatic environments from various sources, such as wind, stormwater, road runoff, snow dumping, and mismanaged waste [7,8], and they are difficult to manage.
Road dust is the main non-point pollutant source of MPs, primarily originating from tyres, bitumen, and road-marking paint [9,10]. Tyres consist of 60% styrene butadiene rubber and are combined with various additives and natural rubber [9,11]. Styrene-butadiene-styrene, which is a thermoplastic elastomer, is mainly used in bitumen, while styrene-isoprene-styrene, ethylene-vinyl-acetate, polyamide, and polyacrylate are mainly added to road-marking paint to improve its performance [9,12].
Road dust, which is one of the major MP emission sources that enters the environment, is recognized by many researchers, and various countries such as Iran, India, Japan, Vietnam and Nepal have studied MPs contained in road dust (Table 1) [13,14,15]. These previous studies reported the contamination status based on particle quantification (particles per weight or area). From the MPs accumulated on road surfaces, 90–95% was expected to flow into soil, rivers, and oceans via rainfall runoff [16,17,18,19]. Once MPs flow into the aquatic environment, their treatment becomes difficult as 90% of them accumulate in sediments [20]. Therefore, MPs in road dust should be dealt with before it is washed away by rainfall.
As MPs contained in road dust mainly flowed into the aquatic environment by rainfall, we hypothesized that MPs on the road would accumulate as the drying period increases. Hence, this study aimed to identify the correlation between the concentration of MPs in road dust and the drying period. In addition, the characteristics of MPs such as the morphology of MPs (size, form and color etc.) and the chemical composition of MPs detected in road dust were investigated.
2. Materials and Methods
2.1. Study Site
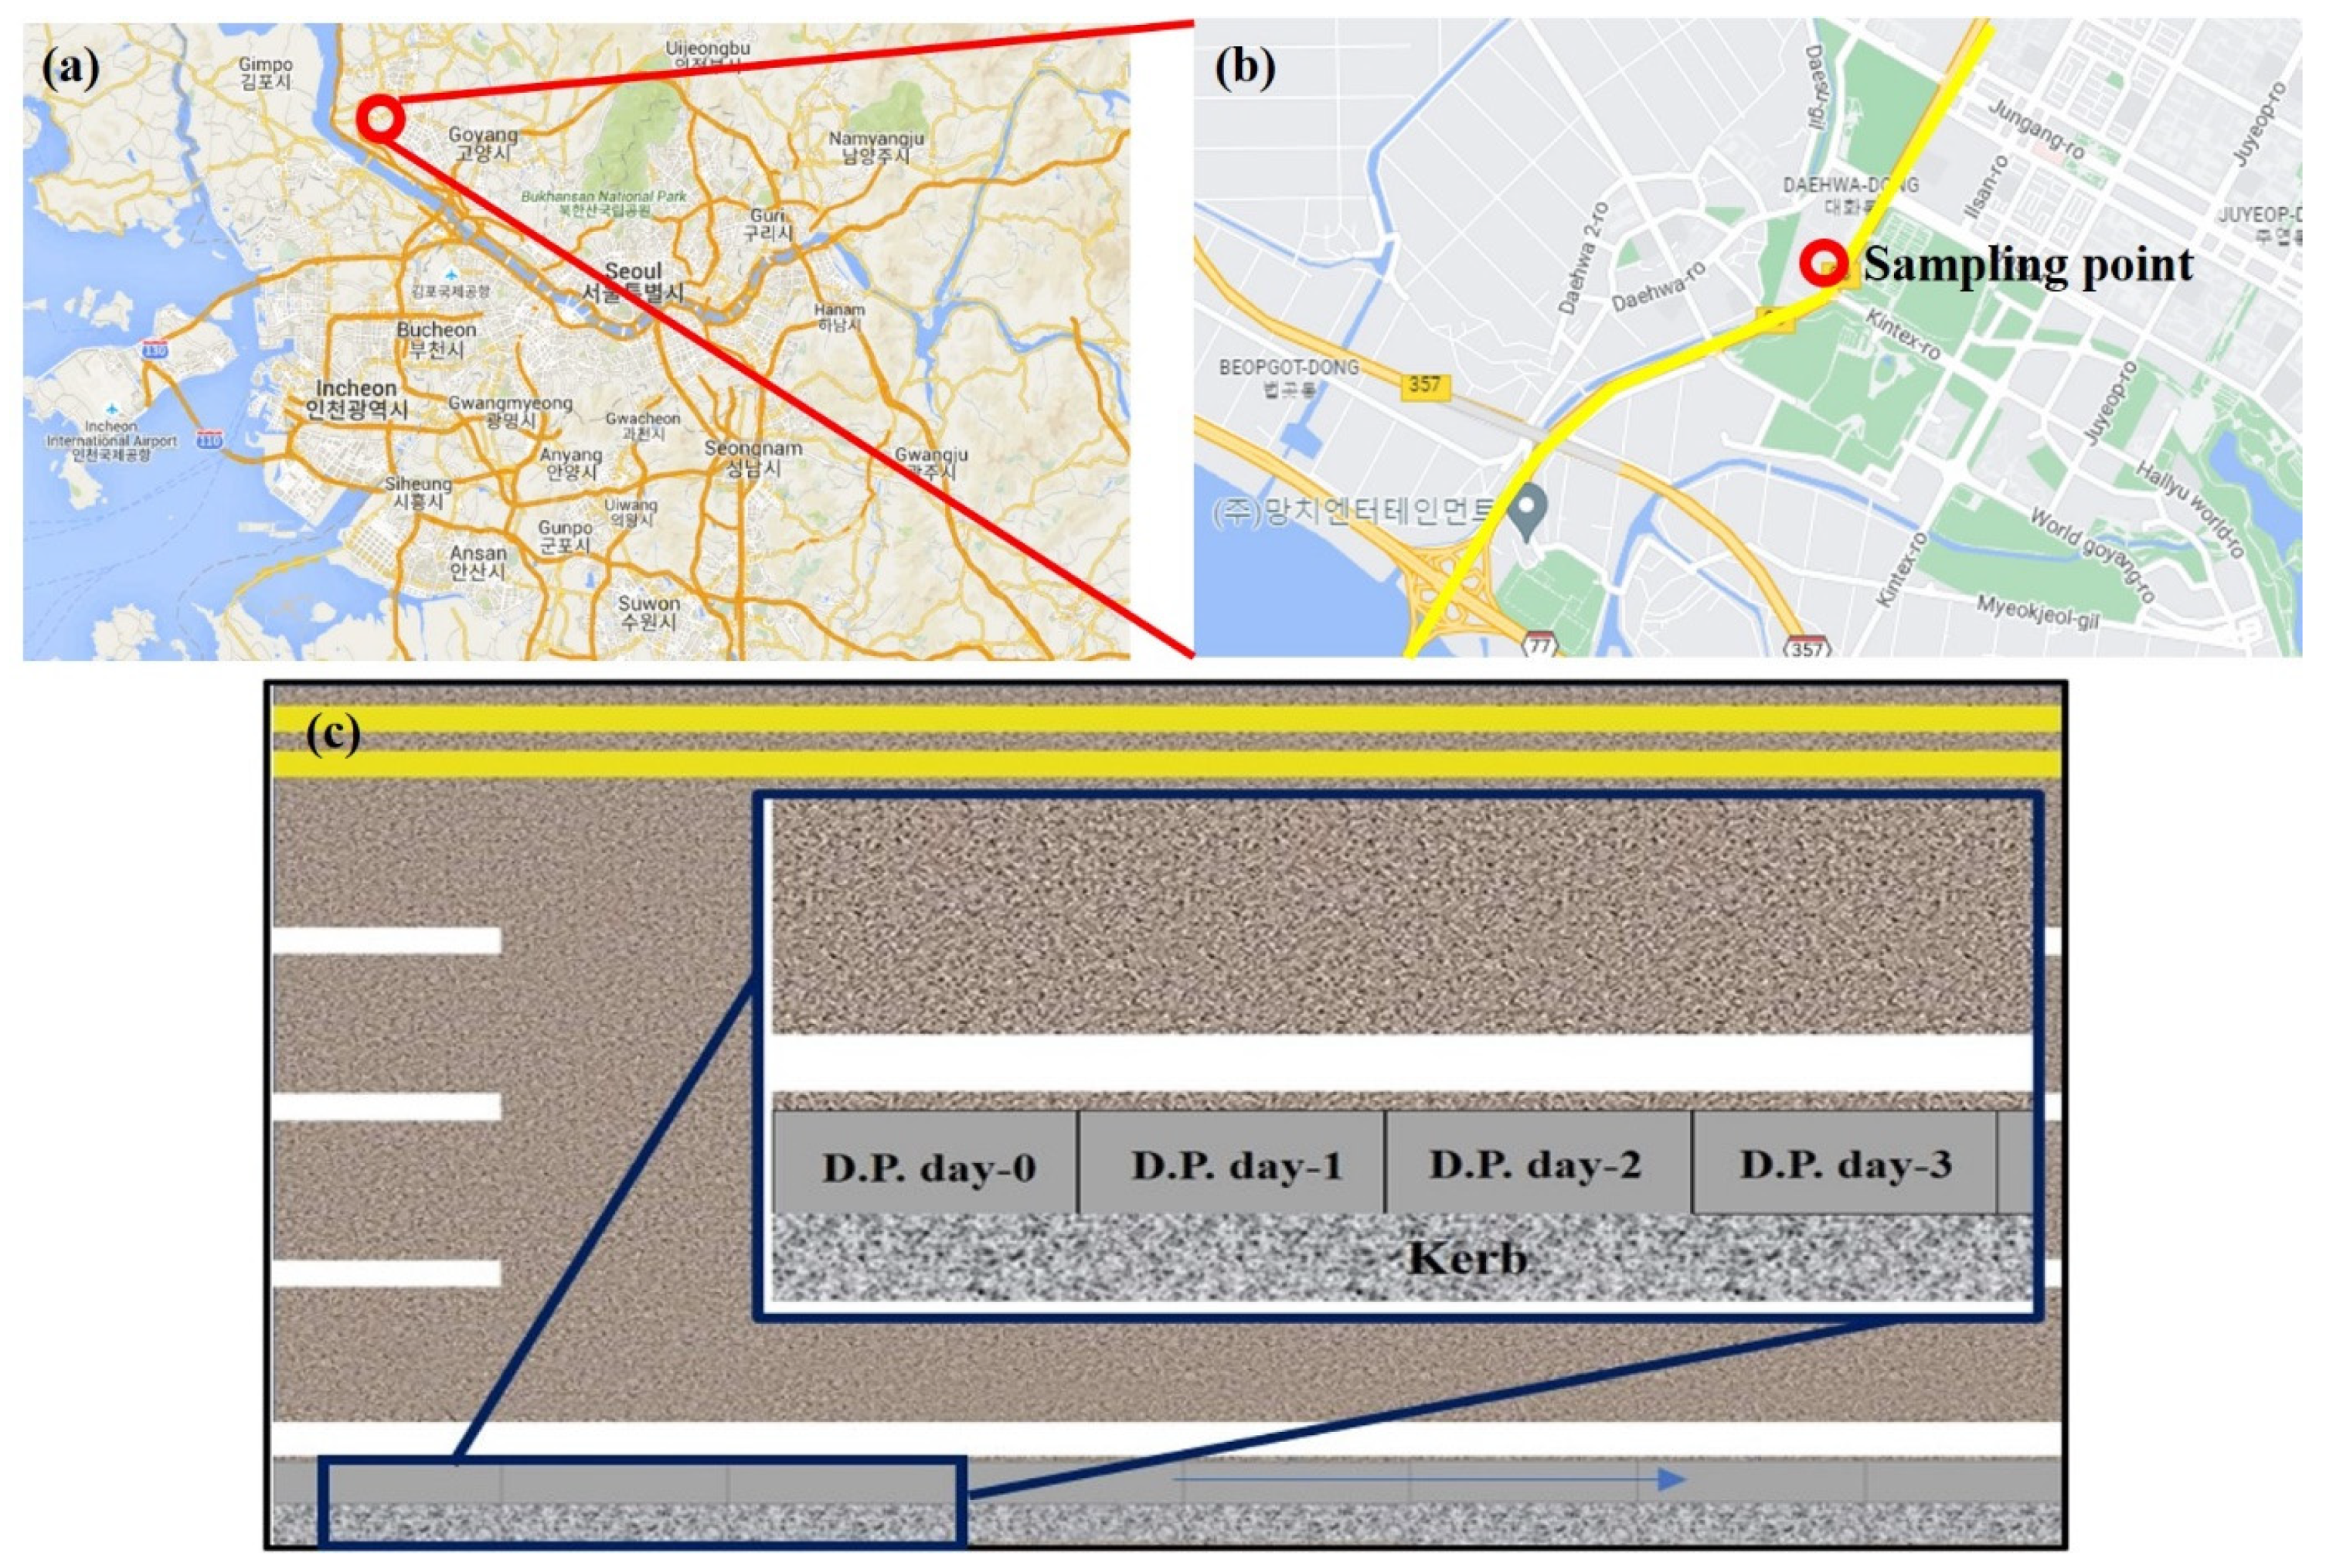
The road dust samples were collected from the road side in the downtown area of Goyang city, South Korea, where the traffic volume was measured (Figure 1a,b). The road had eight lanes (four tracks each with lanes in both directions), and the sampling point was a location with high traffic density in rush hours and these geo-located images were captured from Google maps. The annual average daily traffic (AADT) at the sampling point is approximately 24,027 vehicles/d and the average driving speed is 60 km/h. The sampling site is cleaned with a road sweeper once a week.
2.2. Sampling
Road dust was sampled from 17 May to 2 June 2021. As we hypothesised that road dust would be washed away after a rain event, the sample when the road surface had dried after rain was determined as “the 0-d drying period” (Figure S1). The average temperature was 17.4 °C, and 6 h after the rain stopped, we sampled the road dust. The sample “the 1-d drying period” was collected at the same time the next day; sampling was performed at designated locations for drying periods d-0, 1, 2 and 3 (Figure 1c). Samples on different days for each drying period were analysed twice (Table 2). Samples were collected by sweeping one block in front of the kerb using a wooden brush (Figure S2). The sampled road dust was sifted through a 1 mm sieve to remove leaves, stones and branches. It was then stored in a sterilized 50 mL tube and transported to a laboratory. Road dust samples were collected at the same sampling time, and the drying period was recorded.
2.3. Sample Pretreatment
The sieved samples were dried in a drying oven at 70 °C for 24 h. Aliquots of 1 g samples were obtained, and each sample was replicated three times. The organic matter in these samples was then oxidized using hydrogen peroxide (H2O2, 35%). After the oxidation, each sample was sieved by mesh filter (pore size 100 µm). The sieved samples were transferred to a beaker with a ZnCl2 solution (density: 1.6 g/cm3) and allowed to stand for density separation for 2 h, and then the supernatant was decanted into another cleaned beaker. This operation was repeated three times [21]. The density-separated samples were filtered using a track-etched polycarbonate filter (20 µm pore size and 47 mm diameter) (GVS, Sanford, ME, USA) and dried in a desiccator for 24 h.
2.4. Quantitative and Qualitative Analyses of MPs
For the pretreated samples, the number of MPs (>100 µm) and their sizes and shapes were examined using a stereoscopic microscope (Discovery V8, Carl Zeiss, Oberkochen, Germany). For the quantitative analysis of MPs, 1 g of road dust sample was aliquoted, and, after pretreatment, the number of MPs contained in 1 g was analysed. The unit was number of detected MPs per gram (MPs/g). Fibres, films, flakes, paint particles, and black particles (i.e., tyres and bitumen) were counted [22]. In addition, the morphology of the detected particles was analysed using scanning electron microscopy (SEM, S-3700N, Hitachi, Ltd., Ibaraki, Japan) at 2.0 kV and energy dispersive X-ray spectroscopy (EDX, Xflash detector 5010, Bruker, Billerica, MA, USA). The particles presumed to be MPs detected through the microscope were analysed using Fourier-transform infrared spectroscopy (FTIR; Spotlight 400, Perkin Elmer, Shelton, CT, USA) in the reflective mode. After the measurement, we used the results that matched the measured spectrum by >70% determined through library searching. Furthermore, to identify tyre components, measurements were performed using Raman spectroscopy (DXR 3xi, Thermo Scientific, Waltham, MA, USA).
3. Results and Discussion
3.1. Concentration of MPs in Road Dust as a Function of the Drying Period
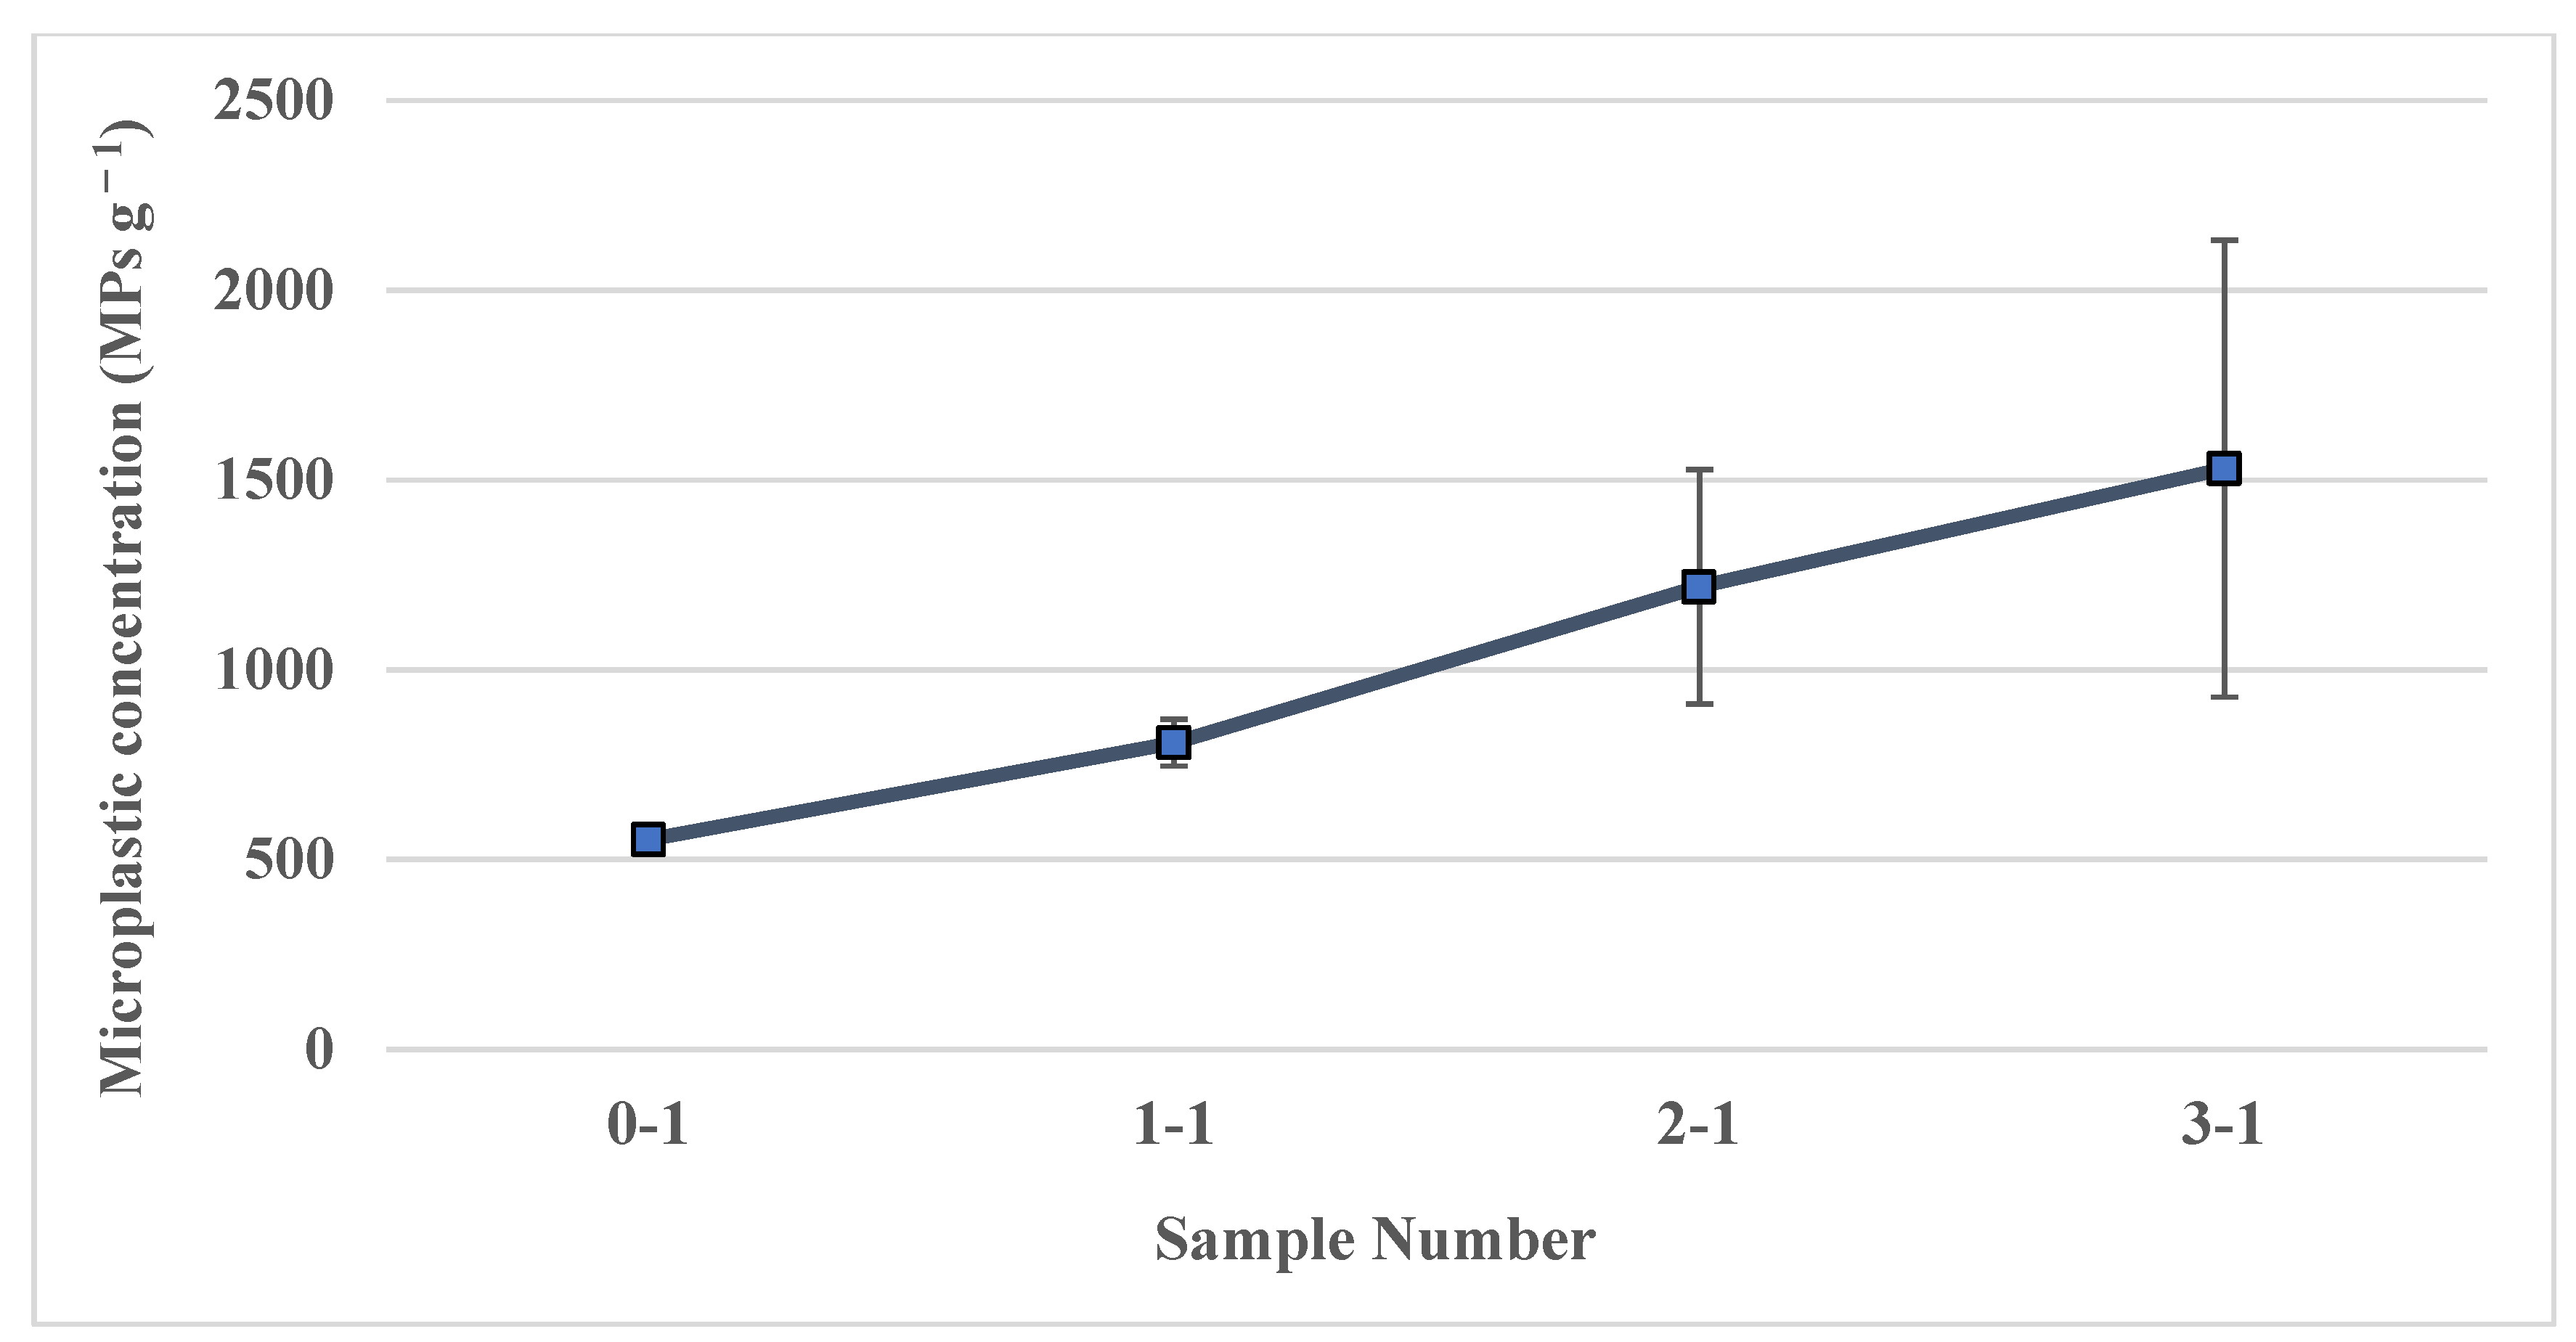
The concentrations of MPs in the continuously collected samples (17–20 May 2021), revealed that the longer the drying period, the higher the MP concentration (Figure 2). In sample 0–1, 552 ± 39 MPs g−1 were detected, compared to the amount detected in the sample 3-1 drying period, where MPs increased by 2.7 times (1530 ± 602 MPs g−1). When the drying period was 0 d, the concentration of MPs was low because they were washed away from the roads by rainfall. As the drying period increased, the MP concentration increased due to the accumulation of MPs generated on the roads [10,23].
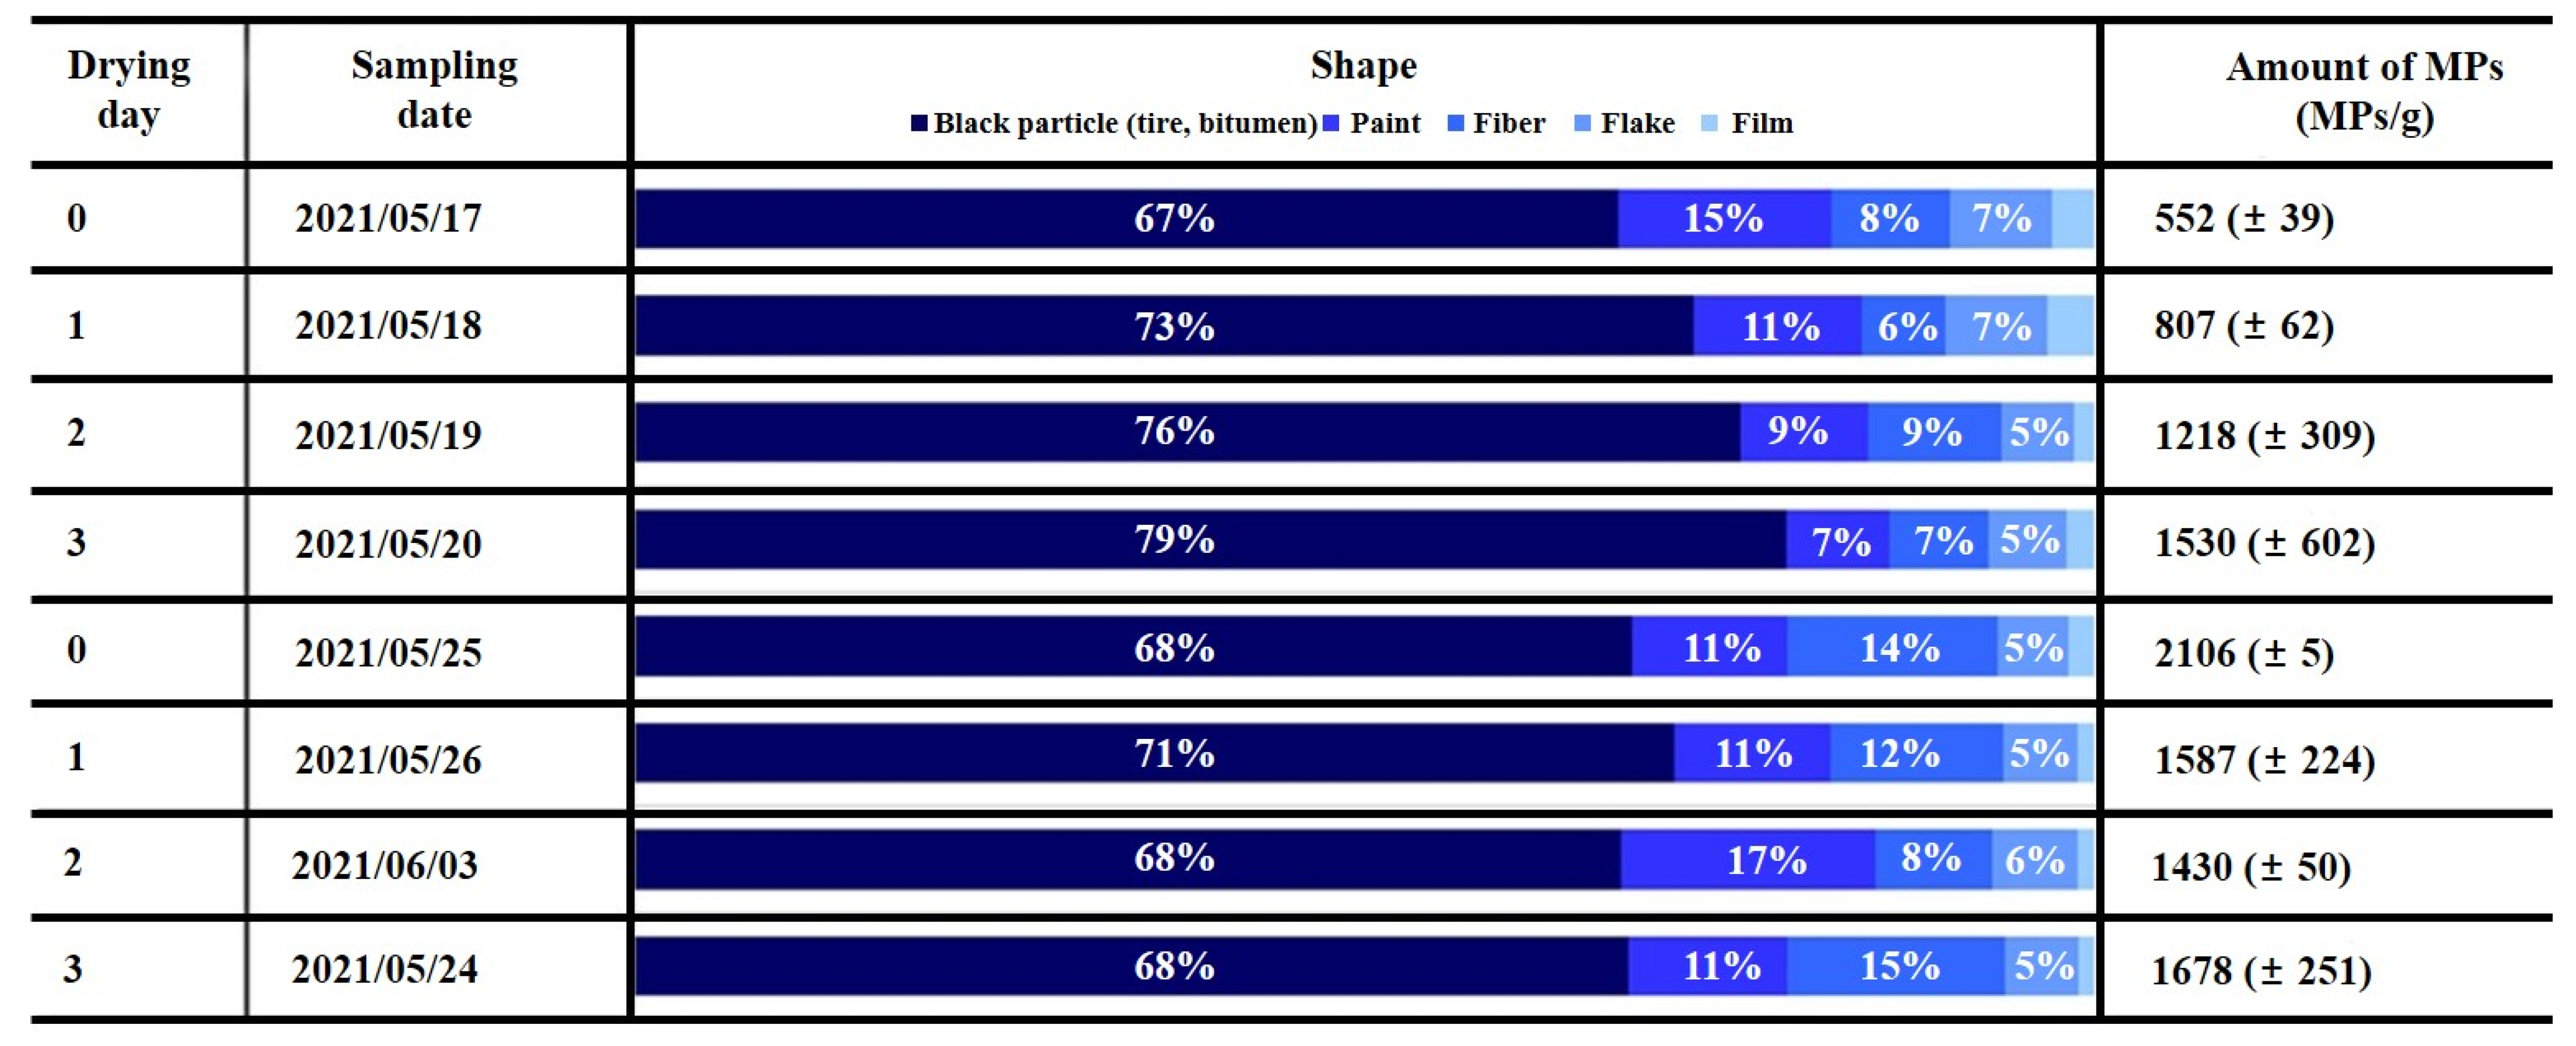
Despite the same drying period, the concentration of MPs in road dust varied significantly depending on the traffic volume and rainfall. For the samples in the 0 d drying period, the concentrations of MPs contained in road dust were 552 ± 39 MPs g−1 for sample 0–1 and 2106 ± 5 MPs g−1 for sample 0–2, respectively (Table 2). There was an evident difference in the MP concentration between the two samples (sample 0–1 and 0–2) due to the occurrence of heavy rainfall (63.5 mm); thus, a relatively lower MP concentration was detected in the road dust as the accumulated MPs on the road were washed away by rainfall [24]. For sample 0–2, there was no rainfall event for 3 d prior to measurement, and a rainfall event of only 4.5 mm occurred in the morning (06.00–09.00) on the sampling day. Therefore, it could be assumed that the MPs were not sufficiently washed away from the road by rainfall. The flow of MPs toward the kerb of the road was accelerated by rainfall; therefore, this suggested that the concentration of MPs in the road dust accumulated at the kerb increased [25,26]. This confirmed that a rainfall event exceeding a certain amount is required to wash away the MPs on the road through the drain located at the kerb. The road dust analysis was conducted eight times, which revealed that the average concentration of MPs in road dust was 1363 ± 495 MPs g−1. In a similar study in South Korea, 102–303 particles g−1 of tyre tread were detected in road dust [27]. Compared to this previous study, the daily traffic volume was approximately three times higher in this study. Therefore, traffic volume could be one factor affecting the amount of MPs. As a result of this study, we confirmed that MP concentrations in road dust are highly influenced by drying period, rainfall and traffic volume. Additional factors in MP concentration were temperature and wind [21,28,29].
3.2. Morphology of Microplastics Detected in Road Dust
Considering the shape of the MPs detected in road dust, black particles presumed to be tyre and bitumen contributed the highest proportion (67~79%), followed by paint (7~17%), fibre (6~15%), flake (5~7%) and film (1~3%) (Figure 3). Although there are variations in samples, it was difficult to find a correlation between the detected shape ratio and the drying period or MP concentration.
A study conducted in Australia reported that black fragments represented 75% of all detected MPs [30]. Furthermore, an analysis of stormwater wetland in Sweden showed that black fragments, which were considered to be tyre particles emitted from automobiles, were dominant in the detected MPs [31]. Tyre particles detected in road dust are attributed to the mechanical abrasion of tyres [23], and the SEM analysis results in this study revealed severe surface wear due to friction on the black particles (Figure S3).
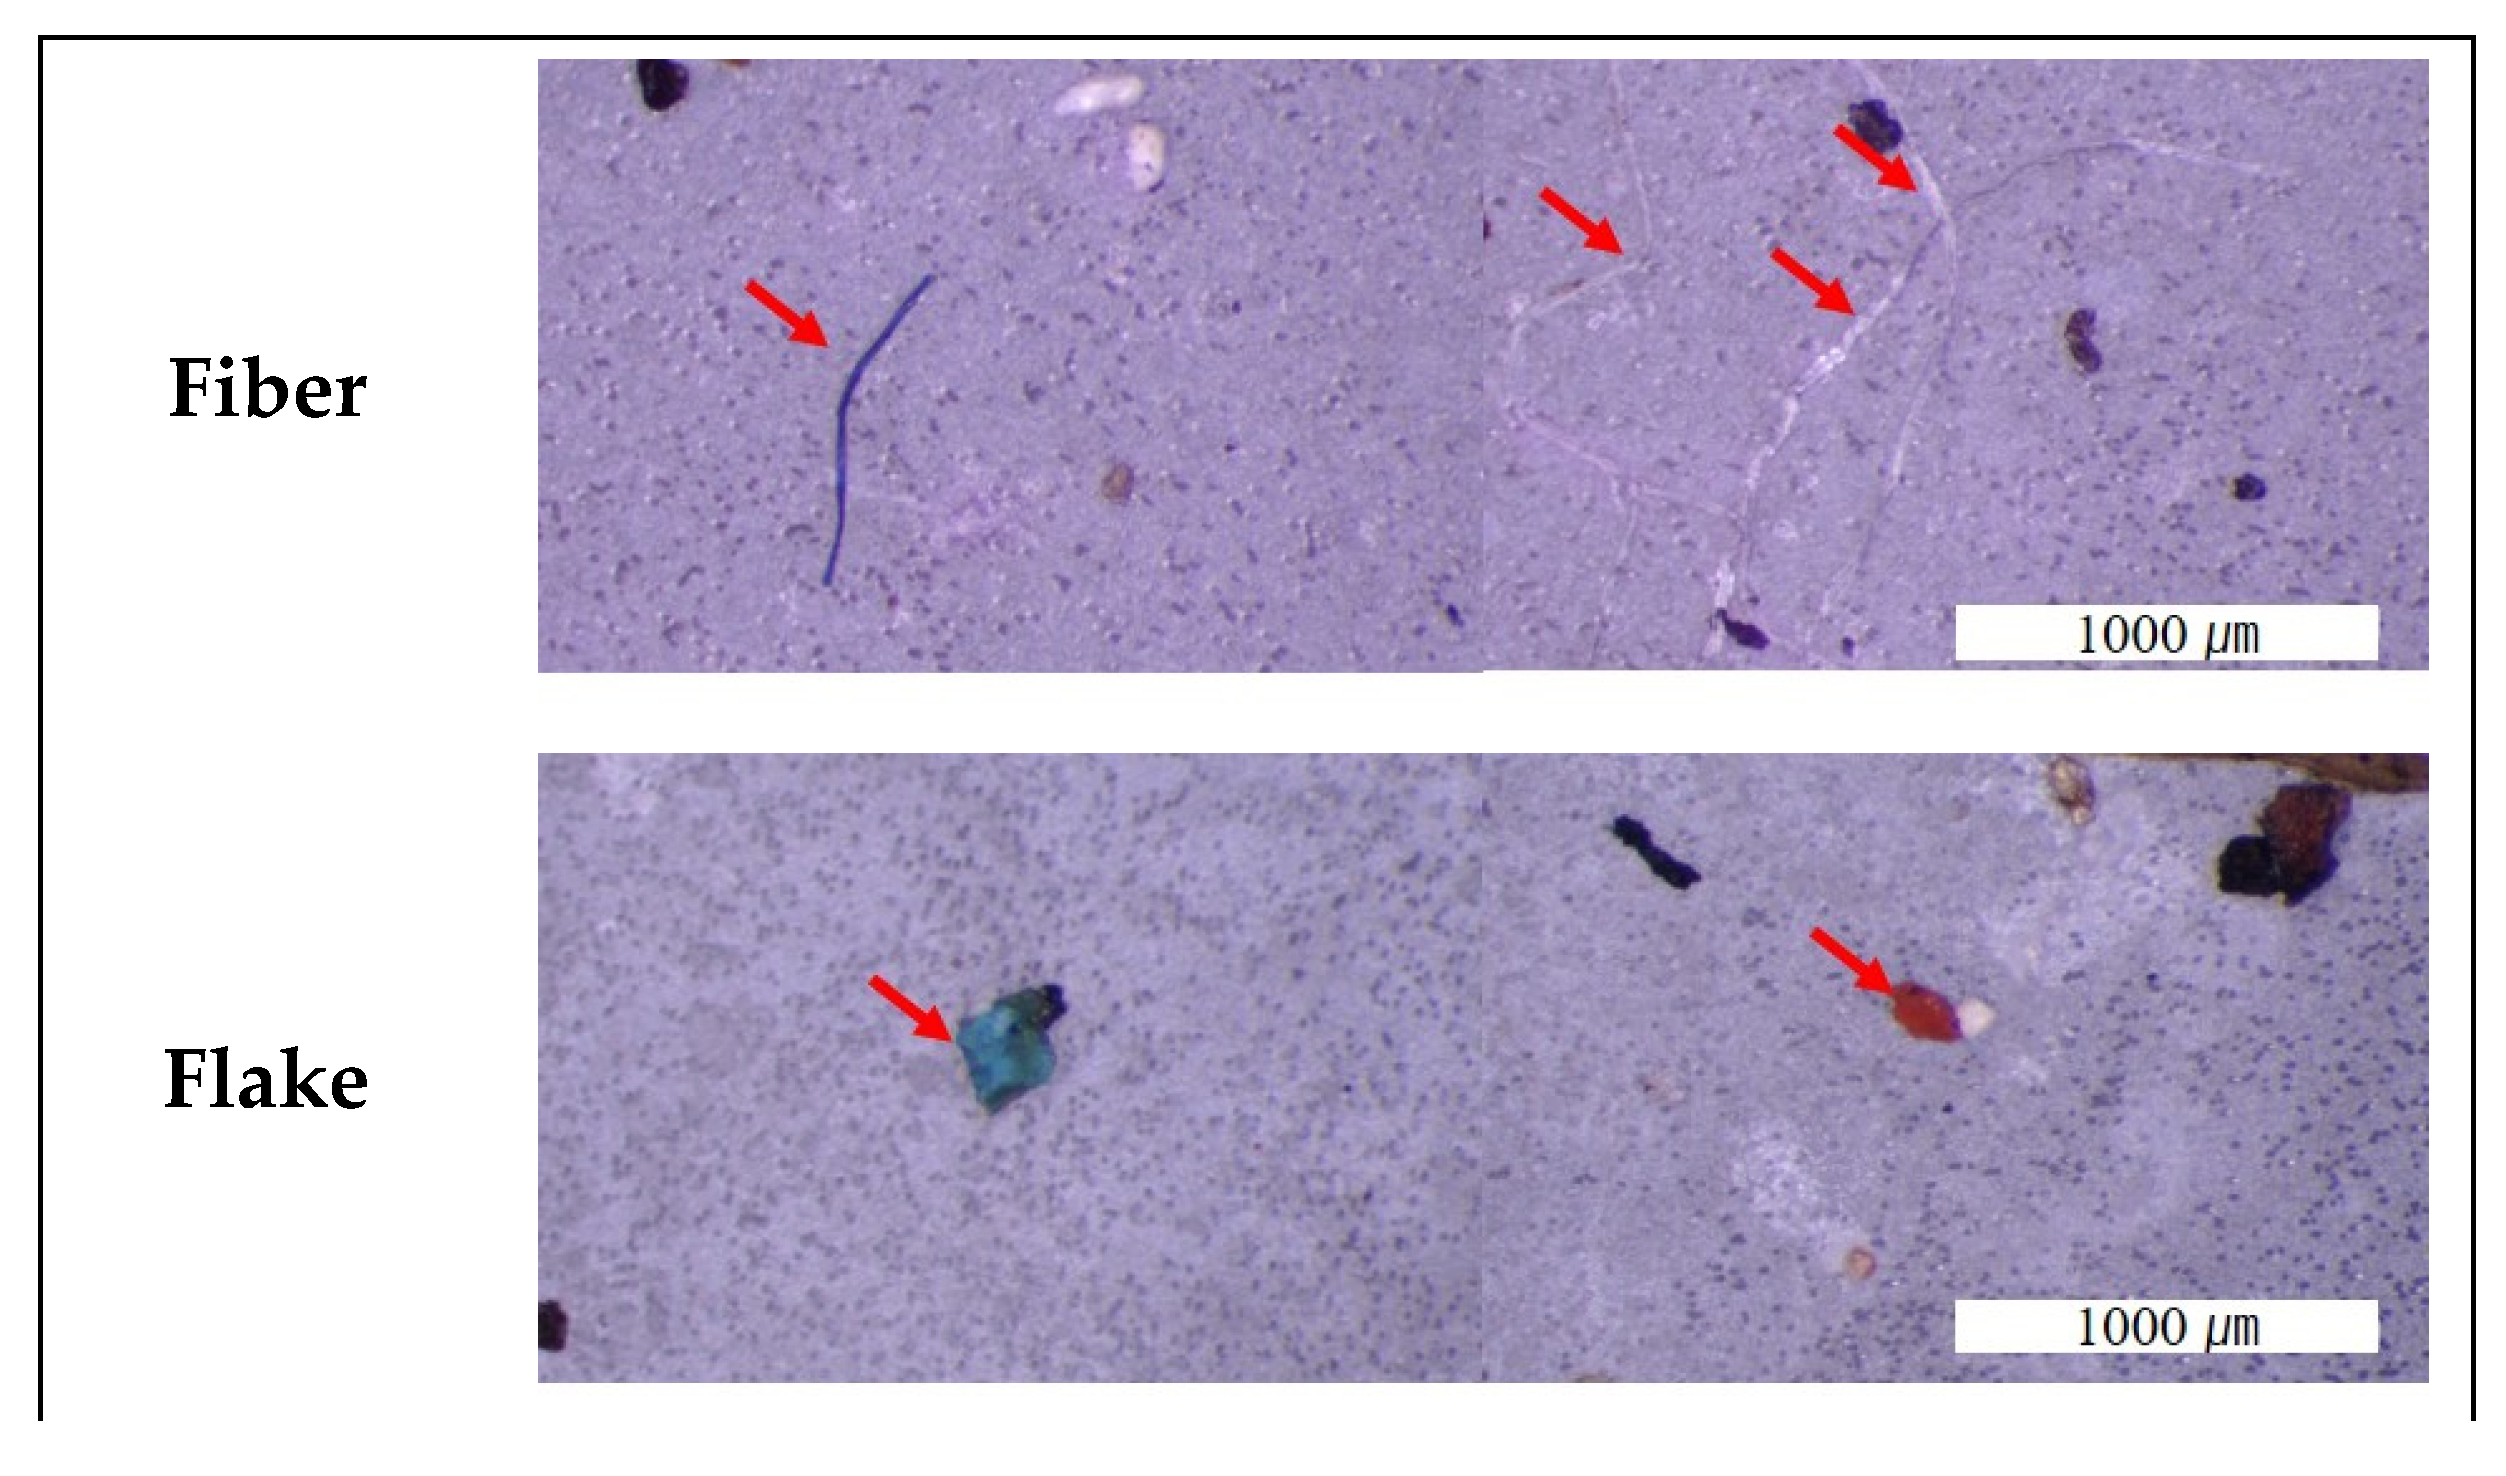
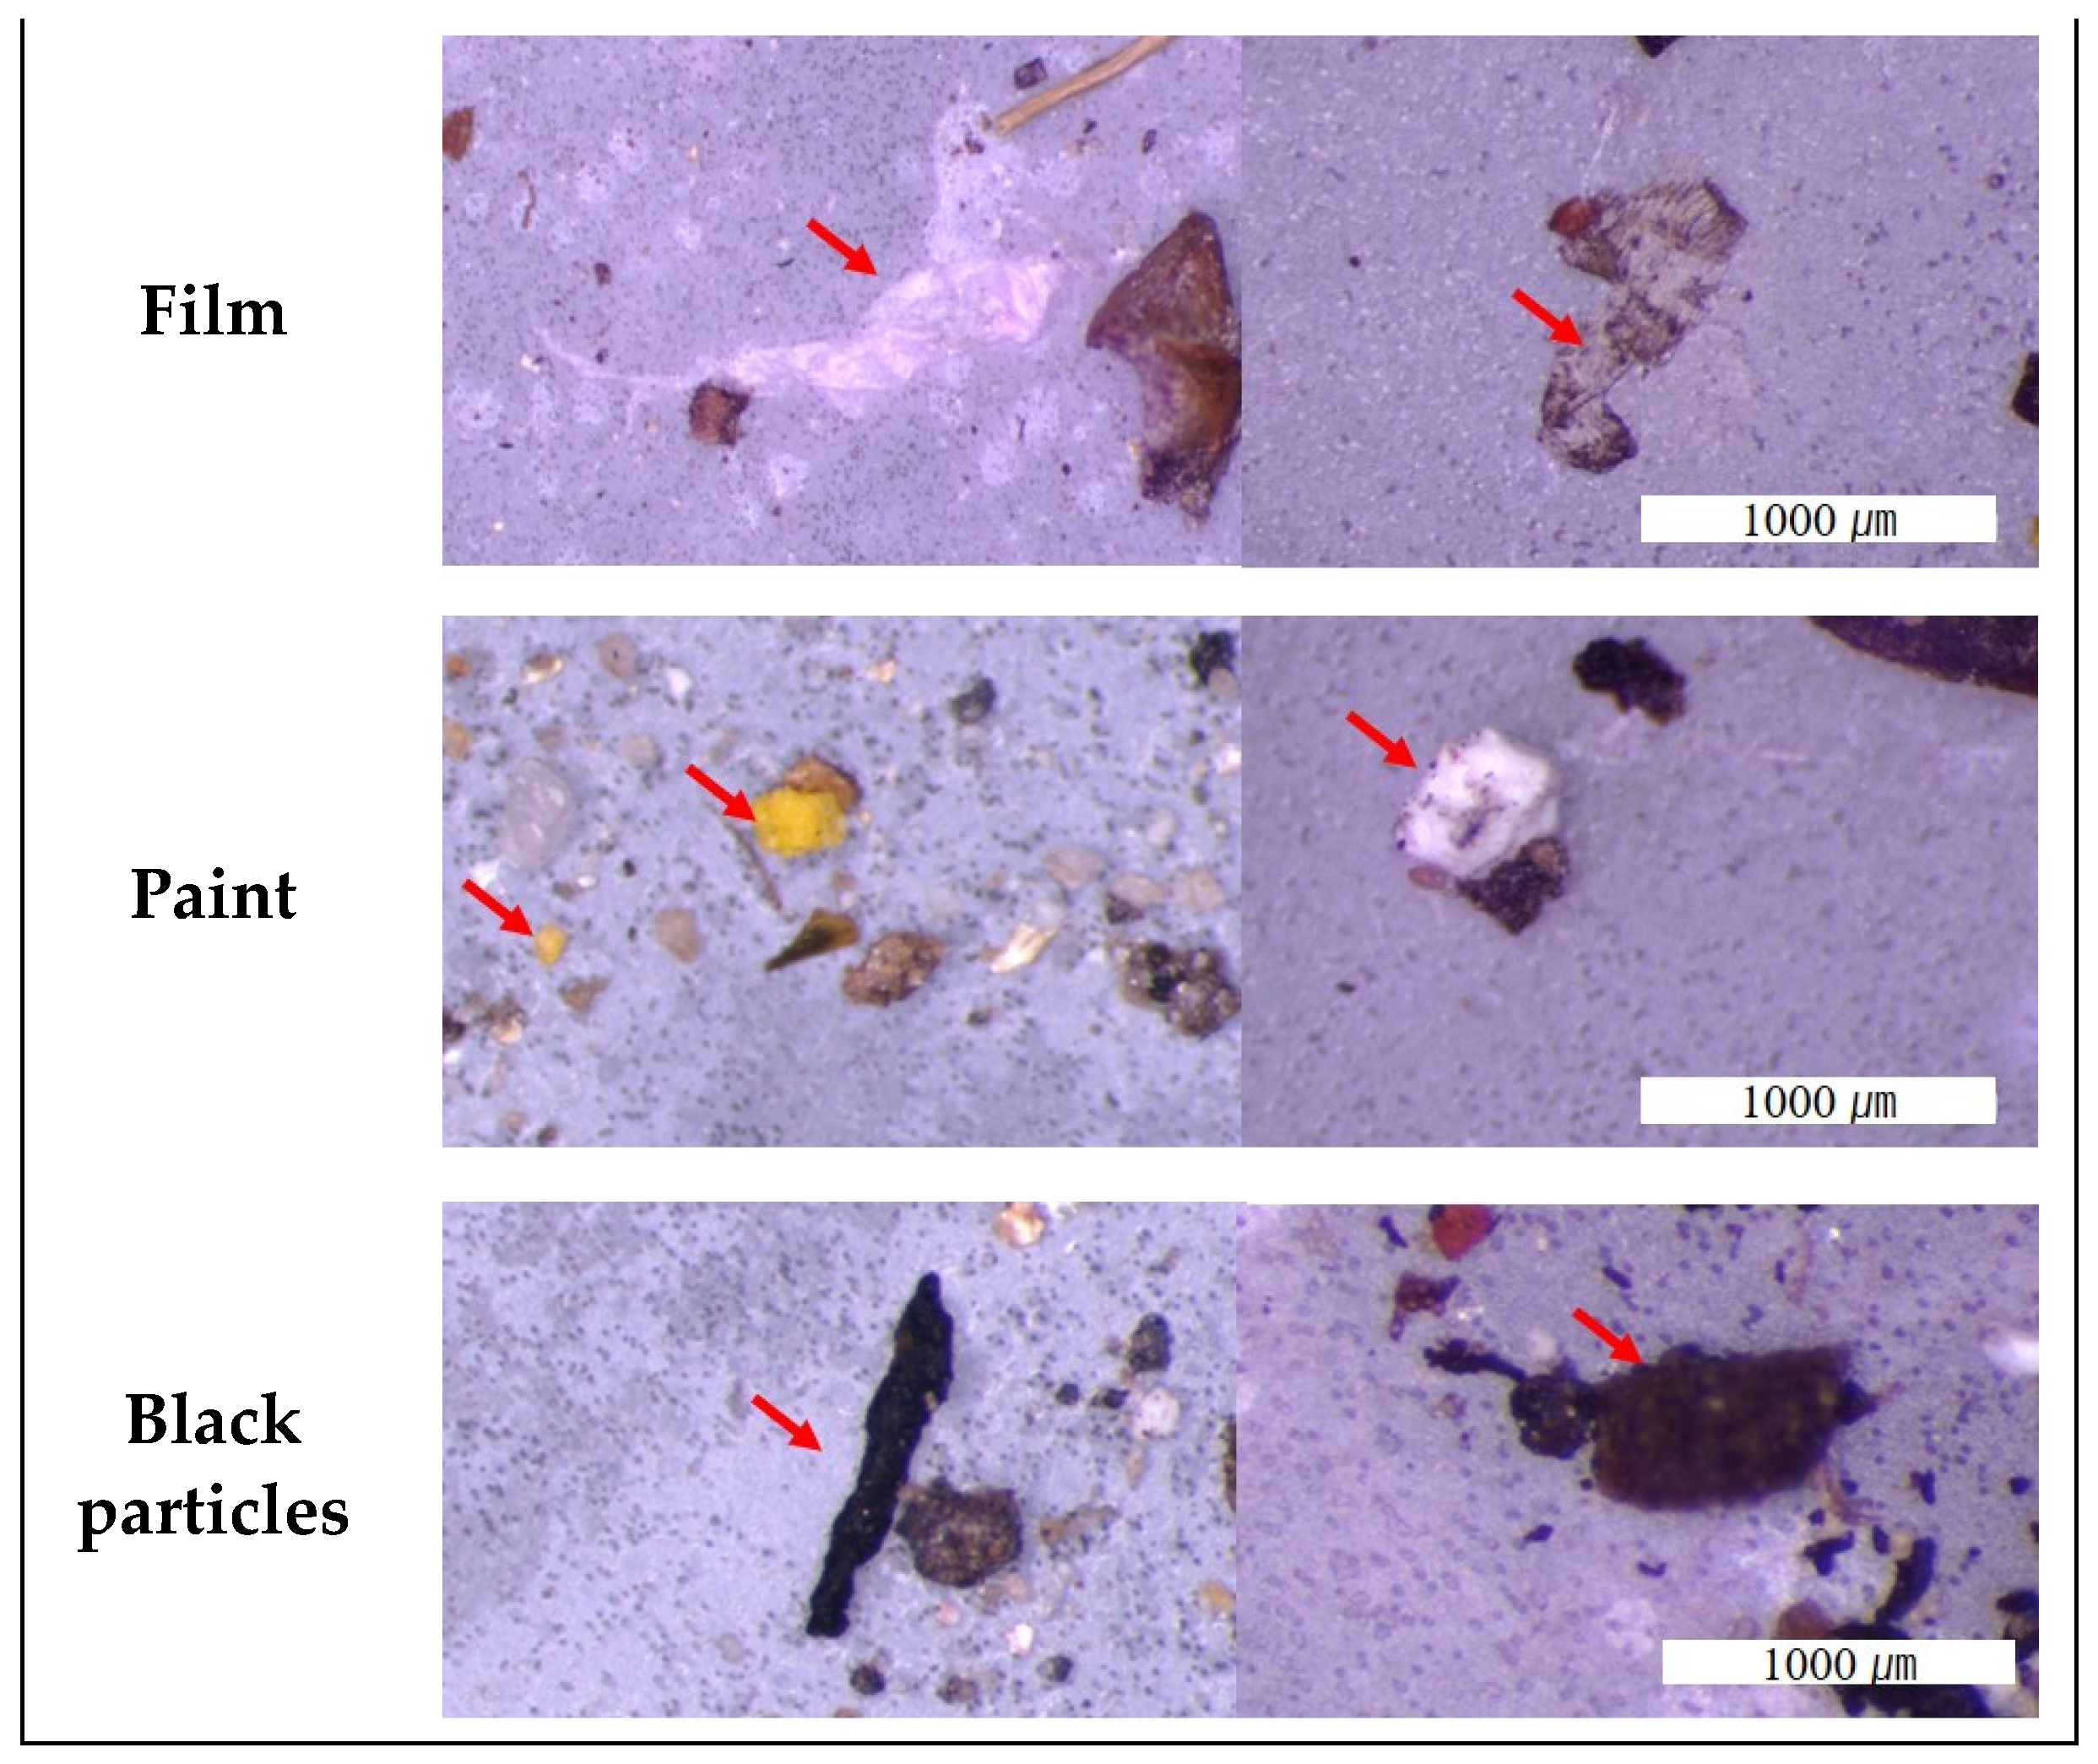
The second highest detected shape was that of paint particles, which are mainly generated by physical impacts and weathering on house and building surfaces [32,33]. In addition, when road-marking paint was detected and analysed, 200–300 µm glass beads were detected in the paint (Figure S4). These glass beads are generally used in road surface markings to provide retro-reflectivity [34] and occur along with the weathered road paint particles. Red, blue, and green colours were mainly observed in the detected flakes and films and were determined to be substances that originated from road facilities and vehicles (Figure 4).
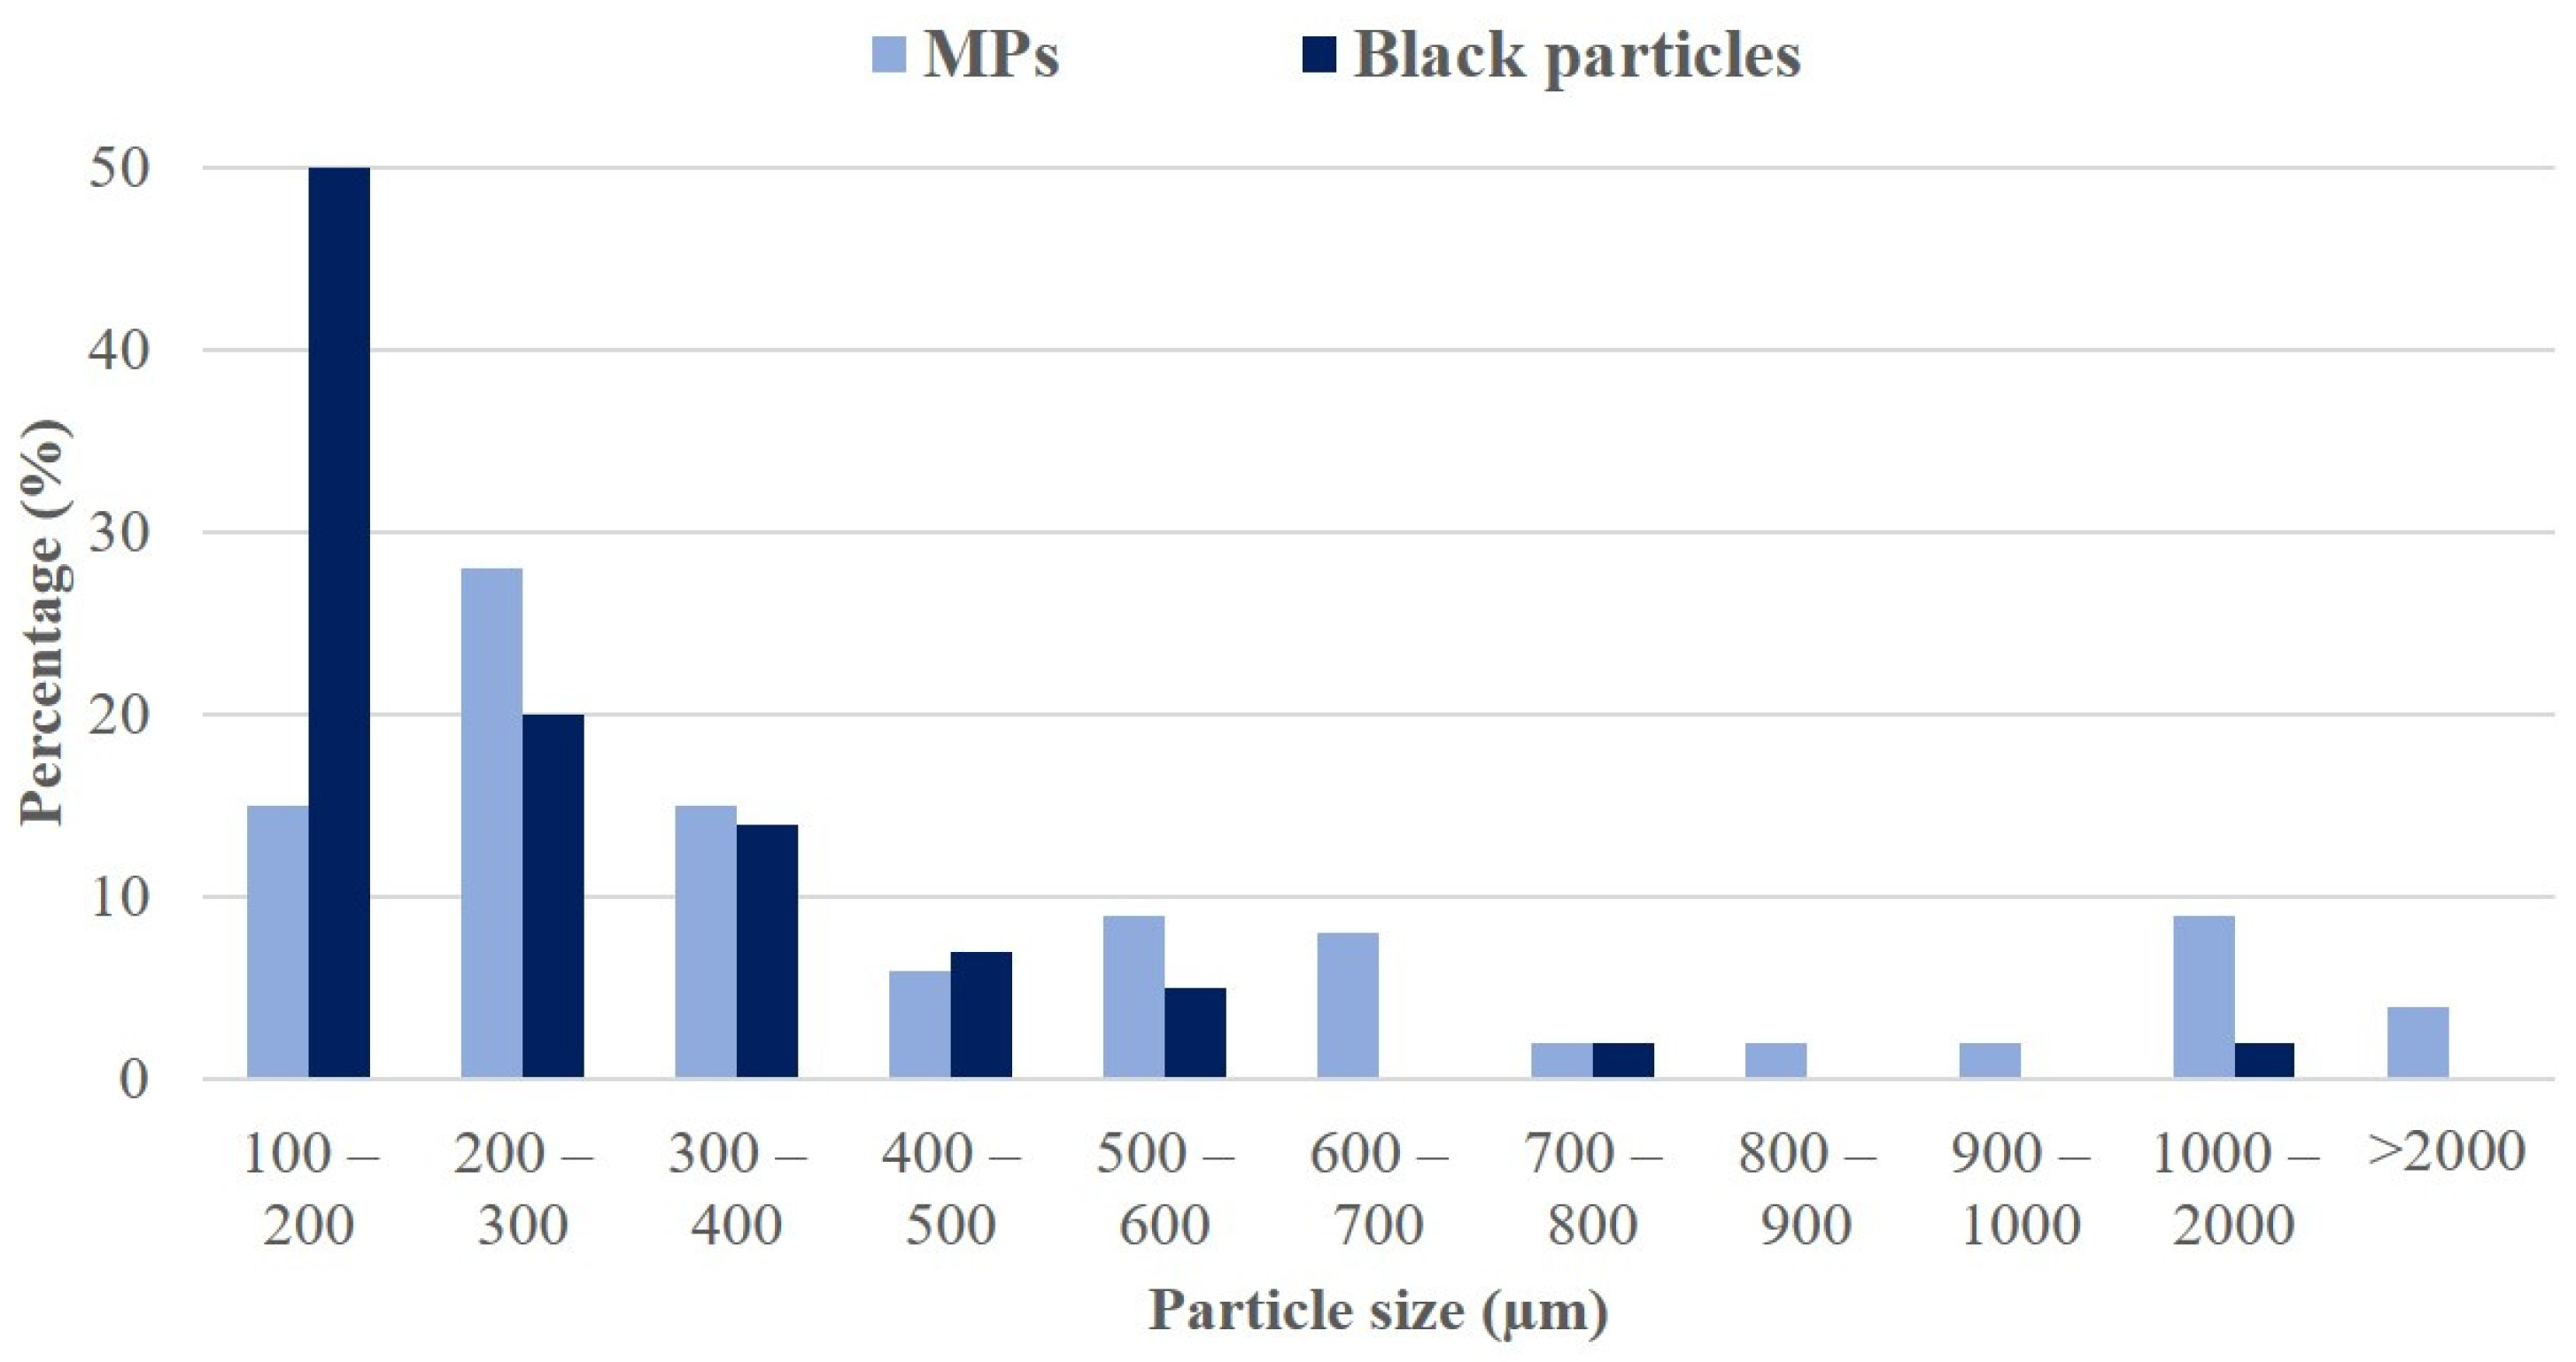
The sizes of the detected MPs were divided into MPs (fibre, flake, and film) and black particles (tyre and bitumen) (Figure 4). MPs had the highest distribution in the 200–300 µm range, and 80% were ≤700 µm. Moreover, most of the black particles were in the 100–200 µm range and 80% were ≤400 µm (Figure 5).
The size range of tyre tread particles detected in stormwater sediment was >500 µm, and other studies showed similar distributions, with 85% ranging 50–350 µm [30,35]. However, Järlskog et al. found that the particle size of road dust sampled at the kerb was mostly in the 10–100 µm range [22]. In this study, only particles >100 µm were analysed; therefore, MPs and black particles <100 µm in size in road dust should be analysed in future studies.
3.3. Chemical Composition of Microplastic Detected in Road Dust
The black particles most detected in the road dust samples were analysed through SEM/EDX, FT-IR and Raman for a qualitative analysis. They were completely black, and the shape was elongated, round and irregular under an optical microscope.
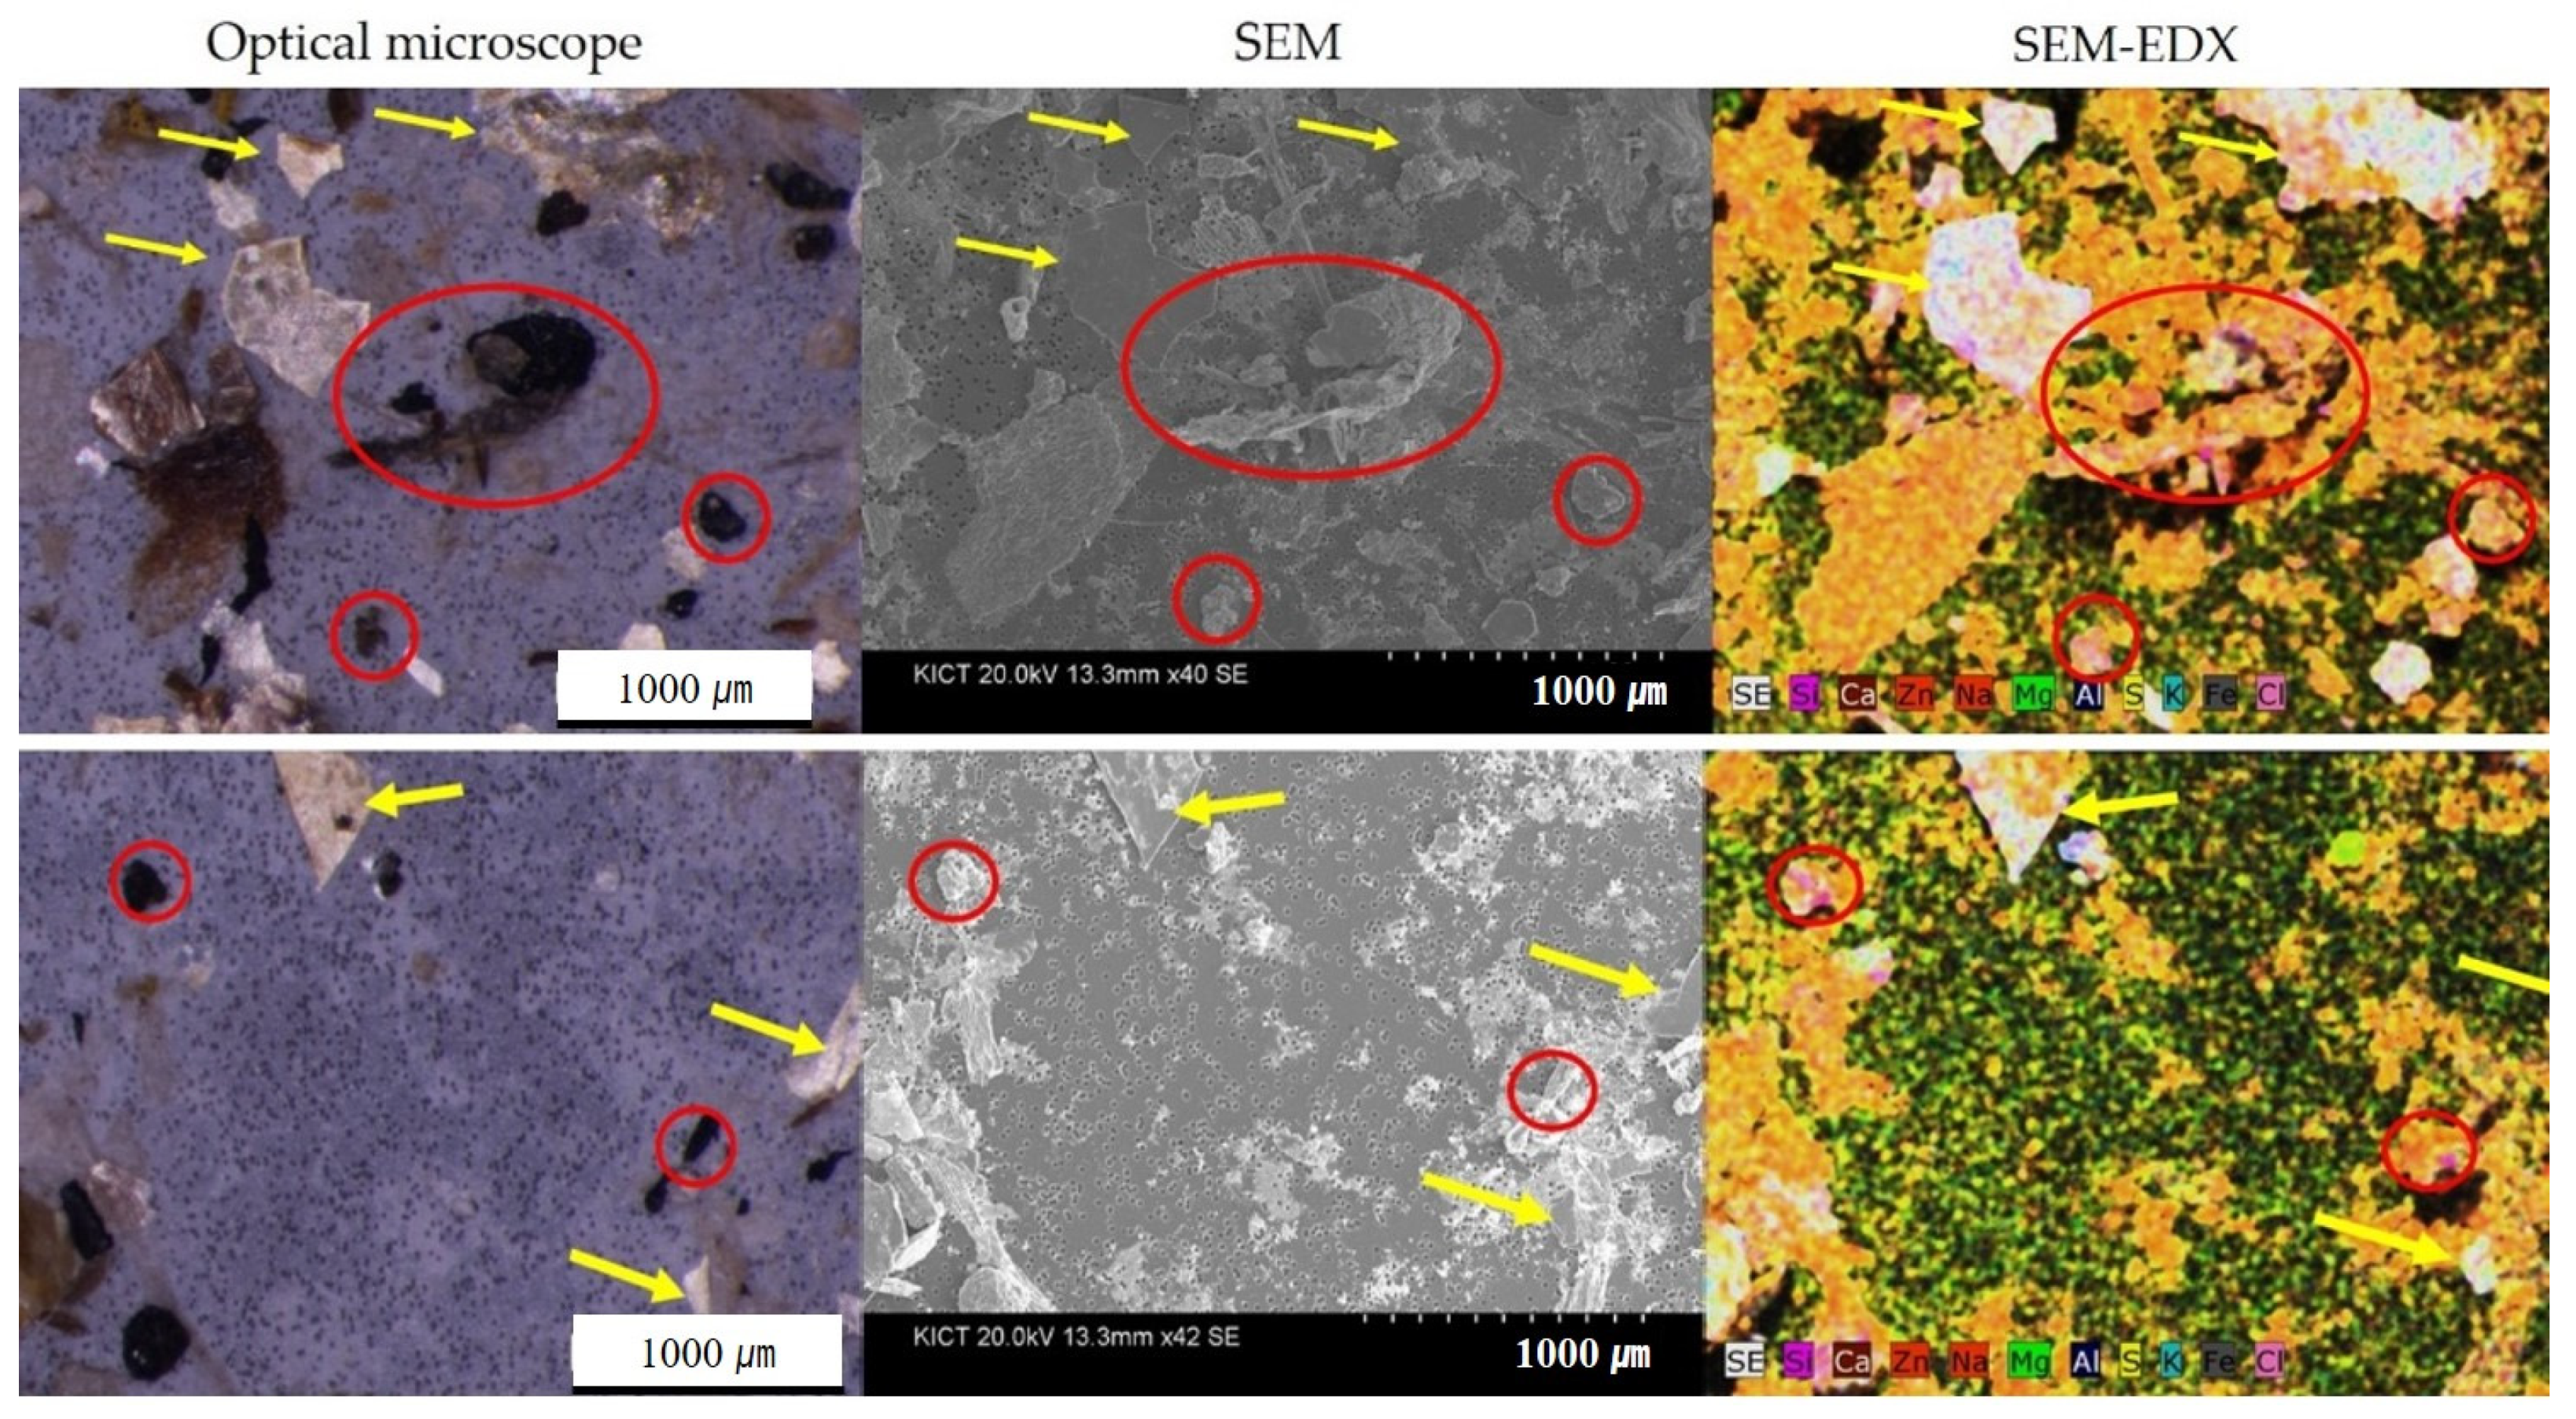
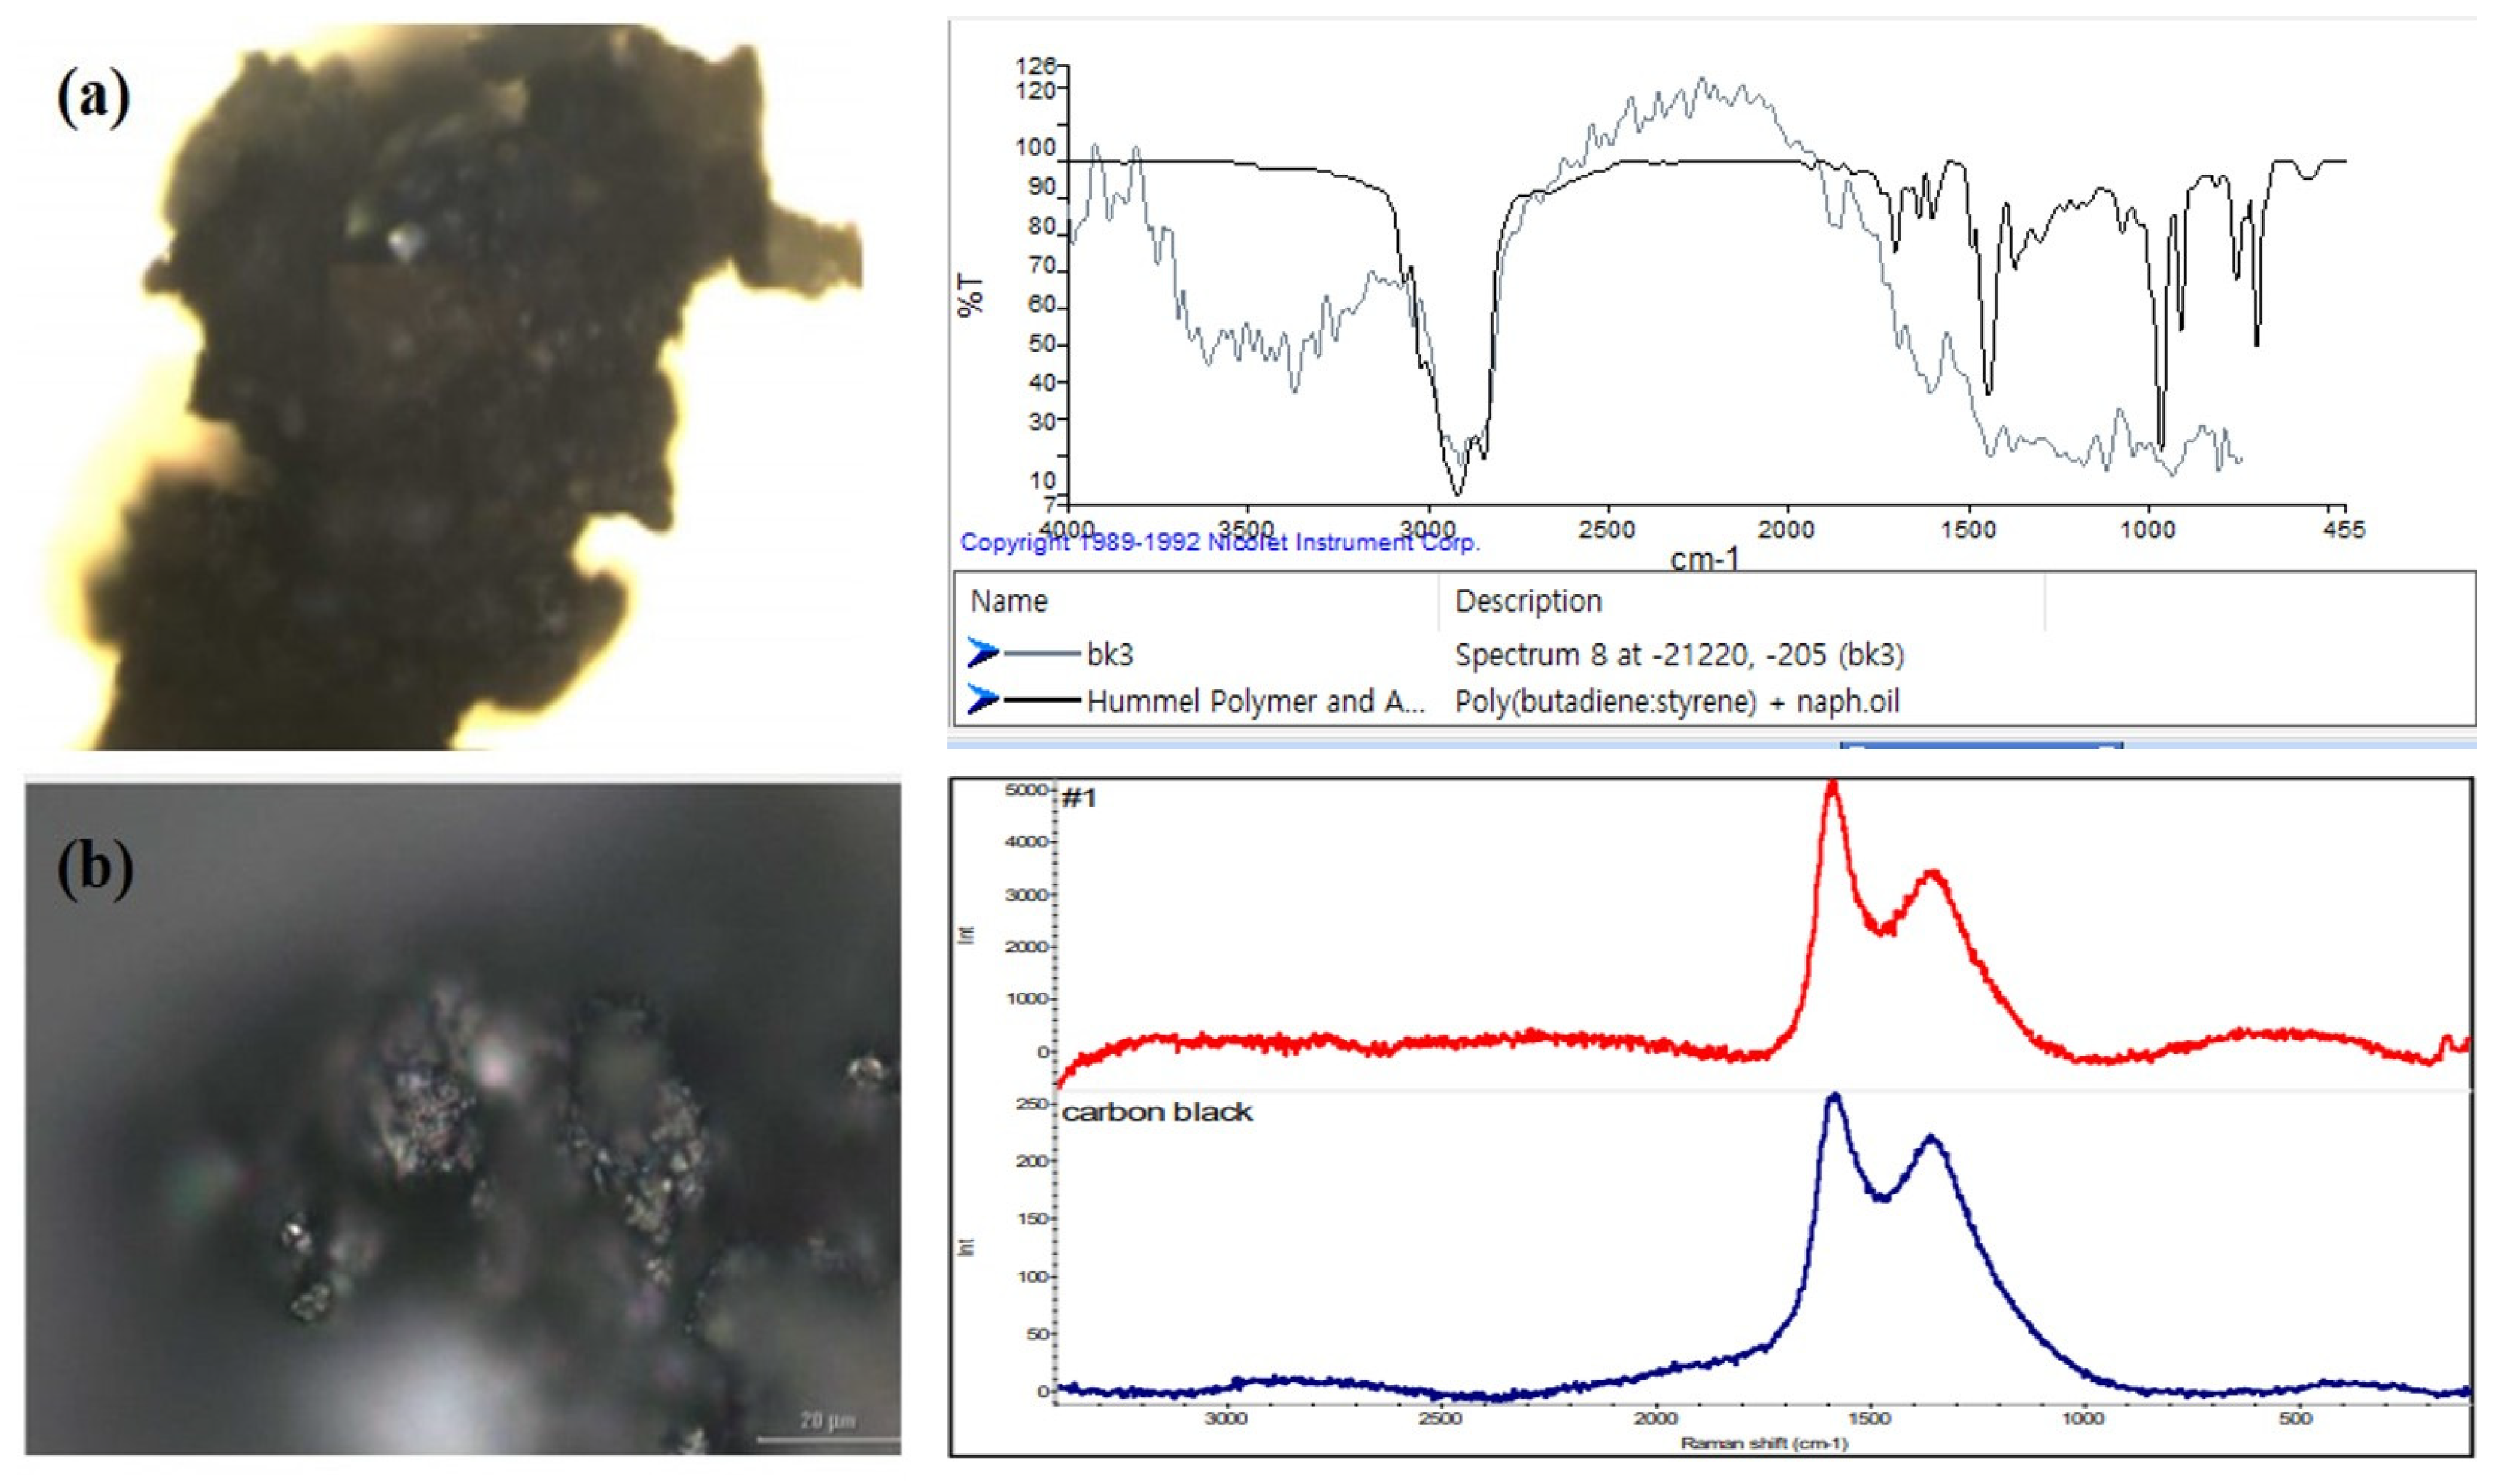
As a result of SEM analysis, a rough surface of black particles was presumed to be caused by breakage or wear on the road. The elements of the black particles were confirmed by EDX [36] and contained S, Na/Zn, Ca, K, Mg, Fe and Al, which are the main components contained in tyres (Figure 6 and Figure S8). The main components of tyre are rubber, which comprises 40–45%, and filler materials (carbon black(C), silica (Si) and chalk (CaCO3)) 30–35%. Vulcanization agents (sulphur (S), zinc oxide (ZnO)) account for 2–5% (Table S1). Therefore, Si is most strongly detected, but all elements must be detected [11]. In this study, a decrease in the detection value was observed when there were stones or other substances around the black particles during EDX analysis. Therefore, accurate density separation is important to obtain accurate results in EDX mapping analysis. As a result of FT-IR analysis, black particles were confirmed that exhibited the highest proportion in road dust were poly(butadiene: styrene) components (Figure 7a). Moreover, carbon black was detected in the Raman analysis (Figure 7b). Carbon black is a component of tyres, and poly(butadiene: styrene) is mainly used to enhance rubber for tyres and bitumen; thus, the black particles were categorised as bitumen or tyre particles [23,37,38].
When coloured MPs were analysed, we detected substances in them that are used in coating particles (ethyl cellulose and COVINAX), and rubber for anti-vibration and impact (poly(norbornene)), indicating that they were generated from vehicle coatings, brake pads and bumpers [23] (Figures S5–S7). Furthermore, polyethylene was mainly detected in the shape of fibres. Fibres are generated from various sources (such as synthetic clothing, ropes, etc.) and introduced into roads through the atmosphere [39,40]. In addition, among the components detected in road dust, some substances are commonly used as outer wall materials (i.e., materials used in moulding and sphere-shaped polystyrene used as building interior materials). This indicated that MPs in road dust were not only from the accumulation of MPs generated by vehicles but also from the atmospheric deposition of MPs generated in cities [41].
As 50% of the MPs generated on roads flow into aquatic environments without treatment, it is necessary to reduce road dust through periodic road cleaning and additional non-point source treatments are required for mitigation [42]. In particular, treatment measures for road dust accumulated at the kerb are also required because the generated road dust moves to the kerb [28]. According to the study by Järlskog et al., road dust contains a large number of black particles <100 µm [22]. These smaller MPs have a higher potential to affect human health, including detrimental respiratory and cardiovascular impacts [17,34,43]. Although respiratory dysfunction due to MP inhalation has not yet been verified in any report, residents possibly inhale MPs every day [19]. From a public health perspective, the quantification of MPs contained in road dust can assist in estimating their impact on human health [44].
4. Conclusions and Implications
The following conclusions have been obtained from this study:
- (1)
- In the samples with 0 to 3 d drying periods, the number of MPs contained in road dust increased with the increase in the drying period because MPs accumulated on the road. In this study, a total of eight analyses were performed, two times for each drying period (d 0, 1, 2 and 3), and the average concentration of road dust was 1363 (±495) MPs g−1.
- (2)
- In this study, 72% of the MPs in road dust were black particles (i.e., tyre and bitumen particles). When the components of the black particles were analysed, carbon black used in tyres and poly(butadiene: styrene) used in bitumen and tyre were detected, the black particles were presumed to be from tyres and bitumen.
- (3)
- The size detection limit of this study was 100 µm, and most (80%) of the black particles detected had sizes <400 µm. As smaller black particles (MPs < 100 µm) in road dust may adversely affect human health, even though respiratory dysfunction owing to MP inhalation has not been verified, their quantification may contribute to assessing their impacts on public health.
A limitation of this study was that tyres hardly reflect light by material and colour, so it is difficult to measure components by spectroscopic analysis (FT-IR and Raman spectroscopy). Therefore, it is difficult to define whether all of the black particles observed with a microscope are tyre particles or bitumen. Our results have shown that MPs in road dust accumulate on roads as the drying period increases. Future studies could monitor stormwater runoff to estimate the microplastic flow into water environments and quantify particles <100 µm in size.
Supplementary Materials
The following are available online at https://0-www-mdpi-com.brum.beds.ac.uk/article/10.3390/su14053006/s1, Figure S1: Sampling date and daily precipitation; Figure S2: Sampling (a) site, (b) point, (c) road dust sample, (d) sampled road dust; Figure S3: SEM image of black particles (x 100); Figure S4: SEM image of glass beads (a) x 30, (b) 100, and (c) SEM-EDX analysis; Figure S5: Coating material FT-IR analysis (Ethyl cellulose (matching score: 0.708), COVINAX (matching score: 0.822)); Figure S6: Rubber for anti-impact and vibration FT-IR analysis (Poly(norbornene) (matching score: 0.835)); Figure S7: Polyethylene FT-IR analysis (Polyethylene (low density) (matching score: 0.760)); Figure S8: SEM-EDX analysis of tyre from road dust; Table S1: Tyre chemical component.
Author Contributions
Contributed to the conception of the study, H.K.; performed the literature analyses and wrote the manuscript, S.P., H.K. and B.L.; helped perform the analysis with constructive discussions, S.K. and I.K. All authors have read and agreed to the published version of the manuscript.
Funding
This research received no external funding.
Institutional Review Board Statement
Not applicable. The study did not involve humans or animals.
Informed Consent Statement
Informed consent was obtained from all subjects involved in the study.
Data Availability Statement
Not applicable.
Acknowledgments
This research was supported by National R&D Program through the National Research Foundation of Korea (NRF) funded by Ministry of Science and ICT (NRF-2021K1A4A8A01079319).
Conflicts of Interest
The authors declare no conflict of interest.
References
- Frias, J.P.G.L.; Nash, R. Microplastics: Finding a consensus on the definition. Mar. Pollut. Bull. 2019, 138, 145–147. [Google Scholar] [CrossRef]
- de Souza Machado, A.A.; Lau, C.W.; Till, J.; Kloas, W.; Lehmann, A.; Becker, R.; Rillig, M.C. Impacts of microplastics on the soil biophysical environment. Environ. Sci. Technol. 2018, 52, 9656–9665. [Google Scholar] [CrossRef] [PubMed] [Green Version]
- Conkle, J.L.; Báez Del Valle, C.D.; Turner, J.W. Are we underestimating microplastic contamination in aquatic environments? Environ. Manag. 2018, 61, 1–8. [Google Scholar] [CrossRef] [PubMed]
- Gasperi, J.; Wright, S.L.; Dris, R.; Collard, F.; Mandin, C.; Guerrouache, M.; Langlois, V.; Kelly, F.J.; Tassin, B. Microplastics in air: Are we breathing it in? Curr. Opin. Environ. Sci. Health 2018, 1, 1–5. [Google Scholar] [CrossRef] [Green Version]
- Karlsson, T.M.; Vethaak, A.D.; Almroth, B.C.; Ariese, F.; van Velzen, M.; Hassellöv, M.; Leslie, H.A. Screening for microplastics in sediment, water, marine invertebrates and fish: Method development and microplastic accumulation. Mar. Pollut. Bull. 2017, 122, 403–408. [Google Scholar] [CrossRef] [PubMed]
- Boucher, J.; Friot, D. Primary Microplastics in the Oceans: A Global Evaluation of Sources; IUCN: Gland, Switzerland, 2017; p. 43. [Google Scholar]
- Su, L.; Nan, B.; Craig, N.J.; Pettigrove, V. Temporal and spatial variations of microplastics in roadside dust from rural and urban Victoria, Australia: Implications for diffuse pollution. Chemosphere 2020, 252, 126567. [Google Scholar] [CrossRef] [PubMed]
- Andrady, A.L. Microplastics in the marine environment. Mar. Pollut. Bull. 2011, 62, 1596–1605. [Google Scholar] [CrossRef]
- Sundt, P.; Schulze, P.; Syversen, F. Sources of microplastics-pollution to the marine environment. Mepex for the Norwegian Environment Agency. Report no M-321/2015. Asker: Mepex Consult. 2014, p. 108. Available online: https://d3n8a8pro7vhmx.cloudfront.net/boomerangalliance/pages/507/attachments/original/1481155578/Norway_Sources_of_Microplastic_Pollution.pdf?1481155578 (accessed on 1 January 2022).
- Vogelsang, C.; Lusher, A.L.; Dadkhah, M.E.; Sundvor, I.; Umar, M.; Ranneklev, S.B.; Eidsvoll, D.; Meland, S. Microplastics in Road Dust–Characteristics, Pathways and Measures; Research Report 7361-2019; Institute of Transport Economics, Norwegian Centre for Transport Research: Oslo, Norway, 2019; p. 174. [Google Scholar]
- Sommer, F.; Dietze, V.; Baum, A.; Sauer, J.; Gilge, S.; Maschowski, C.; Gieré, R. Tire abrasion as a major source of microplastics in the environment. Aerosol Air Qual. Res. 2018, 18, 2014–2028. [Google Scholar] [CrossRef]
- Sengoz, B.; Isikyakar, G. Analysis of styrene-butadiene-styrene polymer modified bitumen using fluorescent microscopy and conventional test methods. J. Hazard. Mater. 2008, 150, 424–432. [Google Scholar] [CrossRef]
- Abbasi, S.; Keshavarzi, B.; Moore, F.; Delshab, H.; Soltani, N.; Sorooshian, A. Investigation of microrubbers, microplastics and heavy metals in street dust: A study in Bushehr City, Iran. Environ. Earth Sci. 2017, 76, 798. [Google Scholar] [CrossRef]
- Patchaiyappan, A.; Dowarah, K.; Zaki Ahmed, S.; Prabakaran, M.; Jayakumar, S.; Thirunavukkarasu, C.; Devipriya, S.P. Prevalence and characteristics of microplastics present in the street dust collected from Chennai Metropolitan City, India. Chemosphere 2021, 269, 128757. [Google Scholar] [CrossRef] [PubMed]
- Yukioka, S.; Tanaka, S.; Nabetani, Y.; Suzuki, Y.; Ushijima, T.; Fujii, S.; Takada, H.; Van Tran, Q.; Singh, S. Occurrence and characteristics of microplastics in surface road dust in Kusatsu (Japan), Da Nang (Vietnam), and Kathmandu (Nepal). Environ. Pollut. 2020, 256, 113447. [Google Scholar] [CrossRef] [PubMed]
- Hidalgo-Ruz, V.; Gutow, L.; Thompson, R.C.; Thiel, M. Microplastics in the marine environment: A review of the methods used for identification and quantification. Environ. Sci. Technol. 2012, 46, 3060–3075. [Google Scholar] [CrossRef]
- Kole, P.J.; Löhr, A.J.; Van Belleghem, F.; Ragas, A. Wear and tear of tyres: A stealthy source of microplastics in the environment. Int. J. Environ. Res. Public Health 2017, 14, 1265. [Google Scholar] [CrossRef] [PubMed]
- Pramanik, B.K.; Roychand, R.; Monira, S.; Bhuiyan, M.; Jegatheesan, V. Fate of road-dust associated microplastics and per- and polyfluorinated substances in stormwater. Process Saf. Environ. Prot. 2020, 144, 236–241. [Google Scholar] [CrossRef]
- Baensch-Baltruschat, B.; Kocher, B.; Stock, F.; Reifferscheid, G. Tyre and road wear particles (TRWP)—A review of generation, properties, emissions, human health risk, ecotoxicity, and fate in the environment. Sci. Total Environ. 2020, 773, 137823. [Google Scholar] [CrossRef] [PubMed]
- Booth, A.M.; Kubowicz, S.; Beegle-Krause, C.; Skancke, J.; Nordam, T.; Landsem, E.; Throne-Holst, M.; Jahren, S. Microplastic in Global and Norwegian Marine Environments: Distributions, Degradation Mechanisms and Transport. Miljødirektoratet M-918; SINTEF: Trondheim, Norway, 2017; pp. 1–147. [Google Scholar]
- Alexandrova, O.; Kaloush, K.E.; Allen, J.O. Impact of asphalt rubber friction course overlays on tire wear emissions and air quality models for Phoenix, Arizona, Airshed. Transp. Res. Rec. 2007, 2011, 98–106. [Google Scholar] [CrossRef]
- Järlskog, I. Occurrence of tire and bitumen wear microplastics on urban streets and in sweeps and washwater. Sci. Total Environ. 2020, 729, 138950. [Google Scholar] [CrossRef] [PubMed]
- Leads, R.R.; Weinstein, J.E. Occurrence of tire wear particles and other microplastics within the tributaries of the Charleston Harbor Estuary, South Carolina, USA. Mar. Pollut. Bull. 2019, 145, 569–582. [Google Scholar] [CrossRef] [PubMed]
- Unice, K.M.; Weeber, M.P.; Abramson, M.M.; Reid, R.C.D.; van Gils, J.A.G.; Markus, A.A.; Vethaak, A.D.; Panko, J.M. Characterizing export of land-based microplastics to the estuary—Part I: Application of integrated geospatial microplastic transport models to assess tire and road wear particles in the Seine watershed. Sci. Total. Environ. 2019, 646, 1639–1649. [Google Scholar] [CrossRef] [PubMed]
- Gustafsson, M.; Blomqvist, G.; Järlskog, I.; Lundberg, J.; Janhäll, S.; Elmgren, M.; Johansson, C.; Norman, M.; Silvergren, S. Road dust load dynamics and influencing factors for six winter seasons in Stockholm, Sweden. Atmos. Environ. X 2019, 2, 100014. [Google Scholar] [CrossRef]
- Wagner, S.; Hüffer, T.; Klöckner, P.; Wehrhahn, M.; Hofmann, T.; Reemtsma, T. Tire wear particles in the aquatic environment—A review on generation, analysis, occurrence, fate and effects. Water Res. 2018, 139, 83–100. [Google Scholar] [CrossRef]
- Lee, H.; Kim, Y. Investigation on inflow possibility of tire tread wear particles from pavement into water system. J. Kor. Soc. Waste Manag. 2020, 37, 204–210. [Google Scholar] [CrossRef]
- Grigoratos, T.; Martini, G. Non-Exhaust Traffic Related Emissions. Brake and Tyre Wear PM; European Commission, Joint Research Centre, Institute of Energy and Transport: Ispra, Italy, 2014. [Google Scholar]
- Hann, S.; Sherrington, C.; Jamieson, O.; Hickman, M.; Kershaw, P.; Bapasola, A.; Cole, G. Investigating Options for Reducing Releases in the Aquatic Environment of Microplastics Emitted by (but Not Intentionally Added in) Products; Final Report; ICF: London, UK, 2018; Volume 23, p. 335. [Google Scholar]
- Ziajahromi, S.; Drapper, D.; Hornbuckle, A.; Rintoul, L.; Leusch, F.D.L. Microplastic pollution in a stormwater floating treatment wetland: Detection of tyre particles in sediment. Sci. Total Environ. 2020, 713, 136356. [Google Scholar] [CrossRef] [PubMed]
- Coalition Clean Baltic. Guidance on Concrete Ways to Reduce Microplastic Inputs from Municipal Stormwater and Waste Water Discharges; Coalition Clean Baltic: Uppsala, Sweden, 2017. [Google Scholar]
- Jones, M.S. Effects of UV Radiation on Building Materials. In Building Research Association of New Zealand; BRANZ: Judgeford, New Zealand, 2002. [Google Scholar]
- Adachi, K.; Tainosho, Y. Characterization of heavy metal particles embedded in tire dust. Environ. Int. 2004, 30, 1009–1017. [Google Scholar] [CrossRef] [PubMed]
- Dehghani, S.; Moore, F.; Akhbarizadeh, R. Microplastic pollution in deposited urban dust, Tehran Metropolis, Iran. Environ. Sci. Pollut. Res. 2017, 24, 20360–20371. [Google Scholar] [CrossRef] [PubMed]
- Kreider, M.L.; Panko, J.M.; McAtee, B.L.; Sweet, L.I.; Finley, B.L. Physical and chemical characterization of tire-related particles: Comparison of particles generated using different methodologies. Sci. Total Environ. 2010, 408, 652–659. [Google Scholar] [CrossRef] [PubMed]
- Kovochich, M.; Parker, J.A.; Oh, S.C.; Lee, J.P.; Wagner, S.; Reemtsma, T.; Unice, K.M. Characterization of individual tire and road wear particles in environmental road dust, tunnel dust, and sediment. Environ. Sci. Technol. Lett. 2021, 8, 1057–1064. [Google Scholar] [CrossRef]
- Roychand, R.; Pramanik, B.K. Identification of micro-plastics in Australian road dust. J. Environ. Chem. Eng. 2020, 8, 103647. [Google Scholar] [CrossRef]
- Blażejowski, K.; Gawdzik, B.; Matynia, T. Effect of recycled rubber on the properties of road bitumen. J. Chem. 2018, 2018, 8759549. [Google Scholar] [CrossRef] [Green Version]
- Liu, K.; Wang, X.; Fang, T.; Xu, P.; Zhu, L.; Li, D. Source and potential risk assessment of suspended atmospheric microplastics in Shanghai. Sci. Total Environ. 2019, 675, 462–471. [Google Scholar] [CrossRef] [PubMed]
- Dris, R.; Gasperi, J.; Mirande, C.; Mandin, C.; Guerrouache, M.; Langlois, V.; Tassin, B. A first overview of textile fibers, including microplastics, in indoor and outdoor environments. Environ. Pollut. 2017, 221, 453–458. [Google Scholar] [CrossRef] [PubMed] [Green Version]
- Yang, Y.Y.; Rodrigez-Jorquera, I.A.; McGuire, M.; Toor, G.S. Contaminants in the Urban Environment: Microplatics. UF/Extension. 2019. Available online: https://edis.ifas.ufl.edu/publication/SS649 (accessed on 1 January 2022).
- Monira, S.; Bhuiyan, M.A.; Haque, N.; Shah, K.; Roychand, R.; Hai, F.I.; Pramanik, B.K. Understanding the fate and control of road dust-associated microplastics in stormwater. Process Saf. Environ. Prot. 2021, 152, 47–57. [Google Scholar] [CrossRef]
- Khan, R.K.; Strand, M.A. Road dust and its effect on human health: A literature review. Epidemiol. Health 2018, 40, e2018013. [Google Scholar] [CrossRef] [PubMed]
- O’Brien, S.; Okoffo, E.D.; Rauert, C.; O’Brien, J.W.; Ribeiro, F.; Burrows, S.D.; Toapanta, T.; Wang, X.; Thomas, K.V. Quantification of selected microplastics in Australian urban road dust. J. Hazard. Mater. 2021, 416, 125811. [Google Scholar] [CrossRef] [PubMed]
Figure 1.
Locations of: (a) Goyang city, (b) sampling point, and (c) road dust sampling point (drying period (D.P.)). (Courtesy: Google Maps).
Figure 1.
Locations of: (a) Goyang city, (b) sampling point, and (c) road dust sampling point (drying period (D.P.)). (Courtesy: Google Maps).

Figure 2.
Microplastic (MP) concentrations in road dust with an increasing drying period.

Figure 3.
Microplastic (MP) concentrations by sampling date.

Figure 4.
Microscope analysis of microplastic shapes: fibre, flake, film, paint, black particles (tyre, bitumen).
Figure 4.
Microscope analysis of microplastic shapes: fibre, flake, film, paint, black particles (tyre, bitumen).


Figure 5.
Size range of microplastics: MPs (fibre, flake and film); black particles (tyre and bitumen).
Figure 5.
Size range of microplastics: MPs (fibre, flake and film); black particles (tyre and bitumen).

Figure 6.
Optical microscope and SEM/EDX mapping of particles of road dust sample (red circle: black particle, yellow arrow: soil and stone).
Figure 6.
Optical microscope and SEM/EDX mapping of particles of road dust sample (red circle: black particle, yellow arrow: soil and stone).

Figure 7.
Analyses of black particles by (a) Fourier-transform infrared spectroscopy (FTIR) and (b) Raman analysis.
Figure 7.
Analyses of black particles by (a) Fourier-transform infrared spectroscopy (FTIR) and (b) Raman analysis.


Table 1.
A comparison of microplastics concentration in road dust studies.
| Location | Sampling Methods | MPs and MRs Concentration (MPs g−1) | Reference |
|---|---|---|---|
| Iran | Sweeping with brush | 87.6 ± 78.2 | [13] |
| India | Sweeping with brush | 2.27 ± 0.9 | [14] |
| Japan | Vacuum cleaner | 2.5 ± 2.7 | [15] |
| Vietnam | 4.1 ± 3.5 | ||
| Nepal | 3.9 ± 3.5 |
Table 2.
Road dust sampling date and drying period.
| Sample No. | Drying Period (d) | Sampling Date | Sampling Time | Amount of Dust Collected (g) |
|---|---|---|---|---|
| 0–1 | 0 | 17 May 2021 | 14:35 | 6.5 |
| 0–2 | 25 May 2021 | 14:00 | 11.1 | |
| 1–1 | 1 | 18 May 2021 | 14:00 | 12.5 |
| 1–2 | 26 May 2021 | 14:00 | 11.6 | |
| 2–1 | 2 | 19 May 2021 | 14:00 | 9.4 |
| 2–2 | 3 June 2021 | 14:00 | 21.3 | |
| 3–1 | 3 | 20 May 2021 | 14:00 | 12.7 |
| 3–2 | 24 May 2021 | 14:00 | 12.2 |
Publisher’s Note: MDPI stays neutral with regard to jurisdictional claims in published maps and institutional affiliations. |
© 2022 by the authors. Licensee MDPI, Basel, Switzerland. This article is an open access article distributed under the terms and conditions of the Creative Commons Attribution (CC BY) license (https://creativecommons.org/licenses/by/4.0/).
Share and Cite
MDPI and ACS Style
Kang, H.; Park, S.; Lee, B.; Kim, I.; Kim, S. Concentration of Microplastics in Road Dust as a Function of the Drying Period—A Case Study in G City, Korea. Sustainability 2022, 14, 3006. https://0-doi-org.brum.beds.ac.uk/10.3390/su14053006
AMA Style
Kang H, Park S, Lee B, Kim I, Kim S. Concentration of Microplastics in Road Dust as a Function of the Drying Period—A Case Study in G City, Korea. Sustainability. 2022; 14(5):3006. https://0-doi-org.brum.beds.ac.uk/10.3390/su14053006
Chicago/Turabian StyleKang, Heejun, Saerom Park, Bokjin Lee, Ilho Kim, and Seogku Kim. 2022. "Concentration of Microplastics in Road Dust as a Function of the Drying Period—A Case Study in G City, Korea" Sustainability 14, no. 5: 3006. https://0-doi-org.brum.beds.ac.uk/10.3390/su14053006
Note that from the first issue of 2016, this journal uses article numbers instead of page numbers. See further details here.