1. Introduction
Friulian is a Romance language which is spoken in north-eastern Italy in 175 municipalities out of 210 in the provinces of Udine, Pordenone and Gorizia (hereafter UPG) that are currently part of the autonomous region of Friuli-Venezia Giulia (i.e., UPG plus the province of Trieste), as well in seven small municipalities in the metropolitan borough of Venice [
1,
2,
3]. In this article, we disregard these seven municipalities. (As a result of the plan to reorganize the system of governance in the Friuli-Venezia Giulia region initiated in 2016, the provinces of Trieste, Gorizia, Pordenone and Udine were abolished, but in 2019 a process was launched to re-establish them. In this article, therefore, we will use the term “province” not in the sense of administrative body, but in the sense of territory).
According to the latest available data for 2014 [
3], the number of Friulian speakers in UPG is about 600,000, of which 420,000 speak it regularly (47.6% of the UPG population) and 180,000 speak it occasionally (19.9%). A further 26.4% of the population say they understand it but do not speak it. In practice, 67.5% of the UPG population self-declares as speaking Friulian at least occasionally. This is equivalent to about half of the population of the region of Friuli-Venezia Giulia. (It is also estimated that the number of people able to speak Friulian outside of Italy is higher than the number who speak it in the UPG; these are immigrants and their descendants, especially in France, Belgium-Wallonia, Canada, Argentina and Brazil [
4,
5]).
People who speak Friulian are usually bilingual because they also speak Italian, which is the language of schooling and also the language used for writing. The Friulian language, on the other hand, is mainly used orally and in informal contexts, in particular within the family, in everyday situations, and in relationships between schoolmates and colleagues [
6,
7,
8]. However, there are differences between geographical areas (see Iannàccaro and Dell’Aquila 2015). In some parts of the UPG, for example, especially in the mountainous and hilly areas, Friulian is in a position of diglossia with respect to Italian—that is, it is used only in informal contexts, while in formal contexts Italian is used; in other areas, mainly on the plain, the relationship between the two languages is better described as—that is, both Friulian and Italian are used in informal contexts, while only Italian is used in formal contexts. (On the difference between the concept of diglossia and dilalia, see [
9,
10]).
Although the language has a rather large demographic base, its use has been steadily declining for decades. Despite its official status and legal protection, Friulian is included in the list of “definitely endangered” languages in UNESCO’s Atlas of the World’s Languages (for a discussion about assessment of the vitality of Friulian based on UNESCO’s criteria, see [
11,
12]). In 2014, 62.2% of residents over 60 years of age in the UPG said they speak Friulian regularly, but only 36.8% of young adults between 19 and 29 years of age stated they use it regularly [
3]. In the last decades of the 20th century, on average, the percentage of people able to speak Friulian dropped by about 1% per year. This decrease slowed down to 0.6% per year, on average, in the 2000s in combination with the increase in the legal status of the language and the protection and promotion policies adopted since the end of the 1990s [
1,
3].
Friulian is a minority language in Italy that is protected and promoted by law, both at a national and regional level [
2,
13,
14] (At a national level it is recognised and protected by the Linguistic Minorities (National) Act 482 of 1999 (henceforth N.A. 482/99) which concerns 12 linguistic minorities or national minorities (see [
15] for an overview). (The original title in “Norme in materia di tutela delle minoranze linguistiche storiche” (Legge 482/99)). N.A 482/1999, in fact, only provides a general regulatory framework that gives local authorities the possibility to use public funds to promote the linguistic rights of minorities, in particular through the teaching of the language in state schools and its use in administrative documents or the media. It does not, however, give indications on how to protect and promote minority languages, nor does it set objectives. It is at the level of regional legislation where, in fact, the protection and promotion of Friulian is stronger. Friulian is protected by the Friulian Language (Regional) Act 29 of 2007 (henceforth R.A 29/2007) (the original title in Italian is “Norme per la tutela, valorizzazione e promozione della lingua friulana” (Legge Regionale 29/07)), which updates and reforms the previous Friulian language and culture (Regional) Act 15 of 1996 (henceforth R.A. 15/96). (The original title in Italian is “Norme per la tutela e la promozione della lingua e della cultura friulane e istituzione del servizio per le lingue regionali e minoritarie” (Legge Regionale 15/96)). R.A. 29/2007 is currently the fundamental legal basis for the protection and promotion of the Friulian language. It covers several areas of intervention, including public administration, media, education, and place names.
The concrete actions of language policy to implement R.A 29/2007 are presented in the “General Language Policy Plan” (GLPP), which is normally defined every five years. The main objectives of the GLPP are to guarantee Friulian-speaking citizens the exercise of their linguistic rights, and to promote the social use of the Friulian language and its development as a linguistic code suitable for all situations in modern life [
16]. The first GLPP was adopted in 2015 and ended in 2019; the new GLPP (2021–2025) was approved and published in November 2021 [
17].
The improvement of the legal framework in the last twenty years, however, has not been followed by an effective implementation of the language policy [
4,
18]. The teaching of Friulian at school is optional and stops at secondary school, and the training of teachers and the certification of their competencies need to be improved [
19,
20]. Within the public administration, the implementation of the GLPP 2015–2019 has also been inadequate due to a decrease in available resources. Knowledge of Friulian is not required to work in the public service, the language training of civil servants is insufficient, and the language is seldom used in communication with users [
21]. There are considerable gaps in the provision of signage for placenames in the Friulian language. Finally, the presence of the Friulian language in public and private media has not increased in recent years, with the sole exception of the internet and social media; public funding in this sector has, in fact, decreased [
22].
The Friulian-speaking people show a considerable symbolic attachment to the language and the majority support a focused language policy [
3,
12,
23]. However, without more effective implementation of the laws in the various areas, and without more investment, it is unlikely that the decline in intergenerational transmission of the language will be halted. This article studies the trajectory for the number of Friulian speakers to 2050 in UPG, thereby providing a quantitative estimate of the pace of the ongoing process of language shift [
24]. We analyse data from existing (and comparable) sociolinguistic surveys. Furthermore, we estimate the evolution of the number of speakers of Friulian to 2050 by means of a formal model of language competition, and we discuss the resulting challenges for language policy in UPG. The article is organised as follows. In
Section 2, we position this article in the literature about language competition models. In
Section 3, we present the main features of the model used in this article.
Section 4 presents the data used, while
Section 5 shows the results of the analysis.
Section 6 summarises and concludes the findings outlined in this article.
2. Related Work: Language Competition Models
Language competition models are defined as mathematical models that produce projections about the demographic evolution of two (or more) languages “competing” for speakers in the same territory. The use of these models can prove to be very useful in language policy and planning, in particular in designing policies aimed at protecting and promoting endangered minority languages. In fact, language policy can affect some of the parameters that influence the demographic evolution of language, e.g., through education and training (i.e., acquisition planning) or interventions aimed at improving the legal status, the functions, and the prestige of languages (i.e., status planning).
Language competition models have developed in the last two decades in biology, statistical physics, and economics by analogy with models of the evolution of biological species in an environment, the interaction between particles in complex systems, as well as models explaining the aggregate results of individual decisions of utility-maximizing agents within a society (for reviews, see [
25,
26,
27,
28,
29]). The first language competition models were developed by Abrams and Strogazt [
30] in applied mathematics, and by Wickström [
31] in economics.
In the simple model of Abrams and Strogazt [
30], the authors present a situation in which languages compete for monolingual speakers (bilingualism, therefore, is excluded). The attractiveness of a language is given by its status and the number of its speakers. The model always predicts the extinction of the minority language. Abrams and Strogazt’s article sparked further theoretical research that explicitly considers bilingualism, since the transition from being monolingual in one language to being monolingual in another language is characterized by a period of social bilingualism. The possibility of individual bilingualism is featured in Minett and Wang [
32]. Besides transmission from parents, this model also includes the possibility for monolingual adult individuals to become bilingual through second language learning.
In Wickström’s model [
31] language dynamics are primarily the outcome of intergenerational language transmission and family formation. Adults form couples and they make decisions as to which (of their) languages to transmit to children. Family formation depends on the distribution of language repertoires in the population. Decisions about intergenerational transmission are influenced both by the number of speakers of a language and the emotional attachment to it. For bilingual parents speaking a minority language, therefore, the choice about which language to pass to their offspring is modelled as a trade-off between the advantages of transmitting a language with a large communicative value (measured in terms of the number of its speakers) and a language with less communicational value but higher emotional value. The author assumes that the higher the status of a language, the higher the utility parents obtain from transmitting it. Wickström’s model was expanded in [
33]. In this model, the status of a minority language is a variable that can decrease over time, but this effect can be counteracted by status planning. Fernando, Valijärvi [
34] further expand the set of variables that can explain language dynamics by including language learning in formal education.
Many of the existing language competition models, however, remain abstract and describe only general relations, such as “if variable A increases, then variable B decreases”. This is one reason why research on language competition models has not received much recognition in linguistics yet. As Boissonneault and Vogt [
26] note:
“Mathematical models of language competition, which were initially developed in the formal and natural sciences, have established themselves as a powerful tool for understanding language competition and language death, but have been slow in reaching the linguistic community. This can be seen in the fact that most models are published in journals covering the fields of physics and mathematics, but also in the fact that those models often lack a complete or accurate representation of the key processes affecting language competition, and in the fact that they are rarely validated against data. These assertions, however, seem to represent the reality of models of language competition less and less well. [Over] the last ten years, the way language competition is modelled has changed considerably. Models published recently typically consider a greater number of sociolinguistic parameters and are more often validated against data than before. This change is in part because more linguists and social scientists have started to show interest [in] models of language competition, harnessing their unique set of expertise, but also in part to the fact that formal and natural scientists themselves have started to adopt the concepts and terminology used by linguists”.
To increase their relevance and acceptance among linguists, therefore, newer models consider a variety of relevant sociolinguistic parameters and base their analysis on empirical data. This can be seen, for example, in [
35,
36]. First, these two contributions expand Wickström’s model [
31] as well as its subsequent developments by including language education, adult language learning, and migration, in addition to family formation and intergenerational language transmission. Secondly, Templin’s study [
36] presents a model that—following the approach of [
34]—operates within parameters that can be estimated from empirical socio-linguistic data. As a result, it can be used to provide projections about the evolution of the number of speakers of the minority language (either monolingual or bilingual) in the long-term.
This model already had two applications. Templin [
36] applies his model to the evolution of Basque in the Autonomous Basque Community in Spain under the assumption that there would be no changes to the current language policy. Templin, Wickström and Gazzola [
25] apply the same model to predict the demographic evolution of Spanish-speakers in the USA and of Basque-speakers in the Autonomous Basque Community in Spain, but they allow the model’s parameters to be influenced by language policy. They show how the evolution of Spanish-speakers in the USA changes depending on the government’s choices regarding both migration and the status of Spanish with respect to English in the USA. They also show how the percentage of bilingual speakers in Basque and Spanish is affected by intra-national mobility patterns in Spain, as well as the government’s policy on the acquisition of the Basque language.
In this article, we develop research in this area further by applying Templin’s model [
36] (summarised in
Section 3 below) to the study of the evolution of the Friulian language in UPG or, more precisely, the evolution of the proportion of bilingual Italian-Friulian with respect to non-speakers of Friulian in UPG.
4. The Data
In 1977, 1998, and 2014, sociolinguistic surveys were conducted to study the presence of Friulian and the attitudes toward the language in Friuli-Venezia Giulia. The results have been published, respectively, in [
1,
3,
38,
39]. The 1977 sociolinguistic survey was conducted using a sample of 385 persons aged 18–65, the 1998 study included 463 respondents aged 18–65, while the sample of the 2014 survey consisted of 1005 individuals aged 18 or over. There are differences with regard to the geographical area covered too. The 1977 and 1998 studies considered a Friulian-speaking territory that consists of 173 municipalities. Of those 173 municipalities, the studies sampled 32. This is named the “old sample” in [
3]. The 2014 survey considered all 209 municipalities of the three provinces of Gorizia (one municipality was added after 2014, bringing the total to 210, see introduction), with Pordenone and Udine as relevant, since “the map of Friulian-speaking has changed considerably” [
40]. Therefore, the 2014 study gathered data from 72 municipalities to obtain a representative sample for all three provinces. This sample has been named the “full sample”. To allow for some comparability, the 32 municipalities of the “old sample” are contained in the 72 municipalities of the “full sample”. (It is worth recalling two additional surveys on the use of Friulian and attitudes towards it carried out in 2006 and 2008 (see [
41]). Although they are certainly interesting, they are not suitable for feeding our model of language competition because the two waves are too close in time. Further, the 1977, 1998 and 2014 surveys were constructed in a compatible manner using the same sample of municipalities (the “old sample”), which makes inter-temporal comparisons more reliable, and they contain specific questions on language use within the family, which can be exploited to estimate the rates of intergenerational language transmission).
The three surveys have one aspect in common, namely that they only considered the three provinces of Udine, Pordenone, and Gorizia (i.e., UPG), but not Trieste. The surveys show that Friulian is a widely spoken language in UPG. At the same time, the surveys clearly indicate that Friulian is losing speakers over time. Before we take a closer look at the number of speakers and its evolution, however, in this section we expand the brief discussion outlined in the introduction by presenting some relevant population figures for the three provinces. This provides a clearer picture of the overall situation of the Friulian language.
4.1. Population Figures
Population dynamics play a key role in language competition. Minority or regional languages, such as Friulian, are mainly transmitted within the family. In many cases such languages lose speakers over time if the death rate exceeds the birth rate, simply because more speakers die than new speakers are born. In addition, a net influx of non-Friulian speakers into the population reinforces such a trend.
Based on population statistics from the Italian National Institute of Statistics (Istat), we worked with estimates on the population size displayed in
Table 1. The province of Udine is by far the most populous and, furthermore, in all three provinces we can see a net increase in the population size. At first sight, this might be somewhat surprising, considering that nowadays the death rate exceeds the birth rate (11.4 vs. 8.4 in 2002 and 10.8 vs. 7.5 in 2014). This discrepancy can be explained by positive net migration, i.e., more people migrate/move to the territory of the three provinces than those who leave.
4.2. Number of Speakers of Friulian
In the first survey from 1977, participants were asked what languages they can speak. A more detailed question on the level of knowledge of Friulian was first asked in 1986 in a study carried out solely in the province of Udine [
1]. The later studies from 1998 and 2014 also asked a detailed question on the level of Friulian and are hence able to distinguish four types of speakers:
speaking Friulian regularly (active regular);
speaking Friulian occasionally (active occasional);
not speaking Friulian, but understanding Friulian (passive);
neither speaking nor understanding Friulian (none).
The three surveys use the frequency of use of the language as a proxy for the level of knowledge of the language. In this article, we use two working definitions of speakers of Friulian:
- (a)
Friulian speakers: We define someone as a Friulian speaker if the respondent in the survey reports speaking Friulian regularly or occasionally (corresponding to the sum of type 1 and 2 above). Accordingly, a non-Friulian speaker is a person with no knowledge of Friulian or only receptive skills in it (corresponding to the sum of type 3 and 4).
- (b)
Regular Friulian speaker: As a regular Friulian speaker we count only those individuals who report speaking Friulian regularly (corresponding to type 1). Non-regular Friulian speakers are a residual category including all the rest (including, types 2, 3 and 4 above).
Although there are data from four points in time (1977, 1986, 1998 and 2014), it is not always easy to compare them. First, the 1977 survey did not ask the same question as the others and it does not differentiate between regular and occasional speakers. Second, the sample size and number of municipalities included in the 1977 and 1998 surveys differs from that used in 2014 (see above). The comparability between the surveys, nevertheless, is still possible, as the 2014 survey also collected data for the “old sample”. As the 1986 study only considered the province of Udine, we will not consider it here.
Henceforth, we work with two samples, the “old sample” and the “full sample”, and with two types of speakers, that is Friulian speakers and regular Friulian speakers. The “old sample” can be used to estimate past changes in the use of Friulian over time, while the “full sample” provides more accurate estimates on the current and potential future number of speakers in the UPG.
4.2.1. The “Full Sample”: Friulian in 2014
In 2014, Friulian was spoken regularly by 57.6% of the population of the province of Udine. In the provinces of Pordenone and Gorizia, 25.9% and 21.5% of the population, respectively, spoke Friulian regularly. All relevant figures on Friulian in 2014 are depicted in
Table 2. Note that the absolute number of speakers in Friulian in each of the three provinces is computed by applying the percentages of speakers (regular and occasional) estimated in the survey to the total number of inhabitants of the three provinces [
40]. (The total number of speakers and the corresponding percentages are therefore derived. As a result of both this estimation procedure, and differences between the “new sample” and the “old sample”, the percentages referring to the total in
Table 2 and
Table 3 slightly differ).
4.2.2. The “Old Sample”: Friulian over the Years
The “old sample” allows us to compare the past and the present situation of the Friulian language. It is important to note once more, however, that the “old sample” is not representative of the entirety of the three provinces. This is illustrated in [
3], who provides an estimation of the number of Friulian speakers in UPG based on the “old sample”. This leads to a total number of roughly 670,000 Friulian speakers in 2014. Using the “full sample” instead, the author established a more realistic estimate of roughly 600,000 Friulian speakers. A comparison of those two numbers shows that the “old sample” tends to overestimate the number of Friulian speakers. As the “old sample” considered only the core region of the Friulian language (173 versus a total of 209 municipalities in UPG), such an overestimation is not surprising.
Keeping this in mind, we now look at how the numbers for the “old sample” changed over time. For the survey years 1998 and 2014, the fractions of Friulian speakers and non-Friulian speakers are displayed in
Table 3. As pointed out earlier, the 1977 study did not access the actual level of Friulian, and hence it cannot be directly compared with the data from the later surveys. Based on the 1977 data, however, it was estimated that, in 1977, about 75% of people in the old sample were regular Friulian speakers, see [
1]. Thanks to this estimate, we can extrapolate that, over the past 40 years, the number of regular Friulian speakers decreased from 75% in 1977 to 48% in 2014. This is a drop of almost 30%. Moreover, the number of Friulian speakers fell from 77% in 1998 to 68% in 2014 and, consequently, by almost 10% within 15 years.
The 1998 and 2014 surveys on the Friulian language provide more relevant information on changes over time, for example, changes regarding the languages spoken within the family context, see [
1,
3].
4.2.3. Estimating the Number of Speakers
The figures presented in
Table 2 and
Table 3 are estimates of the actual numbers or proportion of speakers based on the data from the sociolinguistic surveys. As already mentioned, for the “old sample”, 32 of 173 municipalities were sampled, while for the “full sample”, 72 of 209 municipalities were sampled. Moreover, the sociolinguistic surveys carried out in 1977 and 1998 considered only people between 18 and 65 years of age while the 2014 survey collected data for all adults aged 18 or over. To provide an analysis for the entire population, we follow the same procedure used in [
40], that is, we use the percentages of speakers for adults and apply them to the entire population to produce extrapolations. As a result, the true number of speakers might differ slightly from the estimates.
In the remainder of this section, we estimate all relevant model parameters from the empirical data available. We consider, one by one, all the five processes identified in
Section 3.
4.3. Population Dynamics and Migration
Istat provides detailed data on births, deaths, and migration at a provincial level. Unfortunately, data are only available from 2002 onward. Therefore, we present data only for the years 2002 and 2014, the year of the latest study. Birth and death numbers are displayed in
Table 4. We can see that, from 2002 to 2014, both the birth rate and the death rate decreased. Moreover, as in most European countries, the death rate exceeds the birth rate.
Using these numbers, we can deduce the birth and death rates for the population at two points in time. Those rates are the first essential model parameters. Next, we look at migration numbers. They are also made available at the IStat data warehouse. In
Table 5, below, we display net migration numbers, i.e., inward mobility minus outward mobility. In 2014, the net migration numbers were much lower compared with 2002, and more Italian citizens from the UPG left Italy than Italian citizens who came back there from abroad. If we consider the situation in different years, we see that the migration figures are very volatile (in 2006 and 2010 we have total net migration numbers of 9575 and 5554), and that the migration rate ought to be selected carefully. Unfortunately, we do not have any information on the level of Friulian among newcomers to the UPG, but it is reasonable to assume that foreign newcomers and Italians from other regions of the country do not speak Friulian.
4.4. Linguistic Concentration
An estimate of the geographic concentration of Friulian speakers can be based on the “full sample”, where data for 72 of the total 209 municipalities in Udine, Pordenone and Gorizia were collected. In the model, the concentration of speakers is represented by a single concentration parameter (as a concentration measure, we use the index of dissimilarity, cf. [
35]), and this parameter is a number between 0 and 1. If the parameter has value 0, the speakers of the minority/regional language are distributed evenly throughout the territory. A concentration of 1 reflects a situation in which speakers of the minority/regional language inhabit a relatively small number of municipalities, while the speakers of the majority live in the remaining municipalities. In the case of Friulian in UPG, we estimate this concentration parameter to be about 0.5.
4.5. Language Transmission
Which languages are transmitted from one generation to the next depends on the linguistic composition of the family, i.e., the family type. If both parents speak Friulian (that is, if the family type is “FF”), then it is more likely that the language is passed on to the children compared with a family where only one parent speaks Friulian (type “FI”). To address the question of language transmission, therefore, we must have a rough idea about the distribution of family types, i.e., how many families there are of type FF, type IF and type II. In the model used here, this distribution depends on the number of speakers of Friulian, as well as their geographic concentration. The two basic assumptions are the following:
The more people speak Friulian, the more Friulian-speaking parents there are;
The more geographically concentrated speakers of Friulian are, the fewer mixed couples there are.
A more detailed description of the underlying family formation model is provided in [
35].
The second component of intergenerational language transmission is the actual transmission. Adults not only have to know Friulian in order to transmit it, but they actually must use it within the family context. For the purposes of the model, we want to know, for each of the three family types, how often children acquire Friulian within the family. The 1977, 1998 and 2014 sociolinguistic studies on the Friulian language asked their participants about language use at home, cf. [
1,
3]. On the one hand, adult participants were asked which languages their parents spoke with one another and with them when they were young (adult perspective). On the other hand, participants who had children were asked which languages they spoke with them (child perspective). From the answers to those questions, we can estimate transmission rates for each family type. (Since we are interested in studying the success of language transmission, data from the child’s perspective are not very useful. The data tell whether the respondent as a parent uses the minority language with his or her children, but not whether the children become regular speakers when they reach adulthood. If we follow the adult perspective, on the other hand, we have data both on the languages known by the respondent and on the language his/her parents used among themselves).
The three existing sociolinguistic surveys carried out in 1977, 1998 and 2014 provide details on the languages spoken among the parents, both from the adult’s perspective and the child’s perspective [
1,
3,
39]. What can be seen is that the percentage of families in which Friulian is spoken between the parents is decreasing over time significantly. In 1977, 74% of adults reported Friulian being spoken among their parents. In 1998, this number was only 61%. In 2014, in the “old sample”, only 49% of adults responded that their parents spoke Friulian amongst themselves. This decrease (74% in 1977 to 49% in 2014) is comparable with the decrease in regular Friulian speakers (75% in 1977 to 48% in 2014). Note, among all Friulian speakers in the “full sample” in 2014, 67% of respondents reported that their parents spoke Friulian with each other.
Unfortunately, the publications presenting the results of the 1977 and 1998 surveys do not report figures on the intergenerational transmission of Friulian by explicitly differentiating between speakers and non-speakers of Friulian. That means that we can only tell in how many families Friulian was spoken among the parents, but not how often this led to the successful transmission of the language to the next generation. Such detailed information is only presented from the adult perspective for 2014 [
40]. From those data we can obtain estimates on the transmission rates displayed in
Table 6.
It is worth noting that several Friulian speakers state they grew up in families in which the parents did not speak Friulian to one another. This does not necessarily mean, however, that no parent used the language with the child/children. In mixed families it is possible that only one parent speaks Friulian and he or she passes on the language to the children. In this situation, the minority language is not used with the partner, but only in communication between the Friulian-speaker/parent and the child/children. In addition, other members of the wider family, e.g., grandparents, can transmit Friulian too. To take these two cases into account, we make the assumption here that Friulian speakers from families in which the parents spoke Italian (26%), or another language (24%), to each other are examples of mixed families. In other words, these two types of Friulian speakers, as presented in
Table 6, are included in the type of family “FI” when we compute the transmission rates per family type in
Table 7.
This methodological choice presents a second advantage, that is, it allows us take into account the possible case of individuals who were exposed to the Friulian language in their (wider) family environment, but who started to improve their skills and use them more often when they were adolescent, typically thanks to communication with peers (as noted in
Section 3.1, the model defines all individuals under the age of 18 as children). Recall that the social stigma associated with the Friulian language decreased after the adoption of the R. A. 15/96 and the N.A. 482/1999 (see [
8,
12] for a discussion). On the use of Friulian between peers, see [
23].
4.6. Schooling
Potentially, teaching and using a language in formal education is the second most important channel to strengthen a minority language. This can be seen, for example, in the Autonomous Basque Community in Spain, where bilingual schools offer education in Spanish and Basque, cf. [
36]. Compared with Basque in Spain in the education system, the Friulian language only plays a minor role in education in UPG. After the publication of R. A. 15/1996 and N.A. 482/1999, the Friulian language can formally become part of the curriculum in schools, but “its presence is still unstable, generally ‘experimental’ and everything but guaranteed, notwithstanding the objective declared by [N.A. 482/1999], providing for—at least in [nursery school], [primary] school and [lower secondary] school—the teaching and learning of languages granted official protection, among them Friulian” [
4].
The enhanced legal protection and promotion provided in the R. A. 29/2007 did not substantially improve the situation [
4]. Italian is the language “preferably used by teachers and other members of the school staff” in public education [
42]. Parents can choose whether pupils will attend classes in which the Friulian language is taught. On average, 60% of families choose this option in UPG [
19], with some divergence across the three provinces (74% in the province of Udine, 57% for Pordenone, and 55% for Gorizia). The participation of pupils tends to be higher in primary schools (53%), lower in nursery schools (28%) and lower again in secondary schools (19%). According to the curriculum, the Friulian language should not be taught less than 30 h a year, but often the content of the teaching is not the language, as such, but rather the Friulian culture and traditions taught in Italian [
19]. For most pupils (65%), Italian is the language used for communication with parents since birth, while 16% use both Italian and Friulan, and less than 20% identify as using only Friulian with their parents [
19]). (On this point, see also the qualitative analysis of [
43]).
A further important issue that undermines the teaching of the Friulian language is that the school system provides unsatisfactory training for teachers, with the lack of proper certificates to test their ability to teach the language [
19]. Hence, in UPG, there is no programme which is comparable with the bilingual schools in the Autonomous Basque Community in Spain, and only a fraction of the students is exposed to Friulian in a significant manner. Regarding higher education, the University of Udine is the only university offering Friulian language courses to students and staff.
To summarise, Italian is the dominant language of education in UPG. Occasionally, Friulian is used for projects, courses and sometimes even as a medium of instruction, but this is not sufficient to teach the language to children from a non-Friulian background. In the model, the respective parameter is thus set to 0. Current education policy, in principle, could have the potential to strengthen the language among students from Friulian-speaking families and children with only receptive skills in the language could acquire some active skills from projects and courses throughout their school career, but this is not what has been observed generally due to the lack of consistent implementation. To illustrate this potential, however, we present a scenario where some of the passive Friulian-speaking children become active speakers because of effective education policies (see
Section 5.4 below).
At the same time, the school does not fully displace knowledge of Friulian from those children who already speak it. Although Italian becomes the predominant language of socialisation once Friulian-speaking children begin primary school, many rediscover (and reuse) it once they become teenagers as an identity flag, especially between peers and for in-group communication [
44]. We assume, therefore, that schooling is “neutral” as regards the language skills of children who are native speakers of Friulian, that is, it does not completely remove it over time (the respective parameter is, therefore, set to 0).
4.7. Adult Language Learning
Friulian is a language predominantly acquired within the family. Theoretically, non-Friulian speakers could learn the language as adults. For example, language and culture courses are organized by the Società Filologica Friulana—Friulian Philological Society (SFF). In these courses, participants mainly learn how to read and write. This is related to the fact that most people taking part in such courses already speak Friulian, cf. Petris (2014: 33–35). Therefore, adult language learning—to some extent—only strengthens the Friulian language among its speakers, but does not convert non-speakers into speakers. In the model, the respective conversion parameter is thus set to 0.
Learning a minority language in adult life is possible, in principle, and also through practice, that is, through communication with colleagues and friends (see Guglielemi 2008). Thanks to the relative linguistic proximity between Italian and Friulian, frequent communication with Friulian-speakers and peers can result in the acquisition of receptive skills and, perhaps, some active skills by non-Friulian speakers. This channel, however, is not explicitly included in the model used in this article and, consequently, we leave this question for future research.
5. Results
In this section, we apply the language competition model to the Friulian language. (The language dynamics model originally developed for Basque and Spanish in the Basque Autonomous Community, see [
36], was implemented in Python. The source code for the model and the actual analysis of Friulian with Python are made freely available on Github:
https://github.com/teasko/language_dynamics_modeling, (accessed on 25 October 2021)). The analysis consists of three parts. In the first part, we analyse the history of Friulian and check how well the model outcomes coincide with empirical observations. By doing this, we fine-tune the model. For the analysis of the developments since 1977 we restricted ourselves to the “old sample”, since the representative “full sample” was only made available in 2014. Moreover, for the past developments we only consider regular Friulian speakers. This is because the 1977 survey did not collect sufficiently detailed data on the use of Friulian and, hence, only an estimate of the number of regular Friulian speakers is available for 1977, cf.
Section 1 in this article. In the
Section 2, we use the language competition model to analyse projections for the future of Friulian in the UPG. To achieve this, we consider the representative “full sample” and analyse Friulian speakers as well as regular Friulian speakers. In the
Section 3, we analyse the potential future of Friulian in the three provinces separately.
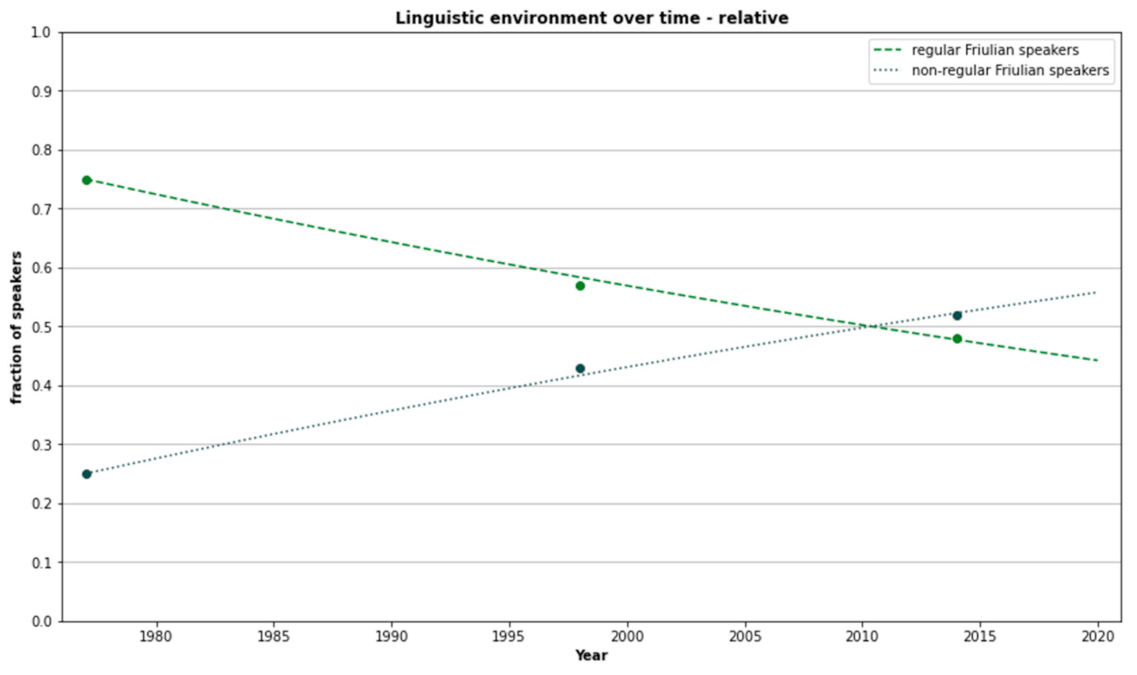
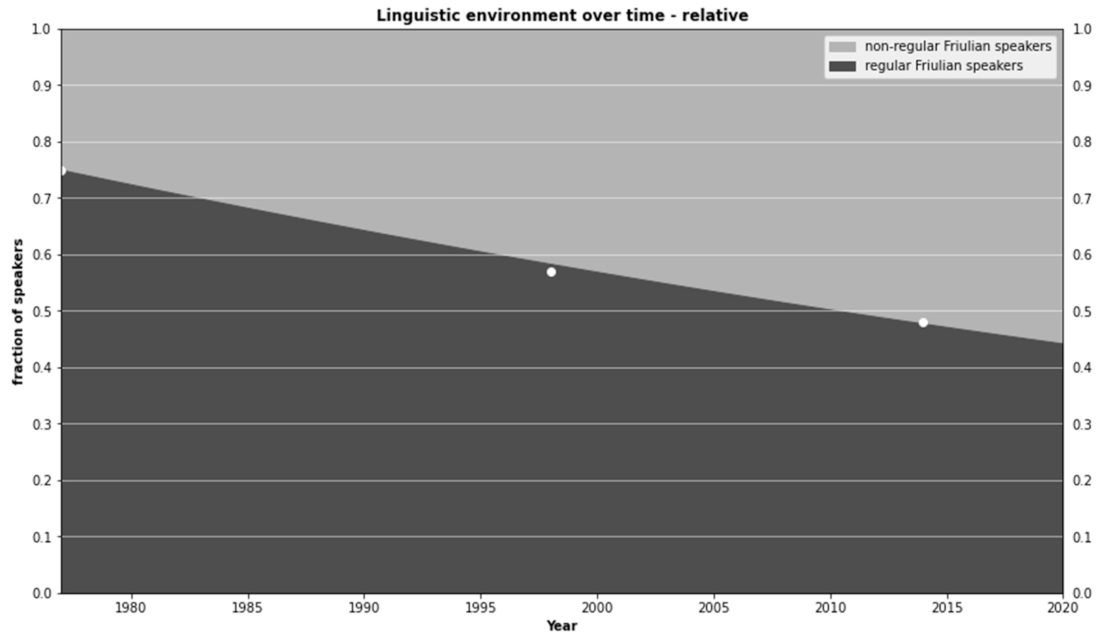
5.1. The “Old Sample”—Past Developments
For the “old sample”, we have empirical data for the years 1977, 1998, and 2014. As explained in
Section 4.2.2, these data should be handled with caution, since the “old sample” does not consider the entirety of the three provinces, Udine, Pordenone, and Gorizia, as the Friulian-speaking area. Therefore, estimates of the number of regular Friulian speakers in UPG based on the “old sample” can be expected to be too high. Moreover, the 1977 survey did not fully access the level of Friulian and, consequently, we only have an estimate of the number of regular Friulian speakers for this year. Nonetheless, the “old sample” can be useful to illustrate the rate of loss of Friulian over time. This is achieved here by applying the language dynamics model to the relative number of regular Friulian speakers.
To model the historical data, we must slightly adapt the parameter estimates presented in
Section 4, as they reflect the current status of Friulian. This adaption mainly concerns birth and transition rates. First, the birth rate was much higher in the nineteen-seventies and nineteen-eighties (See, e.g.,
https://www.macrotrends.net/countries/ITA/italy/birth-rate, (accessed on 25 October 2021)). We assume a higher birth rate of about 12 births per 1000 people in contrast to the 8.4 and 7.6 found for 2002 and 2014. Moreover, we do not have comparable estimates for family transition rates for regular Friulian speakers in 1977 as we do for Friulian speakers in 2014, cf.
Table 6. From [
1] we know that about 50% of the respondents spoke Friulian with their children. Given that 75% of the 1977 population were regular Friulian speakers, we estimate here that about 66% of those regular Friulian speakers transmitted the language to their children.
The model starts in 1977 and makes projections for all successive years up to 2020. The results are shown in
Figure A1 and
Figure A2 in the
Appendix A. First of all, we can see that the lines produced by the model fit the empirical data for 1998 and 2014 quite well, but overestimate the fraction of regular Friulian speakers and slightly underestimate this fraction for 2014. This is mainly due to the change in the birth rate over time. The higher the birth rate, the faster the change happens. The 0.012 birth rate used for the projections is lower than the actual rate in 1977 and higher than the rate in 1998. Hence, for the first couple of years, the fraction of regular Friulian speakers does not increase fast enough and later increases too fast. Or, in other words, the lines should be steeper for earlier years and less steep in later years. Second and, most importantly, we can clearly see the continuous decline in regular Friulian speakers. According to the model projections, we can observe an annual decrease of about 1.2% in regular Friulian speakers. Moreover, this decrease will continue in the future if the general trends remain. However, since the projected curves are too steep for the later years, we do not provide projections beyond 2020. The corresponding numbers in fact would underestimate the actual number of regular Friulian speakers and would, in addition, only refer to the “old sample”.
5.2. The “Full Sample”—Future Developments
To find a more precise picture of the future of Friulian in all of UPG, we now turn to the data from the full sample. In contrast to the 32 municipalities that make up the “old sample”, the 72 municipalities in the “full sample” provide sufficient information to estimate the total number of Friulian speakers in the three provinces in 2014 more accurately. Those numbers are displayed in
Table 2 (see above).
We could now just start running the model at the year 2014 and analyse the future projections it produces. A downside of this approach is that we do not have any data past 2014 to assess the quality of the projections. As an alternative approach, we run the model starting at 1998. For this purpose, we must additionally estimate the number of Friulian speakers in 1998. This can be achieved as follows. For 2014, we have numbers for the “old sample” as well as for the “full sample”. For 1998, we just have numbers for the “old sample”. Comparing the 2014 numbers for both samples, we obtain a quotient. This quotient can then be used to adjust 1998 numbers from the “old sample”.
Another difference between the two approaches is the underlying migration rate. We could see above that, in 2002, there were 8057 net newcomers to the UPG, while in 2014 there were only 1797. Over decades, such a difference in the numbers of newcomers has a significant effect on the population growth. In order to capture this volatility more accurately we use average migration rates. With the first approach (starting in 1998), we use the average rate for the years 2002–2014 (0.0066). With the second approach (starting in 2014), we use the average rate for the years 2014–2018 (0.0031). Both approaches are applied to Friulian speakers and regular Friulian speakers.
Before we turn our attention to the actual model projections, we should recall the predictive limitations of the model and also of the two specific approaches used here. The model works with birth, death and migration rates that are kept constant over time. In reality, nevertheless, these rates change over time, with migration being the most volatile. Moreover, the rates are not age or gender specific, which they are clearly in reality. More sophisticated population projection models, therefore, incorporate estimates of how the parameters will evolve in the future. For example, due to an aging population, it can be assumed that the death rate will increase during the next decades (See, e.g.,
https://www.macrotrends.net/countries/ITA/italy/death-rate, (accessed on 25 October 2021)). Compared with the birth and death rates, foreseeing the development of migration figures is much harder, due to their erratic nature and dependency on external contingencies. Therefore, even more sophisticated population projections must make use of simplistic assumptions based on the evolution of the migration rate. Fornasin (2016) proposes to handle the unavoidable uncertainty of future developments by considering different scenarios, for example, one with higher and another with lower migration figures. Fornasin (2016) derives future projections for the population in Friuli-Venezia Giulia under different scenarios, and this article will follow this approach. Consequently, the projections that follow should not be seen as precise predictions of the future, but as two possible scenarios with different, constant migration rates.
Another limitation of the model applied here is that it does not differentiate between different age groups. Hence, differences in the linguistic composition of different age groups are not considered. Instead, the model simply averages over all age groups. Since intergenerational language transmission is the most important factor for the vitality of Friulian, this limitation can have a negative effect on the quality of the projections. The linguistic composition of adults between 18 and 65 is
a priori more relevant for the transmission to the younger generation than the linguistic composition of adults older than 65 (e.g., people who become parents in their 40s will be in their 60s when their children come of age), although grandparents and other members of the family can also facilitate the intergenerational transmission of a language. (Templin [
37] presents an age sensitive extension of the basic model applied here. With this extended model, differences between age groups can be accounted for. The major drawback of the extended model is that significantly more data are required to set it up, since most model parameters vary between the age groups).
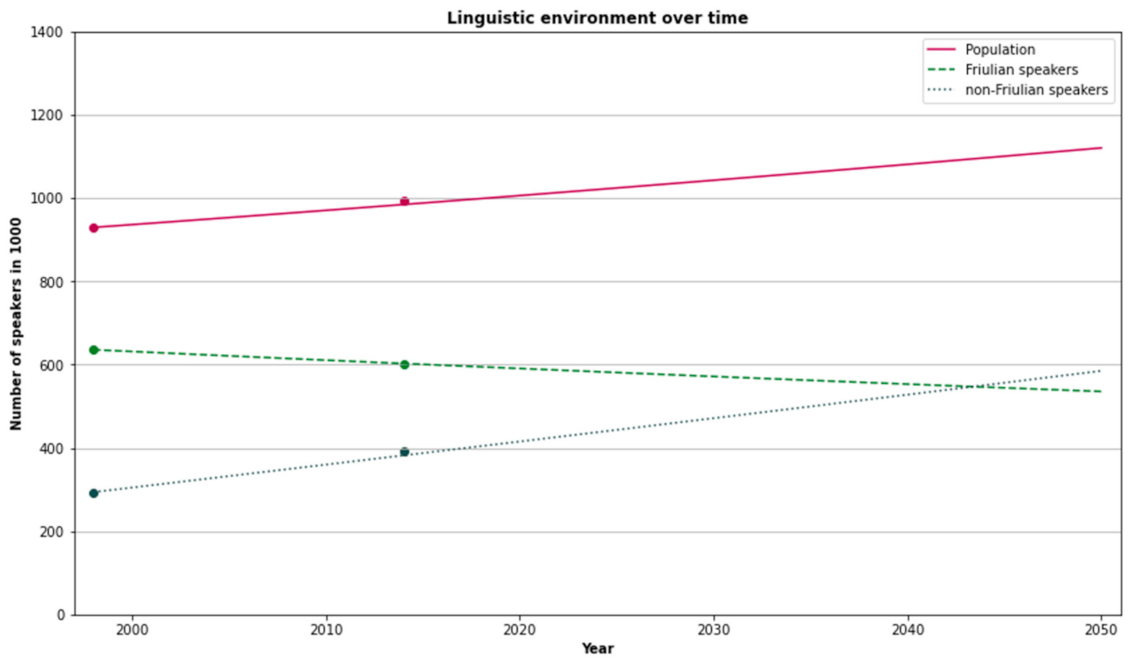
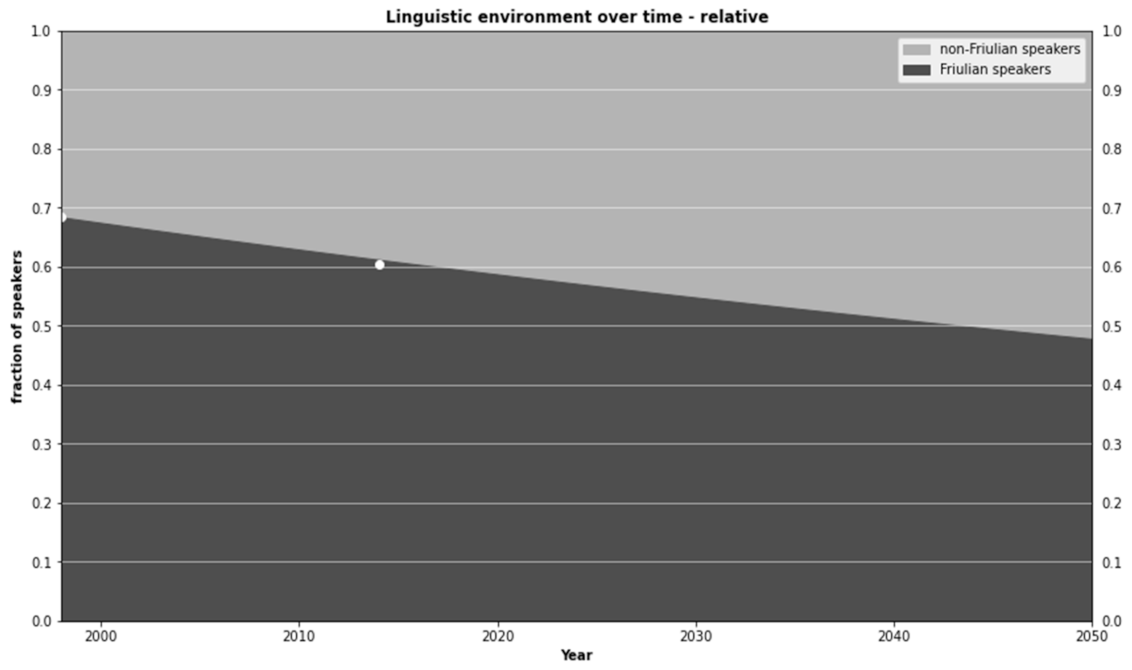
5.2.1. Friulian Speakers
The model projections for both approaches (starting in 1998 and 2014) are presented in
Figure A3,
Figure A4,
Figure A5,
Figure A6 in the
Appendix A. The first approach that starts in 1998 with a higher migration rate matches the 2014 data well, see
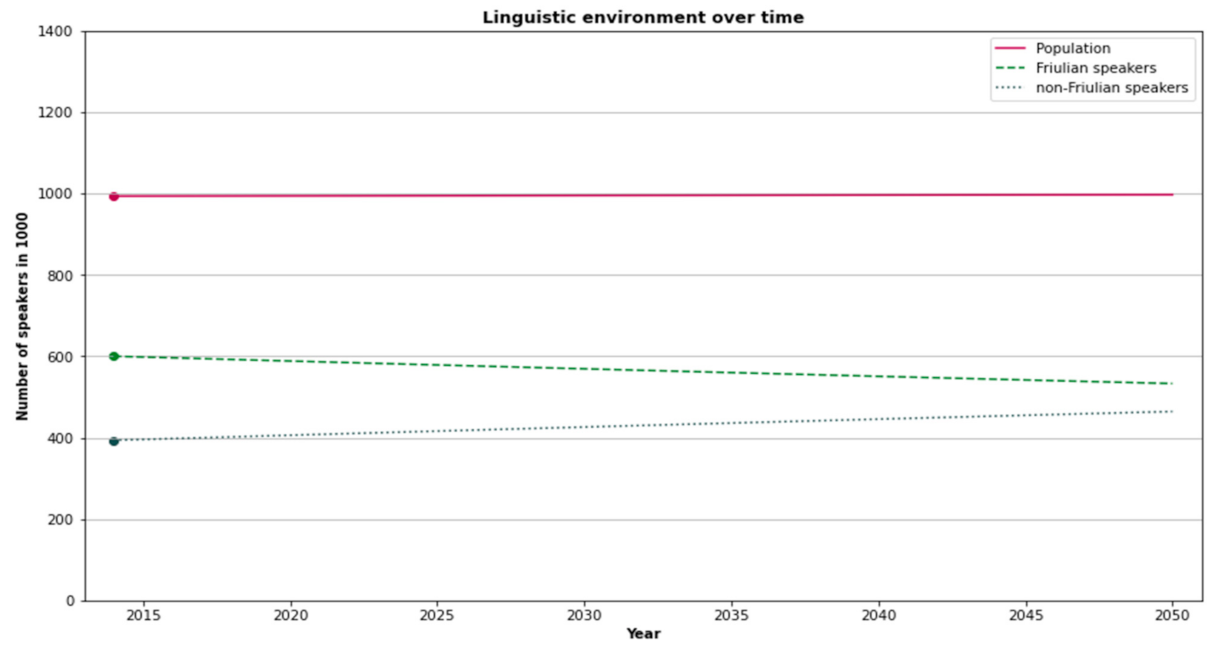
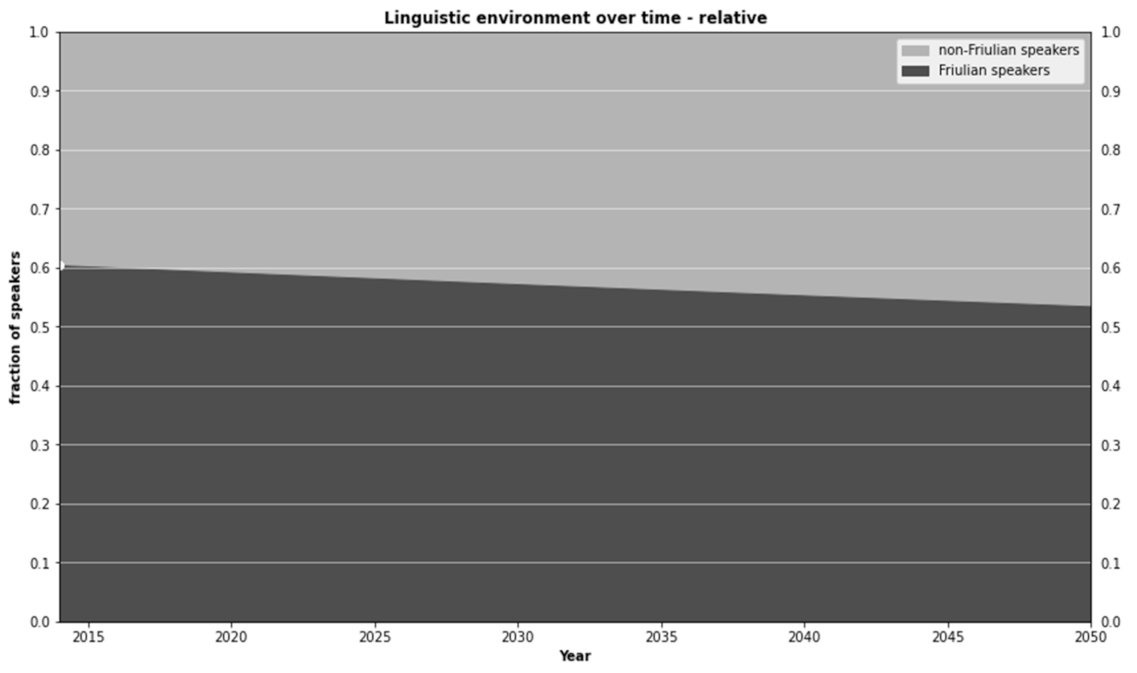
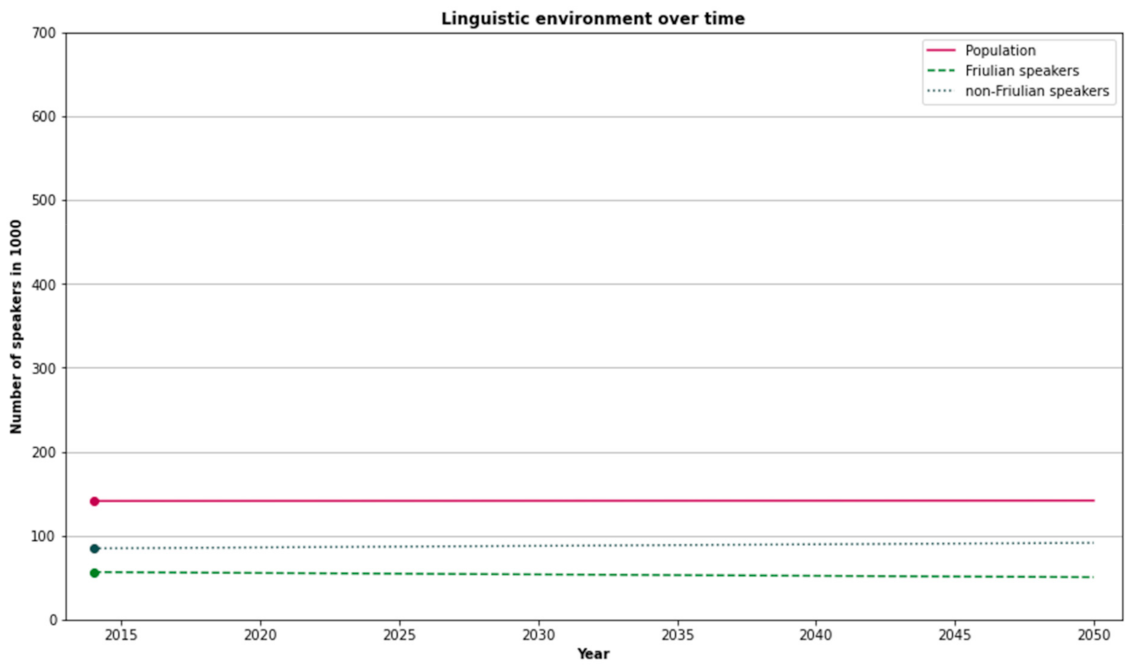
Figure A3. From 2014 onward, both approaches show the same trends but at different rates. The first trend is the increase in the population mainly due to positive net migration, entailing an increase in the number of non-Friulian speakers. With the first approach, the one with the higher migration rate, this increase is so significant that, by 2050, Friulian speakers will be in a minority. With the second approach, based on the lower migration rate, Friulian speakers are still the majority, but only by a few percentage points. Just considering the total numbers of Friulian speakers, both approaches project that their numbers will sink from about 600,000 in 2014 to about 530,000 in 2050, see
Table 8. This underlines the reality that Friulian is a language passed partially from one generation of speakers to the next, but most often not learned by newcomers who do not speak it already.
We can think of the two approaches as two different scenarios depicting how many migrants there will be in the future. In the first approach or scenario (high rate), the overall population increases. In the second approach or scenario, the overall population remains almost constant. Since most migrants are neither regular nor occasional speakers of Friulian, the difference between the two scenarios mainly affects the number of non-speakers and, hence, their linguistic composition. For example, in the high-rate scenario 47.8% of the population speaks Friulian in 2050, but 53.4% in the low-rate scenario, see
Table 8. What remains quite similar in both scenarios is the absolute number of Friulian speakers. Hence, while the relative numbers strongly depend on migration figures, the absolute numbers do not. Thus, even if the actual number of migrants is lower or higher than is the case in the analysed scenarios, the absolute number of Friulian speakers projected by the model would end up at around 530,000 in 2050.
The actual number of speakers in 2050 might even be lower than 530,000. One reason for that is the expected increase in the death rate in the next three decades that we mentioned earlier. With such an increasing rate, population projections suggest a shrinking population in Friuli-Venezia Giulia, see, e.g., [
45]. With a shrinking population, we will observe a similar but slightly accelerated decrease in the number of Friulian speakers compared with our projections presented here.
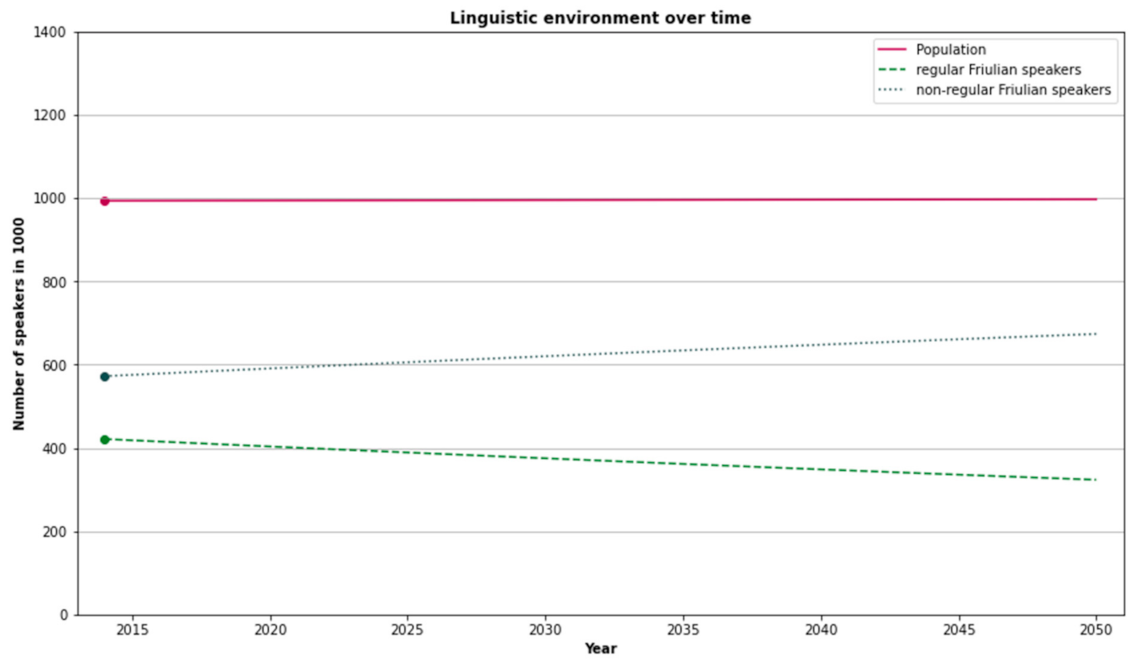
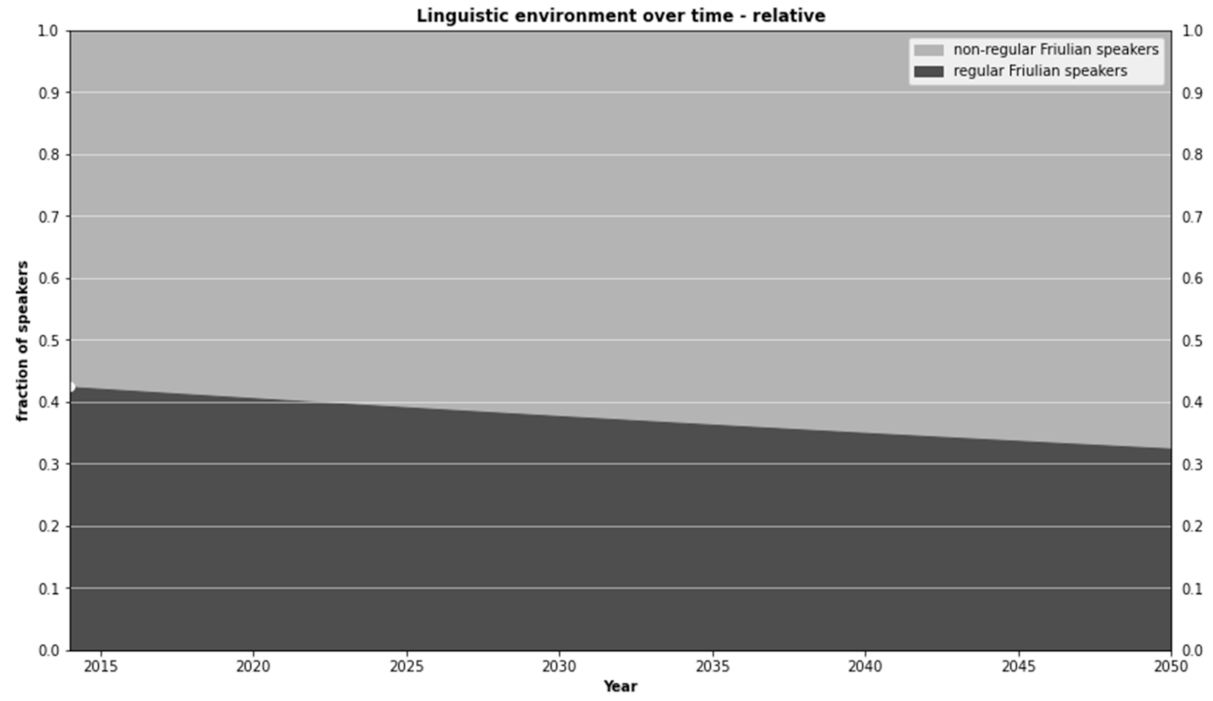
5.2.2. Regular Friulian Speakers
After looking at all Friulian speakers, i.e., regular and occasional, we now turn to regular Friulian speakers only. The model projections for both scenarios (i.e., “high migration” and “low migration” are presented in
Figure A7,
Figure A8,
Figure A9,
Figure A10 in the
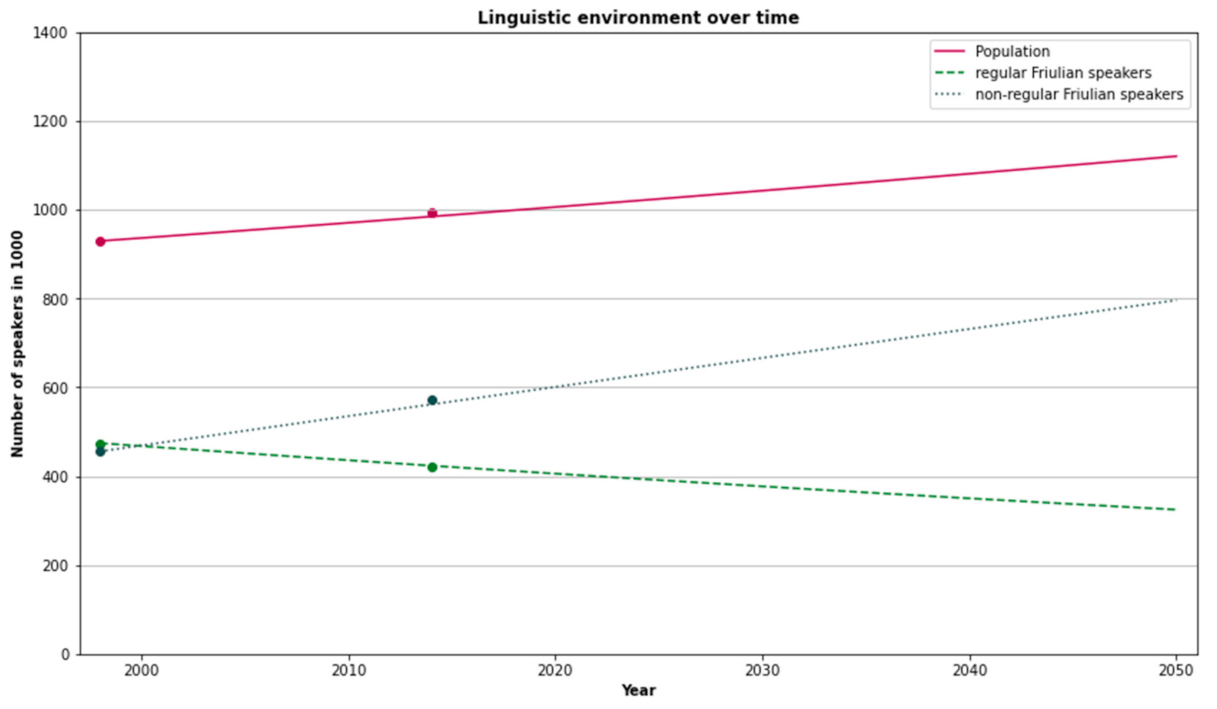
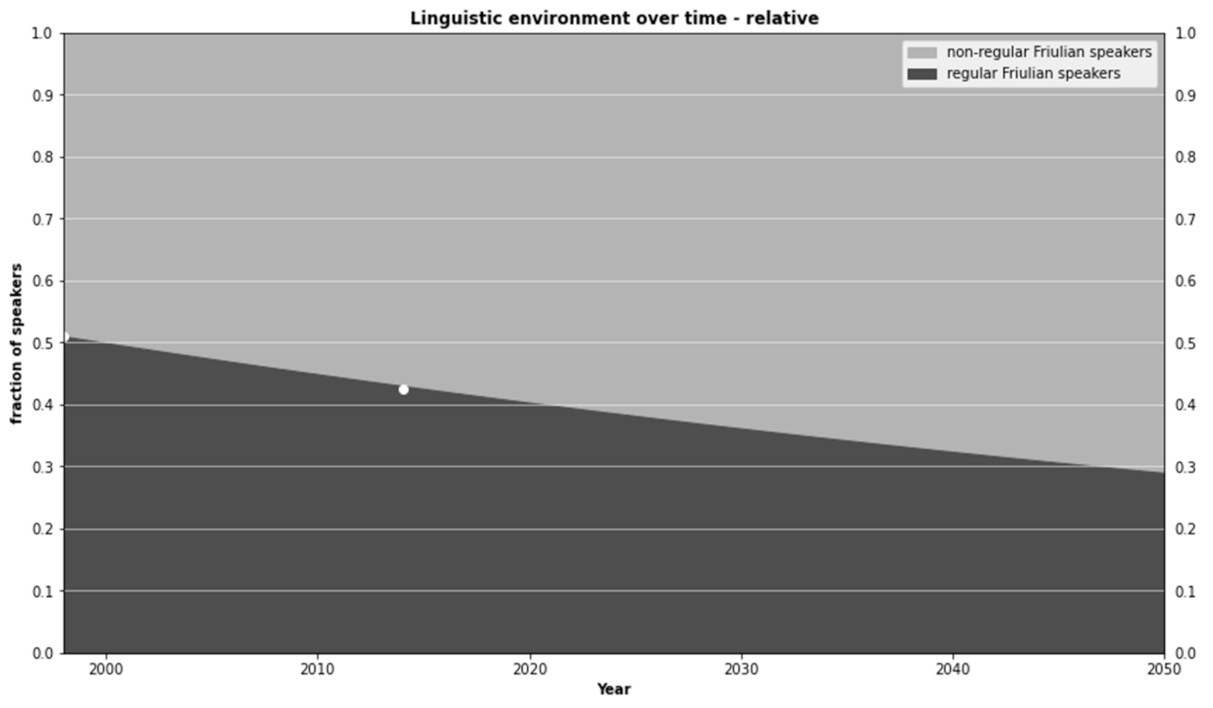
Appendix A. Similar to the case of all Friulian speakers, the absolute numbers of regular Friulian speakers decrease from about 420,000 in 2014 to 320,000 in 2050 with both approaches. At the same time, the number of people who do not speak Friulian regularly increases, but more so following the first approach due to its higher migration rate. This leads to a difference in the fraction of the UPG population speaking Friulian in 2050. With the first approach, only 29% speak Friulian regularly by 2050, while the second approach produces a figure of 32.4%, see
Table 9. Recall, in 2014 the fraction of regular Friulian speakers using the “full sample” was 42.4% (see
Table 2). Thus, as for all speakers, the fraction of regular speakers decreases faster following the first approach than it does with in the second, while the absolute number of regular Friulian speakers evolves similarly with both approaches.
5.3. Developments at the Provincial Level (Friulian Speakers)
As part of the concluding analysis, we look at the three provinces separately. Due to the selection of municipalities in the “old sample”, we cannot derive reliable estimate numbers of speakers in 1998 as was achieved in the analysis of the entire UPG in the previous section. For example, the “old sample” only contains one of the 25 municipalities in Gorizia. Therefore, we only provide projections based on the “full sample” starting in 2014, i.e., we apply the second approach.
Graphical representations of the projections are displayed in
Figure A11,
Figure A12,
Figure A13 in the
Appendix A. These three figures show that in each of the provinces we can see a similar trend, as is the case for UPG as a whole: the number of non-Friulian speakers, and with it the population, increases while the number of Friulian speakers decreases. In addition, the figures highlight some essential differences between the provinces. Since the analysis at the provincial level resembles the overall trends at the level of UPG as a whole, we do not discuss regular Friulian speakers separately here.
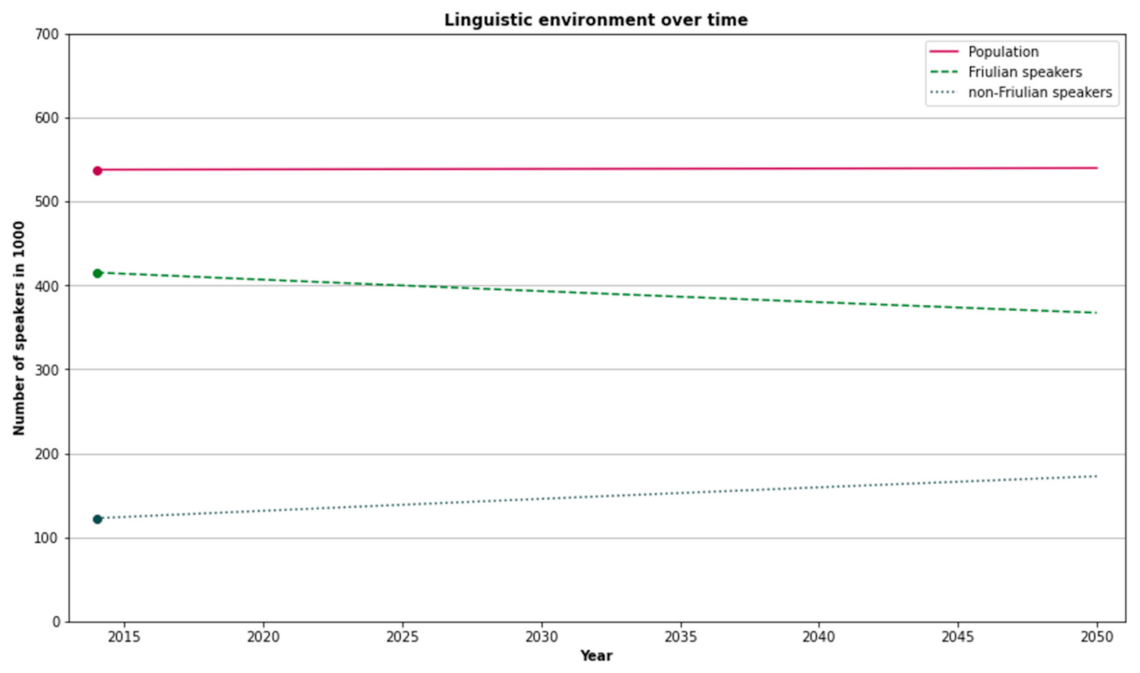
5.3.1. Udine
With roughly 540,000 inhabitants in 2014, Udine is the province with the largest population and the most Friulian speakers of the three. Moreover, it is the only province where Friulian speakers are in the majority. In 2014, 415,000 people spoke Friulian regularly or occasionally, comprising 77% of the population. According to the projections, the number of Friulian speakers will drop to 367,000 in 2050. This would imply a 11% decrease in the absolute number of Friulian speakers. With the parallel increase in non-Friulian speakers, the model projects that, by 2050, only 68% of the population of Udine will be Friulian speakers, which further weakens the language.
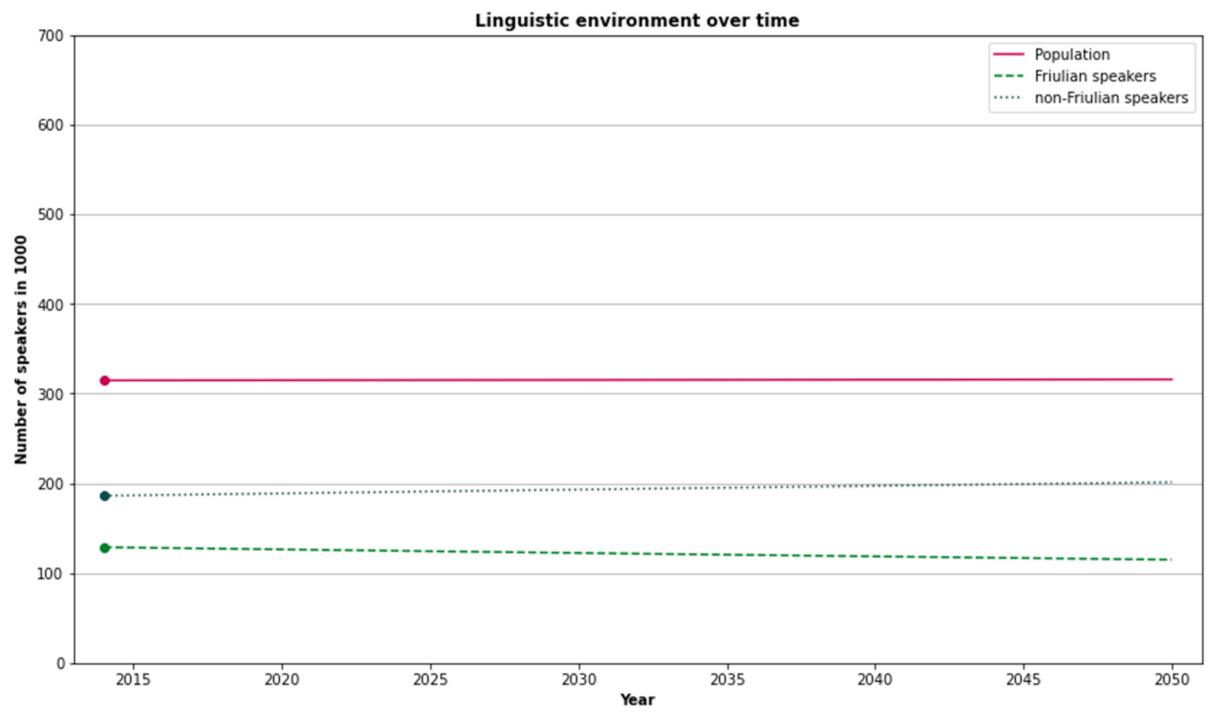
5.3.2. Pordenone
In 2014, the province of Pordenone had 315,000 inhabitants. Roughly 129,000 people, or 41% of Pordenone’s population, were Friulian speakers. According to the projection, the number of Friulian speakers will decrease to 115,000 by 2050. This also corresponds, roughly, to an 11% decrease. As a result of the Friulian language loss and the overall population dynamics, the fraction of the population speaking Friulian regularly or occasionally will drop from 41% in 2014 to 36% in 2050.
5.3.3. Gorizia
With 141,000 inhabitants in 2014, Gorizia is the smallest of the provinces. The linguistic composition of Gorizia is quite similar to that of Pordenone: about 40% of the population were Friulian speakers in 2014. By 2050, this fraction will decrease to 35%. In absolute terms, we are facing a decrease from 56,000 Friulian speakers in 2014 to 50,000 in 2050 and, as a result, a decrease of 11%.
5.4. Scenario with an Enhanced Language Education
Section 4.6 shows that the role of Friulian in the education system is not sufficient to affect the active language skills of pupils significantly. In this section, we illustrate the potential future effect on linguistic vitality of strengthening the language in education. We consider a scenario in which a proportion of the students who have only receptive skills in Friulian become active speakers of the language, thanks to language learning at school. The new General Language Policy Plan 2021–2025 (ARLeF 2021) adopted in November 2021, in fact, earmarks EUR 8.89 m for acquisition planning until 2025, of which EUR 8.64 m is designated for the school system, and EUR 0.25 m, specifically, for adult linguistic training. The budget for acquisition planning in child education, therefore, corresponds to 38.5% of the total budget for the GLPP (EUR 22.4 m). Policy measures aimed at school education include enhanced teacher training, better learning material and instruments, and information campaigns directed at families. It is, therefore, useful to estimate the potential impact of this investment on the vitality of the Friulian language, assuming that the implementation is effective.
In practical terms, we must find a reasonable positive value for parameter sHB—the rate at which non-active Friulian pupils become active speakers. Comparing total numbers in 2014 (see
Table 2), we can see that about 30% of non-active speakers (labelled “others”) have receptive skills in Friulian. We use this percentage for children also, following the approach explained in
Section 4.2. (Instead of using the 30%, we could apply to children the same percentage of the closest generation, that is young people aged 18–29. In this age group those with passive skills are 31.6% (see [
40]). The difference between 15% and 15.8% (=31.6/2), however, is minimal). We assume that half of those become active through strengthened language education. Hence, we can set sHB to 0.15 (or 15%) for our illustrative purpose here. This parameter is close to the estimate of the same parameter in the context of the Autonomous Basque Community in Spain, where more quantitative data on language loss and gain through schooling are available, cf. Templin (2020).
The model predicts that enhanced acquisition planning in the school system could significantly slow down language shift. While in the scenario with low migration presented in
Table 9 the percentage of regular speakers of Friulian in 2050 is 32%, this percentage is almost 36% if an enhanced language education policy is effectively implemented (see
Table 10). This equals a total of 30,000 additional, regular Friulian speakers. Education, therefore, can contribute to reducing language shift in UPG, but it is not enough to stop it completely (We avoid presenting projections for a scenario with high migration because the 15% estimate becomes more questionable. The parameter sHB, equal to 0.15, reflects the assumption that half of 30% of non-active Friulian pupils have passive Friulian skills. With high migration more pupils are children of migrants who very likely do not have passive Friulian skills, and the rate should be lower than 15%).
The comparison between
Table 9 and
Table 10 shows that, despite enhanced acquisition planning, the absolute number of regular speakers of Friulian and their percentage with respect to the total population in UPG in 2050 are both below the values reported for 2014. Of course, this conclusion holds only under the assumptions made here, that is, that the Friulian education system is as effective as the Basque one in “converting” pupils with receptive skills in Friulan into active speakers of the language. More precise and realistic projections require data to estimate the true value of the parameter sHB.
6. Conclusions
We analysed the past and potential future development of the Friulian language in the three provinces of Udine, Pordenone, and Gorizia (UPG), located in the north-east of Italy. Based on data from sociolinguistic surveys from 1977, 1998 and 2014, we could see a clear decrease in the number of Friulian speakers in general, as well as regular Friulian speakers in particular.
The older studies from 1977 and 1998 did not consider the entire territory of UPG as the relevant Friulian-speaking area, but only part of it. Therefore, estimates of the overall number of Friulian speakers based on the older surveys are to be handled with caution. Nonetheless, for the Friulian-speaking area they considered, we could see a dramatic decrease from 75% of the population speaking Friulian regularly in 1977 to 48% in 2014. This corresponds to an average annual decrease of about 1.2%.
To assess the future development of Friulian in UPG, in this article we use a language competition model. This model builds on a mathematical formalization of five processes that are crucial to the language dynamics in any (modern) society, as well as on model parameters obtainable from empirical data, that is, (i) couple/family formation; (ii) intergenerational language transmission; (iii) language acquisition in formal education; (iv) language learning by adults, including migrants; and (v) migration flows. Using estimates for the various model parameters, the language dynamics model is applied to Friulian in UPG. We analysed Friulian speakers as well as regular Friulian speakers. According to the model projections, the historical downwards trend will continue in the near future, as long as the linguistic environment and policy do not change substantially. The model projects that the number of Friulian speakers in UPG will decrease from 600,000 in 2014 to about 530,000 in 2050, and that the number of regular Friulian speakers decreases from 420,000 to 320,000. This corresponds to a decrease in Friulian speakers of 11% and in regular Friulian speakers of 23%. By 2050, about 30% of the UPG will speak Friulian regularly and about 50% will speak Friulian regularly or occasionally. Only in the province of Udine will Friulian speakers remain in a clear majority. The trends that could be seen at the level of UPG as a whole could also be observed at the level of the individual provinces.
The projections indicate, therefore, that almost a quarter of regular speakers will disappear by 2050. This is 100,000 fewer regular speakers in 36 years, equal to an average annual rate of decline of 0.66%, roughly in line with recent trends. The model does not allow us to estimate the average age of the speaker in the future. However, considering the general ageing of the population, it is reasonable to assume that, in 2050, a good part of those 324,000 or so speakers will be over 50. If we assume that the age interval during which people typically have children is between 20 and 45, then the Friulian-speaking demographic base of reproductive age will be much lower than 324,000, creating the premise for a further tendential weakening of that section of the community speaking Friulian. The dynamic model also assumes that the intergenerational transmission takes place at the level of the population as a whole and not only in a certain age group (a more detailed model would require too much data which are unfortunately not available). At the same time, it must be said that children can acquire knowledge of the minority in the wider family environment (e.g., grandparents).
Demographic projections in this article are made with incomplete data at times, samples of sociolinguistic surveys that have been redefined over time and using a certain set of assumptions that IStat makes about demographic trends and migration flows. For this reason, they should be interpreted with caution. However, the forecasts highlight two fundamental points. Firstly, language acquisition via education can reduce the decline in the number of speakers, but is it not likely to be enough. Without a stronger commitment of the population and the public administration, the process of language shift is not likely to stop. Secondly the situation is not yet compromised, and it is not too late to exert an effective influence on the long-term viability of the language. A mass of regular speakers of around 405,000 in 2020 is a firm point from which to stabilise the use of the Friulian language in the future if decision-makers intervene consistently and invest adequate resources in its protection and promotion. The new General Language Policy Plan (2021–2025) is an important step in this direction. The new plan is considerably better structured than the previous one for the period 2015–2019 (see [
46]), with specific budgetary components earmarked for the plan’s various objectives.


