Article

Effects of Grazing Indigenous Laying Hens on Soil Properties: Benefits and Challenges to Achieving Soil Fertility

1
Polytechnic of Coimbra, Coimbra Agriculture School, Bencanta, 3045-601 Coimbra, Portugal
2
Research Centre for Natural Resources, Environment and Society (CERNAS), Coimbra Agriculture School, Bencanta, 3045-601 Coimbra, Portugal
*
Author to whom correspondence should be addressed.
Sustainability 2022, 14(6), 3407; https://0-doi-org.brum.beds.ac.uk/10.3390/su14063407
Submission received: 17 January 2022 / Revised: 12 February 2022 / Accepted: 17 February 2022 / Published: 14 March 2022

Abstract

:
Crop–livestock integration fosters a holistic view of the agricultural system, which is nowadays particularly relevant due to the rising environmental concerns. Laying hens can contribute to improvement of soil chemical properties, but their effects in soil fertility are not fully known. This study aimed to evaluate the effects of grazing laying hens on soil fertility. To meet this goal, we assessed the effects of indigenous laying hens in 22 soil parameters, including chemical, physical, and microbiological parameters, in two farms from the central region of Portugal: an organic horticultural field (A) and a conventional orchard (B). At farm A, the animals grazed during the dry period for 84 continuous days, at a density of 4 m2 per hen. At farm B, the animals grazed during the wet period, at a density of 3.50 m2 per hen, in two periods (34 + 33 days), with a 50 day break period in between grazing. The hens contributed to an increase in the extractable macronutrients phosphorus (P2O5) and potassium (K2O), mineral nitrogen (NH4+-N and NO3-N), and exchangeable bases calcium (Ca2+) and magnesium (Mg2+) in both farms, making these central parameters to consider in their grazing management. At farm A, where soil disturbance is higher, the grazing did not affect soil moisture retention but positively affected soil dry bulk density and contributed to an increase in total aerobic bacteria and nitrogen-fixing bacteria abundances. At farm B, where the hens’ presence led to the understory eradication, soil moisture retention, total aerobic bacteria, nitrogen-fixing bacteria, and fungi abundances were negatively affected, while soil dry bulk density was unaffected. These results show that hens can significantly contribute to improve soil fertility, but more research is needed regarding their grazing management.

1. Introduction

At present, the agricultural sector faces tremendous challenges due to population growth, climate change, increasing environmental problems, and increasing competition for resources [1,2]. A concerted effort has been made to ensure sustainable food production systems and implement resilient agricultural practices that increase productivity and production by 2030 [3]. Combining crops and livestock within the same agricultural system is an efficient strategy to improve farm resilience and sustainability, since this approach contributes to the nutrient cycle, use of on-farm resources and reduction of external inputs, and delivery of ecosystem services [4,5,6,7]. In this context, grazing management by livestock animals can contribute to soil fertility and improvement of crop growth through droppings deposited in the soil. Recently, several authors have demonstrated that grazing broilers can be a strong approach to increasing nutrients in the soil [8,9,10]. However, less scientific evidence has been presented regarding the effects of laying hens on soil fertility. On the other hand, more attention should be given to grazing laying hen management systems since egg production plays a key role in the global food market and it is expected to continue to do so in the future [11,12]. Menke and Paffrath [13], as cited in Kratz et al. [8], reported that the fecal nutrients deposition from laying hens in soil led to the enrichment of nitrogen and phosphorus in the topsoil. Additionally, in soils grazed by laying hens, Hilimire et al. [14] reported an increase in soil pH, total nitrogen (TN), organic matter, and electrical conductivity levels immediately after the hens’ removal from the field. In that moment, no significant differences were found between grazed and not grazed fields with regards to total carbon; mineral nitrogen, i.e., ammoniacal nitrogen (NH4+-N) and nitric nitrogen (NO3-N); extractable phosphorus (P2O5); extractable potassium (K2O); and cation exchange capacity. However, there were significant differences in ammoniacal nitrogen and nitric nitrogen at various time periods after grazing stopped, which was an expected dynamic considering the high amounts of uric acid present in poultry manure [15]. Consequently, Hilimire et al. [14] found higher amounts of soil ammoniacal nitrogen in the grazed fields 51 and 98 days after removal of the animals at the depths of 15–30 cm and 0–15 cm, respectively. In the grazed fields, higher amounts of soil nitric nitrogen at the depth of 15–30 cm were recorded 51 days after the hens’ removal, but significantly lower amounts were recorded after 98 days at the same depth.
Despite the existing knowledge and research on the effects of grazing hens on soil, there are still gaps that need to be filled. To the best of our knowledge, there is no available information regarding hens’ effect on soil microbiological properties, which are particularly relevant in sustainable soil fertility, nor on soil physical properties. Furthermore, the effects in soil micronutrients, such as copper, zinc, iron, and manganese, which are elements that are part of most of the compound feeds supplied to these animals, are also not fully known. Understanding the effects of laying hens on the various properties of the soil is crucial to have a broad view of the system. This will ensure the proper grazing management of these animals and will allow for the advantageous utilization of their contributions, without harming the sustainability of the agroecosystem or the surrounding environment. Thus, this research is founded on the hypothesis that the hens’ grazing can contribute to the improvement of the soil fertility of agroecosystems and, consequently, aimed to evaluate the effects of grazing laying hens on soil properties. In this work, the effects of grazing Portuguese indigenous laying hens were assessed in 22 soil parameters, including chemical, physical, and microbiological parameters, in two different farms from the central region of Portugal: an organic horticultural field (farm A) and a conventional orchard (farm B).

2. Materials and Methods

2.1. Region Description

Experiments were conducted in the central region of Portugal in two different farms, 0.5 km apart, both belonging to Coimbra Agriculture School. The climate is defined as Mediterranean temperate with Atlantic influence. The historical annual total precipitation is 905.10 mm, and the historical annual average temperature is 15.52 °C (Figure A1 in Appendix A). The soil of both locations is alluvial soil.

2.2. Conducted Experiments

2.2.1. Farm A—Horticultural Field

Farm A is a certified organic farm and focuses its production on horticultural and arable crops. The texture of the topsoil is sandy loam (sand: 73.21%, clay: 6.85%, and silt: 19.94%). The latitude, longitude, and elevation are, respectively, 40°13′ N, 8°26′ W, and 12 m above sea level. At this site, we integrated Portuguese indigenous laying hens (breeds Preta Lusitânica and Amarela) with horticultural crops and evaluated their effects on the physical, chemical, and microbiological soil properties (treatment C). Since the hens were also used to control weeds and weed control methods are common in this environment, we compared the hens’ effects on weed control with the effects of the following two other weed control treatments allowed in organic farming: a thermal weed control (treatment T), using a gas burner, and a mechanical weed control (treatment M), using a rototiller. All treatments were applied between rows of horticultural crops, with 0.75 m of width and 30 m of length (total area of 22.5 m2). Four between-row of crops were studied per treatment (n = 4), and each row was filled by three organic certified horticultural crops, namely, sweet pepper (Capsicum annuum L., var. Entinas), kale (Brassica oleracea L., var. Winterbor), and red onion (Allium cepa L., var. Red Bull). The soil was tilled before plantation with a hammer shredder, a disk harrow, a spading machine, and a power harrow, in that order. The crops were randomly planted in one-third of each of the rows on 6 May 2020, and, thereafter, were irrigated by a drip system. The most abundant weeds found during the experiment period are as follows: Cyperus rotundus L., Digitaria sanguinalis L. (Scop.), Amaranthus spp. L., Portulaca olerácea L., Raphanus raphanistrum L., Panicum repens L., and Oxalis pes-caprae L.
The animals grazed in fixed tunnels, along and between the vegetable crops rows, for 84 continuous days, beginning on 3 June 2020 and ending on 26 August 2020. The grazing management followed the European regulations for organic production, including Regulation (EU) 2018/848 and Commission Regulation (EC) No. 889/2008. In this context, each tunnel was occupied per 5 laying hens, respecting the outdoor minimum density of 4 m2 per hen. Two shelter structures were provided for each tunnel, one at each end. Each shelter structure supplied 0.84 m of perch, a nest, and ad libitum water. Additionally, each hen was fed with 80 g day−1 of certified organic compound feed (Table A1 in Appendix B). During the trial period, the mortality rate was zero.
The thermal and mechanical weed control treatments were intermittent and intervened 9 and 6 times, respectively, between May and August 2020, in accordance with the weeds’ growth. The thermal treatment was performed with a gas burner with a working width of around 50.00 cm, while the mechanical treatment was performed using a rototiller with two discs and a working width of around 60.00 cm. The last interventions of these treatments coincided approximately with the end of the hens’ grazing, with a difference of around 50 h in order to allow comparisons between treatments in time.

2.2.2. Farm B—Orchard

Farm B is a conventional farm focused on fruit production, namely, the following species: persimmons (Diospyros kaki L.), apple trees (Malus domestica L. Borck), lemon trees (Citrus limon L. Burmf), orange trees (Citrus sinensis L. Osbeck), and tangerine trees (Citrus reticulata L.). The texture of the topsoil is sandy loam (sand: 73.57%, clay: 7.23%, and silt: 19.20%). The latitude, longitude, and elevation are, respectively, 40°12′ N, 8°27′ W, and 20 m above sea level. Here, we integrated Portuguese indigenous laying hens (breed Preta Lusitânica) with persimmons (cultivar Fuyu), and we compared the hens’ grazing of herbaceous understory on soil properties with the control (without grazing). The understory of the orchard is composed of a mixture of several herbaceous species, such as the following: Poa annua L., Bromus rigidus Roth, Avena spp. L, Lolium rigidum Gaud., Medicago nigra L., and Vicia sativa L. Before the experiment, during orchard cultivation, the understory was usually treated with a rotary cutter. We randomly chose three fruit trees per treatment (n = 3), around which wire fences were constructed in a 3.5 m × 2 m formation (total area of 7 m2). Each plot was provided with one shelter structure and was occupied by 2 laying hens. The outdoor animal density was 3.5 m2 per hen. Identical to farm A, each shelter structure supplied 0.84 m of perch, a nest, ad libitum water, and certified organic compound feed (Table A1 in Appendix B).
The hens’ treatment was intermittent, with two grazing treatments, with a 50 day break period in between grazing. The first grazing treatment lasted 34 days, beginning on 11 November 2020 and ending on 15 December 2020. The second grazing treatment lasted 33 days, beginning on 4 February 2021 and ending on 9 March 2021. A laying hen went missing on 20 November 2020, which was replaced by another hen of the same breed on 24 November 2020.

2.3. Soil Sampling and Analysis

At farm A, the following three soil sampling events occurred during the experiment: the first before the animals were introduced into the field in mid-May 2020, and the remaining two events occurring 10 and 90 days after the animals’ removal in mid-September and at the end of November 2020, respectively. For each soil sampling event, 36 samples were taken per treatment (n = 36) in order to analyze physical parameters. Twelve randomly selected points were determined per treatment, wherein 3 samples were taken per point. To determine soil chemical properties, we took three composite samples per treatment (n = 3). Each sample was composed of the cores collected in 4 different points, randomly distributed, and 2 cores were taken per point (depth up to 20.00 cm). To determine soil microbiological properties, such as the abundance of relevant functional groups in biogeochemical cycles, we took three composite samples per treatment (n = 3). Each sample was composed of the cores collected in 4 different points, randomly distributed, and 4 cores were taken per point (depth up to 15.00 cm).
At farm B, the following four soil sampling events occurred during the experiment: the first before the animals’ introduction into the field in November 2020; the second one after the first grazing treatment in December 2020; and the remaining two events, 10 and 90 days after the second and last grazing treatment in March and in June 2021, respectively. Physical properties were measured in the last two events, and for each of these, 18 samples were taken per treatment (n = 18). Nine randomly selected points were determined per treatment, wherein 2 samples were taken per point. To determine soil chemical properties, in all the sampling events, we took three composite samples per treatment (n = 3). Each sample was composed of the cores collected in 4 different points, randomly distributed, and 2 cores were taken per point (depth up to 20.00 cm). To determine soil microbiological properties, in the last two events, we took three composite samples per treatment (n = 3). Each sample was composed of the cores collected in 4 different points, randomly distributed, and 4 cores were taken per point (depth up to 15.00 cm).

2.3.1. Physical and Chemical Parameters

Dry bulk density was measured according to Blake and Hartge [16]. Undisturbed soil volumes were carefully collected using cores with 5.30 cm of diameter and 3 cm length. Samples were oven-dried (UFB 500, Memmert, Germany) at 105 °C for 48 h and weighed after that. Dry bulk density was calculated by dividing soil dry weight by the volume of the core. Soil moisture was measured according to the gravimetric method, as described by the International Standard Organization [17]. Water content (expressed as a percentage of the initial mass) was determined by the loss of mass after drying (ULE 500, Memmert, Germany) at 105 °C for 48 h.
Samples for chemical analysis were dried in a forced air convection oven (ULE 800, Memmert, Germany) at 38 °C for 24 h. Once dried, samples were ball milled and sieved at 2 mm by the Soil Mill Pulverizette 8 (FRITSCH GmbH, Idar-Oberstein, Germany). Soil organic carbon (SOC) was determined according to the International Standard Organization [18]. SOC was determined by combustion at 590 °C followed by infrared detection using the Dual Range Sulfur and Carbon Analysis System, SC-144 DR (LECO Corporation, St. Joseph, MI, USA). TN was determined by the Kjeldahl method, according to the International Standard Organization [19], comprising the following three steps: (i) digestion using a digestion block (J.P. Selecta, Barcelona, Spain), (ii) distillation using UDK 129 Kjeldahl Distillation Unit (VELP Scientifica, Usmate Velate, Italy) and boric acid 2% as an indicator, (iii) and titration with hydrochloric acid 0.1 N. Mineral nitrogen (NH4+-N and NO3-N), evaluated according to the International Standard Organization [20]. Soluble nitrogen fractions were extracted in a 0.01 M calcium chloride solution and measured using an automated Autoanalyzer—Continuous Flow Analyzer, SAN++ System, series 1050 with 1074 Sampler (Skalar Analytical B.V., Breda, The Netherlands). Soil extractable macronutrients (P2O5 and K2O) were evaluated following the Egnér-Riehm method [21]. Samples were extracted using a solution of ammonium lactate and acetic acid at pH 3.65–3.75. To determine the amounts of P2O5, we mixed soil extracts with ammonium molybdate in acid medium and ascorbic acid, and the mixture was analyzed using a UV/VIS Spectrometer T80+ (PG Instruments Ltd., Leicestershire, UK). To determine the amounts of K2O, we analyzed soil extracts using the atomic absorption spectrophotometry PinAAcle 900T (Perkin Elmer, Inc., Waltham, MA, USA). Soil micronutrients copper (Cu), zinc (Zn), iron (Fe), and manganese (Mn) were extracted simultaneously with a solution of ammonium acetate 0.5 N, acetic acid 0.5 N, and EDTA 0.02 M at pH 4.65 and analyzed using the atomic absorption spectrophotometry PinAAcle 900T (Perkin Elmer, Inc., Waltham, MA, USA), according to the method of Lakanen and Ervio [22]. The total exchangeable bases potassium (K+), sodium (Na+), calcium (Ca2+), and magnesium (Mg2+) were determined according to the method of Chapman [23]. Samples were extracted with a solution of ammonium acetate 1 N at pH 7 and measured using the atomic absorption spectrophotometry PinAAcle 900T (Perkin Elmer, Inc., Waltham, MA, USA). Soil pH was measured in water according to the International Standard Organization [24], using the pH Meter 3310 (Jenway Ltd., Dunmow, UK), with the P19 Sentek electrode (Sentek Ltd., Essex, UK). Soil electrical conductivity was measured according to the International Standard Organization [25] using the conductivity meter Cond 3110 (Xylem Analytics GmbH, Weilheim, Germany), with a TetraCon® 325 measuring cell (Xylem Analytics GmbH, Weilheim, Germany).

2.3.2. Microbiological Parameters

Total aerobic bacteria and nitrogen-fixing bacteria were evaluated through serial dilutions (from 10−3 to 10−5) followed by spread plate count technique, in triplicate, as described by Alef [26] and Weaver and Frederick [27], with adaptations. Colony-forming units (CFU) of total aerobic bacteria and nitrogen-fixing bacteria were counted on nutrient agar and yeast mannitol agar, respectively, both after a 48 h incubation period at 30 °C. Denitrifying bacteria were counted by the most probable number (MPN) method, using nitrate broth as growth medium, according to Focht and Joseph [28], with adaptations. Two replicate tubes were inoculated for each soil dilution (ranging from 10−4 to 10−8) and incubated at 30 °C for 7 days. After incubation, 1 mL of Griess-Ilosvay’s nitrite reagent (Millipore, Darmstadt, Germany) was added to the tubes in order to assess the presence of denitrifying bacteria. Color changes of the medium to pink and/or orange/red were enumerated as positive tubes. Moreover, uninoculated tubes were used as negative controls, and tubes inoculated with Pseudomonas aeruginosa (NCTC 12903/ATCC® 27853) and Escherichia coli (NCTC 12241/ATCC® 25922) were used as positive controls [29,30]. Populations of soil fungi were evaluated through serial dilutions (from 10−2 to 10−4), followed by the spread plate count technique, in triplicate, according to the method of Alef [26], with adaptations. Fungi CFUs were counted on potato dextrose agar after a 7 day incubation period at 25 °C.

2.4. Statistical Analysis

All data are presented as mean values (± standard deviation). In data from farm A, analysis of variance was performed (two-way ANOVA that applied time and treatments as factors), and, where there was statistical significance, the means were further separated using Tukey’s range test. In data from farm B, analysis of variance was also performed (two-way ANOVA that applied time and treatments as factors), and, where there was statistical significance, the means were further separated using Sidak’s multiple comparisons test. Normality was tested for all variables, and, whenever a variable presented a non-normal distribution, that data were transformed to meet assumptions of normality through log transformation. However, we present and report hereafter the original means and standard deviations for a better interpretation of the results. All statistical analyses were performed using GraphPad Prism software version 8.0.2 (GraphPad Software, Inc. San Diego, CA, USA), with the alpha level set at 0.05.

3. Results

3.1. Farm A—Horticultural Field
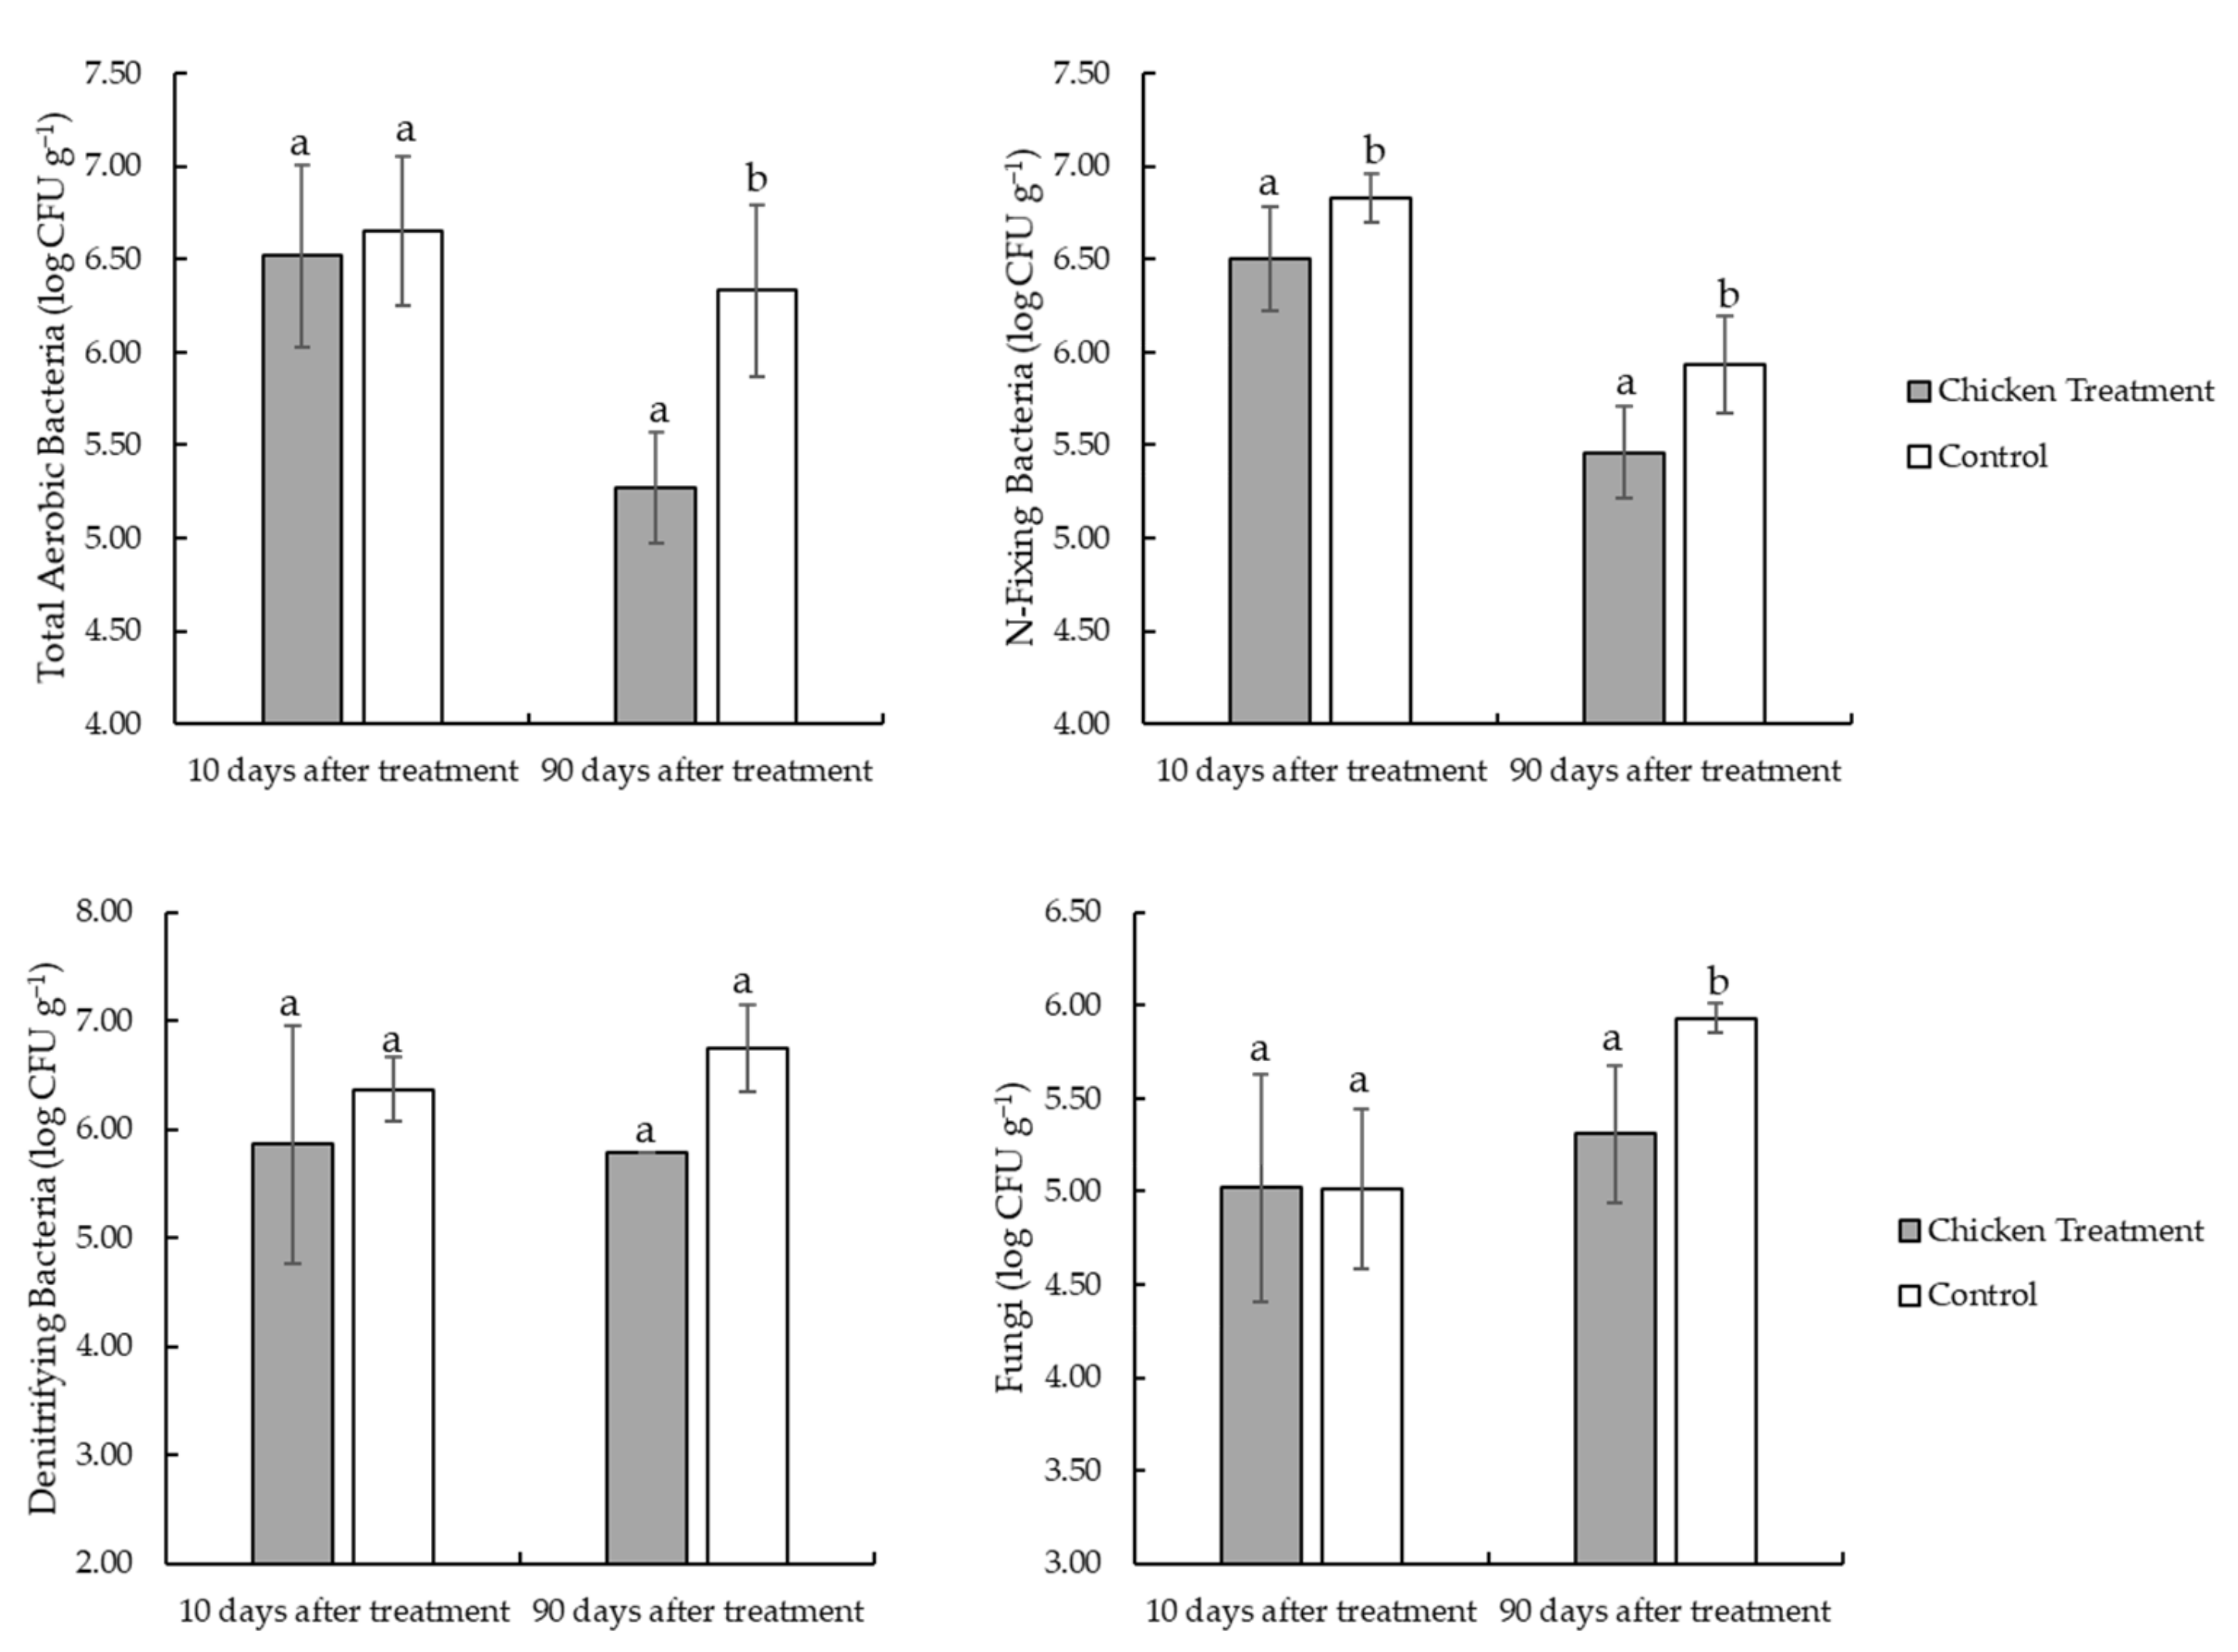
Relative to other treatments, the treatment using the grazing hens at farm A for 84 continuous days during the dry season led to higher levels of several soil chemical parameters 10 days after the animals’ removal. These included TN, NH4+-N, NO3-N, extractable macronutrients P2O5 and K2O, extractable micronutrient Mn, all exchangeable bases (K+, Na+, Ca2+, Mg2+), soil pH, and soil electrical conductivity (p < 0.05; Table 1). In this period, no significant differences were found regarding the micronutrients Cu, Zn, and Fe (p > 0.05). At this stage, the hens’ treatment of weeds (C) presented significantly higher amounts of total SOC compared to the thermal treatment (T), but a similar amount compared to the mechanical treatment (M).
During the last data collection period, 90 days after the treatments’ intervention, several soil chemical parameters stabilized, which resulted in an absence of significant differences between the hens’ weed control treatment and the other treatment options in the following soil parameters: TN, NH4+-N, organic C, micronutrients Zn and Fe, soil pH, and exchangeable bases Na+ and Ca2+ (p > 0.05). However, the grazed soils, at this period, were still presenting significantly higher levels of extractable macronutrients P2O5 and K2O, extractable micronutrients Cu and Mn, and exchangeable bases K+ and Mg2+. The contents of NO3-N and the soil electrical conductivity also seemed to stabilize in hens’ soils, although they showed significant differences with at least one treatment in this last period. The increase in the electrical conductivity of the grazed soils is most likely related to the increase in nutrients and exchangeable bases in the soil, caused by the deposits of droppings. This possible connection is reinforced by the positive and significant correlations found between this parameter and the following parameters: NO3-N (r = 0.995; p < 0.0001), P2O5 (r = 0.715; p = 0.030), K2O (r = 0.789; p = 0.011), K+ (r = 0.787; p = 0.012), Na+ (r = 0.867; p = 0.002), and Mg2+ (r = 0.798; p = 0.010) (Table S1 in Supplementary Materials). In turn, a non-significant negative correlation was found between soil moisture and soil electrical conductivity (r = −0.679; p = 0.138; Table S1 in Supplementary Materials). Although non-significant, this negative correlation may indicate that an increase in soil moisture can possibly contribute to the dissolution of salts and, consequently, to the reduction of soil electrical conductivity. Similar to soil electrical conductivity, the higher levels of soil pH found 10 days after grazing may possibly be due to the increase in the levels of exchangeable bases, which presented the highest values shortly after grazing. Positive and significant correlations were found between the soil pH and the exchangeable bases Ca2+ (r = 0.731; p = 0.025) and Mg2+ (r = 0.669; p = 0.049) (Table S1 in Supplementary Materials).
Regarding soil dry bulk density, soon after the weed control intervention treatments, the mechanical treatment presented significantly lower levels than the other treatments. Moreover, the other treatments’ levels were identical. However, 90 days later, the soil dry bulk density increased in the mechanical treatment, which made it identical to that verified in the thermal treatment (a treatment without soil tillage). In this final period, the hens’ treatment resulted in a dry bulk density significantly lower than that of the other treatments (p < 0.0001), which is expected in no-tillage soil with higher organic matter content. Concerning soil moisture, no significant differences were found between the hens’ treatment and the mechanical treatment in any of the periods studied (p > 0.05), while the thermal treatment presented significant differences in relation to the other treatments in all the periods studied (p < 0.05).
Considering microbiological parameters, we found that the soils grazed by the laying hens presented higher abundances of total aerobic bacteria and nitrogen-fixing bacteria shortly after grazing than the soils of the other treatments (p < 0.0001 and p < 0.05, respectively; Figure 1). Following this, the hens’ treatment in the last studied period presented higher abundance of total aerobic bacteria than the thermal treatment (p = 0.0228), but an identical abundance to that observed in the mechanical treatment (p = 0.2558). Additionally, in the last period, the hens’ treatment presented a higher abundance of nitrogen-fixing bacteria than the mechanical and thermal treatments (p = 0.0123 and p = 0.0362, respectively). Positive and significant correlations were found between nitrogen-fixing bacteria abundance and extractable micronutrients Fe (r = 0.917; p = 0.010) and Mn (r = 0.998; p < 0.0001) (Table S1 in Supplementary Materials). Moreover, although not significant, a positive moderate correlation was also found between nitrogen-fixing bacteria abundance and soil moisture (r = 0.771; p = 0.073; Table S1 in Supplementary Materials). No significant differences were found between treatments regarding the abundance of denitrifying bacteria and fungi in any of the periods studied (p > 0.05). Although the abundances of denitrifying bacteria seemed to present identical levels between the periods studied (i.e., without variations in time), the fungi abundance increased in all treatments between the periods studied. This was most likely due to the increase in precipitation that led to the increase of soil moisture. A very strong positive correlation was found between fungi abundance and soil moisture (r = 0.997; p < 0.0001) (Table S1 in Supplementary Materials).

3.2. Farm B—Orchard

During the wet season, the intermittent grazing at farm B led to significant variations in several soil chemical parameters, which were more evident in certain periods than in others. In comparison to the control field (orchard understory vegetation without treatments), the grazed soils presented higher levels of the following soil chemical parameters: NH4+-N, shortly after the second grazing; NO3-N, after the first grazing and 10 days after second grazing; extractable macronutrient P2O5, shortly after the second grazing, and extractable macronutrient K2O, immediately after the first grazing; extractable micronutrient Zn, 10 and 90 days after the final grazing; soil pH, after the first grazing; exchangeable base Ca2+, after the first grazing and 10 days after second grazing, as well as exchangeable base Mg2+, shortly after the first grazing; and soil electrical conductivity, after the first grazing and 10 days after the second grazing (Table 2). Positive and significant correlations were found between soil electrical conductivity and the following parameters: NO3-N (r = 0.971; p < 0.0001), K2O (r = 0.713; p = 0.047), K+ (r = 0.873; p = 0.005), and Na+ (r = 0.868; p = 0.005) (Table S2 in Supplementary Materials). Moreover, a positive, strong, and significant correlation was found between soil pH and the exchangeable base Mg2+ (r = 0.849; p = 0.008; Table S2 in Supplementary Materials). No significant differences were found in any of the studied periods in the other soil chemical parameters, such as TN; organic C; extractable micronutrients Cu, Fe, and Mn; and exchangeable bases K+ and Na+ (p > 0.05).
Moreover, concerning soil dry bulk density, no significant differences were found in any of the studied periods between the grazed soils and the control soils (p > 0.05). However, although soil moisture was identical between the hens’ treatment and the control, soon after the last grazing, the control fields presented significantly higher levels of soil moisture 90 days after the last grazing (p < 0.0001).
Grazing the orchard soils had negative consequences on the overall microbiology of the soil. However, no significant differences were found between the studied treatment and the control shortly after the last grazing in relation to total aerobic bacteria (p = 0.7820) and fungi abundances (p = 0.9947). The hens’ treatment presented significantly lower levels of these microorganisms 90 days after the grazing (p = 0.0001 and p = 0.0078; Figure 2). In addition, the hens’ treatment also presented a significantly lower abundance of nitrogen-fixing bacteria than the control in both periods studied, which took place 10 and 90 days after the final grazing (p = 0.0138 and p = 0.0004, respectively). Moderate and highly positive, but non-significant, correlations were found between the abundance of nitrogen-fixing bacteria and the micronutrients Fe (r = 0.689; p = 0.311) and Mn (r = 0.905; p = 0.095), respectively (Table S2 in Supplementary Materials). Moreover, a positive, significant, and strong correlation was found between the nitrogen-fixing bacteria abundance and soil moisture (r = 0.999; p = 0.001; Table S2 in Supplementary Materials). As verified on Farm A, no significant differences were found between the hens’ treatment and the control regarding the abundance of denitrifying bacteria in any of the periods studied (p > 0.05).

4. Discussion

4.1. Farm A—Horticultural Field

Grazing laying hens at the horticultural field for 84 continuous days, in the dry season, with an animal density of 4 m2 per hen, contributed to raising the quantity of TN; mineral nitrogen (NH4+-N and NO3-N); extractable macronutrients P2O5 and K2O; extractable micronutrient Mn; and exchangeable bases K+, Na+, Ca2+, and Mg2+. Moreover, the hens’ grazing seemed to aid in the maintenance of the levels of the extractable micronutrient Cu in soil, avoiding losses in the medium term. The grazing did not contribute to an increase in the levels of SOC, which is comprehensible due to the low C/N ratio found in the hens’ droppings. Additionally, the grazing did not contribute to an increase in the levels of the micronutrients Fe and Zn. This result was unexpected, taking into consideration the amount of these micronutrients found in the hens’ droppings (Table A2 in Appendix C), which indicates that more research is potentially required in this area. Soil pH significantly increased in the short term after grazing when higher levels of exchangeable bases, specially Ca2+ and Mg2+, were found. The increase of exchangeable bases most likely contributed to the increase of soil pH, approaching neutrality [31,32]. This inference is reinforced by the positive and significant correlations found between the soil pH and Ca2+ and Mg2+ at this farm. Identically, the increase of soil electrical conductivity is strongly correlated with the increase of NO3-N; the macronutrients P2O5 and K2O; and the exchangeable bases K+, Na+, and Mg2+ (Table S1 in Supplementary Materials). Both soil electrical conductivity and soil pH stabilized in farm A 90 days after grazing, most likely due to the occurrence of precipitation (Figure A1 in Appendix A), since rainfall contributes to the dissolution and the leaching of salts, which leads to lower levels of salts in the soil and, consequently, decreased electrical conductivity [33]. However, attention must be paid to the accumulation of salts in soil grazed by the hens, particularly in arid regions that lack of precipitation, where intensive grazing can lead to soil salinization phenomena.
The results of this study agree with those obtained by Hilimire et al. [14] regarding TN, NH4+-N and NO3-N, soil pH, and soil electrical conductivity. Contrastingly, this study’s results did not correspond with the results of Hilimire et al. [14] regarding the extractable macronutrients P2O5 and K2O, which were unaffected in the hens’ grazing studied by these authors. However, our results agree with the results achieved by Menke and Paffrath [13], as cited in Kratz et al. [8], concerning the increase in nitrogen and phosphorus. Recent studies have been found regarding the effects of grazing broilers on soil chemical properties, suggesting increases in the amounts of mineral nitrogen, K2O, and P2O5 after grazing [9,10]. However, it is difficult to make comparisons with the results obtained in this work, since broilers have different feed requirements than laying hens, which influences excreta properties [14,34] and, consequently, their effects on soil. Therefore, more research is needed regarding the effects of grazing laying hens on soil properties.
Although the mechanical and thermal treatments have less of an effect in soil chemical properties relative to the hens’ treatment, it is worth noting the following aspects: the slight, but significant, increase in the amounts of NO3-N in the mechanical treatment 10 days after the interventions, since it is well known that soil tillage contributes to increase mineralization and nitrification rates leading to nitrogen loss [35,36,37,38], and slight decrease of SOC in the thermal treatment 10 days after the interventions that was non-significant relative to the mechanical treatment, since fire in some situations can possibly contribute to soil carbon losses [39].
Regarding soil physical properties, soon after the treatments’ interventions, the dry bulk density of the grazed soils was identical to that found in the thermal treatment (treatment without tillage), which may indicate that grazing hens have little effect on this soil’s physical parameter. In the same period, the mechanical treatment presented the lowest dry bulk density relative to the other treatments, which was expected. In fact, the rotating movement of the rototiller contributes immediately to a floury soil, as a result of the separation of the particles. Yet, in soils with low organic matter that cannot support rotation movements, the separation of the particles leads to the destruction of the soil aggregates [40]. In the end, the soil particles become loose, and, with the deposition of water (e.g., precipitation or irrigation sprinkler), which was the case between the first and the second soil samplings (Figure A1 in Appendix A), the particles tend to seal, hardening the topsoil, which justifies the increase of 12.61% in the dry soil bulk density of the mechanical treatment between the second sampling (10 days) and the final sampling (90 days) following the treatment. This result was expected, since the increase of soil dry bulk density over time and after tillage has been reported by other authors [41,42,43]. Concerning soil moisture retention, no significant differences were found between the hens’ treatment and the mechanical treatment in any of the periods studied. However, significant differences were found between the thermal treatment and the other treatments in all the periods studied (Table 1). This can be explained by the inefficiency of this treatment in controlling weeds. While the other treatments left the soil practically uncovered at the end of the experiment, the thermal treatment showed a high abundance of weeds and the soil completely covered by vegetation right after the intervention. Since soil physical conditions and vegetation affect each other mutually (i.e., soil conditions can affect vegetation patterns, while vegetation can affect soil thermal and hydrological properties) [44], the higher abundance of vegetation in the thermal treatment may have contributed to the significant differences found in soil moisture retention.
In this farm, the grazing additionally contributed to an increase in total aerobic bacteria and nitrogen-fixing bacteria abundances 10 and 90 days after grazing, which indicates that grazing hens are useful for increasing microbial activity in this kind of agroecosystem (horticultural field, with annual tillage). Although the hens did not significantly contribute to the increase of Fe in the grazed soil, the stability in the levels of this micronutrient and the increased levels of Mn in the grazed soils, coupled with an increase in soil moisture, may have contributed to the increase of nitrogen-fixing bacteria abundances in the grazed soils, as these elements play fundamental roles in the activities of these bacteria [45,46,47]. This relationship between the micronutrients Fe and Mn with an increased abundance of nitrogen-fixing bacteria is reinforced by the positive correlations found between these micronutrients and the abundance of these bacteria (Table S1 in Supplementary Materials). However, more research is needed to understand the real contributions of the hens to the abundance and activities of nitrogen-fixing bacteria. Regarding fungi and denitrifying bacteria abundance, the results suggest that the hens grazing had no impact in these microbial populations compared to the other treatments.
Overall, the results of this study suggest that grazing laying hens at the horticultural field significantly contributed to its soil fertility. In these circumstances, laying hens can be important assets to improve the resilience of the system by recycling nutrients and reducing inputs while producing meat and eggs. Laying hens services should, therefore, be considered as a promising way to reach sustainable food production.

4.2. Farm B—Orchard

At the orchard, the hens grazed in the wet season with an animal density of 3.5 m2 per hen, which contributed to a rise in the quantity of mineral nitrogen (NH4+-N and NO3-N), extractable macronutrients P2O5 and K2O, extractable micronutrient Zn, and exchangeable bases Ca2+ and Mg2+ in the soil. Similar to what occurred in farm A, the grazing did not contribute to an increase in the amounts of SOC, probably due to the low C/N ratio found in the hens’ droppings (Table A2 in Appendix C). Moreover, grazing did not contribute to an increase in the levels of the micronutrient Fe, which, as stated previously, demands more research. Moreover, the grazing at the orchard did not contribute to an increase in the quantity of TN, extractable micronutrients Cu and Mn, and exchangeable bases Na+ and K+. Considering the fact that these soil chemical parameters were significantly affected by grazing on farm A, the lack of contributions of grazing in the orchard may have occurred due to the interference of the following factors: grazing during the rainy season, since the rainfall contributes to the dissolution of salts, reducing soil nutrient contents [33]; different grazing management, with two grazing periods and with an animal density of 3.5 m2 per hen; and a different agroecosystem, wherein soil properties are affected by other factors, such as tree canopy [48,49,50].
Moreover, as found at the horticultural field, the grazing at the orchard significantly increased soil pH in the short-term, probably due to the higher levels of exchangeable bases Ca2+ and Mg2+ [31,32]. In the same way, despite the occurrence of precipitation during the grazing period, soil electrical conductivity also increased in the grazed plots due to an increase in the salt content of the soil [51]. This conclusion is reinforced by the strong correlation found between soil electrical conductivity and the following soil parameters: NO3-N, extractable macronutrient K2O, and exchangeable bases K+ and Na+ (Table S2 in Supplementary Materials).
Regarding soil dry bulk density, no significant differences were found between the grazed soils and the control, which suggests that the hens may have had little effect in this soil parameter. However, the hens’ effect on soil dry bulk density is possibly related to animal density and grazing duration, but this would require further research to confirm. Concerning soil moisture retention, although no significant differences were found between the grazed fields and the control shortly after grazing, a significantly lower level of soil moisture was recorded for the hens’ treatment in the final period studied. Since during grazing, the hens eradicated the existing vegetation, the lower vegetation abundance 90 days later may have contributed to the lower soil moisture contents in this treatment [44] (Table 2).
Concerning soil microbiology, the grazing at the orchard did not affect denitrifying bacteria abundance but did negatively affect the abundances of total aerobic bacteria, nitrogen-fixing bacteria, and fungi abundances. This observation requires more research in order to determine a grazing management protocol that contributes to an overall increase of general soil fertility in these agroecosystems, with its diverse physical, chemical, and biological properties. The eradication of vegetation and eventual destruction of superficial roots may be the main causes of this reduction of microbial abundance in the grazed soils. Even if the hens’ effect on the roots was reduced or non-significant, which has not been investigated, the eradication of surface vegetation already affects the soil–plant systems by reducing soil microbial activities [44,52,53,54]. Furthermore, as stated previously, the eradication of the understory vegetation may have contributed to the significant reduction of soil moisture at farm B [44], which affects the microbial activity of nitrogen-fixing bacteria and fungi [45,55], justifying the positive correlations found between these microorganisms and soil moisture on both farms (Tables S1 and S2). To sum up, the eradication of vegetation may have led to a decrease in microbial abundance due to (i) the effects of the hens on the soil–plant system, (ii) the lower water retention capacity of the grazed soil, or (iii) both of these reasons.
Considering the hens’ potential to improve soil fertility, we recommend that hens’ grazing should be further researched so that farmers can make the best use of the hens’ presence in their agroecosystems. This is especially pertinent regarding soil biological properties and its dynamics, as they have been the least researched. A broad view of the hens’ effects on soil fertility is critical to achieving good agricultural results and ensuring greater system resilience and sustainability.

5. Conclusions

Crop–livestock integration fosters a holistic view of the farm system that can lead to farm resilience and farm sustainability. As the results of this study demonstrate, laying hens can improve several soil chemical parameters and, consequently, crop growth. However, there is still a lack of data regarding the total effects of these animals in soil fertility. This study adds new information regarding the effects of grazing hens in this matter. The hens contributed to an increase in extractable macronutrients P2O5 and K2O, mineral nitrogen (NH4+-N and NO3-N), and exchangeable bases Ca2+ and Mg2+ in both farms, marking these as crucial parameters to consider in farmers’ grazing management. The hens additionally increased the levels of TN; extractable micronutrients Cu, Zn, and Mn; and exchangeable bases K+ and Na+ in at least one of the farms that were studied. These chemical contributions most likely led to the increase of soil pH and soil electrical conductivity found in both farms shortly after grazing, which were then likely mitigated by the occurrence of precipitation. In arid regions with lack of rainfall, the increase of soil electrical conductivity in the grazed soils should be monitored and supervised to avoid soil salinization phenomena. Soil dry bulk density and denitrifying bacteria abundance were unaffected in both farms, suggesting a low impact of the hens’ grazing in these soil parameters. However, regarding soil moisture retention, total aerobic bacteria, nitrogen-fixing bacteria, and fungi abundances, the results varied greatly between farms. At farm A (the horticultural field), where soil disturbance is higher due to the occurrence of annual tillage, the grazing did not affect soil moisture retention and contributed to an increase in total aerobic bacteria and nitrogen-fixing bacteria abundances, which is most likely due to the presence of favorable elements to its activities, such as the micronutrient Mn. Nonetheless, more research is needed to understand the context of this positive contribution. Contrastingly, at the farm B (the orchard), which is an agroecosystem with lower soil disturbance due to the presence of year-round understory vegetation, soil moisture retention, total aerobic bacteria, nitrogen-fixing bacteria, and fungi abundances were negatively affected, which was, in all likelihood, due to the eradication of vegetation by the hens’ grazing.
This work is partially limited by the lack of assessment of the effects of hens on crop productivity, which needs to be further investigated. The use of endangered indigenous breeds of hens in this experiment promotes and emphasizes the importance of conserving the genetic heritage of these native breeds. However, this could be considered a limitation on further research, as these breeds are rare, potentially making larger trials difficult to perform.
The use of mobile and temporary structures, commonly known as chicken tractors, capable of avoiding the eradication of vegetation and that better distribute nutrients throughout the plot, according to farmers management, may be a viable option that deserves to be studied in the future. As this work exhibits, grazing hens can and should play a key role in improving soil fertility in agricultural systems. For this reason, their grazing management should be further studied so that their presence in the agroecosystem can be utilized to produce greater and more sustainable contributions to the system as a whole.

Supplementary Materials

The following are available online at https://0-www-mdpi-com.brum.beds.ac.uk/article/10.3390/su14063407/s1, Table S1: Pearson’s correlation coefficient (r) and related significance between physical, chemical, and biological parameters at farm A (p-value < 0.05 *; p-value < 0.001 **; p-value < 0.0001 ***). Table S2: Pearson’s correlation coefficient (r) and related significance between physical, chemical, and biological parameters at farm B (p-value < 0.05 *; p-value < 0.001 **; p-value < 0.0001 ***).

Author Contributions

Conceptualization, P.R.S., R.L.P., S.D. and D.S.; methodology, P.R.S., R.L.P., S.D. and D.S.; formal analysis, P.R.S.; investigation, P.R.S.; resources, S.D. and D.S.; writing—original draft preparation, P.R.S.; writing—review and editing, P.R.S., R.L.P., S.D., and D.S.; supervision, S.D. and D.S. All authors have read and agreed to the published version of the manuscript.

Funding

This work was partially supported by grant IIA_PDR2020_GMÓVEL_LIC1 and project grant PDR2020-101-031353, through the European Regional Development Fund and the PDR 2020 Programs and FCT-Portuguese Foundation for Science and Technology. The APC was funded by Coimbra Agriculture School.

Institutional Review Board Statement

The experiment was approved by the Animal Welfare Board (ORBEA) of Coimbra Agriculture School, in accordance with the Directive 2010/63/EU and with the Portuguese Decree Law No. 113/2013 of 7 August 2013, on the protection of animals used for scientific purposes.

Informed Consent Statement

Not applicable.

Data Availability Statement

All data generated and analyzed in this study are included in this published article.

Acknowledgments

The authors are deeply thankful to the Rui Amaro, Maria Alexandra Oliveira, and Maria Antónia Conceição, as well as to the Rosa Guilherme, Miguel Valério, and Rui Ferreira for their knowledge and field support; to Ben Colo and to Joana Rocha for their diligent proofreading, English editing, and relevant suggestions; and to the three anonymous reviewers, whose suggestions substantially improved this manuscript.

Conflicts of Interest

The authors declare no conflict of interest.

Appendix A

Figure A1. Normal value of average of total precipitation and average of mean temperatures (1971–2000 [56]) and monthly total precipitation and monthly mean temperature between April 2020 and March 2021, in Coimbra, Bencanta, according to data collected by the meteorological station of Coimbra Agriculture School.
Sustainability 14 03407 g0a1

Appendix B

Table A1. Nutrition facts of the grain-based commercial feed provided to the hens during the experiment.
Ingredients
Maize, Soybean Meal, Triticale, Calcium Carbonate, Sunflower, Pea, Barley, Dicalcium Phosphate
Calculated compositionAmountTrace elementsAmount
Crude protein16.10%Sodium selenite—selenium0.395 mg
Crude fat5.81%Ferrous sulphate monohydrate—iron80.75 mg
Crude ash13.65%Anhydrous calcium iodate—iodine0.525 mg
Crude fiber4.01%Manganese oxide—manganese80.60 mg
Sodium0.18%Cupric sulphate pentahydrate—copper10.00 mg
Calcium4.10%Zinc oxide—zinc103.35 mg
Phosphorus0.65%
VitaminsAmount
Vitamin A10,000 UI
Vitamin D32000 UI
Vitamin E10.00 mg
Vitamin B12.00 mg
Vitamin B24.00 mg
Calcium D-pantothenate8.21 mg
Niacinamide20.90 mg
Vitamin B60.10 mg
Folic acid0.69 mg
Vitamin B1220.00 µg
Choline chloride375.00 mg

Appendix C

Table A2. Nutrient constitution of Portuguese hens’ droppings used in the field experiment.
ParameterBreeds
Preta LusitânicaAmarela
Solid content (%)30.2038.17
Organic matter (%)48.1738.75
Organic C (%)45.9931.88
N (%)3.712.62
C:N ratio3.884.76
P (%)0.700.57
K (%)2.512.42
Ca (%)5.863.24
Mg (%)0.400.34
Cu (mg kg−1)29.0025.00
Zn (mg kg−1)459.00374.00
Fe (mg kg−1)5590.007695.00
Mn (mg kg−1)382.00341.00
Cd (mg kg−1)1.001.00
Pb (mg kg−1)29.0040.00
Cr (mg kg−1)30.0040.00
Ni (mg kg−1)15.0022.00
Hg (mg kg−1)0.0390.038
pH7.107.10
Elect. cond.
(mS cm−1, 25 °C)
7.786.41

References

  1. Garnett, T.; Appleby, M.C.; Balmford, A.; Bateman, I.J.; Benton, T.G.; Bloomer, P.; Burlingame, B.; Dawkins, M.; Dolan, L.; Fraser, D.; et al. Sustainable Intensification in Agriculture: Premises and Policies. Science 2013, 341, 33–34. [Google Scholar] [CrossRef] [PubMed]
  2. Davis, K.F.; Gephart, J.A.; Emery, K.A.; Leach, A.M.; Galloway, J.N.; D’Odorico, P. Meeting future food demand with current agricultural resources. Glob. Environ. Chang. 2016, 39, 125–132. [Google Scholar] [CrossRef]
  3. United Nations General Assembly. Transforming Our World: The 2030 Agenda for Sustainable Development; United Nations: New York, NY, USA, 2015; Available online: https://www.refworld.org/docid/57b6e3e44.html (accessed on 12 November 2021).
  4. Bonaudo, T.; Bendahan, A.B.; Sabatier, R.; Ryschawy, J.; Bellon, S.; Leger, F.; Magda, D.; Tichit, M. Agroecological principles for the redesign of integrated crop-livestock systems. Eur. J. Agron. 2014, 57, 43–51. [Google Scholar] [CrossRef]
  5. Hilimire, K. Integrated crop/livestock agriculture in the United States: A review. J. Sustain. Agric. 2011, 35, 376–393. [Google Scholar] [CrossRef]
  6. Russelle, M.P.; Entz, M.H.; Franzluebbers, A.J. Reconsidering integrated crop-livestock systems in North America. Agron. J. 2007, 99, 325–334. [Google Scholar] [CrossRef] [Green Version]
  7. Hendrickson, J.R.; Hanson, J.D.; Tanaka, D.L.; Sassenrath, G. Principles of integrated agricultural systems: Introduction to processes and definition. Renew. Agric. Food Syst. 2008, 23, 265–271. [Google Scholar] [CrossRef] [Green Version]
  8. Kratz, S.; Rogasik, J.; Schnug, E. Changes in soil nitrogen and phosphorus under different broiler production systems. J. Environ. Qual. 2004, 33, 1662–1674. [Google Scholar] [CrossRef]
  9. Stadig, L.M.; Tuyttens, F.A.M.; Rodenburg, T.B.; Vandecasteele, B.; Ampe, B.; Reubens, B. Interactions between broiler chickens, soil parameters and short rotation coppice willow in a free-range system. Agroecol. Sustain. Food Syst. 2019, 43, 1009–1030. [Google Scholar] [CrossRef]
  10. Yu, C.; Jiang, X.; Du, H.; Li, Q.; Zhang, Z.; Qiu, M.; Chen, T.; Xia, B.; Song, X.; Hu, C.; et al. Effects of free-range broiler production on vegetation characteristic and soil physicochemical property of the stocking areas in China. Agrofor. Syst. 2019, 94, 675–685. [Google Scholar] [CrossRef]
  11. Vaarst, M.; Steenfeldt, S.; Horsted, K. Sustainable development perspectives of poultry production. World’s Poult. Sci. J. 2015, 71, 609–620. [Google Scholar] [CrossRef] [Green Version]
  12. OECD; FAO. OECD-FAO Agricultural Outlook 2020–2029; OCDE: Paris, France; FAO: Rome, Italy, 2020; Available online: https://www.oecd.org/publications/oecd-fao-agricultural-outlook-19991142.htm (accessed on 20 December 2021).
  13. Menke, A.; Paffrath, A. Freilandhaltung von Legehennen: Artgerechte Tierhaltung ökologisch bedenklich? DGS Mag. 1996, 22, 11–16. [Google Scholar]
  14. Hilimire, K.; Gliessman, S.R.; Muramoto, J. Soil fertility and crop growth under poultry/crop integration. Renew. Agric. Food Syst. 2012, 28, 173–182. [Google Scholar] [CrossRef] [Green Version]
  15. Nahm, K.H. Evaluation of the nitrogen content in poultry manure. World Poult. Sci. J. 2003, 59, 77–88. [Google Scholar] [CrossRef]
  16. Blake, G.R.; Hartge, K. Bulk Density. In Methods of Soil Analysis. Part 1: Physical and Mineralogical Methods, 2nd ed.; Klute, A., Ed.; American Society of Agronomy, Inc.; Soil Science Society of America, Inc.: Madison, WI, USA, 1986; pp. 363–375. Available online: https://0-acsess-onlinelibrary-wiley-com.brum.beds.ac.uk/doi/10.2136/sssabookser5.1.2ed.c13 (accessed on 3 May 2021).
  17. ISO 11461:2001; Soil Quality—Determination of Soil Water Content as a Volume Fraction Using Coring Sleeves—Gravimetric Method. International Organization for Standardization: Geneva, Switzerland, 2001. Available online: https://www.iso.org/standard/33031.html (accessed on 3 May 2021).
  18. ISO 10694:1995; Soil Quality—Determination of Organic and Total Carbon after Dry Combustion (Elementary Analysis). International Organization for Standardization: Geneva, Switzerland, 1995. Available online: https://www.iso.org/standard/18782.html (accessed on 3 May 2021).
  19. ISO 11261:1995; Soil Quality—Determination of Total Nitrogen—Modified Kjeldahl Method. International Organization for Standardization: Geneva, Switzerland, 1995. Available online: https://www.iso.org/standard/19239.html (accessed on 3 May 2021).
  20. ISO 14255:1998; Soil Quality—Determination of Nitrate Nitrogen, Ammonium Nitrogen and Total Soluble Nitrogen in Air-Dry Soils Using Calcium Chloride Solution as Extractant. International Organization for Standardization: Geneva, Switzerland, 1998. Available online: https://www.iso.org/standard/23081.html (accessed on 3 May 2021).
  21. Egnér, H.; Riehm, H.; Domingo, H.W.R. Untersuchungen über die chemische Bodenanalyse als Grundlage für die Beurteilung des Nahrstoffzustandes der Boden. II. Chem. Extraktionsmethoden Phosphor. Kaliumbestimmung 1960, 26, 199–215. [Google Scholar]
  22. Lakanen, E.; Ervio, R. A comparison of eight extractants for the determination of plant available micronutrients in soils. Acta Agral. Fenn. 1971, 123, 223–232. [Google Scholar]
  23. Chapman, H.D. Cation-Exchange Capacity. In Methods of Soil Analyses. Part 2: Chemical and Microbiological Properties, 5th ed.; Norman, A.G., Ed.; American Society of Agronomy, Inc.; Soil Science Society of America, Inc.: Madison, WI, USA, 1965; pp. 891–901. [Google Scholar] [CrossRef]
  24. ISO 10390:2005; Soil Quality—Determination of pH. International Organization for Standardization: Geneva, Switzerland, 2005. Available online: https://www.iso.org/standard/40879.html (accessed on 3 May 2021).
  25. ISO 11265:1994; Soil Quality—Determination of the Specific Electrical Conductivity. International Organization for Standardization: Geneva, Switzerland, 1994. Available online: https://www.iso.org/standard/19243.html (accessed on 3 May 2021).
  26. Alef, K. Enrichment, isolation and counting of soil microorganisms. Methods Appl. Soil Microbiol. Biochem. 1995, 123–186. [Google Scholar] [CrossRef]
  27. Weaver, R.W.; Frederick, L.R. Rhizobium. In Methods of Soil Analysis: Part 2: Chemical and Microbiological Properties, 2nd ed.; Page, A.L., Ed.; American Society of Agronomy, Inc.; Soil Science Society of America, Inc.: Madison, WI, USA, 1983; pp. 1043–1070. [Google Scholar] [CrossRef]
  28. Focht, D.D.; Joseph, H. An Improved Method for the Enumeration of Denitrifying Bacteria. Soil Sci. Soc. Am. J. 1973, 37, 698–699. [Google Scholar] [CrossRef]
  29. Jeter, R.M.; Ingraham, J.L. The Denitrifying Prokaryotes. In The Denitrifying Prokaryotes; Starr, M.P., Stolp, H., Trüper, H.G., Balows, A., Schlegel, H.G., Eds.; Springer: Berlin/Heidelberg, Germany, 1981; Volume 1, pp. 913–925. Available online: https://0-link-springer-com.brum.beds.ac.uk/chapter/10.1007/978-3-662-13187-9_73 (accessed on 12 May 2021).
  30. Shapleigh, J.P. The Denitrifying Prokaryotes. In The Denitrifying Prokaryotes, 3rd ed.; Dworkin, M., Falkow, S., Rosenberg, E., Schleifer, K., Stackebrandt, E., Eds.; Springer: Singapore, 2006; pp. 769–792. Available online: https://0-link-springer-com.brum.beds.ac.uk/referenceworkentry/10.1007/0-387-30742-7_23 (accessed on 22 May 2021).
  31. Kobierski, M.; Bartkowiak, A.; Lemanowicz, J.; Piekarczyk, M. Impact of poultry manure fertilization on chemical and biochemical properties of soils. Plant Soil Environ. 2017, 63, 558–563. [Google Scholar] [CrossRef] [Green Version]
  32. Adekiya, A.O.; Agbede, T.M.; Aboyeji, C.M.; Dunsin, O.; Simeon, V.T. Biochar and poultry manure effects on soil properties and radish (Raphanus sativus L.) yield. Biol. Agric. Hortic. 2018, 35, 33–45. [Google Scholar] [CrossRef]
  33. Francos, M.; Pereira, P.; Alcañiz, M.; Mataix-Solera, J.; Úbeda, X. Impact of an intense rainfall event on soil properties following a wildfire in a Mediterranean environment (North-East Spain). Sci. Total Environ. 2016, 572, 1353–1362. [Google Scholar] [CrossRef]
  34. Iyappan, P.; Karthikeyan, S.; Sekar, S. Changes in the Composition of Poultry Farm Excreta (PFE) by the Cumulative Influence of the Age of Birds, Feed and Climatic Conditions and a Simple Mean for Minimizing the Environmental Hazard. Int. J. Environ. Sci. 2011, 1, 847–859. Available online: https://www.indianjournals.com/ijor.aspx?target=ijor:ijes&volume=1&issue=5&article=014 (accessed on 28 November 2021).
  35. Calderón, F.J.; Jackson, L.E.; Scow, K.M.; Rolston, D.E. Microbial responses to simulated tillage in cultivated and uncultivated soils. Soil Biol. Biochem. 2000, 32, 1547–1559. [Google Scholar] [CrossRef]
  36. Li, S.; Jiang, X.; Wang, X.; Wright, A.L. Tillage effects on soil nitrification and the dynamic changes in nitrifying microorganisms in a subtropical rice-based ecosystem: A long-term field study. Soil Tillage Res. 2015, 150, 132–138. [Google Scholar] [CrossRef]
  37. Raiesi, F.; Kabiri, V. Carbon and nitrogen mineralization kinetics as affected by tillage systems in a calcareous loam soil. Ecol. Eng. 2017, 106, 24–34. [Google Scholar] [CrossRef]
  38. Kabiri, V.; Raiesi, F.; Ghazavi, M.A. Tillage effects on soil microbial biomass, SOM mineralization and enzyme activity in a semi-arid Calcixerepts. Agric. Ecosyst. Environ. 2016, 232, 73–84. [Google Scholar] [CrossRef]
  39. González-Pérez, J.A.; González-Vila, F.J.; Almendros, G.; Knicker, H. The effect of fire on soil organic matter—A review. Environ. Int. 2004, 30, 855–870. [Google Scholar] [CrossRef]
  40. Abdollahi, L.; Schjønning, P.; Elmholt, S.; Munkholm, L.J. The effects of organic matter application and intensive tillage and traffic on soil structure formation and stability. Soil Tillage Res. 2014, 136, 28–37. [Google Scholar] [CrossRef]
  41. Osunbitan, J.A.; Oyedele, D.J.; Adekalu, K.O. Tillage effects on bulk density, hydraulic conductivity and strength of a loamy sand soil in southwestern Nigeria. Soil Tillage Res. 2005, 81, 57–64. [Google Scholar] [CrossRef]
  42. Schlüter, S.; Großmann, C.; Diel, J.; Wu, G.M.; Tischer, S.; Deubel, A.; Rücknagel, J. Long-term effects of conventional and reduced tillage on soil structure, soil ecological and soil hydraulic properties. Geoderma 2018, 332, 10–19. [Google Scholar] [CrossRef]
  43. Telak, L.J.; Pereira, P.; Ferreira, C.S.S.; Filipovic, V.; Filipovic, L.; Bogunovic, I. Short-Term Impact of Tillage on Soil and the Hydrological Response within a Fig (Ficus Carica) Orchard in Croatia. Water 2020, 12, 3295. [Google Scholar] [CrossRef]
  44. Ehrenfeld, J.G.; Ravit, B.; Elgersma, K. Feedback in the Plant-Soil System. Annu. Rev. Environ. Resour. 2005, 30, 75–115. [Google Scholar] [CrossRef] [Green Version]
  45. Torabian, S.; Farhangi-Abriz, S.; Denton, M.D. Do tillage systems influence nitrogen fixation in legumes? A review. Soil Tillage Res. 2019, 185, 113–121. [Google Scholar] [CrossRef]
  46. Hood, G.; Ramachandran, V.; East, A.K.; Downie, J.A.; Poole, P.S. Manganese transport is essential for N2-fixation by Rhizobium leguminosarum in bacteroids from galegoid but not phaseoloid nodules. Environ. Microbiol. 2017, 19, 2715–2726. [Google Scholar] [CrossRef] [PubMed] [Green Version]
  47. Brear, E.M.; Day, D.A.; Smith, P.M.C. Iron: An essential micronutrient for the legume-rhizobium symbiosis. Front. Plant Sci. 2013, 4, 359. [Google Scholar] [CrossRef] [PubMed] [Green Version]
  48. Rossetti, I.; Bagella, S.; Cappai, C.; Caria, M.C.; Lai, R.; Roggero, P.P.; Martins da Silva, P.; Sousa, J.P.; Querner, P.; Seddaiu, G. Isolated cork oak trees affect soil properties and biodiversity in a Mediterranean wooded grassland. Agric. Ecosyst. Environ. 2015, 202, 203–216. [Google Scholar] [CrossRef]
  49. Kooch, Y.; Samadzadeh, B.; Hosseini, S.M. The effects of broad-leaved tree species on litter quality and soil properties in a plain forest stand. Catena 2017, 150, 223–229. [Google Scholar] [CrossRef]
  50. Soliveres, S.; Eldridge, D.J.; Müller, J.D.; Hemmings, F.; Throop, H.L. On the interaction between tree canopy position and environmental effects on soil attributes and plant communities. J. Veg. Sci. 2015, 26, 1030–1042. [Google Scholar] [CrossRef]
  51. Azeez, J.O.; van Averbeke, W. Dynamics of Soil pH and Electrical Conductivity with the Application of Three Animal Manures. Commun. Soil Sci. Plant Anal. 2012, 43, 865–874. [Google Scholar] [CrossRef]
  52. Högberg, P.; Nordgren, A.; Buchmann, N.; Taylor, A.F.S.; Ekblad, A.; Högberg, M.N.; Nyberg, G.; Ottosson-Löfvenius, M.; Read, D.J. Large-scale forest girdling shows that current photosynthesis drives soil respiration. Nature 2001, 411, 789–792. [Google Scholar] [CrossRef]
  53. Canarini, A.; Kaiser, C.; Merchant, A.; Richter, A.; Wanek, W. Root exudation of primary metabolites: Mechanisms and their roles in plant responses to environmental stimuli. Front. Plant Sci. 2019, 10, 157. [Google Scholar] [CrossRef]
  54. Karlowsky, S.; Augusti, A.; Ingrisch, J.; Akanda, M.K.U.; Bahn, M.; Gleixner, G. Drought-induced accumulation of root exudates supports post-drought recovery of microbes in mountain grassland. Front. Plant Sci. 2018, 871, 1593. [Google Scholar] [CrossRef]
  55. Chen, H.; Mothapo, N.V.; Shi, W. Soil Moisture and pH Control Relative Contributions of Fungi and Bacteria to N2O Production. Microb. Ecol. 2015, 69, 180–191. [Google Scholar] [CrossRef] [PubMed]
  56. IPMA. Ficha Climatológica—Estação Coimbra, Bencanta: 1971–2000; Instituto Português do Mar e da Atmosfera: Lisbon, Portugal, 2022; Available online: https://www.ipma.pt/pt/oclima/normais.clima/1971-2000/normalclimate7100.jsp (accessed on 27 June 2021).
Figure 1. Soil microbiological results at the farm A, 10 and 90 days after the intervention of treatments. Within each period, different small letters (a and/or b) indicate statistical differences between treatments (two-way ANOVA; p-value < 0.05).
Sustainability 14 03407 g001
Figure 2. Soil microbiological results at the farm B, 10 and 90 days after the intervention of treatments. Within each period, different small letters (a and/or b) indicate statistical differences between treatments (two-way ANOVA; p-value < 0.05).
Sustainability 14 03407 g002
Table 1. Soil chemical and physical results at farm A before, 10 days after, and 90 days after the intervention of treatments. Within each period, different small letters (a and/or b) indicate statistical differences between treatments (two-way ANOVA; p-value < 0.05; C—chickens’ treatment; T—thermal treatment; M—mechanical treatment).
ParameterPeriod Regarding GrazingTreatmentp-value
CMTC vs. MC vs. TM vs. T
TN (g kg−1)Before1.39 ± 0.09 a1.26 ± 0.08 a1.20 ± 0.08 a0.40110.13040.7010
10d after1.60 ± 0.15 a1.24 ± 0.06 b1.17 ± 0.09 b0.00110.00020.6519
90d after1.40 ± 0.11 a1.30 ± 0.13 a1.31 ± 0.08 a0.45920.50560.9964
NH4+-N (mg kg−1)Before22.33 ± 6.65 a17.93 ± 1.97 a24.80 ± 5.61 a0.99890.99960.9966
10d after497.46 ± 304.75 a26.72 ± 8.67 b57.65 ± 54.31 b0.00010.00030.9329
90d after122.46 ± 14.25 a116.86 ± 4.84 a122.43 ± 14.35 a0.9977>0.99990.9977
NO3-N (mg kg−1)Before10.00 ± 2.93 a11.33 ± 1.47 a8.33 ± 2.31 a0.88150.81850.4607
10d after93.42 ± 40.12 a27.75 ± 10.20 b4.14 ± 2.44 c0.0009<0.0001<0.0001
90d after10.20 ± 1.98 a4.40 ± 0.37 b5.33 ± 0.62 ab0.01670.06850.7630
Organic C (%)Before1.33 ± 0.06 a1.19 ± 0.07 a1.09 ± 0.05 a0.16780.01010.3500
10d after1.19 ± 0.08 a1.03 ± 0.06 ab0.97 ± 0.09 b0.07760.01370.6749
90d after1.15 ± 0.10 a1.01 ± 0.12 a1.05 ± 0.10 a0.16780.37350.8616
P2O5 (mg kg−1)Before123.33 ± 27.21 a45.67 ± 21.73 b54.33 ± 7.02 b<0.0001<0.00010.7585
10d after218.33 ± 0.58 a47.33 ± 3.79 b54.33 ± 7.57 b<0.0001<0.00010.8341
90d after159.37 ± 23.63 a41.14 ± 7.97 b51.17 ± 5.80 b<0.0001<0.00010.6922
K2O (mg kg−1)Before286.00 ± 19.29 a144.00 ± 15.62 b199.67 ± 41.00 c<0.00010.00240.0487
10d after546.67 ± 32.52 a129.33 ± 11.59 b152.67 ± 11.06 b<0.0001<0.00010.5408
90d after335.33 ± 40.43 a145.00 ± 29.10 b184.67 ± 16.17 b<0.0001<0.00010.1888
Cu (mg kg−1)Before4.77 ± 0.42 a4.00 ± 0.20 b3.63 ± 0.35 b0.01300.00050.3001
10d after4.67 ± 0.21 a4.20 ± 0.10 a4.27 ± 0.25 a0.15370.24310.9582
90d after4.67 ± 0.21 a3.67 ± 0.42 b3.77 ± 0.32 b0.00160.00390.9087
Zn (mg kg−1)Before4.87 ± 0.55 a2.87 ± 0.15 a2.83 ± 0.12 a0.17010.15470.9983
10d after4.30 ± 2.44 a3.50 ± 1.13 a3.53 ± 1.50 a0.94070.90910.9962
90d after5.20 ± 0.36 a2.73 ± 0.25 a2.93 ± 0.40 a0.07620.12120.9661
Fe (mg kg−1)Before112.33 ± 5.03 a100.33 ± 5.13 a100.00 ± 6.24 a0.92200.91110.9996
10d after74.67 ± 23.67 a56.00 ± 1.00 a59.33 ± 2.08 a0.62640.75830.9738
90d after129.63 ± 3.21 a114.60 ± 4.78 a92.50 ± 59.97 a0.89960.12050.2518
Mn (mg kg−1)Before19.67 ± 2.52 a15.33 ± 2.31 b14.67 ± 1.15 b0.02950.01190.9025
10d after18.33 ± 3.21 a11.67 ± 0.58 b10.00 ± 0.00 b0.00110.00010.5371
90d after24.03 ± 1.37 a19.43 ± 0.59 b19.63 ± 2.48 b0.02060.02700.9908
pH (H2O)Before6.93 ± 0.06 a6.73 ± 0.40 a6.63 ± 0.06 a0.23290.13180.9386
10d after6.79 ± 0.13 a6.23 ± 0.23 b6.39 ± 0.10 b0.00190.01770.5747
90d after6.51 ± 0.08 a6.24 ± 0.06 a6.22 ± 0.07 a0.23290.13180.9386
K+ (me 100g−1)Before0.63 ± 0.14 a0.32 ± 0.04 b0.39 ± 0.06 b0.00020.00230.4648
10d after1.12 ± 0.04 a0.30 ± 0.03 b0.32 ± 0.05 b<0.0001<0.00010.9423
90d after0.70 ± 0.13 a0.30 ± 0.06 b0.38 ± 0.01 b<0.00010.00020.4049
Na+ (me 100g−1)Before0.22 ± 0.03 a0.20 ± 0.05 a0.22 ± 0.07 a0.91740.97860.8247
10d after0.49 ± 0.04 a0.30 ± 0.04 b0.23 ± 0.02 b<0.0001<0.00010.1722
90d after0.08 ± 0.05 a0.07 ± 0.02 a0.04 ± 0.03 a0.87430.41940.7120
Ca2+ (me 100g−1)Before6.57 ± 0.55 a6.58 ± 1.39 a5.14 ± 0.19 a>0.99990.05330.0521
10d after8.15 ± 1.27 a5.53 ± 0.15 b5.87 ± 0.26 b0.00060.00230.8238
90d after5.52 ± 0.33 a5.04 ± 0.56 a4.76 ± 0.02 a0.68600.39280.8709
Mg2+ (me 100g−1)Before0.96 ± 0.04 a0.73 ± 0.02 b0.68 ± 0.04 b<0.0001<0.00010.1749
10d after1.11 ± 0.06 a0.79 ± 0.02 b0.71 ± 0.05 c<0.0001<0.00010.0296
90d after0.82 ± 0.02 a0.66 ± 0.03 b0.65 ± 0.01 b<0.0001<0.00010.9344
Electrical cond. (dS m−1)Before0.14 ± 0.02 a0.14 ± 0.02 a0.12 ± 0.01 a0.98650.52780.5550
10d after1.09 ± 0.31 a0.35 ± 0.10 b0.16 ± 0.01 c<0.0001<0.00010.0004
90d after0.12 ± 0.01 a0.09 ± 0.02 ab0.08 ± 0.01 b0.16760.02050.5252
Dry bulk density (g cm−3)10d after1.29 ± 0.07 a1.19 ± 0.10 b1.27 ± 0.09 a<0.00010.51680.0002
90d after1.15 ± 0.08 a1.34 ± 0.07 b1.32 ± 0.07 b<0.0001<0.00010.3936
Soil moisture (%)10d after5.46 ± 1.83 a5.66 ± 2.78 a7.83 ± 2.34 b0.9153<0.0001<0.0001
90d after17.18 ± 2.51 a17.51 ± 1.54 a15.85 ± 1.33 b0.79190.0240.0033
Table 2. Soil chemical and physical results at farm B, before, 10 days after, and 90 days after the intervention of treatments. Within each period, different small letters (a and/or b) indicate statistical differences between treatments (two-way ANOVA; p-value < 0.05).
ParameterPeriodTreatmentp-Value
ChickensControl
TN (g kg−1)Before grazing1.33 ± 0.15 a1.47 ± 0.06 a0.9046
After the first grazing1.67 ± 0.29 a1.37 ± 0.21 a0.3340
10d after the second grazing1.77 ± 0.25 a1.40 ± 0.00 a0.1735
90d after the second grazing1.60 ± 0.35 a1.60 ± 0.10 a>0.9999
NH4+-N (mg kg−1)Before grazing55.85 ± 5.34 a73.47 ± 45.95 a0.9896
After the first grazing88.86 ± 23.46 a46.86 ± 1.62 a0.3808
10d after the second grazing595.08 ± 607.13 a77.91 ± 9.29 b0.0014
90d after the second grazing42.82 ± 6.84 a58.60 ± 8.67 a0.8630
NO3-N (mg kg−1)Before grazing1.78 ± 0.16 a1.75 ± 0.36 a>0.9999
After the first grazing41.15 ± 48.39 a3.92 ± 2.41 b0.0252
10d after the second grazing48.89 ± 26.16 a5.07 ± 2.47 b0.0037
90d after the second grazing5.78 ± 0.98 a5.02 ± 1.03 a0.9983
Organic C (%)Before grazing1.39 ± 0.19 a1.53 ± 0.07 a0.9476
After the first grazing1.60 ± 0.20 a1.41 ± 0.39 a0.8822
10d after the second grazing1.79 ± 0.22 a1.43 ± 0.21 a0.4068
90d after the second grazing1.92 ± 0.07 a2.04 ± 0.49 a0.9719
P2O5 (mg kg−1)Before grazing248.33 ± 17.24 a260.00 ± 31.61 a0.9928
After the first grazing447.33 ± 14.05 a428.67 ± 29.30 a0.9857
10d after the second grazing404.67 ± 122.19 a268.67 ± 15.70 b0.0073
90d after the second grazing448.00 ± 43.27 a379.67 ± 25.38 a0.4255
K2O (mg kg−1)Before grazing575.33 ± 45.08 a564.67 ± 42.19 a>0.9999
After the first grazing816.33 ± 21.22 a349.67 ± 99.89 b0.0004
10d after the second grazing717.67 ± 197.66 a477.33 ± 82.80 a0.0697
90d after the second grazing605.00 ± 148.00 a676.67 ± 132.46 a0.9038
Cu (mg kg−1)Before grazing18.40 ± 1.04 a17.00 ± 1.30 a0.8246
After the first grazing11.97 ± 1.82 a11.73 ± 0.72 a0.9998
10d after the second grazing16.57 ± 1.52 a13.53 ± 2.53 a0.2013
90d after the second grazing17.37 ± 3.10 a13.60 ± 0.87 a0.0790
Zn (mg kg−1)Before grazing8.57 ± 0.85 a8.13 ± 0.51 a0.9726
After the first grazing7.60 ± 1.40 a6.20 ± 0.17 a0.3356
10d after the second grazing12.07 ± 1.85 a7.67 ± 0.75 b0.0002
90d after the second grazing10.70 ± 0.36 a9.47 ± 0.70 a0.4535
Fe (mg kg−1)Before grazing205.67 ± 8.74 a201.67 ± 12.50 a0.9986
After the first grazing126.00 ± 21.38 a122.00 ± 15.52 a0.9986
10d after the second grazing195.00 ± 32.60 a176.67 ± 30.99 a0.7231
90d after the second grazing159.67 ± 8.74 a150.33 ± 11.02 a0.9667
Mn (mg kg−1)Before grazing109.00 ± 9.54 a109.33 ± 9.50 a>0.9999
After the first grazing62.33 ± 14.36 a63.00 ± 6.56 a>0.9999
10d after the second grazing86.67 ± 12.06 a89.67 ± 14.84 a0.9941
90d after the second grazing71.00 ± 5.00 a68.33 ± 2.52 a0.9962
pH (H2O)Before grazing6.70 ± 0.10 a6.70 ± 0.00 a>0.9999
After the first grazing6.90 ± 0.10 a6.50 ± 0.17 b0.0127
10d after the second grazing6.60 ± 0.30 a6.33 ± 0.12 a0.1314
90d after the second grazing7.17 ± 0.06 a7.03 ± 0.06 a0.7084
K+ (me 100g−1)Before grazing0.94 ± 0.12a0.97 ± 0.18 a>0.9999
After the first grazing1.56 ± 0.04 a0.95 ± 0.57 a0.0798
10d after the second grazing1.77 ± 0.44 a1.16 ± 0.14 a0.4492
90d after the second grazing1.23 ± 0.08 a1.15 ± 0.15 a0.9983
Na+ (me 100g−1)Before grazing0.03 ± 0.02 a0.03 ± 0.01 a0.9699
After the first grazing0.46 ± 0.59 a0.17 ± 0.06 a0.8752
10d after the second grazing0.38 ± 0.06 a0.15 ± 0.09 a0.2054
90d after the second grazing0.16 ± 0.02 a0.19 ± 0.04 a0.9973
Ca2+ (me 100g−1)Before grazing4.94 ± 0.76 a5.80 ± 0.86 a0.5936
After the first grazing9.09 ± 0.57 a6.52 ± 1.19 b0.0043
10d after the second grazing8.43 ± 0.81 a5.91 ± 0.20 b0.0050
90d after the second grazing8.93 ± 0.34 a8.52 ± 1.07 a0.9543
Mg2+ (me 100g−1)Before grazing1.18 ± 0.13 a1.24 ± 0.10 a0.9988
After the first grazing1.84 ± 0.35 a1.01 ± 0.50 b0.0163
10d after the second grazing1.57 ± 0.29 a1.07 ± 0.13 a0.2155
90d after the second grazing2.21 ± 0.20 a2.77 ± 0.45 a0.1471
Electrical cond. (dS m−1)Before grazing0.15 ± 0.03 a0.18 ± 0.02 a0.9995
After the first grazing0.49 ± 0.36 a0.14 ± 0.01 b0.0502
10d after the second grazing0.46 ± 0.23 a0.14 ± 0.02 b0.0853
90d after the second grazing0.13 ± 0.01 a0.12 ± 0.02 a>0.9999
Dry bulk density (g cm−3)10d after the second grazing1.25 ± 0.16 a1.16 ± 0.18 a0.1080
90d after the second grazing1.04 ± 0.10 a1.09 ± 0.09 a0.3844
Soil moisture (%)10d after the second grazing19.20 ± 5.12 a21.49 ± 2.81 a0.1158
90d after the second grazing10.71 ± 2.78 a14.74 ± 1.82 b<0.0001
Publisher’s Note: MDPI stays neutral with regard to jurisdictional claims in published maps and institutional affiliations.

