
Technical Performance Prediction and Employment Potential of Solar PV Systems in Cold Countries

 ,
,  ,
,  ,
,  ,
,  and
and 
Abstract
:1. Introduction
2. Materials and Methods
2.1. PVsyst Simulation Model
- Identification of the study area (location)
- Downloading of the weather data characteristics for the study area (i.e., solar irradiance, wind speed, and ambient temperature)
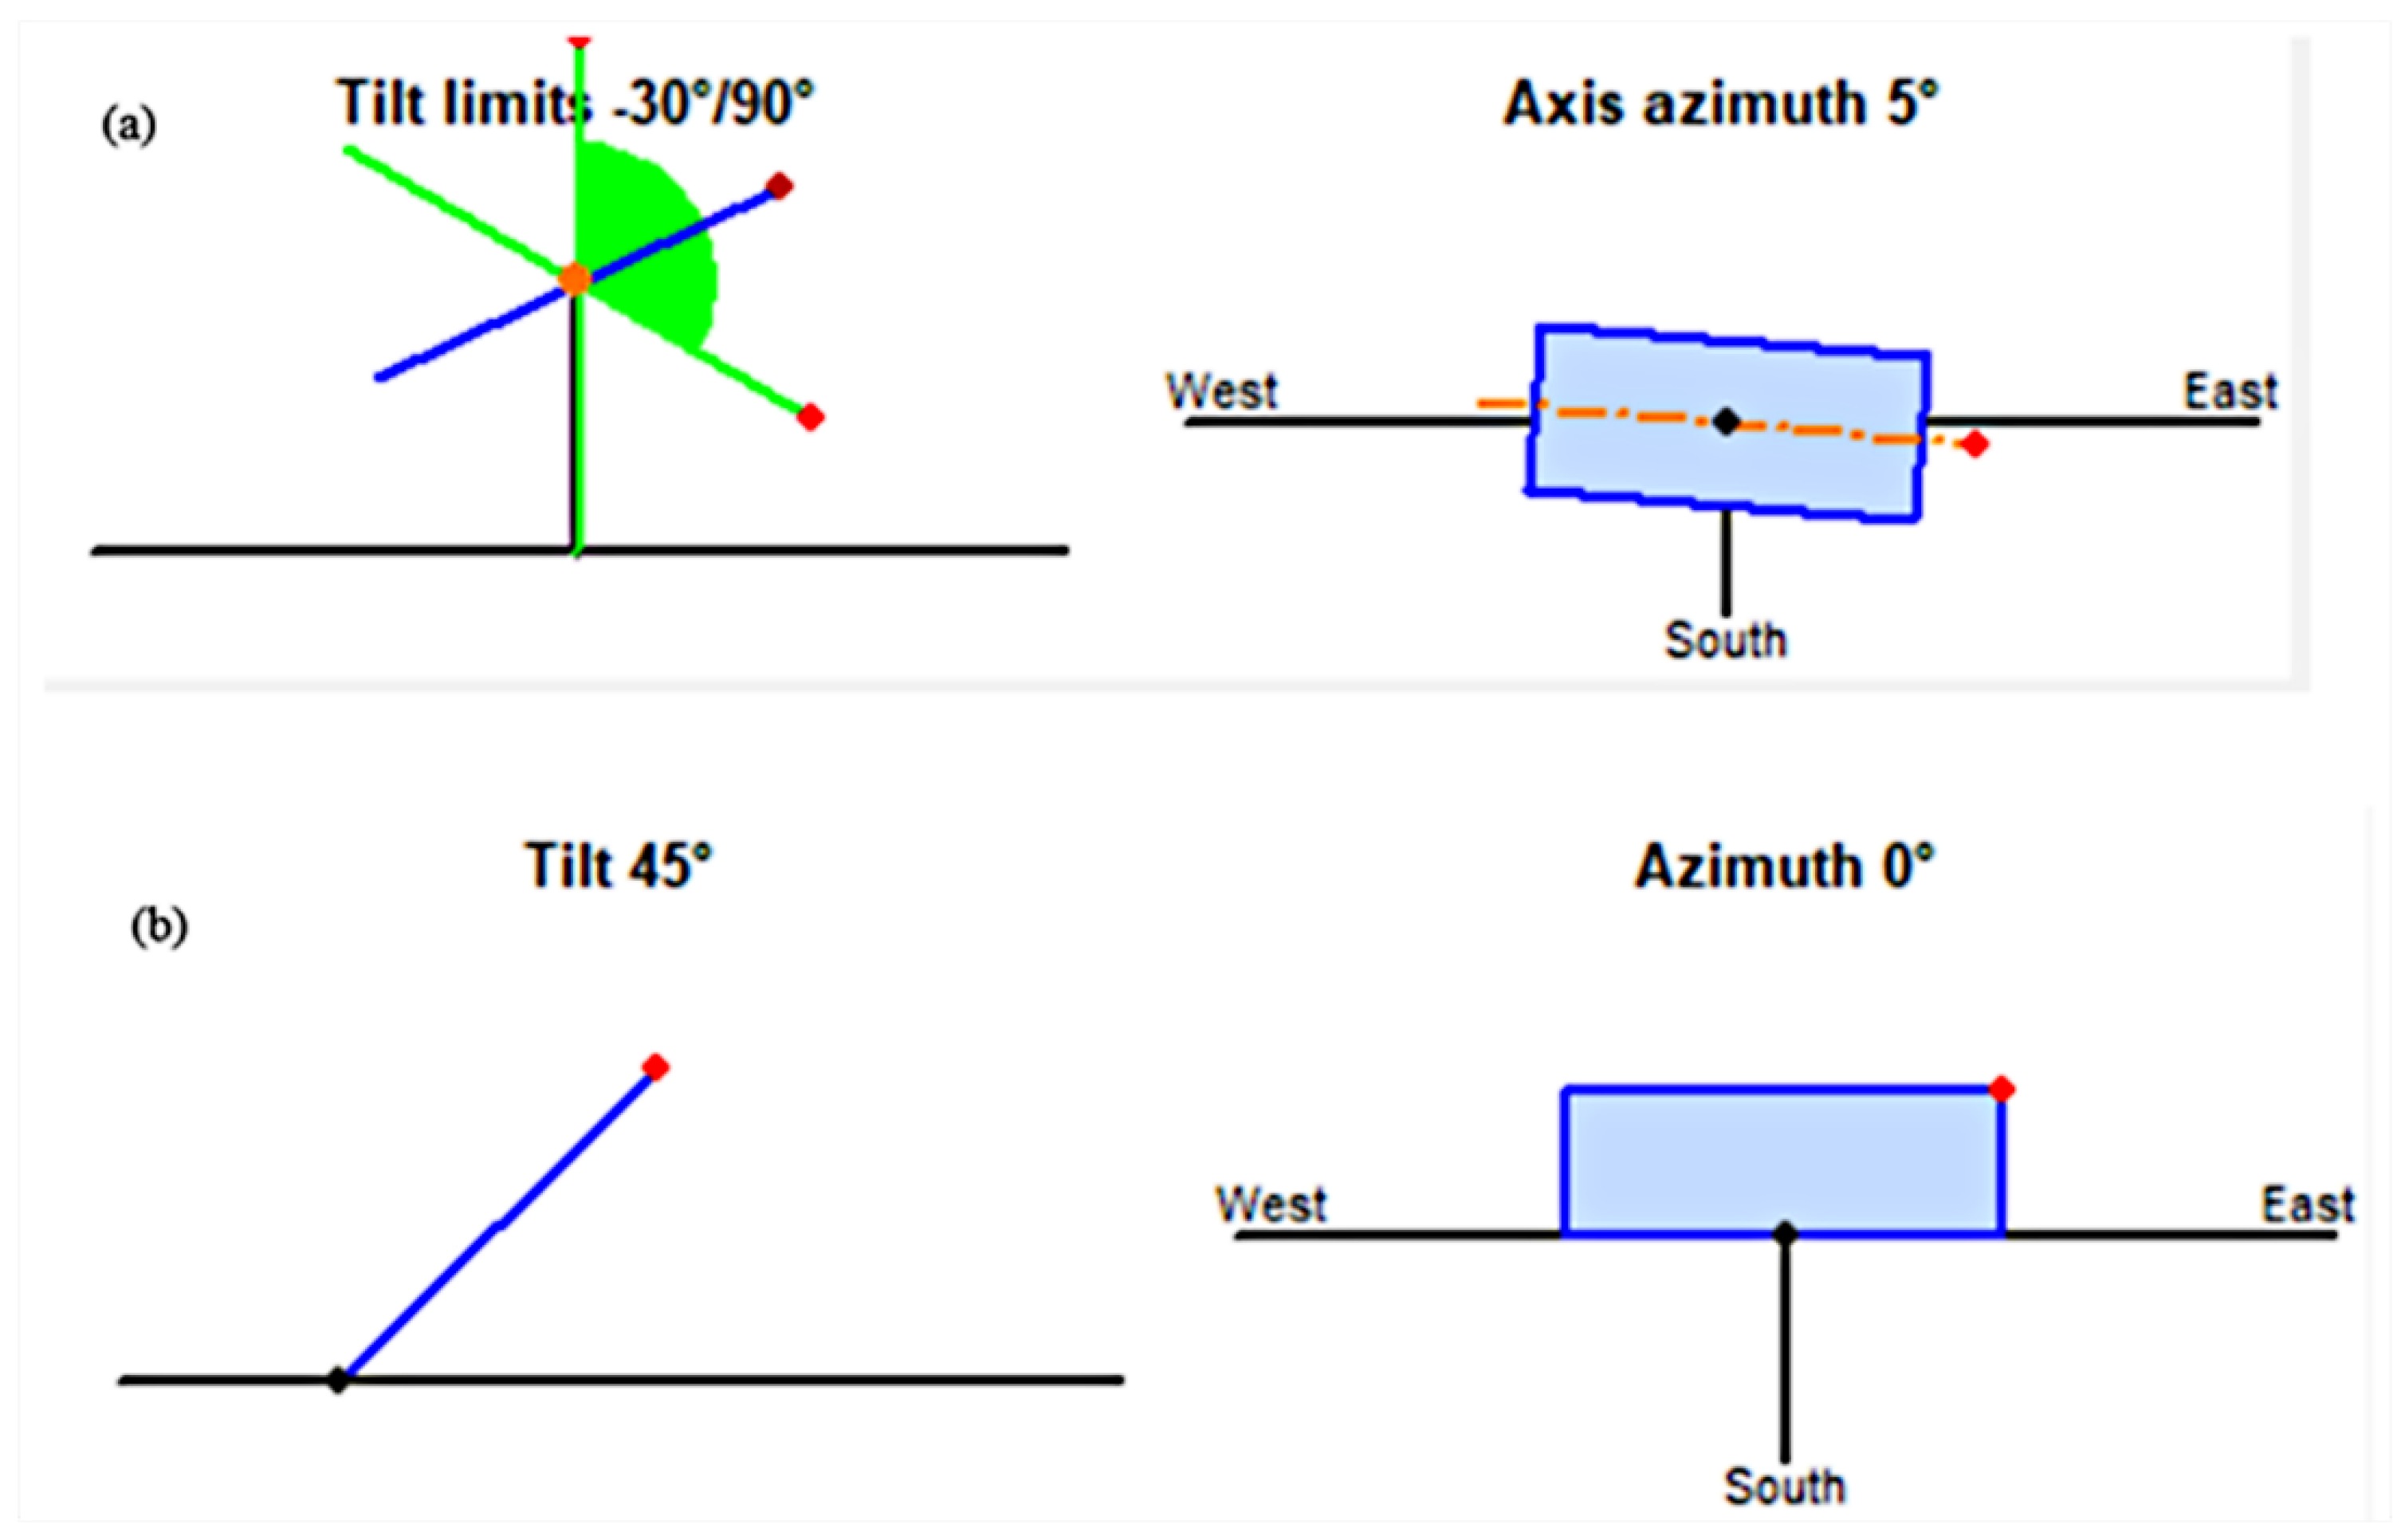
- Selection of the orientation of the PV module (i.e., tilt and azimuth angles)
- Selection of the system components of the PV and inverter systems in relation to the requirements of the system
- Discretionary user needs relative to grid-tied system requirements
- The discretionary choice to alter the values for the loss types.
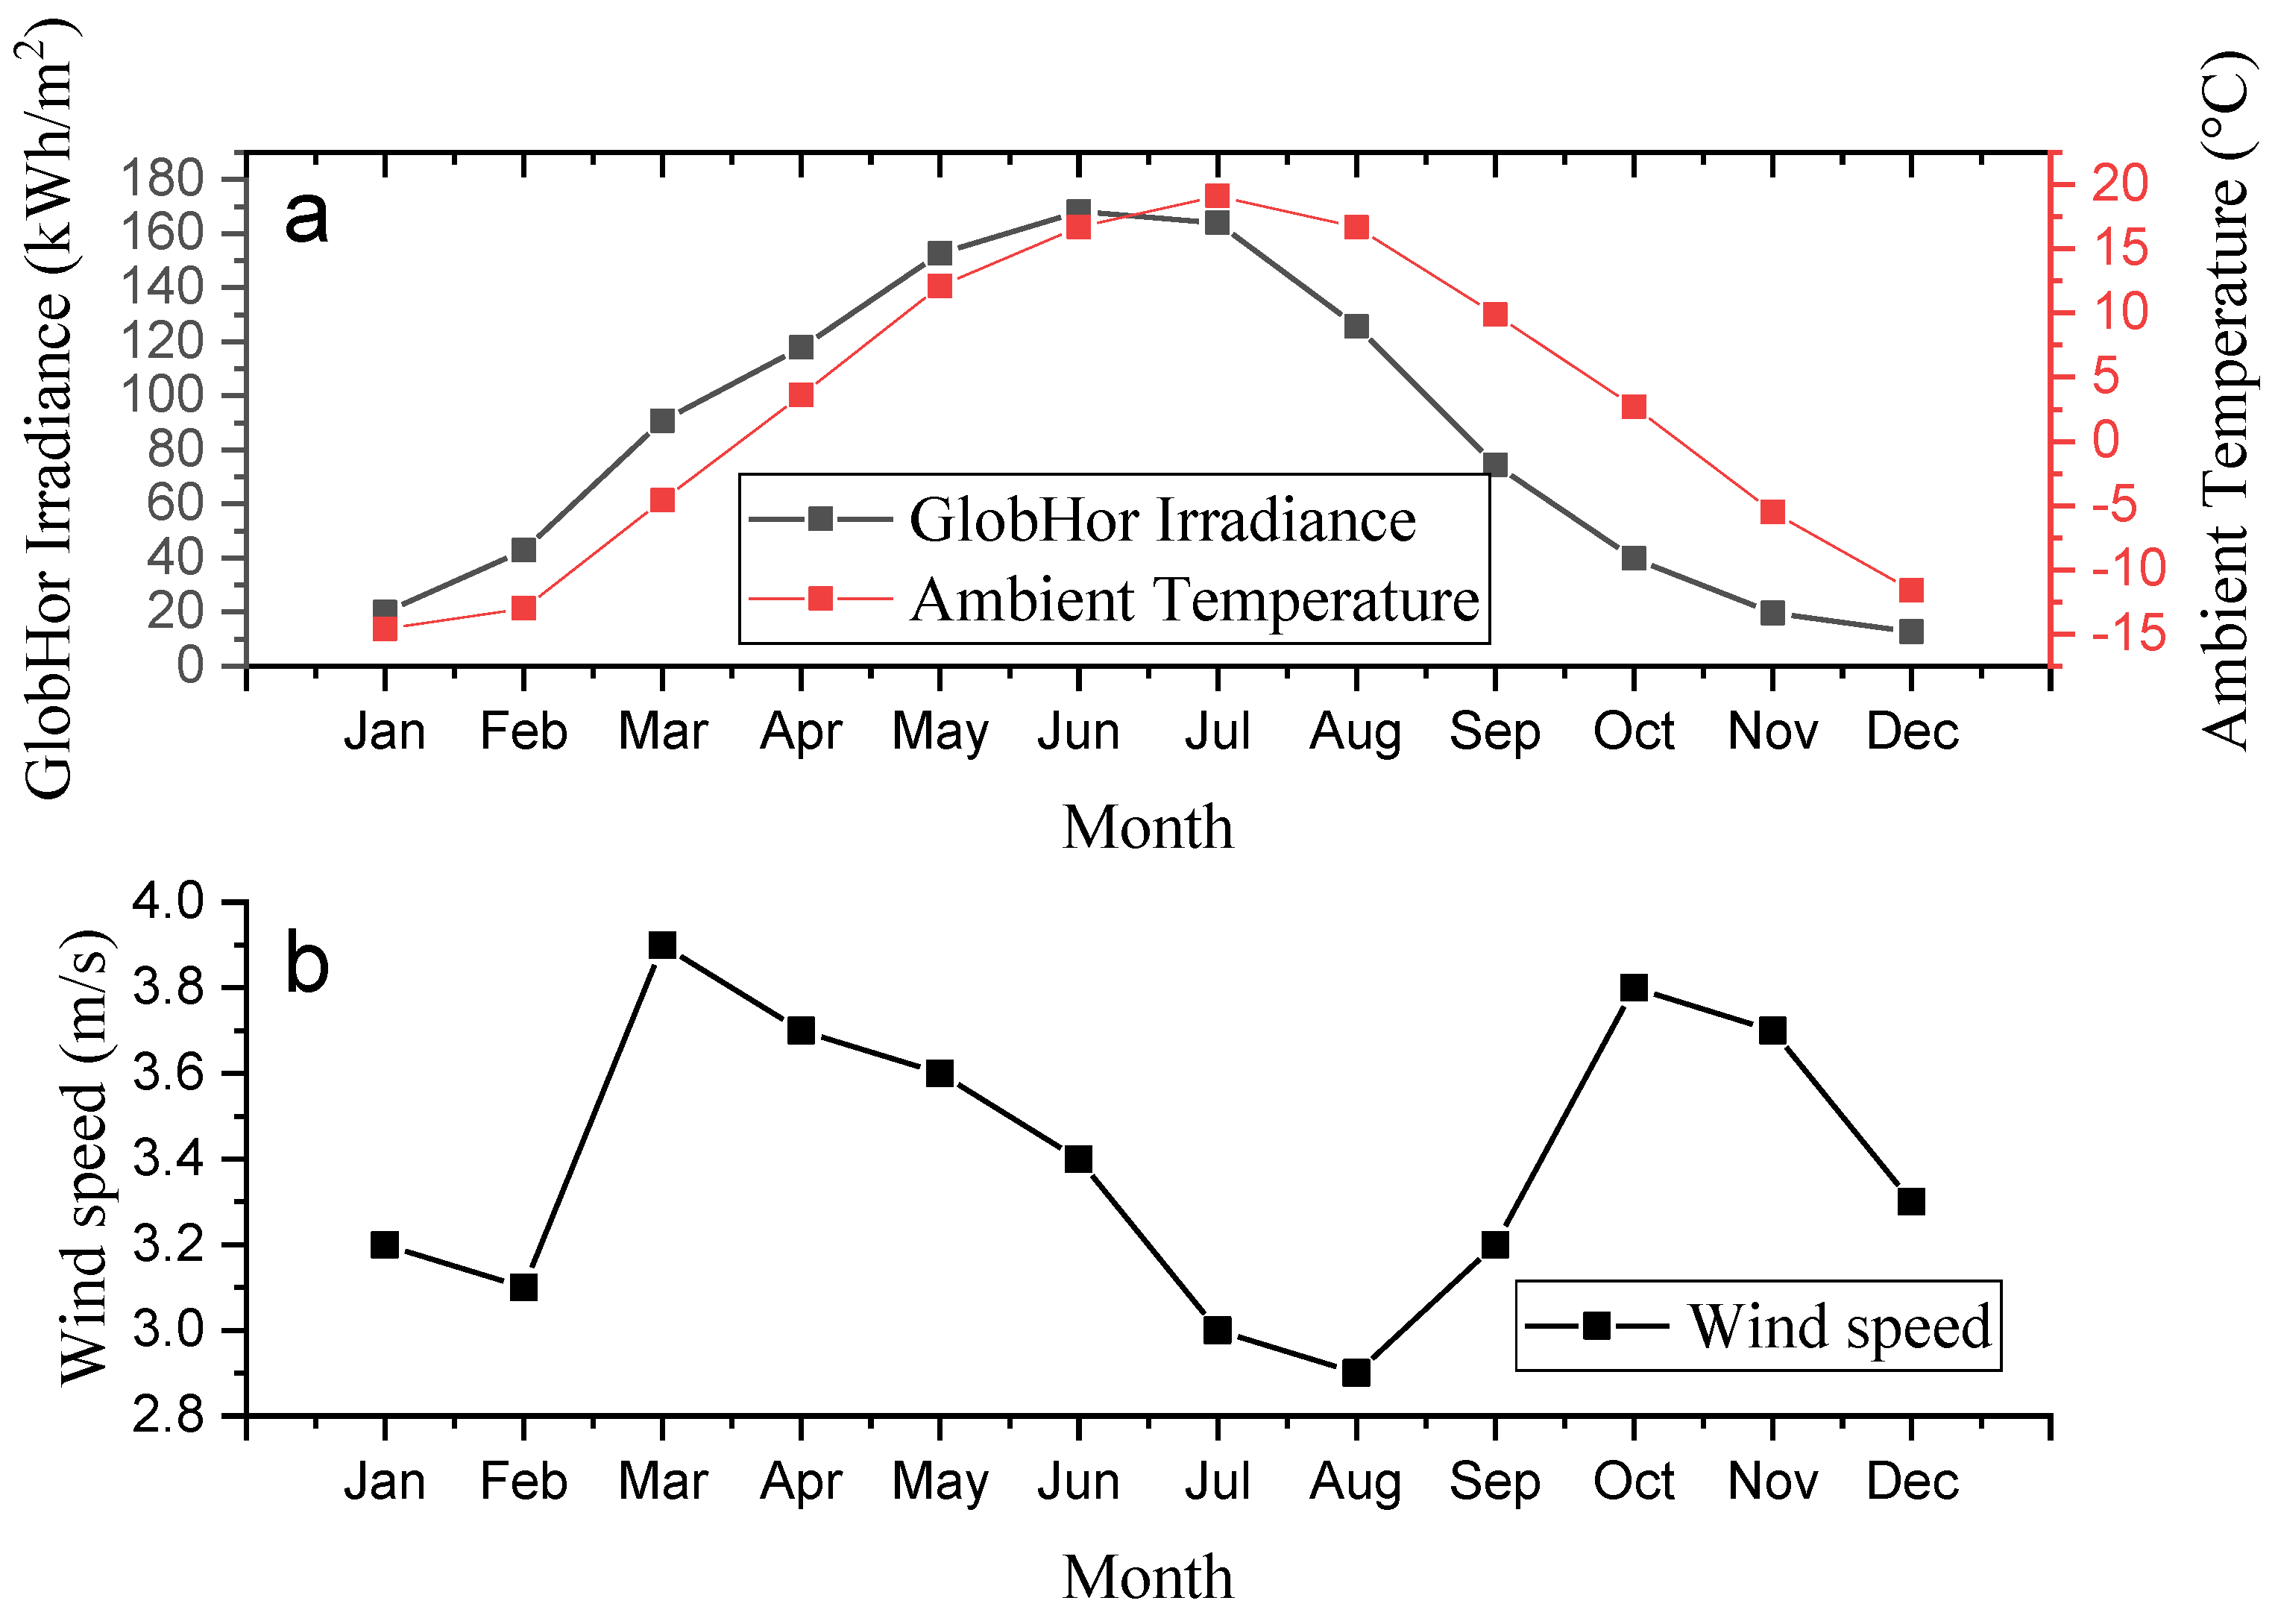
2.2. Meteorological Data of the Study Area
2.3. Solar PV Performance Assessment
2.4. Energy Production
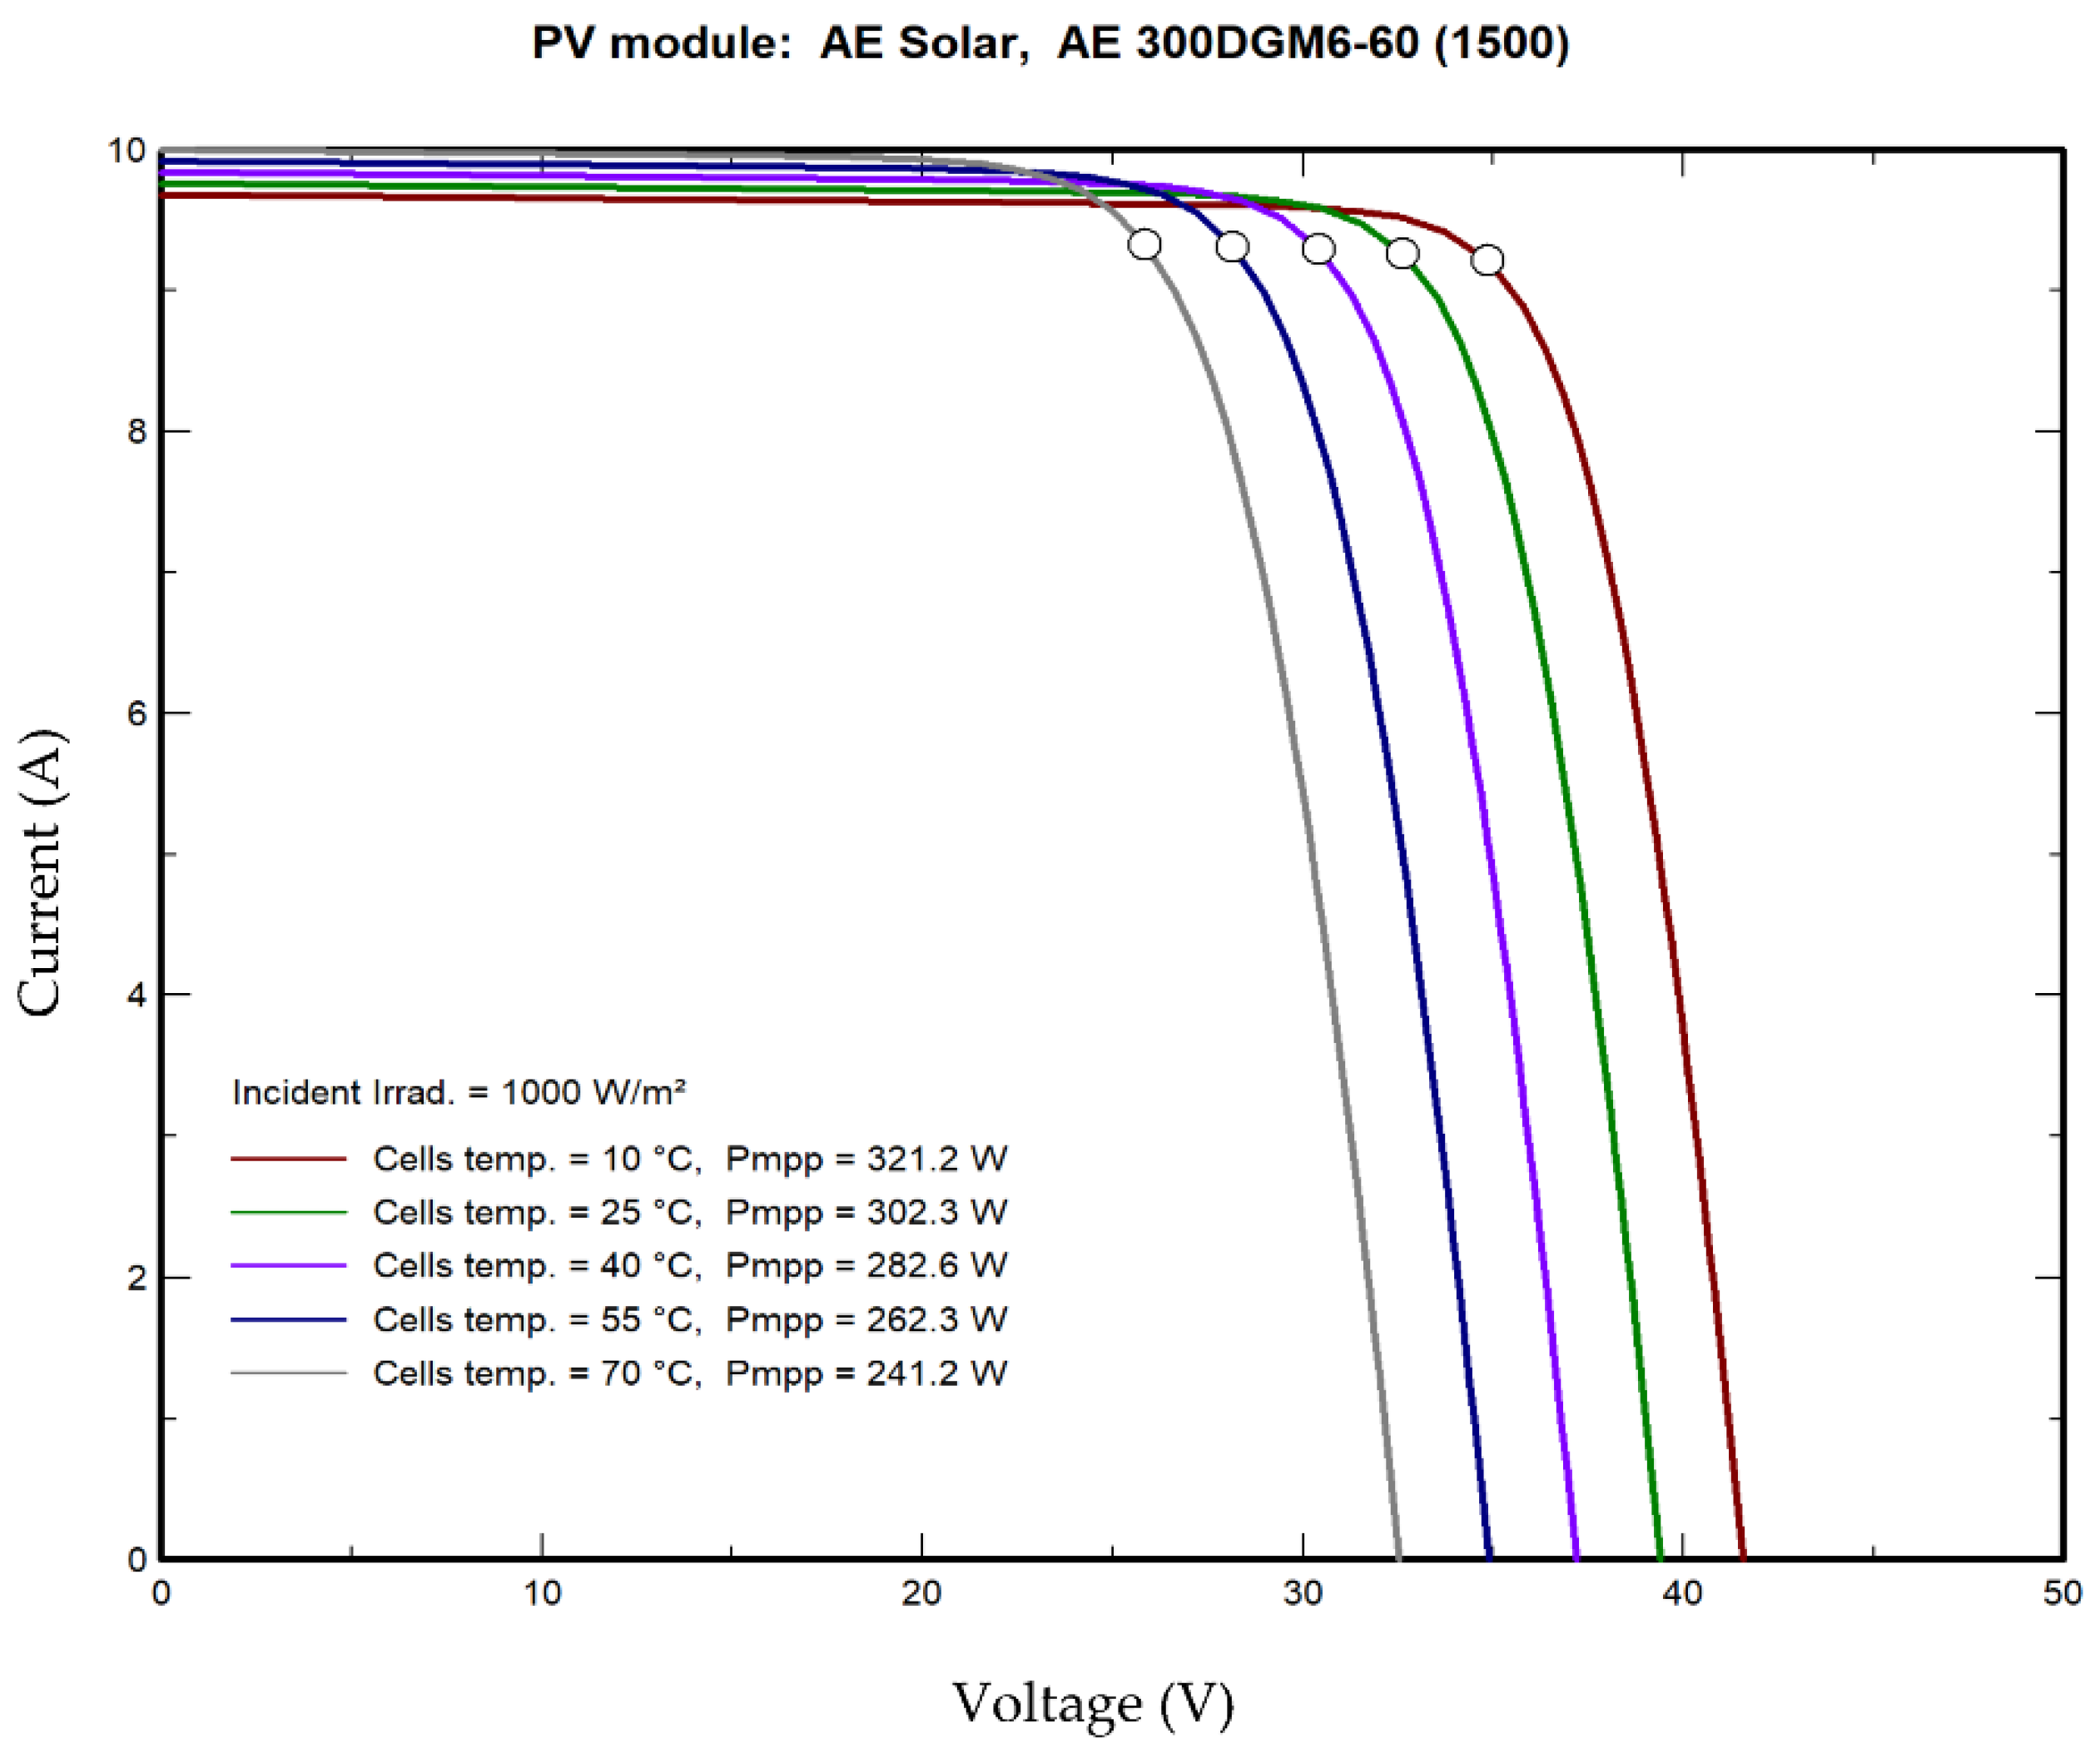
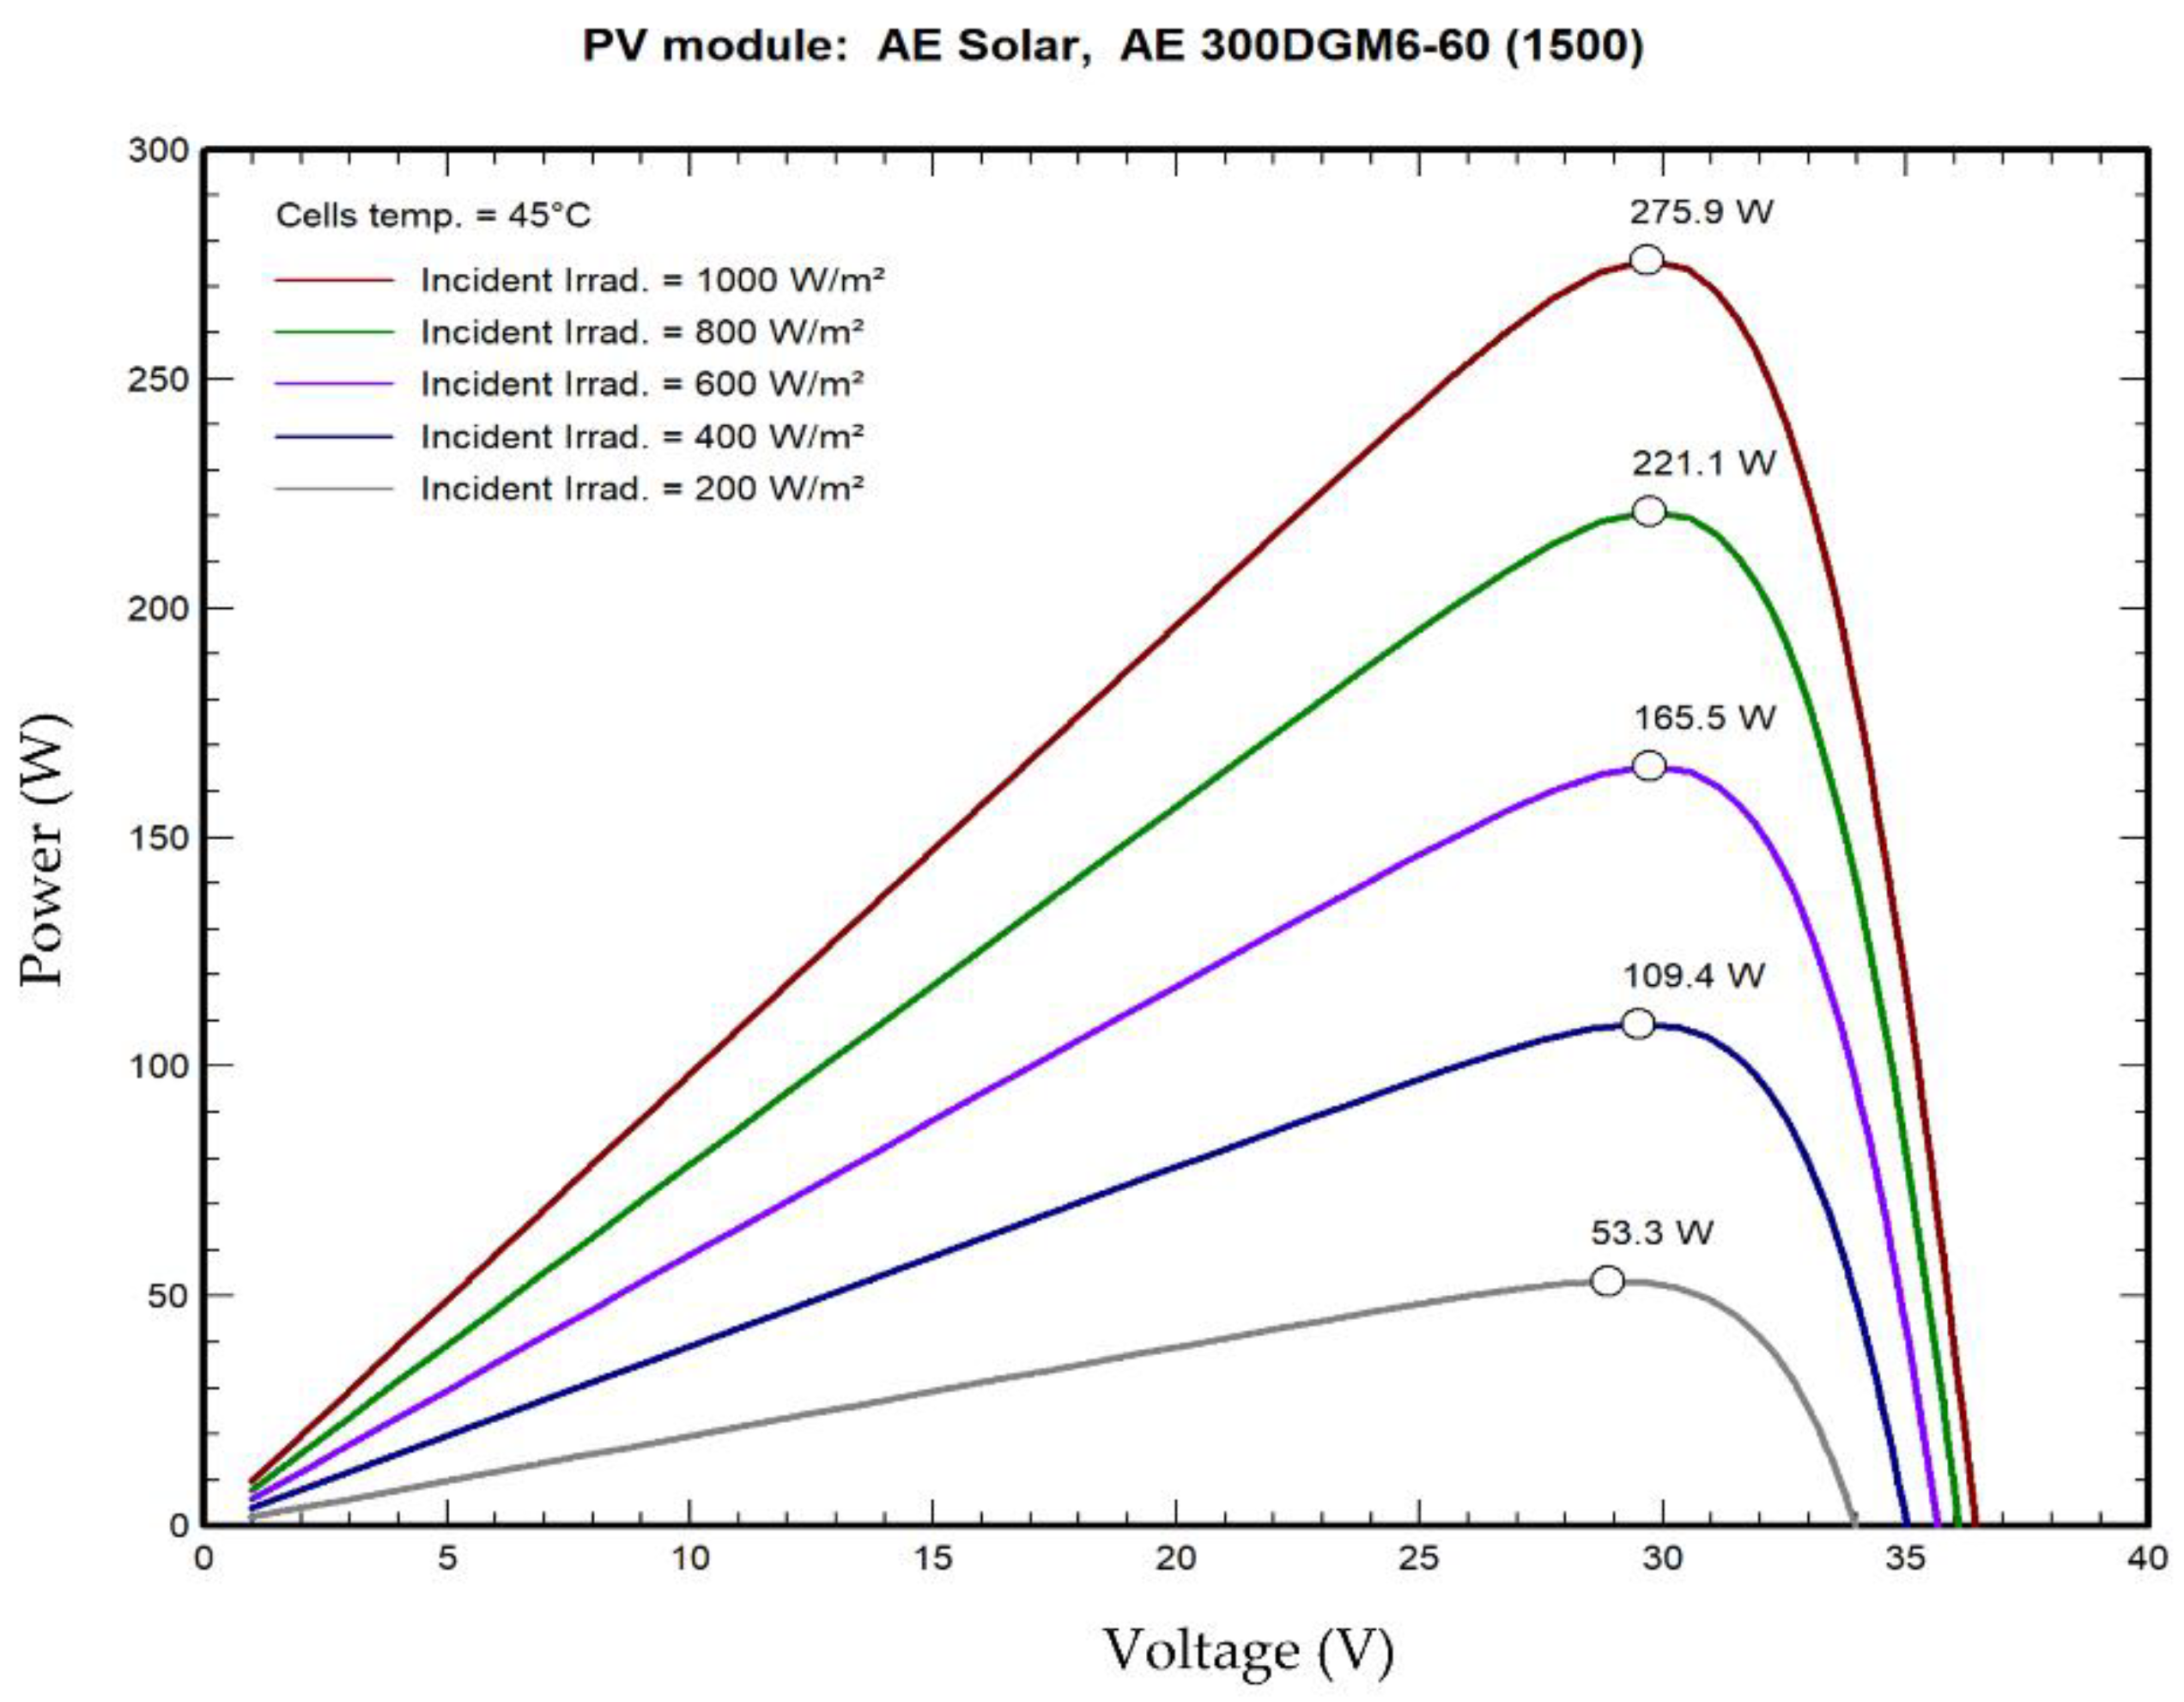
2.5. Characteristics of the Various Components
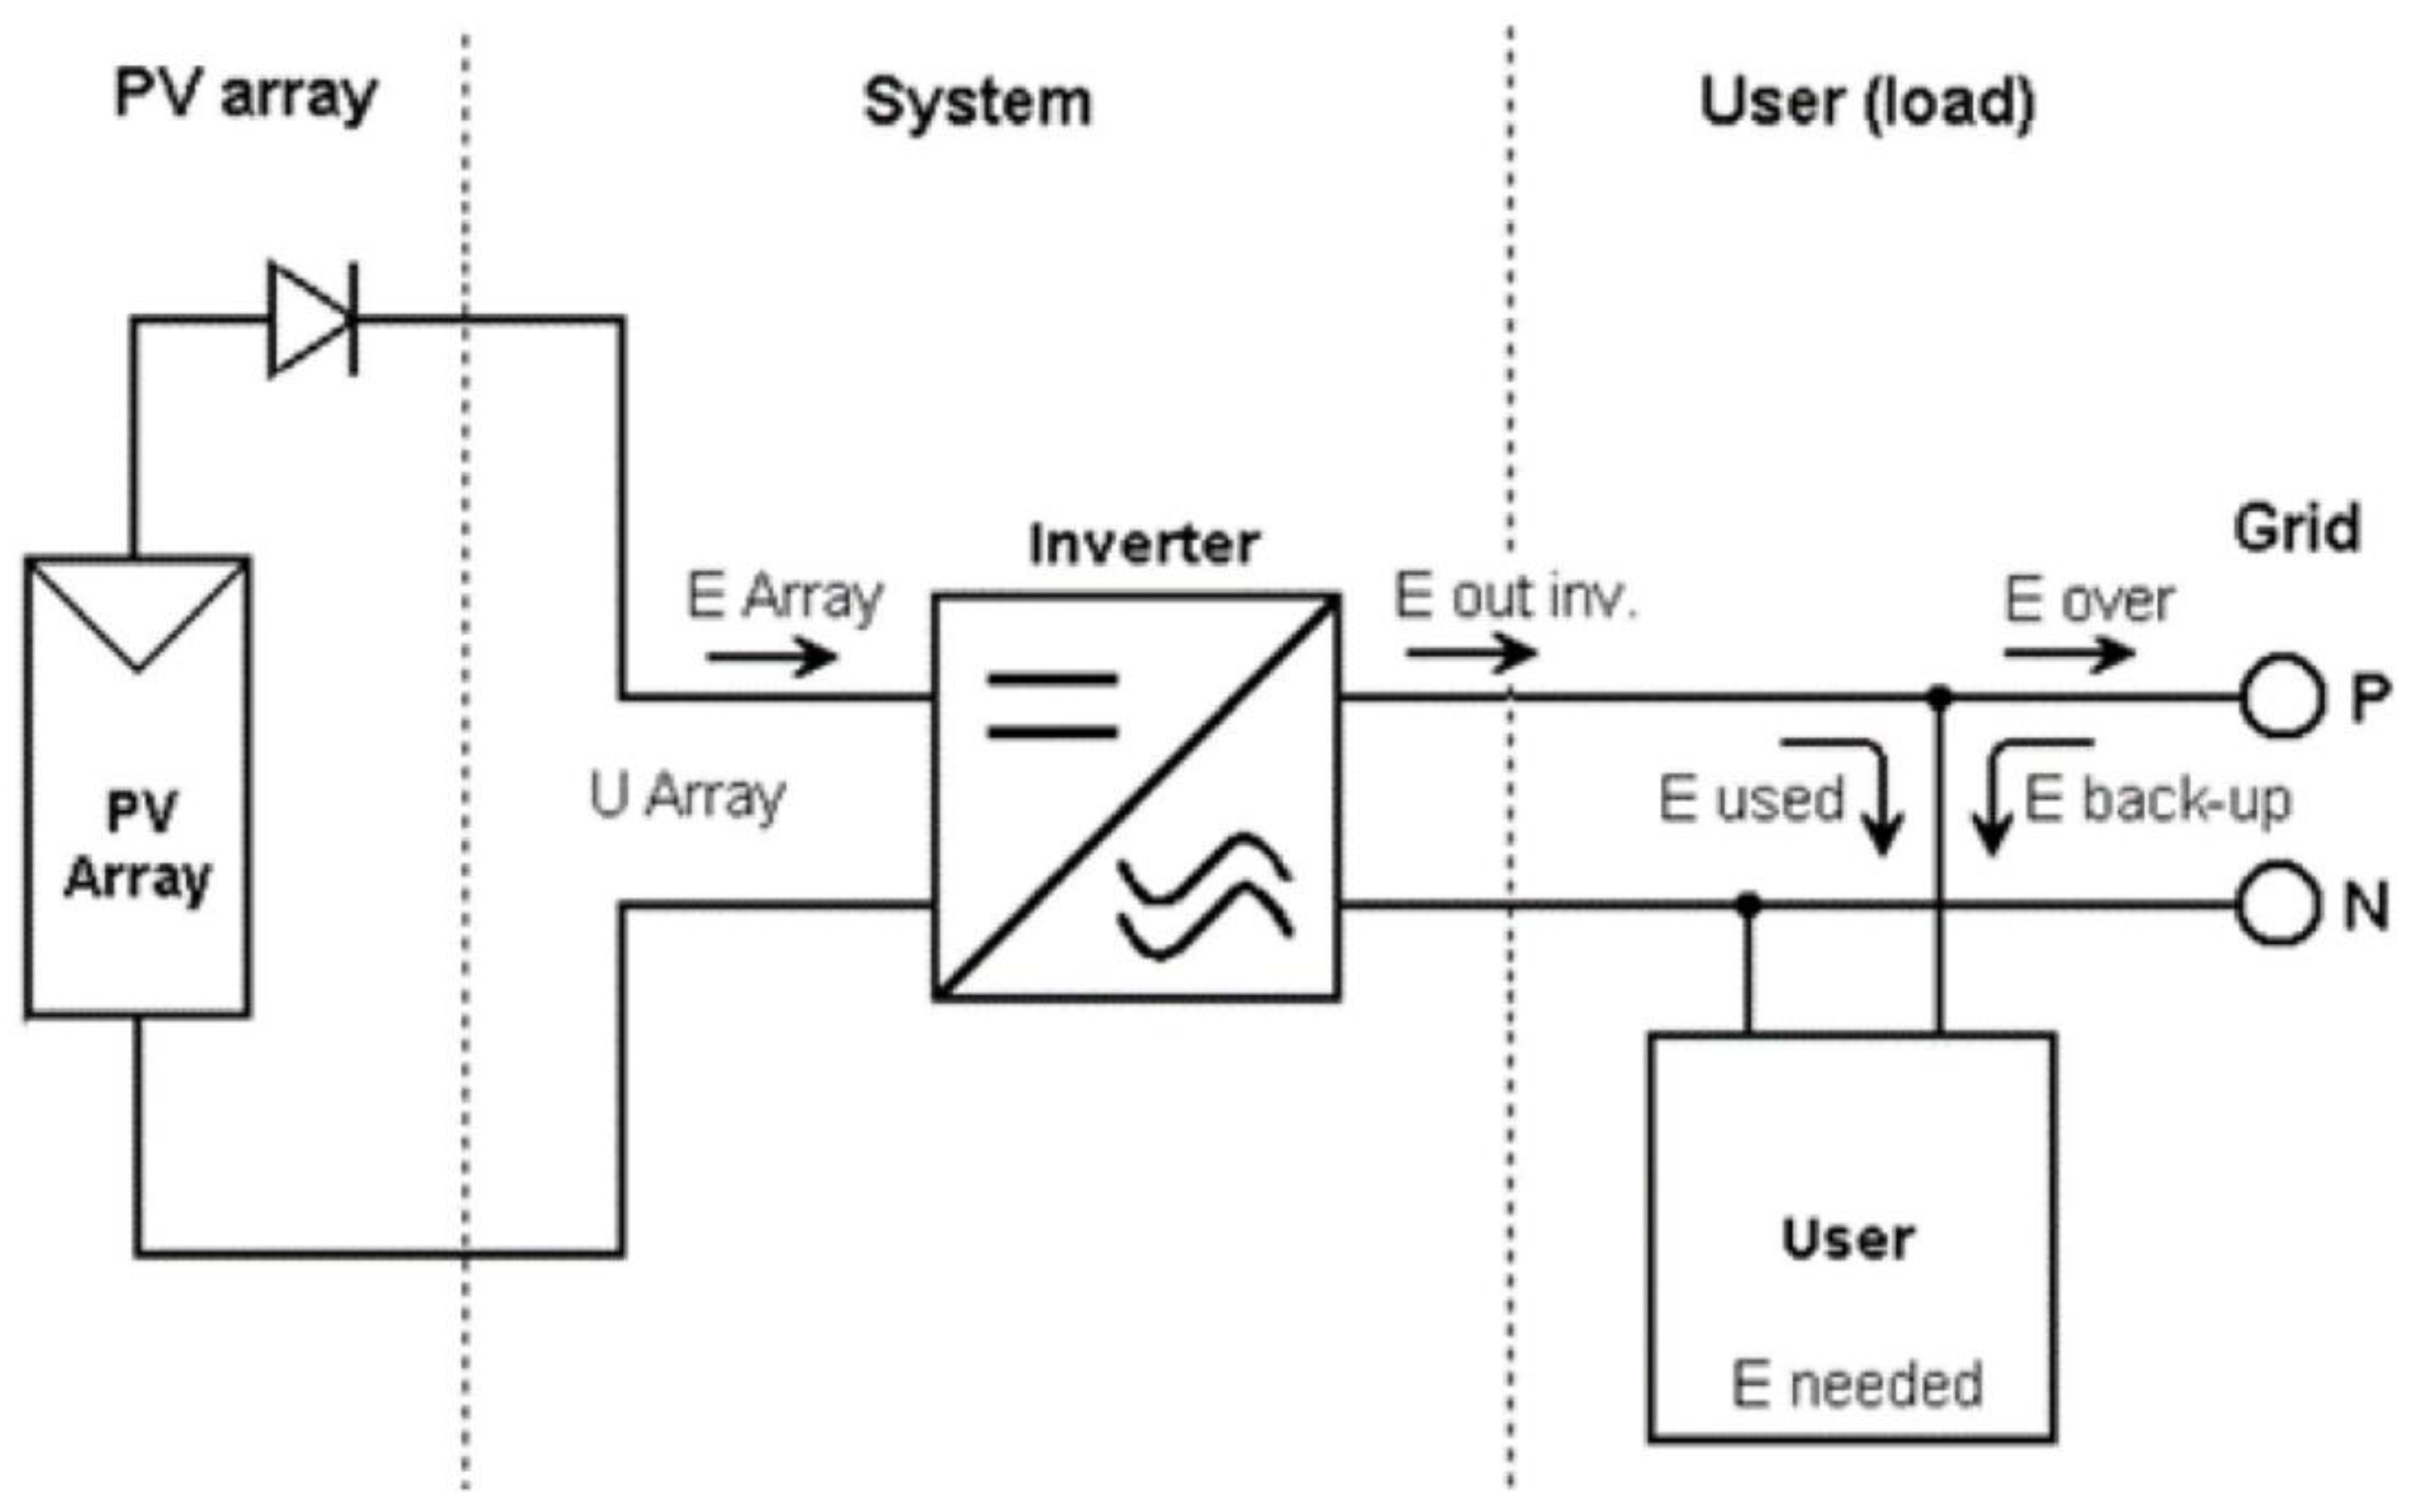
2.6. Field Mechanisms Used in the Analysis
3. Results and Discussion
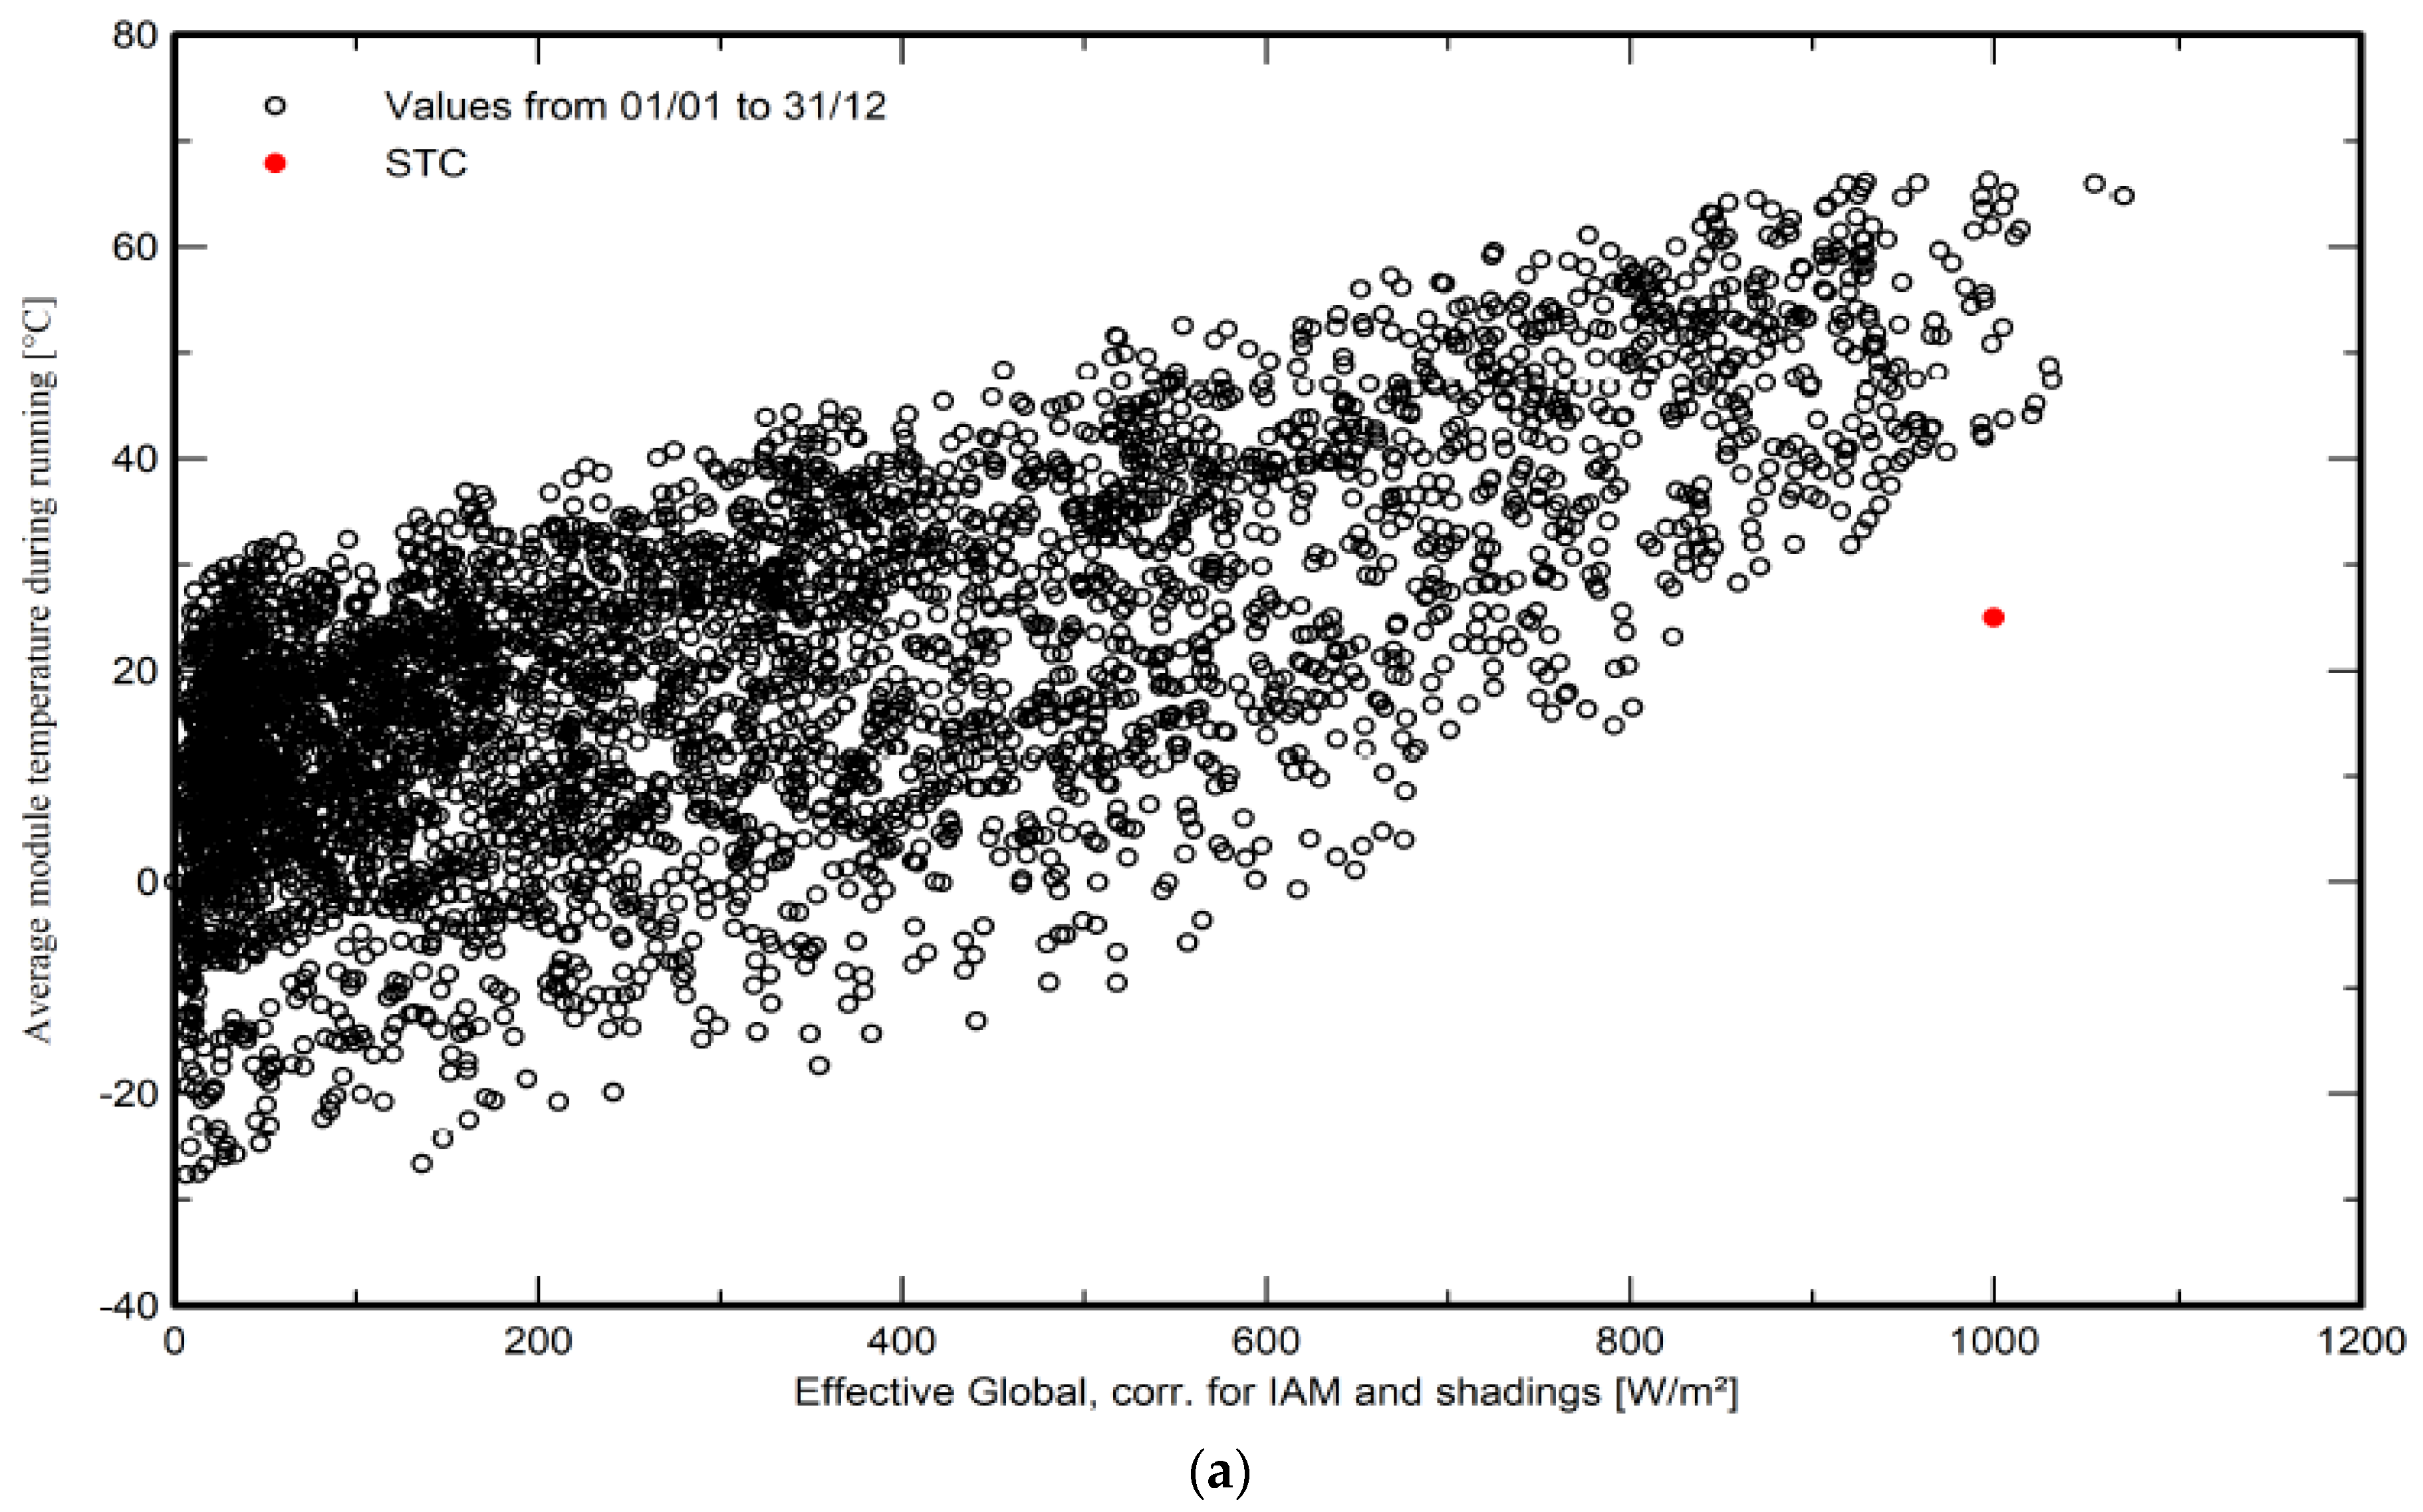
3.1. System Losses
3.2. Social Aspect
4. Conclusions
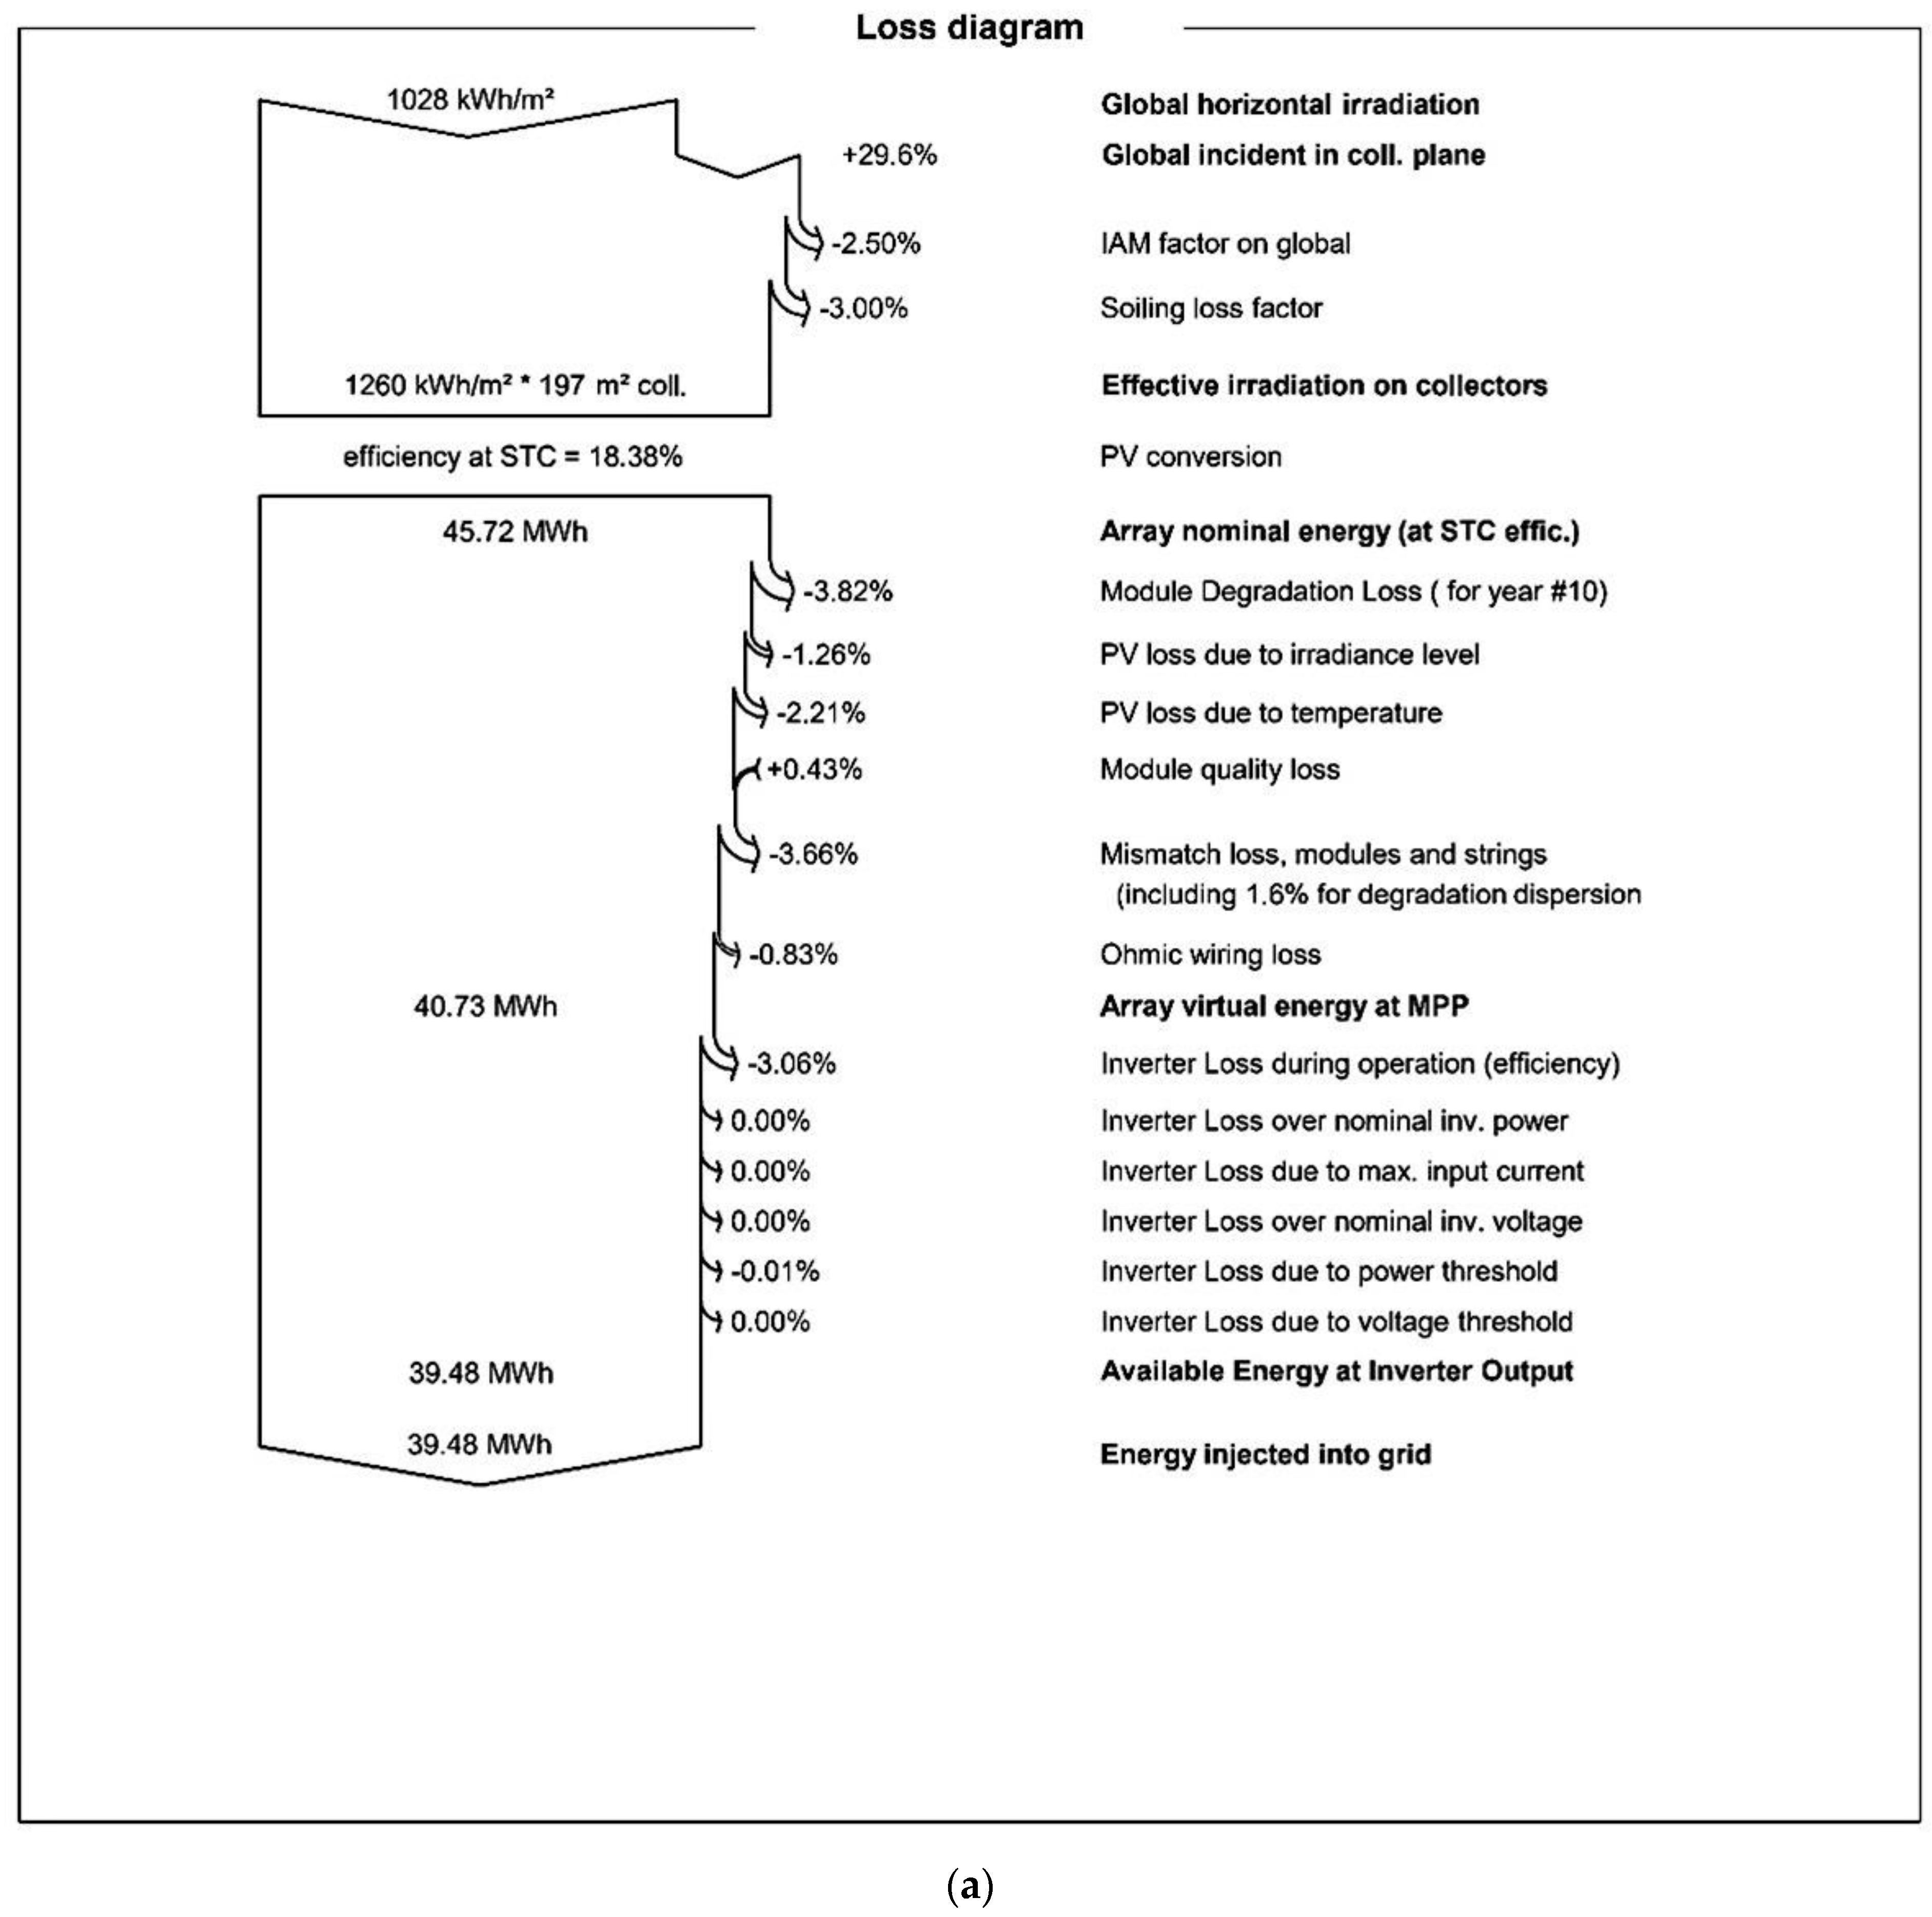
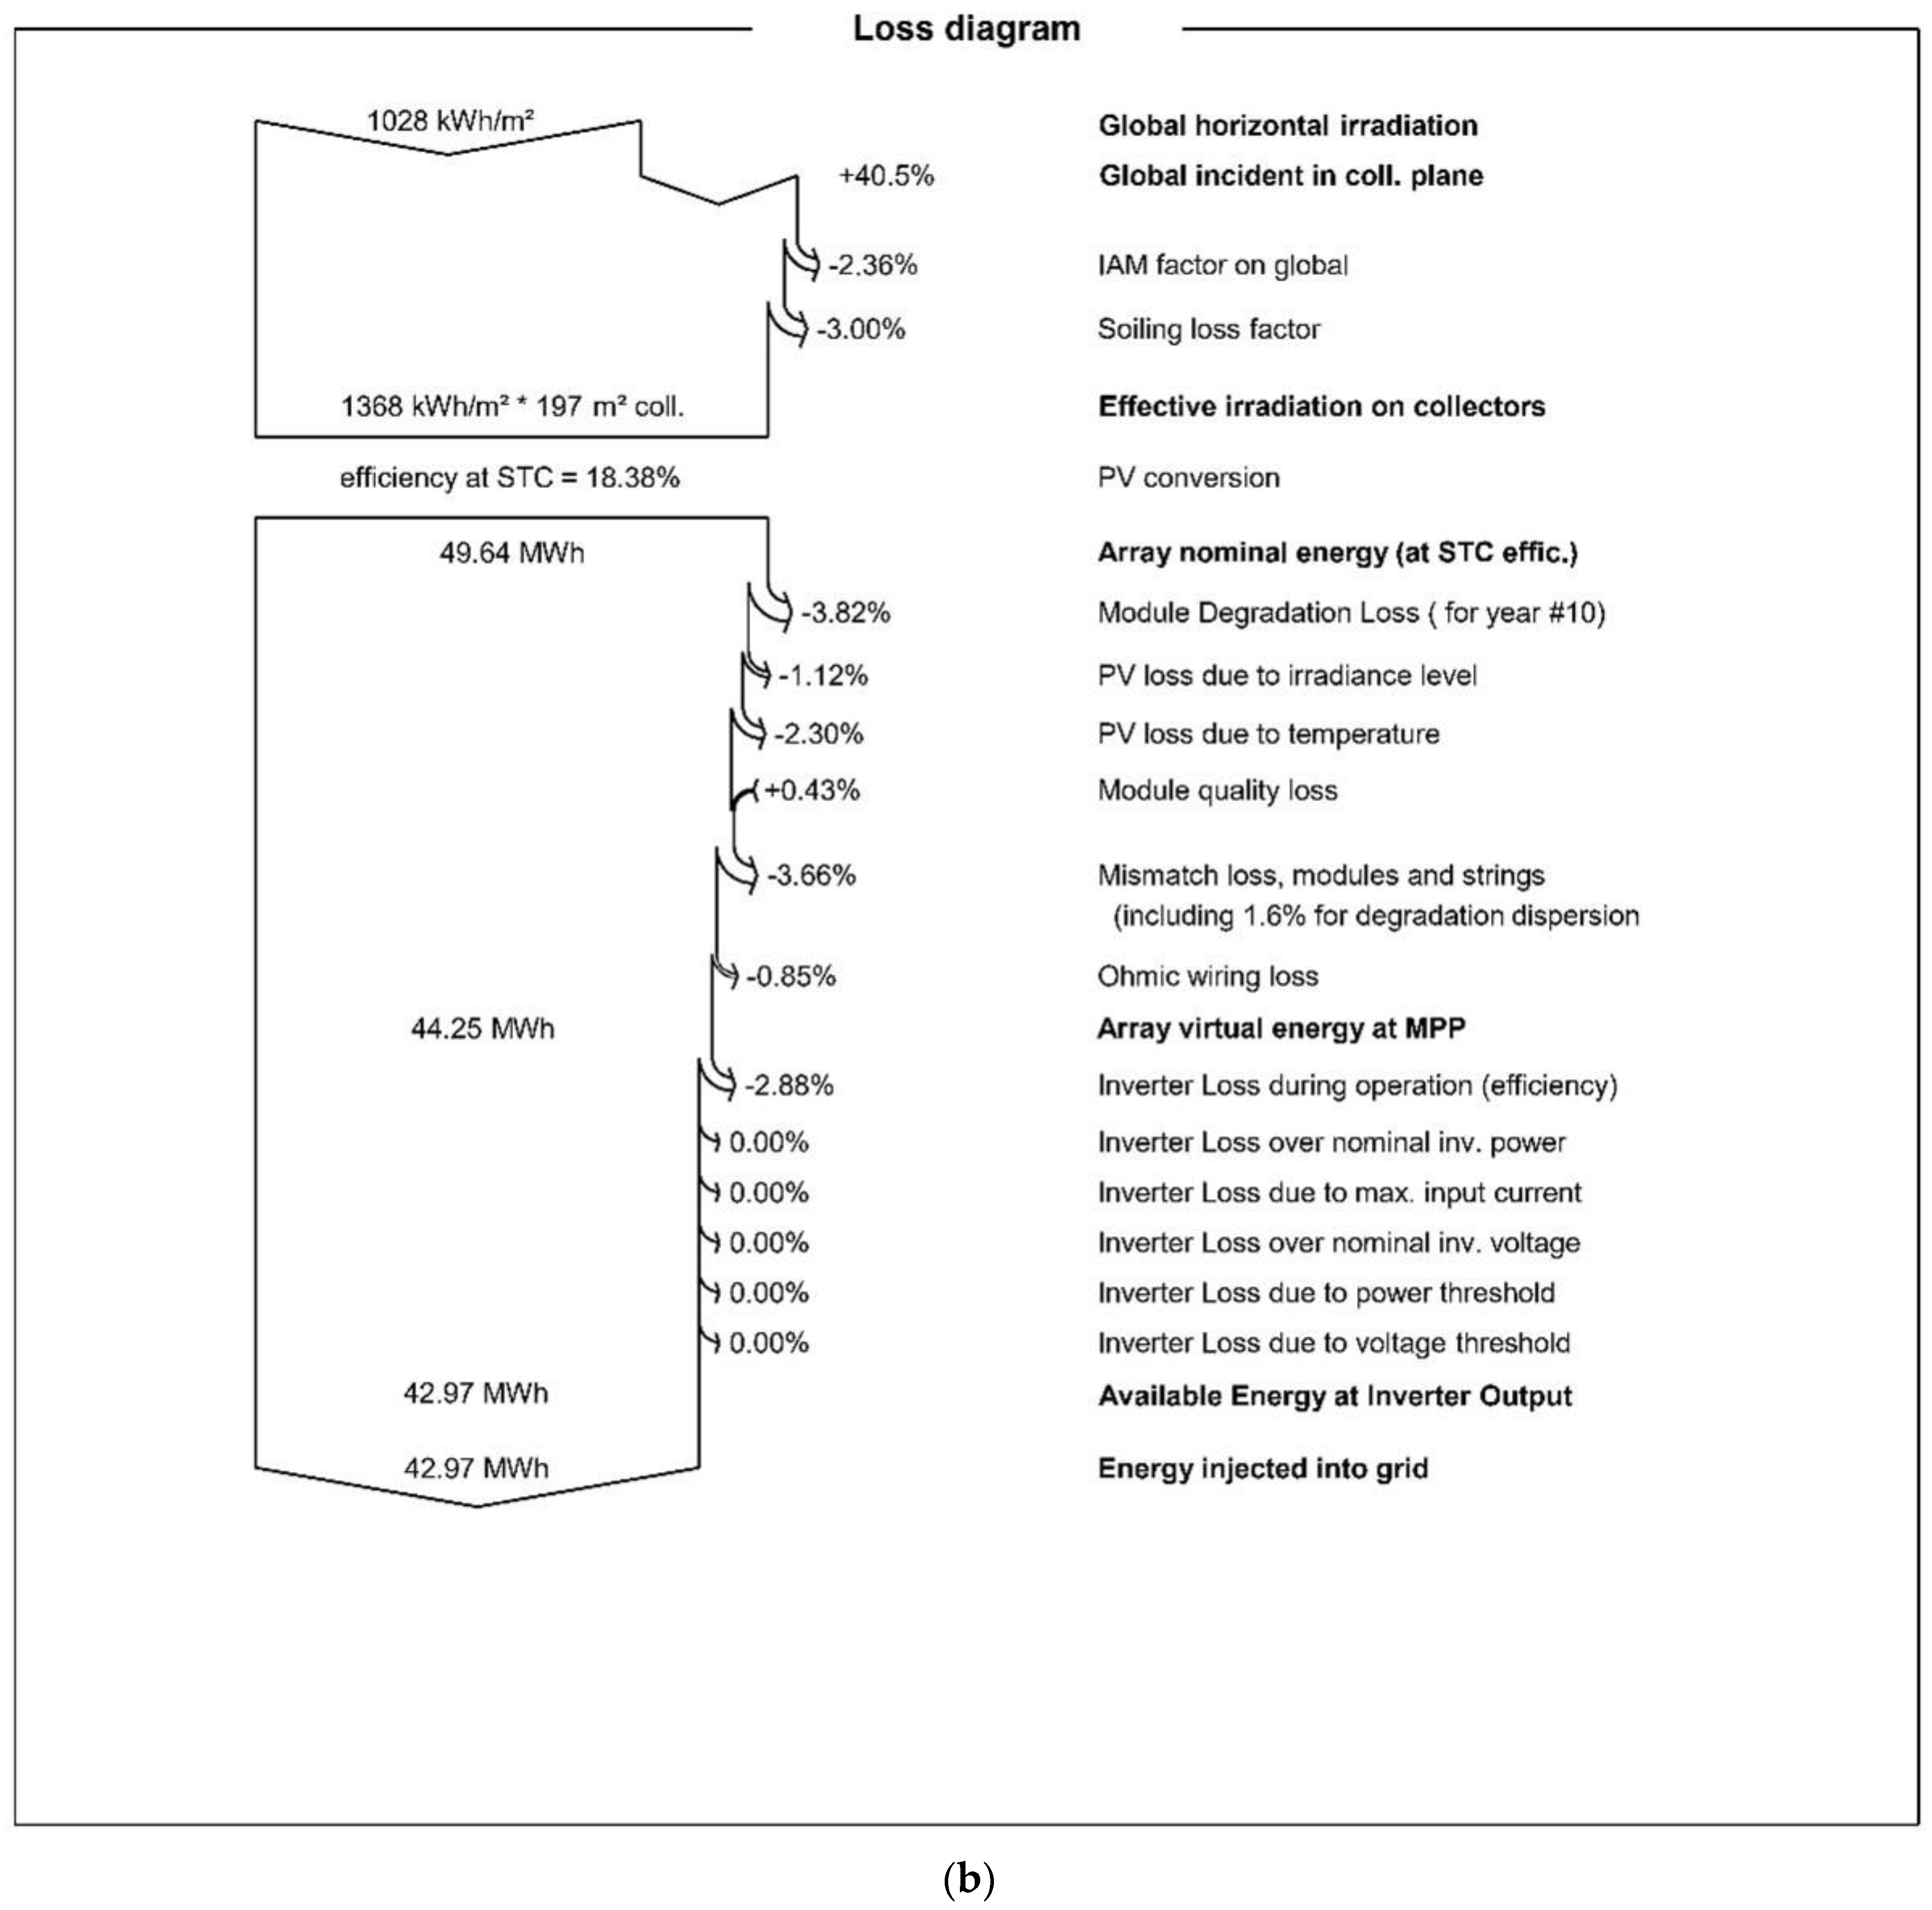
- A total of 1028 kWh/m2 global horizontal solar irradiation was received during the analysis period.
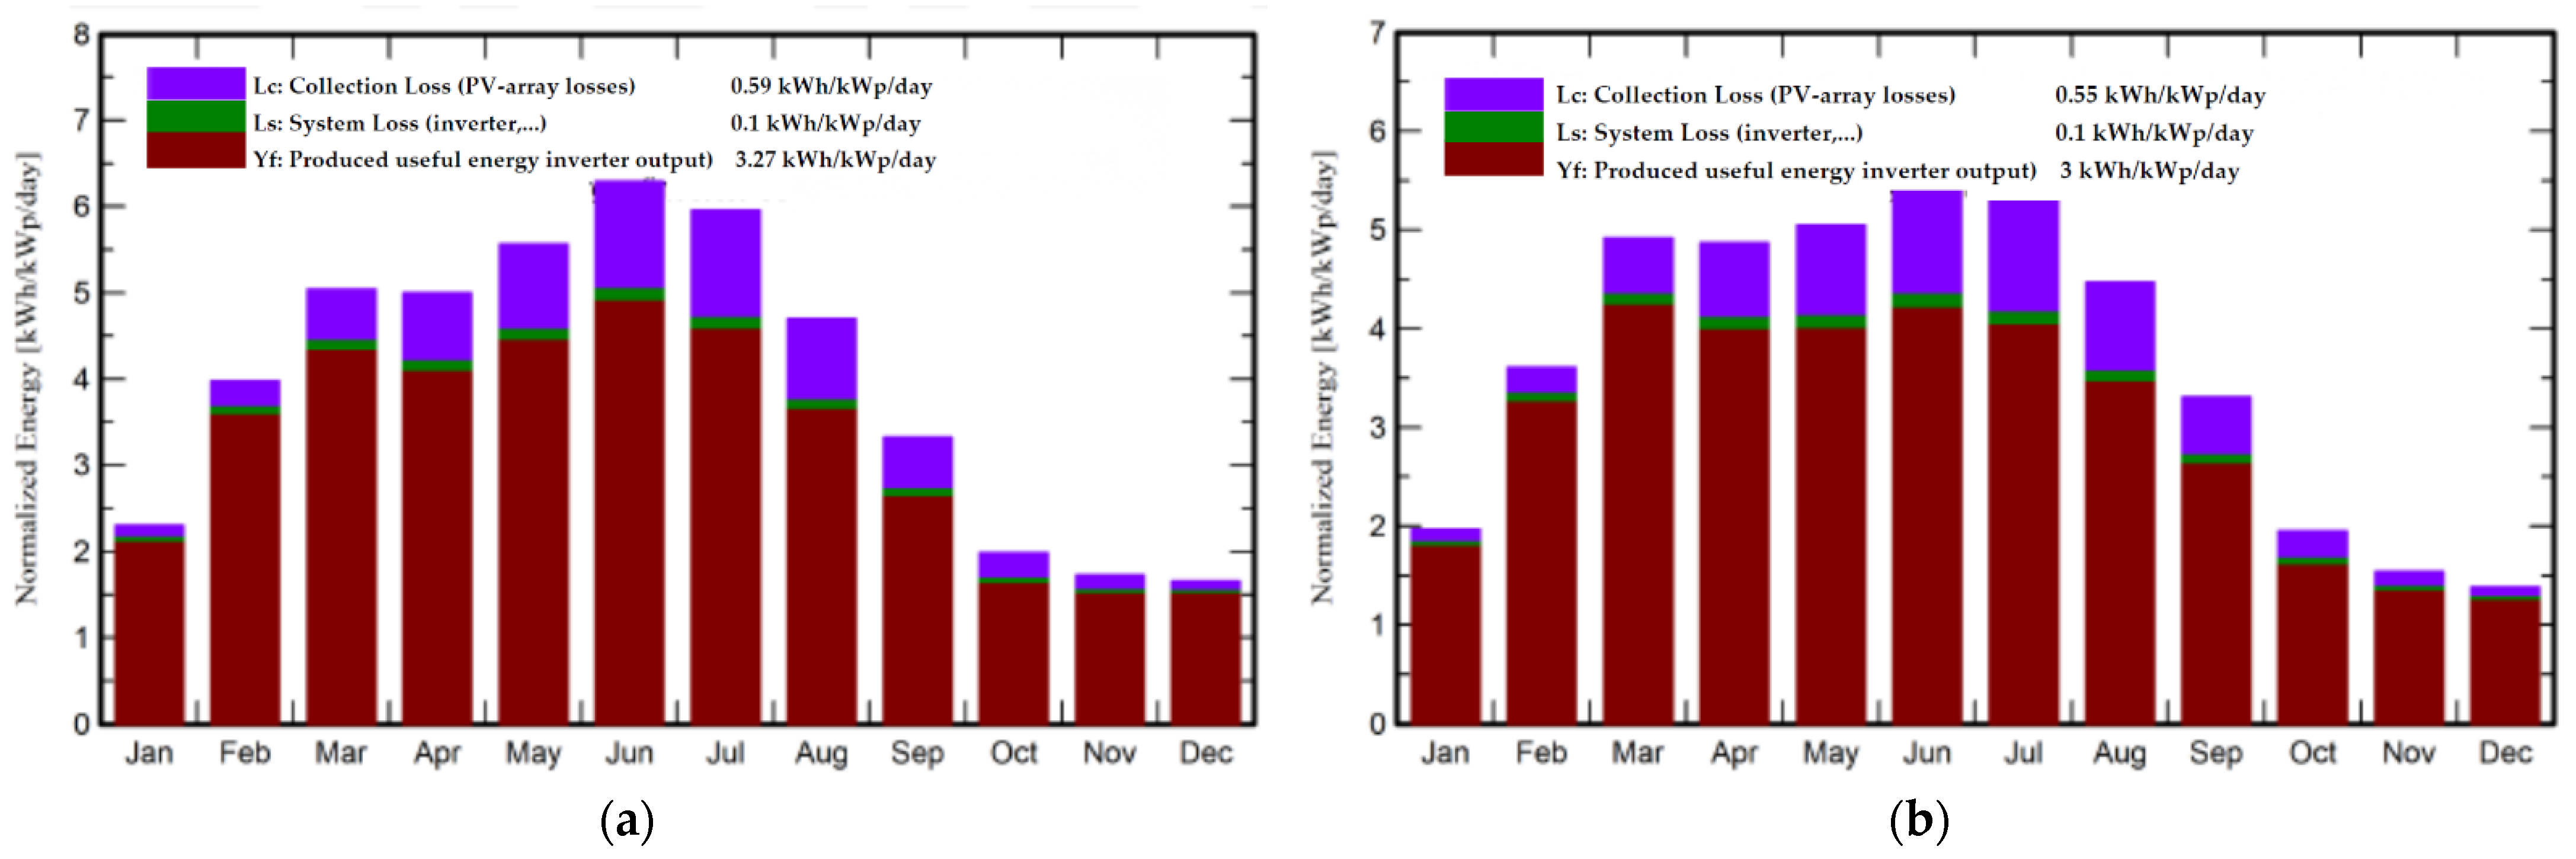
- The fixed tilted plane PV panel is expected to export 39.48 MWh of electricity to the grid, while the tracking system will export 42.97 MWh for a year. The months of March to August are the periods within which much of the electricity will be generated due to the high solar irradiations recorded during those periods.
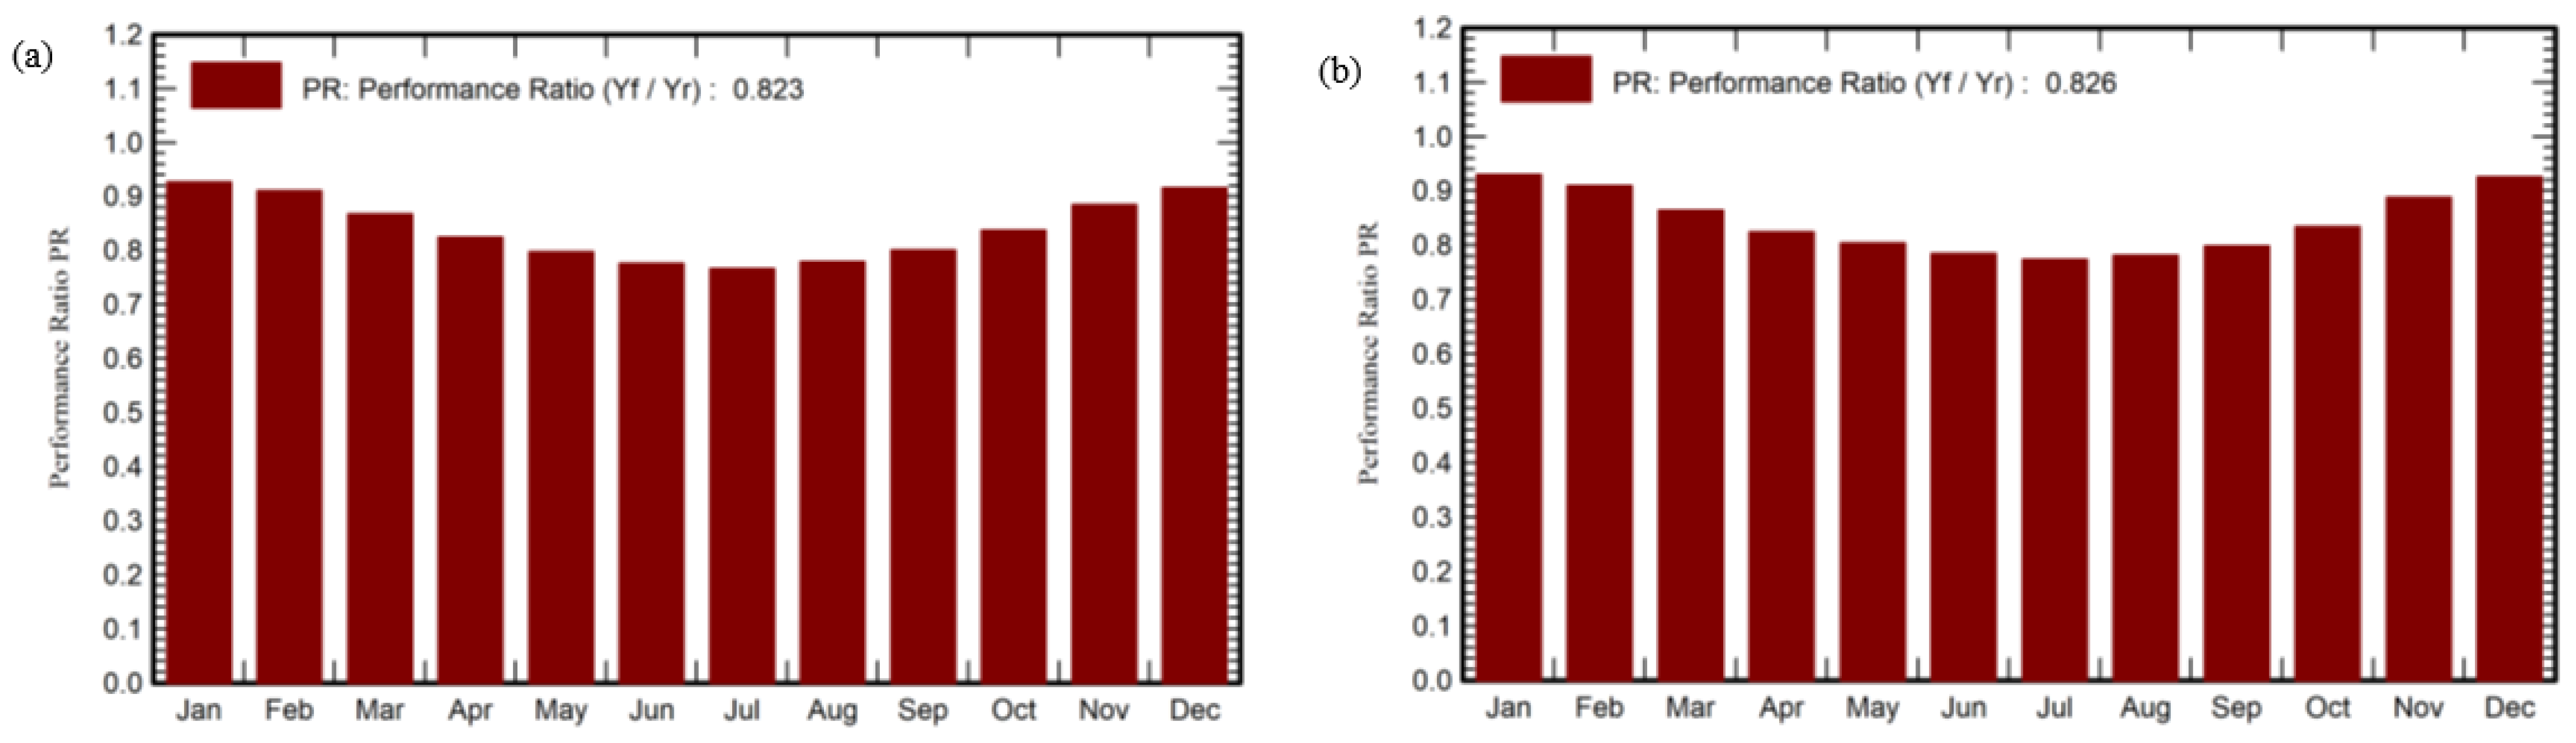
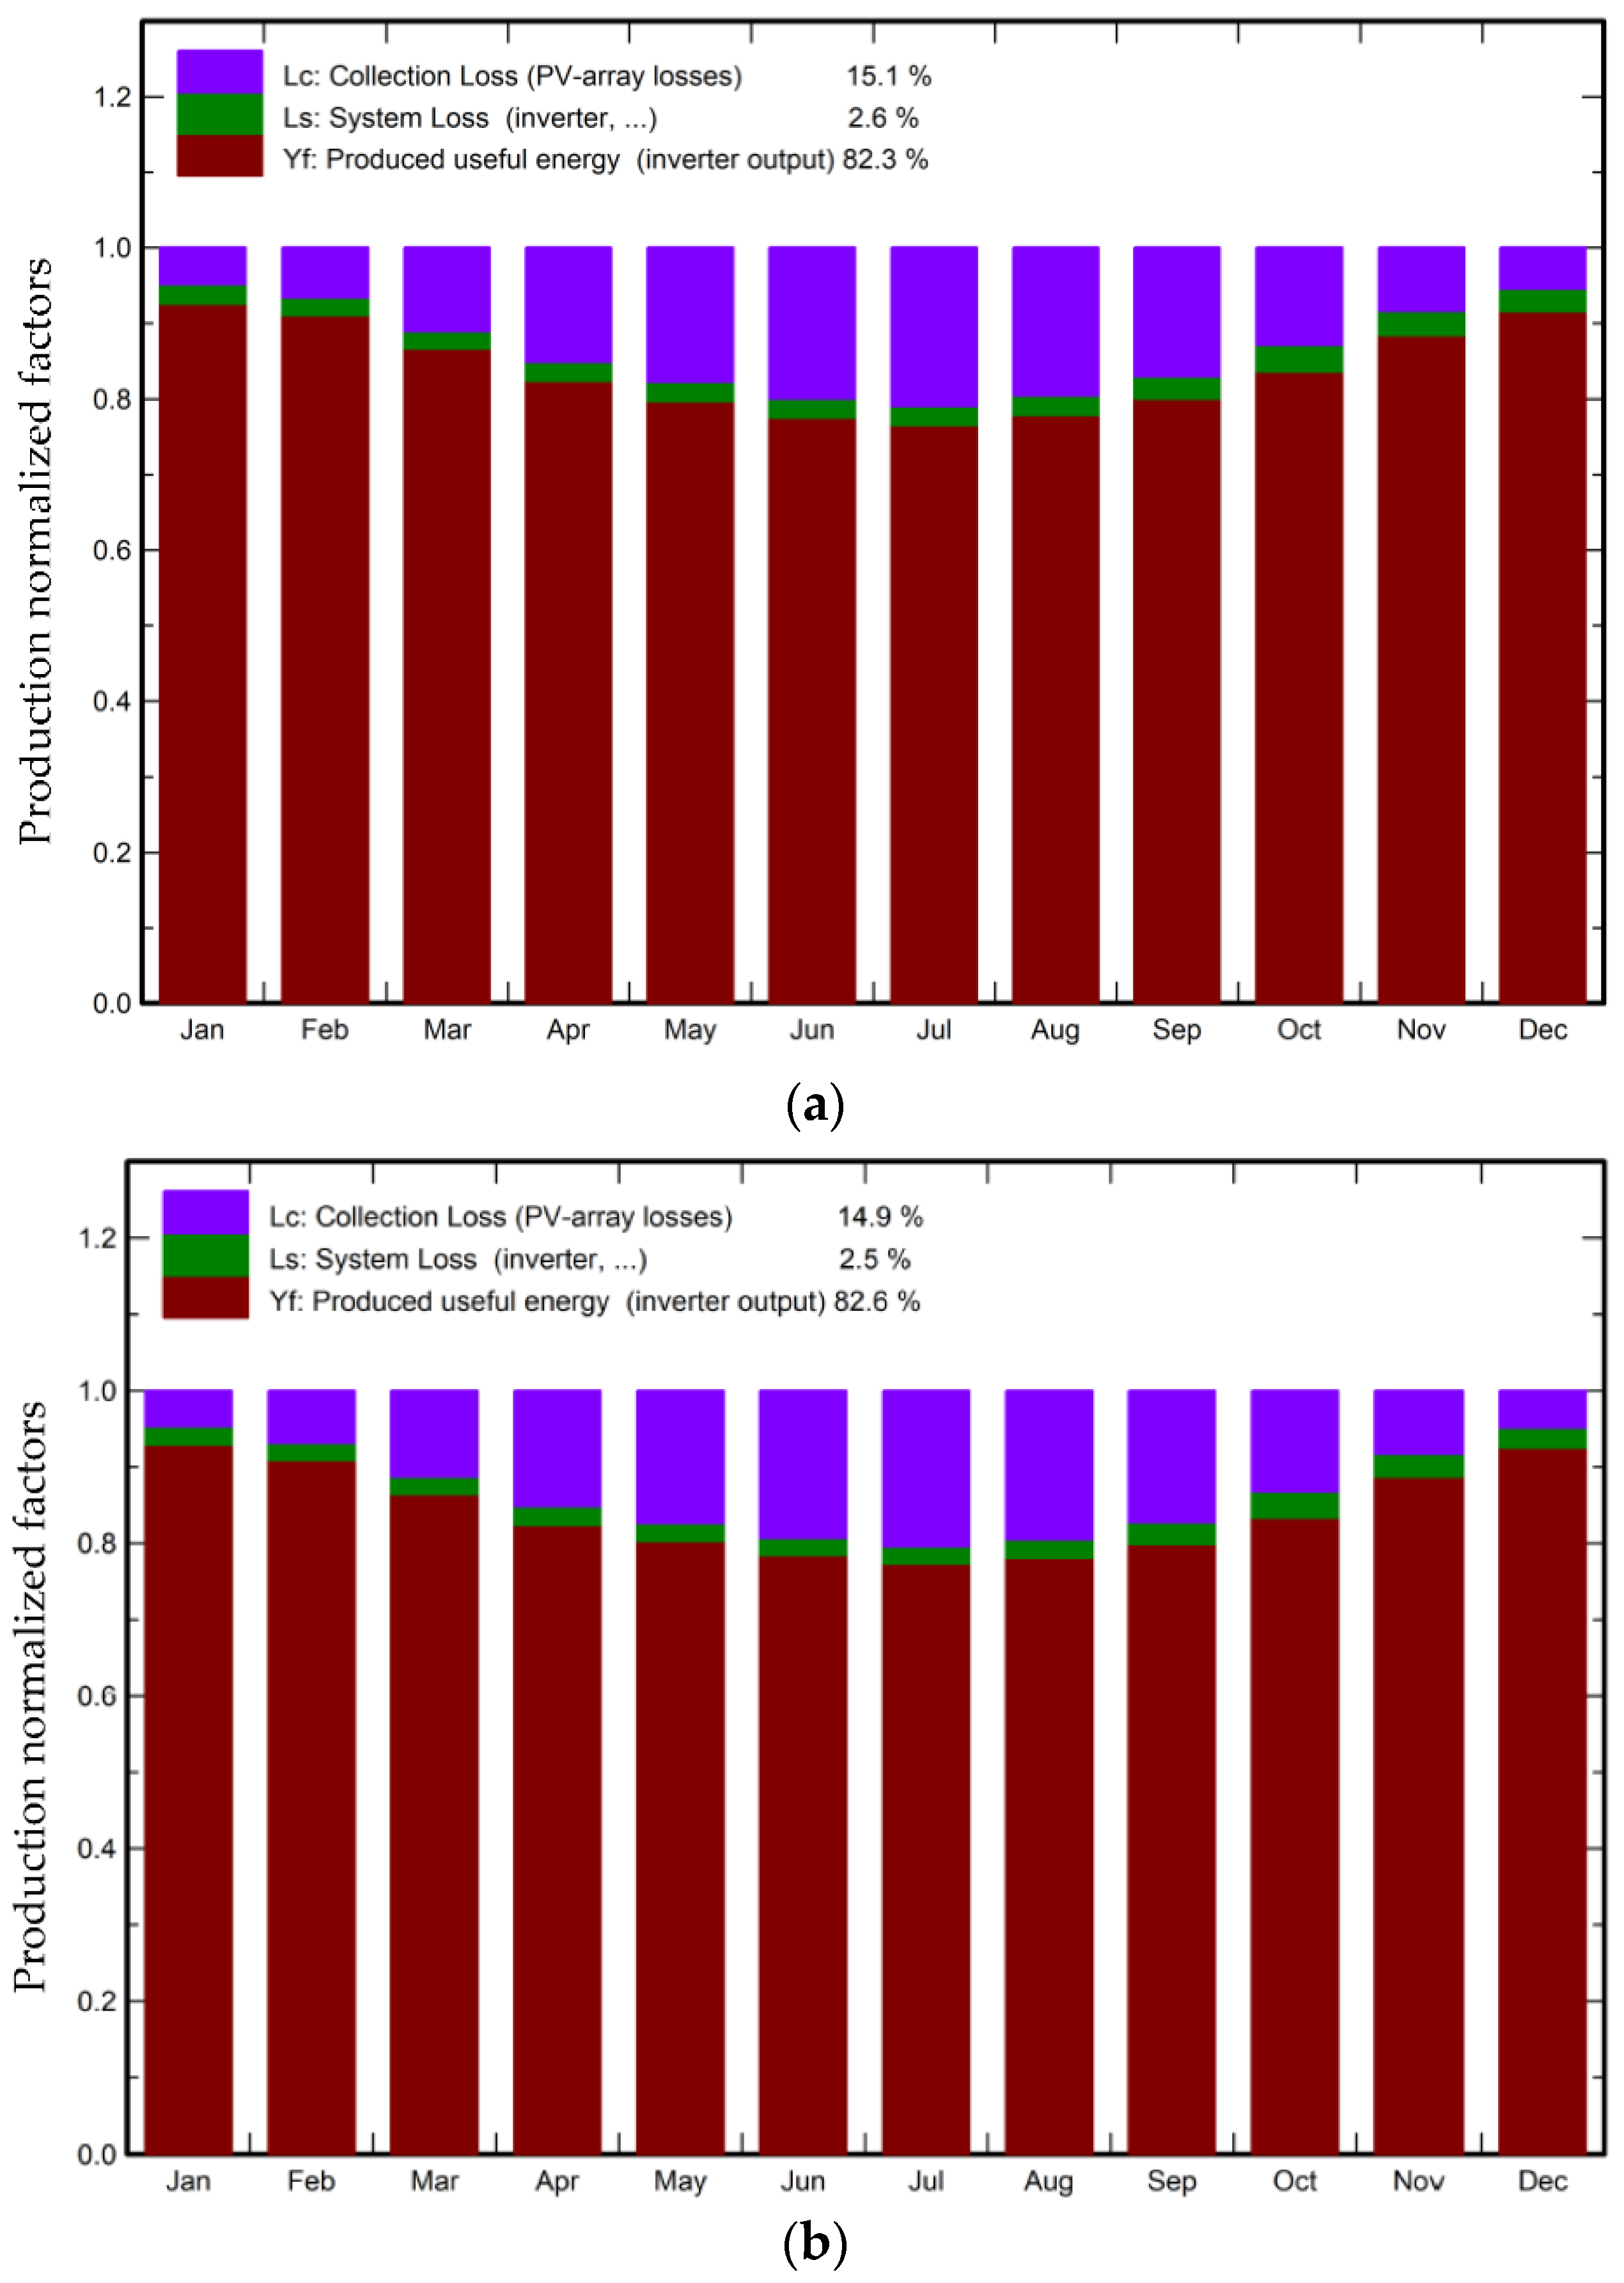
- A PR of 82.3% and 82.6% were obtained for the fixed and tracking systems, respectively. It can clearly be seen that the PR is inversely proportional to the temperature of the PV module; PR values in the winter season are higher than those in summer.
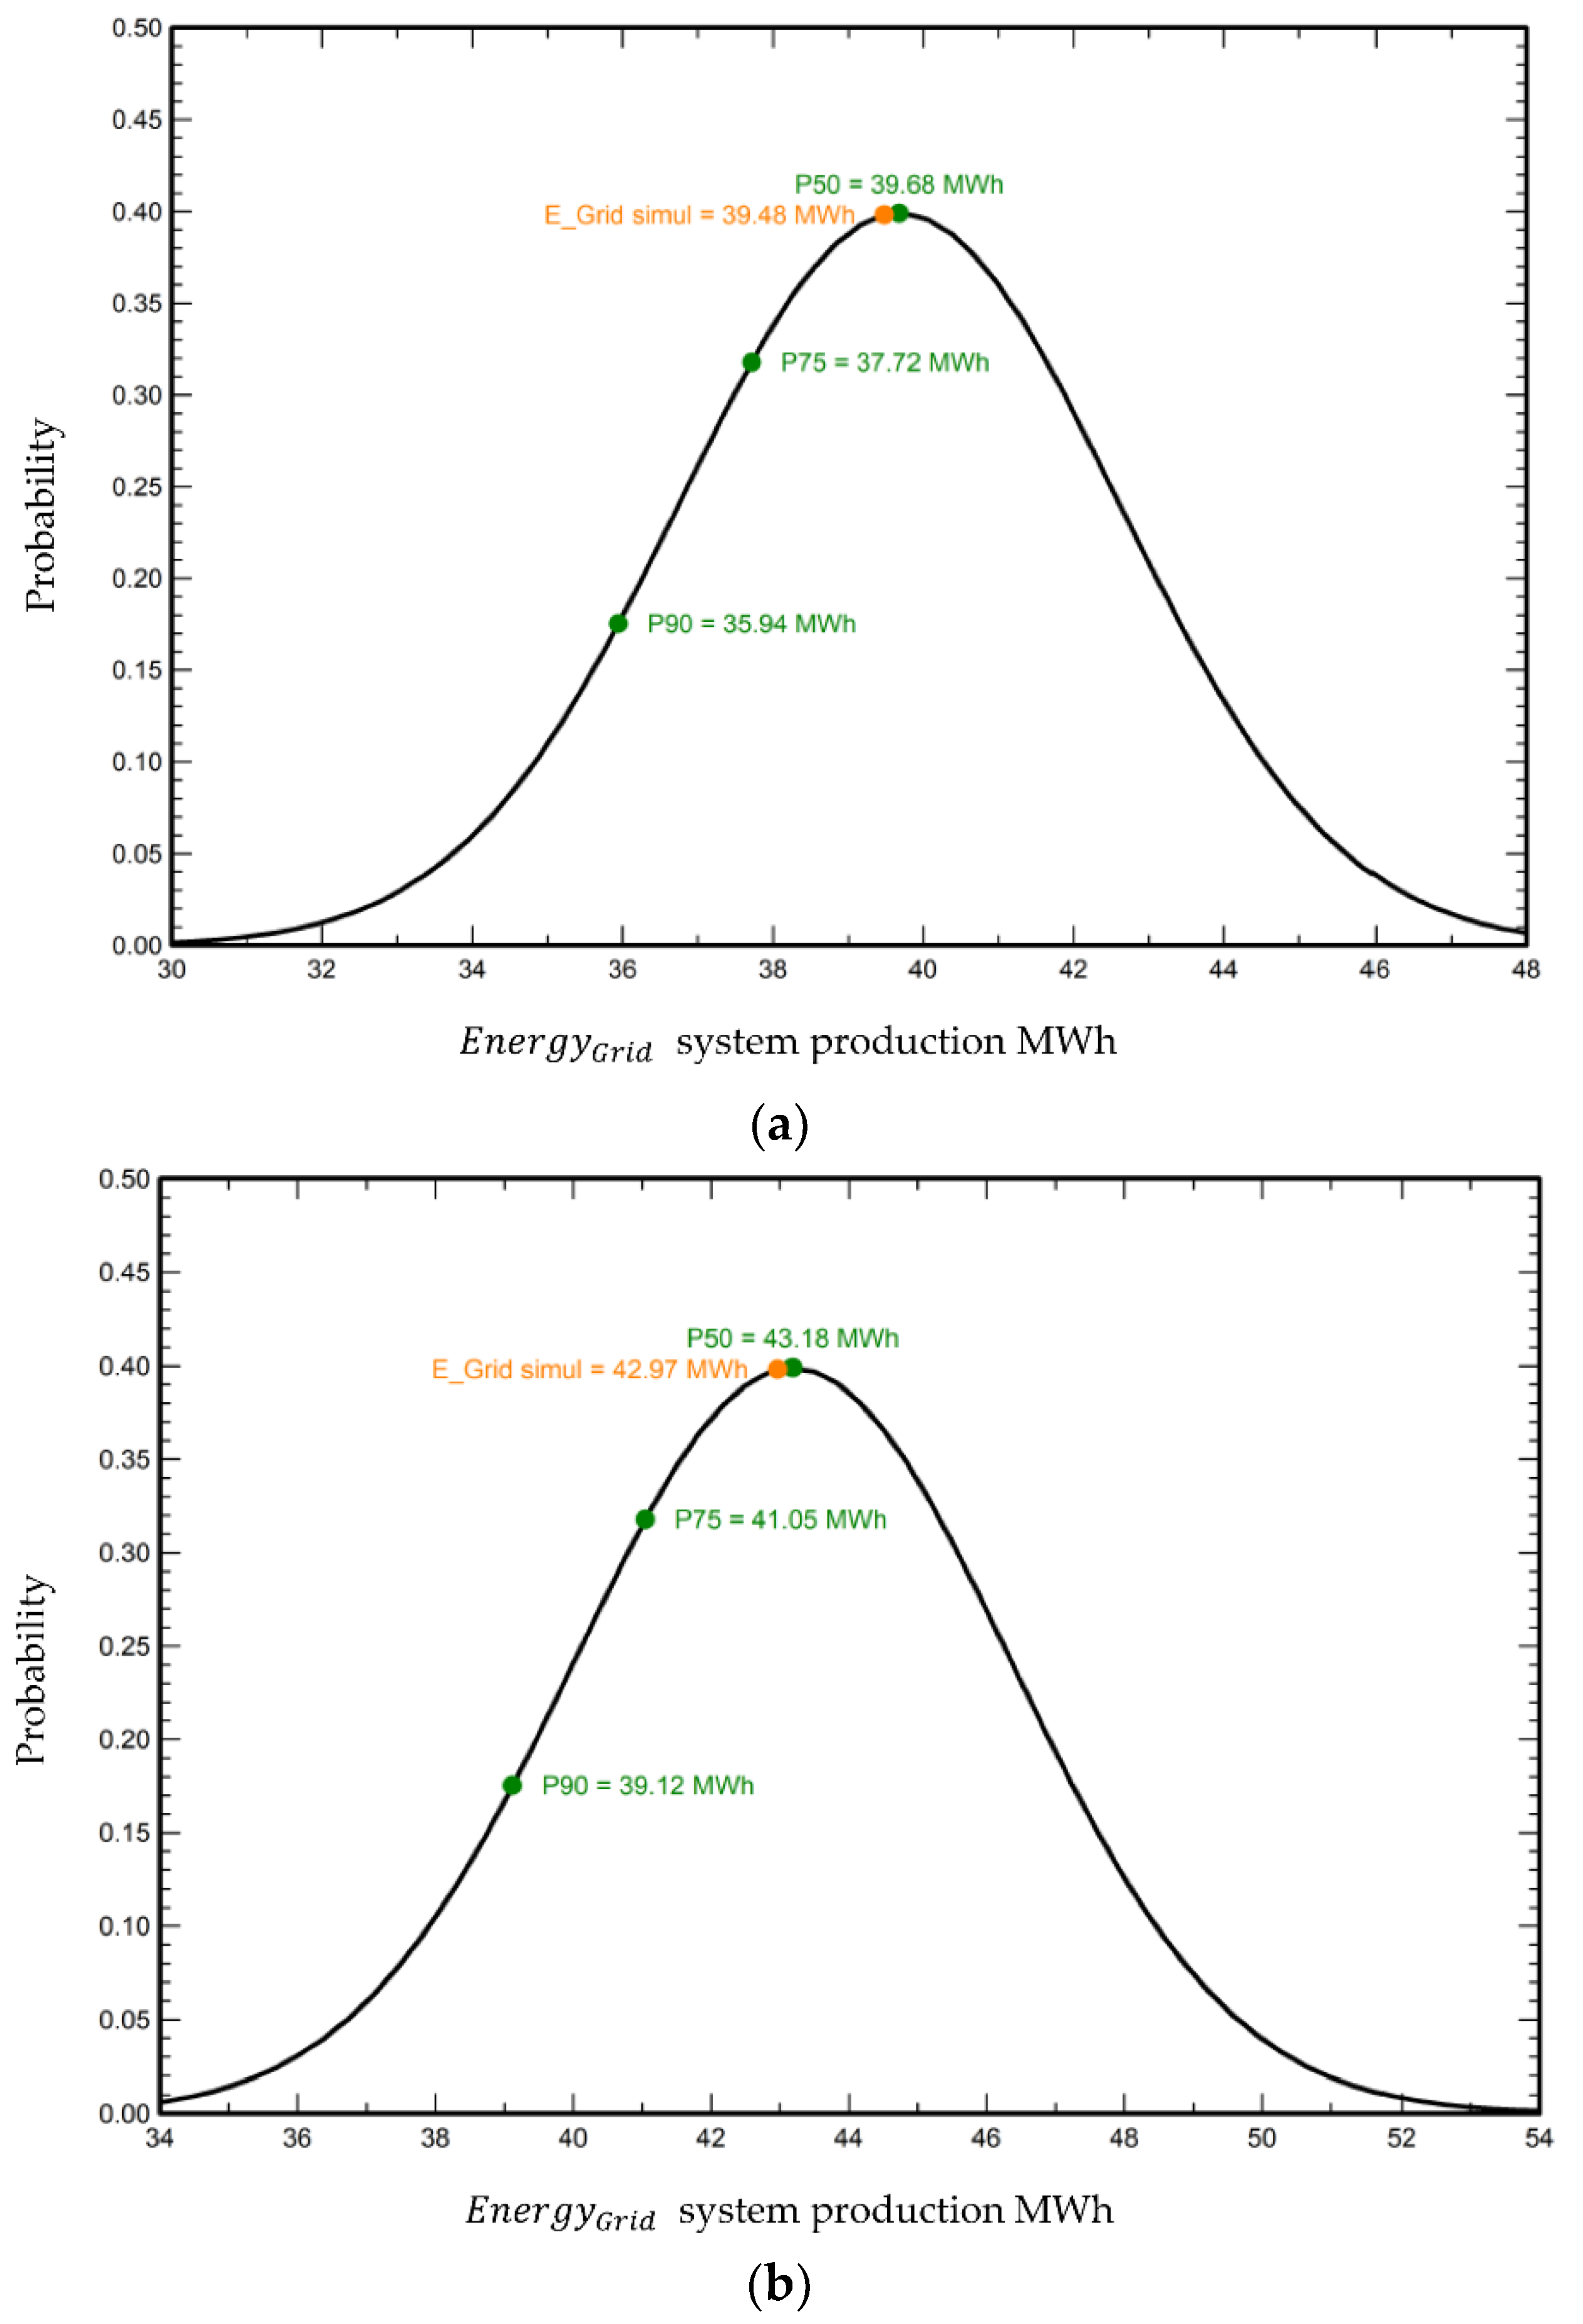
- According to the results from the simulations, the expected annual production probability for the fixed PV module for the P50, P75, and P90 is39.68 MWh, 37.72 MWh, and 35.94 MWh, respectively, with a variability of 2.91 MWh. In the case of the tracking PV module, the projected annual production probability for the P50, P75, and P90 is 43.18 MWh, 41.05 MWh, and 39.12 MWh, respectively, with a variability of 3.17 MWh.
- The PV array losses for both orientations, i.e., fixed and tracking, are expected to be 15.1% and 14.9%, respectively. The months of May to August recorded the highest array losses due to the high temperatures during those periods.
- According to the mathematical computations, we obtained 0.0011 persons/year for the fixed PV module, while 0.0012 persons/year were obtained for the tracking system. Therefore, assuming both modules operated for a lifetime of 25 years, then the fixed module will have an employment potential of 0.028 persons against 0.030 persons for the tracking PV module.
Author Contributions
Funding
Institutional Review Board Statement
Informed Consent Statement
Data Availability Statement
Acknowledgments
Conflicts of Interest
Abbreviations
| AC | Alternating current |
| CF | Capacity factor |
| CIS | Copper indium selenium |
| DC | Direct current |
| E–W | East to West |
| GHG | Greenhouse gas |
| GHI | Global horizontal irradiation |
| IAM | Incidence angle modifier |
| MPP | Maximum Power Point |
| PR | Performance ratio |
| STCs | Standard test conditions |
References
- Ahmed, N.; Naveed Khan, A.; Ahmed, N.; Aslam, A.; Imran, K.; Sajid, M.B.; Waqas, A. Techno-Economic Potential Assessment of Mega Scale Grid-Connected PV Power Plant in Five Climate Zones of Pakistan. Energy Convers. Manag. 2021, 237, 114097. [Google Scholar] [CrossRef]
- Abdin, Z.; Mérida, W. Hybrid Energy Systems for Off-Grid Power Supply and Hydrogen Production Based on Renewable Energy: A Techno-Economic Analysis. Energy Convers. Manag. 2019, 196, 1068–1079. [Google Scholar] [CrossRef]
- IPCC. Global Warming of 1.5 °C. 2018. Available online: https://www.ipcc.ch/sr15/download/ (accessed on 2 December 2021).
- Yaqoob, S.J.; Motahhir, S.; Agyekum, E.B. A New Model for a Photovoltaic Panel Using Proteus Software Tool under Arbitrary Environmental Conditions. J. Clean. Prod. 2022, 333, 130074. [Google Scholar] [CrossRef]
- Agyekum, E.B.; Nutakor, C.; Agwa, A.M.; Kamel, S. A Critical Review of Renewable Hydrogen Production Methods: Factors Affecting Their Scale-Up and Its Role in Future Energy Generation. Membranes 2022, 12, 173. [Google Scholar] [CrossRef]
- Agyekum, E.B. Techno-Economic Comparative Analysis of Solar Photovoltaic Power Systems with and without Storage Systems in Three Different Climatic Regions, Ghana. Sustain. Energy Technol. Assess. 2021, 43, 100906. [Google Scholar] [CrossRef]
- Hassan, Q.; Jaszczur, M.; Przenzak, E. Mathematical Model for the Power Generation from Arbitrarily Oriented Photovoltaic Panel. E3S Web Conf. 2017, 14, 01028. [Google Scholar] [CrossRef]
- Malvoni, M.; Leggieri, A.; Maggiotto, G.; Congedo, P.M.; De Giorgi, M.G. Long Term Performance, Losses and Efficiency Analysis of a 960kWp Photovoltaic System in the Mediterranean Climate. Energy Convers. Manag. 2017, 145, 169–181. [Google Scholar] [CrossRef]
- Kumar, N.M.; Gupta, R.P.; Mathew, M.; Jayakumar, A.; Singh, N.K. Performance, Energy Loss, and Degradation Prediction of Roof-Integrated Crystalline Solar PV System Installed in Northern India. Case Stud. Therm. Eng. 2019, 13, 100409. [Google Scholar] [CrossRef]
- Ramanan, P.; Kalidasa, M.K.; Karthick, A. Performance Analysis and Energy Metrics of Grid-Connected Photovoltaic Systems. Energy Sustain. Dev. 2019, 52, 104–115. [Google Scholar] [CrossRef]
- Ameur, A.; Sekkat, A.; Loudiyi, K.; Aggour, M. Performance Evaluation of Different Photovoltaic Technologies in the Region of Ifrane, Morocco. Energy Sustain. Dev. 2019, 52, 96–103. [Google Scholar] [CrossRef]
- Dahmoun, M.E.-H.; Bekkouche, B.; Sudhakar, K.; Guezgouz, M.; Chenafi, A.; Chaouch, A. Performance Evaluation and Analysis of Grid-Tied Large Scale PV Plant in Algeria. Energy Sustain. Dev. 2021, 61, 181–195. [Google Scholar] [CrossRef]
- Kittner, N.; Gheewala, S.H.; Kamens, R.M. An Environmental Life Cycle Comparison of Single-Crystalline and Amorphous-Silicon Thin-Film Photovoltaic Systems in Thailand. Energy Sustain. Dev. 2013, 17, 605–614. [Google Scholar] [CrossRef]
- Padmavathi, K.; Daniel, S.A. Performance Analysis of a 3MWp Grid Connected Solar Photovoltaic Power Plant in India. Energy Sustain. Dev. 2013, 17, 615–625. [Google Scholar] [CrossRef]
- Radue, C.; van Dyk, E.E. A Comparison of Degradation in Three Amorphous Silicon PV Module Technologies. Sol. Energy Mater. Sol. Cells 2010, 94, 617–622. [Google Scholar] [CrossRef]
- Kymakis, E.; Kalykakis, S.; Papazoglou, T.M. Performance Analysis of a Grid Connected Photovoltaic Park on the Island of Crete. Energy Convers. Manag. 2009, 50, 433–438. [Google Scholar] [CrossRef]
- Belmahdi, B.; Bouardi, A.E. Solar Potential Assessment Using PVsyst Software in the Northern Zone of Morocco. Procedia Manuf. 2020, 46, 738–745. [Google Scholar] [CrossRef]
- Kapoor, S.; Sharma, A.K.; Porwal, D. Design and Simulation of 60kWp Solar On-Grid System for Rural Area in Uttar-Pradesh by “PVsyst”. J. Phys. Conf. Ser. 2021, 2070, 012147. [Google Scholar] [CrossRef]
- Dellosa, J.T.; Panes, M.J.C.; Espina, R.U. Techno-Economic Analysis of a 5 MWp Solar Photovoltaic System in the Philippines. In Proceedings of the 2021 IEEE International Conference on Environment and Electrical Engineering and 2021 IEEE Industrial and Commercial Power Systems Europe (EEEIC/I CPS Europe), Bari, Italy, 7–10 September 2021; pp. 1–6. [Google Scholar]
- Chabachi, S.; Necaibia, A.; Abdelkhalek, O.; Bouraiou, A.; Ziane, A.; Hamouda, M. Performance Analysis of an Experimental and Simulated Grid Connected Photovoltaic System in Southwest Algeria. Int. J. Energy Environ. Eng. 2022. [Google Scholar] [CrossRef]
- Yadav, B.K.; Rauniyar, P.K.; Sudhakar, K.; Bajracharya, T.R.; Priya, S.S. Sustainable Green Campus in NEPAL: 3E Analysis. Int. J. Low-Carbon Technol. 2021, 16, 531–542. [Google Scholar] [CrossRef]
- Haffaf, A.; Lakdja, F.; Ould Abdeslam, D.; Meziane, R. Monitoring, Measured and Simulated Performance Analysis of a 2.4 KWp Grid-Connected PV System Installed on the Mulhouse Campus, France. Energy Sustain. Dev. 2021, 62, 44–55. [Google Scholar] [CrossRef]
- Chandel, R.; Chandel, S.S. Performance Analysis Outcome of a 19-MWp Commercial Solar Photovoltaic Plant with Fixed-Tilt, Adjustable-Tilt, and Solar Tracking Configurations. Prog. Photovolt. Res. Appl. 2022, 30, 27–48. [Google Scholar] [CrossRef]
- Kumar, P.; Pal, N.; Sharma, H. Performance Analysis and Evaluation of 10 KWp Solar Photovoltaic Array for Remote Islands of Andaman and Nicobar. Sustain. Energy Technol. Assess. 2020, 42, 100889. [Google Scholar] [CrossRef]
- Korsavi, S.S.; Zomorodian, Z.S.; Tahsildoost, M. Energy and Economic Performance of Rooftop PV Panels in the Hot and Dry Climate of Iran. J. Clean. Prod. 2018, 174, 1204–1214. [Google Scholar] [CrossRef]
- Omar, M.A.; Mahmoud, M.M. Grid Connected PV- Home Systems in Palestine: A Review on Technical Performance, Effects and Economic Feasibility. Renew. Sustain. Energy Rev. 2018, 82, 2490–2497. [Google Scholar] [CrossRef]
- Elibol, E.; Özmen, Ö.T.; Tutkun, N.; Köysal, O. Outdoor Performance Analysis of Different PV Panel Types. Renew. Sustain. Energy Rev. 2017, 67, 651–661. [Google Scholar] [CrossRef]
- Agyekum, E.B.; Kumar, N.M.; Mehmood, U.; Panjwani, M.K.; Haes Alhelou, H.; Adebayo, T.S.; Al-Hinai, A. Decarbonize Russia—A Best–Worst Method Approach for Assessing the Renewable Energy Potentials, Opportunities and Challenges. Energy Rep. 2021, 7, 4498–4515. [Google Scholar] [CrossRef]
- Statista. Russia: Installed Electricity Generation Capacity by Source. 2021. Available online: https://0-www-statista-com.brum.beds.ac.uk/statistics/1027465/russia-installed-electricity-generating-capacity-by-source/ (accessed on 27 January 2022).
- IRENA. REMAP 2030 Renewable Energy Prospects for the Russian Federation; IRENA: Abu Dhabi, United Arab Emirates, 2017; Available online: www.irena.org/remap (accessed on 15 December 2021).
- Institute of Energy Strategy. Energy Strategy of Russia for the Period Up to 2030; Institute of Energy Strategy: Moscow, Russia, 2010; p. 174. [Google Scholar]
- de Lima, L.C.; de Araújo Ferreira, L.; de Lima Morais, F.H.B. Performance Analysis of a Grid Connected Photovoltaic System in Northeastern Brazil. Energy Sustain. Dev. 2017, 37, 79–85. [Google Scholar] [CrossRef]
- Chandrika, V.; Thalib, M.M.; Karthick, A.; Sathyamurthy, R.; Manokar, A.M.; Subramaniam, U.; Stalin, B. Performance Assessment of Free Standing and Building Integrated Grid Connected Photovoltaic System for Southern Part of India. Build. Serv. Eng. Res. Technol. 2021, 42, 237–248. [Google Scholar] [CrossRef]
- Ramanan, P.; Kalidasa Murugavel, K.; Karthick, A.; Sudhakar, K. Performance Evaluation of Building-Integrated Photovoltaic Systems for Residential Buildings in Southern India. Build. Serv. Eng. Res. Technol. 2020, 41, 492–506. [Google Scholar] [CrossRef]
- Oliveira-Pinto, S.; Stokkermans, J. Assessment of the Potential of Different Floating Solar Technologies—Overview and Analysis of Different Case Studies. Energy Convers. Manag. 2020, 211, 112747. [Google Scholar] [CrossRef]
- Elhadj Sidi, C.E.B.; Ndiaye, M.L.; El Bah, M.; Mbodji, A.; Ndiaye, A.; Ndiaye, P.A. Performance Analysis of the First Large-Scale (15MWp) Grid-Connected Photovoltaic Plant in Mauritania. Energy Convers. Manag. 2016, 119, 411–421. [Google Scholar] [CrossRef]
- Li, C. Comparative Performance Analysis of Grid-Connected PV Power Systems with Different PV Technologies in the Hot Summer and Cold Winter Zone. Int. J. Photoenergy 2018, 2018, 8307563. [Google Scholar] [CrossRef]
- AL-Rasheedi, M.; Gueymard, C.A.; Al-Khayat, M.; Ismail, A.; Lee, J.A.; Al-Duaj, H. Performance Evaluation of a Utility-Scale Dual-Technology Photovoltaic Power Plant at the Shagaya Renewable Energy Park in Kuwait. Renew. Sustain. Energy Rev. 2020, 133, 110139. [Google Scholar] [CrossRef]
- Agyekum, E.B.; PraveenKumar, S.; Alwan, N.T.; Velkin, V.I.; Shcheklein, S.E. Effect of Dual Surface Cooling of Solar Photovoltaic Panel on the Efficiency of the Module: Experimental Investigation. Heliyon 2021, 7, e07920. [Google Scholar] [CrossRef] [PubMed]
- Dubey, S.; Sarvaiya, J.N.; Seshadri, B. Temperature Dependent Photovoltaic (PV) Efficiency and Its Effect on PV Production in the World—A Review. Energy Procedia 2013, 33, 311–321. [Google Scholar] [CrossRef] [Green Version]
- Agyekum, E.B.; Afornu, B.K.; Ansah, M.N.S. Effect of Solar Tracking on the Economic Viability of a Large-Scale PV Power Plant. Environ. Clim. Technol. 2020, 24, 55–65. [Google Scholar] [CrossRef]
- Hafez, A.Z.; Yousef, A.M.; Harag, N.M. Solar Tracking Systems: Technologies and Trackers Drive Types–A Review. Renew. Sustain. Energy Rev. 2018, 91, 754–782. [Google Scholar] [CrossRef]
- Eke, R.; Demircan, H. Performance Analysis of a Multi Crystalline Si Photovoltaic Module under Mugla Climatic Conditions in Turkey. Energy Convers. Manag. 2013, 65, 580–586. [Google Scholar] [CrossRef]
- Okello, D.; van Dyk, E.E.; Vorster, F.J. Analysis of Measured and Simulated Performance Data of a 3.2 kWp Grid-Connected PV System in Port Elizabeth, South Africa. Energy Convers. Manag. 2015, 100, 10–15. [Google Scholar] [CrossRef]
- Agyekum, E.B.; PraveenKumar, S.; Alwan, N.T.; Velkin, V.I.; Shcheklein, S.E.; Yaqoob, S.J. Experimental Investigation of the Effect of a Combination of Active and Passive Cooling Mechanism on the Thermal Characteristics and Efficiency of Solar PV Module. Inventions 2021, 6, 63. [Google Scholar] [CrossRef]
- Vidal, H.; Rivera, M.; Wheeler, P.; Vicencio, N. The Analysis Performance of a Grid-Connected 8.2 KWp Photovoltaic System in the Patagonia Region. Sustainability 2020, 12, 9227. [Google Scholar] [CrossRef]
- PVsyst Project Design > P50–P90 Evaluations. Available online: https://www.pvsyst.com/help/p50_p90evaluations.htm (accessed on 31 December 2021).
- PVsyst Project Design > Array and System Losses > Array Losses, General Considerations. Available online: https://www.pvsyst.com/help/array_losses_general.htm (accessed on 1 January 2022).
- Koirala, B.P.; Sahan, B.; Henze, N. Study on MPP Mismatch Losses in Photovoltaic Applications. In Proceedings of the European Photovoltaic Solar Energy Conference and Exhibition (EU PVSEC), Hamburg, Germany, 21–25 September 2009; pp. 3727–3733. [Google Scholar]
- Tapia, M. Evaluation of Performance Models against Actual Performance of Grid Connected PV Systems; Carl von Ossietzky Universität Oldenburg, Institute of Physics: Oldenburg, Germany, 2013; Available online: http://oops.uni-oldenburg.de/2433/7/Thesis_TapiaM.pdf (accessed on 2 January 2022).
- Herrmann, W.; Kämmer, S.; Yusufoglu, U. Circuit Losses in PV Arrays Caused by Electrical Mismatch of PV Modules—Impacts of Temperature Gradients and a Variation of Irradiance. In Proceedings of the 28th European Photovoltaic Solar Energy Conference and Exhibition, Villepinte, France, 30 September–4 October 2013; pp. 4127–4131. [Google Scholar]
- Shiva Kumar, B.; Sudhakar, K. Performance Evaluation of 10 MW Grid Connected Solar Photovoltaic Power Plant in India. Energy Rep. 2015, 1, 184–192. [Google Scholar] [CrossRef] [Green Version]
- Arora, R.; Arora, R.; Sridhara, S.N. Performance Assessment of 186 KWp Grid Interactive Solar Photovoltaic Plant in Northern India. Int. J. Ambient. Energy 2019, 43, 128–141. [Google Scholar] [CrossRef]
- Baqir, M.; Channi, H.K. Analysis and Design of Solar PV System Using Pvsyst Software. Mater. Today Proc. 2022, 48, 1332–1338. [Google Scholar] [CrossRef]
- Husain, A.A.F.; Phesal, M.H.A.; Ab Kadir, M.Z.A.; Ungku Amirulddin, U.A. Techno-Economic Analysis of Commercial Size Grid-Connected Rooftop Solar PV Systems in Malaysia under the NEM 3.0 Scheme. Appl. Sci. 2021, 11, 10118. [Google Scholar] [CrossRef]
- Syahindra, K.D.; Ma’arif, S.; Widayat, A.A.; Fauzi, A.F.; Setiawan, E.A. Solar PV System Performance Ratio Evaluation for Electric Vehicles Charging Stations in Transit Oriented Development (TOD) Areas. E3S Web Conf. 2021, 231, 02002. [Google Scholar] [CrossRef]
- Kumar, R.; Rajoria, C.S.; Sharma, A.; Suhag, S. Design and Simulation of Standalone Solar PV System Using PVsyst Software: A Case Study. Mater. Today Proc. 2021, 46, 5322–5328. [Google Scholar] [CrossRef]
- Duong, M.Q.; Tran, N.T.N.; Sava, G.N.; Tanasiev, V. Design, Performance and Economic Efficiency Analysis of the Photovoltaic Rooftop System. Rev. Roum. Sci. Tech. Électrotech. Énerg. 2019, 64, 229–234. [Google Scholar]
- Satish, M.; Santhosh, S.; Yadav, A. Simulation of a Dubai Based 200 KW Power Plant Using PVsyst Software. In Proceedings of the 2020 7th International Conference on Signal Processing and Integrated Networks (SPIN), Noida, India, 27–28 February 2020; pp. 824–827. [Google Scholar]
- Pietruszko, S.M.; Gradzki, M. Performance of a Grid Connected Small PV System in Poland. Appl. Energy 2003, 74, 177–184. [Google Scholar] [CrossRef]
- Adaramola, M.S.; Vågnes, E.E.T. Preliminary Assessment of a Small-Scale Rooftop PV-Grid Tied in Norwegian Climatic Conditions. Energy Convers. Manag. 2015, 90, 458–465. [Google Scholar] [CrossRef]
- Ayompe, L.M.; Duffy, A.; McCormack, S.J.; Conlon, M. Measured Performance of a 1.72 kW Rooftop Grid Connected Photovoltaic System in Ireland. Energy Convers. Manag. 2011, 52, 816–825. [Google Scholar] [CrossRef] [Green Version]
- Milosavljević, D.D.; Pavlović, T.M.; Piršl, D.S. Performance Analysis of A Grid-Connected Solar PV Plant in Niš, Republic of Serbia. Renew. Sustain. Energy Rev. 2015, 44, 423–435. [Google Scholar] [CrossRef]
- Adaramola, M.S. Techno-Economic Analysis of a 2.1kW Rooftop Photovoltaic-Grid-Tied System Based on Actual Performance. Energy Convers. Manag. 2015, 101, 85–93. [Google Scholar] [CrossRef]
- Chauhan, A.; Saini, R.P. Techno-Economic Feasibility Study on Integrated Renewable Energy System for an Isolated Community of India. Renew. Sustain. Energy Rev. 2016, 59, 388–405. [Google Scholar] [CrossRef]
- Baruah, A.; Basu, M.; Amuley, D. Modeling of an Autonomous Hybrid Renewable Energy System for Electrification of a Township: A Case Study for Sikkim, India. Renew. Sustain. Energy Rev. 2021, 135, 110158. [Google Scholar] [CrossRef]


| Model | AE 300DGM6-60 (1500) |
| Module type | Si-mono |
| Unit nominal power | 300 Wp |
| Nominal (STC) | 36.0 kWp |
| Pmpp | 32.3 kWp |
| Cell area | 177 m2 |
| Module area | 197 m2 |
| Efficiency | 18.38% |
| Global Horizontal, kWh/m2 | Diffuse Horizontal, kWh/m2 | T_amb, °C | Global Eff, kWh/m2 | GlobInc, kWh/m2 | Energy Array, MWh | E_Grid, MWh | PR | ||||||
|---|---|---|---|---|---|---|---|---|---|---|---|---|---|
| Fixed | Tracking | Fixed | Tracking | Fixed | Tracking | Fixed | Tracking | Tracking | Fixed | ||||
| Jan | 19.9 | 10.17 | −14.57 | 58.0 | 68.5 | 60.9 | 71.3 | 2.087 | 2.446 | 2.032 | 2.384 | 0.929 | 0.926 |
| Feb | 42.8 | 16.23 | −13.04 | 96.2 | 106.6 | 101.0 | 111.3 | 3.394 | 3.734 | 3.310 | 3.642 | 0.909 | 0.911 |
| Mar | 90.8 | 33.36 | −4.61 | 144.6 | 148.5 | 152.4 | 156.4 | 4.880 | 4.994 | 4.754 | 4.865 | 0.864 | 0.867 |
| Apr | 117.8 | 52.17 | 3.92 | 137.9 | 141.2 | 146.1 | 149.9 | 4.467 | 4.579 | 4.333 | 4.446 | 0.824 | 0.824 |
| May | 152.6 | 77.64 | 12.05 | 147.5 | 162.6 | 156.4 | 172.6 | 4.634 | 5.136 | 4.489 | 4.991 | 0.803 | 0.797 |
| Jun | 168.1 | 76.44 | 16.66 | 154.5 | 178.0 | 163.9 | 188.6 | 4.725 | 5.481 | 4.576 | 5.329 | 0.785 | 0.776 |
| Jul | 163.9 | 78.29 | 19.14 | 154.9 | 174.1 | 164.3 | 184.7 | 4.680 | 5.291 | 4.531 | 5.140 | 0.773 | 0.766 |
| Aug | 125.8 | 69.21 | 16.66 | 130.7 | 137.1 | 138.6 | 145.6 | 4.014 | 4.222 | 3.885 | 4.093 | 0.781 | 0.779 |
| Sep | 74.5 | 39.26 | 9.94 | 93.8 | 94.3 | 99.3 | 99.8 | 2.965 | 2.974 | 2.862 | 2.870 | 0.799 | 0.801 |
| Oct | 39.8 | 26.93 | 2.66 | 57.3 | 58.4 | 60.5 | 61.4 | 1.896 | 1.920 | 1.821 | 1.844 | 0.834 | 0.837 |
| Nov | 19.7 | 11.85 | −5.47 | 44.0 | 49.7 | 46.3 | 51.8 | 1.527 | 1.711 | 1.473 | 1.655 | 0.887 | 0.884 |
| Dec | 12.8 | 7.59 | −11.64 | 40.9 | 49.4 | 43.0 | 51.3 | 1.463 | 1.758 | 1.417 | 1.710 | 0.925 | 0.916 |
| Year | 1028.4 | 499.14 | 2.73 | 1260.3 | 1368.5 | 1332.6 | 1444.9 | 40.732 | 44.247 | 39.483 | 42.970 | 0.826 | 0.823 |
| Location | Plant Capacity | Solar Irradiation (kWh/m2) | Energy to Grid (MWh) | PR, % | Degradation Loss, % | Ref |
|---|---|---|---|---|---|---|
| India | 10 MW | 1940 | 15 798.192 | 86.12 | - | [52] |
| India | 186 kW | 1821 | 318.52 | 85.6 | - | [53] |
| Afghanistan | 700 kW | 1998 | 1266.1 | 79.7 | 1.50 | [54] |
| Chile | 8.2 kW | - | 6.7780 | 85.5 | - | [46] |
| Malaysia | 380 kW | 1631 | 495.39 | 80.3 | 3.81 | [55] |
| India | 200 kW | 1820.7 | 292.954 | 77.27 | 2.5 | [9] |
| Indonesia | 41.1 kW | 1732 | 74.3 | 82.69 | - | [56] |
| India | 230 W | 1911 | 1.068 | 72.8 | 1.5 | [57] |
| Vietnam | 2 kW | 1616 | 2.5699 | 76.9 | 2.0 | [58] |
| Dubai | 200 kW | 2000 | 352.62 | 81.7 | - | [59] |
| Poland | 1 kW | - | 0.83 | 60–80 | - | [60] |
| Norway | 220–240 W | - | 11.92 | 83.03 | - | [61] |
| Ireland | 1.72 kW | 1043.1 | - | 81.5 | - | [62] |
| Serbia | 2 kW | - | - | 93.6 | - | [63] |
| Norway | 2.1 kW | - | 1.93 | - | - | [64] |
| Fixed tilted plane | 36 kW | 1028 | 39.48 | 82.3 | 3.82 | Current study |
| Tracking system | 36 kW | 1028 | 42.97 | 82.6 | 3.82 | Current study |
Publisher’s Note: MDPI stays neutral with regard to jurisdictional claims in published maps and institutional affiliations. |
© 2022 by the authors. Licensee MDPI, Basel, Switzerland. This article is an open access article distributed under the terms and conditions of the Creative Commons Attribution (CC BY) license (https://creativecommons.org/licenses/by/4.0/).
Share and Cite
Agyekum, E.B.; Mehmood, U.; Kamel, S.; Shouran, M.; Elgamli, E.; Adebayo, T.S. Technical Performance Prediction and Employment Potential of Solar PV Systems in Cold Countries. Sustainability 2022, 14, 3546. https://0-doi-org.brum.beds.ac.uk/10.3390/su14063546
Agyekum EB, Mehmood U, Kamel S, Shouran M, Elgamli E, Adebayo TS. Technical Performance Prediction and Employment Potential of Solar PV Systems in Cold Countries. Sustainability. 2022; 14(6):3546. https://0-doi-org.brum.beds.ac.uk/10.3390/su14063546
Chicago/Turabian StyleAgyekum, Ephraim Bonah, Usman Mehmood, Salah Kamel, Mokhtar Shouran, Elmazeg Elgamli, and Tomiwa Sunday Adebayo. 2022. "Technical Performance Prediction and Employment Potential of Solar PV Systems in Cold Countries" Sustainability 14, no. 6: 3546. https://0-doi-org.brum.beds.ac.uk/10.3390/su14063546