Article

Research on the Coordination between Agricultural Production and Environmental Protection in Kazakhstan Based on the Rationality of the Objective Weighting Method

1
College of Agronomy, Northwest A&F University, Xianyang 712100, China
2
Shaanxi Engineering Research Center of Circular Agriculture, Xianyang 712100, China
3
College of Agronomy, S. Seifullin Kazakh Agro-Technical University, Nur-Sultan 010000, Kazakhstan
4
College of Pharmacy, Astana Medical University, Nur-Sultan 010000, Kazakhstan
*
Author to whom correspondence should be addressed.
Sustainability 2022, 14(6), 3700; https://0-doi-org.brum.beds.ac.uk/10.3390/su14063700
Submission received: 23 February 2022 / Revised: 16 March 2022 / Accepted: 18 March 2022 / Published: 21 March 2022
(This article belongs to the Section Sustainable Agriculture)

Abstract

:
In the context of sustainable development, agricultural production and environmental protection are inseparable, and environmental quality directly affects regional agricultural production safety. Kazakhstan is the largest food producer and exporter in Central Asia, and the quality of its agricultural environment is of great significance to international food security. This study focuses on the rationality of the entropy weight, factor weight, and CRITIC weight in the agricultural environmental evaluation within the common objective weight method, and comprehensively evaluates the coordination of environmental protection and agricultural production in Kazakhstan. The results show that (1) CRITIC weights are the most stable, followed by factor weights, while entropy weighting is the most unstable; objective weighting methods have their limitations and must be related to actual conditions and subjective experience. (2) The level of environmental protection and the degree of coordination are most problematic near the Aral Sea, followed by the remaining western region; the results reveal that these evaluation indexs are also insufficient at Kostany and Karagandy in the central region; this is caused by historical issues, climate change, natural conditions, and agricultural management patterns. Investment in environmental protection and agricultural production management should be coordinated in a targeted manner. (3) Except for the areas near the Aral Sea, the level of agricultural production in other states is very promising. This research serves as a reference for environmental assessment research, environmental governance investment, and agricultural production management in Kazakhstan.

1. Introduction

After the conclusion of the millennium development goals (MDGs) in 2015, the United Nations established sustainable development goals (SDGs) to guide global development between 2015 and 2030 [1]. The realization of food security and the promotion of sustainable agriculture are still the focus of the international community [2]. Population growth and climate change have put forward higher demands on food production and greater pressure on the natural environment and resources [3]. The average global surface temperature is expected to rise by 1.7–4.8 °C by the end of the 21st century [4], and the global population could grow to around 9.7 billion in 2050 [5]. On the other hand, environmental degradation and pollution will adversely affect agricultural production and development. High external input and resource-intensive agricultural systems have caused large-scale deforestation, water shortage, biodiversity loss, soil depletion, and high greenhouse gas emissions [6]. In recent years, exploring the interactive relationship between the regional environment and agricultural production has become one of the core issues of sustainable development [7]. While increasing agricultural productivity and economic benefits, people have to give more consideration to environmental health.
According to the “Strategy Kazakhstan 2050: the new political course of the established state”, issued by the President of the Republic of Kazakhstan, the threat to global food security is one of the challenges of the 21st century. Kazakhstan cares about solving the problems of environmental protection and the rational use of natural resources to produce superior agricultural products. In recent years, Kazakhstan has placed unprecedented emphasis on sustainable development. In 2018, it reached an agreement with the OECD to integrate the measurement of “green” growth into the regular reporting system, realize the concept of “green economy” and assess progress to achieve “green” growth [8]. Regarding green agricultural production, Kazakhstan’s Land Law and Environmental Law stipulate the use of pesticides and the scope of arable land in detail [9]. In the transition to green agriculture, more attention should be paid to the effective use and protection of land and water, the use of fewer fertilizers and pesticides, and biological (organic) plant protection methods to comprehensively control pests and erosion.
Kazakhstan is the largest food producer in Central Asia and is reputed to be the “world’s breadbasket” [10]. According to FAO statistics [11], Kazakhstan produced 11.30 million tons of wheat, 3.83 million tons of barley, 1.01 million tons of linseed, and exported 1.64 million tons of barley, 1.57 million tons of flour, and 5.38 million tons of wheat in 2019. Its sustainable agricultural development is of great significance to the world’s food security. Research on sustainable agricultural development in Kazakhstan has focused on water management, policy adjustments, and Aral Sea ecology [12], and has relied upon remote sensing technology [13,14]. There are, however, few studies on agricultural environmental health evaluation systems. This study was performed on the rationality of common objective weighting methods in agricultural environmental evaluation, as well as the coordination of environmental protection and agricultural production in Kazakhstan. The results can serve as points of reference for researchers in the environmental assessment system, for Kazakhstan’s environmental protection management and investors, and for agricultural production management departments.

2. Literature Review

2.1. Weighting Assignment Method (WAM)

Choosing WAMs is an important step in evaluation research. At present, WAMs popularly used in academia are divided into subjective and objective categories.
Commonly used in subjective weighting assignment methods (SWAMs) are the analytic hierarchy process (AHP), gray correlation degree (GCD), and induced ordered weighted averaging (IOWA) [15]. In a land evaluation for sustainable development of Himalayan agriculture, the AHP empowerment section subjectively explained the relationship between scores and indicator relationships in detail [16]. In a risk evaluation of an agricultural drought disaster in Henan Province, China, the subjective resolution coefficient ρ was set to 0.5 when processing gray correlation weights [17].
Objective weighting assignment methods (OWAMs) are more diverse, among which are CRITIC, indicator weights on principal component analysis (PCAW), factor analysis (FAW, principal component rotation of PCA), entropy (EW), coefficient of variation (CVW), etc., [18]. Abdel-Basset and Mohamed used the TOPSIS–CRITIC model to evaluate the sustainability of the supply chain for three telecommunication equipment categories [19]. Ke et al. combined the PCAW and grey clustering model to evaluate the ecological security of 16 cities in Hubei Province, China [20]. Liu et al. used the equal weight method, EW, and mean square error method to evaluate the multidimensional rural development level. Among these methods, EW is the most widely used [21].
SWAMs better reflect the experience, preferences, and screening intentions of the evaluators, with strong flexibility but poor objectivity. OWAMs rely more on the relationship among the original data, with a stronger mathematical–theoretical basis (Table 1), and therefore, weight distribution among indicators may be inconsistent with subjective concerns or the actual situation and without reflecting the intention of decision makers. A single weight method cannot fully reflect the importance of attributes, but the combination of SWAMs and OWAMs can improve this situation.
Therefore, according to the different principles and characteristics of OWAMs, we chose CRITIC, FAW, and EW to assign weights in environmental protection investments (EPI)s, environmental protection achievements (EPAs), agricultural production rates (APRs), and agricultural economic benefits (AEBs), so as to ensure the objective rationality of primary weights. Then, we analyzed the actual production situation to choose a weight distribution from the three methods, and the four dimensions (i.e., EPI, EPA, APR, and AEB) were equally weighted.

2.2. Coordination of Environmental Protection and Agricultural Production

“Green” is the main goal of the current agricultural development. Zhao evaluated the level of green agricultural development in Henan Province, from the three aspects of environment (forest coverage, pollution control, environmental investment, etc.), production processes (pesticides, fertilizers, agricultural waste recycling, etc.), and green output (green product certification, hazardous substance detection, etc.) [22]. Yu et al. proposed the applicability of the Entropy–TOPSIS model in green development evaluation and obstacle analysis and discussed the results from four aspects: resource utilization (labor, cultivated land, water, agricultural machinery, etc.); environmental impact (chemical fertilizer, pesticide, mulch, energy consumption, etc.); ecological conservation (afforestation, soil and water treatment, protected areas, etc.); economic benefit (per capita benefit, grain yield, etc.), taking Jiangxi Province as a case study [23]. There have been many further evaluations and discussions on agricultural green development in the past five years [24,25]. However, studies on the comprehensive score of green agricultural development alone cannot well interpret the relationship between agricultural production and environmental security.
The coupling degree measures the interaction of two or more elements in a system; the coordination degree measures the coordination state of elements in a system. This means that the coupling coordination degree (CCD) considers the interaction and coordination level of elements in a system, and clearly shows the relationship between elements. In academia, the application of CCD is very extensive, especially in the study of relationships among social–economic activities [26], urbanization, development levels of various industries [27], ecological space, people’s lives, and environmental health. In a study on the temporal and spatial changes in CCD between the socio-economic and ecological environment of the Loess Plateau, the CCD level was divided into good coordination (0.8–0.9), moderate coordination (0.7–0.8), primary coordination (0.6–0.7), tiny coordination (0.5–0.6), and mild dissonance (0.4–0.5) [28]. In a CCD study of the public demand and government supply in Chinese urban agglomerations, 0–0.3 indicated a serious imbalance, 0.3–0.5 indicated a moderately low, 0.5–0.8 indicated a moderately high, and 0.8–1 indicated perfect coordination [29]. In a study on the CCD of environmental and social benefits in urban wetland parks, a CCD value between 0.55 and 0.75 was considered to reflect moderate coordination, as the average was 0.63 [30].
In this study, the final scores of EPI and EPA were averaged, which represents Kazakhstan’s efforts and achievements for environmental protection in agricultural production. The final scores of APR and AEB were averaged to represent the agricultural production capacity and economic benefits. In this way, in addition to providing an overall description of the level of green agricultural development in Kazakhstan, we also clearly explain the relationship between agricultural production and environmental protection.

3. Materials and Methods

3.1. Study Area

Kazakhstan is located at the heart of Eurasia and is divided into 14 states, with an area of 2.72 × 10⁶ km2. There are plains in the north and center, lowlands in the west, and a few mountains in the east and south. Inland rivers and lakes are rare. South Kazakhstan was renamed Turkestan in 2019.
Kazakhstan implements extensive agricultural production management, seldom uses chemical fertilizers and pesticides, and has imperfect irrigation facilities. North-Kazakhstan, Kostanay, and Akmola are cereal production bases, as they have abundant rainfall. Turkestan, Zhambyl, and Almaty are fruit and vegetable production bases, as they have high average temperatures. Along the horizontal central axis, there are vast semi-arid grasslands suitable for animal husbandry [31].

3.2. Data Collection

The selection of evaluation indicators was realized by optimizing the mature and diverse green agriculture evaluation system, combined with data from Kazakhstan’s agricultural and environmental Statistical Yearbooks from 2010 to 2019 [31,32]. Environmental protection includes investments in the improvement of climate, water, soil, and ecological zones; achievements in fallow and land recovery rates, which are both closely related to agricultural production; the status of afforestation, forest coverage, protected areas, and environmental protection agencies. In 2019, the output value of plant production was 2,817,660.6 million KZT, and the output value of animal husbandry was 2,319,496.7 million KZT, accounting for 99.21% (the remaining 0.79% referring to agricultural services) of the total agricultural output value of 5,177,893.7 million KZT. Therefore, the production efficiency of the main planting and animal husbandry products was chosen to represent the agricultural production capacity. The profitability of planting and animal husbandry, labor productivity, and the agricultural salary level was used to represent the economic benefits of agriculture. These indicators were selected because they provide a comprehensive overview of the current agricultural environment and the level of agricultural development (Table 2).

3.3. Weight Calculating Methods

Normalization of all indicators for the Matrix X was performed through the following steps:
  • Step 1: CRITIC weights [19] were determined by
C j = i = 1 n x i j x ¯ j 2 n 1   × j = 1 p 1 r j j
where Cj is the information volume of indicator j; each indicator has n data, and there are p indicators in total; xij is value i of indicator j, rjj is the correlation coefficient between indicator j and the other indicators.
C W j = C j j = 1 p C j  
where CWj is the CRITIC weight of indicator j.
  • Step 2: FA weights [20]
Factor analysis was carried out through SPSS (IBM) as follows:
C C j = f = 1 m [ P C f j C R f 2 × P V f ]  
where CCj is the comprehensive coefficient of indicator j, with m principal components; PCfj is the load of indicator j on principal component f; PVf is the variance percentage of PCf; CRf is the characteristic root of PCf.
F W j = C C j j = 1 p C C j  
where FWj is the factor analysis weight of indicator j. This ensured that the cumulative interpretation rate of m principal components reached 80%.
  • Step 3: Entropy weights [21] were determined by
E j = 1 l n   n i = 1 n x i j l n x i j
where Ej is the entropy value of indicator j.
E W j = 1 E j n j = 1 p E j
where EWj is the entropy weight of indicator j.
  • Step 4: Calculation of the CCD
S E P = j 1 = 1 p w j 1 x j 1 × 100 / 2
where SEP is the score of environmental protection, wj1 is the weight of EPI and EPA indicators, and xj1 is the corresponding indicator data.
S A P = [ j 2 = 1 p w j 2 x j 2 × 100 ] / 2
where SAP is the score of agricultural production, wj2 is the weight of APR and AEB indicators, and xj2 is the corresponding indicator data.
We normalized SEP and SAP to obtain SEP′ and SAP′ as follows:
C C D = 2 × [ S E P × S A P S E P + S A P 2 ] 1 / 2 × α S E P + β S A P      
where CCD is the degree of coupling and coordination between environmental protection and agricultural production; α and β are the evaluation coefficients, generally taken as 0.5.
In the present study, “RStudio” (https://www.rstudio.com/products/rstudio/download/ (accessed on 20 June 2021)) and “Excel” (Microsoft Corp., Redmond, WA, USA) were used for all data calculations, while “ArcGIS” (Esri, Redlands, CA, USA) and “Origin” (OriginLab, Northampton, MA, USA) were used to plot the drawings.

4. Results

4.1. Weight Selection Based on the Actual Production Situation

For EPI, the CRITIC method results presented the most reasonable allocation. From 2010 to 2019, Kazakhstan invested an average of 61,050.18 million KZT in CSAQ, 21,040.26 million KZT in WSI, and 1177.91 million KZT in HPR annually. Thus, investments in the safety of climate and air (CSAQ) were most important in agriculture-related environmental protection in Kazakhstan, followed by water and soil improvement (WSI), while the least was invested in habitat (HPR). Only CW fit the actual situation; EW considers the volatility of the indicator itself but without the relationship among indicators, while FAW considers the relationship among indicators from a general perspective, which obscures the importance of CSAQ and WSI. They are likely to be represented because of their high correlation with other indicators (changes in CSAQ, WSI, ANF, and HPR are more consistent) (Figure 1).
For EPA, the FW allocation results were more appropriate. The land recovery rate (LR) and fallow rate (FR), which are of greater relevance to agricultural production, should occupy more important positions, which is consistent with the purpose of this study. In addition, the forest coverage rate (FCR) and the proportion of nature reserves (NRP) hardly fluctuated between 2010 and 2019. Kazakhstan’s FCR was 4.5% in 2010 and 4.8% in 2019, rising steadily over the past decade. The NRP was 8.45% in 2010 and 8.94% in 2019, rising in volatility. EW exaggerated the impact of NPR on agricultural production due to its volatility; in comparison, CW over-measured the independence among indicators and exaggerated the impact of FCR on agricultural production.
For APR, CW was selected. As mentioned in the indicator selection instructions in Section 3.1, planting contributed more than animal husbandry to the agricultural development in Kazakhstan. From 2015 to 2019, the average annual output value of the planting industry was 2,270,226.3 million KZT, and that of animal husbandry was 1,854,466.2 million KZT. The output value of the planting industry was about 1.2 times that of animal husbandry. In addition, it is extremely difficult to improve the productivity of animal husbandry. The pastures in Kazakhstan are mainly distributed in the horizontal central area. In 2019, the grazing area of Karagandy, Aktobe, and East-Kazakhstan accounted for 43% of the total. However, the semi-desert and semi-savannah areas are not suitable to support the excessive demand for forage; the fodder planted area reached 2178.8 kha. Thus, changes in crop yields could be more easily achieved and should be more impactful than changes in livestock yields. Only CW fit this actual situation. EW did not capture the relationship among indicators because the statistical method to determine egg yields is different, so the volatility is large, causing interference. This widely diverges from the actual production. In fact, the total economic output of poultry farming only accounts for 27% of the livestock industry. FW weakens the effects of cereals and F&V because of their strong association and their yields having higher environmental requirements than those from potatoes (Figure 2).
For AEB, the FW program was the most suitable. The economic volume of the planting industry was 1.2 times that of animal husbandry, so the profitability of the planting industry has a higher probability of affecting the economic benefits of Kazakhstan’s agriculture. The allocation of CW was not in line with reality. However, EW was suboptimal with respect to the different statistical methods for the agricultural wage level (LP).

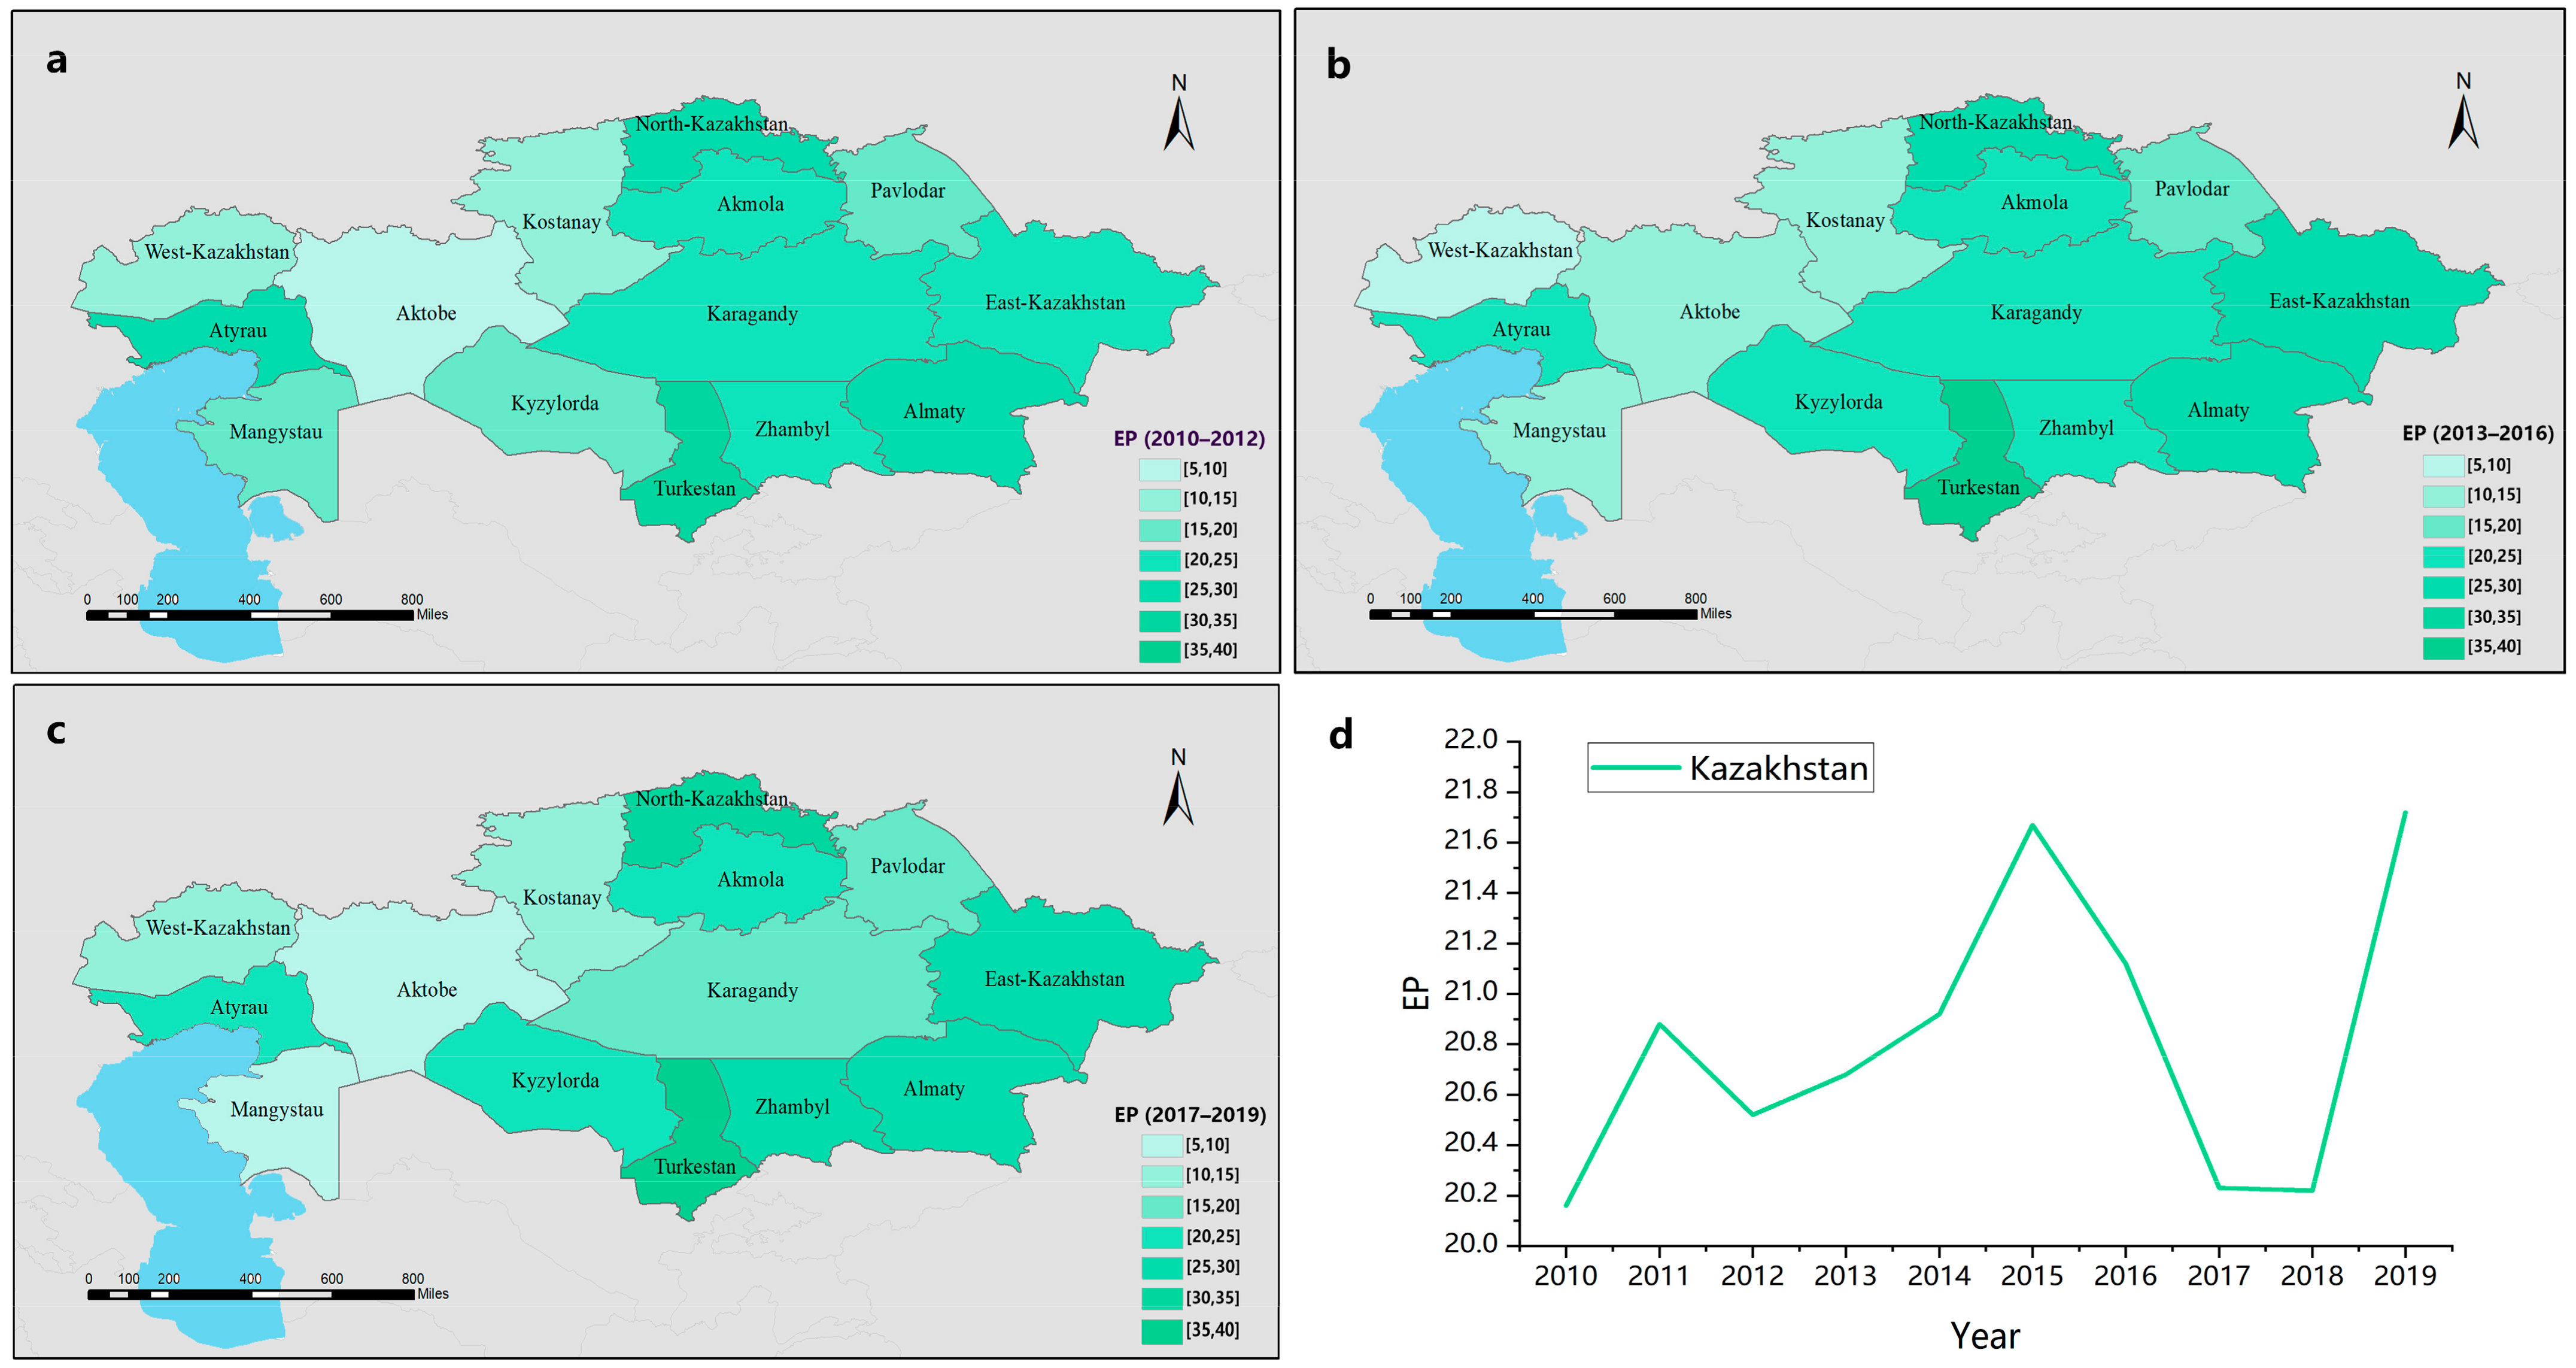
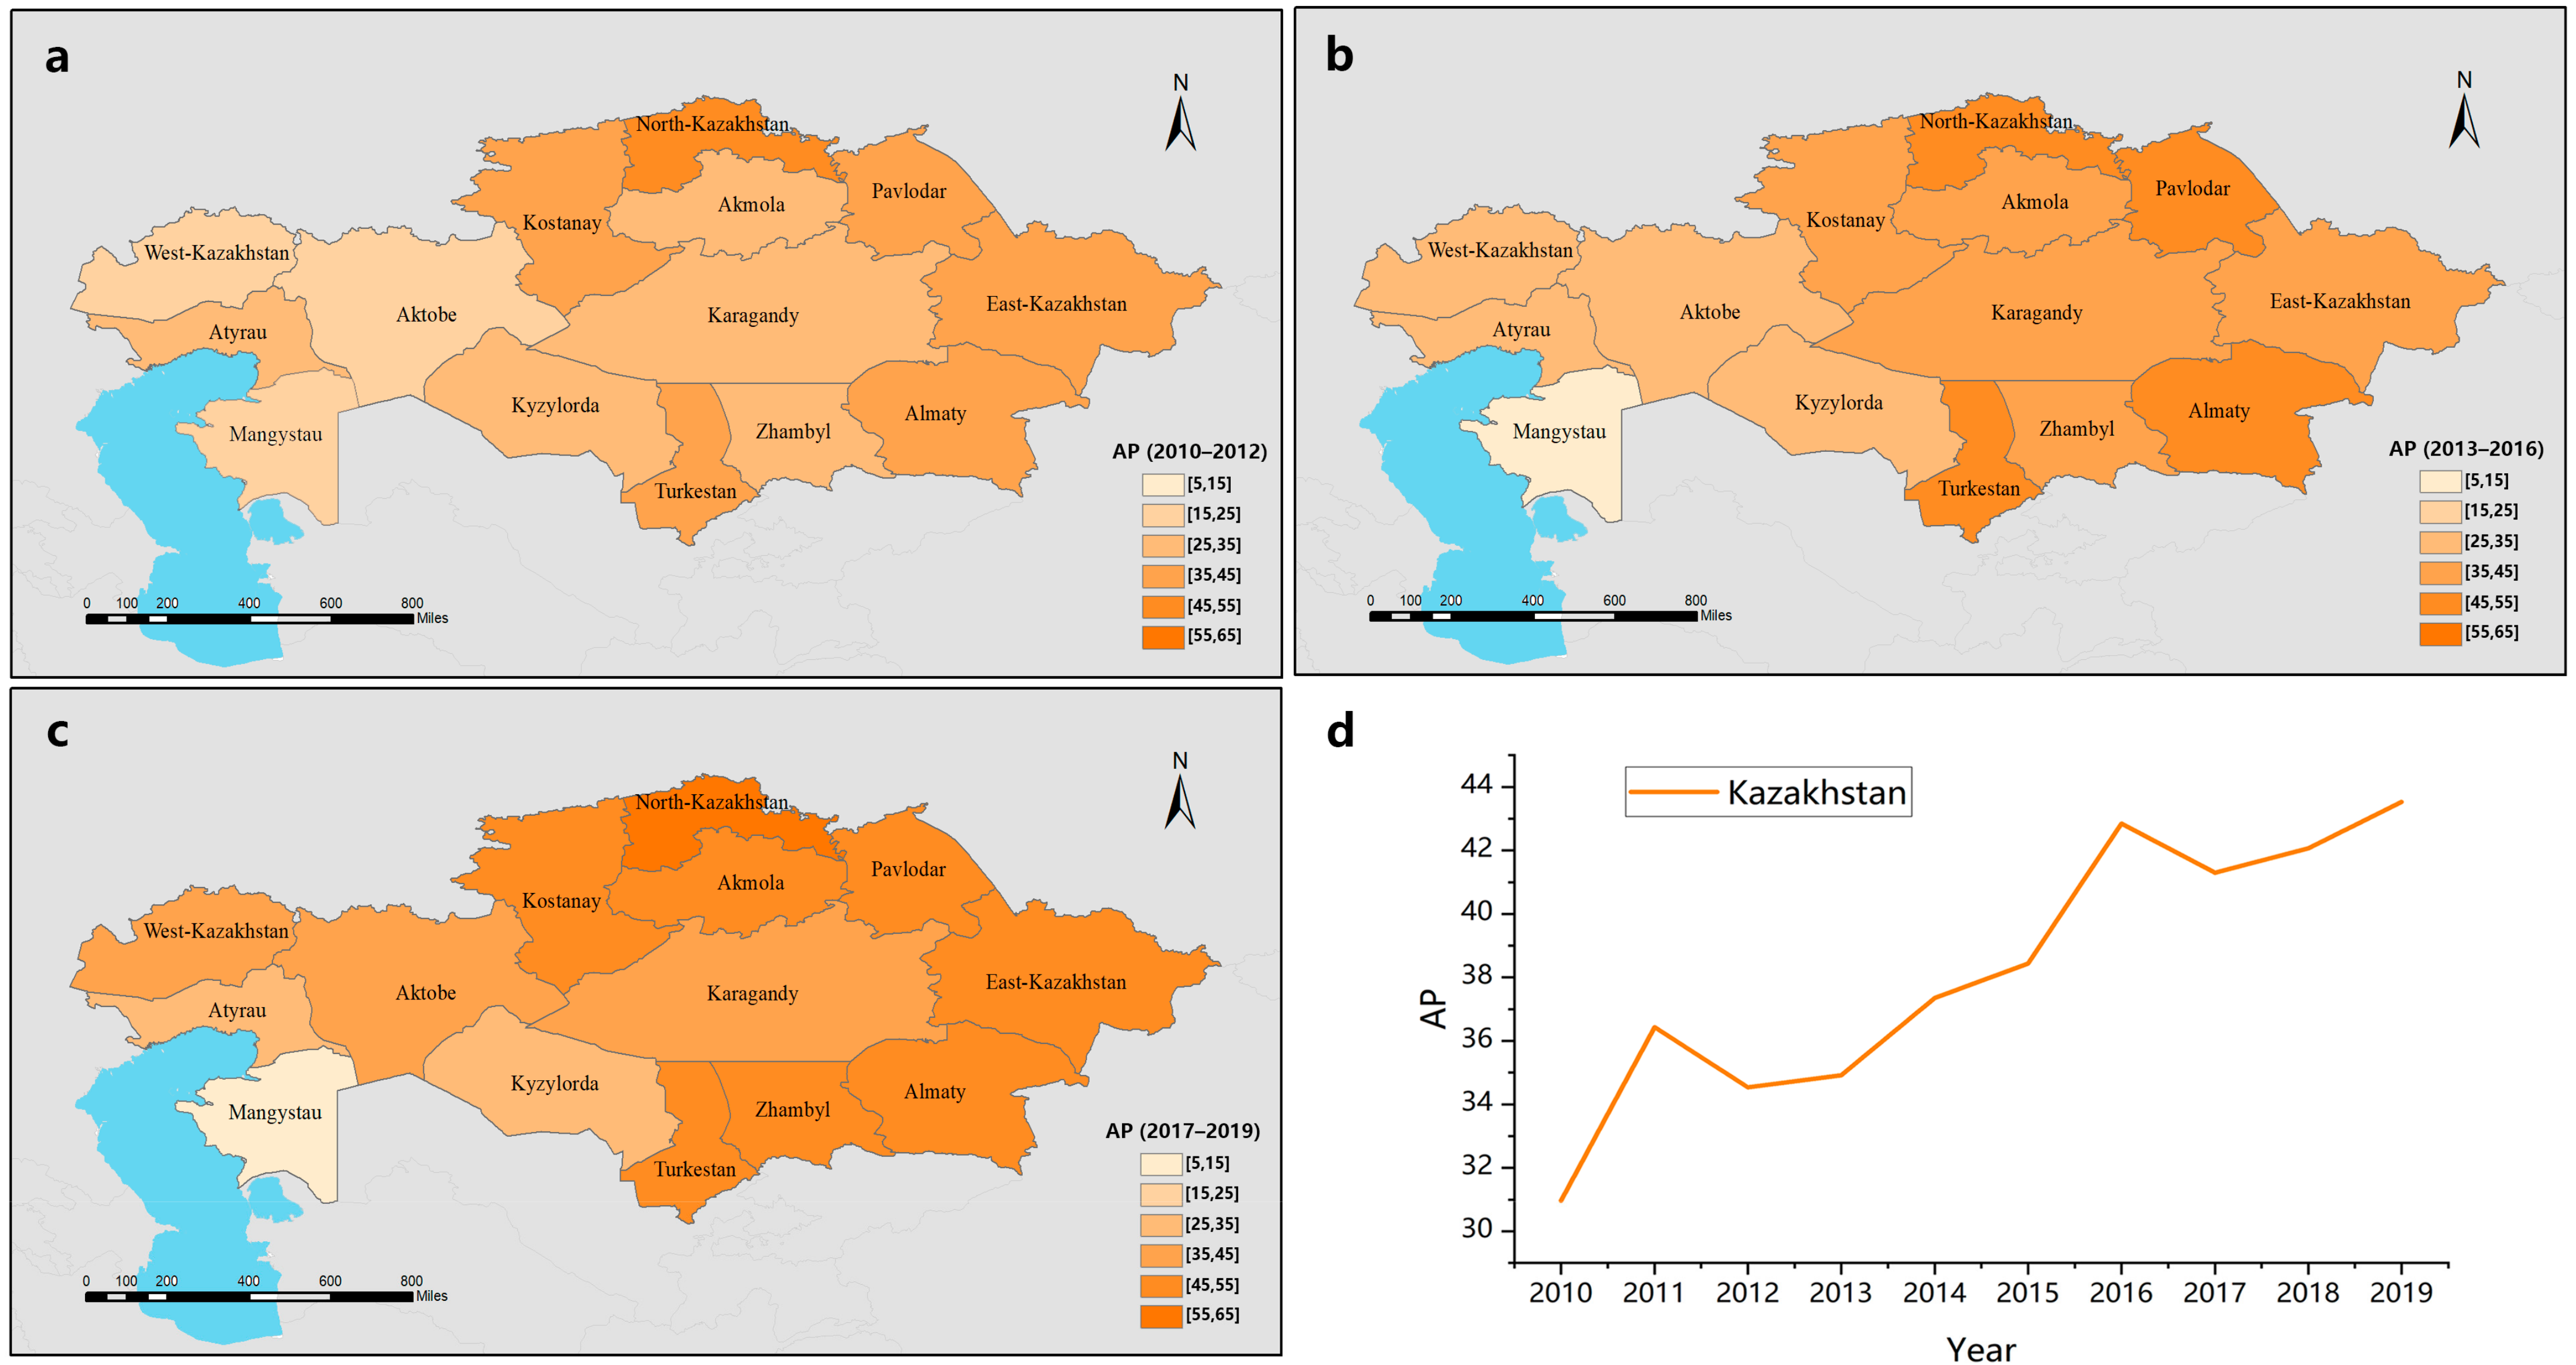
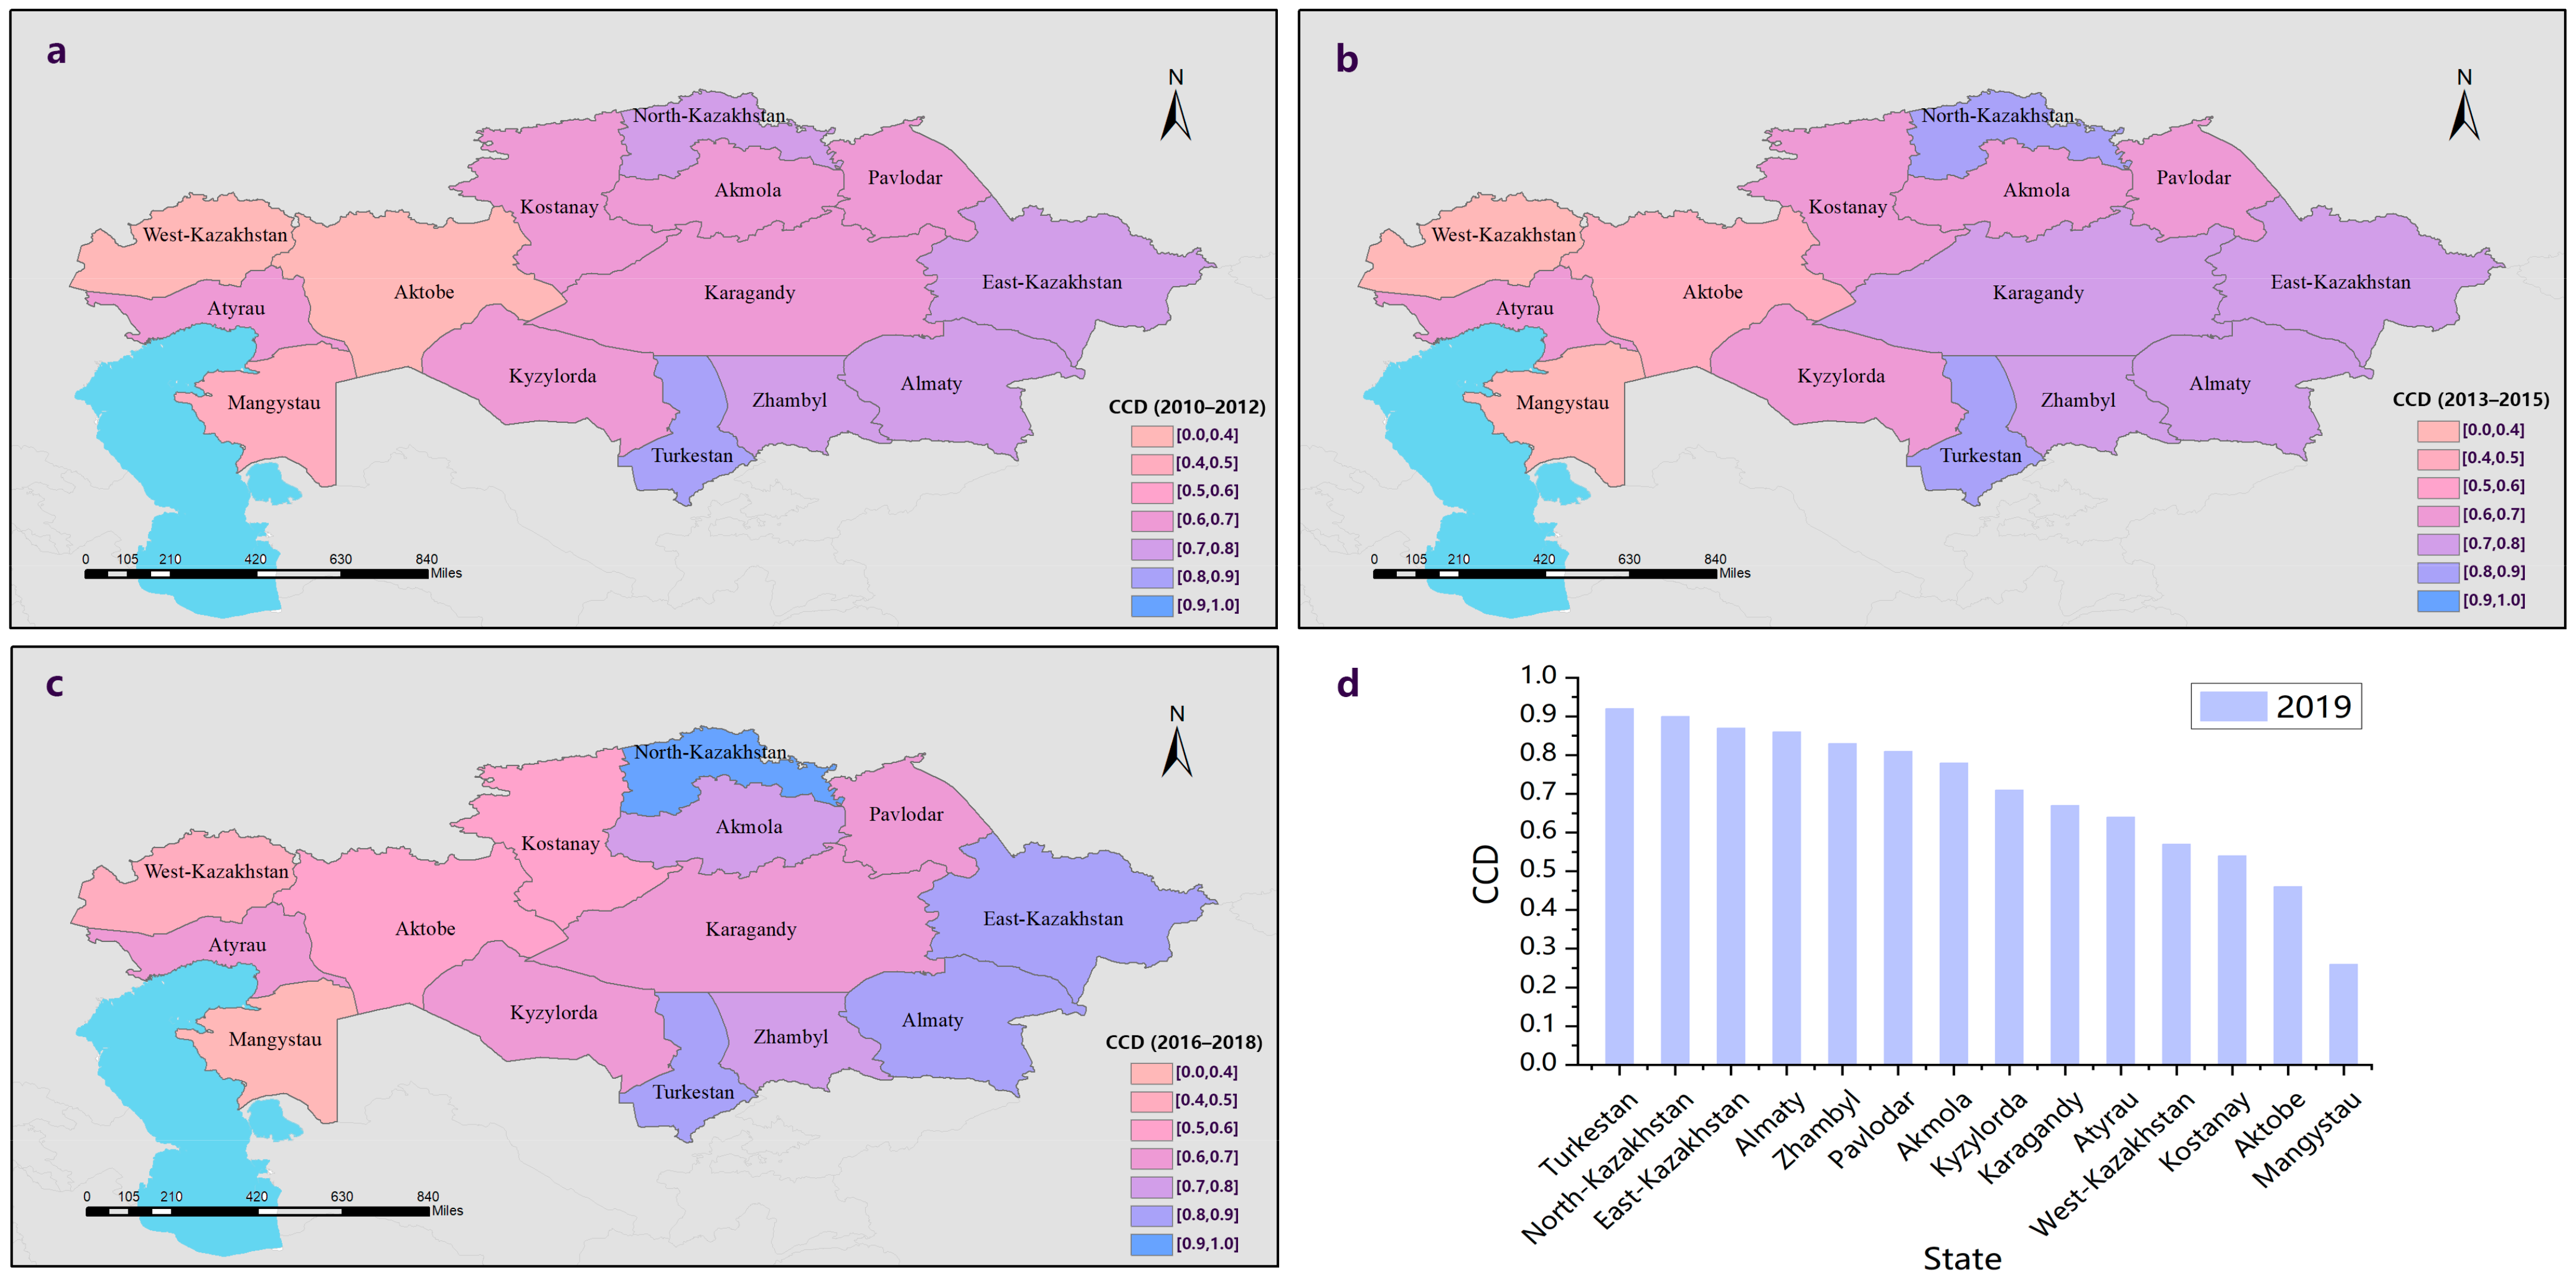
4.2. CCD of Environmental Protection (EP) and Agricultural Production (AP)

The EP levels in 14 states ranged from 7.86 to 38.82. In 2017–2019, the state with the highest EP value was Turkestan (38.82), followed by North-Kazakhstan (30.45); the state with the lowest EP value was Mangystan (8.49), followed by Aktobe (9.74). There has been little change in Kazakhstan’s environmental performance over the past decade. The total score reached its peak in 2015 and 2019, respectively. Around the Aral Sea, the EP levels of Atyrau (−4.93) and Mangystau (−7.40) declined; in the central region, the EP levels of Kostanay (−3.68) and Karagandy (−4.32) also declined. On the contrary, the EP levels in the southern region rose, including Kyzylorda (+3.54), Turkestan (+5.93), and Zhambyl (+1.22). The EP levels of North-Kazakhstan (+4.27), Akmola (+1.33), and East-Kazakhstan (+4.52) also increased. In addition, the EP levels of Pavlodar (−0.58) and Almaty (+0.03) remained stable (Figure 3).
The AP levels in 14 regions ranged from 8.78 to 59.32. In 2017–2019, the state with the highest AP value was North-Kazakhstan (59.32), followed by Pavlodar (53.56); the state with the lowest AP value was Mangystan (8.78), followed by Atyrau (26.77). The AP level in Kazakhstan rose steadily on the whole, except for Mangystau (−9.60). The states with a rapid EP growth were Akmola (+19.70), Pavlodar (+12.67), and North-Kazakhstan (+12.64) in the north; Zhambyl (+13.54) and Almaty (+10.90) in the south; Aktobe (+12.95) in the midwestern region. The states with a slow EP growth were Atyrau (+0.30) around the Aral Sea, Kyzylorda (+2.82), and Kostanay (+3.17) in the central region.
AP levels were growing much faster than EP levels. The EP and AP levels tended to be consistently distributed, i.e., they were low around the Aral Sea but high in the south and north. However, the change in the AP level in Karagandy (EP: −4.32 and AP: +9.62), Kostanay (EP: −3.68 and AP: +3.17), and Pavlodar (EP: −0.58 and AP: +12.67) clearly differed from the EP levels in these states (Figure 4).
The classification of CCD grades refers to a coordinated evaluation of the ecological environment and urbanization in Chongqing [33], and is adjusted according to the distribution characteristics of CCD values in this study.
The CCD value of 14 states was between 0.28 and 0.93. In 2019, the state with the highest CCD value was Turkestan (0.92), followed by North-Kazakhstan (0.90) and East-Kazakstan (0.87); the state with the lowest CCD value was Mangystau (0.26), followed by Aktobe (0.46) and Kostanay (0.54). Near the Aral Sea, the CCD values of Mangystau and Atyrau decreased by 0.229 and 0.015, respectively. In the central region, the CCD values of Kostanay and Karagandy decreased by 0.069 and 0.009, respectively. In the north, the CCDs of Akmola, Pavlodar, and North-Kazakhstan increased by 0.154, 0.123, and 0.101, respectively. Other states with a higher CCD growth were West-Kazakhstan (0.177), Zhambyl (0.111), and East-Kazakhstan (0.118) (Figure 5).
In 2019, only Mangystau (0.26) was in a state of imbalance between EP and AP; Aktobe (0.46), West-Kazakhstan (0.57), and Kostanay (0.54) were in a barely coordinated state; Atyrau (0.64) and Karagandy (0.67) were in primary coordination; Akmola (0.78) and Kyzylorda (0.71) were in intermediate coordination; Almaty (0.86), Zhambyl (0.83), Pavlodar (0.81), and East-Kazakhstan (0.87) were in good coordination; North-Kazakhstan (0.90) and Turkestan (0.92) were in perfect coordination (Table 3).

5. Discussion

5.1. Analysis of Weight Methods

The EW is considered to be objective and reliable in traditional research and has a wide range of applications [34]. In a study on the coordinated development of the fishery economy and environmental quality in China, the distribution results of EW were used to discuss to what extent local government departments should attach importance to these indicators [27]. However, there still are many concerns with respect to EW. Zhu et al. analyzed the irrationality of the entropy method in decision making in detail and reported that too many zero values and the ignorance of grade discrimination cause EW distortion [35]. In research on the shortcomings of EW in the dynamic evaluation of water quality indicators, it was claimed that EW only considers the statistical characteristics of the data, while ignoring its practical significance [36]. This is similar to the findings of this study. In this study, EW was found to be the most unstable method, through the analysis of three weighting results in four dimensions. Even if the original data were normalized, the influence of different dimensions was still considerable. This effect was due to the volatility differences within the indicators under different dimensional statistics. Moreover, the calculation principle, which only considers the volatility of the indicator itself, also limited the possibility of weakening the dimension influenced by the relationship among indicators.
CRITIC emphasizes the difference and independence between indicators. In this study, CRITIC was the most stable weight mode and suitable for most situations. Even if CW allocation was not chosen in measuring EPA and AEB, the weight distributions of CW were not far from the actual production situation and evaluation requirements. The correlation among indicators is more taken into account in FAW to achieve a generalized expression. In a study on the synergistic effects of sustainable development goals between China and countries along the belt and road, 93 measurement indicators related to the 17 SDGs were compressed into two directions through PCA [37]. In this study, the factor weighting method was found to be unsuitable for the assignment of indicators, which were representative but strongly correlated with other indicators in the group. If the effects of these indicators are weakened, the effects of indicators with relatively less importance but higher independence would be exaggerated. Our results confirm the consensus reached by many scholars that any objective weight method has its limitations and needs to be combined with subjective judgment [38].

5.2. Analysis of CCD Results

According to the evaluation results for the environmental protection level and coupling coordination degree, Atyrau and Mangystau near the Aral Sea had great difficulties with environmental governance. Other nearby western (West-Kazakhstan) and midwestern (Aktobe, Kostanay, and Karagandy) regions were also problematic in terms of environmental governance. These patterns are related to historical issues, climate change, and agricultural management techniques. Before Kazakhstan gained its independence, it had undergone the “virgin land” movement. In 1956, 130 million hectares of wasteland were reclaimed to alleviate the food shortage of the Soviet Union [39]. The Aral Sea region has shouldered a huge burden of irrigation and adopted extensive flood irrigation management methods, resulting in a loss of nearly 80% of the lake surface area by the end of the 1990s, causing large-scale desertification and sandstorms [40]. Climate change is also a major driving force of desertification. High temperatures and low rainfall amounts are characteristic for West-Kazakhstan, Atyrau, Mangystau, and Aktobe, complicating agriculture in these areas due to wind erosion [41]. For environmental governance in these areas, more attention should be paid to the investment in CSAQ and WSI. Agricultural production methods in these areas should have stricter restrictions, prohibit large-scale and high-intensity agricultural reclamation, and change the extensive agricultural management model. Farmland protection forests should be built reasonably and the application of high-efficiency water-saving irrigation technologies such as drip irrigation should be promoted.
Kostanay and Karagandy are semi-steppe and semi-desert areas dominated by animal husbandry. Environmental management difficulties in these regions derive from desert distribution and a lack of precipitation. From 2010 to 2019, Karagandy, Kyzylorda, and Kostanay had average temperatures of 4.39, 10.59, and 3.95 °C, respectively, which are not considered high temperatures when compared with the other states; however, the annual precipitation was 252.8, 145, and 297 mm, respectively [31]. Except for the western region, these states feature the lowest precipitation. In addition, the Qyzylqum Desert is distributed in three prefectures and mainly distributed in Atyrau and Kyzylorda, partly in Karagandy, Kostanay, and other states. In these areas, a balanced management system for grass and animal husbandry can be established by restoring and establishing pasture rotation, banning grazing, and resting grazing, so as to reduce the pressure on land from agricultural and animal husbandry development activities. Their environmental governance inputs should focus on WSI.
The EP scores of the 14 states were much lower than the AP scores. Combined with the positive performance of CCD, we found that environmental improvements have a much greater impact on agricultural production than expected. In the study by Zhu et al. on the relationship between rural transformation and the agro-ecological environment, the authors showed that the rural environment plays a major role in food production [42]. North-Kazakhstan, East-Kazakhstan, and Turkestan, where EP scores were high but AP scores were low, resulting in relatively low CCD scores, agricultural production development could be further improved through improved cropping patterns.

6. Conclusions

In this study, Kazakhstan, as an important country for international food production and export, was selected to study the coordination between agricultural production and environmental protection. We analyzed the rationality and limitations of common objective empowerment methods in environmental safety assessment, showed the distribution status of agricultural production, environmental protection, and coordination in the states of Kazakhstan, and analyzed the causes. Finally, specific suggestions were put forward for environmental governance and agricultural production in areas with prominent problems.
This research can help Kazakhstan government officials and scientists accurately locate the level of agricultural production and environmental protection in each state, so as to develop targeted investment governance and differentiated agricultural management programs. Other researchers focusing on environmental assessment can also refer to this weighting scheme.

Author Contributions

Conceptualization, methodology, writing—original draft preparation, writing—review and editing, D.W.; writing—review and editing, S.L.; resources, investigation, S.T. and N.J.; data curation, P.M.; supervision, project administration, funding acquisition, Y.F. All authors have read and agreed to the published version of the manuscript.

Funding

This research was funded by the Strategic Leading Special Science and Technology Program of the Chinese Academy of Sciences (No. XDA20040202) and the Shaanxi Innovation Capability Support Program (No. 2019PT-13).

Institutional Review Board Statement

Ethical review and approval were waived for this study as the study does not collect any personal data of the respondents, and all data we used are public data.

Informed Consent Statement

Not applicable.

Data Availability Statement

The data will be provided upon request by the corresponding author.

Conflicts of Interest

The authors declare no conflict of interest.

References

  1. Garbero, A.; Jäckering, L. The Potential of Agricultural Programs for Improving Food Security: A Multi-Country Perspective. Glob. Food Secur. 2021, 29, 100529. [Google Scholar] [CrossRef]
  2. Laurett, R.; Paço, A.; Mainardes, E.W. Antecedents and Consequences of Sustainable Development in Agriculture and the Moderator Role of the Barriers: Proposal and Test of a Structural Model. J. Rural Stud. 2021, 86, 270–281. [Google Scholar] [CrossRef]
  3. Chojnacka, K.; Mikula, K.; Izydorczyk, G.; Skrzypczak, D.; Witek-Krowiak, A.; Gersz, A.; Moustakas, K.; Iwaniuk, J.; Grzędzicki, M.; Korczyński, M. Innovative High Digestibility Protein Feed Materials Reducing Environmental Impact through Improved Nitrogen-Use Efficiency in Sustainable Agriculture. J. Environ. Manag. 2021, 291, 112693. [Google Scholar] [CrossRef] [PubMed]
  4. Misiou, O.; Koutsoumanis, K. Climate Change and Its Implications for Food Safety and Spoilage. Trends Food Sci. Technol. 2021. [Google Scholar] [CrossRef]
  5. Mc Carthy, U.; Uysal, I.; Badia-Melis, R.; Mercier, S.; O’Donnell, C.; Ktenioudaki, A. Global Food Security–Issues, Challenges and Technological Solutions. Trends Food Sci. Technol. 2018, 77, 11–20. [Google Scholar] [CrossRef]
  6. Guo, Y.; Zhao, H.; Zhang, S.; Wang, Y.; Chow, D. Modeling and Optimization of Environment in Agricultural Greenhouses for Improving Cleaner and Sustainable Crop Production. J. Clean. Prod. 2021, 285, 124843. [Google Scholar] [CrossRef]
  7. Zhao, Y.; Wang, S.; Ge, Y.; Liu, Q.; Liu, X. The Spatial Differentiation of the Coupling Relationship between Urbanization and the Eco-Environment in Countries Globally: A Comprehensive Assessment. Ecol. Model. 2017, 360, 313–327. [Google Scholar] [CrossRef]
  8. National Report Based on OECD Green Growth Indicators. Available online: https://stat.gov.kz/official/industry/157/publication (accessed on 26 October 2021).
  9. Lazzat, Y.; Aigerim, O.; Daniya, N. The Ecological and Legal Aspects of Ensuring the Food Security of the Republic of Kazakhstan Under the Transition to a “Green” Economy. Procedia-Soc. Behav. Sci. 2014, 143, 971–975. [Google Scholar] [CrossRef] [Green Version]
  10. Swinnen, J.; Burkitbayeva, S.; Schierhorn, F.; Prishchepov, A.V.; Müller, D. Production Potential in the “Bread Baskets” of Eastern Europe and Central Asia. Glob. Food Secur. 2017, 14, 38–53. [Google Scholar] [CrossRef]
  11. FAOSTAT. Available online: http://www.fao.org/faostat/zh/#data/QC (accessed on 5 June 2021).
  12. Barrett, T.; Feola, G.; Krylova, V.; Khusnitdinova, M. The Application of Rapid Appraisal of Agricultural Innovation Systems (RAAIS) to Agricultural Adaptation to Climate Change in Kazakhstan: A Critical Evaluation. Agric. Syst. 2017, 151, 106–113. [Google Scholar] [CrossRef]
  13. Ding, Y.K.; Li, Y.P.; Liu, Y.R. Spatial-Temporal Assessment of Agricultural Virtual Water and Uncertainty Analysis: The Case of Kazakhstan (2000–2016). Sci. Total Environ. 2020, 724, 138155. [Google Scholar] [CrossRef]
  14. Kim, S.J.; Park, S.; Lee, S.J.; Shaimerdenova, A.; Kim, J.; Park, E.; Lee, W.; Kim, G.S.; Kim, N.; Kim, T.H.; et al. Developing Spatial Agricultural Drought Risk Index with Controllable Geo-Spatial Indicators: A Case Study for South Korea and Kazakhstan. Int. J. Disaster Risk Reduct. 2021, 54, 102056. [Google Scholar] [CrossRef]
  15. Pang, J.; Liu, X.; Huang, Q. A New Quality Evaluation System of Soil and Water Conservation for Sustainable Agricultural Development. Agric. Water Manag. 2020, 240, 106235. [Google Scholar] [CrossRef]
  16. Kumar, A.; Pramanik, M.; Chaudhary, S.; Negi, M.S. Land Evaluation for Sustainable Development of Himalayan Agriculture Using RS-GIS in Conjunction with Analytic Hierarchy Process and Frequency Ratio. J. Saudi Soc. Agric. Sci. 2021, 20, 1–17. [Google Scholar] [CrossRef]
  17. Luo, D. Risk Evaluation of Agricultural Drought Disaster Using a Grey Cloud Clustering Model in Henan Province, China. Int. J. Disaster Risk Reduct. 2020, 49, 101759. [Google Scholar] [CrossRef]
  18. Amelio, M. Olive Oil Sensory Evaluation: An Alternative to the Robust Coefficient of Variation (CVr %) for Measuring Panel Group Performance in Official Tasting Sessions. Trends Food Sci. Technol. 2019, 88, 567–570. [Google Scholar] [CrossRef]
  19. Abdel-Basset, M.; Mohamed, R. A Novel Plithogenic TOPSIS-CRITIC Model for Sustainable Supply Chain Risk Management. J. Clean. Prod. 2020, 247, 119586. [Google Scholar] [CrossRef]
  20. Ke, X.; Wang, X.; Guo, H.; Yang, C.; Zhou, Q.; Mougharbel, A. Urban Ecological Security Evaluation and Spatial Correlation Research—Based on Data Analysis of 16 Cities in Hubei Province of China. J. Clean. Prod. 2021, 311, 127613. [Google Scholar] [CrossRef]
  21. Liu, X.; Liu, Z.; Zhong, H.; Jian, Y.; Shi, L. Multi-Dimension Evaluation of Rural Development Degree and Its Uncertainties: A Comparison Analysis Based on Three Different Weighting Assignment Methods. Ecol. Indic. 2021, 130, 108096. [Google Scholar] [CrossRef]
  22. Zhao, X. Study on evaluation index system of agricultural green development level in Henan Province. Agric. Technol. 2021, 41, 164–167. [Google Scholar] [CrossRef]
  23. Yu, Y.; Wang, C.; Peng, L.; Yu, Y. Evaluation of Agricultural Green Development Level and Ananlysis of its Obstacle Factors Based on Entropy Weight Topsis Model: A Case Study of Jiangxi Province. China’s Agric. Resour. Reg. 2021. Available online: https://kns.cnki.net/kcms/detail/11.3513.S.20210607.1132.016.html (accessed on 22 February 2022).
  24. Fang, L.; Hu, R.; Mao, H.; Chen, S. How Crop Insurance Influences Agricultural Green Total Factor Productivity: Evidence from Chinese Farmers. J. Clean. Prod. 2021, 321, 128977. [Google Scholar] [CrossRef]
  25. Kolecka, N. Greening Trends and Their Relationship with Agricultural Land Abandonment across Poland. Remote Sens. Environ. 2021, 257, 112340. [Google Scholar] [CrossRef]
  26. Cai, B.; Shao, Z.; Fang, S.; Huang, X.; Huq, E.; Tang, Y.; Li, Y.; Zhuang, Q. Finer-Scale Spatiotemporal Coupling Coordination Model between Socioeconomic Activity and Eco-Environment: A Case Study of Beijing, China. Ecol. Indic. 2021, 131, 108165. [Google Scholar] [CrossRef]
  27. Peng, D.; Mu, Y.; Zhu, Y. Evaluating the Level of Coordinated Development of Fisheries Economic Growth and Environmental Quality in Selected Chinese Regions. Environ. Impact Assess. Rev. 2021, 89, 106605. [Google Scholar] [CrossRef]
  28. Xiao, Y.; Wang, R.; Wang, F.; Huang, H.; Wang, J. Investigation on Spatial and Temporal Variation of Coupling Coordination between Socioeconomic and Ecological Environment: A Case Study of the Loess Plateau, China. Ecol. Indic. 2022, 136, 108667. [Google Scholar] [CrossRef]
  29. Li, J.; Yuan, W.; Qin, X.; Qi, X.; Meng, L. Coupling Coordination Degree for Urban Green Growth between Public Demand and Government Supply in Urban Agglomeration: A Case Study from China. J. Environ. Manag. 2022, 304, 114209. [Google Scholar] [CrossRef] [PubMed]
  30. Ye, Y.; Qiu, H. Environmental and Social Benefits, and Their Coupling Coordination in Urban Wetland Parks. Urban For. Urban Green. 2021, 60, 127043. [Google Scholar] [CrossRef]
  31. Kazakhstan National Bureau of Strategic Statistics. Agriculture, Forestry and Fisheries in the Republic of Kazakhstan. Available online: https://stat.gov.kz/official/industry/14/publication (accessed on 5 June 2021).
  32. Kazakhstan National Bureau of Strategic Statistics. Environmental Protection and Sustainable Development of Kazakhstan. Available online: https://stat.gov.kz/official/industry/157/publication (accessed on 26 October 2021).
  33. Yang, C.; Zeng, W.; Yang, X. Coupling Coordination Evaluation and Sustainable Development Pattern of Geo-Ecological Environment and Urbanization in Chongqing Municipality, China. Sustain. Cities Soc. 2020, 61, 102271. [Google Scholar] [CrossRef]
  34. Li, Y.; Zhang, Q.; Wang, L.; Liang, L. Regional Environmental Efficiency in China: An Empirical Analysis Based on Entropy Weight Method and Non-Parametric Models. J. Clean. Prod. 2020, 276, 124147. [Google Scholar] [CrossRef]
  35. Zhu, Y.; Tian, D.; Yan, F. Effectiveness of Entropy Weight Method in Decision-Making. Math. Probl. Eng. 2020, 2020, 3564835. [Google Scholar] [CrossRef]
  36. Zhe, W.; Xigang, X.; Feng, Y. An Abnormal Phenomenon in Entropy Weight Method in the Dynamic Evaluation of Water Quality Index. Ecol. Indic. 2021, 131, 108137. [Google Scholar] [CrossRef]
  37. Feng, T.; Kang, Q.; Pan, B.; Yang, Y. Synergies of Sustainable Development Goals between China and Countries along the Belt and Road Initiative. Curr. Opin. Environ. Sustain. 2019, 39, 167–186. [Google Scholar] [CrossRef]
  38. Zhong, C.; Yang, Q.; Liang, J.; Ma, H. Fuzzy Comprehensive Evaluation with AHP and Entropy Methods and Health Risk Assessment of Groundwater in Yinchuan Basin, Northwest China. Environ. Res. 2022, 204, 111956. [Google Scholar] [CrossRef]
  39. Dara, A.; Baumann, M.; Kuemmerle, T.; Pflugmacher, D.; Rabe, A.; Griffiths, P.; Hölzel, N.; Kamp, J.; Freitag, M.; Hostert, P. Mapping the Timing of Cropland Abandonment and Recultivation in Northern Kazakhstan Using Annual Landsat Time Series. Remote Sens. Environ. 2018, 213, 49–60. [Google Scholar] [CrossRef]
  40. Rzymski, P.; Klimaszyk, P.; Niedzielski, P.; Marszelewski, W.; Borowiak, D.; Nowiński, K.; Baikenzheyeva, A.; Kurmanbayev, R.; Aladin, N. Pollution with Trace Elements and Rare-Earth Metals in the Lower Course of Syr Darya River and Small Aral Sea, Kazakhstan. Chemosphere 2019, 234, 81–88. [Google Scholar] [CrossRef] [PubMed]
  41. Hu, Y.; Han, Y.; Zhang, Y. Land Desertification and Its Influencing Factors in Kazakhstan. J. Arid. Environ. 2020, 180, 104203. [Google Scholar] [CrossRef]
  42. Zhu, C.; Lin, Y.; Zhang, J.; Gan, M.; Xu, H.; Li, W.; Yuan, S.; Wang, K. Exploring the Relationship between Rural Transition and Agricultural Eco-Environment Using a Coupling Analysis: A Case Study of Zhejiang Province, China. Ecol. Indic. 2021, 127, 107733. [Google Scholar] [CrossRef]
Figure 1. Weights of environmental protection indicators.
Sustainability 14 03700 g001
Figure 2. Weights of agricultural production indicators.
Sustainability 14 03700 g002
Figure 3. Environmental protection level of Kazakhstan (a) EP value for 2010–2012; (b) EP value for 2013–2016; (c) EP value for 2017–2019; (d) Changes in Kazakhstan’s EP value for 2010–2019.
Sustainability 14 03700 g003
Figure 4. Agricultural production level of Kazakhstan (a) AP value for 2010–2012; (b) AP value for 2013–2016; (c) AP value for 2017–2019; (d) Changes in Kazakhstan’s AP value for 2010–2019.
Sustainability 14 03700 g004
Figure 5. CCD of Kazakhstan (a) CCD value for 2010–2012; (b) CCD value for 2013–2016; (c) CCD value for 2017–2019; (d) CCD values for 14 states in 2019.
Sustainability 14 03700 g005
Table 1. OWAM principles and characteristics.
OWAMCorrelation among
Indicators
Volatility in
Indicators
Note
CRITIC+“+” means positive effect;
“−” means negative effect;
“/” means no effect.
PCAW/FAW++
EW/+
CVW/+
Table 2. Indicator description and processing.
IndicatorsAbbreviations and UnitsIndicator Descriptions
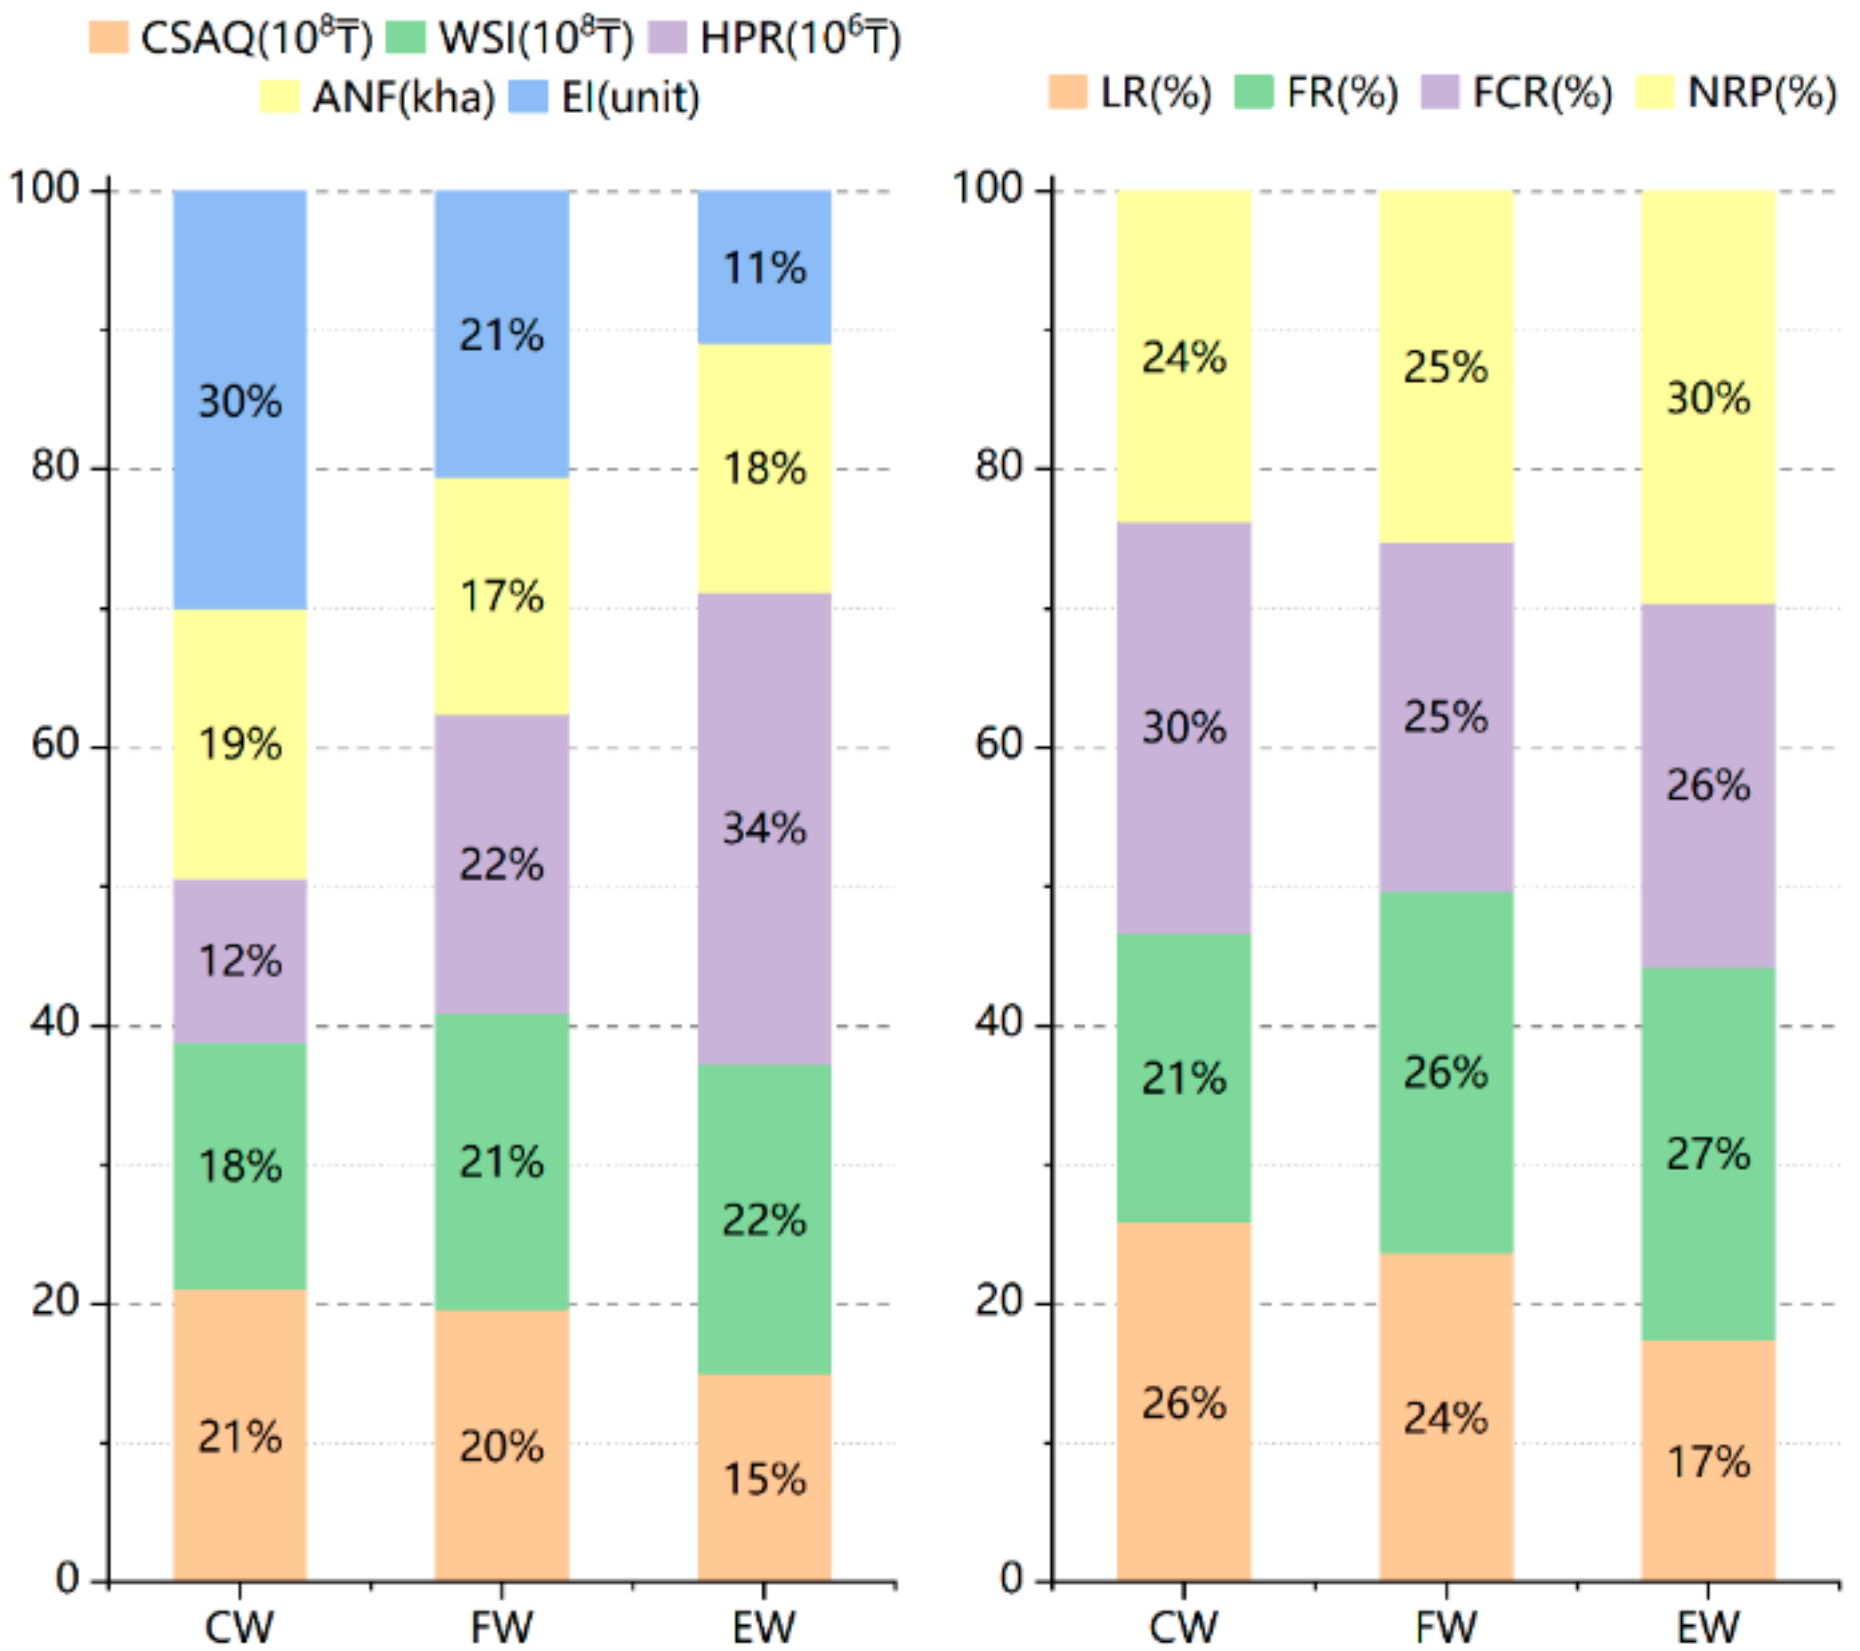
Environmental protection expenditures and investments (EPI)
Climate safety and air qualityCSAQ (108 KZT)CSAQ, WSI, and HPR are government expenditures and investments on environmental protection by category; EI is the number of environmental protection departments and agencies; “KZT” is the code for Kazakhstan’s currency “tenge”.
Water and soil improvementWSI (108 KZT)
Habitat protection and restorationHPR (106 KZT)
Afforestation in national forestsANF (kha)
Environmental institutionsEI (unit)
Environmental protection achievements (EPA)
Land recovery rateLR (%)Healed area/disturbed area
Fallow rateFR (%)Fallow area/cultivated area
Forest cover rateFCR (%)It slowly increased from 4.5% to 4.8%.
Proportion of nature reservesNRP (%);Nature reserve area/state area
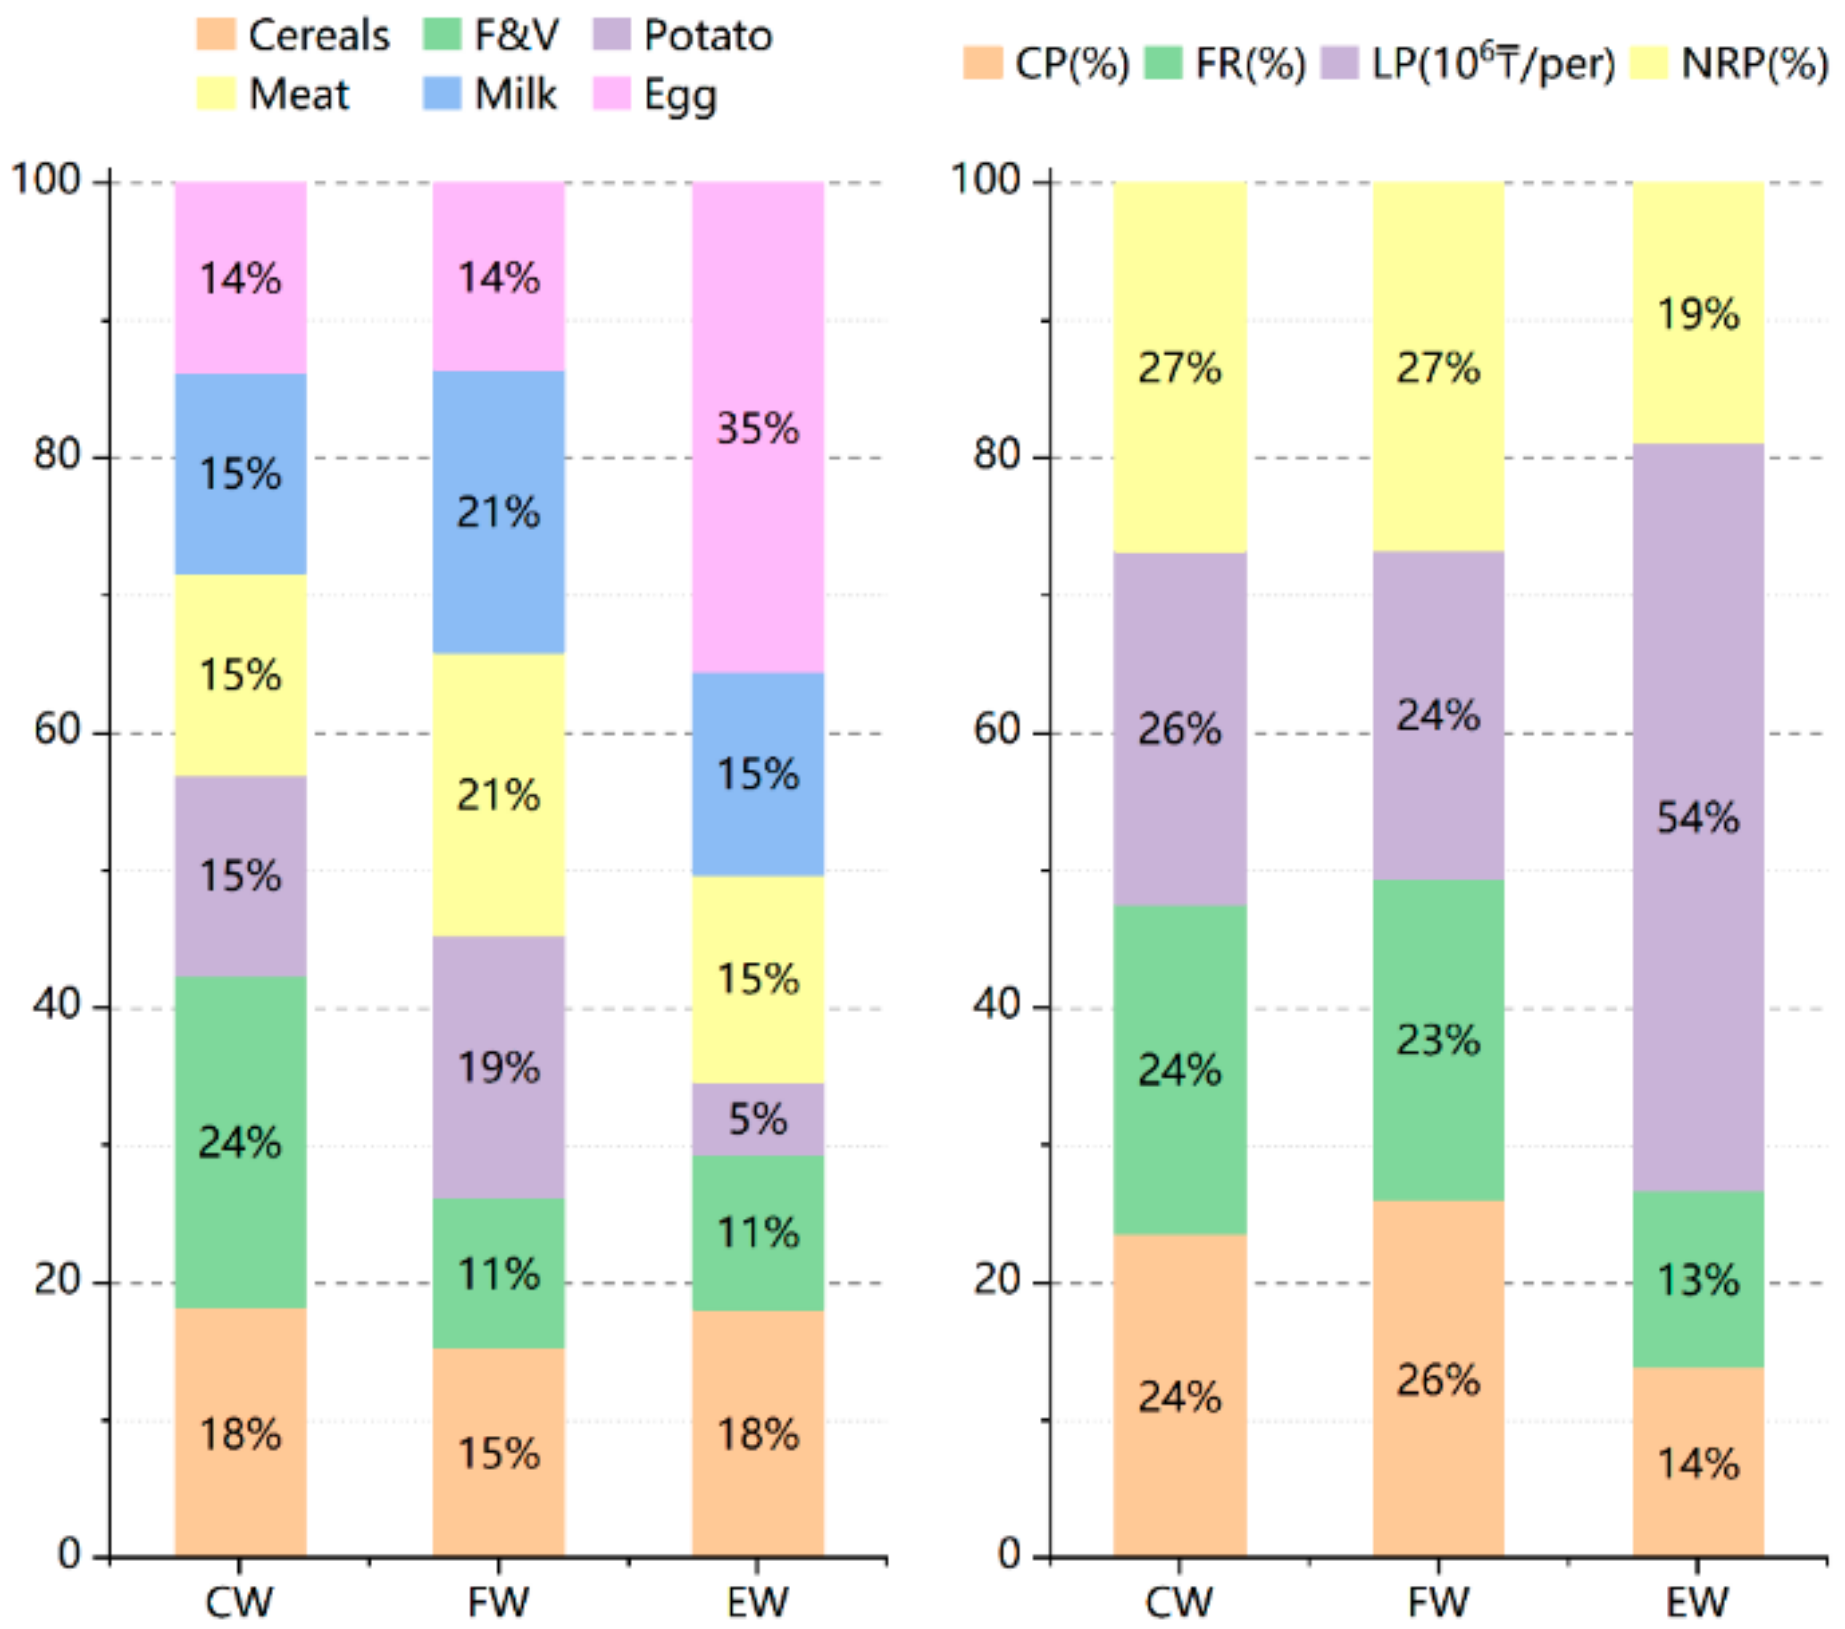
Agricultural productivity (APR)
Cerealst/haCereal, potato, and F&V yields represent the planting productivity, and the yield per unit area of meat, milk, and egg represents livestock productivity (based on yearbook statistics; there is no livestock production per head).
Potato
Fruits and vegetablesF&V (t/ha)
Meatkg/ha
Milk
Egg10 No./ha
Agricultural economic benefits (AEB) [23]
Crop profitabilityCP (%)Profits of crop production companies
Animal husbandry profitabilityAP (%)Profits of animal husbandry production companies
Labor productivityLP (106 KZT/per)Gross value of crop and livestock/agricultural workers
Agricultural salary levelASL (%)Wages of agricultural practitioners/per capita wage (average wage in agriculture compared to overall wage)
Table 3. CCD level.
Table 3. CCD level.
CCD ValueClassMean
[0.0–0.4]1Imbalance
[0.4–0.6]2Low coordination
[0.6–0.7]3Primary coordination
[0.7–0.8]4Intermediate coordination
[0.8–0.9]5Good coordination
[0.9–1.0]6Perfect coordination
Publisher’s Note: MDPI stays neutral with regard to jurisdictional claims in published maps and institutional affiliations.

