
Impact of Urban Re-Densification on Indoor Lighting Demand and Energy Poverty on the Equator, in the City of Quito

 ,
,  , and
, and
Abstract
:1. Introduction
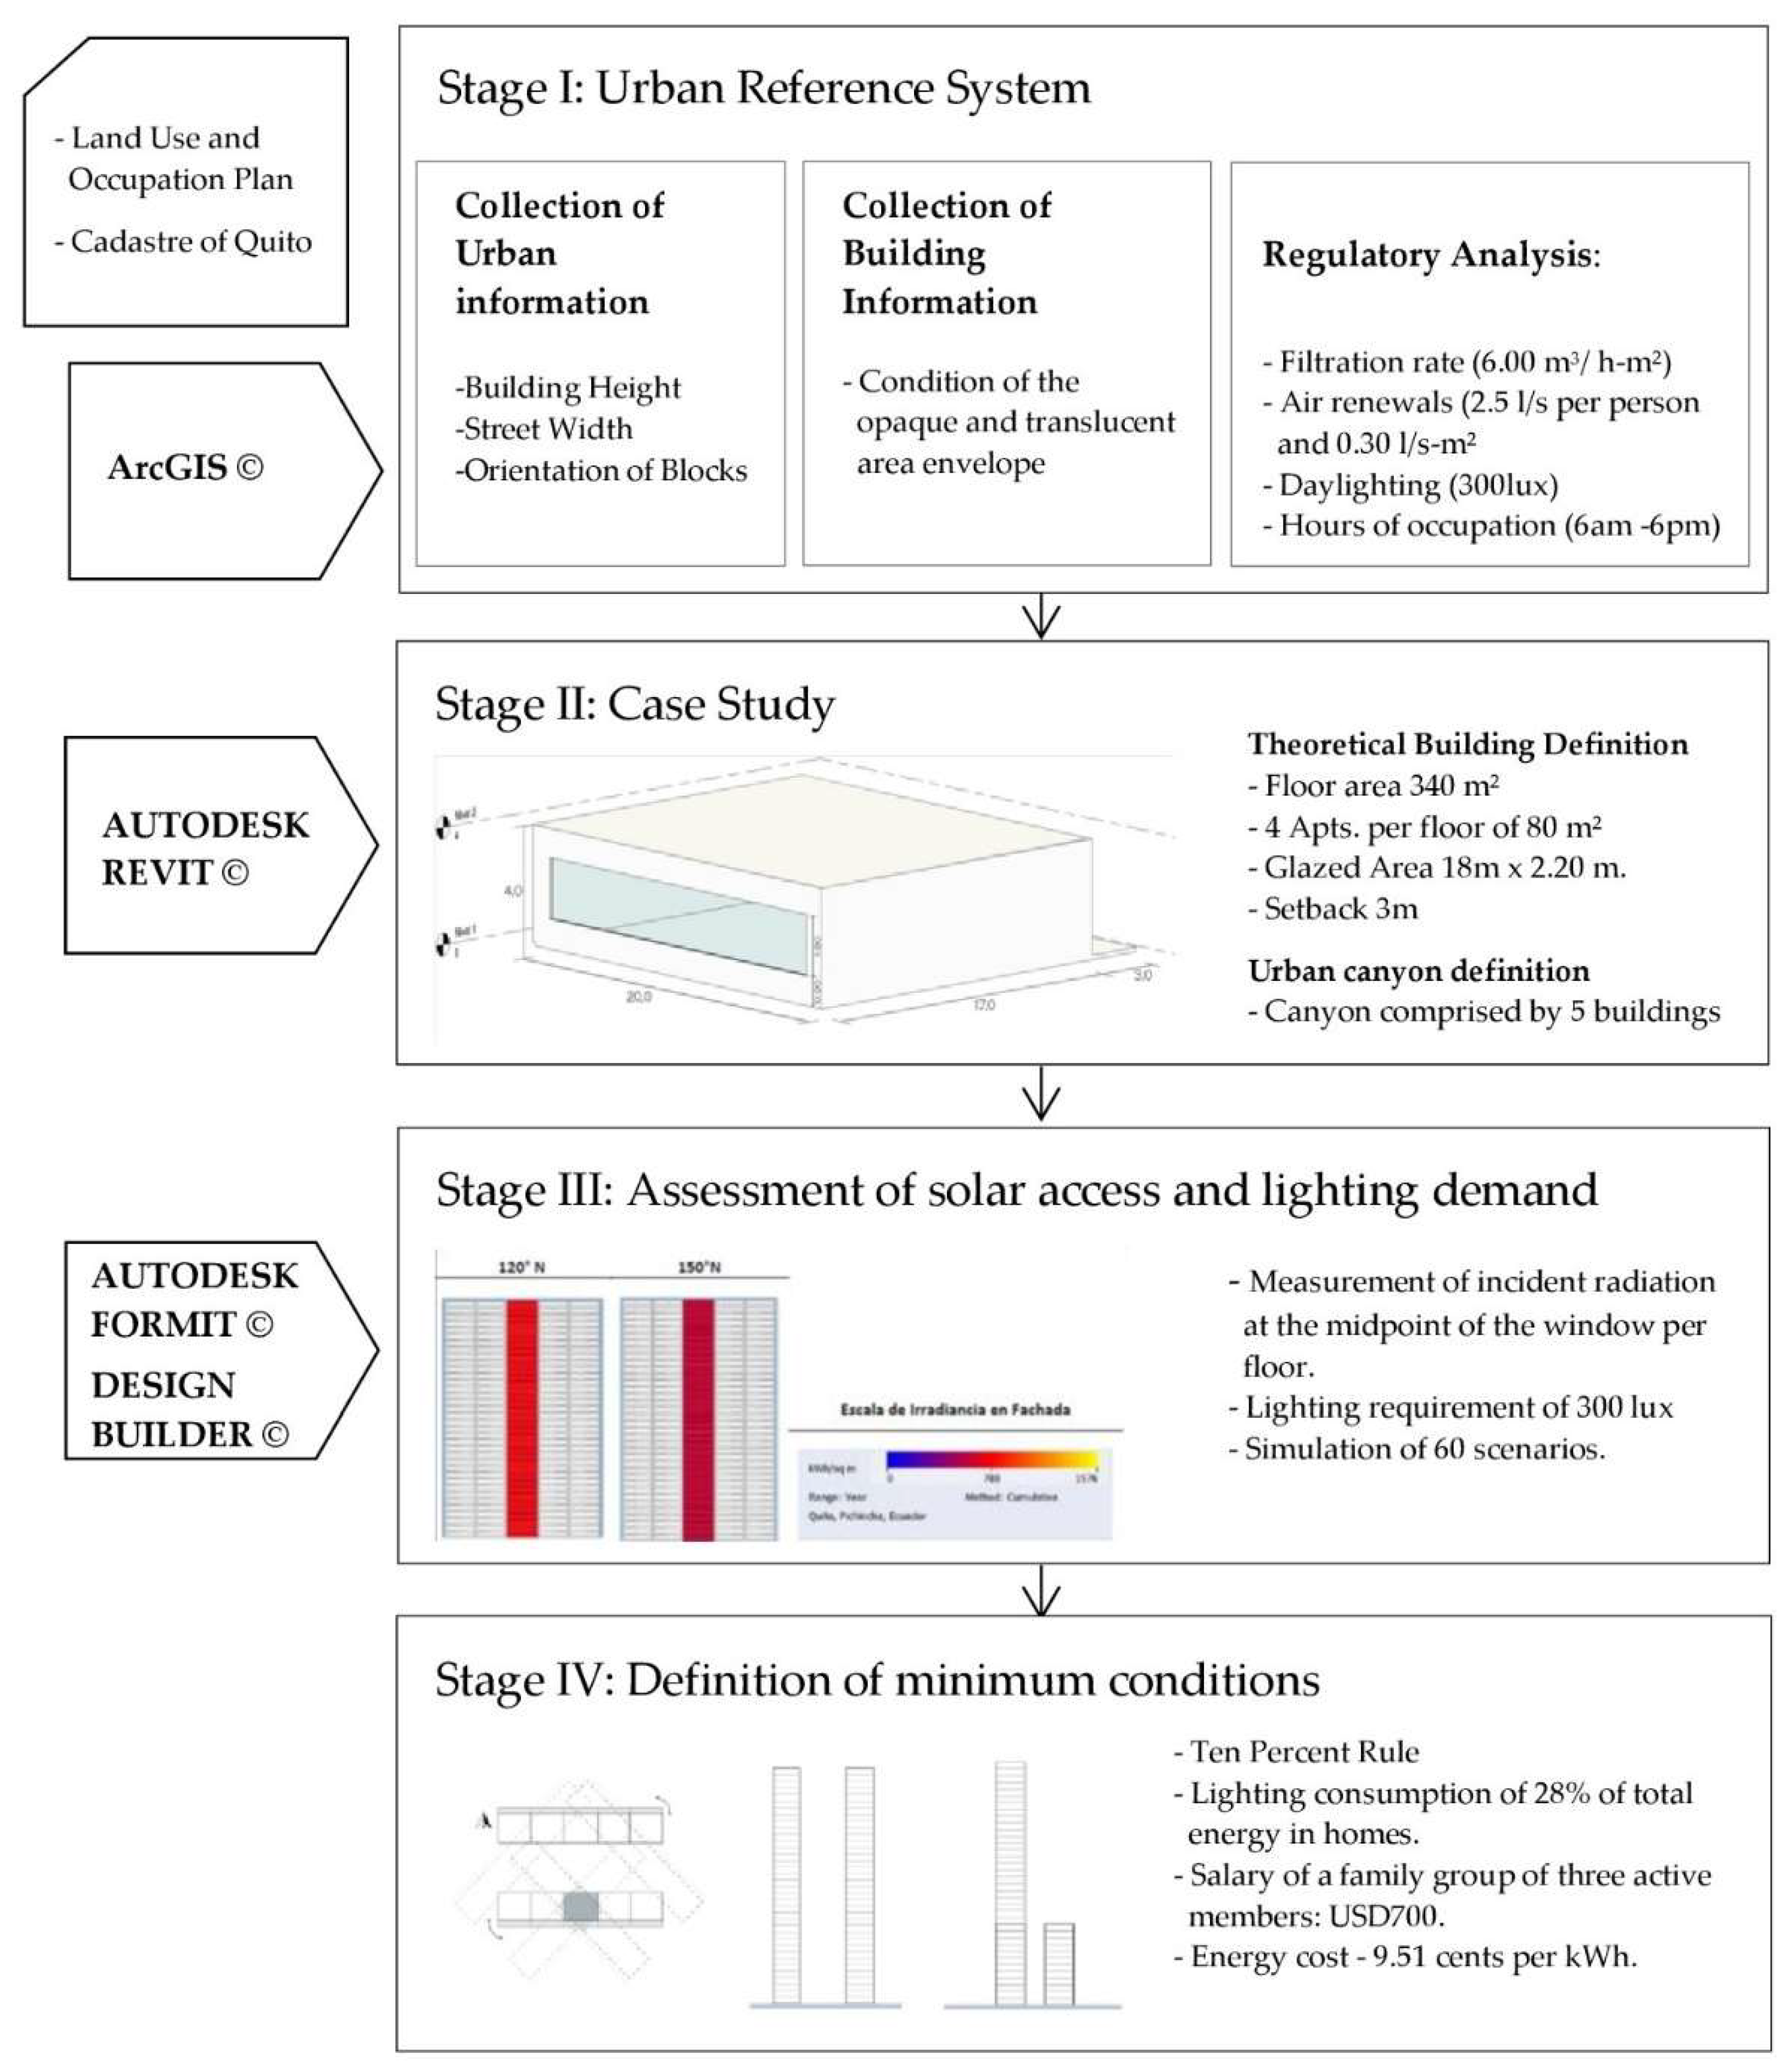
2. Methodology
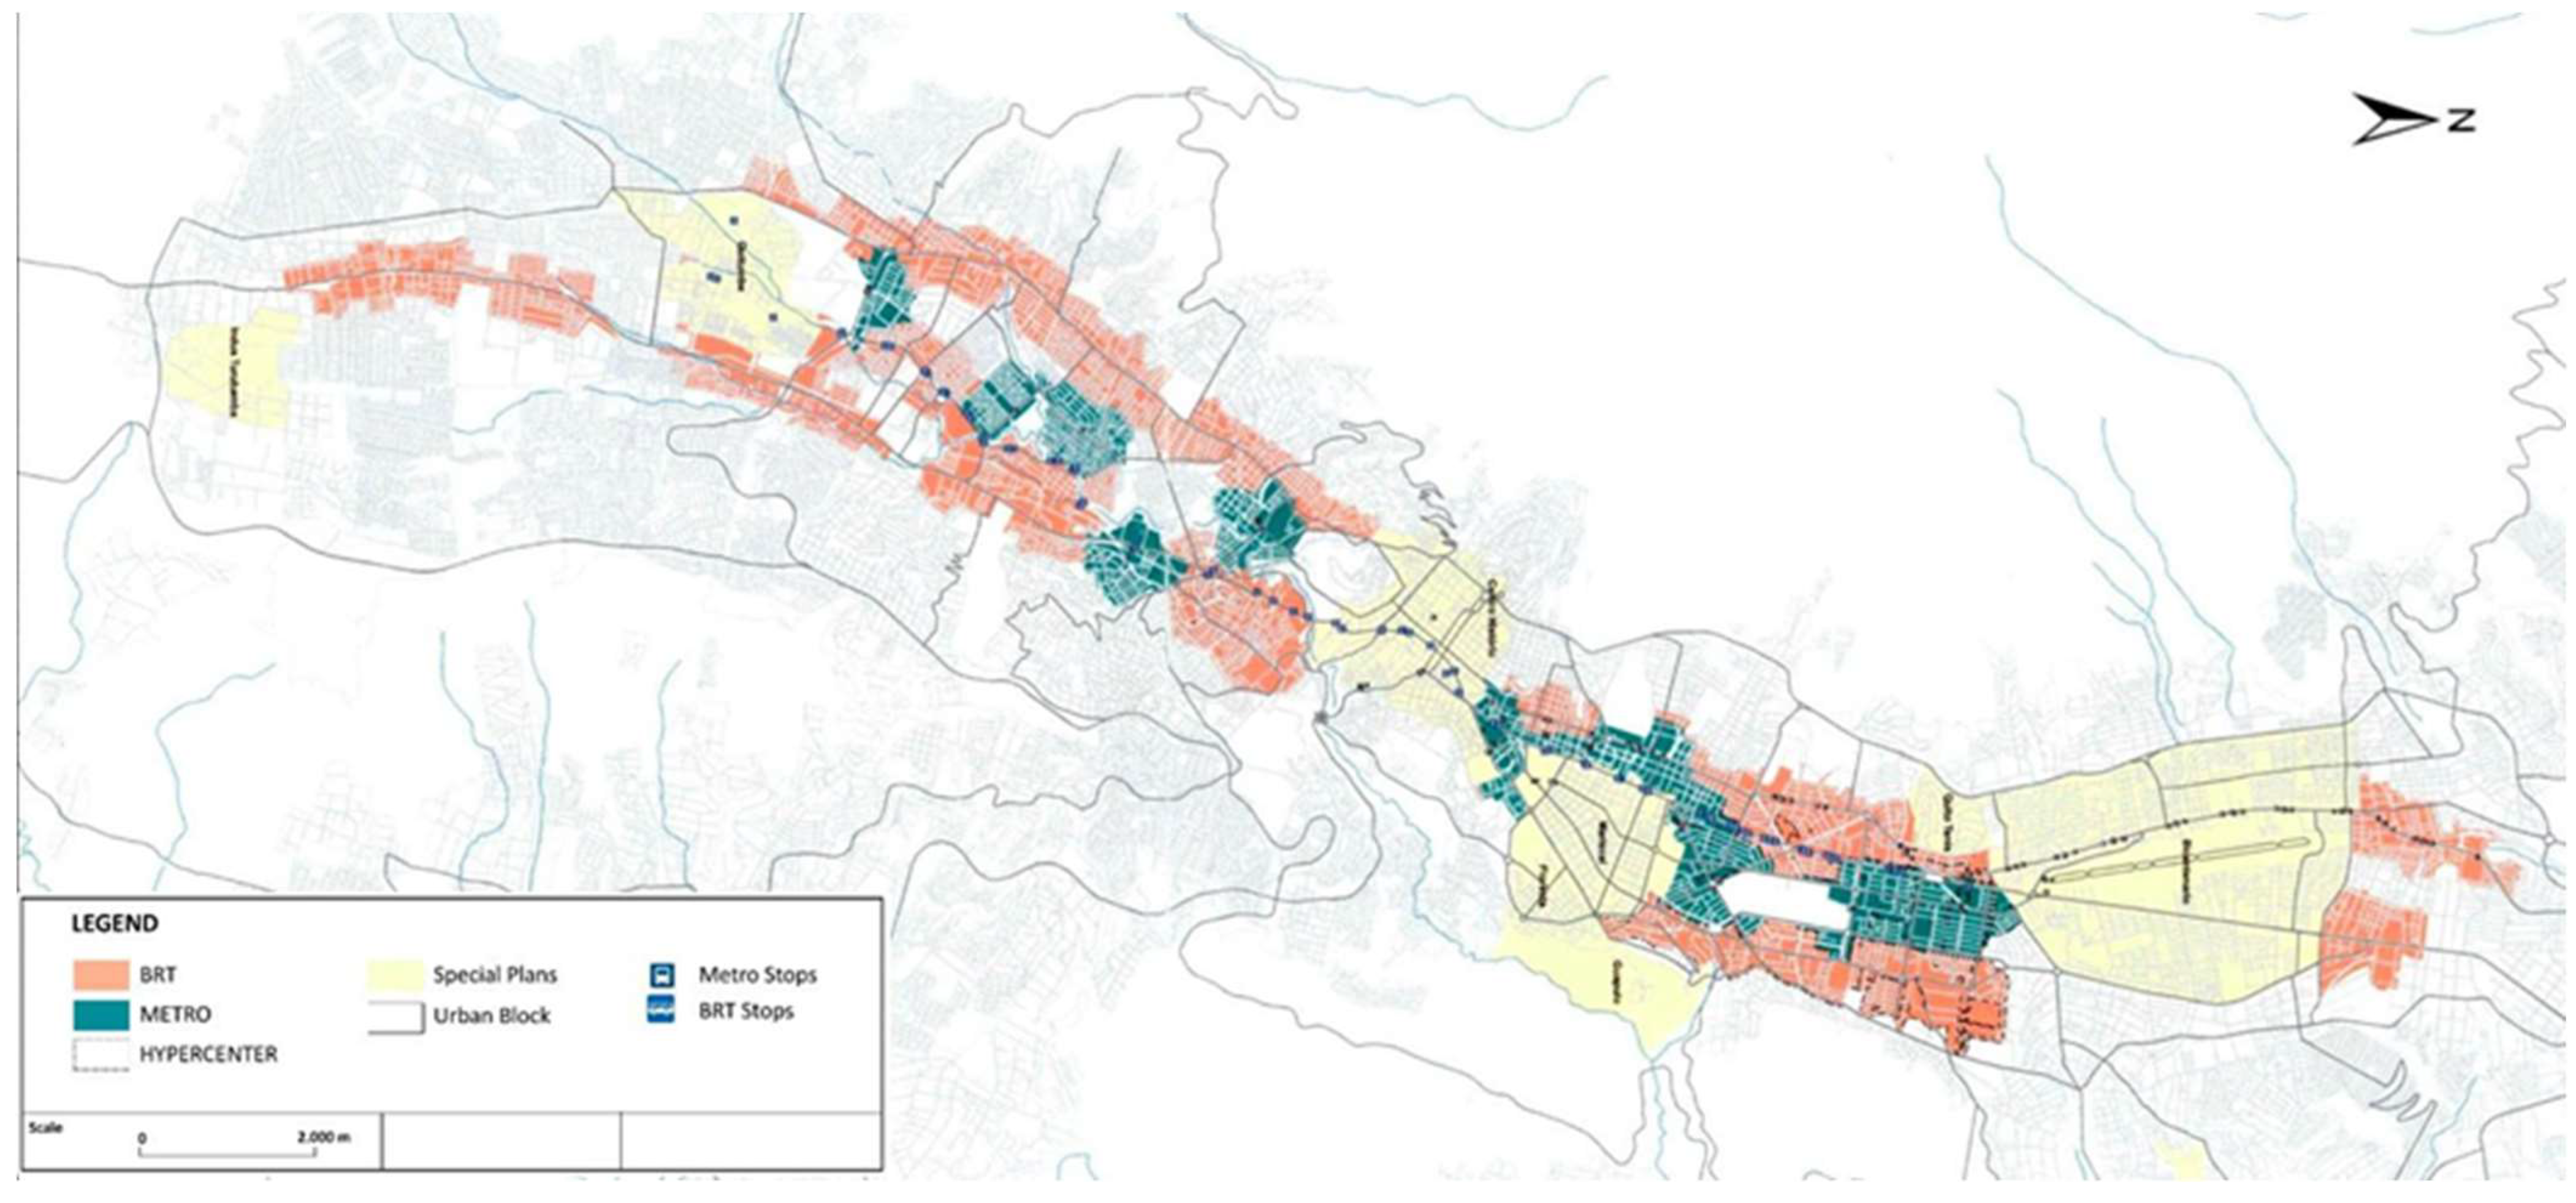
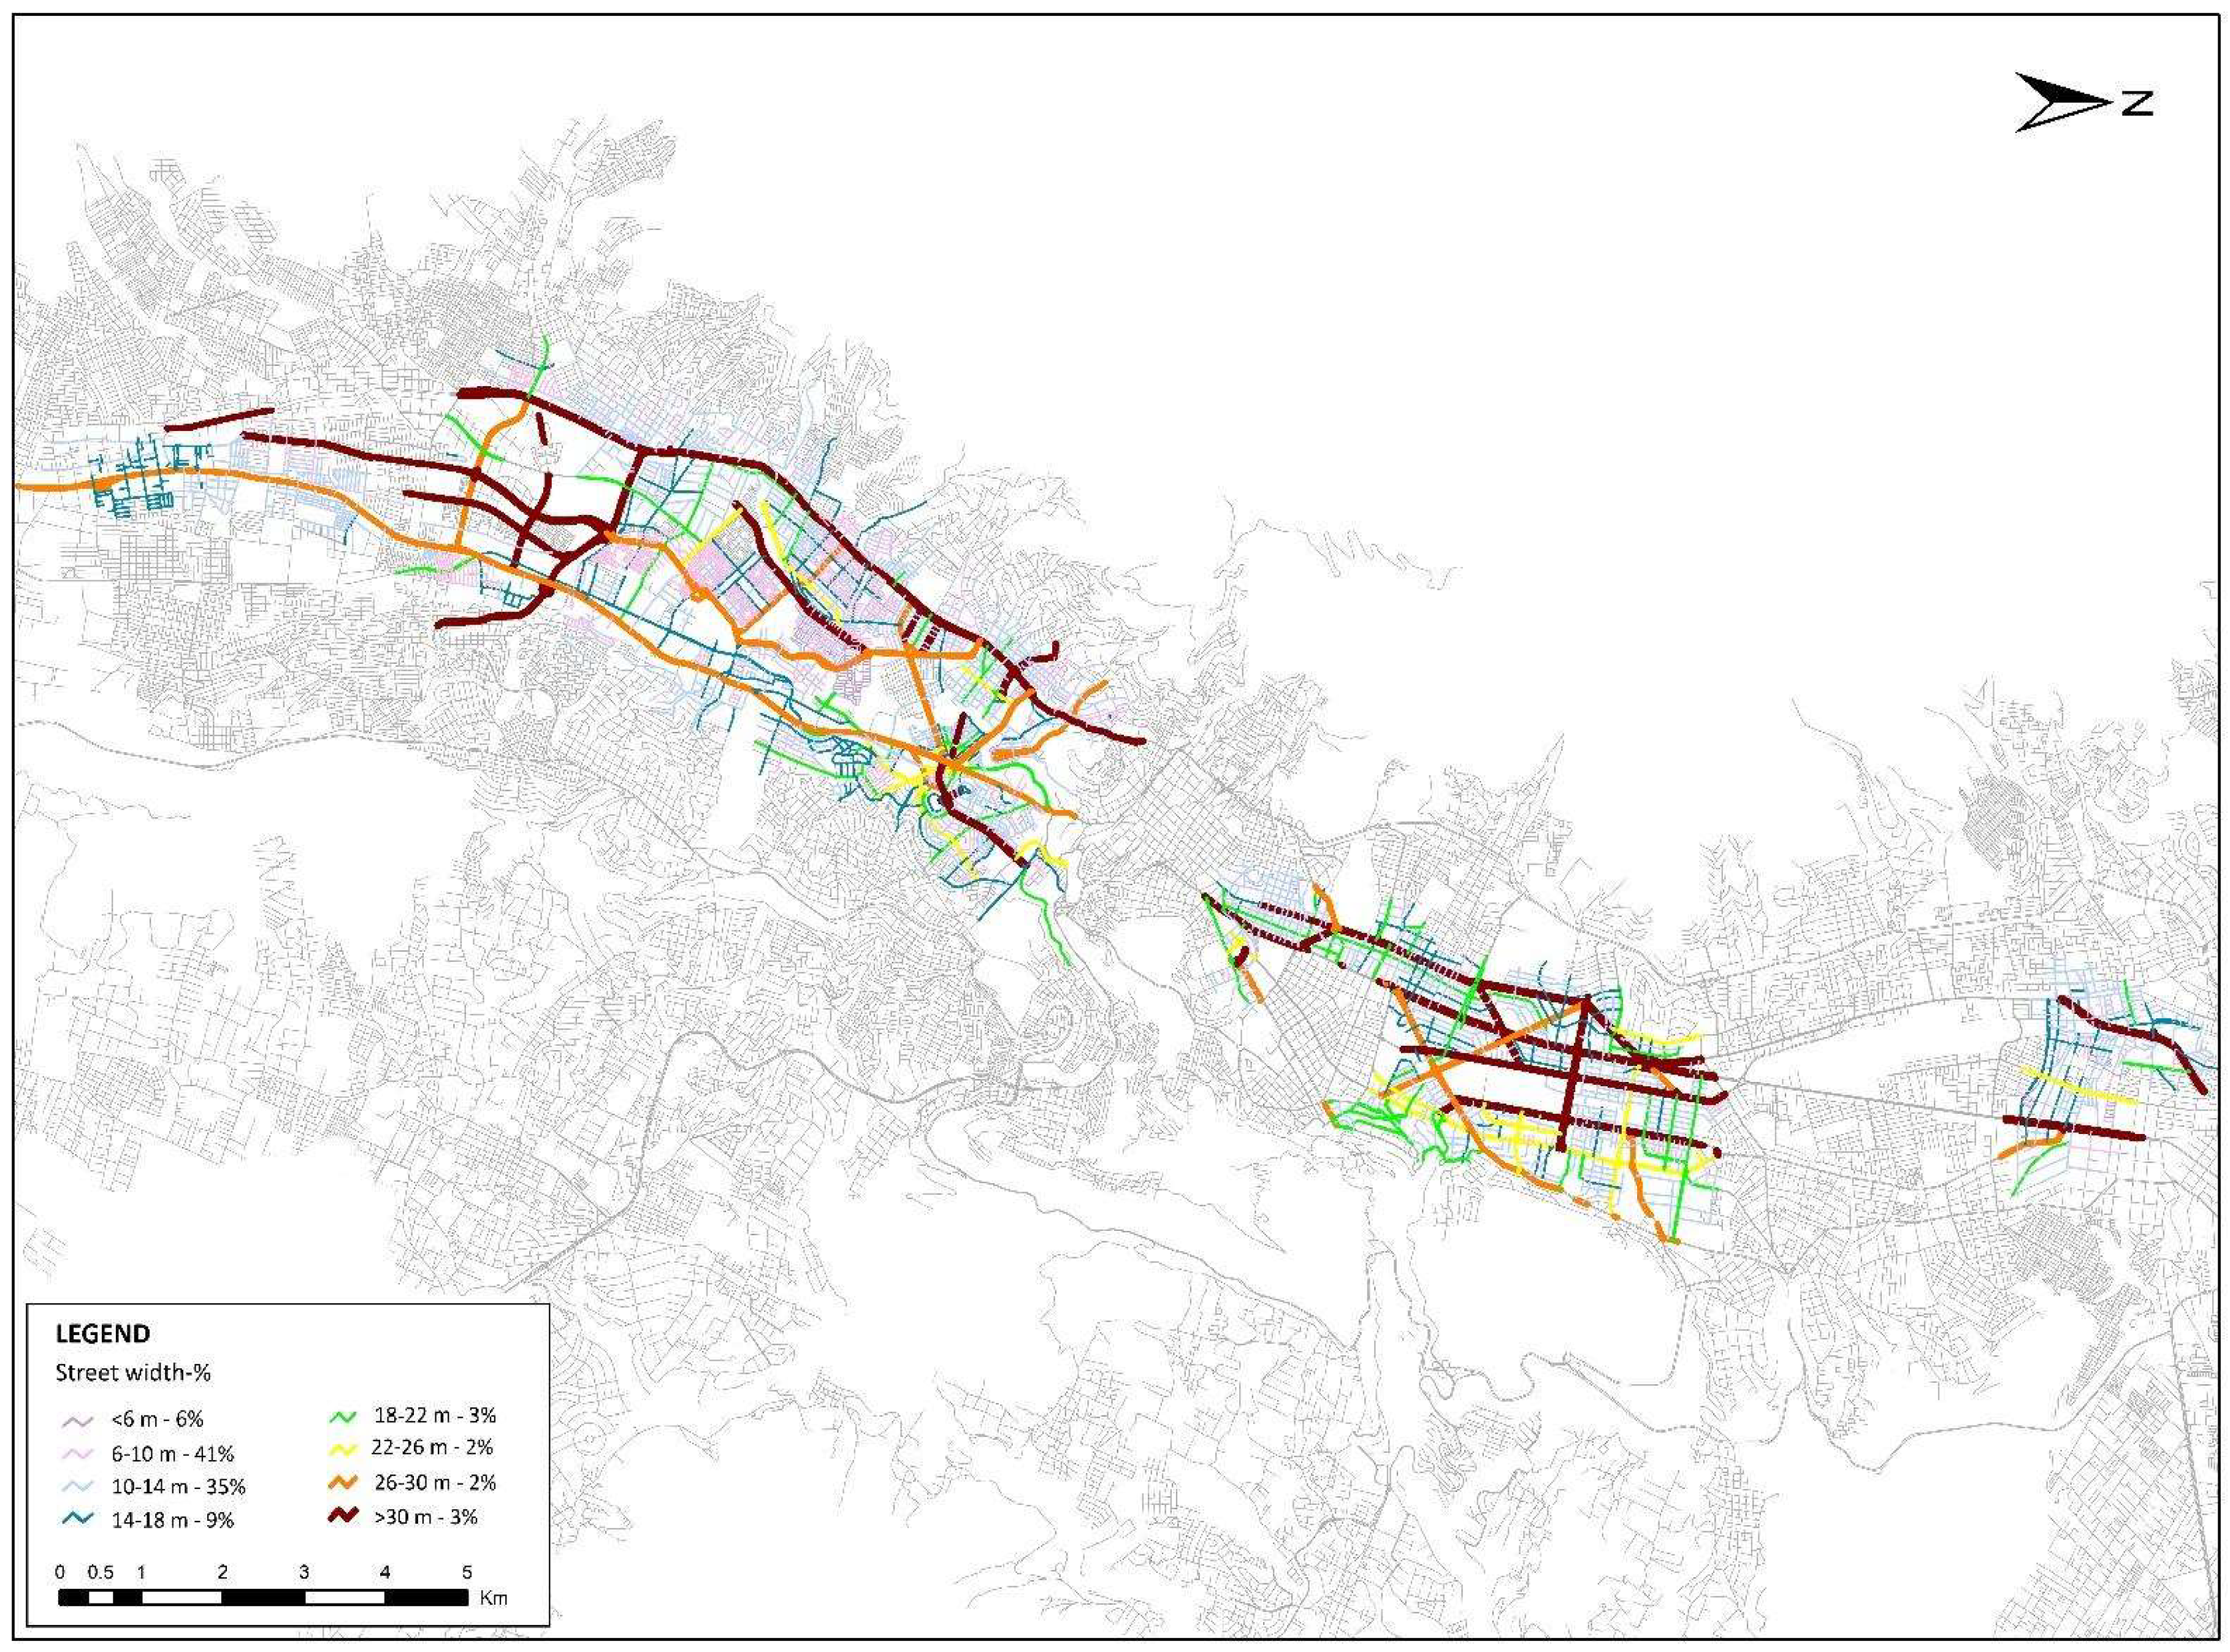
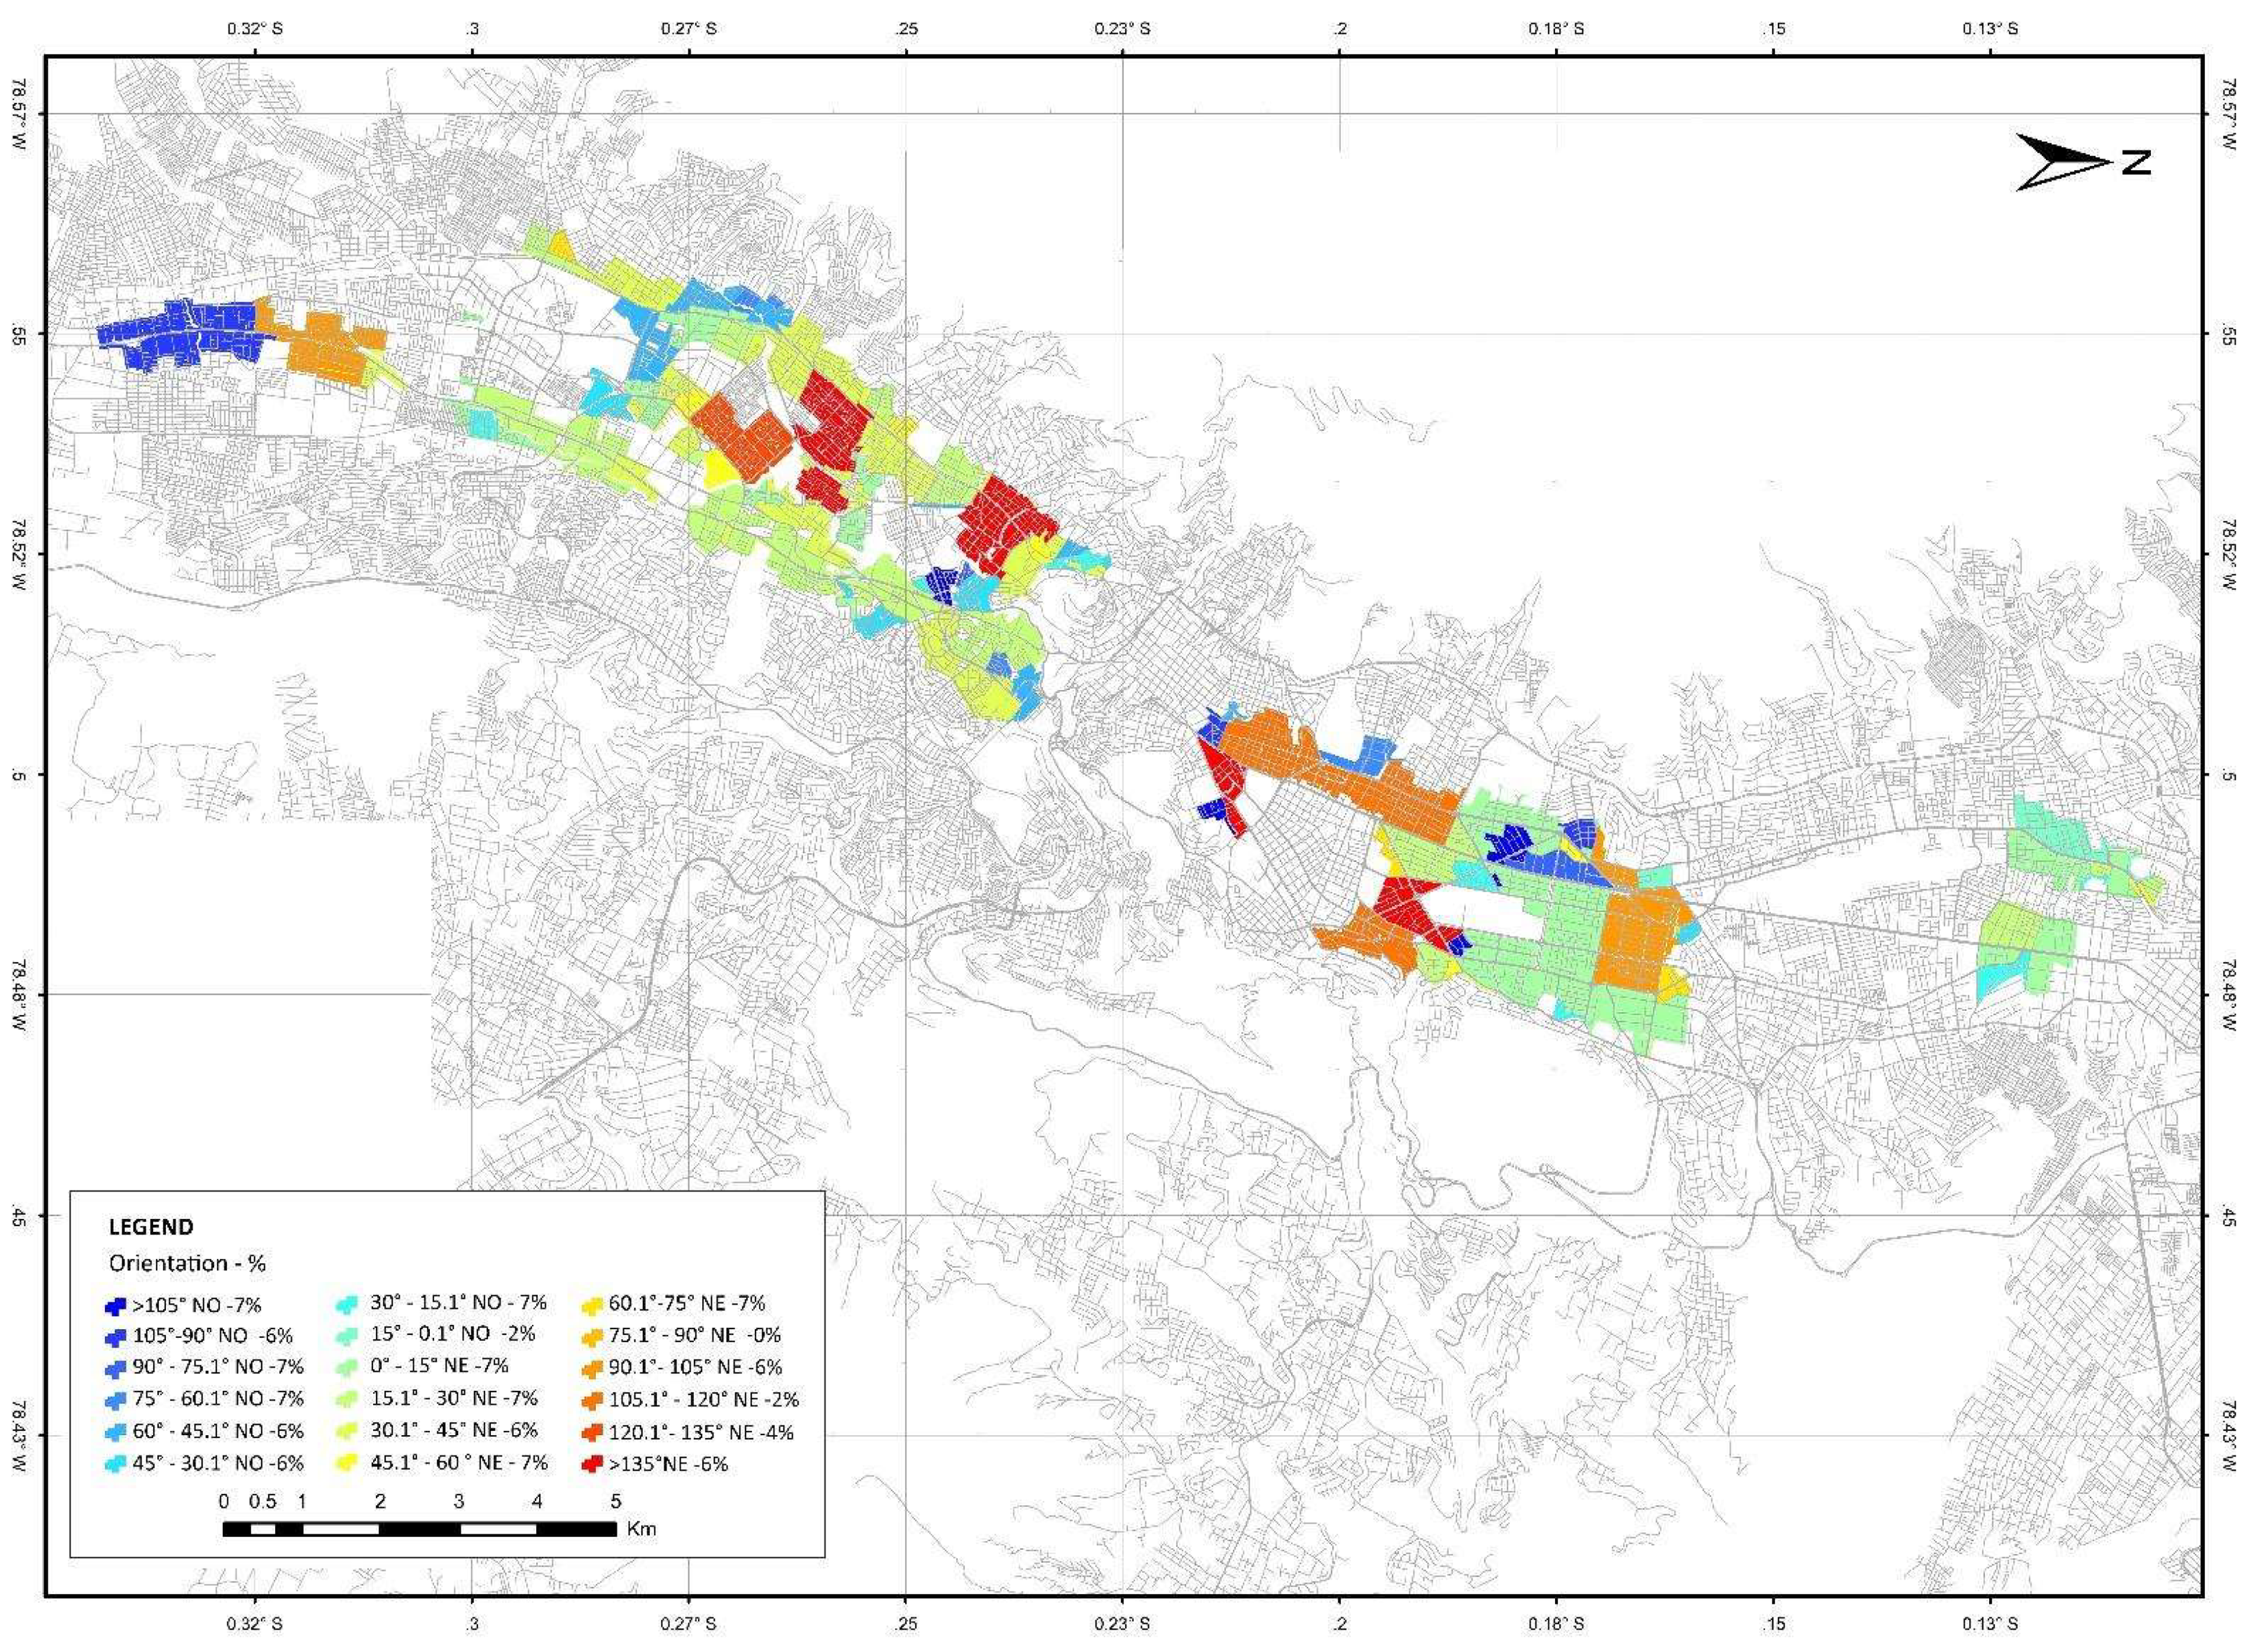
2.1. Urban Reference System
2.2. Case Study
2.3. Evaluation of Solar Access and Lighting Demand
2.4. Definition of Minimum Conditions
3. Results
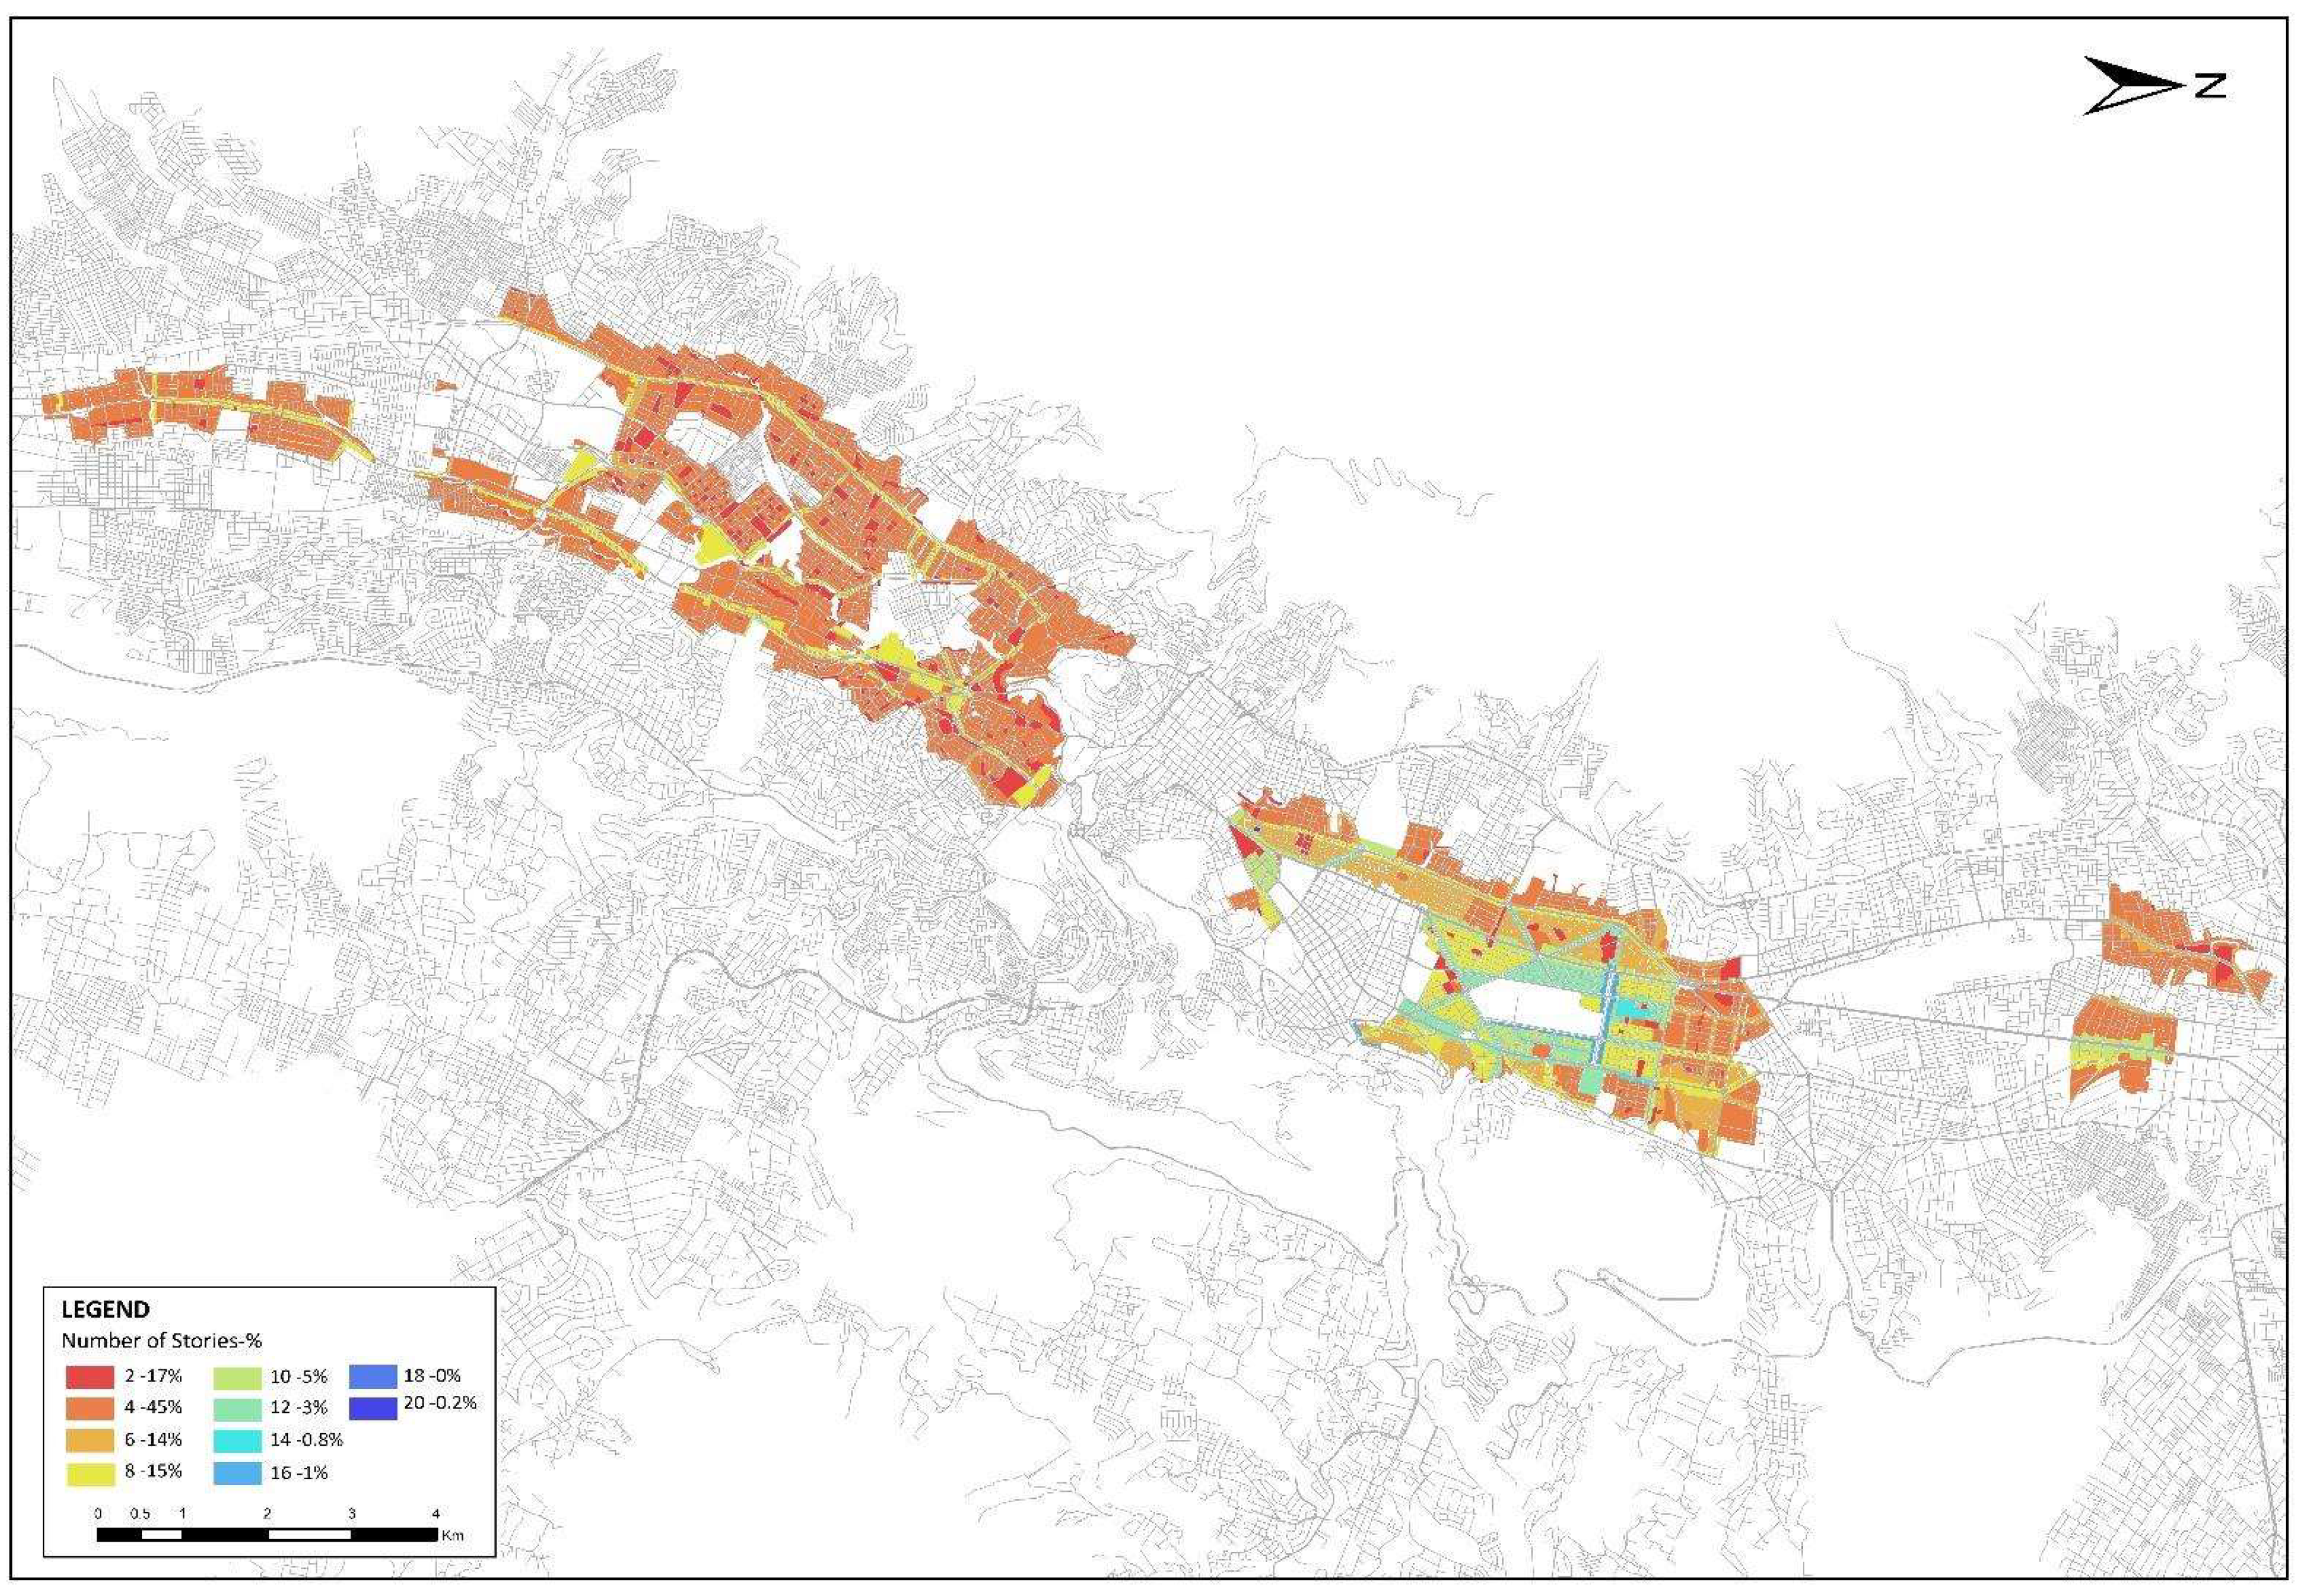
3.1. Characterization of the Urban and Building Context
3.2. Irradiance on Facades and Lighting Demands
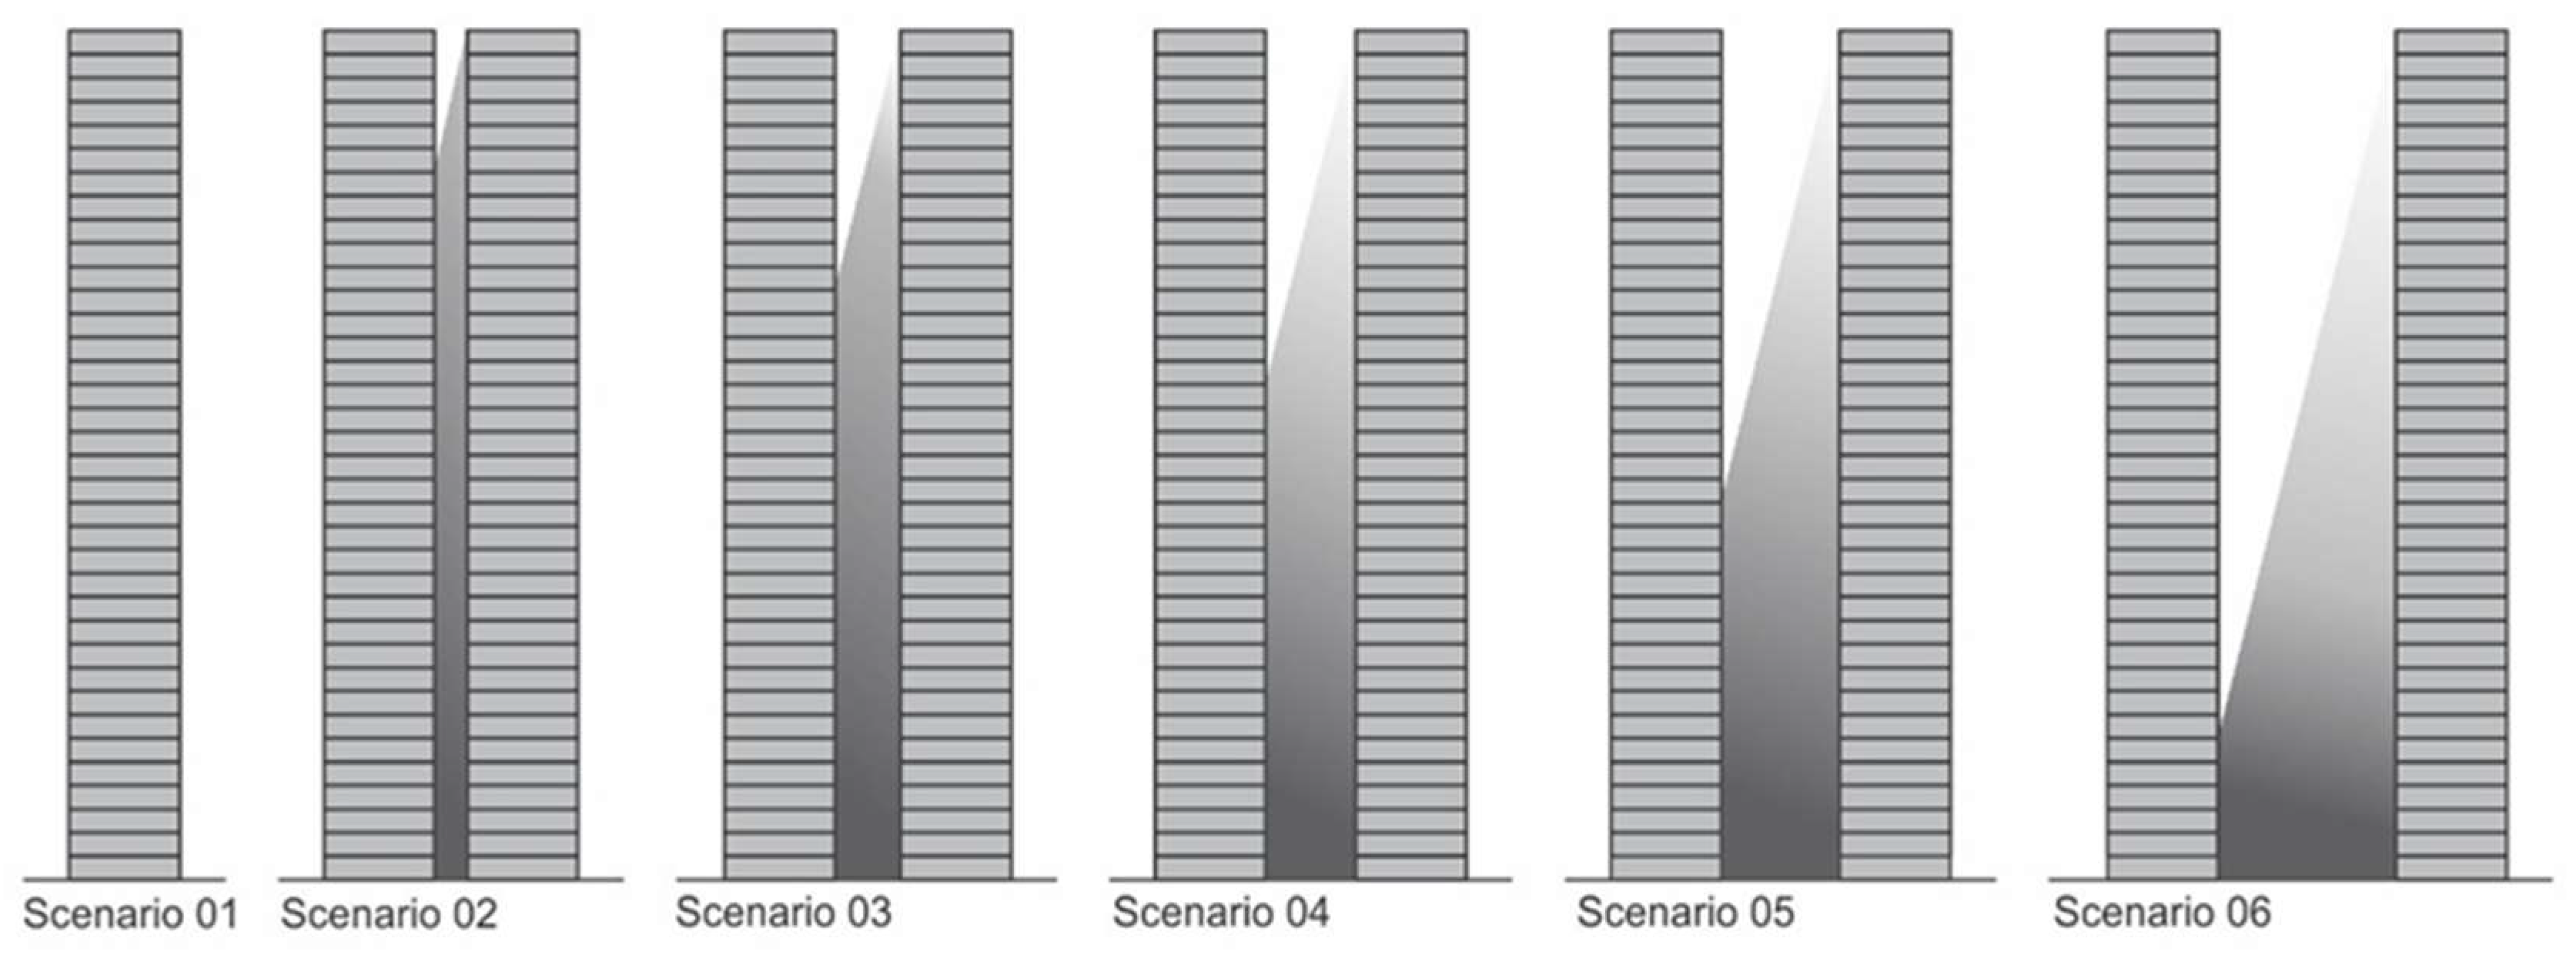
3.2.1. Scenario 1: Building with No Daylight Obstruction
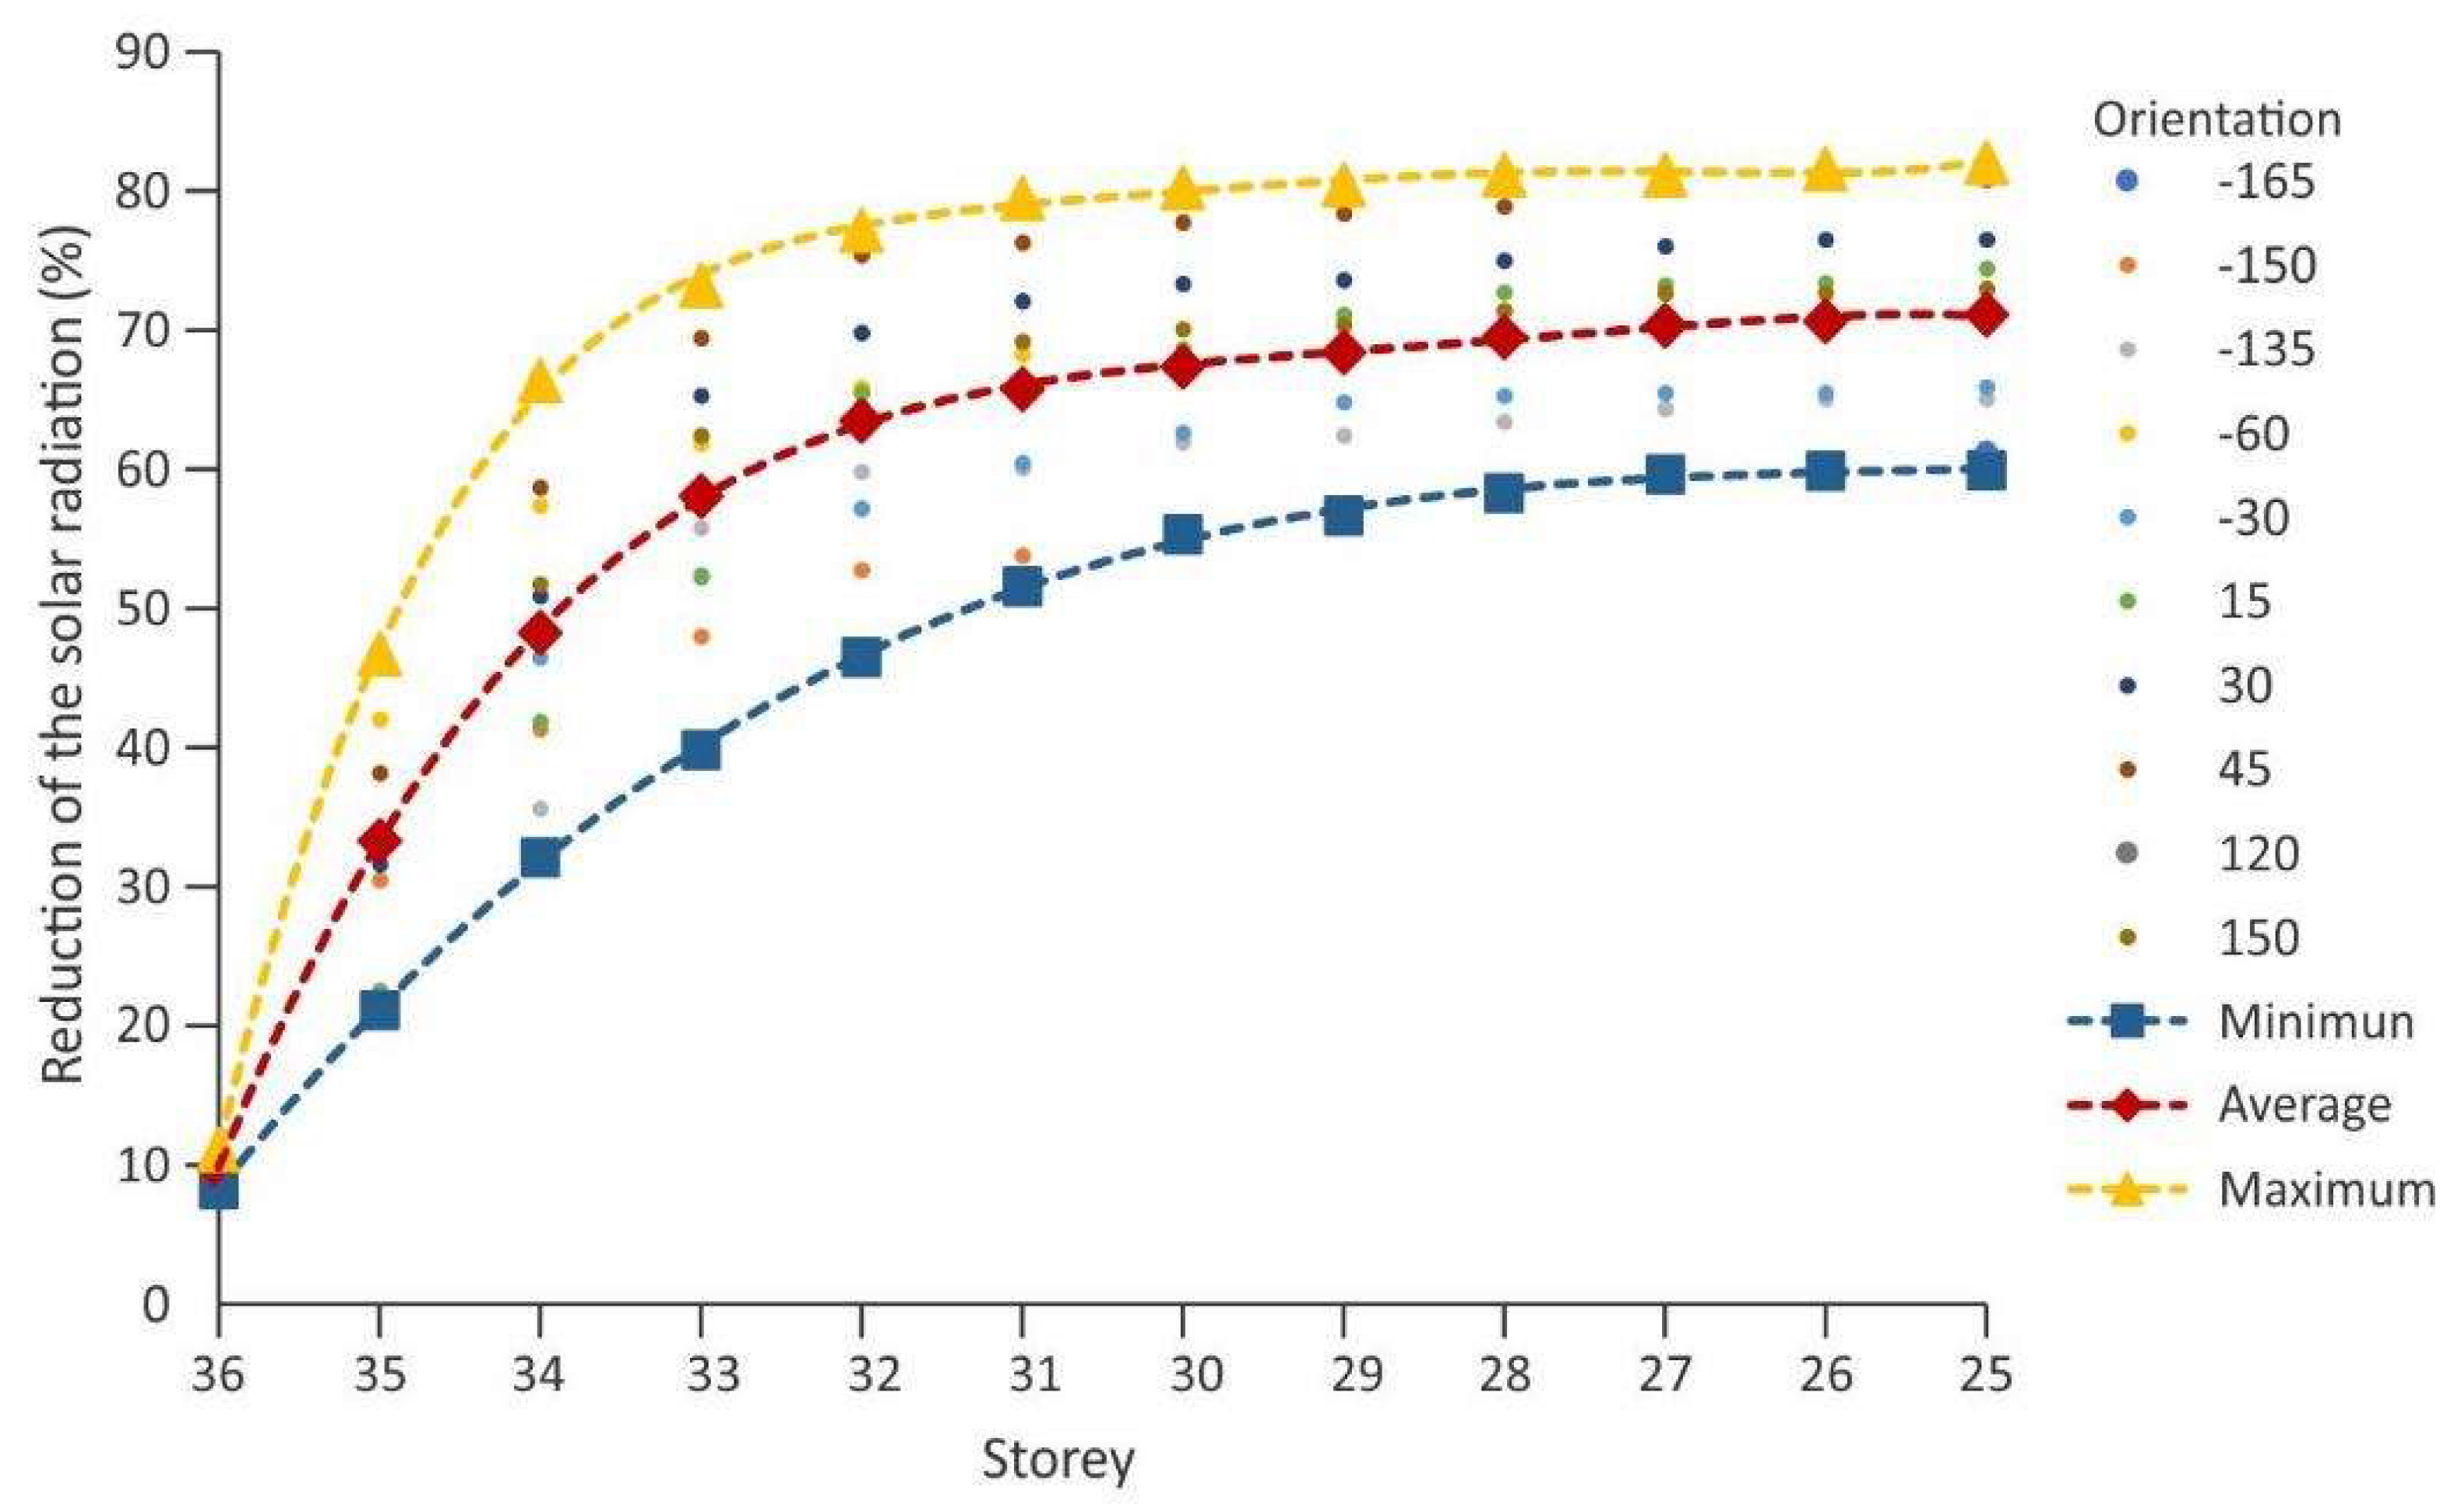
3.2.2. Scenario 2: Urban Canyon Ratio 24
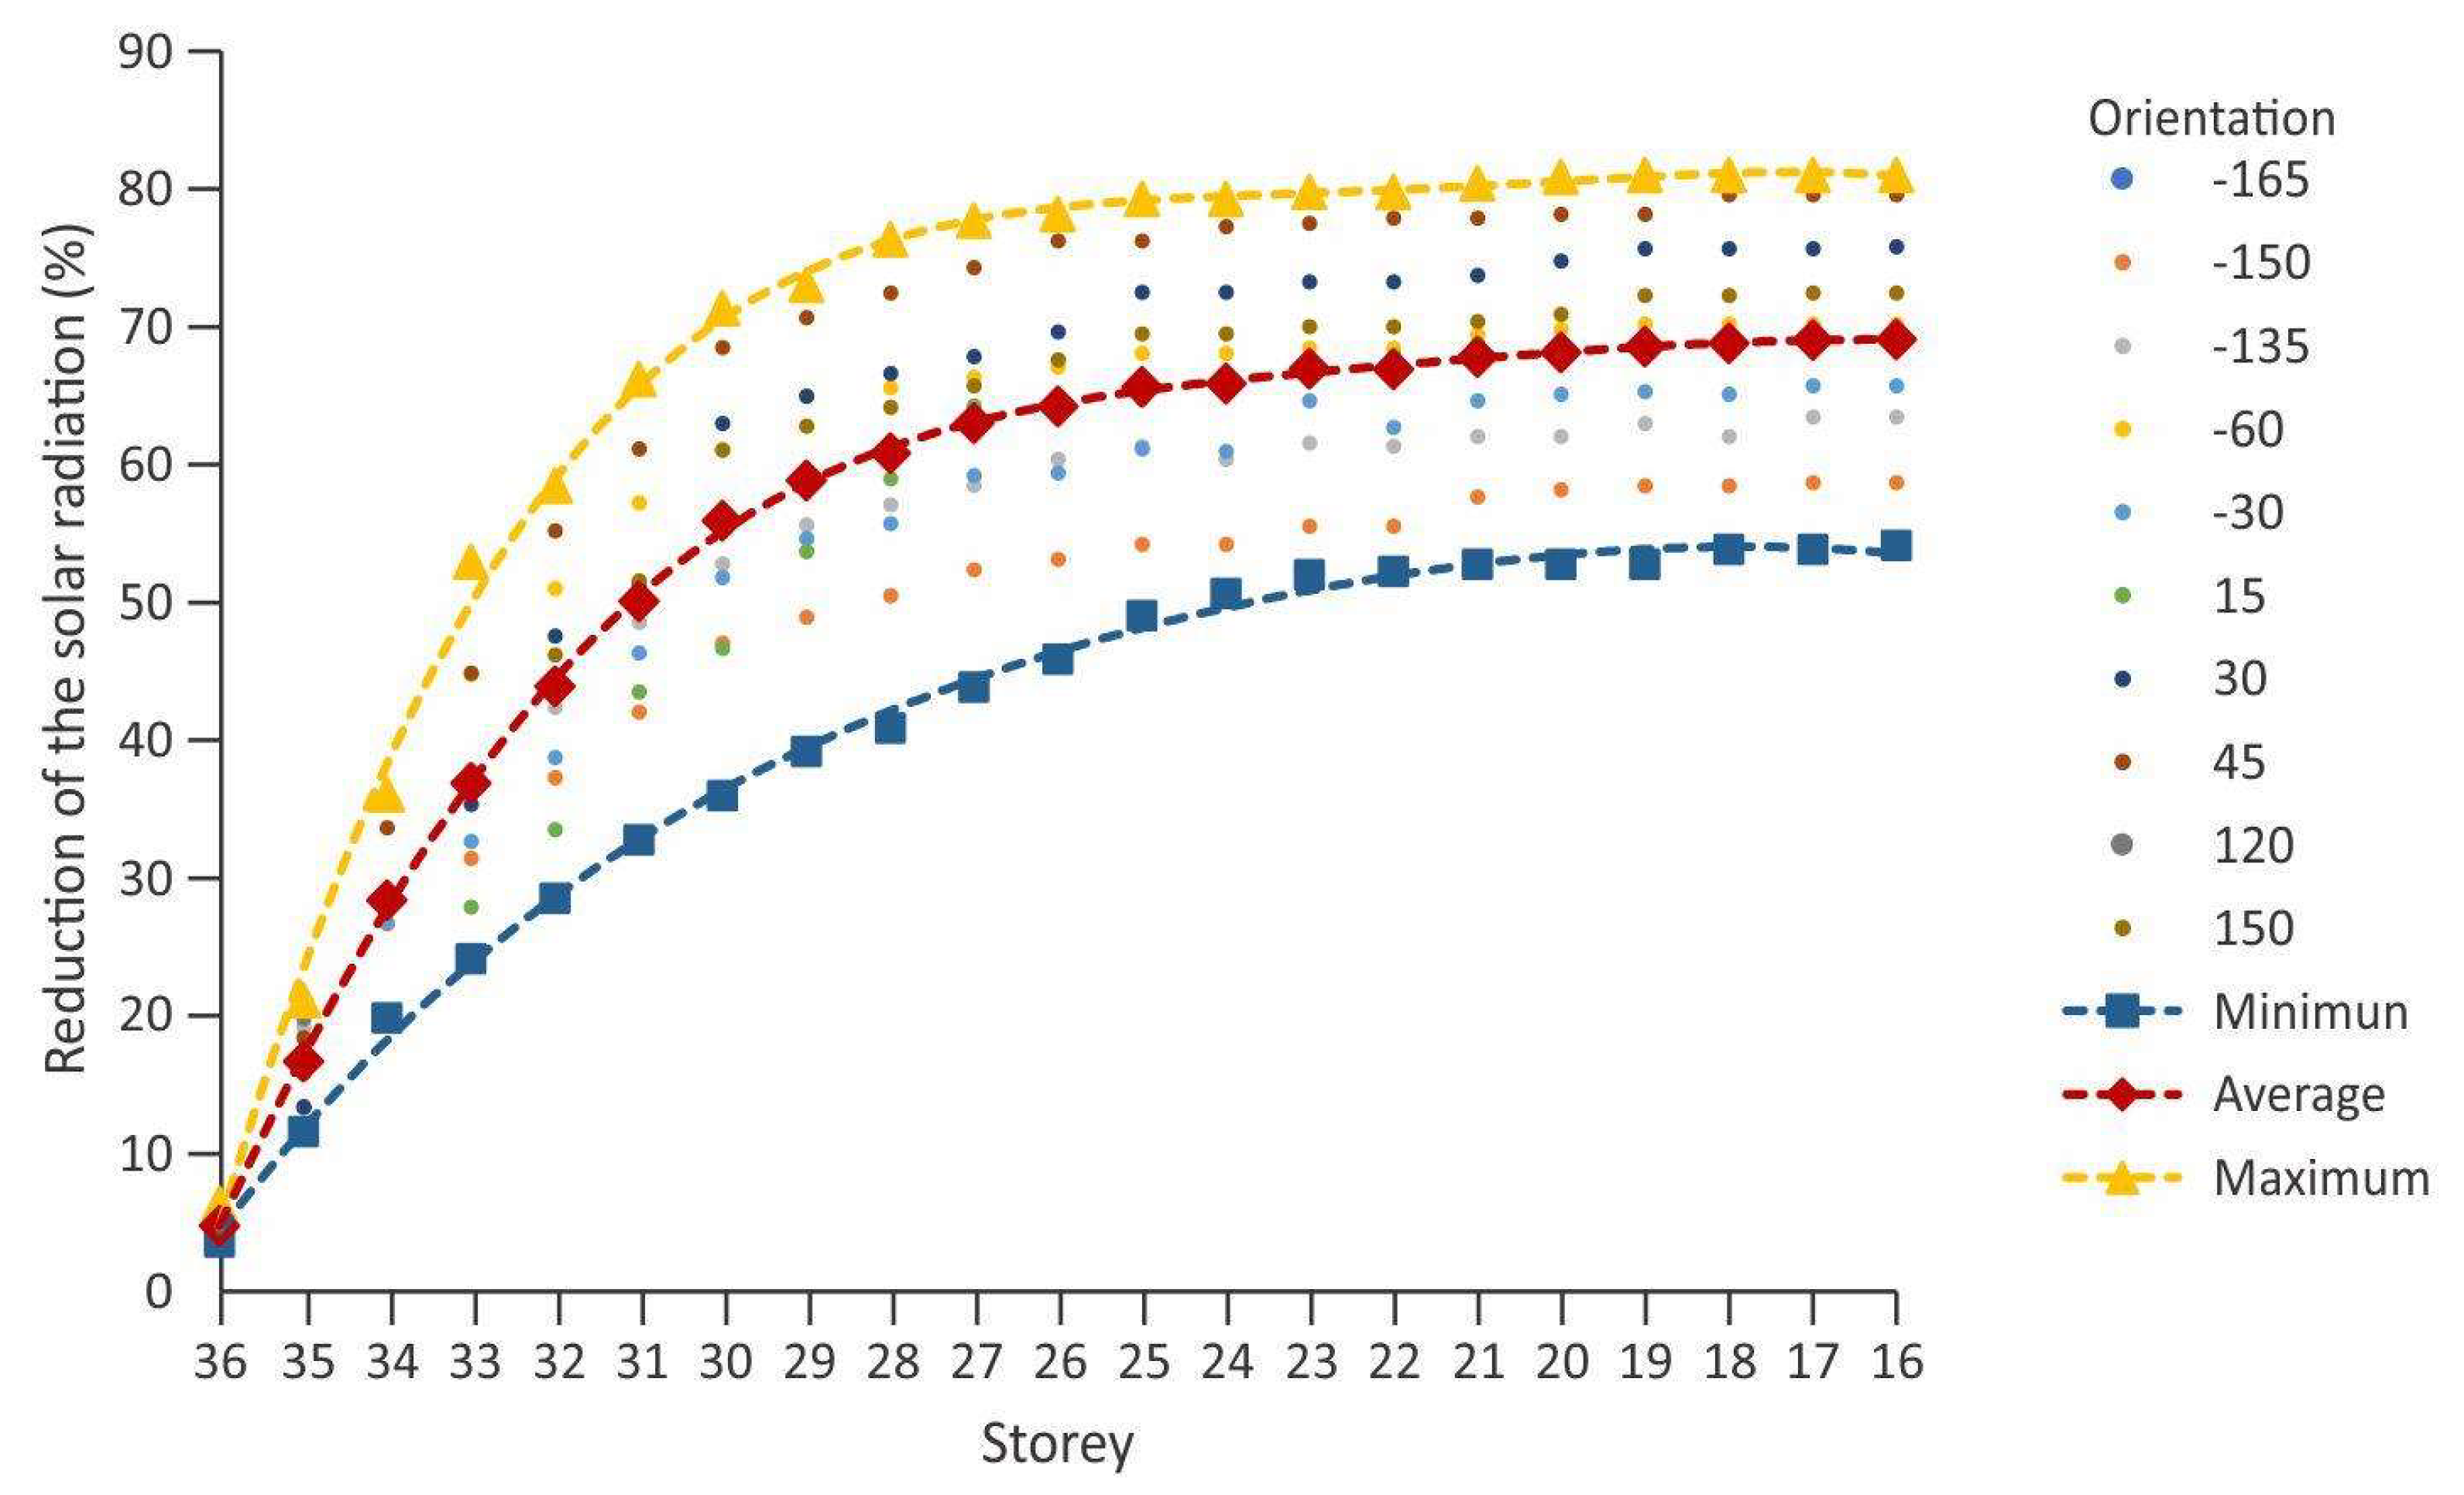
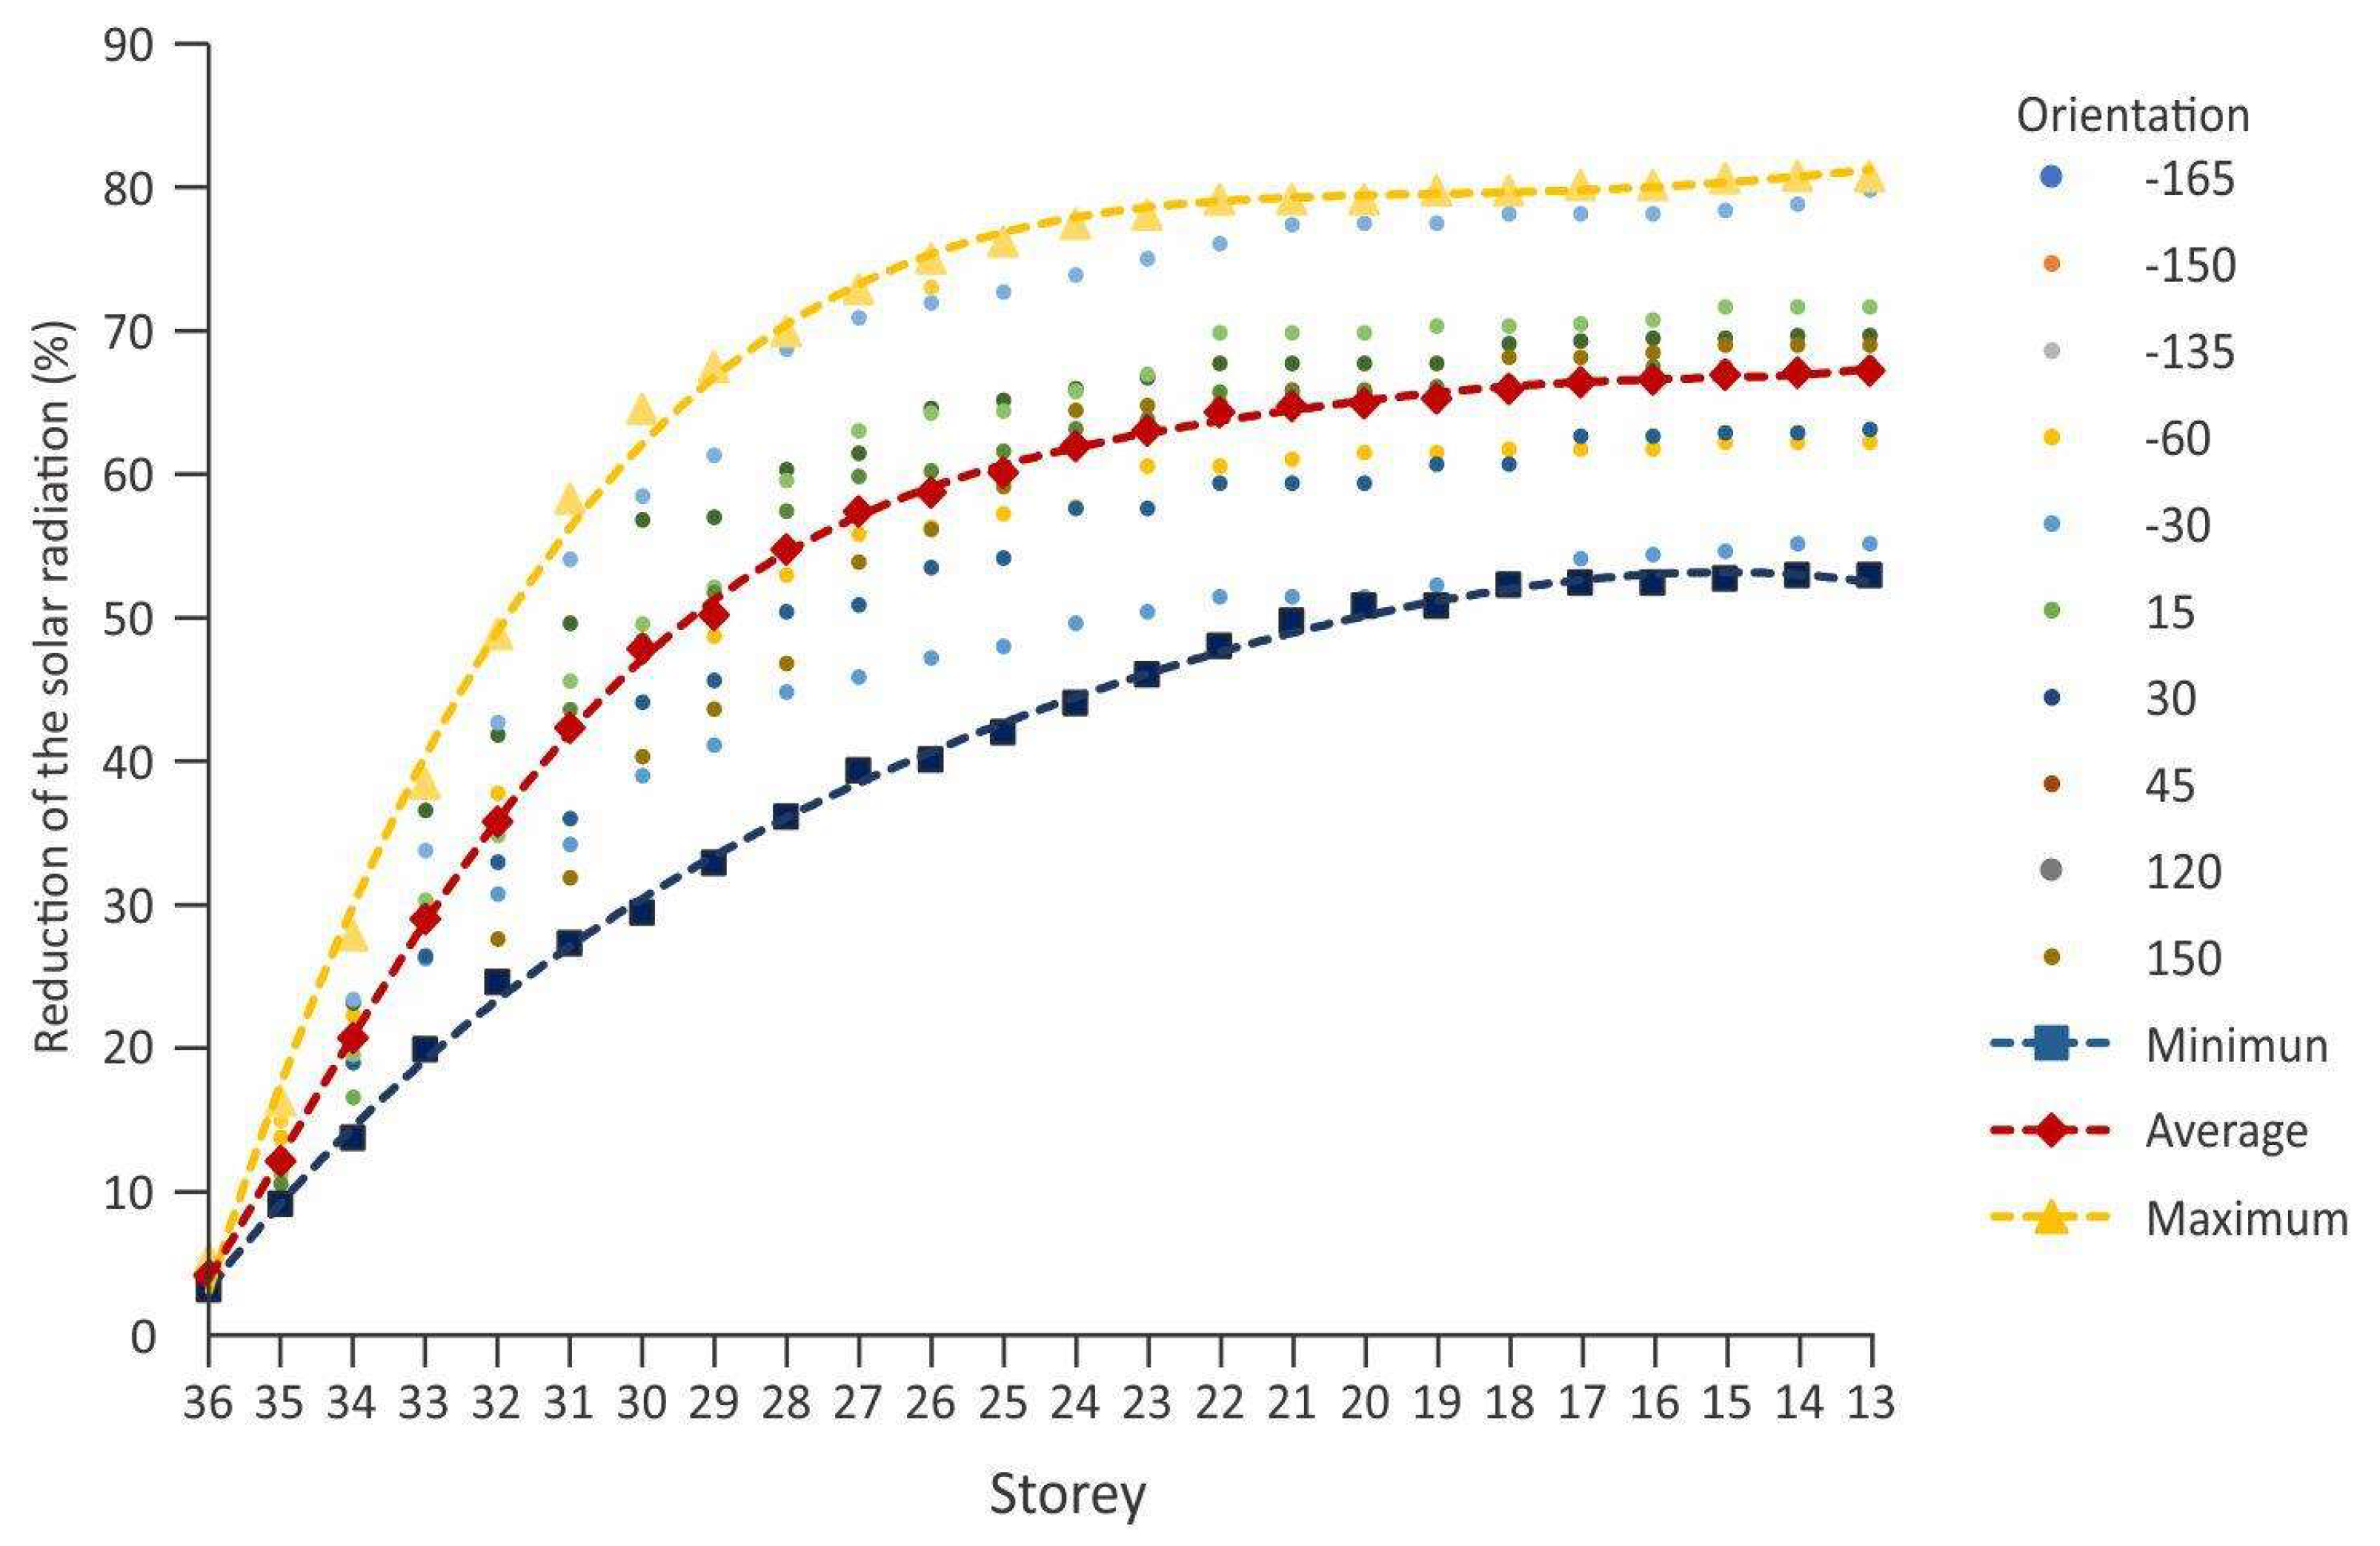
3.2.3. Scenario 3: Urban Canyon Ratio 12
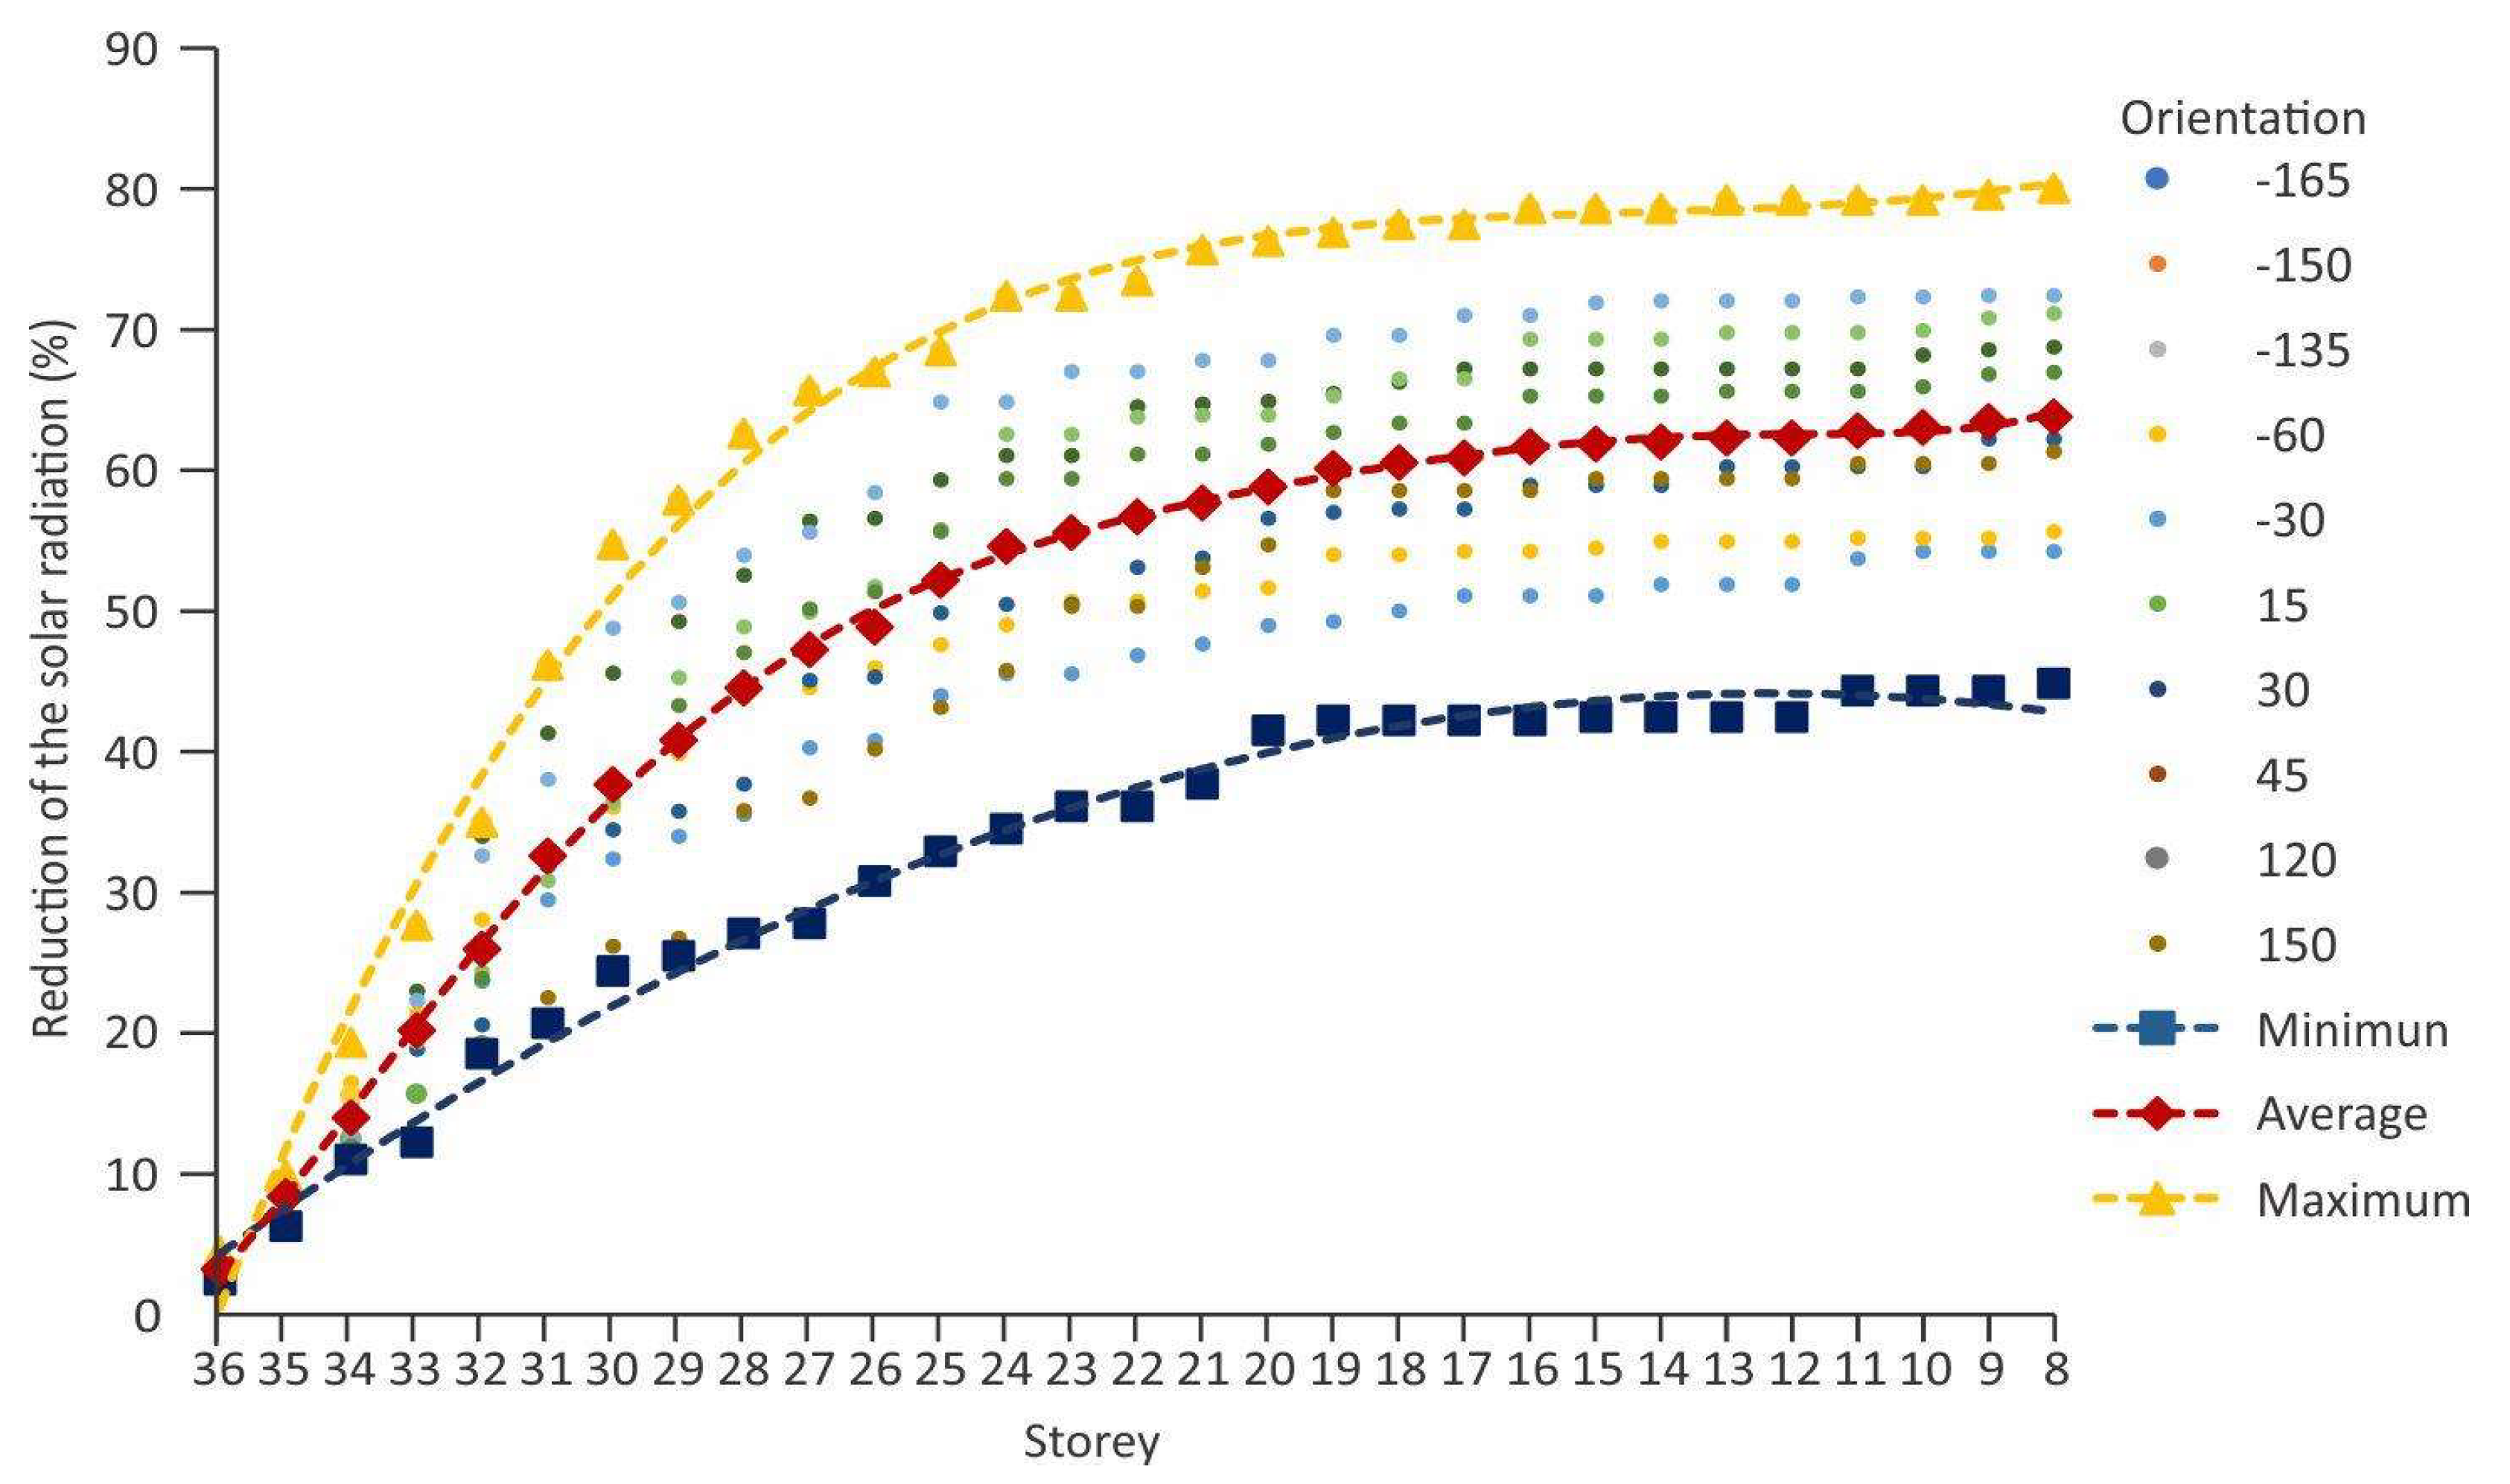
3.2.4. Scenario 4: Urban Canyon Ratio 9
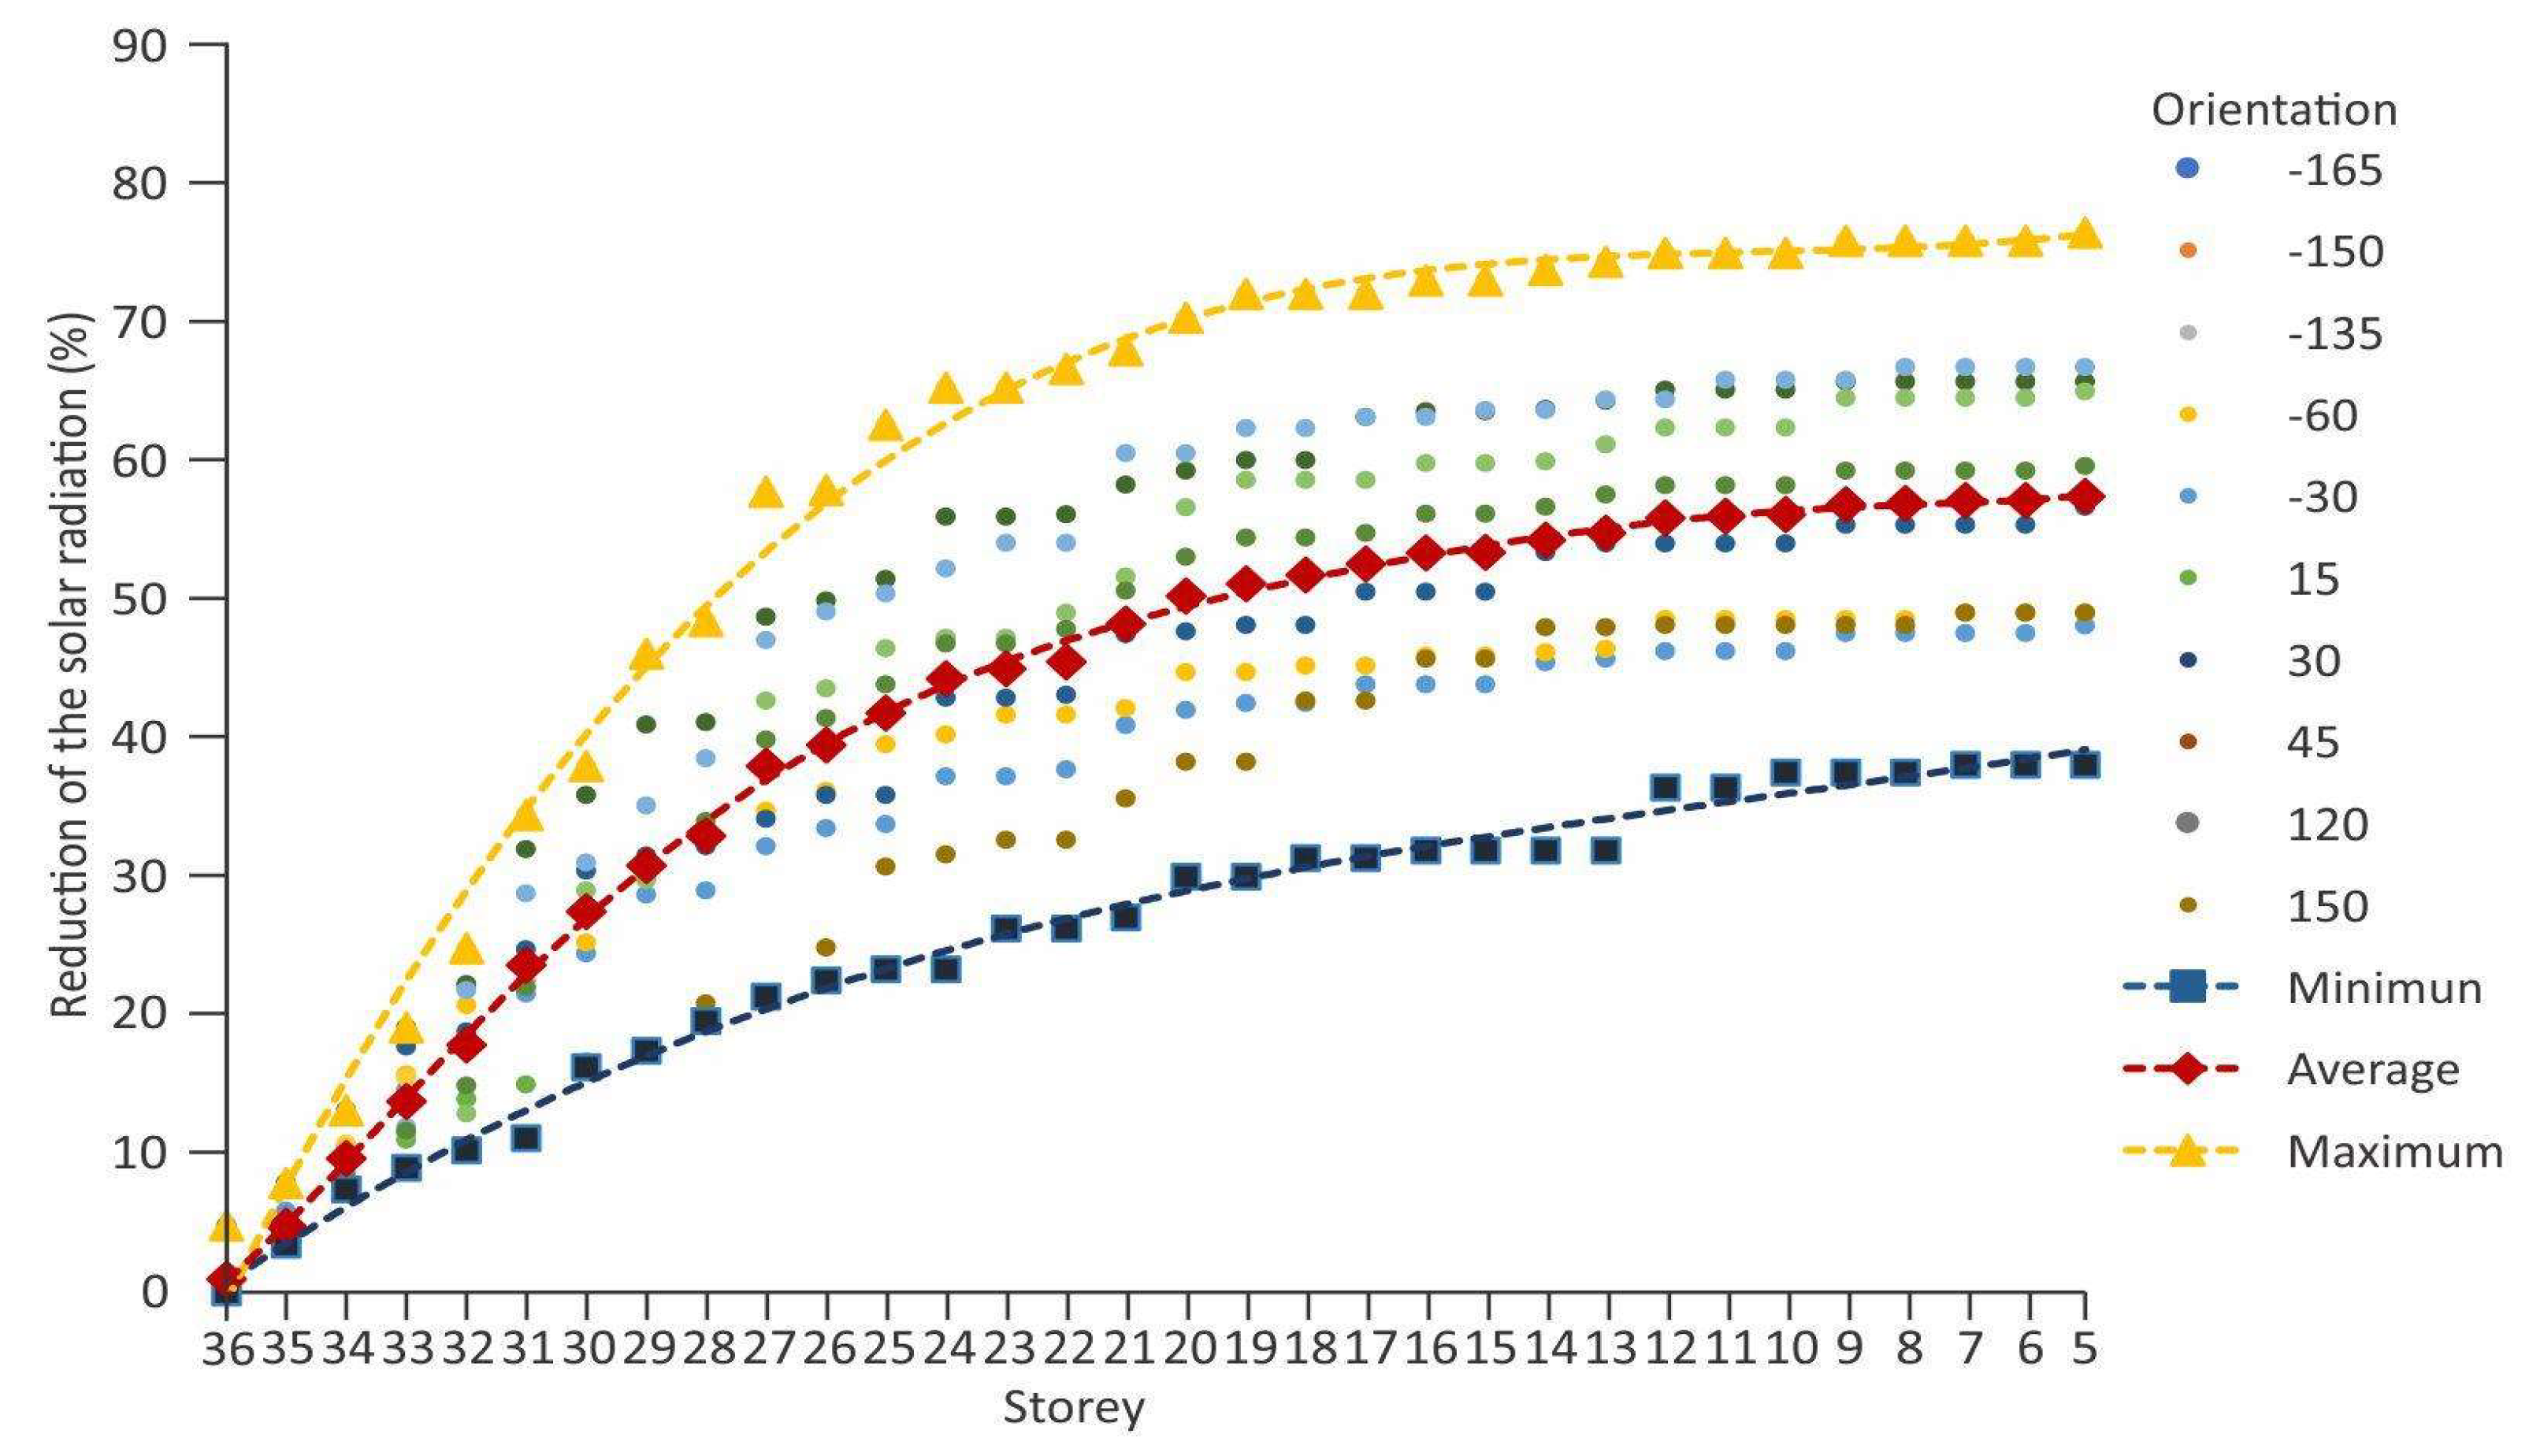
3.2.5. Scenario 5: Urban Canyon Ratio 6.5
3.2.6. Scenario 6: Urban Canyon Ratio 4.8
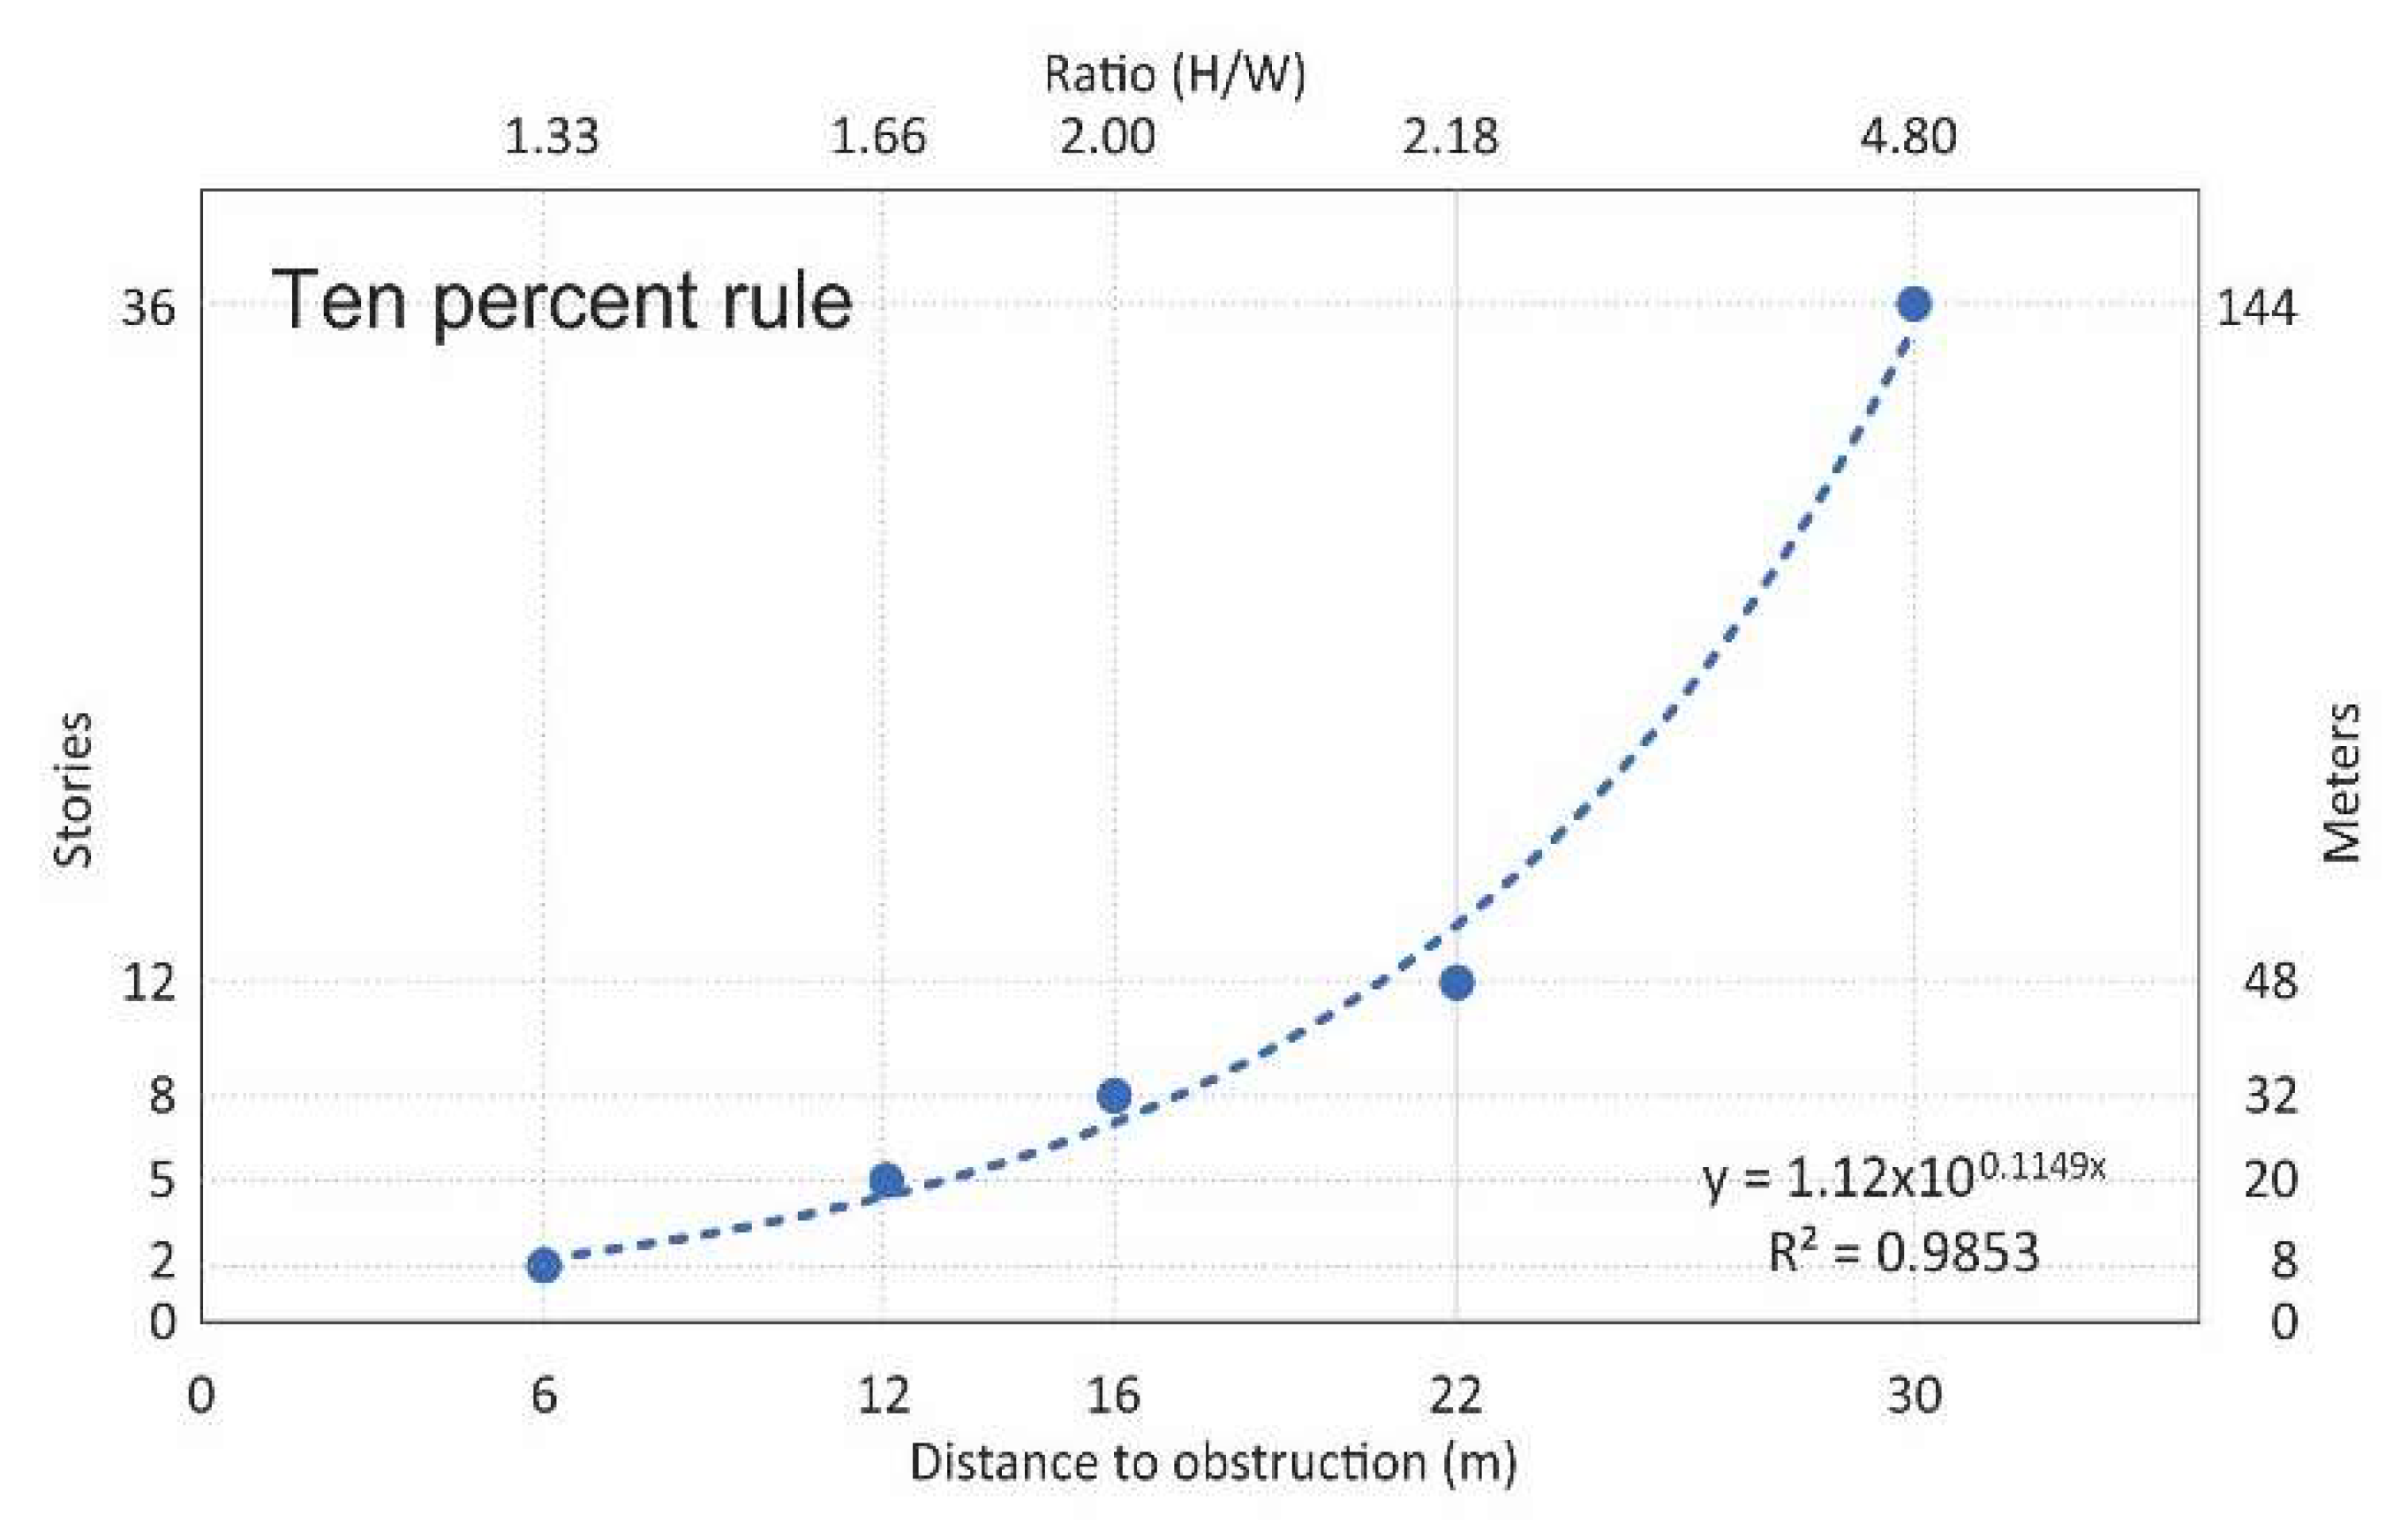
3.3. Minimum Location Conditions
4. Discussion
5. Conclusions
Author Contributions
Funding
Institutional Review Board Statement
Informed Consent Statement
Data Availability Statement
Acknowledgments
Conflicts of Interest
References
- Santamouris, M. Innovating to zero the building sector in Europe: Minimising the energy consumption, eradication of the energy poverty and mitigating the local climate change. Sol. Energy 2016, 128, 61–94. [Google Scholar] [CrossRef]
- Pérez-Fargallo, A.; Rubio-Bellido, C.; Pulido-Arcas, J.A.; Javier Guevara-García, F. Fuel Poverty Potential Risk Index in the context of climate change in Chile. Energy Policy 2018, 113, 157–170. [Google Scholar] [CrossRef]
- Shonali Pachauri, D.S. Energy Use and Energy Access in Relation to Poverty. Econ. Polit. Wkly. 2004, 39, 271–278. [Google Scholar]
- González-Eguino, M. Energy poverty: An overview. Renew. Sustain. Energy Rev. 2015, 47, 377–385. [Google Scholar] [CrossRef]
- Bouzarovski, S.; Petrova, S. A global perspective on domestic energy deprivation: Overcoming the energy poverty–fuel poverty binary. Energy Res. Soc. Sci. 2015, 10, 31–40. [Google Scholar] [CrossRef]
- IEA; UNEP. International Energy Agency and the United Nations Environment Programme—Global Status Report 2018: Towards a zero-emission, efficient and resilient buildings and construction sector. Glob. Status Rep. 2018, 73. Available online: https://www.iea.org/reports/2018-global-status-report (accessed on 2 March 2022).
- REPSOL. Anuario Estadístico-Energético. Dir. Estud. 2019, 169. Available online: https://www.repsol.com/content/dam/repsol-corporate/es/energia-e-innovacion/documentos-energia-e-innovacion/anuario-estadistico-energetico-2019.pdf (accessed on 2 March 2022).
- ARCONEL. Estadisticas Anuales Y Multianual Del Sector Eléctrico Ecuatoriano 2018; ARCONEL: Quito, Ecuador, 2019. [Google Scholar]
- Cárdenas–Jirón, L.A.; Uribe Araya, P. Acceso solar a las edificaciones. El eslabón pendiente en la norma urbanística chilena sobre la actividad proyectual. Rev. Urban. 2012, 2, 21–42. [Google Scholar]
- Lobaccaro, G.; Frontini, F. Solar energy in urban environment: How urban densification affects existing buildings. Energy Procedia 2014, 48, 1559–1569. [Google Scholar] [CrossRef] [Green Version]
- Capeluto, I.G.; Yezioro, A.; Bleiberg, T.; Shaviv, E. Solar rights in the design of urban spaces. In Proceedings of the PLEA 2006—23rd International Conference on Passive and Low Energy Architecture, Geneva, Switzerland, 6–8 September 2006; pp. 6–8. [Google Scholar]
- Curreli, A. El Acceso Solar a la Escala del Tejido Urbano. El Enfoque Morfológico y el Método de Análisis Comparativo Aplicados al Caso de Barcelona. Ph.D. Thesis, Universitat Politècnica de Catalunya, Departament de Tecnologia de l’Arquitectura, Barcelona, Spain, 2016; p. 335. [Google Scholar]
- Knowles, R.L. The solar envelope: Its meaning for energy and buildings. Energy Build. 2003, 35, 15–25. [Google Scholar] [CrossRef]
- Mccann, C.; Solar, K.; Meeting, A.S. A Comprehensive Review of Solar Access Law in the United States Suggested Standards for a Model Statute and Ordinance. 2008. Available online: http://www.solarabcs.org/about/publications/reports/solar-access/ (accessed on 2 March 2022).
- Derby, G.S. Ligation of the Common Carotid Artery for Malignant Recurrent Hemorrhage of the Vitreous. JAMA J. Am. Med. Assoc. 1907, XLIX, 107–110. [Google Scholar] [CrossRef] [Green Version]
- Tereci, A.; Ozkan, S.T.E.; Eicker, U. Energy benchmarking for residential buildings. Energy Build. 2013, 60, 92–99. [Google Scholar] [CrossRef]
- Van Esch, M.M.E.; Looman, R.H.J.; De Bruin-Hordijk, G.J. The effects of urban and building design parameters on solar access to the urban canyon and the potential for direct passive solar heating strategies. Energy Build. 2012, 47, 189–200. [Google Scholar] [CrossRef]
- O’Brien, W.T.; Kennedy, C.A.; Athienitis, A.K.; Kesik, T.J. The relationship between net energy use and the urban density of solar buildings. Environ. Plan. B Plan. Des. 2010, 37, 1002–1021. [Google Scholar] [CrossRef]
- Alicia, L.; Jirón, C.; Pablo, J.; Zamorano, J.C.; Acevedo, C. Explorando luz solar en modelos de desarrollo inmobiliario. Aplicaciones en cinco ciudades chilenas. Rev. Urban. 2016, 34, 158–173. [Google Scholar]
- Pérez-Fargallo, A.; Rubio-Bellido, C.; Pulido-Arcas, J.A.; Trebilcock, M. Development policy in social housing allocation: Fuel poverty potential risk index. Indoor Built Environ. 2017, 26, 980–998. [Google Scholar] [CrossRef]
- Thomson, H.; Bouzarovski, S.; Snell, C. Rethinking the measurement of energy poverty in Europe: A critical analysis of indicators and data. Indoor Built Environ. 2017, 26, 879–901. [Google Scholar] [CrossRef]
- Boardman, B. Fixing Fuel Poverty: Challenges and Solutions; Earthscan: London, UK, 2010. [Google Scholar]
- Rosenow, J.; Platt, R.; Flanagan, B. Fuel poverty and energy efficiency obligations—A critical assessment of the supplier obligation in the UK. Energy Policy 2013, 62, 1194–1203. [Google Scholar] [CrossRef]
- Ambrose, A.R. Improving energy efficiency in private rented housing: Why don’t landlords act? Indoor Built Environ. 2015, 24, 913–924. [Google Scholar] [CrossRef]
- Love, J.; Cooper, A.C. From social and technical to socio-technical: Designing integrated research on domestic energy use. Indoor Built Environ. 2015, 24, 986–998. [Google Scholar] [CrossRef]
- Snell, C.; Bevan, M.; Thomson, H. Justice, fuel poverty and disabled people in England. Energy Res. Soc. Sci. 2015, 10, 123–132. [Google Scholar] [CrossRef]
- Wang, P.; Liu, Z.; Zhang, L. Sustainability of compact cities: A review of Inter-Building Effect on building energy and solar energy use. Sustain. Cities Soc. 2021, 72, 103035. [Google Scholar] [CrossRef]
- Baker, N.; Steemers, K. Energy and Environment in Architecture: A Technical Design Guide. Available online: https://books.google.com.ec/books?hl=es&lr=&id=FJp5AgAAQBAJ&oi=fnd&pg=PP1&ots=6jxEryx_7L&sig=EMIGJUAlwL8QlisH1fG4eq38d58&redir_esc=y#v=onepage&q&f=false (accessed on 4 June 2021).
- Sanaieian, H.; Tenpierik, M.; Van Den Linden, K.; Mehdizadeh Seraj, F.; Mofidi Shemrani, S.M. Review of the impact of urban block form on thermal performance, solar access and ventilation. Renew. Sustain. Energy Rev. 2014, 38, 551–560. [Google Scholar] [CrossRef]
- Hachem, C.; Athienitis, A.; Fazio, P. Evaluation of energy supply and demand in solar neighborhood. Energy Build. 2012, 49, 335–347. [Google Scholar] [CrossRef]
- Quan, S.J.; Li, C. Urban form and building energy use: A systematic review of measures, mechanisms, and methodologies. Renew. Sustain. Energy Rev. 2021, 139, 110662. [Google Scholar] [CrossRef]
- Franco Medina, R.; Bright, P.; Benitez, J.; Beckers, B. A study of solar access in Bogotá: The Las Nieves neighborhood. In Proceedings of the First International Conference on Urban Physics, Quito, Ecuador, 25 September–2 October 2016; pp. 96–121. [Google Scholar]
- Han, Y.; Taylor, J.E.; Pisello, A.L. Exploring mutual shading and mutual reflection inter-building effects on building energy performance. Appl. Energy 2017, 185, 1556–1564. [Google Scholar] [CrossRef] [Green Version]
- Mangan, S.D.; Koclar Oral, G.; Erdemir Kocagil, I.; Sozen, I. The impact of urban form on building energy and cost efficiency in temperate-humid zones. J. Build. Eng. 2021, 33, 101626. [Google Scholar] [CrossRef]
- Krüger, E.; Suga, M. Recommendations of height restrictions for urban Canyons in Curitiba, Brazil. J. Asian Archit. Build. Eng. 2009, 8, 447–452. [Google Scholar] [CrossRef] [Green Version]
- Carrión, F.; Erazo Espinosa, J. La forma urbana de Quito: Una historia de centros y periferias. Bull. L’institut Français D’études Andin. 2012, 41, 503–522. [Google Scholar] [CrossRef] [Green Version]
- Peralta Arias, J.; Higueras García, E. Sustainable urban evaluation of Quito’s Master Plans. Period 1942–2012. Estoa 2016, 5, 21–34. [Google Scholar] [CrossRef] [Green Version]
- Cuvi, N. Un análisis de la resiliencia en Quito, 1980–2015. Bitácora Urbano Territorial. 2016, 25, 35. [Google Scholar] [CrossRef]
- Durán, G.; Martí, M.; Mérida, J. Crecimiento, segregación y mecanismos de desplazamiento en el periurbano de Quito. Íconos-Rev Cienc. Soc. 2016, 56, 123–146. [Google Scholar] [CrossRef] [Green Version]
- Carrión, F.; Pinto, J.P. Producción y organización espacial de viejas y ‘nuevas’ desigualdades en Quito. Andamios Rev. Investig. Soc. 2019, 16, 101. [Google Scholar] [CrossRef] [Green Version]
- Herrero Olarte, S. Identifying Patterns of Labor Exclusion by Residencial Causes in South America: The Case of Quito. J. Urban Reg. Anal. 2021, 13. [Google Scholar] [CrossRef]
- CAMICON. Quito, el Cantón más Poblado del Ecuador en el 2020. Available online: https://www.camicon.ec/la-camara-quito-el-canton-mas-poblado-del-ecuador-en-el-2020/ (accessed on 13 December 2020).
- Secretaría de Territorio. Hábitat y Vivienda Anexo 2. Instructivo de Aplicación de los Parámetros de Eco-Eficiencia; Secretaría de Territorio, Hábitat y Vivienda: Quito, Ecuador, 2020; pp. 1–61.
- Rodriguez, D.A.; Vergel-Tovar, E.; Camargo, W.F. Land development impacts of BRT in a sample of stops in Quito and Bogotá. Transp. Policy 2016, 51, 4–14. [Google Scholar] [CrossRef]
- Bocarejo, J.P.; Portilla, I.; Pérez, M.A. Impact of Transmilenio on density, land use, and land value in Bogotá. Res. Transp. Econ. 2013, 40, 78–86. [Google Scholar] [CrossRef]
- López-Morales, E.; Sanhueza, C.; Espinoza, S.; Órdenes, F. Verticalización inmobiliaria y valorización de renta de suelo por infraestructura pública: Un análisis econométrico del gran santiago, 2008–2011. Eure 2019, 45, 113–134. [Google Scholar] [CrossRef] [Green Version]
- Sandroni, P. Recent Experience with Land Value Capture in São Paulo, Brazil. Available online: https://www.lincolninst.edu/publications/articles/recent-experience-land-value-capture-sao-paulo-brazil (accessed on 13 December 2020).
- Baquero, M.; Quesada, F. Eficiencia energética en el sector residencial de la Ciudad de Cuenca, Ecuador. Maskana 2016, 7, 147–165. [Google Scholar] [CrossRef] [Green Version]
- Poruschi, L.; Ambrey, C.L. Densification, what does it mean for fuel poverty and energy justice? An empirical analysis. Energy Policy 2018, 117, 208–217. [Google Scholar] [CrossRef]
- Municipio del Distrito Metropolitano de Quito. Ordenanza Metropolitana 210. PUOS; Secretaría de Territorio Hábitat y Vivienda: Quito, Ecuador, 2018. Available online: https://gobiernoabierto.quito.gob.ec/wp-content/uploads/documentos/ordenanzas/ordenanzas_sancionadasview.php?showdetail=&ORD=210 (accessed on 2 March 2022).
- Jhohnson, B. Patterns of Residential Occupancy; National Research Council Of Canada Report No. 464; National Research Council of Canada: Ottawa, ON, Canada, 1981. Available online: http://web.mit.edu/parmstr/Public/NRCan/ir464.pdf (accessed on 2 March 2022).
- Ministerior De Desarrollo Urbano Y Vivienda (MIDUVI). Eficiencia Energética en Edificaciones Residenciales NEC-HS-EE; Ministerior De Desarrollo Urbano Y Vivienda (MIDUVI): Quito, Ecuador, 2018; p. 40. Available online: https://www.habitatyvivienda.gob.ec/wp-content/uploads/downloads/2019/03/NEC-HS-EE-Final.pdf (accessed on 2 March 2022).
- CEN European Standard EN 17037; 2018 Daylight in Buildings. European Committee for Standardization: Brussels, Belgium, 2018.
- Bournas, I. Daylight compliance of residential spaces: Comparison of different performance criteria and association with room geometry and urban density. Build. Environ. 2020, 185, 107276. [Google Scholar] [CrossRef]
- He, Q.; Ng, S.T. Energy-Efficient Window Retrofit for Existing High-Rise Residential Buildings with the Consideration of Mutual Shading. In Proceedings of the 33rd Annual ARCOM Conference, Cambridge, UK, 4–6 September 2017; pp. 755–764. [Google Scholar]
- Taleghani, M.; Tenpierik, M.; Van Den Dobbelsteen, A.; De Dear, R. Energy use impact of and thermal comfort in different urban block types in the Netherlands. Energy Build. 2013, 67, 166–175. [Google Scholar] [CrossRef]
- El Comercio INEC: El Ingreso de la Familia Típica en Ecuador es USD 700 Mensuales, en Promedio|El Comercio. Available online: https://www.elcomercio.com/actualidad/inec-ingreso-familia-ecuador-sueldo.html (accessed on 2 January 2021).
- Bhatia, M.; Angelou, N. Beyond Connections Energy Access Redefined. World Bank. Energy Sector Management Assistance Program (ESMAP); World Bank: Washington, DC, USA, 2015; pp. 1–224. [Google Scholar]
- Alchapar, N.; Correa, E. Reflectancia solar de las envolventes opacas de la ciudad y su efecto sobre las temperaturas urbanas. Inf. La Constr. 2015, 67, e112. [Google Scholar] [CrossRef] [Green Version]
- Venegas Quintulén, S.A.; Piderit Moreno, M.B. Reflectancia de las envolventes verticales y su influencia sobre disponibilidad de luz natural en el cañón urbano de la ciudad de Concepcion. Rev. Hábitat Sustentable 2018, 8, 6–15. [Google Scholar] [CrossRef]
- Strømann-Andersen, J.; Sattrup, P.A. The urban canyon and building energy use: Urban density versus daylight and passive solar gains. Energy Build. 2011, 43, 2011–2020. [Google Scholar] [CrossRef]
- Kontokosta, C.E. Predicting Building Energy Efficiency Using New York City Benchmarking Data. ACEEE Summer Study Energy Effic. Build. 2012, 163–174. [Google Scholar]
- Ko, Y.; Radke, J.D. The Effect of Urban Form and Residential Cooling Energy Use in Sacramento, California. Environ. Plan. B Plan. Des. 2014, 41, 573–593. [Google Scholar] [CrossRef]
- Rodríguez-Álvarez, J. Urban Energy Index for Buildings (UEIB): A new method to evaluate the effect of urban form on buildings’ energy demand. Landsc. Urban Plan. 2016, 148, 170–187. [Google Scholar] [CrossRef]
- Quan, J. Density and Energy Performance of Solar Powered Buildings in the Urban Context. Ph.D. Thesis, Georgia Institute of Technology, Atlanta, GA, USA, 2016. [Google Scholar]
- Quan, S.J.; Economou, A.; Grasl, T.; Yang, P.P.-J. Computing Energy Performance of Building Density, Shape and Typology in Urban Context. Energy Procedia 2014, 61, 1602–1605. [Google Scholar] [CrossRef] [Green Version]
- Vartholomaios, A. A parametric sensitivity analysis of the influence of urban form on domestic energy consumption for heating and cooling in a Mediterranean city. Sustain. Cities Soc. 2017, 28, 135–145. [Google Scholar] [CrossRef]
- De Decker, K. The Solar Envelope: How to Heat and Cool Cities without Fossil Fuels. Low-Tech Magazine. Available online: http://www.lowtechmagazine.com/2012/03/solar-oriented-cities-1-the-solar-envelope.html (accessed on 2 March 2022).
- Bournas, I.; Dubois, M.C. Daylight regulation compliance of existing multi-family apartment blocks in Sweden. Build. Environ. 2019, 150, 254–265. [Google Scholar] [CrossRef]
- Šprah, N.; Košir, M. Daylight provision requirements according to EN 17037 as a restriction for sustainable urban planning of residential developments. Sustainability 2020, 12, 315. [Google Scholar] [CrossRef] [Green Version]
- Kanters, J.; Gentile, N.; Bernardo, R. Planning for solar access in Sweden: Routines, metrics, and tools. Urban Plan. Transp. Res. 2021, 9, 348–368. [Google Scholar] [CrossRef]


| Scenario | Building Height (H) m | Street Width (W) m | Ratio H/W | Orientation °N |
|---|---|---|---|---|
| Scenario 1 | 144 | - | - | 15°, 30°, 45°, 120°, 165°, −30°, −60°, −135°, −150° |
| Scenario 2 | 6 | 24 | ||
| Scenario 3 | 12 | 12 | ||
| Scenario 4 | 16 | 9 | ||
| Scenario 5 | 22 | 6.5 | ||
| Scenario 6 | 30 | 4.8 |
| Building Scale | N. Stories | % Filled (Wall) | % Open (Window) | Opaque Area | Translucent Area | ||||||
|---|---|---|---|---|---|---|---|---|---|---|---|
| Material | Finishing | Colour | Emissivity | Reflectance Index (%) | Material | Reflectance Index (%) | Luminous Transmission Coefficient (%) | ||||
| Low | 2 | 73.27 | 26.72 | Mortar | Rustic | White | 0.85 | 60 | Simple Glazing | 7.00 | 31.00 |
| 5 | 69.53 | 30.46 | Brick | Even | Terracotta | 0.85 | 57 | Simple Glazing | 7.00 | 31.00 | |
| Medium | 8 | 63.48 | 36.51 | Brick | Even | Terracotta | 0.85 | 57 | Simple Glazing | 7.00 | 31.00 |
| 10 | 34.31 | 65.69 | Plaster | Even | White | 0.42 | 90 | Simple Glazing | 7.00 | 31.00 | |
| Aluminum profile | Even | Gray | 0.95 | 54 | |||||||
| 8 | 79.80 | 20.20 | Mortar | Rustic | Brown | 0.61 | 52 | Simple Glazing | 7.00 | 31.00 | |
| Intermediate | 13 | 68.34 | 31.65 | Mortar | Rustic | Gray | 0.95 | 41 | Simple Glazing | 7.00 | 31.00 |
| 15 | 26.38 | 73.61 | Plaster | Even | White | 0.42 | 90 | Double Glazing | 17.00 | 47.30 | |
| 14 | 33.19 | 66.80 | Uncovered Concrete | Even | White | 0.85 | 80 | Simple Glazing | 7.00 | 31.00 | |
| 18 | 33.17 | 62.82 | Mortar | Rustic | White | 0.85 | 60 | Double Glazing | 17.00 | 47.30 | |
| Critical | 21 | 27.61 | 72.39 | Plaster | Even | White | 0.42 | 90 | Simple Glazing | 7.00 | 31.00 |
| 21 | 43.53 | 56.46 | Uncovered Concrete | Even | White | 0.85 | 80 | Double Glazing | 17.00 | 47.30 | |
| 22 | 48.13 | 51.86 | Brick | Even | Terracotta | 0.85 | 57 | Double Glazing | 17.00 | 47.30 | |
| Aluminum Profile | Even | Gray | 0.95 | 54 | |||||||
| 25 | 21.43 | 78.56 | Mortar | Rustic | Gray | 0.95 | 41 | Double Glazing | 17.00 | 47.30 | |
| 32 | 27.37 | 72.63 | Brick | Even | Terracotta | 0.85 | 57 | Double Glazing | 17.00 | 47.30 | |
| Orientation | Solar Radiation (KWh/m2 Year) | Lighting Demand (KWh/m2 Year) |
|---|---|---|
| 15° | 568 | 7.62 |
| 30° | 660 | 7.68 |
| 45° | 773 | 7.73 |
| 120° | 815 | 7.75 |
| 150° | 578 | 7.72 |
| −165° | 374 | 7.68 |
| −150° | 377 | 7.60 |
| −135° | 421 | 7.55 |
| −60 | 514 | 7.46 |
| −30° | 458 | 7.47 |
| Orientation | Floor | |||||||||
|---|---|---|---|---|---|---|---|---|---|---|
| 25 | 31 | 34 | 35 | 36 | ||||||
| 15° | 145 | 74% | 191 | 66% | 330 | 42% | 440 | 23% | 521 | 8% |
| 30° | 155 | 77% | 184 | 72% | 324 | 51% | 451 | 32% | 599 | 9% |
| 45° | 148 | 81% | 183 | 76% | 319 | 59% | 478 | 38% | 689 | 11% |
| 120° | 150 | 82% | 167 | 80% | 163 | 80% | 175 | 79% | 196 | 76% |
| 150° | 156 | 73% | 178 | 69% | 279 | 52% | 384 | 34% | 526 | 9% |
| −165° | 145 | 61% | 181 | 52% | 254 | 32% | 295 | 21% | 336 | 10% |
| −150° | 151 | 60% | 174 | 54% | 221 | 41% | 262 | 31% | 335 | 11% |
| −135° | 147 | 65% | 168 | 60% | 271 | 36% | 279 | 34% | 375 | 11% |
| −60 | 148 | 71% | 163 | 68% | 219 | 57% | 298 | 42% | 467 | 9% |
| −30° | 156 | 66% | 181 | 60% | 245 | 47% | 308 | 33% | 419 | 9% |
| Orientation | Floor | |||||||||
|---|---|---|---|---|---|---|---|---|---|---|
| 25 | 31 | 34 | 35 | 36 | ||||||
| 15° | 42.9 | 463% | 41.4 | 443% | 32.6 | 328% | 24.7 | 224% | 16.1 | 111% |
| 30° | 42.8 | 457% | 41.2 | 437% | 34.0 | 342% | 25.8 | 236% | 16.8 | 119% |
| 45° | 44.3 | 473% | 41.9 | 442% | 34.0 | 340% | 24.9 | 222% | 12.8 | 66% |
| 120° | 44.7 | 476% | 42.8 | 452% | 33.9 | 338% | 23.3 | 200% | 13.0 | 68% |
| 150° | 44.4 | 475% | 42.4 | 449% | 33.7 | 336% | 23.5 | 204% | 13.3 | 73% |
| −165° | 44.5 | 480% | 42.7 | 455% | 33.6 | 338% | 24.0 | 213% | 14.0 | 83% |
| −150° | 44.5 | 485% | 42.7 | 461% | 34.1 | 349% | 24.0 | 216% | 13.8 | 82% |
| −135° | 44.7 | 492% | 43.0 | 470% | 34.1 | 352% | 23.5 | 211% | 13.5 | 79% |
| −60 | 44.6 | 498% | 42.9 | 476% | 34.1 | 358% | 23.6 | 216% | 13.5 | 80% |
| −30° | 44.2 | 492% | 42.3 | 466% | 33.6 | 350% | 23.5 | 215% | 13.3 | 77% |
| Orientation | Story | |||||||||
|---|---|---|---|---|---|---|---|---|---|---|
| 16 | 26 | 32 | 34 | 36 | ||||||
| 15° | 172 | 70% | 199 | 65% | 377 | 34% | 455 | 20% | 544 | 4% |
| 30° | 158 | 76% | 199 | 70% | 345 | 48% | 471 | 29% | 633 | 4% |
| 45° | 156 | 80% | 182 | 76% | 345 | 55% | 512 | 34% | 745 | 4% |
| 120° | 153 | 81% | 176 | 78% | 337 | 59% | 525 | 36% | 785 | 4% |
| 150° | 158 | 73% | 186 | 68% | 310 | 46% | 415 | 28% | 555 | 4% |
| −165° | 171 | 54% | 190 | 49% | 267 | 29% | 299 | 20% | 352 | 6% |
| −150° | 155 | 59% | 176 | 53% | 236 | 37% | 276 | 27% | 353 | 6% |
| −135° | 153 | 64% | 166 | 61% | 242 | 43% | 300 | 29% | 396 | 6% |
| −60 | 152 | 70% | 168 | 67% | 251 | 51% | 328 | 36% | 486 | 5% |
| −30° | 156 | 66% | 185 | 60% | 280 | 39% | 335 | 27% | 436 | 5% |
| Orientation | Story | |||||||||
|---|---|---|---|---|---|---|---|---|---|---|
| 16 | 26 | 32 | 34 | 36 | ||||||
| 15° | 40.0 | 425% | 38.7 | 407% | 29.3 | 285% | 22.9 | 201% | 8.8 | 15% |
| 30° | 39.7 | 417% | 38.7 | 404% | 30.6 | 299% | 23.5 | 206% | 8.8 | 15% |
| 45° | 40.0 | 417% | 38.7 | 400% | 29.3 | 279% | 22.9 | 197% | 8.8 | 13% |
| 120° | 44.5 | 474% | 42.3 | 445% | 32.3 | 317% | 22.4 | 189% | 8.6 | 11% |
| 150° | 40.1 | 420% | 39.0 | 405% | 30.8 | 299% | 23.5 | 205% | 8.9 | 15% |
| −165° | 39.8 | 418% | 38.3 | 399% | 29.5 | 284% | 23.1 | 201% | 8.9 | 16% |
| −150° | 39.8 | 423% | 38.8 | 410% | 30.6 | 302% | 23.7 | 211% | 8.8 | 16% |
| −135° | 44.3 | 487% | 42.0 | 456% | 32.5 | 330% | 22.6 | 200% | 8.4 | 11% |
| −60 | 40.8 | 447% | 39.3 | 427% | 30.8 | 313% | 22.9 | 207% | 8.8 | 18% |
| −30° | 39.9 | 434% | 38.7 | 419% | 30.5 | 308% | 23.5 | 214% | 8.7 | 16% |
| Orientation | Floor | |||||||||
|---|---|---|---|---|---|---|---|---|---|---|
| 13 | 26 | 32 | 34 | 36 | ||||||
| 15° | 179 | 68% | 249 | 56% | 411 | 28% | 490 | 14% | 547 | 4% |
| 30° | 193 | 71% | 236 | 64% | 430 | 35% | 531 | 20% | 639 | 3% |
| 45° | 169 | 78% | 184 | 76% | 262 | 66% | 327 | 58% | 399 | 48% |
| 120° | 162 | 80% | 220 | 73% | 417 | 49% | 588 | 28% | 787 | 3% |
| 150° | 188 | 67% | 230 | 60% | 372 | 36% | 458 | 21% | 558 | 3% |
| −165° | 178 | 52% | 224 | 40% | 282 | 25% | 312 | 17% | 355 | 5% |
| −150° | 172 | 54% | 199 | 47% | 261 | 31% | 299 | 21% | 357 | 5% |
| −135° | 161 | 62% | 184 | 56% | 262 | 38% | 327 | 22% | 399 | 5% |
| −60 | 157 | 69% | 182 | 65% | 299 | 42% | 395 | 23% | 488 | 5% |
| −30° | 171 | 63% | 213 | 53% | 307 | 33% | 371 | 19% | 439 | 4% |
| Orientation | Floor | |||||||||
|---|---|---|---|---|---|---|---|---|---|---|
| 13 | 26 | 32 | 34 | 36 | ||||||
| 15° | 36.37 | 377% | 33.36 | 338% | 24.52 | 222% | 18.8 | 147% | 8.29 | 9% |
| 30° | 36.47 | 375% | 34.3 | 347% | 25.4 | 231% | 19.32 | 152% | 8.33 | 8% |
| 45° | 37.34 | 383% | 35.35 | 357% | 24.98 | 223% | 18.27 | 136% | 8.34 | 8% |
| 120° | 40.81 | 427% | 37.99 | 390% | 26.35 | 240% | 17.68 | 128% | 8.17 | 5% |
| 150° | 36.52 | 373% | 34.35 | 345% | 25.53 | 231% | 19.38 | 151% | 8.42 | 9% |
| −165° | 36.54 | 376% | 33.43 | 335% | 24.61 | 220% | 18.88 | 146% | 8.36 | 9% |
| −150° | 36.47 | 380% | 34.22 | 350% | 25.42 | 234% | 19.36 | 155% | 8.34 | 10% |
| −135° | 36.87 | 388% | 34.66 | 359% | 25.06 | 232% | 18.51 | 145% | 8.3 | 10% |
| −60 | 37.47 | 402% | 35.12 | 371% | 25.25 | 238% | 18.37 | 146% | 8.25 | 11% |
| −30° | 36.45 | 388% | 34.26 | 359% | 25.24 | 238% | 19.16 | 156% | 8.19 | 10% |
| Orientation | Floor | |||||||||
|---|---|---|---|---|---|---|---|---|---|---|
| 8 | 13 | 26 | 32 | 36 | ||||||
| 15° | 217 | 62% | 228 | 60% | 338 | 40% | 462 | 19% | 554 | 2% |
| 30° | 187 | 72% | 196 | 70% | 316 | 52% | 498 | 25% | 642 | 3% |
| 45° | 209 | 73% | 212 | 73% | 318 | 59% | 519 | 33% | 751 | 3% |
| 120° | 158 | 81% | 165 | 80% | 265 | 67% | 528 | 35% | 794 | 3% |
| 150° | 188 | 67% | 196 | 66% | 279 | 52% | 439 | 24% | 562 | 3% |
| −165° | 205 | 45% | 214 | 43% | 258 | 31% | 302 | 19% | 360 | 4% |
| −150° | 171 | 55% | 180 | 52% | 222 | 41% | 287 | 24% | 361 | 4% |
| −135° | 185 | 56% | 188 | 55% | 226 | 46% | 302 | 28% | 402 | 5% |
| −60 | 158 | 69% | 166 | 68% | 221 | 57% | 338 | 34% | 498 | 3% |
| −30° | 171 | 63% | 180 | 61% | 249 | 46% | 363 | 21% | 442 | 3% |
| Orientation | Floor | |||||||||
|---|---|---|---|---|---|---|---|---|---|---|
| 8 | 13 | 26 | 32 | 36 | ||||||
| 15° | 34.2 | 348% | 33.9 | 345% | 27.6 | 262% | 19.8 | 160% | 8.2 | 7% |
| 30° | 34.1 | 344% | 33.5 | 336% | 28.3 | 268% | 20.4 | 166% | 8.2 | 7% |
| 45° | 34.2 | 342% | 34.0 | 340% | 28.8 | 272% | 19.7 | 155% | 8.2 | 7% |
| 120° | 35.2 | 355% | 35.3 | 355% | 29.1 | 275% | 20.2 | 161% | 8.3 | 7% |
| 150° | 33.9 | 339% | 33.3 | 332% | 28.3 | 266% | 20.5 | 165% | 8.3 | 8% |
| −165° | 33.5 | 337% | 33.3 | 333% | 27.1 | 253% | 20.0 | 160% | 8.3 | 8% |
| −150° | 33.9 | 346% | 33.3 | 339% | 28.0 | 269% | 20.4 | 168% | 8.2 | 8% |
| −135° | 33.8 | 348% | 34.2 | 353% | 28.8 | 281% | 19.5 | 159% | 8.2 | 8% |
| −60 | 35.1 | 370% | 35.2 | 371% | 28.9 | 288% | 19.7 | 165% | 8.1 | 8% |
| −30° | 34.0 | 354% | 33.5 | 348% | 28.2 | 278% | 20.3 | 171% | 8.1 | 8% |
| Orientation | Floor | |||||||
|---|---|---|---|---|---|---|---|---|
| 5 | 20 | 30 | 36 | |||||
| 15° | 290 | 49% | 351 | 38% | 476 | 16% | 566 | 0% |
| 30° | 232 | 65% | 287 | 57% | 469 | 29% | 655 | 1% |
| 45° | 258 | 67% | 306 | 60% | 534 | 31% | 770 | 0% |
| 120° | 193 | 76% | 243 | 70% | 506 | 38% | 809 | 1% |
| 150° | 234 | 60% | 272 | 53% | 417 | 28% | 574 | 1% |
| −165° | 232 | 38% | 262 | 30% | 312 | 17% | 374 | 0% |
| −150° | 196 | 48% | 219 | 42% | 285 | 24% | 376 | 0% |
| −135° | 215 | 49% | 233 | 45% | 315 | 25% | 420 | 0% |
| −60 | 177 | 66% | 210 | 59% | 330 | 36% | 508 | 1% |
| −30° | 199 | 57% | 240 | 48% | 345 | 25% | 311 | 32% |
| Orientation | Floor | |||||||
|---|---|---|---|---|---|---|---|---|
| 5 | 20 | 30 | 36 | |||||
| 15° | 26.9 | 253% | 24.0 | 215% | 17.5 | 130% | 8.1 | 6% |
| 30° | 27.8 | 261% | 25.2 | 229% | 18.1 | 135% | 8.1 | 6% |
| 45° | 28.5 | 269% | 25.7 | 233% | 17.7 | 129% | 7.9 | 2% |
| 120° | 29.1 | 275% | 26.2 | 238% | 18.0 | 133% | 8.2 | 6% |
| 150° | 27.3 | 254% | 25.0 | 223% | 17.9 | 132% | 8.2 | 6% |
| −165° | 27.6 | 260% | 24.7 | 221% | 17.8 | 131% | 8.1 | 6% |
| −150° | 27.4 | 260% | 24.9 | 228% | 17.9 | 135% | 8.1 | 6% |
| −135° | 27.4 | 263% | 24.7 | 228% | 17.1 | 127% | 8.0 | 6% |
| −60 | 28.8 | 286% | 25.9 | 247% | 17.7 | 137% | 7.9 | 6% |
| −30° | 27.6 | 270% | 25.1 | 236% | 17.9 | 140% | 8.0 | 6% |
| Floor | Orientation (°N) | ||||||||||
|---|---|---|---|---|---|---|---|---|---|---|---|
| −165 | −150 | −135 | −60 | −30 | 15 | 30 | 45 | 120 | 150 | ||
| Scenario 2 Ratio 24 | 1 | 28.54 | 28.50 | 28.64 | 28.58 | 28.35 | 27.37 | 26.95 | 28.61 | 28.62 | 28.51 |
| 25 | 28.24 | 28.19 | 28.31 | 28.26 | 28.05 | 27.21 | 27.10 | 28.06 | 28.31 | 28.13 | |
| 31 | 27.04 | 27.04 | 27.26 | 27.22 | 26.80 | 26.22 | 26.13 | 26.54 | 27.12 | 26.86 | |
| 34 | 21.32 | 21.62 | 21.64 | 21.65 | 21.29 | 20.66 | 21.54 | 21.54 | 21.50 | 21.35 | |
| 35 | 15.23 | 15.20 | 14.90 | 14.95 | 14.92 | 15.66 | 16.36 | 15.77 | 14.74 | 14.89 | |
| 36 | 8.89 | 8.75 | 8.55 | 8.53 | 8.40 | 10.18 | 10.67 | 8.11 | 8.26 | 8.45 | |
| Scenario 3 Ratio 12 | 1 | 25.45 | 25.61 | 27.98 | 25.94 | 25.59 | 25.58 | 25.63 | 25.58 | 28.11 | 25.82 |
| 26 | 24.31 | 24.58 | 26.62 | 24.92 | 24.56 | 24.52 | 24.56 | 24.52 | 26.79 | 24.71 | |
| 32 | 18.69 | 19.38 | 20.58 | 19.54 | 19.31 | 18.58 | 19.41 | 18.58 | 20.49 | 19.51 | |
| 34 | 14.65 | 15.00 | 14.35 | 14.51 | 14.88 | 14.53 | 14.89 | 14.53 | 14.21 | 14.92 | |
| 35 | 10.60 | 10.73 | 9.59 | 10.13 | 10.57 | 10.35 | 10.55 | 10.35 | 9.31 | 10.37 | |
| 36 | 5.64 | 5.59 | 5.33 | 5.57 | 5.50 | 5.55 | 5.58 | 5.55 | 5.44 | 5.63 | |
| Scenario 4 Ratio 9 | 1 | 23.45 | 23.41 | 23.66 | 24.13 | 23.45 | 23.39 | 23.41 | 25.93 | 26.64 | 23.45 |
| 26 | 21.20 | 21.70 | 21.97 | 22.26 | 21.72 | 21.15 | 21.74 | 22.41 | 24.09 | 21.78 | |
| 29 | 18.53 | 19.09 | 19.23 | 19.50 | 19.14 | 18.36 | 19.07 | 20.06 | 21.09 | 19.18 | |
| 32 | 15.60 | 16.11 | 15.89 | 16.01 | 16.00 | 15.55 | 16.11 | 15.84 | 16.70 | 16.19 | |
| 34 | 11.97 | 12.28 | 11.74 | 11.65 | 12.15 | 11.92 | 12.25 | 11.58 | 11.21 | 12.29 | |
| 35 | 9.67 | 9.89 | 9.25 | 9.24 | 9.79 | 9.72 | 9.95 | 8.49 | 8.90 | 9.86 | |
| 36 | 5.30 | 5.29 | 5.26 | 5.23 | 5.19 | 5.25 | 5.28 | 5.29 | 5.18 | 5.34 | |
| Scenario 5 Ratio 6.5 | 1 | 21.37 | 21.57 | 21.54 | 22.36 | 21.60 | 21.78 | 21.70 | 21.74 | 22.47 | 21.55 |
| 13 | 21.09 | 21.13 | 21.70 | 22.28 | 21.22 | 21.48 | 21.25 | 21.55 | 22.36 | 21.14 | |
| 25 | 18.05 | 18.73 | 18.90 | 19.40 | 18.72 | 18.39 | 18.87 | 19.25 | 19.50 | 18.77 | |
| 26 | 17.20 | 17.77 | 18.23 | 18.33 | 17.88 | 17.49 | 17.92 | 18.24 | 18.44 | 17.92 | |
| 32 | 12.65 | 12.91 | 12.37 | 12.52 | 12.86 | 12.58 | 12.94 | 12.48 | 12.80 | 12.98 | |
| 34 | 9.32 | 9.37 | 8.65 | 8.87 | 9.35 | 9.08 | 9.43 | 8.78 | 8.97 | 9.37 | |
| 36 | 5.24 | 5.21 | 5.17 | 5.13 | 5.12 | 5.19 | 5.23 | 5.23 | 5.28 | 5.27 | |
| Scenario 6 Ratio 4.8 | 1 | 18.08 | 17.54 | 17.84 | 18.79 | 17.66 | 17.30 | 17.76 | 18.50 | 18.87 | 17.52 |
| 5 | 17.52 | 17.35 | 17.37 | 18.25 | 17.51 | 17.07 | 17.59 | 18.07 | 18.42 | 17.34 | |
| 20 | 15.63 | 15.81 | 15.69 | 16.40 | 15.93 | 15.21 | 15.99 | 16.32 | 16.61 | 15.83 | |
| 30 | 11.27 | 11.32 | 10.86 | 11.21 | 11.36 | 11.12 | 11.44 | 11.22 | 11.44 | 11.35 | |
| 32 | 9.98 | 10.03 | 9.49 | 9.71 | 10.07 | 9.87 | 10.15 | 9.73 | 9.80 | 10.06 | |
| 36 | 5.15 | 5.13 | 5.08 | 5.02 | 5.04 | 5.13 | 5.14 | 5.02 | 5.20 | 5.19 | |
Publisher’s Note: MDPI stays neutral with regard to jurisdictional claims in published maps and institutional affiliations. |
© 2022 by the authors. Licensee MDPI, Basel, Switzerland. This article is an open access article distributed under the terms and conditions of the Creative Commons Attribution (CC BY) license (https://creativecommons.org/licenses/by/4.0/).
Share and Cite
Montes-Villalva, E.; Pereira-Ruchansky, L.; Piderit-Moreno, B.; Pérez-Fargallo, A. Impact of Urban Re-Densification on Indoor Lighting Demand and Energy Poverty on the Equator, in the City of Quito. Sustainability 2022, 14, 3783. https://0-doi-org.brum.beds.ac.uk/10.3390/su14073783
Montes-Villalva E, Pereira-Ruchansky L, Piderit-Moreno B, Pérez-Fargallo A. Impact of Urban Re-Densification on Indoor Lighting Demand and Energy Poverty on the Equator, in the City of Quito. Sustainability. 2022; 14(7):3783. https://0-doi-org.brum.beds.ac.uk/10.3390/su14073783
Chicago/Turabian StyleMontes-Villalva, Estefanía, Lucía Pereira-Ruchansky, Beatriz Piderit-Moreno, and Alexis Pérez-Fargallo. 2022. "Impact of Urban Re-Densification on Indoor Lighting Demand and Energy Poverty on the Equator, in the City of Quito" Sustainability 14, no. 7: 3783. https://0-doi-org.brum.beds.ac.uk/10.3390/su14073783