
How Do China’s Development Zones Affect Environmental Pollution under Government Domination


1
Business School of Ningbo University, Ningbo 315211, China
2
Marine Economics Research Center, Donghai Academy, Ningbo University, Ningbo 315211, China
*
Author to whom correspondence should be addressed.
Sustainability 2022, 14(7), 3790; https://0-doi-org.brum.beds.ac.uk/10.3390/su14073790
Submission received: 25 February 2022
/
Revised: 21 March 2022
/
Accepted: 21 March 2022
/
Published: 23 March 2022
(This article belongs to the Topic Climate Change and Environmental Sustainability)
Abstract
:Environmental pollution has recently become a serious economic issue, and finding ways to reduce pollution in economic development is an urgent task for developing countries, especially China. In this paper, we aim to document the policy role of development zones (DZs) in promoting China’s economic development on environmental pollution and consider the establishment of DZs as a quasi-natural experiment. Specifically, we identify the establishment of DZs on pollution emissions based on the staggered difference-in-difference (DID) approach by setting a dummy variable for DZ policies. Furthermore, we examine the heterogeneity of provincial and national (high-tech and economic development zones) DZs on pollution to detect the government domination effect. Finally, in order to deal with the potential spatial spillover effects of DZs, this paper applies the spatial difference-in-difference (SDID) method to explore the spatial reallocation effects of DZs. The results indicate that the provincial DZs can aggravate China’s pollution intensity, but they will no longer play the same role for national-level policies. Moreover, we find that national high-tech industrial DZs (HTZs) can reduce pollution intensity. In particular, the national DZs can bring about the reallocation of pollution among cities working as a selective place-based policy. That means that the national HTZs will not only reduce the local pollution intensity, but also reduce that of surrounding areas. Our empirical results highlight that cities should be encouraged to set up national HTZs in order to achieve an environmentally friendly high-quality development goal.
1. Introduction
Establishing development zones (hereafter DZs) is an important location-oriented policy and a critical part of the regional economic development strategy [1]. In developed countries, the UK was the first to build DZs with the aim of driving economic development [2]. Unlike the UK, the main goal of establishing DZs in the US is to revitalize deprived urban areas and balance inter-regional development, so these DZs are usually chosen to be established in poor areas [3]. Meanwhile, establishing DZs as a policy to promote economic growth is also prevalent in developing countries, especially in China which has 387 national DZs and 2299 provincial DZs by 2021. Many studies have confirmed that the DZs can help achieve an agglomeration economy, similar to many place-based programs in developed countries [4,5,6,7,8], by attracting high-tech firms and promoting their interactions [9,10], attracting foreign direct investment [11,12,13,14,15], optimizing industrial structure and resource allocation [16,17], and then improving GDP growth [18], even for DZs located in the suburban areas, which is confirmed in the case of Beijing, Wuhan and Nanjing [19,20,21]. However, although China is achieving rapid economic growth, the environmental pollution is also becoming more and more serious [22,23], which has significantly hindered China’s sustainable development [24,25,26,27]. Previous studies have mainly explored the role of DZs in economic performance rather than environmental pollution, but with the economy becoming larger, developing countries have begun to emphasize the economic quality, especially in China, where environmental protection has become an important aspect. Thus, this paper is concerned with assessing the effect of DZ policies on pollution.
How do DZs affect pollution? Previous studies have mainly focused on the economic agglomeration effect, which can bring about the competition effect and knowledge diffusion effect among firms [7,28,29]. For example, that will increase the competitive pressure among firms and force them to update their technology, reduce the learning cost and increase the flow speed of information and technology among firms, which in turn may reduce the resource consumption and pollution per unit of output for the local and surrounding firms [4,21,30]. Firms may also actively engage in environmental protection to improve their social reputation and differentiated competition [31,32]. Although the theories are relatively consistent about the positive effect of economic agglomeration on the environment, empirical analyses show great disputes. Some research finds that economic agglomeration can reduce pollution [22,33,34], while others proved that economic agglomeration can aggravate pollution [35,36,37], especially the empirical analysis of how China’s DZs affect the environment, where Fan et al. (2019), Liang & Yang (2019) have documented that DZs will aggravate the pollution intensity [38,39], while Guo et al. (2019, 2021) and Zhou et al. (2019) reach the opposite conclusion that DZs will reduce pollution intensity [40,41,42].
As for why there is such a controversy, one possible reason is that previous literature may have ignored the fact that the establishment of DZs in China has another distinctive feature—government domination.
One aspect of government domination are the preferential policies for the firms within the DZs on which most of the previous studies have also focused, such as lower-priced industrial land [43], greater financial subsidies and tax breaks [13,14]. These preferential policies reduced the R&D risks and R&D costs of firms and stimulated innovation enthusiasm [44]. Additionally, the easing of the firms’ financing constraints will further lower the investment and production threshold for firms, allowing more small and medium-sized firms to enter and bringing about the expansion of the DZs’ industrial scale [45]. These preferential policies significantly promote the technology progress and upgrading of firms [13,29]. Thus, in terms of government-led preferential policies, DZs can reduce the pollution discharge per unit of a firm’s output.
However, there are another two important and special aspects of the government-dominated DZs policy in China—policy upgrading and industrial selection. Thus, this paper further analyzes the effect of DZs on pollution, in combination with the two special features. There are two political levels of DZs, provincial and national development zones, where most national DZs are upgraded from the provincial DZs [46], and they have different attitudes towards environmental protection with different governmental objectives. As shown in Section 4, provincial DZs sacrifice the environment in favor of GDP growth, but the national DZs reduce the pollution discharge intensity. Furthermore, there are two types of national DZs, high-tech industrial development zones (hereafter HTZs) and economic and technological development zones (hereafter ETZs), which have different industrial criteria. As shown in Section 6, these two types of DZs have different effects on pollution. The HTZs will significantly reduce the pollution discharge intensity, as they prefer the high-tech firms [21], but the ETZs significantly increase the pollution intensity, as they concentrate on the traditional manufacturing firms [47].
Moreover, government domination may bring about the reallocation of pollution among cities. As a place-based industrial policy, the establishment of DZs is a selective process, some cities have been selected and some have not. Such a selective policy will certainly realize the resource reallocation [16], causing some firms or resources to flow from the areas without DZs to the areas with DZs. Such a reallocation effect will not only affect the resource allocation efficiency, but also bring about the reallocation of pollution among cities due to the different preference for industries of DZs [48]. For example, if the industries are high-tech and green, and such industries are precisely preferred and attracted by HTZs, then the HTZs will reduce the local pollution discharge intensity, while in other regions the pollution discharge intensity has been passively increased as a result of the departure of such green industries.
To the best of our knowledge, very few studies have paid attention to the environmental effect of DZs, most of the papers are based on the perspective of agglomeration effects when study the impact of DZs on economic performance, and documented that the formation of agglomeration economies would bring scale economy and economic growth [14,15]. Meanwhile, other scholars have begun to pay attention to the government-dominated aspects of DZs, which will give preferential policies to firms in DZ, thereby encouraging them to innovate and upgrade their technology, which may reduce pollution emissions as well [43,45]. Although some research has begun to document the impact of DZs on pollutant emissions, the literature still ignores the other two aspects of government-dominated DZs in China: the upgrading effect from provincial DZs to national DZs and the selection effect of DZs on leading industries—these two effects may have a significant impact on the pollution discharge behavior [21].
To this end, this paper attempts to extend the existing literature from the following aspects: Firstly, we focus on the environmental consequence of DZs which have long been under-recognized in the evaluation of China’s DZ policies. Secondly, the policy of DZs in China is characterized by industrial selection, which makes it possible to reduce pollution intensity in HTZs that choose high-tech industries, while increasing pollution intensity in ETZs that choose traditional manufacturing industries [47]. Thirdly, the establishment of DZs in China is characterized by upgrading process, from none to owning the provincial DZs, and then the national DZs [46]. To apply the provincial DZs, local governments mainly focus on boosting the economic scale, while ignoring the environment or even sacrificing the environment, but to apply the national DZs, such as the HTZs, they may be concerned with the economic quality, and also pay more attention to the environment [21,49]. Therefore, we take the establishment of DZs as a quasi-natural experiment, and use staggered DID to identify the impact of establishment and upgrading of DZs on pollution emissions. Moreover, we also test for heterogeneity of different types of DZs. Finally, the establishment of DZs with selective characteristics has an obvious resource reallocation and pollution reallocation effect [16,48], so the spatial DID method is used to identify the reallocation effects.
The remainder of the paper is organized into seven sections: Section 2 introduces the background of the DZs program. Section 3 introduces the empirical strategy with the difference-in-differences (DID) method. Section 4 discusses the basic empirical analysis results of how provincial or national DZs affect the pollution intensity. Section 5 presents parallel trend test for the DID method. Section 6 discusses the different effects of national HTZs and national ETZs on pollution. Section 7 discusses the pollution reallocation effects of DZs with spatial DID method. Section 8 concludes.
2. Background
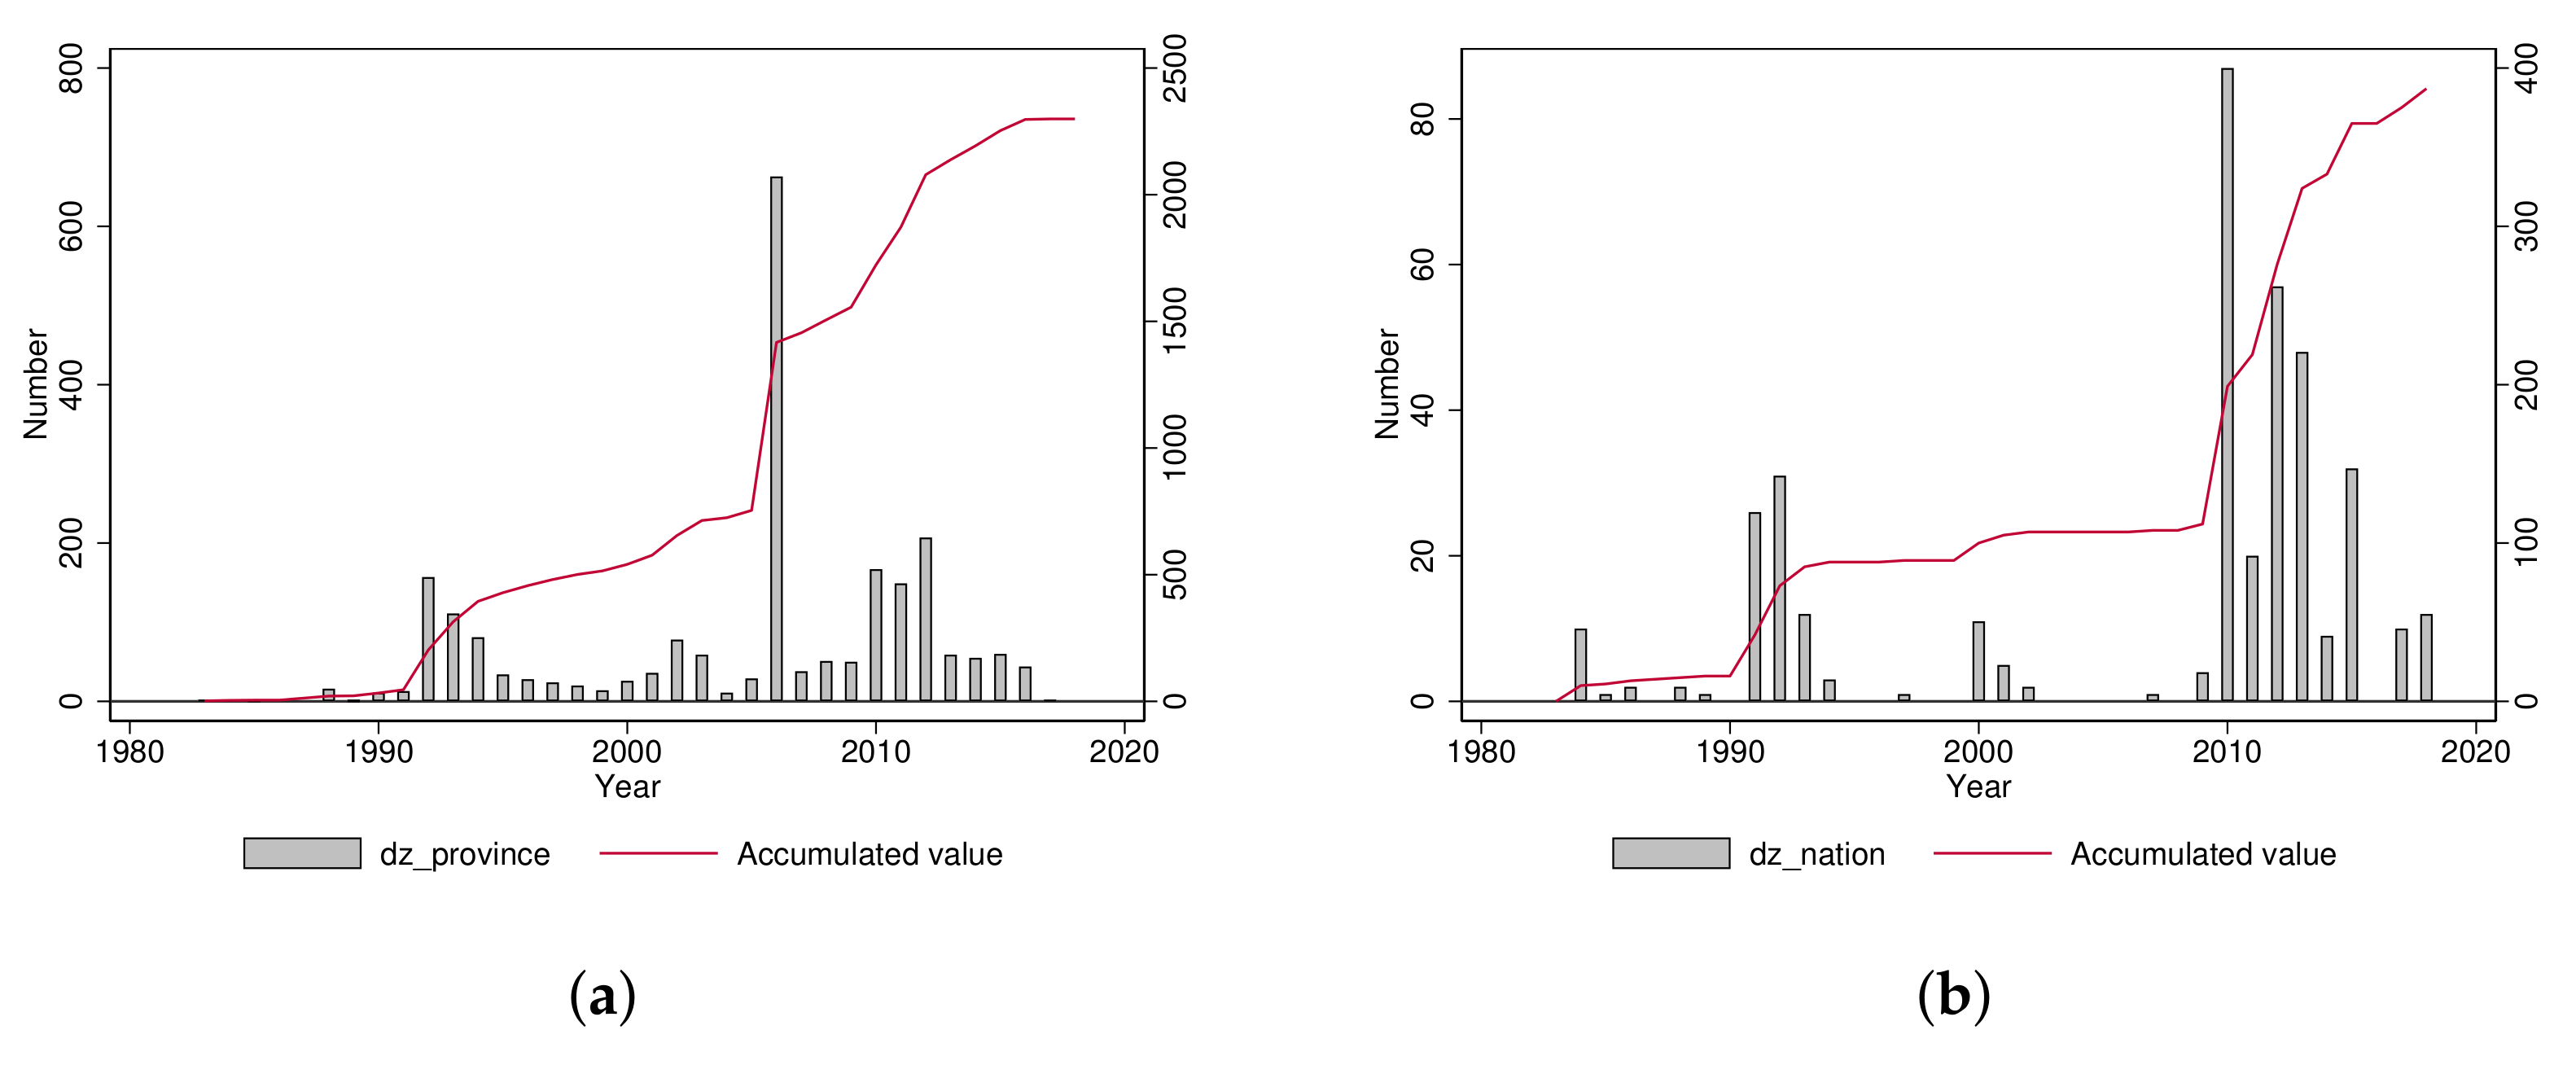
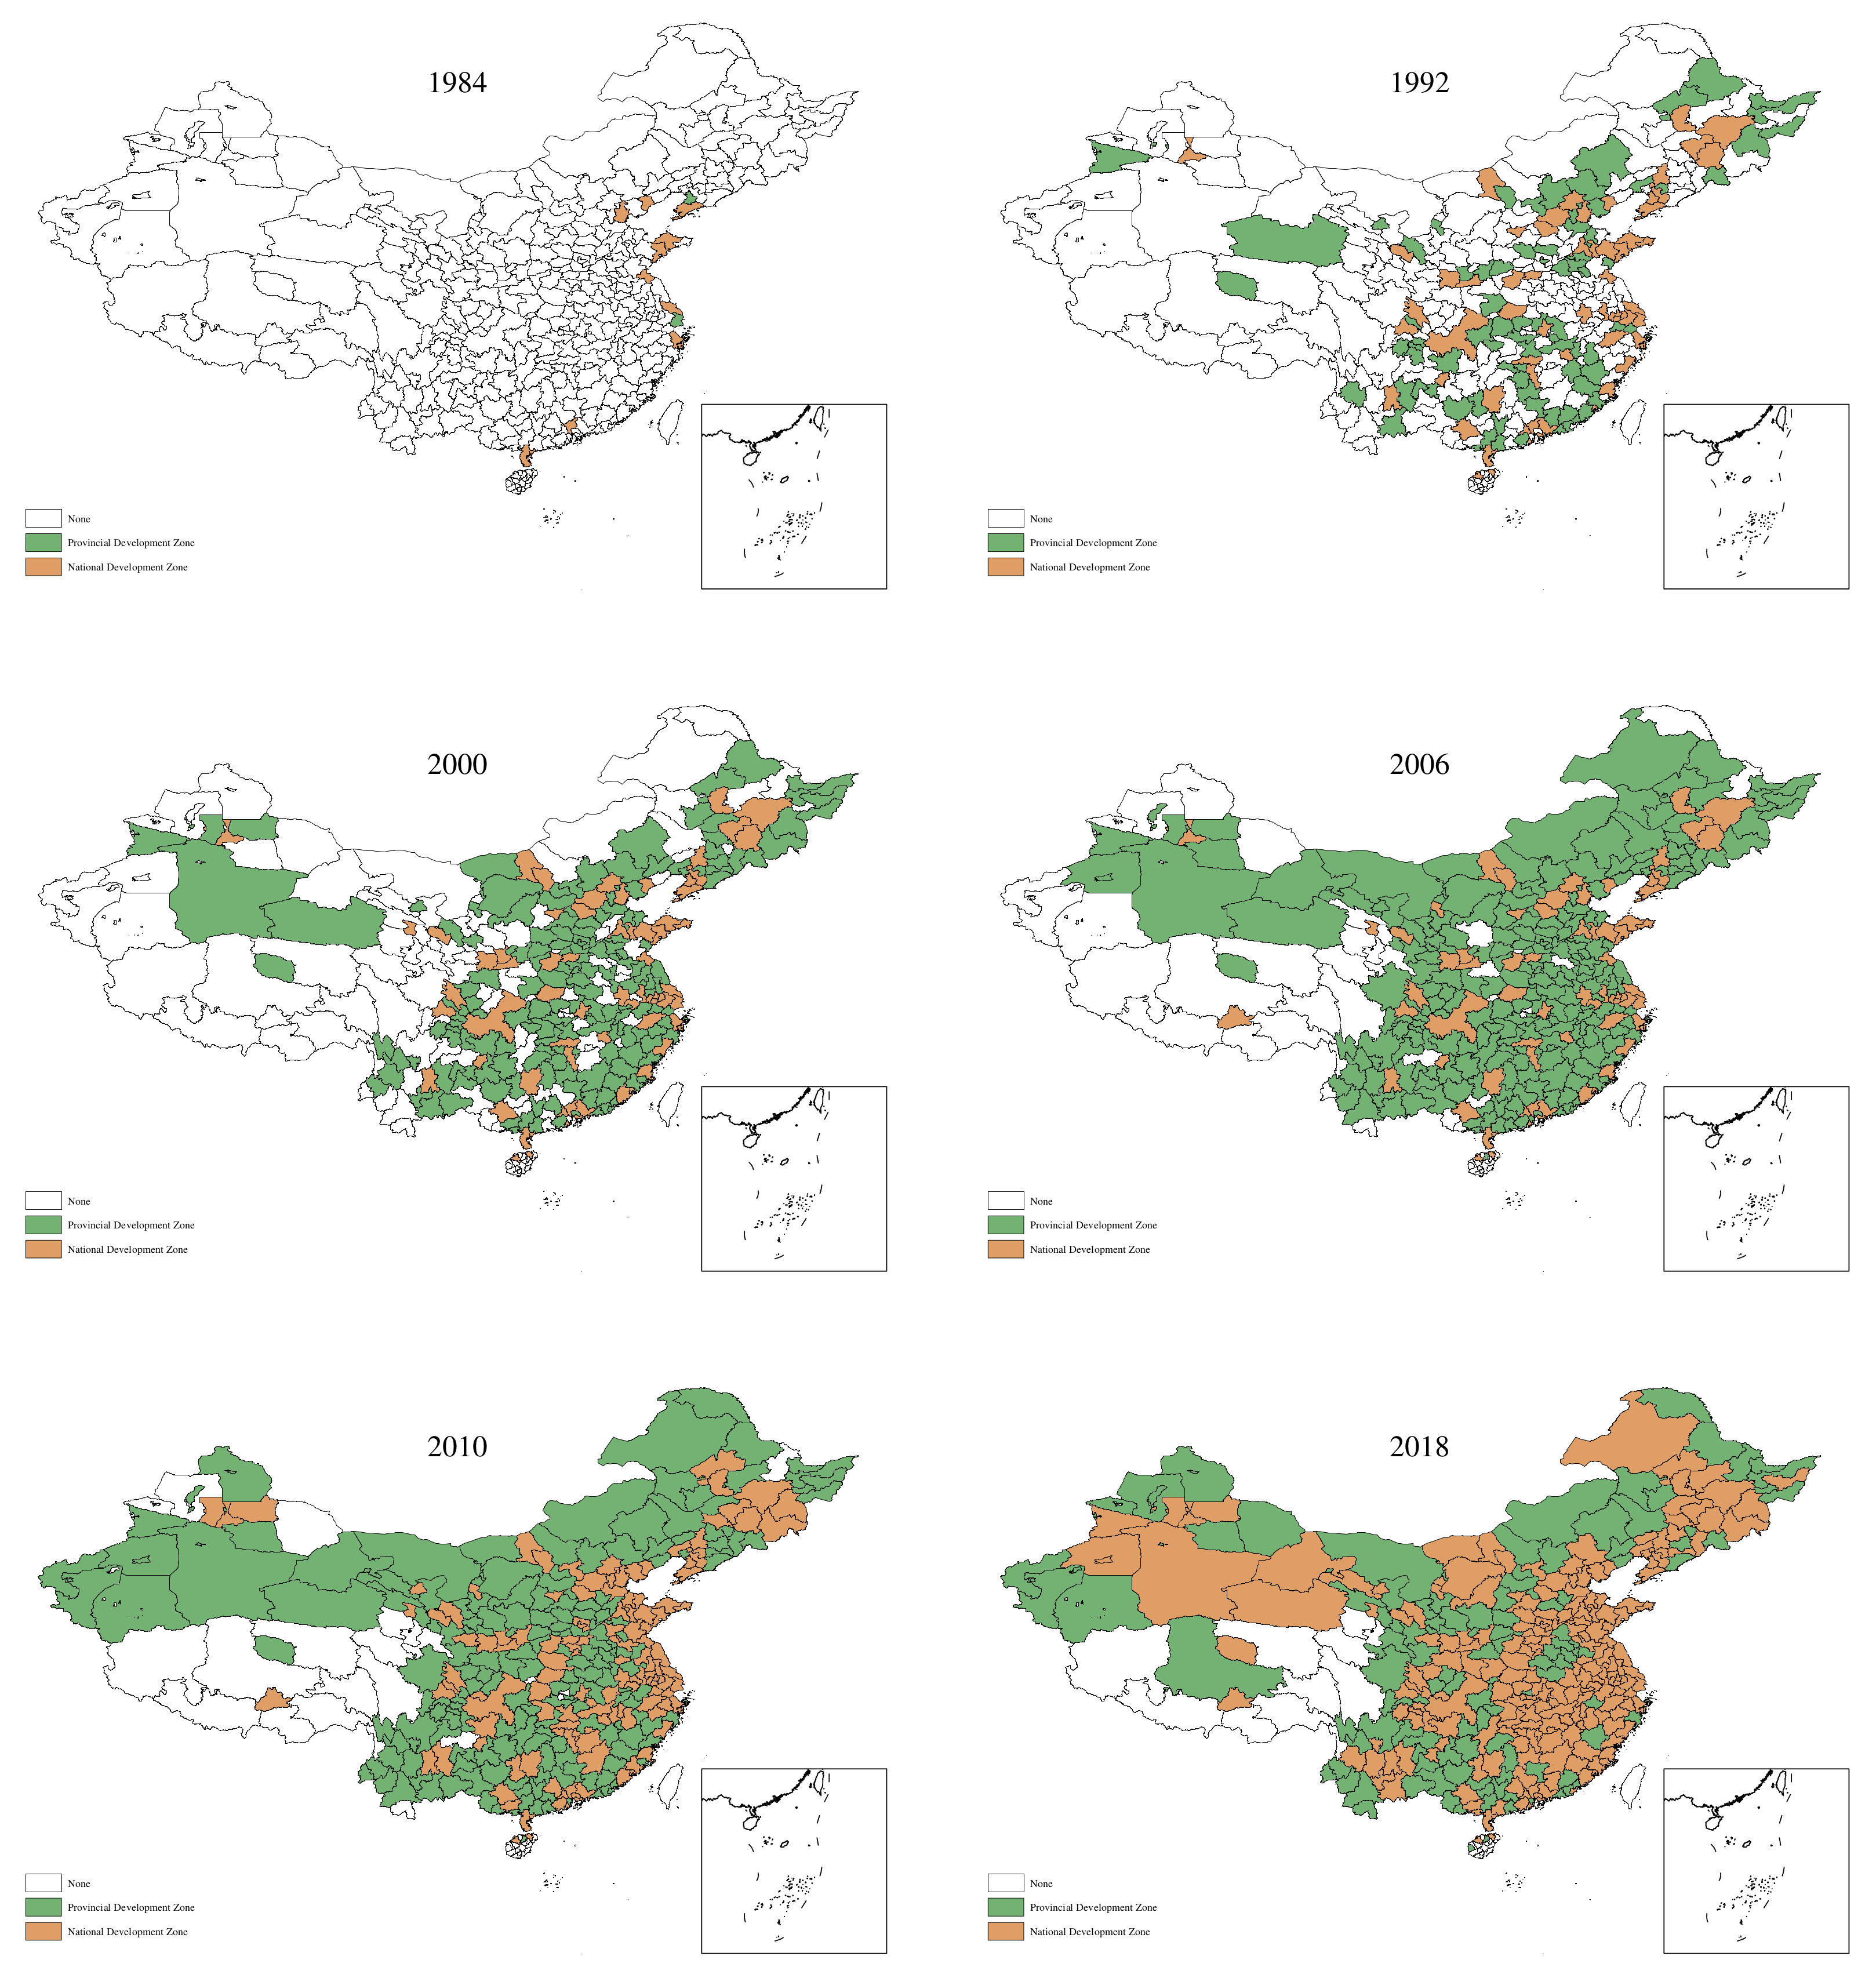
There are two political levels of DZs in China, the provincial and the national, Figure 1 shows the number of DZs established over the years. With the establishment of the first 10 national DZs in 1984, the number of national DZs had increased to 387 by 2021. Although the first established DZ is the national, a large number of provincial DZs were established after Deng Xiaoping’s famous southern tour in 1992, with a total of 541 provincial DZs established by 2000 (a few have been upgraded to the national), which were considered important engines for industrial clusters and economic growth in the context of reform and opening up, and which were mainly concentrated in the eastern and central regions. With the implementation of the Western Development Strategy from 2000, the provincial DZs began to be concentrated in the central and western regions, and in 2009, the cities with provincial DZs have covered most of China, with more than 1700 provincial DZs (some have been upgraded to the national). However, only 73 national DZs were established before 1992, and only 39 from 1993 to 2009. However, in order to cope with the decline of economic growth after the financial crisis, 260 provincial DZs were upgraded to the national level from 2010 to 2018, while more than 600 provincial DZs were also established during this period. By 2021, there were 387 national DZs and 2299 provincial DZs in China, and the geographical distribution and evolution of DZs are shown in Figure 2.
China’s national DZs are mainly upgraded from the provincial (308 provincial DZs have been upgraded to the national level, accounting for 79.59% of all national DZs). In terms of the approval process, to establish a provincial DZ, the city should apply to the provincial planning or science and technology administrative department, and the provincial administrative departments have a great incentive to pass this application to stimulate local economic growth. When the provincial DZ is developed enough, it can be upgraded to a national DZ by applying to the relevant central ministry, usually to the Ministry of Science and Technology for a national HTZ and to the Ministry of Commerce for a national ETZ. These state administrative departments will select from all applicants to approve, and every province will take out the best provincial ones when applying for the national DZs. The main goal of provincial DZs is to realize industrial agglomeration and economic growth, although the industries attracted may be resource-consuming and polluting. However, when they apply for upgrading to a national one, the requirements of the state administrative departments are strict, concerning not only the economic scale, but also some indicators reflecting economic quality, such as industrial structure, innovation capacity, and environmental protection. Therefore, such an upgrading process has led to different political levels of DZs in China, and different governmental objectives, which in turn has led to the different effect of DZs on pollution discharge intensity.
This upgraded national DZs have many advantages compared to the provincial DZs. Firstly, the administrative level is raised, the provincial DZ is like a town while the national DZ is a municipal district, which makes the investment attraction more flexible. Moreover, preferential policies will be strengthened, for example, provincial DZs are more likely to enjoy reduced land rent, while national DZs can enjoy more national-level benefits, such as VAT exemptions. Thirdly, compared to the huge number of provincial DZs, the number of cites with national DZs is only 19%, and “national DZ” is still a very scarce city card. Finally, there will be more opportunities for policy piloting to national DZs, and more national and provincial policies will be enjoyed first.
Moreover, when the provincial DZs upgrade to national, they will be divided into two types, HTZs and ETZs. The HTZs were established to develop high-tech industries, so their industrial selection mainly focuses on high-tech industries, such as the industries related to information technology, biotechnology, and new material technology. However, the ETZs have the direct goal of increasing GDP through introducing foreign investment and developing export-oriented industries which are mainly the manufacturing and processing trade industries, regardless of whether the pollution is serious or not. As for the application process, the national HTZ is mainly applied to the Ministry of Science and Technology, which aims to promote scientific and technological innovation. After the application, the State Council organizes the Development and Reform Commission, the Ministry of Land and Resources, the Ministry of Construction to jointly examine and approve and, finally, issue a document.
Meanwhile, the national ETZ is led by the Ministry of Commerce for review. Although the opinions of the Ministry of Land and Resources, the Ministry of Construction, and the Development and Reform Commission are also required throughout the application and approval process, and finally approved and issued by the State Council, the main leading department is the Ministry of Commerce. The latter is mainly concerned with foreign trade and international economic cooperation. Moreover, the Ministry of Science and Technology decides whether or not to approve an applicant as a national HTZ based on the statistics such as the economic development level (e.g., GDP, exports, investment, etc.), fiscal revenue and expenditure (mainly the expenditure on science and technology), human capital level (number of highly educated employees), and innovation (e.g., number of patents, high-tech enterprises, etc.) However, when deciding whether to approve an applicant as a national ETZ, the statistics of the Ministry of Commerce are mainly concerned with the annual industrial output value per square kilometer, the overall scale of tax revenue, the scale of foreign direct investment and exports. Therefore, such differences in applying process and objectives have led to different industrial development requirements and different choices of key industries in each type of national DZ, which in turn have led to different levels of environmental pollution by different industries or enterprises within the DZs.
3. Empirical Strategy and Data
The effect of DZ policies on pollutant emissions is estimated based on the staggered difference-in-difference (DID) approach. Firstly, the dummy variable is set for DZ policies—regardless of whether the DZ is national or provincial—to estimate the overall effect, where equals one for municipalities with DZs and zero otherwise. We set the dummy variable to indicate whether there is a DZ in city i at year t. Generally, this method should set one dummy variable , the cities with DZ are in the experimental group, and the variable equals 1, the cities without DZ are in the control group and equals 0, therefore, variable can capture the differences between the experimental group and the control group even if no experiment is conducted. Meanwhile, this method should set another dummy variable which takes the establishment time of DZ as the dividing line, the variable equals 1 if the city has established DZ, the is 0 if not, therefore, variable can describe the differences between the two periods before and after the quasi-experiment. Then, the regression coefficient of the interaction term can measure precisely the effect of DZ policy on the experimental group. However, the DZs in some cities were not established in the same year. Therefore, the typical DID method is not consistent with ours, but we can see that the interaction term in the typical DID method is exactly the variable in our setting. The corresponding econometric model is:
The explanatory variable is the intensity of pollutant emissions in city i at year t. Given the availability of data, we use the logarithm of the ratio of wastewater ( tons) and sulfur dioxide emissions (tons) to GDP ( CNY) for each city, which were denoted as and , respectively. For the choice of control variables, Zhu et al. (2019), Zhao et al. (2020), and Cheng et al. (2018) suggest that industrial structure and foreign direct investment have a significant effect on pollutant emissions, while Chen et al. (2020) and Rahman et al. (2021) demonstrate that population density has an important effect on pollutant emissions, while Elheddad et al. (2021) elaborated on the effect of financial development level, and Liu et al. (2018) pointed out that city size can have a significant effect on pollutant emissions [50,51,52,53,54,55,56]. Therefore, the control variables X mainly include: the industrial structure variable , measured by the proportion of total value added of secondary and tertiary industries to GDP; the population density variable , measured by the number of people per unit of land area (thousand people/km); the financial development level variable , measured by the ratio of year-end financial institutions’ loan balances to GDP; the foreign direct investment variable , measured by the ratio of total foreign direct investment (converted to CNY using the annual average real effective exchange rate) to GDP; and the city size variable , measured by the logarithm of total city population ( people). Meanwhile, and are city and year fixed effect, and is the stochastic disturbance.
The entire dataset was obtained from the China’s Urban Statistical Yearbook, which is published by The National Bureau of Statistics of China. Additionally, some scholars have used these data in their empirical studies [14,57,58,59]. Therefore, these data have a high degree of credibility. Given that the wastewater and waste gas data in this yearbook have been disclosed only since 2003, the data used in this paper span the period 2003–2019 and include 288 cities at the prefecture level and above. The statistical analysis of the main variables is shown in Table 1.
We will follow the upgrade process when analyzing the role of DZ policies. Firstly, the overall impact of the DZ policy is analyzed empirically, at which point cities that establish DZs are used as the treated group, whether they establish provincial DZs or national DZs, and that cities which establish no DZs are used as the control group. Secondly, only the role of provincial DZ policies is empirically analyzed, and for this purpose, those cities that are upgraded to national DZs were removed from the sample, and the treated group is those cities that with only provincial DZs, and the control group contained still those cities without DZs. Finally, to empirically analyze the effect of upgrading from provincial to national DZs, then those cities that are upgraded to national-level DZs are included as the treated group, while those cities that only have provincial DZs are included as the control group.
Moreover, when the provincial DZs upgrade to the national level, they will be divided into HTZs and ETZs. It can be seen that the two types of DZs display obvious differences in industrial development, with HTZs focusing more on high-tech industries and ETZs focusing mainly on manufacturing industries under foreign investment. This difference will inevitably lead to a different effect of the different industrial clusters on environment. Therefore, the different types of DZs should also be taken into account when empirically analyzing the effect of national DZs on pollution discharge. However, some cities have both national HTZ and ETZ. Therefore, when empirically analyzing the role of national HTZs or ETZs separately, the sample points which have both are removed.
The data on DZs in this paper were mainly obtained from the China Development Zone Audit Bulletin Directory (hereafter CDZABD, 2018 Edition), which discloses both the list of provincial DZs and the list of national DZs, and there is no intersection between these two types. Since most national DZs are upgraded from provincial DZs and the CDZABD only reports the time when they became national-level, in order to obtain the time when a national DZ became a provincial DZ in the past, we first refer to the China Development Zone Review Announcement Catalogue (hearafter CDZRAC, 2006 Edition) to find the time when the national DZs setup during 2007 to 2018 was approved as a provincial DZ before 2006, and for the DZs that were upgraded to national level before 2006 or after 2018, we used the official website to find the time when they were approved as provincial DZs.
4. Basic Results
First, we empirically analyzed the overall impact of all China’s DZs on pollution discharge without considering the DZs’ upgrading process, the results are shown in Table 2, where columns (1)–(2) present the impact of DZs on wastewater discharge intensity and columns (3)–(4) present the impact on exhaust gas discharge intensity. The results of the variable show that DZs will increase the intensity of wastewater or exhaust gas in their cities regardless of whether control variables are included (odd columns do not include control variables and even columns include control variables). The establishment of DZs increases wastewater discharge by 7.54%, Wang and Nie (2016) [60] documented that the establishment of new DZs worsens the water quality of surrounding rivers. This suggest that industrial agglomeration increases pollutant emissions. The intuitive implication of this result is that although China’s DZs can increase production inputs, attract investment, or upgrade the industrial structure and productivity of the city, which in turn leads to economic growth, this process comes at the expense of the environment increasing the pollution discharge intensity. The DZs can realize the process of resource reallocation under industrial agglomeration as well as the reallocation of pollution, which may bring economic growth but increases relative pollution discharge faster. It means that the process of resource reallocation brought by industrial agglomeration is more in the agglomeration of those industries or enterprises with greater environmental pollution. Moreover, it is also a process of resource expansion. An important role of China’s DZs is to attract investment and FDI, then this result also means that, in the process of attracting investment to achieve economic growth, it attracts more enterprises with relatively more serious environmental pollution.
However, there is one distinctive feature of China’s DZ policy—the upgrading of DZs. First, local cities apply to provincial government departments, such as the Department of Science and Technology or the Development and Reform Commission, to establish provincial-level DZs. After years of building provincial-level DZs, provincial government departments can apply to national ministries, such as the central Ministry of Science and Technology, the Development and Reform Commission, and the Ministry of Commerce, to upgrade from provincial-level DZs to national-level DZs. There are also a few DZs that are national-level from the start, and these only account for about 20% of all national-level DZs. In this regard, this paper further analyzes the hierarchy of DZs. For this reason, this paper further analyzes the heterogeneous effects of policies on pollution emissions between provincial and national DZs. Table 3 presents the role of provincial DZs and Table 4 presents the role of national DZs.
The coefficients of in Table 3 show that if only provincial DZs are established, then it will aggravate the pollution discharge intensity, which is consistent with Table 2. However, Table 4 shows that if the DZ is upgraded from provincial to national level, then the coefficients of become insignificant. This suggests that the above discussion of the effect of DZs on pollution only applies to provincial DZs, for example, the increase in pollution intensity brought about by DZs through the resource reallocation effect or expansion effect only occurs in provincial DZs. Provincial DZs focus more on whether attracting investment can lead to greater economic growth than on whether it is environmentally friendly or even at the expense of the environment. However, when the DZ is upgraded to the national level, more attention will be paid to the environmental friendliness of the enterprises or industries it attracts, avoiding the destruction of the environment while benefiting the economy. It can be said that DZs are not only divided into different administrative levels—the provincial and the national, but also different “quality” levels from an environmental perspective.
5. Parallel Trend Test and Dynamic Impact
A premise of our DID strategy is that, in the absence of policy shock, the trend of the pollution discharge intensity between the treated group (cities with DZ) and the control group (cities without DZ) should be the same. Now, we construct the following model referring to Howell (2019) [61] to test the parallel trend assumption,
where is the dummy variable of policy enactment time. Suppose that is the year when the DZ was established. if , and 0 otherwise; if , and 0 otherwise, for . Then, the variables to describe the difference between the treated group and the control group before the policy implementation. if and 0 otherwise, it describes the effect of the policy after its implementation. A year prior, policy implementation was chosen as the baseline, that is, was removed from the regression. Then, we can test the parallel trend hypothesis, , if the hypothesis cannot be rejected, the parallel trend assumption is considered to be satisfied, the results are shown in Table 5. As can be seen, the F-test for the hypothesis shows that the hypothesis cannot be rejected, and there is no systematic differences between treated group and control group before policy implemented. Furthermore, the regression results based on the variable in columns (3) and (4) show that if only the policy of establishing a provincial DZ will indeed aggravate the pollution discharge intensity, while the upgrade to national DZ does not have such an impact. This is consistent with the previous results.
In order to further explore the dynamic effect of the DZs on pollution discharge, the econometric model is constructed such that:
where , and or the variable is used to control for the level of pollution discharge before policy implementation. The results for the variable describe the effect of the policy in the year of implementation, the regression results for the variable describe the effect of the policy one year after implementation, and so forth. The pre-policy period is chosen as the baseline, that is, the variable is removed from the regression. The results are shown in Table 6.
From columns (3) and (4), it can be seen that the aggravating effect of provincial DZs on pollution discharge increases year by year as policy implementation, especially for exhaust gases. As for national DZs, the aggravating effect on pollution discharge is insignificant after the policy conducted, which show great consistency with our baseline model in Table 4.
6. The Heterogenous Effects of Different Types of DZs
As mentioned earlier, the implementation of specific policy measures is very different between national HTZs and ETZs. The national HTZs mainly concentrates on high-tech enterprises in three major industries—information technology, biotechnology, and new material technology. However, the main purpose of the national ETZs is to attract foreign investment and promote the development of manufacturing industries. Therefore, such a difference in purpose may make a big difference in its impact on pollution discharge. We verified this judgment in Table 7 and Table 8. It can be seen that the results are different from the previous results in Table 4. Only the national ETZs have a certain positive effect on pollution discharge, and even the positive effect on wastewater is significant (as shown in Table 8). In contrast, for the national HTZs (as shown in Table 7), it has a significant inhibitory effect on pollution discharge. The coefficients in column (2) and (4) indicate that the setup of HTZs can reduce 17.37% of SO emissions and 6.68% of wastewater discharge. This result is consistent with the work of Wang et al. (2021) [62], they estimated that the setup of HTZs can reduce SO emissions by 19.9 tons and 26.8% of their sample mean. This difference in results verifies our previous analysis. The high-tech industries clustered in the HTZs mainly rely on frontier technologies, and such industries involve relatively low resource consumption and environmental pollution. Yang et al. (2022) [63] found that the establishment of HTZs increases the number of green technology patents obtained by firms by 0.093, with a sample mean value of 0.086, which means that the establishment of HTZs increases the number of green technology patents obtained by firms by 108.1%. On the other hand, the industries in the national ETZs are broader than those in the HTZs, and less attention is paid to the technology-intensive industries, which are also relatively more polluting.
7. The Pollution Reallocation Effect of DZs
Previous analysis shows that provincial DZs exacerbate the intensity of pollution discharge, while upgrading to national DZs does not have such an effect. This empirical result indicates that national DZs are of high quality, but provincial DZs are of low quality in terms of environmental protection. However, an important remaining issue is that, although provincial DZs increased pollution in their own cities, if such pollution is only transferred in equal amounts from cities without DZs to cities with DZs, then such provincial DZs are only “self-sacrificing” in the environment. Furthermore, national DZs can reduce the pollution intensity in their own cities, if such a policy only attracts low-pollution industries from outside the city, then such a policy is only “self-serving”. To answer this question, we further analyzed the spatial externality of DZs empirically using the spatial difference-in-difference (SDID) method, and the corresponding econometric model is:
where W is the spatial 0–1 weight matrix of whether cities are next to each other. reflects the effect of the city’s own policies, namely, the direct effect, while reflects the effect of neighboring cities’ policies, namely, the indirect effects or partial spillover effect.
In order to measure the relative magnitude of the direct effect and spatial spillover effect, and to address the difficulty in interpreting the coefficients of the spatial econometric model, a partial differential method of the spatial regression model is obtained by referring to the work of LeSage and Pace (2009) [64]. The direct effect reflects the impact of the DZ in city i on pollution discharge only in city i, which includes the feedback effect, i.e., the impact of policy in city i on other regions in turn affects city i. The spatial spillover effect reflects the effect of the policy in neighboring city j on city i. The total effect is the sum of the direct effect and the spatial spillover effect, which can be interpreted as the average effect of the DZ in a certain city on pollution discharge in all cities.
The empirical results are shown in Table 9 and Table 10. It can be seen that the coefficients of the spatial lags of the dependent variables are significantly non-zero (as shown in the regression results of the variable ), which indicates that only using the regression coefficients of the model to measure the spatial spillover effects of DZs will have systematic bias [64], so we use the empirical results of the direct and indirect effects shown in the table to perform the analysis.
Columns (1) and (2) in Table 9 show that the provincial DZs only exacerbate local pollution discharge intensity (as shown by the direct effects), but there is no significant spatial spillover effect (as shown by the spillover effects). The DZs policy, as a selective place based industrial policy, mainly selects a portion of cities to build DZs, and a corresponding portion of cities do not build DZs. Such a selective policy will realize the reallocation effect of resources—a portion of enterprises will flow from areas without DZs to areas with DZs. Since the provincial DZs mainly concentrate on manufacturing enterprises which may be with relatively higher pollution, such a reallocation effect may reduce the pollution discharge intensity in the area with provincial DZs, and reduce the pollution in the area with DZs. However, the empirical results show that the DZs do not reduce the pollution in the neighboring areas, which indicates that the provincial DZs do not significantly contribute to the pollution reallocation effect. On the other hand, another role of the provincial DZs is to attract domestic and foreign investment which is a process of resources expansion, and these investment will be mainly concentrated in the manufacturing industries preferred by the DZs. Since the provincial DZs mainly focus on local economic growth and ignore environmental pollution, our empirical evidence shows that the increase in investment brought by provincial DZs is at the expense of the environment.
When upgraded to national DZs, it not only has no aggravating effect on the local pollution discharge intensity, but also reduces the pollution to the neighboring areas, as shown in columns (3) and (4) of Table 9. However, the reason for this result should be further analyzed in terms of the different effect of different types of national DZs—national HTZs and national ETZs, whose empirical results are shown in Table 10.
Columns (1) and (2) in Table 10 show that national HTZs will alleviate the wastewater discharge intensity in the region (as shown by the direct effects). Previous sections have partially show the reason for this. Firstly, the HTZs will bring about the economic agglomeration effect, which in turn will promote competition between enterprises, technological progress and technology diffusion, all of which may further reduce the enterprises’ pollution. Moreover, the government’s domination of industries, another characteristic of China’s DZs, also makes national HTZs more clustered with high-tech enterprises, and such industrial choices will inevitably lead to lower pollution per unit of output in their regions. As for the spillover effects, column (2) shows that national HTZs significantly reduce pollution in neighboring areas. One important reason is that national HTZs have more technological diffusion effects and less pollution reallocation effects on the surrounding areas. In the process of HTZs construction, although high-tech enterprises are concentrated in their area, their technological progress will spill over to the surrounding areas, and it also forms a better division effect with the surrounding areas, so that the industrial structure of the surrounding areas will also be upgraded. Eventually, the national HTZs will have a mitigating effect on pollution to the surrounding areas, which is why it can be said that the construction of national HTZs is “self-beneficial and altruistic” for the environment.
Columns (3) and (4) in Table 10 show that the national ETZs will increase the pollution discharge intensity in their regions (as shown by the direct effects). Although the economic agglomeration in ETZs can also mitigate the pollution intensity to some extent through technological progress and diffusion, the ETZs mainly gather manufacturing enterprises with relatively low technology level under the guidance of the government, and the pollution discharge intensity of these enterprises is relatively higher. However, the results on the spillover effects show that, although the ETZs aggravate their own pollution intensity, they have significantly and obviously mitigated the pollution in the neighboring areas. This indicates that the industrial agglomeration in the ETZs attracts the more polluting manufacturing enterprises from the surrounding areas to itself through the reallocation effect, while reducing the pollution in the surrounding areas. Moreover, such flow is not equal, the ETZs uses its economic agglomeration effect to reduce part of the transferred pollution. Eventually, the empirical results show that, the reduction of pollution under the spillover effects is greater than the increase of pollution under the direct effects, and the total effects still shows a reduction of aggregate pollution. It can be said that the construction of the ETZs is “self-sacrificing” for the environment.
In comparison, in terms of the total effects, the mitigation effect of the “self-serving and altruistic” national HTZs on pollution discharge intensity is significantly greater than the “self-sacrificing” national ETZs.
8. Conclusions
DZs can achieve economic agglomeration as a place-based policy. However, China’s DZs also have another important feature, government domination, in addition to the economic agglomeration, such as, the government selection of industries in DZs, and upgrading of DZs led by the government. Therefore, this paper focuses on the government domination characteristic of China’s DZs and empirically examines how China’s DZs affect pollution discharge intensity, using staggered DID combined with China’s urban panel data. Moreover, China’s DZs are selective policies, i.e., the provincial and central government select some cities to build DZs while others are accordingly not selected. Such a selective policy will inevitably bring about the reallocation of resources and pollution, thus, this paper examines the pollution reallocation effects among cities using a spatial DID approach.
Overall, the DZs policy in China will increase the pollution discharge intensity, which indicates that, although the DZs may drive economic growth, they are at the expense of environment. The provincial DZs are more concentrated in manufacturing enterprises because they focus on short-term GDP growth when they are established, and this increases pollution discharge intensity in the zones. In contrast, in addition to the GDP, the national DZs also pay more attention to environmental issues. When the provincial DZs are upgraded to the national level, they will not sacrifice the environment and may even reduce pollution discharge intensity. As the number of provincial DZs is much larger than national DZs, the overall DZs aggravate pollution discharge intensity. Therefore, China should continue to increase the number of national DZs and encourage qualified provincial DZs to upgrade. At the same time, provincial DZs should not only focus on GDP growth, but also consider the environmental impact, and place more environmental constraints for local governments when constructing DZs, as well as penalizing the firms in DZs that do not meet the environmental requirements.
The national DZs, including the national HTZs and the national ETZs, have different effects on pollution, whereby the national ETZs increase the pollution discharge intensity while the national HTZs decrease it. The reason for this difference lies in the different choices of industries led by the governments. The HTZs mainly focus on high-tech industries with low energy consumption and pollution, while the ETZs mainly focus on traditional manufacturing industry to attract foreign investment resulting in increased pollution. Therefore, the national ETZs need to pay attention to economic growth as well as environmental issues, and take the environmental impact as an important criterion when selecting firms. The government can establish a special fund to support the green technology innovation of firms, or build a pollution trading market in the DZs to promote the green technology.
Different levels and types of DZs have different spillover effects on the surrounding areas. Provincial DZs do not reduce pollution intensity in the surrounding areas, while aggravating local pollution intensity. When provincial DZs are upgraded to the national level, the national ETZs are “self-sacrificing”, namely, the national ETZs concentrate polluting firms in the surrounding areas to aggravate local pollution intensity, but reduce the pollution intensity in the surrounding areas. As the spillover effect is greater than the direct effect, they reduce the aggregate pollution intensity of the whole country. The national HTZs are “self-serving and altruistic”, that is, the national HTZs concentrate high-tech industries in the zones to reduce the pollution intensity through technological progress, meanwhile, they can spread the knowledge and technology to the surrounding areas, which indirectly improve the technology in the surrounding areas, and thus reduce the pollution intensity in the surrounding areas.
Our empirical results highlight that when cities establish provincial DZs, they need to screen the firms that have settled in the DZs to improve the quality of DZs and avoid environmental pollution caused by “race to bottom” competition. At the same time, the strict requirements for high-quality and environmentally frendly firms are also conducive to upgrading to a national DZ or even a HTZ in the future to achieve an environmentally friendly high-quality development goal. The limitation of this study is that the detailed data on firms’ pollution emissions are currently unavailable to us. We hope that we can use the detailed data to identify the mechanisms of the establishment or upgrading of DZs to pollution emissions, to make our understanding of DZ policy more complete.
Author Contributions
Conceptualization, W.J. and L.J.; methodology, W.J., L.J. and K.C.; software, K.C.; validation, W.J., L.J. and Y.C.; formal analysis, W.J., Q.X. and Y.C.; resources, Q.X.; data curation, K.C. and Y.C.; writing—original draft preparation, W.J. and L.J.; writing—review and editing, K.C. and Y.C.; visualization, K.C.; supervision, Y.C. and Q.X.; funding acquisition, Q.X. All authors have read and agreed to the published version of the manuscript.
Funding
This work was supported by Projects of National Social Science Fund of China (No.19BTJ032).
Institutional Review Board Statement
Not applicable.
Informed Consent Statement
Not applicable.
Data Availability Statement
The data presented in this study are available on request from the corresponding author.
Acknowledgments
This paper is financially supported by National Social Science Fund of China (No. 19BTJ032). In addition, we thank the editors and the anonymous reviewers for their constructive comments and advices.
Conflicts of Interest
The authors declare no conflict of interest.
References
- Ham, J.C.; Swenson, C.; İmrohoroğlu, A.; Song, H. Government programs can improve local labor markets: Evidence from state enterprise zones, federal empowerment zones and federal enterprise community. J. Public Econ. 2011, 95, 779–797. [Google Scholar] [CrossRef]
- Chaudhary, N.; Potter, J. Evaluation of the local employment impacts of enterprise zones: A critique. Urban Stud. 2019, 56, 2112–2159. [Google Scholar] [CrossRef]
- Neumark, D.; Young, T. Enterprise zones, poverty, and labor market outcomes: Resolving conflicting evidence. Reg. Sci. Urban Econ. 2019, 78, 103462. [Google Scholar] [CrossRef] [Green Version]
- Combes, P.P.; Duranton, G.; Gobillon, L. The identification of agglomeration economies. J. Econ. Geogr. 2011, 11, 253–266. [Google Scholar] [CrossRef] [Green Version]
- Neumark, D.; Simpson, H. Place-based policies. In Handbook of Regional and Urban Economics; Elsevier: Amsterdam, The Netherlands, 2015; Volume 5, pp. 1197–1287. [Google Scholar]
- Carlino, G.; Kerr, W.R. Agglomeration and innovation. In Handbook of Regional and Urban Economics; Elsevier: Amsterdam, The Netherlands, 2015; Volume 5, pp. 349–404. [Google Scholar]
- Buzard, K.; Carlino, G.A.; Hunt, R.M.; Carr, J.K.; Smith, T.E. The agglomeration of American R&D labs. J. Urban Econ. 2017, 101, 14–26. [Google Scholar]
- Jang, S.; Kim, J.; von Zedtwitz, M. The importance of spatial agglomeration in product innovation: A microgeography perspective. J. Bus. Res. 2017, 78, 143–154. [Google Scholar] [CrossRef]
- Zhang, X.; Huang, P.; Sun, L.; Wang, Z. Spatial evolution and locational determinants of high-tech industries in Beijing. Chin. Geogr. Sci. 2013, 23, 249–260. [Google Scholar] [CrossRef]
- Li, Y.; Zhu, K. Spatial dependence and heterogeneity in the location processes of new high-tech firms in Nanjing, China. Pap. Reg. Sci. 2017, 96, 519–535. [Google Scholar] [CrossRef]
- Wei, S.J. The open door policy and China’s rapid growth: Evidence from city-level data. Growth Theor. Light East Asian Exp. 1995, 4, 73–104. [Google Scholar]
- Wei, Y.D.; Leung, C.K. Development zones, foreign investment, and global city formation in Shanghai. Growth Chang. 2005, 36, 16–40. [Google Scholar] [CrossRef]
- Wang, J. The economic impact of special economic zones: Evidence from Chinese municipalities. J. Dev. Econ. 2013, 101, 133–147. [Google Scholar] [CrossRef]
- Alder, S.; Shao, L.; Zilibotti, F. Economic reforms and industrial policy in a panel of Chinese cities. J. Econ. Growth 2016, 21, 305–349. [Google Scholar] [CrossRef]
- Lu, Y.; Wang, J.; Zhu, L. Place-based policies, creation, and agglomeration economies: Evidence from China’s economic zone program. Am. Econ. J. Econ. Policy 2019, 11, 325–360. [Google Scholar] [CrossRef] [Green Version]
- Jin, L.; Liu, X.; Tang, S.H.K. High-technology zones, misallocation of resources among cities and aggregate productivity: Evidence from China. Appl. Econ. 2021, 54, 2778–2794. [Google Scholar] [CrossRef]
- Tian, X.; Bai, F.; Jia, J.; Liu, Y.; Shi, F. Realizing low-carbon development in a developing and industrializing region: Impacts of industrial structure change on CO2 emissions in southwest China. J. Environ. Manag. 2019, 233, 728–738. [Google Scholar] [CrossRef] [PubMed]
- Liu, R.; Zhao, R. The Role of China’s High-Tech Zones in Its Regional Economic Development. China Econ. 2016, 11, 44–56. [Google Scholar]
- Wu, F.; Phelps, N.A. (Post) suburban development and state entrepreneurialism in Beijing’s outer suburbs. Environ. Plan. A 2011, 43, 410–430. [Google Scholar] [CrossRef]
- Miao, J.T.; Hall, P. Optical illusion? The growth and development of the Optics Valley of China. Environ. Plan. C Gov. Policy 2014, 32, 863–879. [Google Scholar] [CrossRef] [Green Version]
- Li, Y.; Wang, X. Innovation in suburban development zones: Evidence from Nanjing, China. Growth Chang. 2019, 50, 114–129. [Google Scholar] [CrossRef] [Green Version]
- Wang, S.; He, Y.; Song, M. Global value chains, technological progress, and environmental pollution: Inequality towards developing countries. J. Environ. Manag. 2021, 277, 110999. [Google Scholar] [CrossRef]
- Liu, K.; Lin, B. Research on influencing factors of environmental pollution in China: A spatial econometric analysis. J. Clean. Prod. 2019, 206, 356–364. [Google Scholar] [CrossRef]
- Chaudhry, I.S.; Ali, S.; Bhatti, S.H.; Anser, M.K.; Khan, A.I.; Nazar, R. Dynamic common correlated effects of technological innovations and institutional performance on environmental quality: Evidence from East-Asia and Pacific countries. Environ. Sci. Policy 2021, 124, 313–323. [Google Scholar] [CrossRef]
- Sharma, R.; Sinha, A.; Kautish, P. Examining the nexus between export diversification and environmental pollution: Evidence from BRICS nations. Environ. Sci. Pollut. Res. 2021, 28, 61732–61747. [Google Scholar] [CrossRef] [PubMed]
- Bilgili, F.; Nathaniel, S.P.; Kuşkaya, S.; Kassouri, Y. Environmental pollution and energy research and development: An Environmental Kuznets Curve model through quantile simulation approach. Environ. Sci. Pollut. Res. 2021, 28, 53712–53727. [Google Scholar] [CrossRef] [PubMed]
- Xu, B.; Lin, B. Regional differences of pollution emissions in China: Contributing factors and mitigation strategies. J. Clean. Prod. 2016, 112, 1454–1463. [Google Scholar] [CrossRef]
- Otsuka, A.; Goto, M.; Sueyoshi, T. Energy efficiency and agglomeration economies: The case of J apanese manufacturing industries. Reg. Sci. Policy Pract. 2014, 6, 195–212. [Google Scholar] [CrossRef]
- Acemoglu, D.; García-Jimeno, C.; Robinson, J.A. State capacity and economic development: A network approach. Am. Econ. Rev. 2015, 105, 2364–2409. [Google Scholar] [CrossRef] [Green Version]
- Liu, S.; Zhu, Y.; Du, K. The impact of industrial agglomeration on industrial pollutant emission: Evidence from China under New Normal. Clean Technol. Environ. Policy 2017, 19, 2327–2334. [Google Scholar] [CrossRef]
- Muganyi, T.; Yan, L.; Sun, H.p. Green finance, fintech and environmental protection: Evidence from China. Environ. Sci. Ecotechnol. 2021, 7, 100107. [Google Scholar] [CrossRef]
- Tian, P.; Lin, B. Impact of financing constraints on firm’s environmental performance: Evidence from China with survey data. J. Clean. Prod. 2019, 217, 432–439. [Google Scholar] [CrossRef]
- Zeng, D.Z.; Zhao, L. Pollution havens and industrial agglomeration. J. Environ. Econ. Manag. 2009, 58, 141–153. [Google Scholar] [CrossRef] [Green Version]
- Ma, R.; Wang, C.; Jin, Y.; Zhou, X. Estimating the effects of economic agglomeration on haze pollution in Yangtze River Delta China using an econometric analysis. Sustainability 2019, 11, 1893. [Google Scholar] [CrossRef] [Green Version]
- Cheng, Z. The spatial correlation and interaction between manufacturing agglomeration and environmental pollution. Ecol. Indic. 2016, 61, 1024–1032. [Google Scholar] [CrossRef]
- Verhoef, E.T.; Nijkamp, P. Externalities in urban sustainability: Environmental versus localization-type agglomeration externalities in a general spatial equilibrium model of a single-sector monocentric industrial city. Ecol. Econ. 2002, 40, 157–179. [Google Scholar] [CrossRef] [Green Version]
- Su, Y.; Yu, Y.q. Spatial agglomeration of new energy industries on the performance of regional pollution control through spatial econometric analysis. Sci. Total Environ. 2020, 704, 135261. [Google Scholar] [CrossRef]
- Fan, Q.; Yang, S.; Liu, S. Asymmetrically spatial effects of urban scale and agglomeration on haze pollution in China. Int. J. Environ. Res. Public Health 2019, 16, 4936. [Google Scholar] [CrossRef] [PubMed] [Green Version]
- Liang, W.; Yang, M. Urbanization, economic growth and environmental pollution: Evidence from China. Sustain. Comput. Inform. Syst. 2019, 21, 1–9. [Google Scholar] [CrossRef]
- Guo, Y.; Tong, L.; Mei, L. Evaluation and influencing factors of industrial pollution in Jilin restricted development zone: A spatial econometric analysis. Sustainability 2021, 13, 4194. [Google Scholar] [CrossRef]
- Zhou, K.; Liu, H.; Wang, Q. The impact of economic agglomeration on water pollutant emissions from the perspective of spatial spillover effects. J. Geogr. Sci. 2019, 29, 2015–2030. [Google Scholar] [CrossRef] [Green Version]
- Guo, L.; Luo, J.; Yuan, M.; Huang, Y.; Shen, H.; Li, T. The influence of urban planning factors on PM2. 5 pollution exposure and implications: A case study in China based on remote sensing, LBS, and GIS data. Sci. Total Environ. 2019, 659, 1585–1596. [Google Scholar] [CrossRef]
- Sun, Y.; Ma, A.; Su, H.; Su, S.; Chen, F.; Wang, W.; Weng, M. Does the establishment of development zones really improve industrial land use efficiency? Implications for China’s high-quality development policy. Land Use Policy 2020, 90, 104265. [Google Scholar] [CrossRef]
- Czarnitzki, D.; Hanel, P.; Rosa, J.M. Evaluating the impact of R&D tax credits on innovation: A microeconometric study on Canadian firms. Res. Policy 2011, 40, 217–229. [Google Scholar] [CrossRef] [Green Version]
- Woldesilassie, T.L.; Ivatury, V.M.K. Key Determinant Factors Affecting the Performance of Small and Medium Scale Manufacturing Enterprise: A Case Study on West Shoa Zone, Oromia National Regional State, Ethiopia. Int. J. Eng. Res. 2020, 9, 555–562. [Google Scholar]
- Hu, K.; Shi, D. The impact of government-enterprise collusion on environmental pollution in China. J. Environ. Manag. 2021, 292, 112744. [Google Scholar] [CrossRef] [PubMed]
- Liang, L.; Wang, Z.; Li, J. The effect of urbanization on environmental pollution in rapidly developing urban agglomerations. J. Clean. Prod. 2019, 237, 117649. [Google Scholar] [CrossRef]
- Huang, X.; Chen, X.; Huang, P. Research on fuzzy cooperative game model of allocation of pollution discharge rights. Water 2018, 10, 662. [Google Scholar] [CrossRef] [Green Version]
- Zhuang, L.; Ye, C. Changing imbalance: Spatial production of national high-tech industrial development zones in China (1988–2018). Land Use Policy 2020, 94, 104512. [Google Scholar] [CrossRef]
- Zhu, L.; Hao, Y.; Lu, Z.N.; Wu, H.; Ran, Q. Do economic activities cause air pollution? Evidence from China’s major cities. Sustain. Cities Soc. 2019, 49, 101593. [Google Scholar] [CrossRef]
- Zhao, H.; Cao, X.; Ma, T. A spatial econometric empirical research on the impact of industrial agglomeration on haze pollution in China. Air Qual. Atmos. Health 2020, 13, 1305–1312. [Google Scholar] [CrossRef]
- Cheng, X.; Fan, L.; Wang, J. Can energy structure optimization, industrial structure changes, technological improvements, and central and local governance effectively reduce atmospheric pollution in the Beijing–Tianjin–Hebei area in China? Sustainability 2018, 10, 644. [Google Scholar] [CrossRef] [Green Version]
- Chen, J.; Wang, B.; Huang, S.; Song, M. The influence of increased population density in China on air pollution. Sci. Total Environ. 2020, 735, 139456. [Google Scholar] [CrossRef] [PubMed]
- Rahman, M.M.; Alam, K. Clean energy, population density, urbanization and environmental pollution nexus: Evidence from Bangladesh. Renew. Energy 2021, 172, 1063–1072. [Google Scholar] [CrossRef]
- Elheddad, M.; Benjasak, C.; Deljavan, R.; Alharthi, M.; Almabrok, J.M. The effect of the Fourth Industrial Revolution on the environment: The relationship between electronic finance and pollution in OECD countries. Technol. Forecast. Soc. Chang. 2021, 163, 120485. [Google Scholar] [CrossRef]
- Liu, Y.; Wu, J.; Yu, D.; Ma, Q. The relationship between urban form and air pollution depends on seasonality and city size. Environ. Sci. Pollut. Res. 2018, 25, 15554–15567. [Google Scholar] [CrossRef]
- Ebenstein, A.; Fan, M.; Greenstone, M.; He, G.; Yin, P.; Zhou, M. Growth, Pollution, and Life Expectancy: China from 1991–2012. Am. Econ. Rev. 2015, 105, 226–231. [Google Scholar] [CrossRef] [Green Version]
- Su, Y.; Liu, Z. The impact of foreign direct investment and human capital on economic growth: Evidence from Chinese cities. China Econ. Rev. 2016, 37, 97–109. [Google Scholar] [CrossRef]
- Combes, P.P.; Démurger, S.; Li, S. Migration externalities in Chinese cities. Eur. Econ. Rev. 2015, 76, 152–167. [Google Scholar] [CrossRef] [Green Version]
- Wang, B.; Nie, X. Industrial Agglomeration and Environmental Governance: The Power or Resistance-Evidence from a Ouasi-natural Experiment of Establishment of the Development Zone. China Ind. Econ. 2016, 12, 75–89. (In Chinese) [Google Scholar]
- Howell, A. Heterogeneous impacts of China’s economic and development zone program. J. Reg. Sci. 2019, 59, 797–818. [Google Scholar] [CrossRef]
- Wang, X.; Feng, Y. The effects of National High-tech Industrial Development Zones on economic development and environmental pollution in China during 2003–2018. Environ. Sci. Pollut. Res. 2021, 28, 1097–1107. [Google Scholar] [CrossRef]
- Yang, S.; Liu, W.; Zhang, Z. The Dynamic Value of China’s High-Tech Zones: Direct and Indirect Influence on Urban Ecological Innovation. Land 2022, 11, 59. [Google Scholar] [CrossRef]
- LeSage, J.; Pace, R.K. Introduction to Spatial Econometrics; Chapman and Hall/CRC: Boca Raton, FL, USA, 2009. [Google Scholar]
Figure 1.
Time Distribution of Newly Established DZs. (a) No. of Provincial DZs. (b) No. of National DZs. Notes: the accumulated No. of DZs are listed on the right axis.
Figure 1.
Time Distribution of Newly Established DZs. (a) No. of Provincial DZs. (b) No. of National DZs. Notes: the accumulated No. of DZs are listed on the right axis.

Figure 2.
The geographic evolution of China’s DZs. Notes: The green ones are provincial DZs, and the orange ones are national DZs.
Figure 2.
The geographic evolution of China’s DZs. Notes: The green ones are provincial DZs, and the orange ones are national DZs.


Table 1.
Descriptive statistics of each variable.
| Var. Name | Obs | Mean | Std. Dev. | Min | Max |
|---|---|---|---|---|---|
| 4630 | −7.7435 | 1.0874 | −13.4289 | −3.5431 | |
| 4627 | −5.7173 | 1.4596 | −14.5143 | −1.4368 | |
| 4639 | 0.8589 | 0.0901 | 0.5011 | 0.9997 | |
| 4811 | 0.4258 | 0.3312 | 0.0000 | 2.7130 | |
| 4823 | 0.8715 | 0.5560 | 0.0753 | 9.6229 | |
| 4419 | 0.0209 | 0.0230 | 0.0000 | 0.3758 | |
| 4813 | 5.8482 | 0.7417 | −3.2189 | 8.1363 |
Table 2.
Overall impact of DZ policies on emissions.
| (1) | (2) | (3) | (4) | |
|---|---|---|---|---|
| lnw | lnw | lns | lns | |
| 0.0663 * | 0.0754 ** | 0.2720 *** | 0.2004 *** | |
| (0.040) | (0.036) | (0.054) | (0.055) | |
| −2.3684 *** | −0.8067 *** | |||
| (0.260) | (0.308) | |||
| 0.7180 *** | −1.3472 *** | |||
| (0.182) | (0.215) | |||
| 0.0918 *** | 0.1168 *** | |||
| (0.028) | (0.033) | |||
| −0.7067 ** | −0.0406 | |||
| (0.342) | (0.405) | |||
| −0.0141 | −0.4568 *** | |||
| (0.138) | (0.164) | |||
| −6.6833 *** | −5.0353 *** | −4.8070 *** | −0.9949 | |
| (0.047) | (0.813) | (0.056) | (0.961) | |
| City effects | Yes | Yes | Yes | Yes |
| Time effects | Yes | Yes | Yes | Yes |
| N | 4630 | 4160 | 4627 | 4158 |
| 0.7372 | 0.7351 | 0.7767 | 0.7676 | |
| F | 781.7913 | 538.5685 | 964.5664 | 638.0513 |
Notes: Cluster standard error in parentheses. * denotes p < 0.1, ** p < 0.05, and *** p < 0.01.
Table 3.
The impact of provincial DZs.
| (1) | (2) | (3) | (4) | |
|---|---|---|---|---|
| lnw | lnw | lns | lns | |
| 0.1206 ** | 0.1194 ** | 0.1823 *** | 0.1538 *** | |
| (0.049) | (0.048) | (0.057) | (0.058) | |
| −6.6852 *** | −5.0344 *** | −4.6275 *** | −2.3041 | |
| (0.049) | (1.802) | (0.057) | (2.402) | |
| Controls | No | Yes | No | Yes |
| City effects | Yes | Yes | Yes | Yes |
| Time effects | Yes | Yes | Yes | Yes |
| N | 2573 | 2510 | 2574 | 2313 |
| 0.6553 | 0.6313 | 0.6397 | 0.6165 | |
| F | 301.742 | 216.2048 | 282.7928 | 180.006 |
Notes: Cluster standard error in parentheses. * denotes p < 0.1, ** p < 0.05, and *** p < 0.01.
Table 4.
The impact of national DZs.
| (1) | (2) | (3) | (4) | |
|---|---|---|---|---|
| lnw | lnws | lns | lns | |
| −0.0008 | 0.0333 | 0.0233 | 0.0469 | |
| (0.025) | (0.025) | (0.029) | (0.029) | |
| −6.6279 *** | −4.8453 *** | −4.5487 *** | −1.9596 ** | |
| (0.029) | (0.810) | (0.034) | (0.979) | |
| Controls | No | Yes | No | Yes |
| City effects | Yes | Yes | Yes | Yes |
| Time effects | Yes | Yes | Yes | Yes |
| N | 4469 | 4263 | 4468 | 4016 |
| 0.7390 | 0.7282 | 0.7867 | 0.7803 | |
| F | 762.1298 | 558.472 | 986.7409 | 662.0061 |
Notes: Cluster standard error in parentheses. * denotes p < 0.1, ** p < 0.05, and *** p < 0.01.
Table 5.
Parallel trend test.
| General Impact | The Impact of Provincial DZs | The Impact of National DZs | ||||
|---|---|---|---|---|---|---|
| (1) | (2) | (3) | (4) | (5) | (6) | |
| lnw | lns | lnw | lns | lnw | lns | |
| ≥6 years before | −0.2738 | −0.4196 ** | −0.2347 | −0.3389 * | 0.002 | 0.0942 * |
| (0.172) | (0.205) | (0.174) | (0.203) | (0.048) | (0.056) | |
| 5 years before | −0.2753 | 0.0243 | −0.2435 | 0.0861 | −0.0187 | 0.0953 |
| (0.216) | (0.258) | (0.219) | (0.256) | (0.057) | (0.067) | |
| 4 years before | −0.3465 * | 0.1729 | −0.3129 | 0.2214 | −0.0154 | 0.0529 |
| (0.198) | (0.237) | (0.200) | (0.235) | (0.055) | (0.065) | |
| 3 years before | 0.0067 | 0.0991 | 0.0146 | 0.1218 | −0.0077 | 0.0281 |
| (0.102) | (0.122) | (0.105) | (0.122) | (0.055) | (0.065) | |
| 2 years before | 0.0453 | 0.056 | 0.0488 | 0.0731 | −0.0189 | 0.0098 |
| (0.100) | (0.119) | (0.102) | (0.119) | (0.055) | (0.066) | |
| 1 years before | ||||||
| 1.50 | 1.48 | 1.20 | 1.32 | 0.08 | 0.94 | |
| Policy | 0.0508 | 0.3043 *** | 0.1111* | 0.2325 *** | −0.0086 | 0.0705 |
| beginning | (0.072) | (0.087) | (0.070) | (0.088) | (0.042) | (0.050) |
Notes: In the case of the test β−6 = β−5 = … = β−2 = 0, the F-values are listed in the table. Cluster standard error in parentheses. * denotes p < 0.1, ** p < 0.05, and *** p < 0.01.
Table 6.
Dynamic analysis of the role of policies.
| General Impact | The Impact of Provincial DZs | The Impact of National DZs | ||||
|---|---|---|---|---|---|---|
| (1) | (2) | (3) | (4) | (5) | (6) | |
| lnw | lns | lnw | lns | lnw | lns | |
| Policy before | ||||||
| Policy year | 0.0317 | 0.1096 | 0.0185 | 0.075 | −0.0176 | −0.0623 |
| (0.075) | (0.089) | (0.077) | (0.090) | (0.043) | (0.051) | |
| 1 year after | 0.1160 * | 0.1482 * | 0.1146 | 0.0837 | −0.0225 | 0.0207 |
| (0.071) | (0.085) | (0.074) | (0.086) | (0.044) | (0.052) | |
| 2 year after | 0.0977 | 0.1477 * | 0.1081 | 0.1194 | 0.0273 | 0.0238 |
| (0.070) | (0.083) | (0.072) | (0.084) | (0.044) | (0.052) | |
| 3 year after | 0.1213 * | 0.1589 * | 0.1407 * | 0.1503 * | −0.0224 | 0.0199 |
| (0.071) | (0.084) | (0.072) | (0.084) | (0.045) | (0.054) | |
| 4 year after | 0.0623 | 0.1679 ** | 0.1501 ** | 0.2428 *** | −0.0281 | 0.0687 |
| (0.068) | (0.081) | (0.073) | (0.085) | (0.046) | (0.054) | |
| 5 year after | 0.0341 | 0.1384 * | 0.1603 ** | 0.2086 ** | 0.0305 | 0.0897 |
| (0.069) | (0.082) | (0.074) | (0.087) | (0.050) | (0.059) | |
| ≥6 year after | 0.067 | 0.3238 *** | 0.1678 *** | 0.3809 *** | 0.0343 | 0.0598 |
| (0.052) | (0.062) | (0.059) | (0.069) | (0.039) | (0.046) | |
Notes: Cluster standard error in parentheses. * denotes p < 0.1, ** p < 0.05, and *** p < 0.01.
Table 7.
The role of national-level HTZs.
| (1) | (2) | (3) | (4) | |
|---|---|---|---|---|
| lnw | lnw | lns | lns | |
| −0.0773 ** | −0.0668 * | −0.2090 *** | −0.1737 *** | |
| (0.037) | (0.038) | (0.045) | (0.044) | |
| −6.5724 *** | −3.9930 ** | −4.4405 *** | −0.6177 | |
| (0.031) | (1.955) | (0.038) | (2.311) | |
| Controls | No | Yes | No | Yes |
| City effects | Yes | Yes | Yes | Yes |
| Time effects | Yes | Yes | Yes | Yes |
| N | 3000 | 2693 | 3000 | 2695 |
| 0.9837 | 0.9762 | 0.9787 | 0.9707 | |
| F | 10,674.9704 | 5023.2728 | 8140.1407 | 4066.6128 |
Notes: Cluster standard error in parentheses. * denotes p < 0.1, ** p < 0.05, and *** p < 0.01.
Table 8.
The role of national-level economic ETZs.
| (1) | (2) | (3) | (4) | |
|---|---|---|---|---|
| lnw | lnw | lns | lns | |
| 0.0794 ** | 0.0777 ** | −0.0435 | 0.0215 | |
| (0.034) | (0.034) | (0.038) | (0.037) | |
| −6.5998 *** | −6.2864 *** | −4.4653 *** | −5.7378 *** | |
| (0.033) | (1.346) | (0.037) | (1.479) | |
| Controls | No | Yes | No | Yes |
| City effects | Yes | Yes | Yes | Yes |
| Time effects | Yes | Yes | Yes | Yes |
| N | 3032 | 2707 | 3035 | 2711 |
| 0.9809 | 0.9688 | 0.9781 | 0.9659 | |
| F | 9174.8239 | 3834.7932 | 8002.0841 | 3498.0715 |
Notes: Cluster standard error in parentheses. * denotes p < 0.1, ** p < 0.05, and *** p < 0.01.
Table 9.
Role of DZs.
| The Role of Provincial DZs | The Role of National DZs | |||
|---|---|---|---|---|
| (1) | (2) | (3) | (4) | |
| lnw | lns | lnw | lns | |
| 0.0960 *** | 0.2479 *** | 0.2054 *** | 0.1676 *** | |
| (0.030) | (0.027) | (0.019) | (0.018) | |
| 0.1868 ** | 0.1357 * | −0.0133 | 0.0684 ** | |
| (0.077) | (0.080) | (0.026) | (0.031) | |
| 0.0839 | −0.0737 | −0.2488 *** | −0.2330 *** | |
| (0.094) | (0.098) | (0.041) | (0.050) | |
| Direct effects | 0.1939 ** | 0.1339 | −0.0281 | 0.0584 * |
| (0.079) | (0.086) | (0.027) | (0.032) | |
| Spillover effects | 0.0772 | −0.0371 | −0.2942 *** | −0.2496 *** |
| (0.071) | (0.085) | (0.047) | (0.054) | |
| Total effects | 0.2711 ** | 0.0968 | −0.3223 *** | −0.1912 *** |
| (0.116) | (0.142) | (0.060) | (0.068) | |
| City effects | Yes | Yes | Yes | Yes |
| Time effects | Yes | Yes | Yes | Yes |
| N | 1173 | 1173 | 3468 | 3468 |
| 0.0368 | 0.005 | 0.2251 | 0.1086 | |
Notes: Cluster standard error in parentheses. * denotes p < 0.1, ** p < 0.05, and *** p < 0.01.
Table 10.
Role of national DZs.
| The Role of National HTZs | The Role of National ETZs | |||
|---|---|---|---|---|
| (1) | (2) | (3) | (4) | |
| lnw | lns | lnw | lns | |
| 0.1989 *** | 0.1648 *** | 0.2100 *** | 0.1779 *** | |
| (0.019) | (0.018) | (0.019) | (0.018) | |
| −0.0277 *** | 0.0526 | 0.0417 * | 0.1253 *** | |
| (0.008) | (0.034) | (0.021) | (0.033) | |
| −0.0527 | −0.2883 *** | −0.1770 *** | −0.3881 *** | |
| (0.045) | (0.054) | (0.045) | (0.053) | |
| Direct effects | −0.0302 *** | 0.0401 | 0.0319 | 0.1069 *** |
| (0.010) | (0.035) | (0.029) | (0.034) | |
| Spillover effects | −0.0692 | −0.3141 *** | −0.1985 *** | −0.4156 *** |
| (0.051) | (0.059) | (0.051) | (0.058) | |
| Total effects | −0.0994 *** | −0.2740 *** | −0.1666 *** | −0.3087 *** |
| (0.033) | (0.073) | (0.062) | (0.071) | |
| City effects | Yes | Yes | Yes | Yes |
| Time effects | Yes | Yes | Yes | Yes |
| N | 3468 | 3468 | 3468 | 3468 |
| 0.1599 | 0.0844 | 0.0894 | 0.0954 | |
Notes: Cluster standard error in parentheses. * denotes p < 0.1, ** p < 0.05, and *** p < 0.01.
Publisher’s Note: MDPI stays neutral with regard to jurisdictional claims in published maps and institutional affiliations. |
© 2022 by the authors. Licensee MDPI, Basel, Switzerland. This article is an open access article distributed under the terms and conditions of the Creative Commons Attribution (CC BY) license (https://creativecommons.org/licenses/by/4.0/).
Share and Cite
MDPI and ACS Style
Jiang, W.; Cao, K.; Jin, L.; Cheng, Y.; Xu, Q. How Do China’s Development Zones Affect Environmental Pollution under Government Domination. Sustainability 2022, 14, 3790. https://0-doi-org.brum.beds.ac.uk/10.3390/su14073790
AMA Style
Jiang W, Cao K, Jin L, Cheng Y, Xu Q. How Do China’s Development Zones Affect Environmental Pollution under Government Domination. Sustainability. 2022; 14(7):3790. https://0-doi-org.brum.beds.ac.uk/10.3390/su14073790
Chicago/Turabian StyleJiang, Weijie, Kairui Cao, Laiqun Jin, Yongyi Cheng, and Qunfang Xu. 2022. "How Do China’s Development Zones Affect Environmental Pollution under Government Domination" Sustainability 14, no. 7: 3790. https://0-doi-org.brum.beds.ac.uk/10.3390/su14073790
Note that from the first issue of 2016, this journal uses article numbers instead of page numbers. See further details here.