
Benchmarking Water Efficiency in Public School Buildings


Laboratory of Energy Efficiency in Buildings, Department of Civil Engineering, Federal University of Santa Catarina, Florianópolis 88040-900, Brazil
*
Authors to whom correspondence should be addressed.
Sustainability 2022, 14(7), 3794; https://0-doi-org.brum.beds.ac.uk/10.3390/su14073794
Submission received: 18 February 2022
/
Revised: 10 March 2022
/
Accepted: 21 March 2022
/
Published: 23 March 2022
(This article belongs to the Special Issue Sustainable Water Use)
Abstract
:The operation of buildings is significant among the human activities that withdraw water from nature, and evaluating the water efficiency of buildings is essential for sustainable development. Hence, this paper aims to assess the water efficiency in school buildings to identify benchmarks that could be used as targets in water-saving initiatives alongside highlighting which type of variable is more influential for each building. A cluster benchmarking system was developed and applied to 82 public school buildings in Florianópolis, Brazil. Data were obtained from the state water supply company and both state and municipal education departments. Water consumption drivers were defined through a literature review and the language R was used for clustering the sample. Water efficiency was then evaluated using suitable indicators for occupation conditions, building rooms and spaces and water appliances. High and low-efficiency buildings were identified in the five clusters generated through the k-means algorithm. Schools with excessively low or high consumption that could be related either to the under-measurement or leaks were identified, which is useful for water network management. In conclusion, water-efficient school buildings were highlighted as benchmarks and the type of variables that should be addressed for enhancing the accuracy of water-saving initiatives were highlighted.
1. Introduction
There is a growing concern that the intensification of some human activities, such as the burning of fossil fuels and deforestation, strongly affect environmental conditions on Earth [1]. Population growth, pollution of water sources, urban sprawl, agricultural irrigation, climate change and droughts are factors that contribute to the imbalance between water availability and demand [2]. In this scenario, the availability of water is among the natural resources facing alarming prospects. The trend of intense urbanisation and population growth may be as relevant to the tension over water availability as climate changes [2,3]. Human-induced climate change impacts the hydrological cycle and therefore water availability [4], and great urban growth is expected worldwide, which will be accompanied by an increase in the demand for water [5].
Buildings contribute to water consumption in a significant way. Out of the total water withdrawn from nature, the amount consumed in buildings could range from 25 to 33% in developing and developed countries [6,7]. To find data that support solutions for the imbalance between the use of water resources and development, several strategies have been presented in engineering and environmental sciences. Among them, benchmarking is a methodology that can be used to compare similar processes of a given activity to highlight the one with the best performance [8,9].
Among buildings that could be assessed through benchmarking systems, schools were highlighted in this research. Considering the school building as an environmental system allows understanding its way of operation, identifying relationships between its components and proposing improvements. In other words, it allows modelling such a system, which allows designing policies or programmes for the rational use of water that are feasible as they consider the characteristics of the building. What can happen is that the initiative or programme to save water cannot be applied due to differences between the reference building and the one in which it is being applied. Another possibility is that the programme is applied in a building that already operates at high efficiency and does not present measurable improvements, making it appear that such a programme is not properly formulated, as the results are of little impact.
Benchmarking allows comparing the equivalent processes of a given activity to seek the one that constitutes a more advantageous performance and could present slight variations [8,10]. Although it is commonly used for comparing processes, benchmarking systems allow identifying a reference point for systematically determining how to compare it to other components. Moreover, there are mainly three types of benchmarking: one related to processes, one that deals with performance analysis and one that compares strategies [11].
Techniques for benchmarking are based on establishing an efficient border in which each element analysed occupies a relative position, making it possible to compare outputs and inputs throughout the system to verify differences. It is noteworthy that the most crucial aspect of such techniques is the selection of the efficiency measures adopted [12,13]. These efficiency measures, in the form of indicators, are what allow the benchmarking system to validate the results [12]. Therefore, benchmarking is an attempt to establish criteria that represent a certain phenomenon that occurred as desired (e.g. low water consumption in a building) to be indicators or targets for similar elements. The process is based on the following inference: if up to a certain component of the process evaluated, the results were similar to the reference then the final result will also be similar. These references of performance are called benchmarks or reference points.
The characterisation of how variables influence water consumption in buildings is essential to perform suitable benchmarking systems. It has been pointed out that many water consumption estimates for buildings consider the simple consumption index [14], which is the volume consumed by the users, and significant variables could be not considered in the process. Furthermore, a great variation in the water consumption in educational buildings has been found [9,15]. This leads to no real indicators of water consumption, which can result in inadequate water designs for buildings.
In addition to a great variation in the water consumption in school buildings, the work of Antunes and Ghisi [15] highlighted potential potable water savings up to 5431 litres per day in a school building by implementing water-saving initiatives such as rainwater harvesting. However, the challenge is how to choose in which building such initiatives should be implemented. Performing water consumption benchmarking could reveal buildings that need this kind of improvement.
Considering this context of water availability and buildings sustainability, this work presents a benchmarking system used to evaluate water consumption in a set of public school buildings in the city of Florianópolis, southern Brazil. A model for clustering benchmarking data is presented, and useful results are shown for managing such a water distribution network.
2. Materials and Methods
2.1. The Case Study of Florianópolis
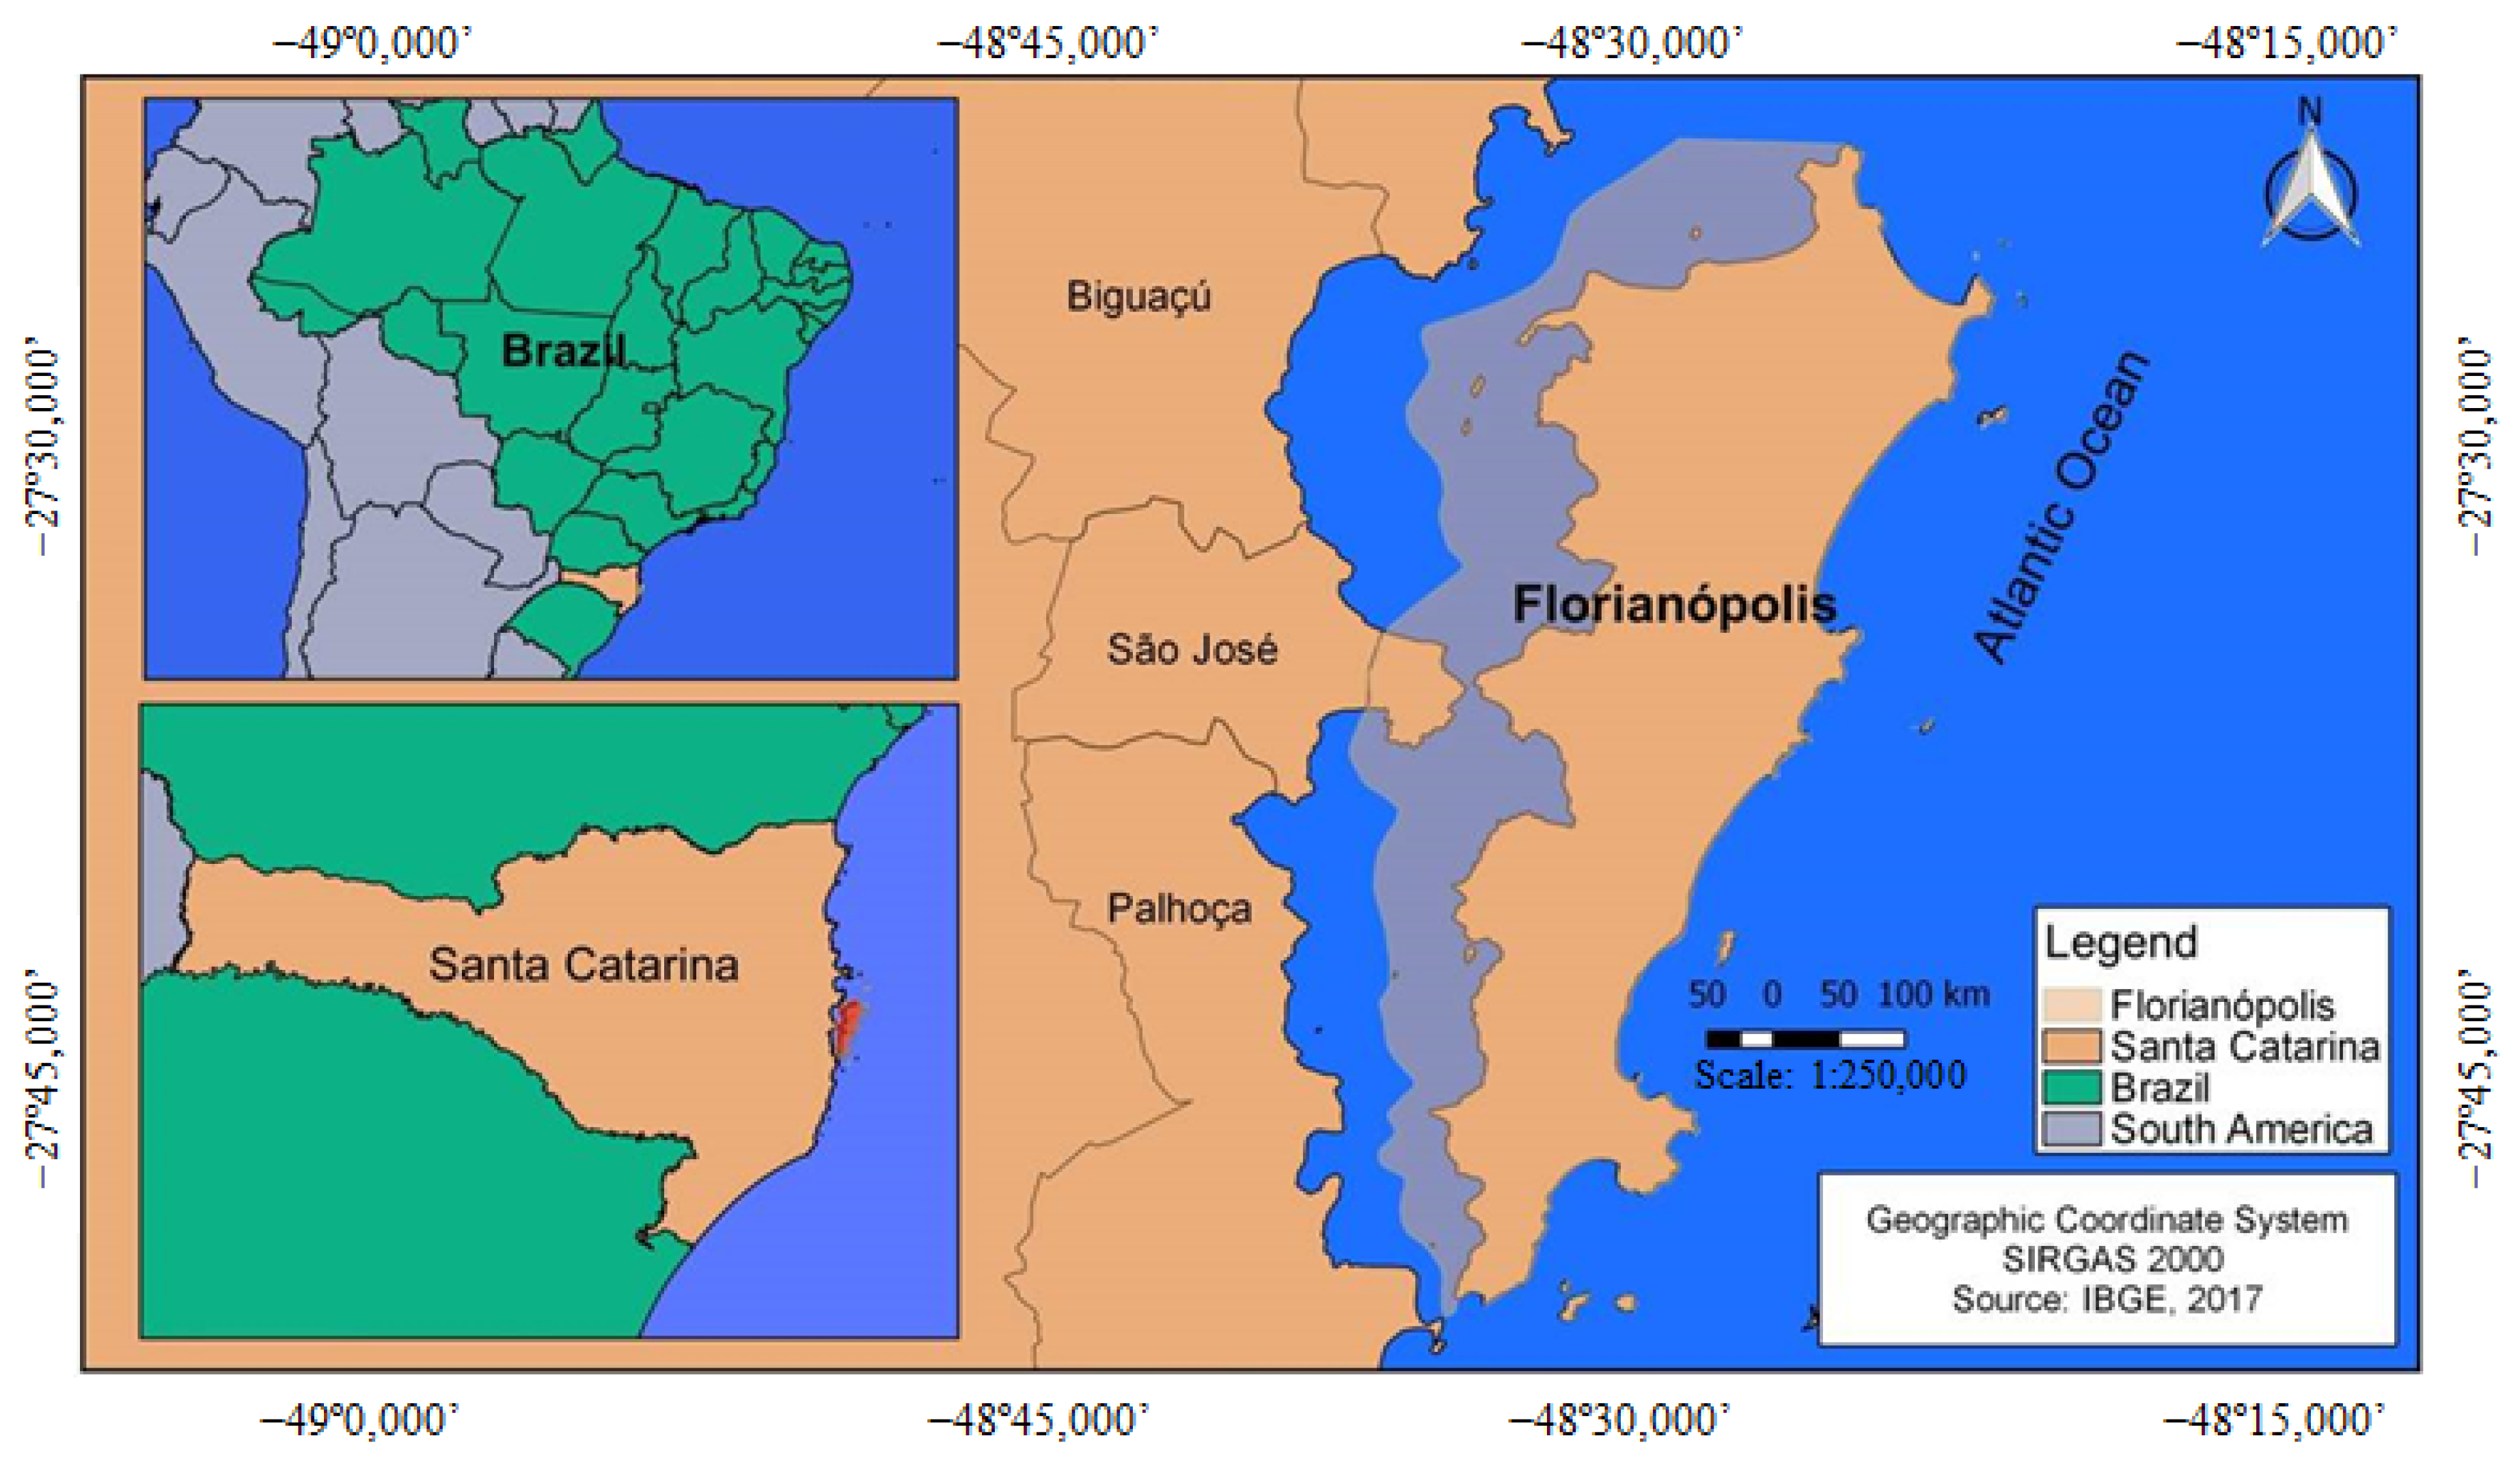
Florianópolis is the capital city of the state of Santa Catarina, southern Brazil. Florianópolis has 516,524 inhabitants [16], is located at 27°35′49″ S, 48°32′56″ W [17] and is composed of a continental portion and an island, as Figure 1 shows. A sample of public schools was investigated to understand how water consumption occurs according to their constructive characteristics as well as their regular occupation status and which school buildings present higher degrees of efficiency.
When compared to other cities in Brazil, Florianópolis is well positioned in terms of employment and income, ranking 11 out of the 5570 Brazilian municipalities [16]. The island region is, in fact, less dense than the mainland. However, the central and northern regions contain areas with a population density similar to that found on the mainland. Other cities compose the metropolitan region, such as São José, Biguaçu and Palhoça.
The sample was composed of elementary, middle and high schools, as well as daycare centres. The majority of buildings investigated were single storey but buildings with up to five storeys were found.
2.2. Definition of Variables and Clustering Analysis
Several phases were carried out to benchmark the water efficiency in public school buildings in Florianópolis. In a first step, data were collected from schools in three paths: online survey, questionnaires and water consumption in the local water distribution state company. The average monthly water consumption for each school was calculated from the monthly measurement data carried out by the state water company, which were made available for this investigation.
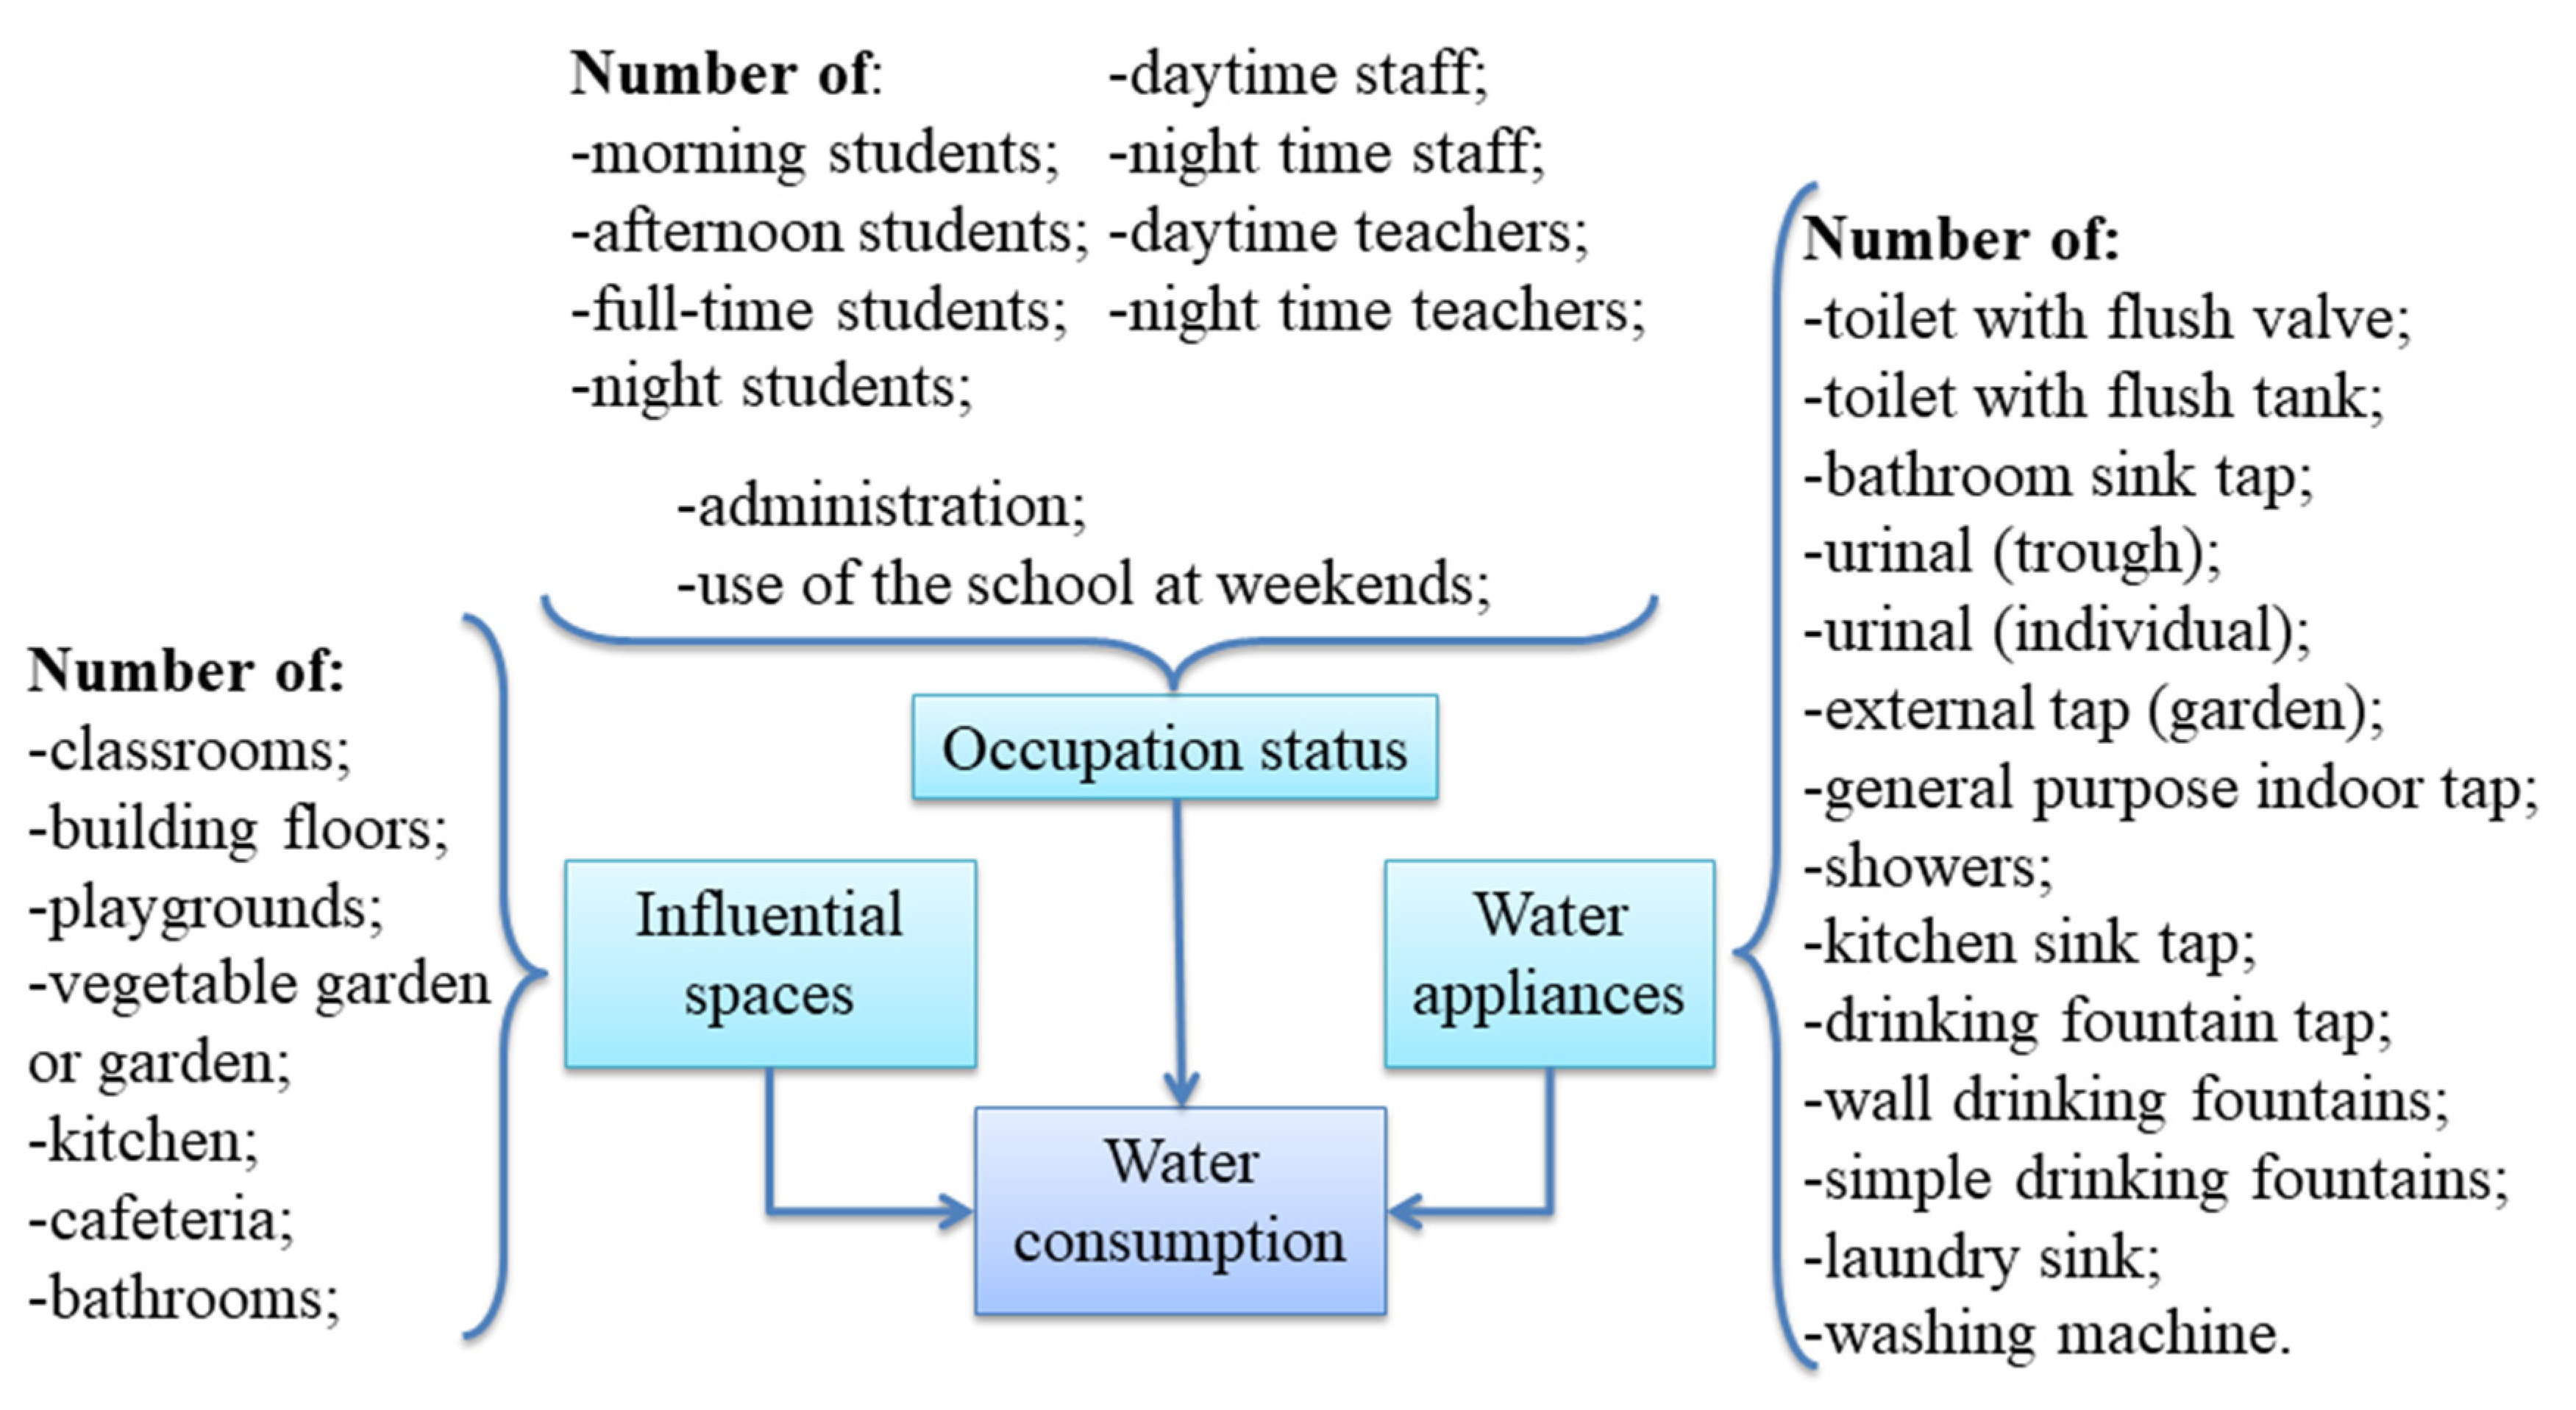
In the online survey and questionnaires, three sets of variables were used to collect and organise data: buildings rooms and spaces, occupation conditions (status) and the number of water appliances. In the category of variables related to rooms and spaces of buildings variables such as the number of classrooms, the number of sports courts and the existence of a vegetable garden that has the necessity of regular watering were addressed. The occupation conditions included the number of students and the number of teachers and staff. The water appliances category considered the existence or the number of types of devices that consume water in a building. Each school building was identified through a number code in the benchmarking system.
Then, a cluster analysis was performed in the R language to isolate clusters internally similar. Using “FactoMineR”, “factoextra” and “cluster” packages [18] the data were normalised, organised and clustering functions were used to find the optimal number of clusters for the sample and clusters configuration. This stage took into account 31 variables related to water consumption in buildings that were defined through a literature review.
Influential variables for water consumption in buildings were addressed by Dias et al. [19]. Using a statistical model, this study found that water consumption increases with the age of the building and its distance to the city centre. Both size and occupation variables strongly influence water consumption. According to these findings, variables related to buildings rooms and spaces and occupational conditions were included in the model for assessing water consumption presented in this paper.
Considering residential buildings, Garcia et al. [20] identified drivers for water consumption in 108 single-family households using questionnaires. Variables investigated include socioeconomic and demographic characteristics, construction data, water appliances and water-use habits. The total number of variables investigated was 57. Construction data included the number of bathrooms, the building age and the built area of the city as variables. Statistically significant variables were highlighted to be addressed in water-saving initiatives [20].
The study of water consumption drivers in buildings can vary from the type of building evaluated. According to Ywashima [21], the non-rational use of water can be often detected in schools as the user is not responsible for paying the water bill. In that sense, determinant variables for water consumption in school buildings were investigated by Pedroso [14]. In monitoring the water consumption in 13 school buildings, models were developed through multiple regression techniques and the results showed the main contributor variables for water consumption. At kindergarten school buildings, daily maximum local temperature, the impervious area of buildings and the number of toilets with flushing valves were highlighted as the main contributors to water consumption. As for the basic school buildings, the main contributors were the daily maximum temperature, the total permeable areas and the number of classrooms [14].
Considering variables investigated in the literature to either perform water benchmarking or identify main drivers for water use in buildings, variables to be investigated in the benchmarking system presented in this paper were defined. Such variables are shown in Figure 2.
Each variable was presented either as a categorical or non-categorical variable, i.e. responses could be yes or no (use of building at weekend) or the quantity of each item (number of students). The categorical variables were converted to binary 0–1 form to compose the dataset used in the R language. Administration refers to whether the school is administrated by the municipality of Florianópolis or by the government of the state of Santa Catarina. This variable was also converted into a binary number form.
In the clustering analysis, a hierarchical method was used through the method of Ward to generate a dendrogram as an exploratory step in the R language. Then, the within-sum of squares method (elbow method) was used to determine the optimal number of clusters to be used in the k-means algorithm. This method indicates the optimal number of clusters for a sample according to the variables involved [22]. Then, an optimal number of clusters suitable to the nonhierarchical method of the k-means was generated to support the developed method.
A benchmarking system was developed to compare water consumption between buildings in each cluster considering the sets of variables defined previously. First, buildings in each cluster were sorted using both monthly water consumption (m3) and daily per capita water consumption (L), which allowed us to rank water consumption for each cluster, which was the first stage of the benchmarking system.
The information on water consumption in a month or by a user may not be enough to evaluate water efficiency in a building. To properly compare such information, indicators were developed according to how well water is consumed considering the influential spaces for water consumption existing in the buildings, the water appliances available and the population that use such buildings daily. Such indicators not only compose the general consumption indicator, which is the main indicator, but also indicate which type of variable can be more responsible for water efficiency level in each building, whether it is low and efficient or high and optimisable.
2.3. Indicators for Evaluating Water Consumption
The sets of variables obtained in the previous stage were used to generate three indicators, which composed the general consumption indicator, which shows the water efficiency. The first one was the indicator of water consumption per school regular population (ICP). To compose such an indicator the daily per capita water consumption was calculated. When converting the average monthly consumption from cubic metres to litres and considering the school days per month, the daily per capita consumption was calculated using Equation (1).
where:
- Cdpc is the daily per capita water consumption (L);
- Cmm is the average monthly water consumption (m3);
- P is the number of users that compose the school regular population;
- dL is the average number of school days in a month.
The calculation of daily per capita water consumption using school days was necessary to evenly compare the per capita water consumption with other indicators to compose the general water consumption efficiency. Although there is an influence of users’ ages on water consumption, as shown in the work of Dias et al. [19] and Garcia et al. [20], the difference of age among students, teachers and staff was not considered in this evaluation.
The indicator of water consumption per school regular population (ICP) for each school building was calculated using Equation (2). The average daily consumption per capita in the cluster was divided by the daily per capita water consumption of each building to generate the decreasing indicator, which shows the best performance for that building with lower consumption related to this set of variables.
where:
- ICP is the indicator of water consumption per school regular population (non-dimensional);
- is the average daily per capita water consumption of the cluster (L);
- Cdpc is the daily per capita water consumption of the evaluated building (L).
The second indicator was developed to measure how water is consumed considering the rooms or spaces available in the building for the scholar community. These variables include influential indoor and outdoor spaces for water consumption according to the literature [19,20,23,24,25], such as playground squares or sports courts. The indicator of water consumption per influential space in the building (ICS) was necessary as not all buildings surveyed presented the same pattern in terms of these characteristics. In contrast to the population indicator that considered students, teachers and staff equivalently, in the calculation of the water consumption per influential space indicator, the quantity of each space was considered separately. First, a water consumption index (CS) for each space, was calculated. Equation (3) shows how an index for each type of building space was calculated.
where:
- CS is the consumption index for each type of building space (non-dimensional);
- CMM is the average monthly water consumption (m3);
- QS is the number of spaces of each type in the building.
The same procedure was carried out for the other influential spaces variables, as shown in Equation (4). In this study, seven variables related to influential spaces available in school buildings were investigated. The consumption per space index (CSi) was then calculated for the entire building as follows.
where:
- CSi is the consumption per space index for the entire building (non-dimensional);
- CS is the consumption index per each type of building space (non-dimensional);
- nS is the number of each type of space in the building.
The average consumption index per influential building space for water consumption of the cluster evaluated was calculated by the sum of the consumption per space index (CSi) for each building divided by the number of school buildings in each cluster, according to Equation (5).
where:
- is the consumption per space index for the entire building in the cluster (non-dimensional);
- CS is the consumption index per each type of building space (non-dimensional);
- nC is the number of school buildings in the cluster.
Afterwards, the average consumption per space index for the cluster was divided by the consumption index per each type of building space of the school analysed to generate a descending ranking. Thus, the first position in such a ranking shows the best performance for that building with the lowest consumption related to the influential spaces variables for water consumption. The indicator of water consumption per influential space in the building (ICS) was calculated using Equation (6).
where:
- ICS is the indicator of water consumption per influential space in the building (non-dimensional);
- is the average consumption per space index for the cluster (non-dimensional);
- CSi is the index of consumption per space for the evaluated building (non-dimensional).
The third indicator was related to the number of water appliances in the buildings: the indicator of consumption per water appliance (ICWA). Such an indicator took into account, in addition to the quantities of each water appliance, their corresponding design flows [26,27]. The consumption index per water appliance was calculated using Equation (7), and the quantities of water appliances in the buildings and their design flow ratios were considered.
where:
- CWA is the water consumption per water appliance (non-dimensional);
- CMM is the average monthly water consumption (m3);
- NWA is the number of each type of water appliance in the building;
- DFWA if the design flow of each water appliance (L/s).
The average water consumption index related to each water appliance was calculated using Equation (8). Such an index was calculated for each cluster.
where:
- is the average water consumption related to each water appliance (non-dimensional);
- CWA is the water consumption related to each water appliance (non-dimensional);
- nG is the number of valid observations (school buildings) in the cluster.
The indicator of consumption per water appliance (ICWA) was then calculated using Equation (9). This indicator results from the ratio between the average consumption index for water appliances in the cluster and the consumption index for water appliances for each school building.
where:
- ICWA is the indicator of consumption per water appliance in the building (non-dimensional);
- is the average water consumption related to each water appliance (non-dimensional);
- CWA is the water consumption related to each water appliance (non-dimensional).
Finally, a general water consumption indicator (IGC) was defined as the average of the three previous indicators. Equation (10) shows its calculation. With the definition of the indicator, the efficiency ranking can be defined and the benchmarks of each cluster can be highlighted.
where:
- IGC is the general consumption indicator (non-dimensional);
- ICP is the indicator of water consumption per school regular population (non-dimensional);
- ICS is the indicator of water consumption per influential space in the building (non-dimensional);
- ICWA is the indicator of consumption per water appliance in the building (non-dimensional);
- nI is the number of indicators included in the evaluation system.
In the final stage of the benchmarking system, the indicators were attributed to the sample of school buildings evaluated in each cluster. Sorting buildings using the general consumption indicator allows a deeper evaluation of the performance of the buildings than only using the rankings of water consumption that were firstly carried out.
3. Results
3.1. Cluster Analysis Results
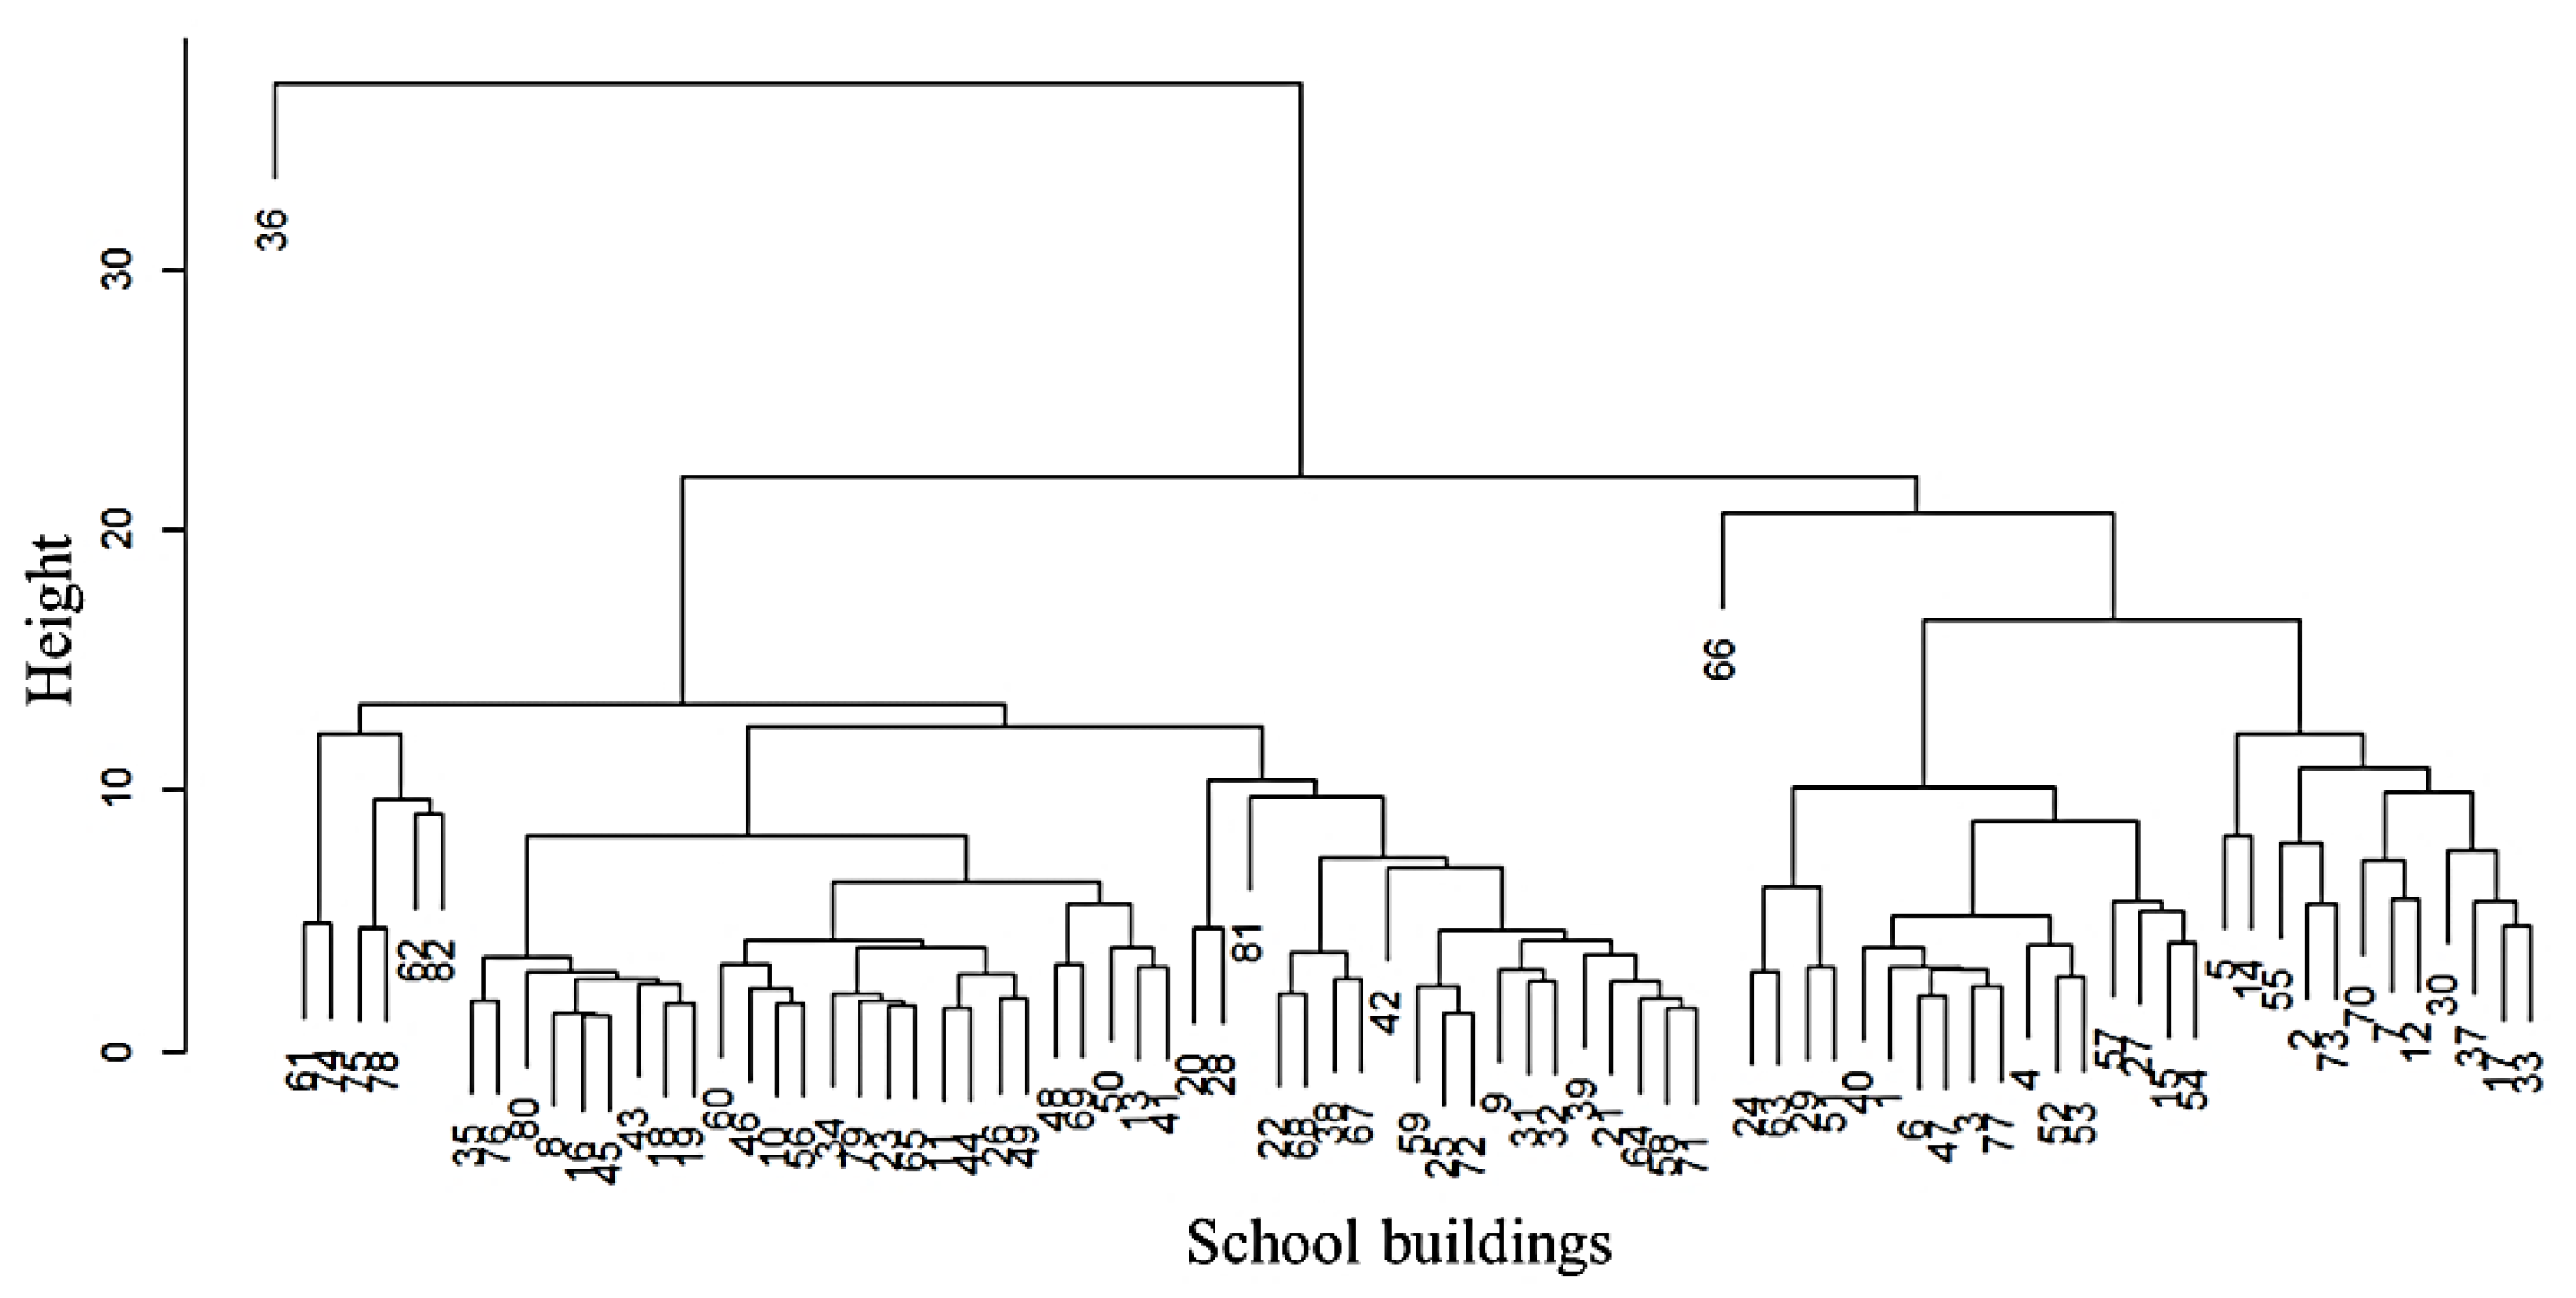
Eighty-two valid observations (school buildings) were obtained and composed the sample, which underwent exploratory analysis. Firstly, the information was organised into a suitable and scaled dataset, and each school building was represented through an identification code. The dendrogram of clusters was carried out using hclust() function in R language through the hierarchical method of Ward and the result is shown in Figure 3. At this stage, the research was exploratory and was looking for an approximate number of clusters to be used in the clustering by a non-hierarchical method.
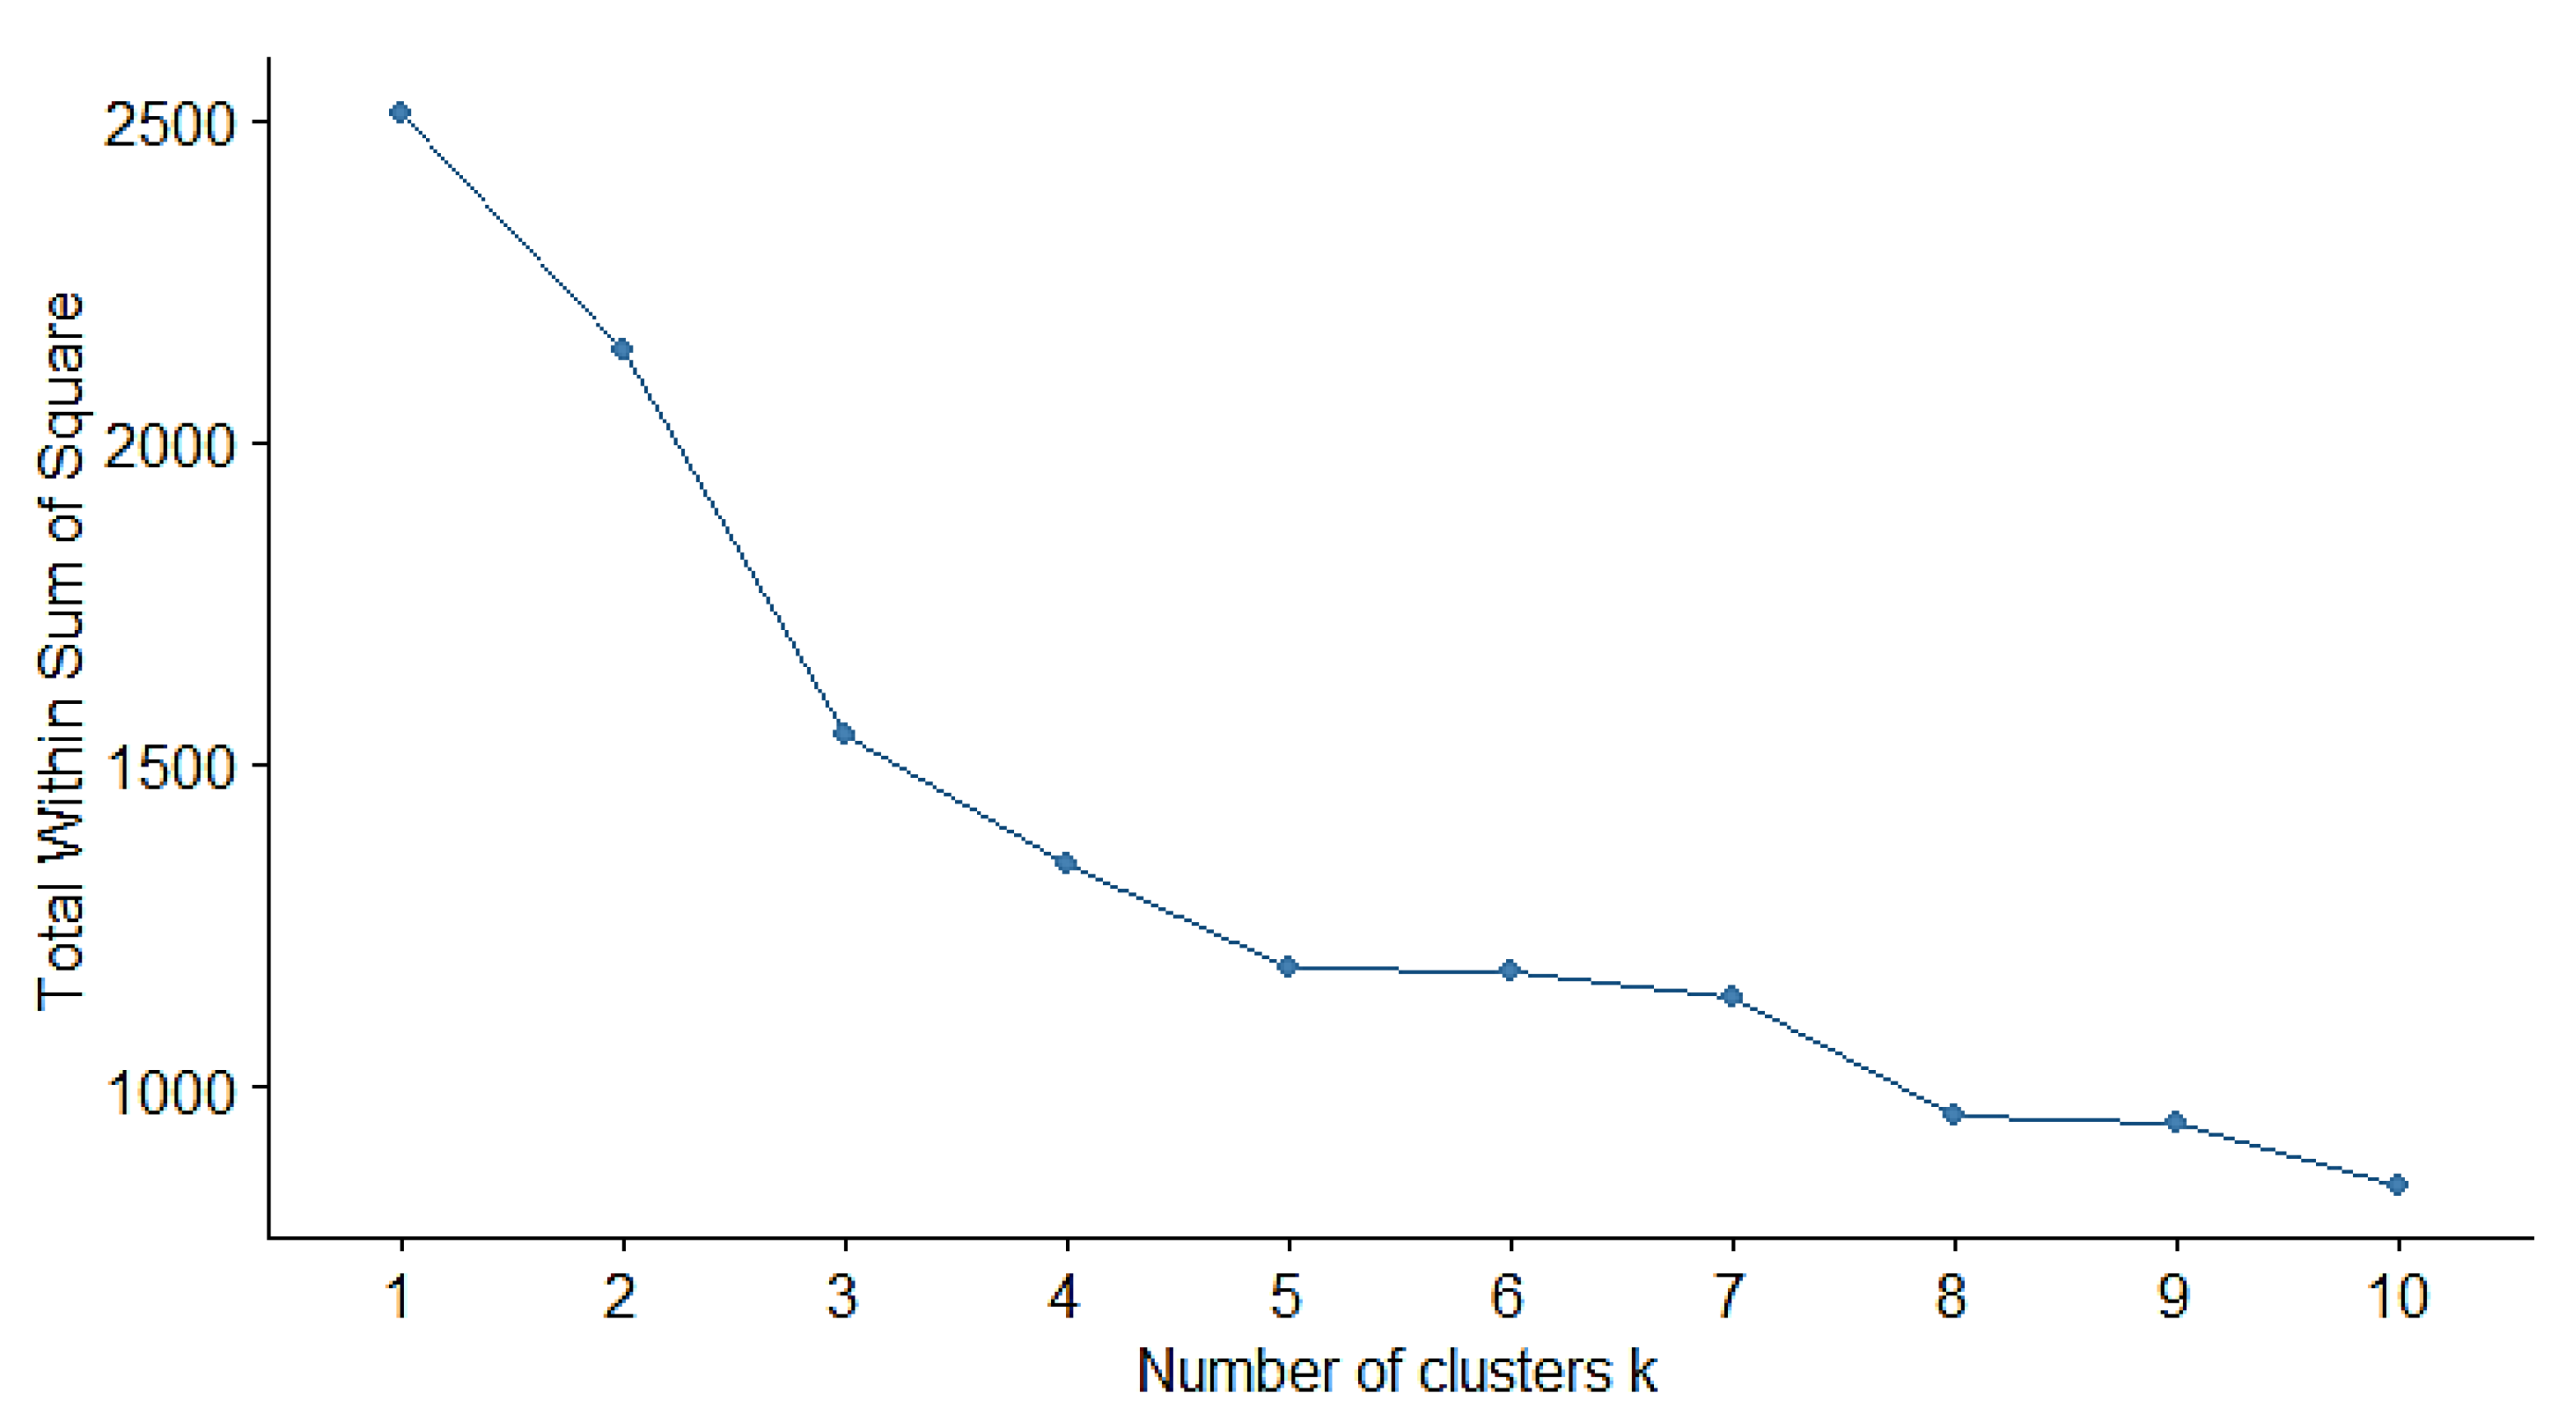
Notably, buildings 36 and 66 were sufficiently different from the others to constitute their clusters in isolation. However, a visual analysis is not enough to determine the number of clusters and has to be aided with other statistical procedures. Aiming at the clustering through a non-hierarchical method with the k-means algorithm, the result of the elbow method, shown in Figure 4, indicates three, five and eight clusters. According to the elbow method, this indication can be seen when there are slight smoothing regions in the descending curve.
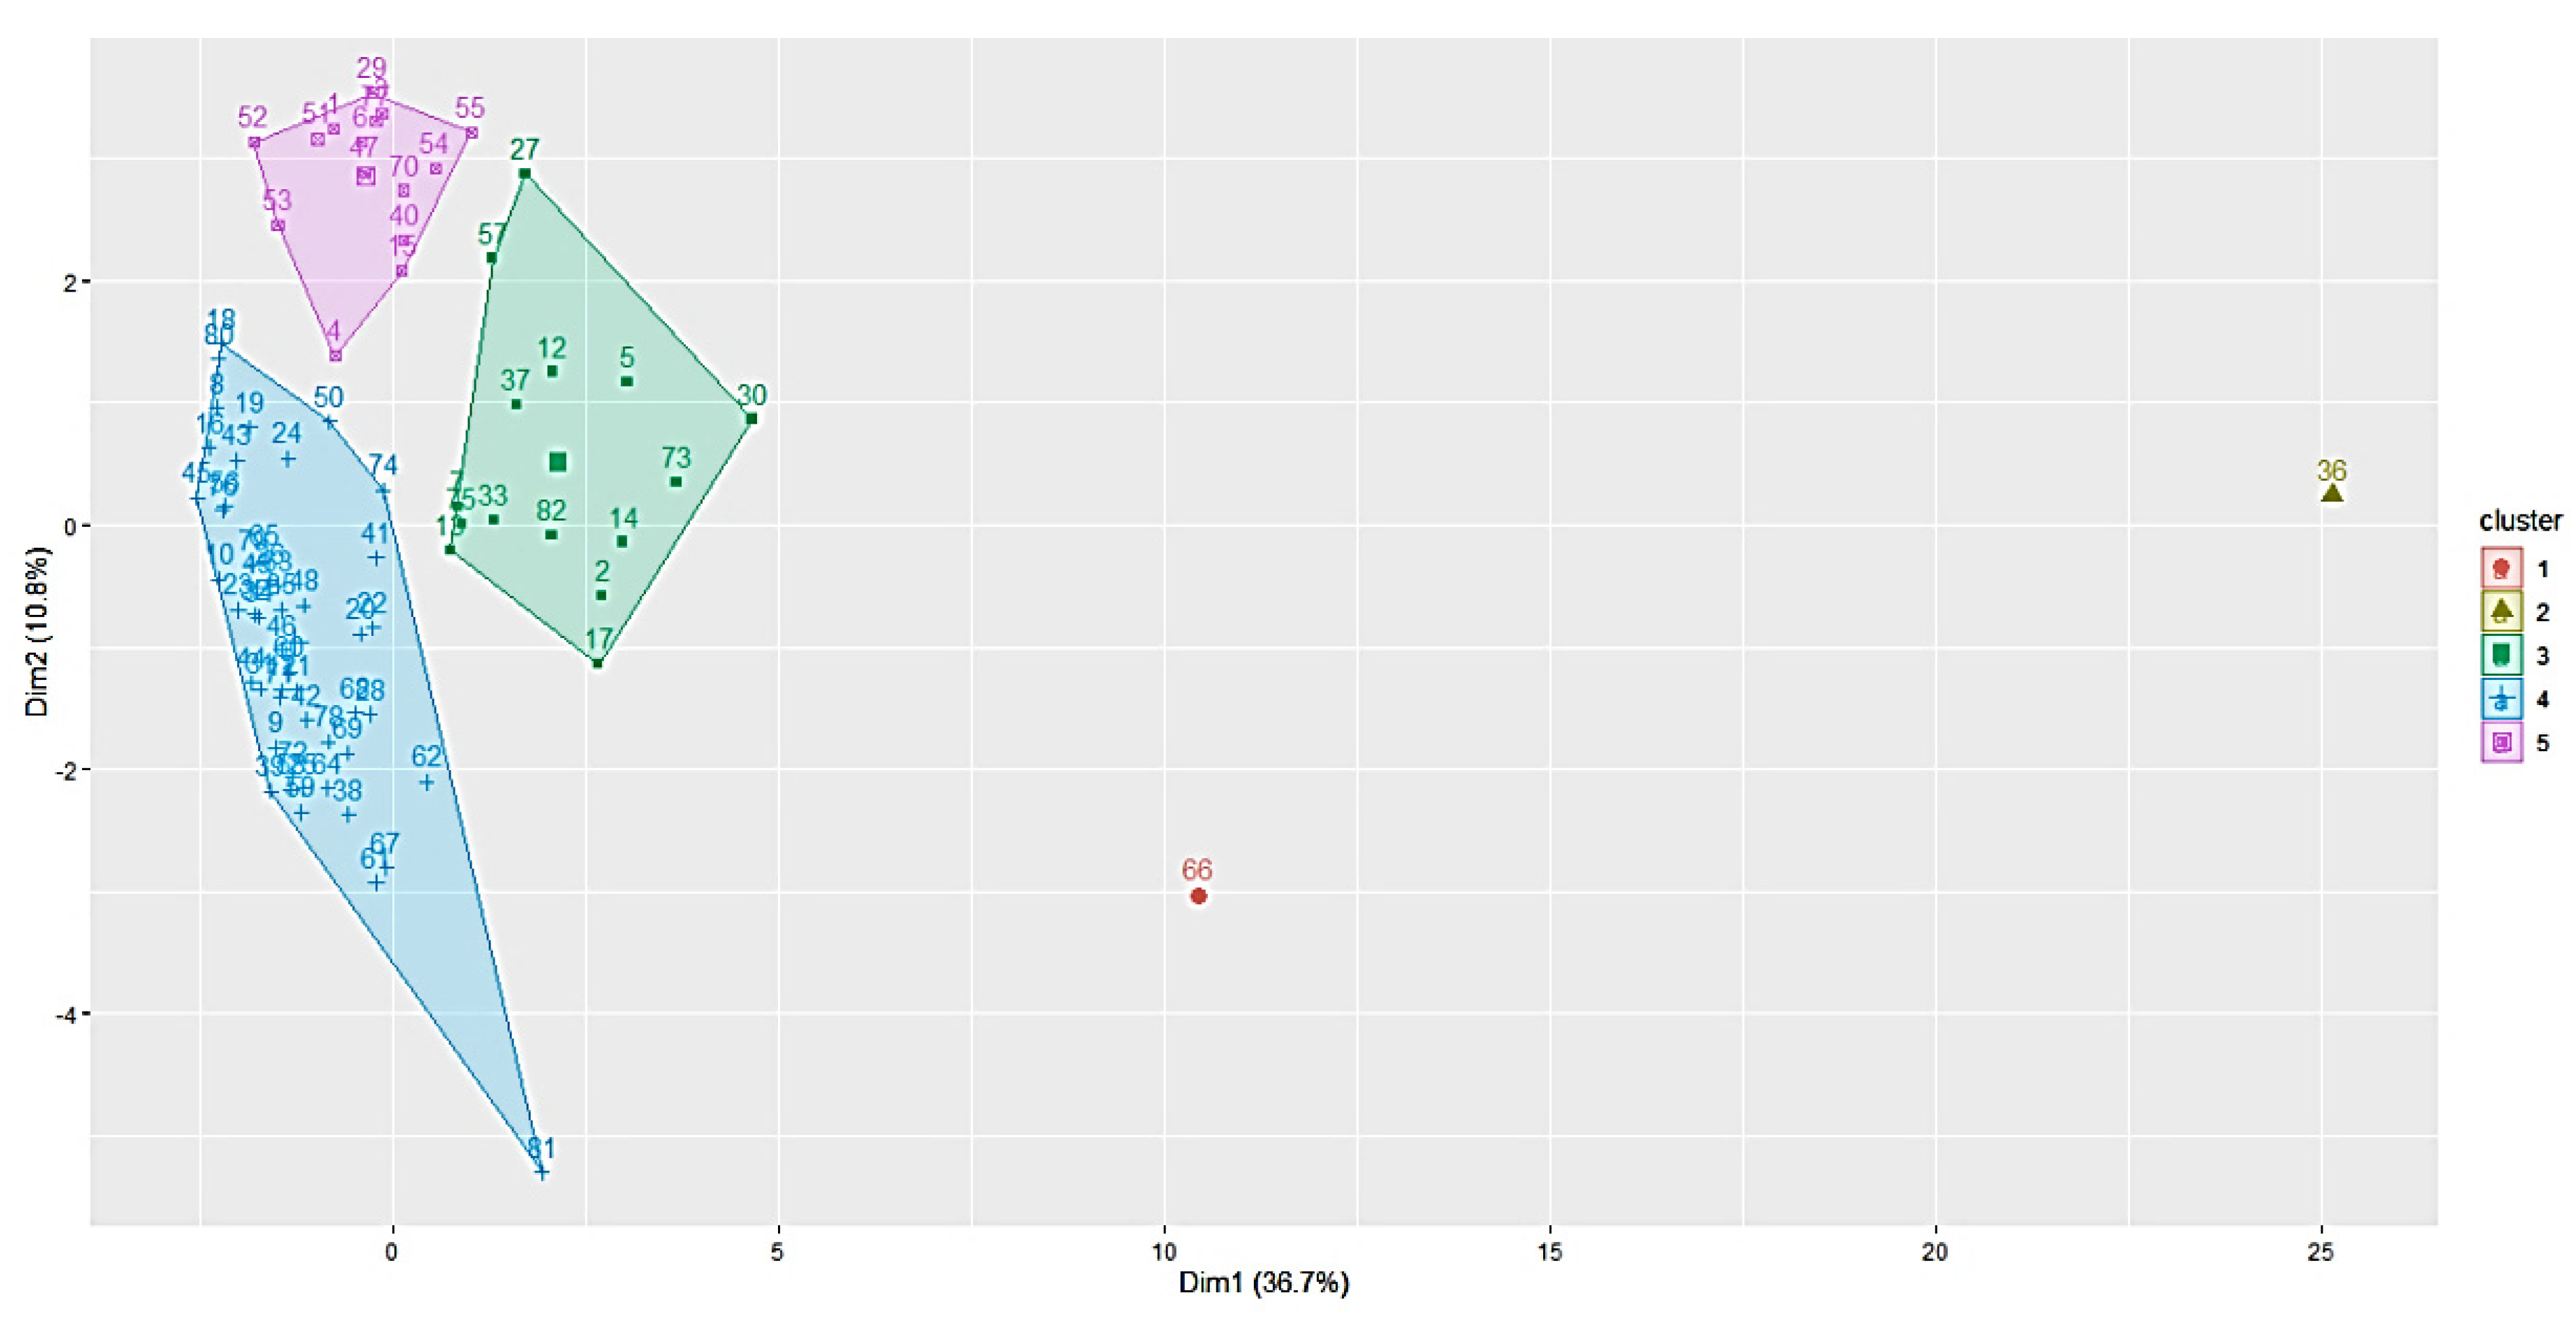
The number of clusters was defined to be used in the method of the k-means based on the visual analysis of the dendrogram shown in Figure 3. One can see 3 clusters, in addition to school buildings 36 and 66, at a linkage distance equal to 15 by Ward’s method. The formation of five clusters allows in-depth analysis in the benchmarking system following steps. With the clusters formed by buildings 36 and 66, five clusters were generated in total. The results of the k-means algorithm with five clusters are shown in Figure 5.
Figure 5 shows that clusters G1 and G2 contain only one school each and are identified by the colours orange and yellow, respectively (buildings 36 and 66). Cluster G4 is identified by the colour blue and contains 50 schools. Clusters G3 and G5 contain 15 schools each and are identified by the colours green and magenta, respectively.
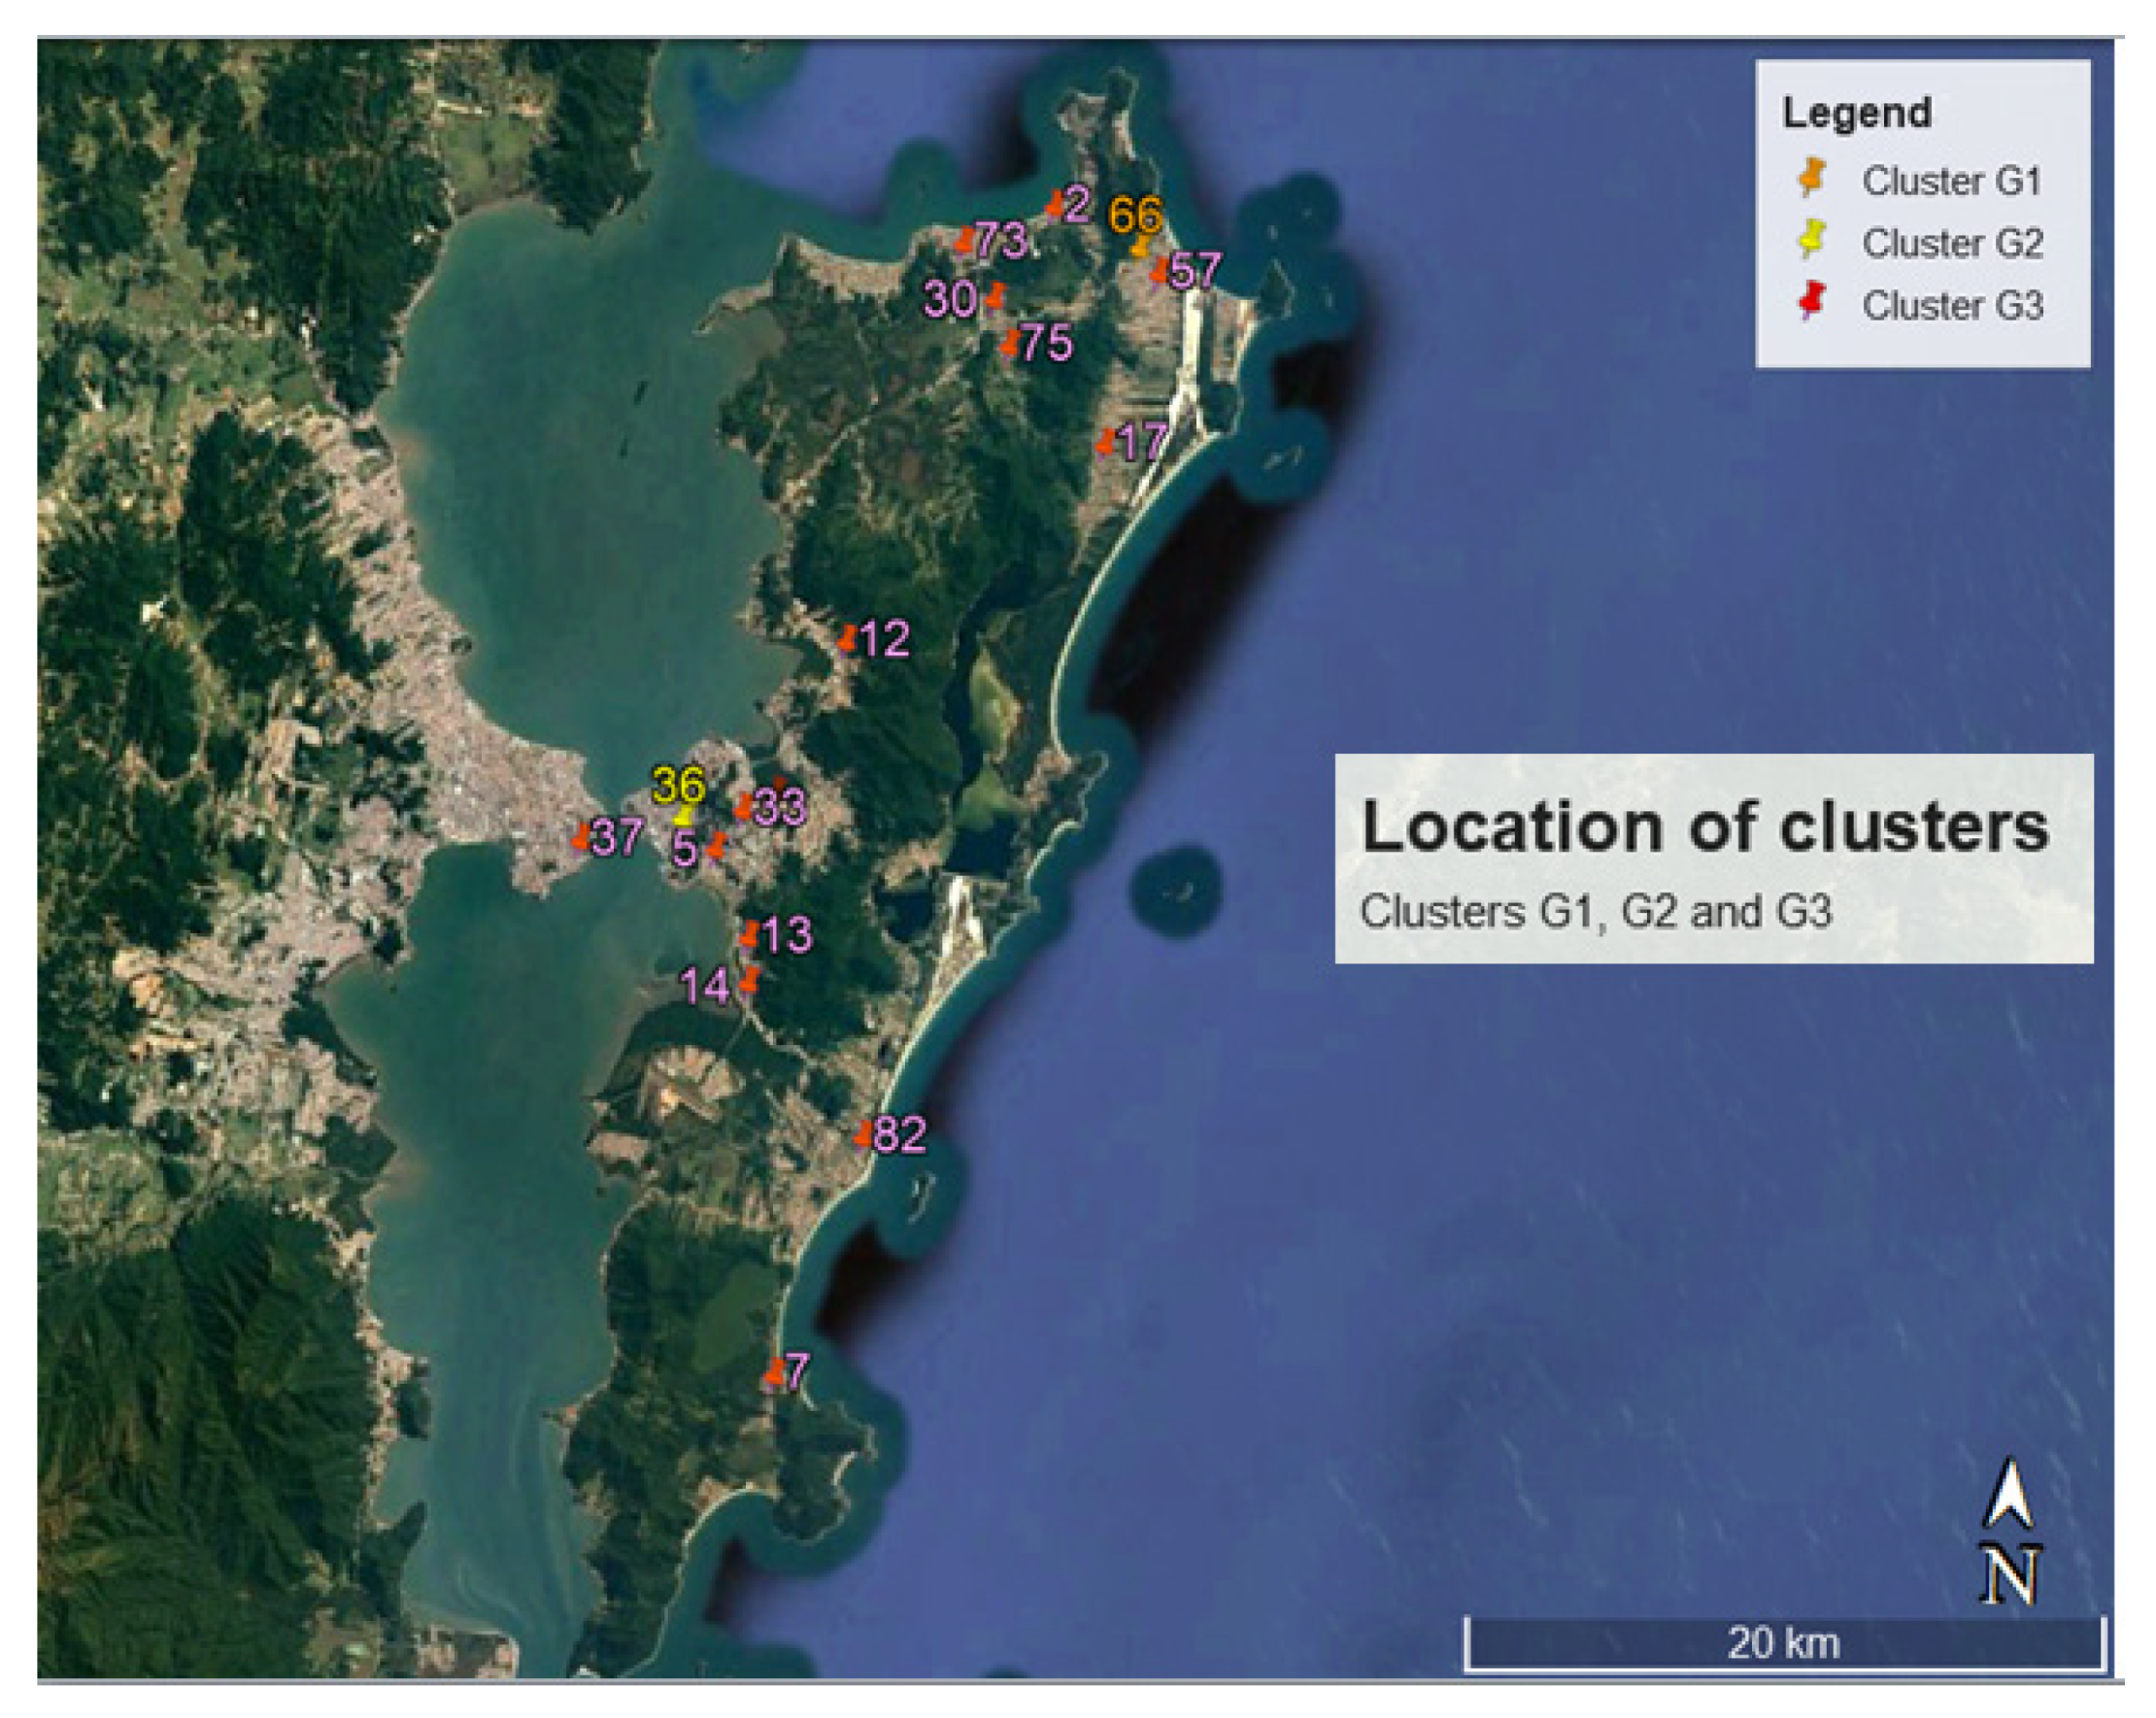
As clusters G1 and G2 are composed of one building each, the geographic location of school buildings in clusters G1, G2 and G3 are shown all together in Figure 6. Cluster G3 presents only one school building in the continental region of Florianópolis.
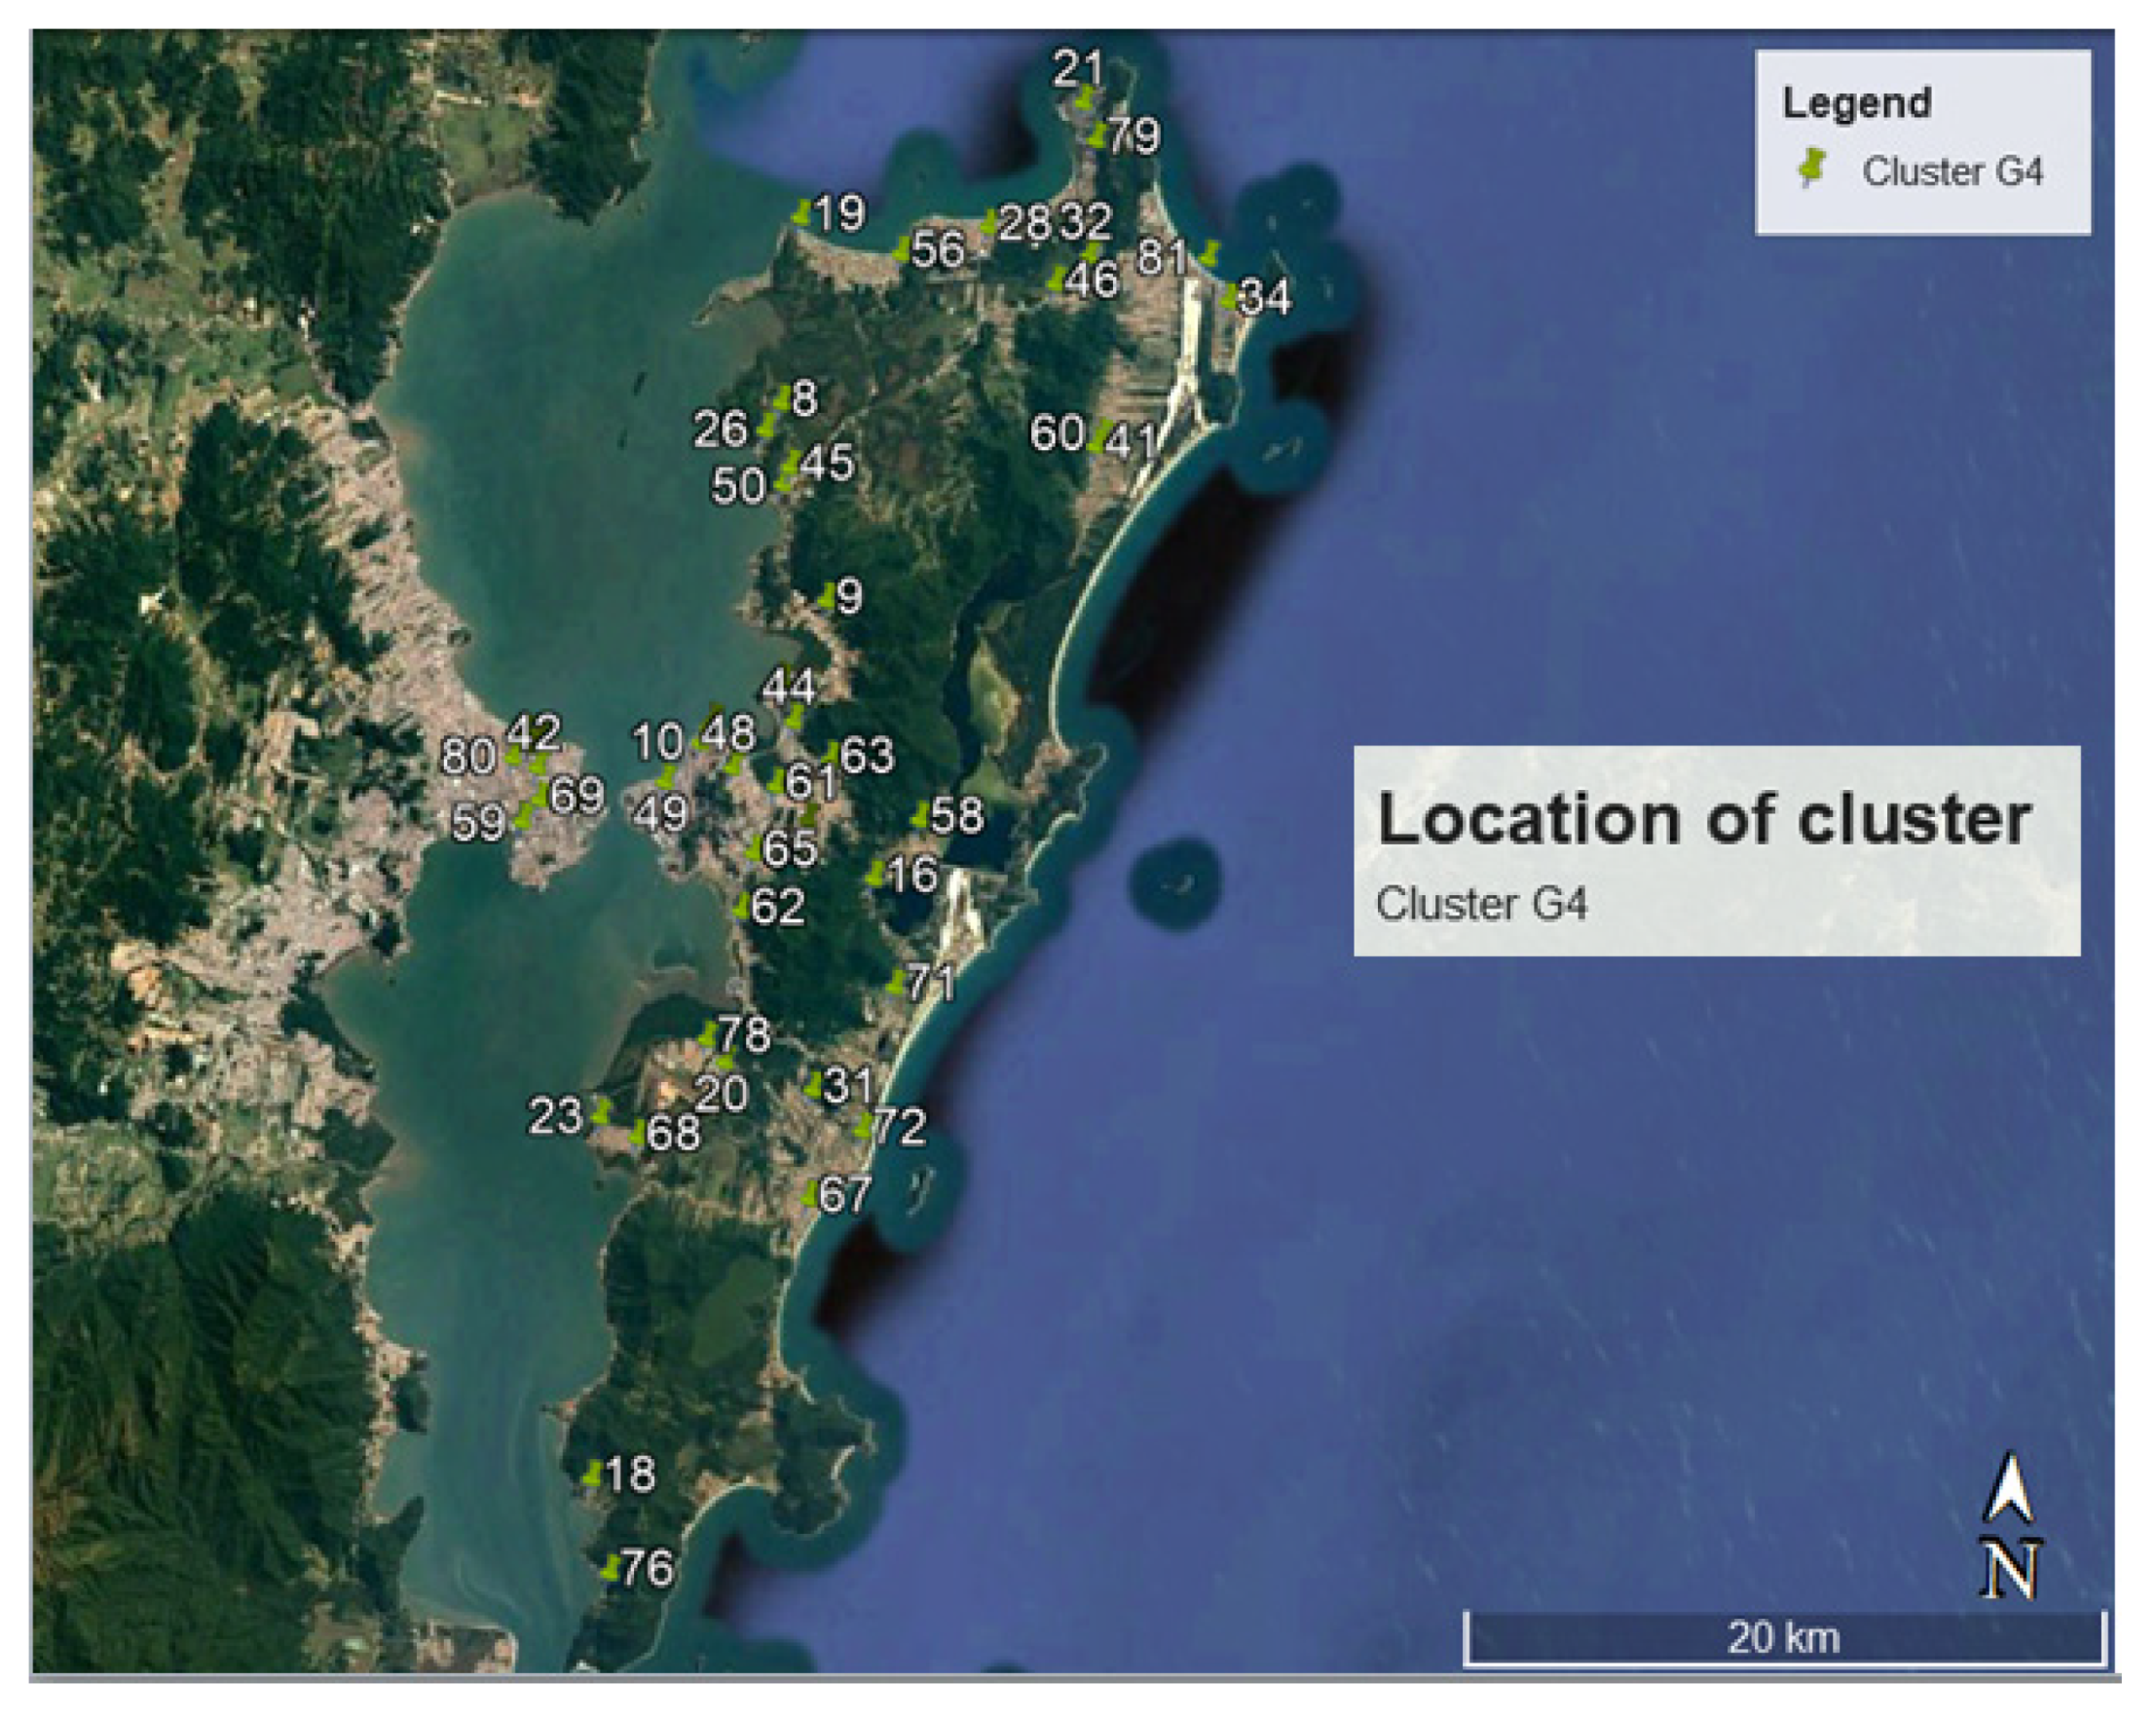
Cluster G4, with a greater number of buildings, has representative buildings in continental and island regions of the municipality. Such a cluster includes 50 school buildings which are shown in Figure 7.
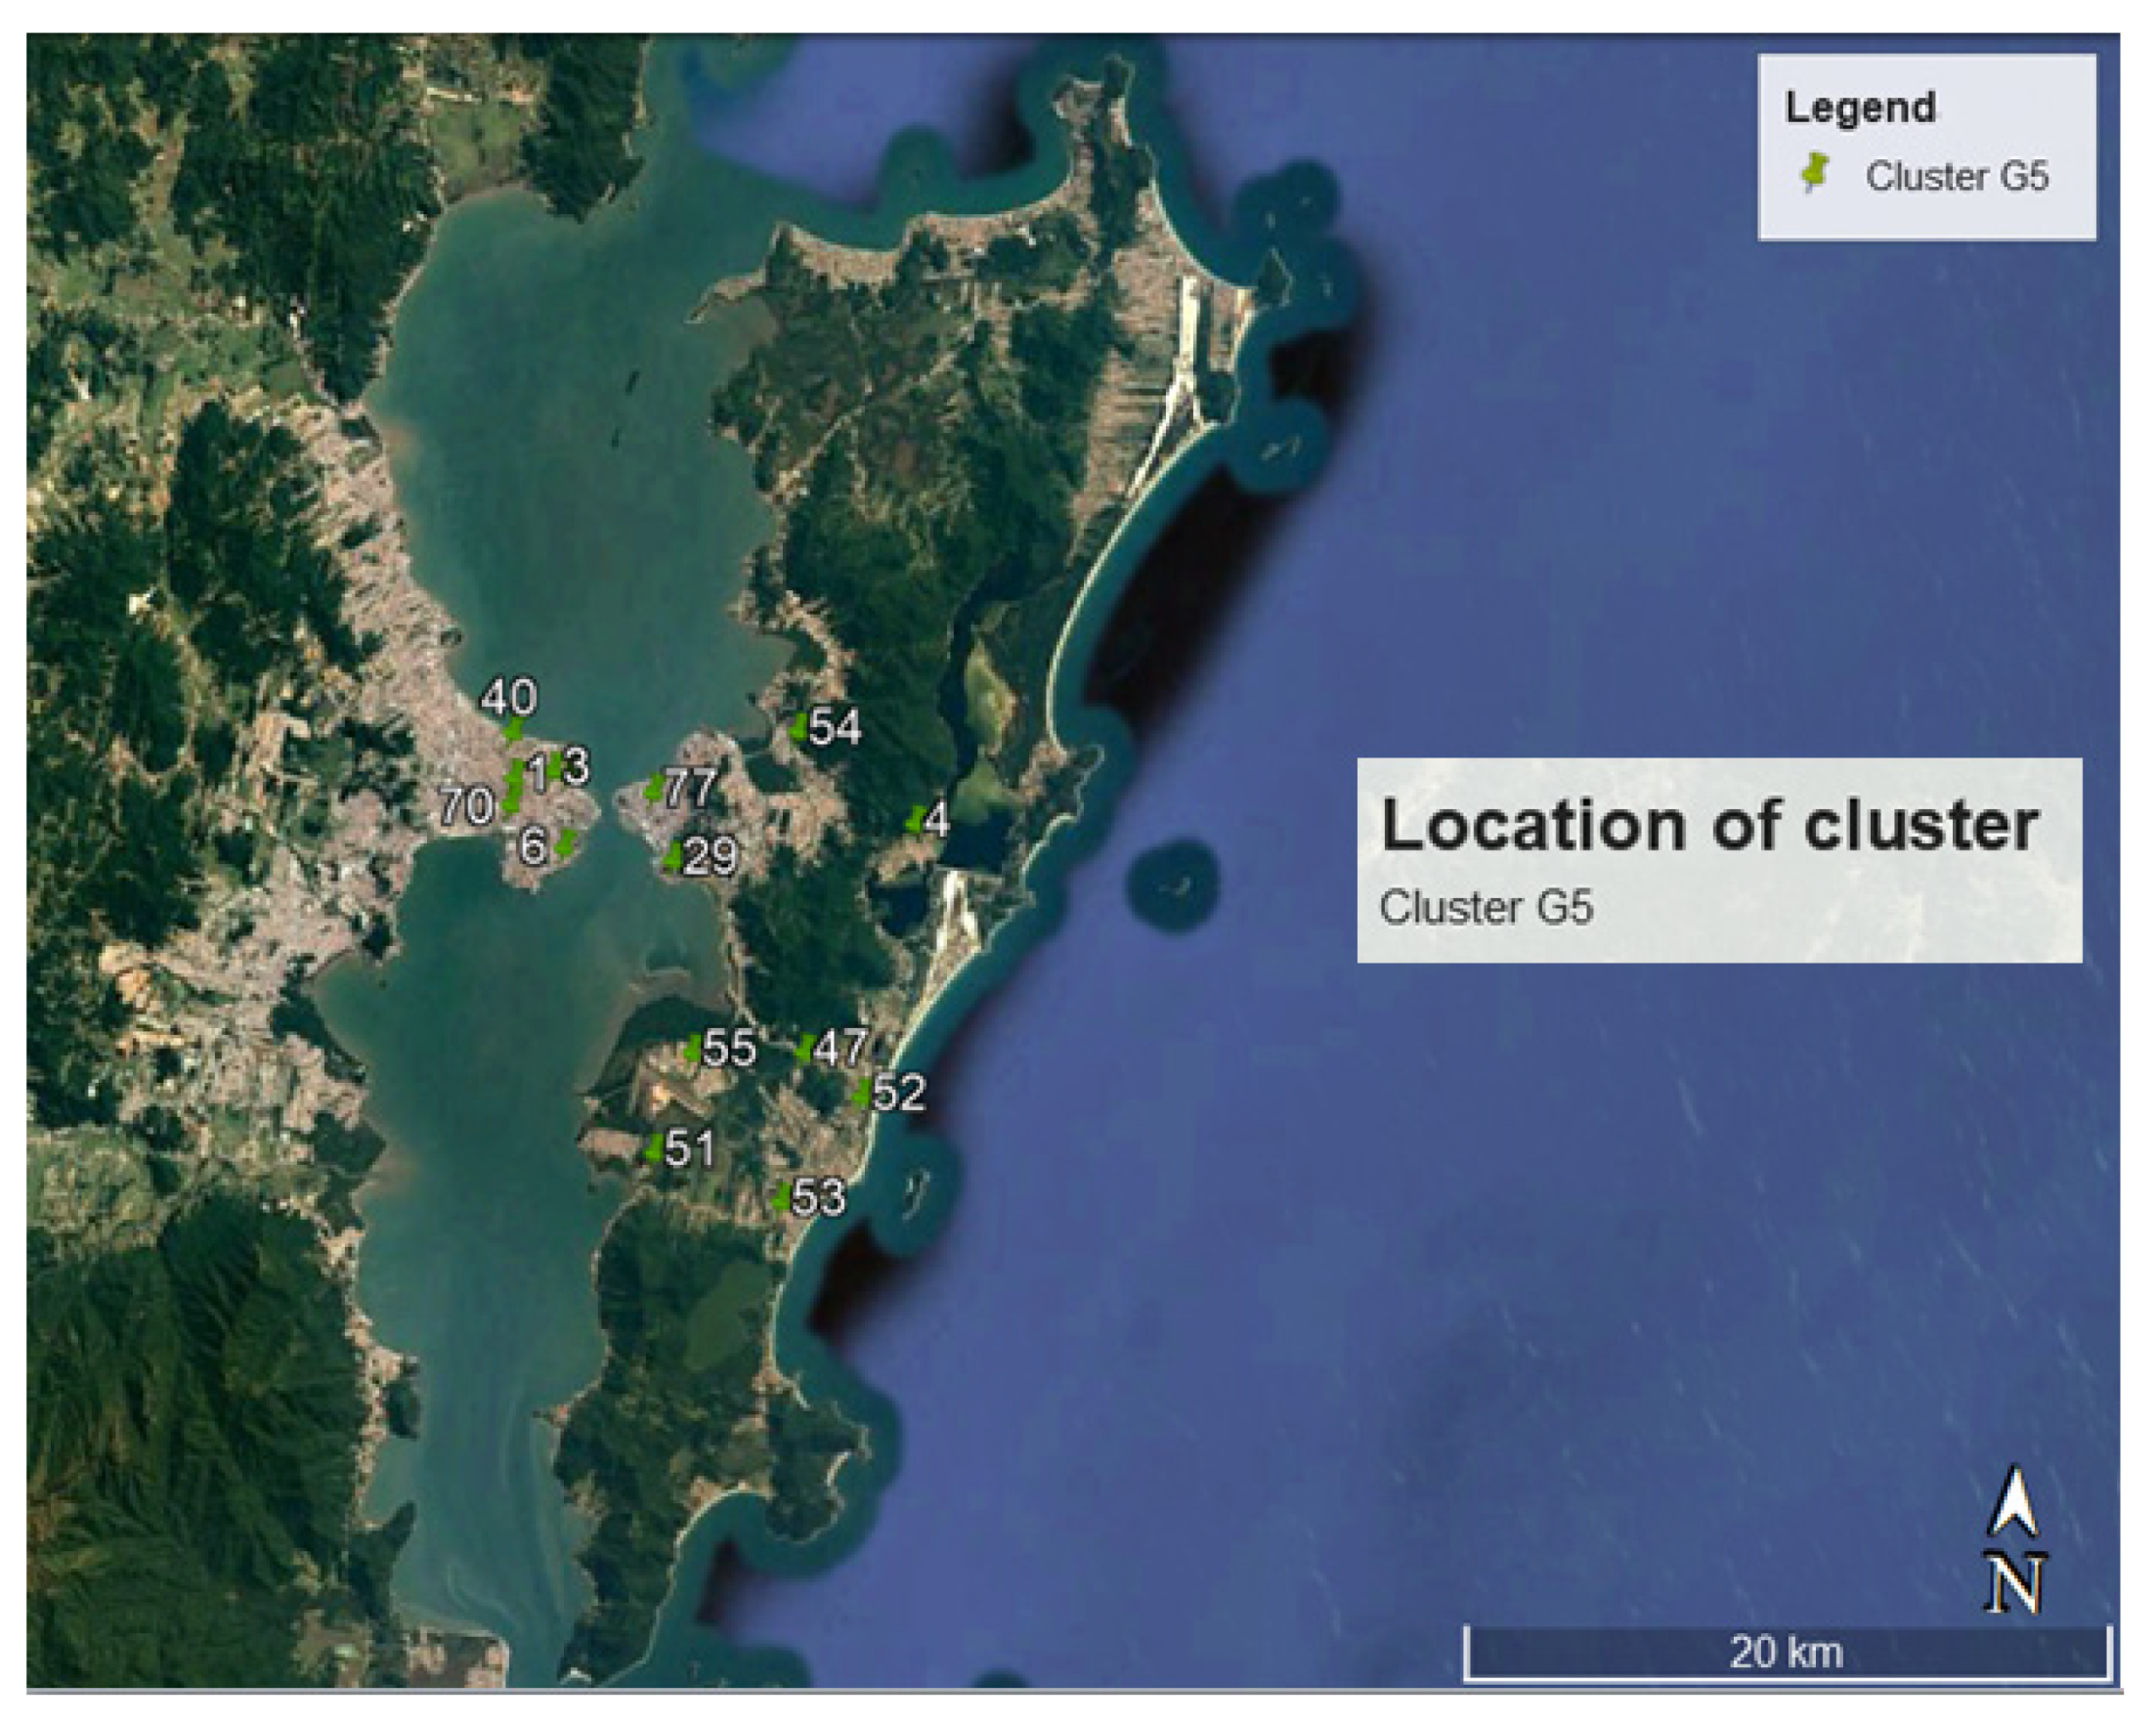
Cluster G5 has no representatives in the northern island region of the city and includes 15 school buildings distributed in the central portion of the island regions and continental region. Figure 8 shows the geographical distribution of school buildings in cluster G5.
With clusters defined and buildings geographically located was possible to benchmark the water consumption as similar buildings were clustered together and could then be properly compared. These results concluded the first step of the evaluation: a cluster analysis.
3.2. Benchmarking Water Consumption
In the evaluation system presented in this paper, benchmarking is the comparative assessment of how water is consumed in the school buildings that belong to the same cluster. This stage aims to find the best performance under similar conditions. Finding benchmarks means finding the most efficient buildings in terms of water consumption for each cluster. Thus, from finding the school building with the highest performance, it is possible to evaluate the other buildings in the same cluster.
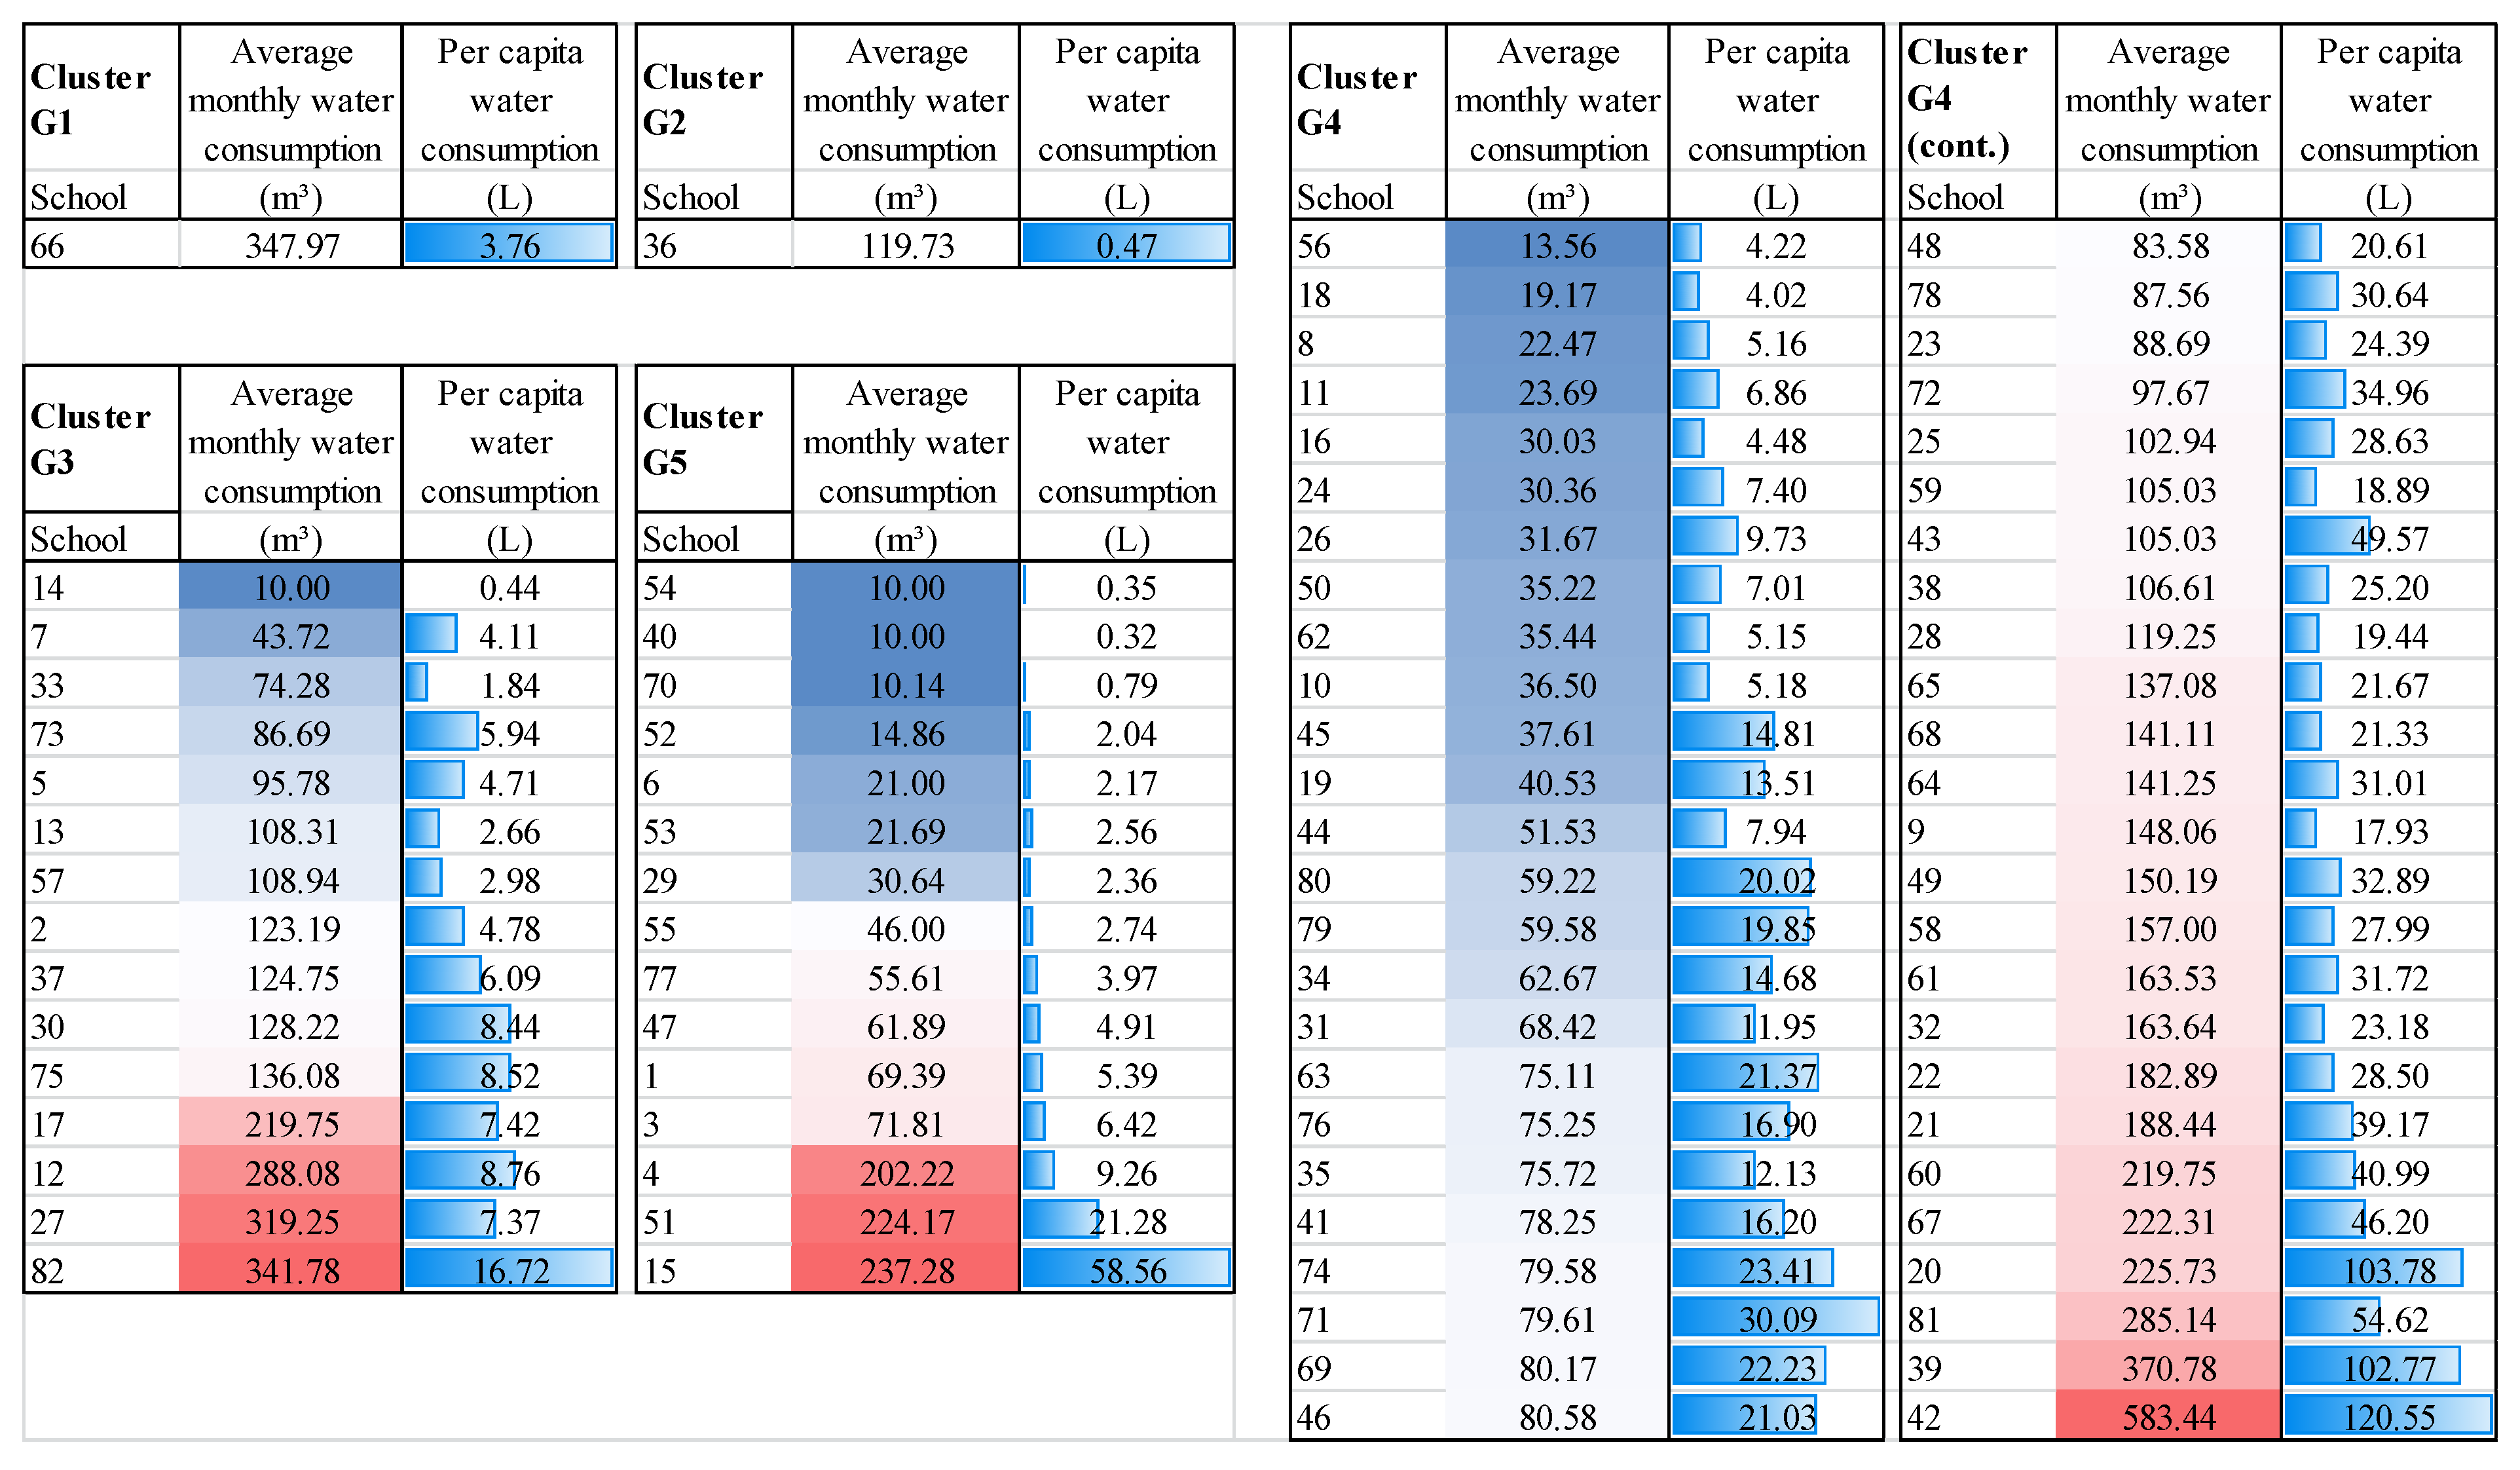
The first information extracted and analysed was water consumption, either the average monthly volume consumed in each building or the daily per capita water consumption. Figure 9 shows the rankings of water consumption within the clusters with the code numbers of each school building. Gradients from blue to red vary between school buildings with the lowest and highest monthly water consumption and the blue horizontal bars indicate the daily per capita water consumption. The cluster G4 is presented split into two.
Water consumption rankings are a valuable starting point to understand how the sample behaves in terms of this variable. However, it is not possible to simply assign the school building with the lowest water consumption as the benchmark for each cluster. This would not be enough for evaluating how water is being used and deeper indicators are necessary.
For deeper assessing the performance of each building in its cluster, it is not enough to evaluate the monthly water consumption or the daily per capita water consumption of the buildings. Although these data are essential for the benchmarking system, they cannot explain the entire phenomenon. Therefore, buildings were classified concerning three indicators: the indicator of water consumption per school regular population (ICP); the indicator of water consumption per influential space in the building (ICS); the indicator of consumption per water appliances in the building (ICWA). These three indicators are related to the three categories of variables detailed at the beginning of the method section and were used to generate the general consumption indicator (IGC) of the school buildings.
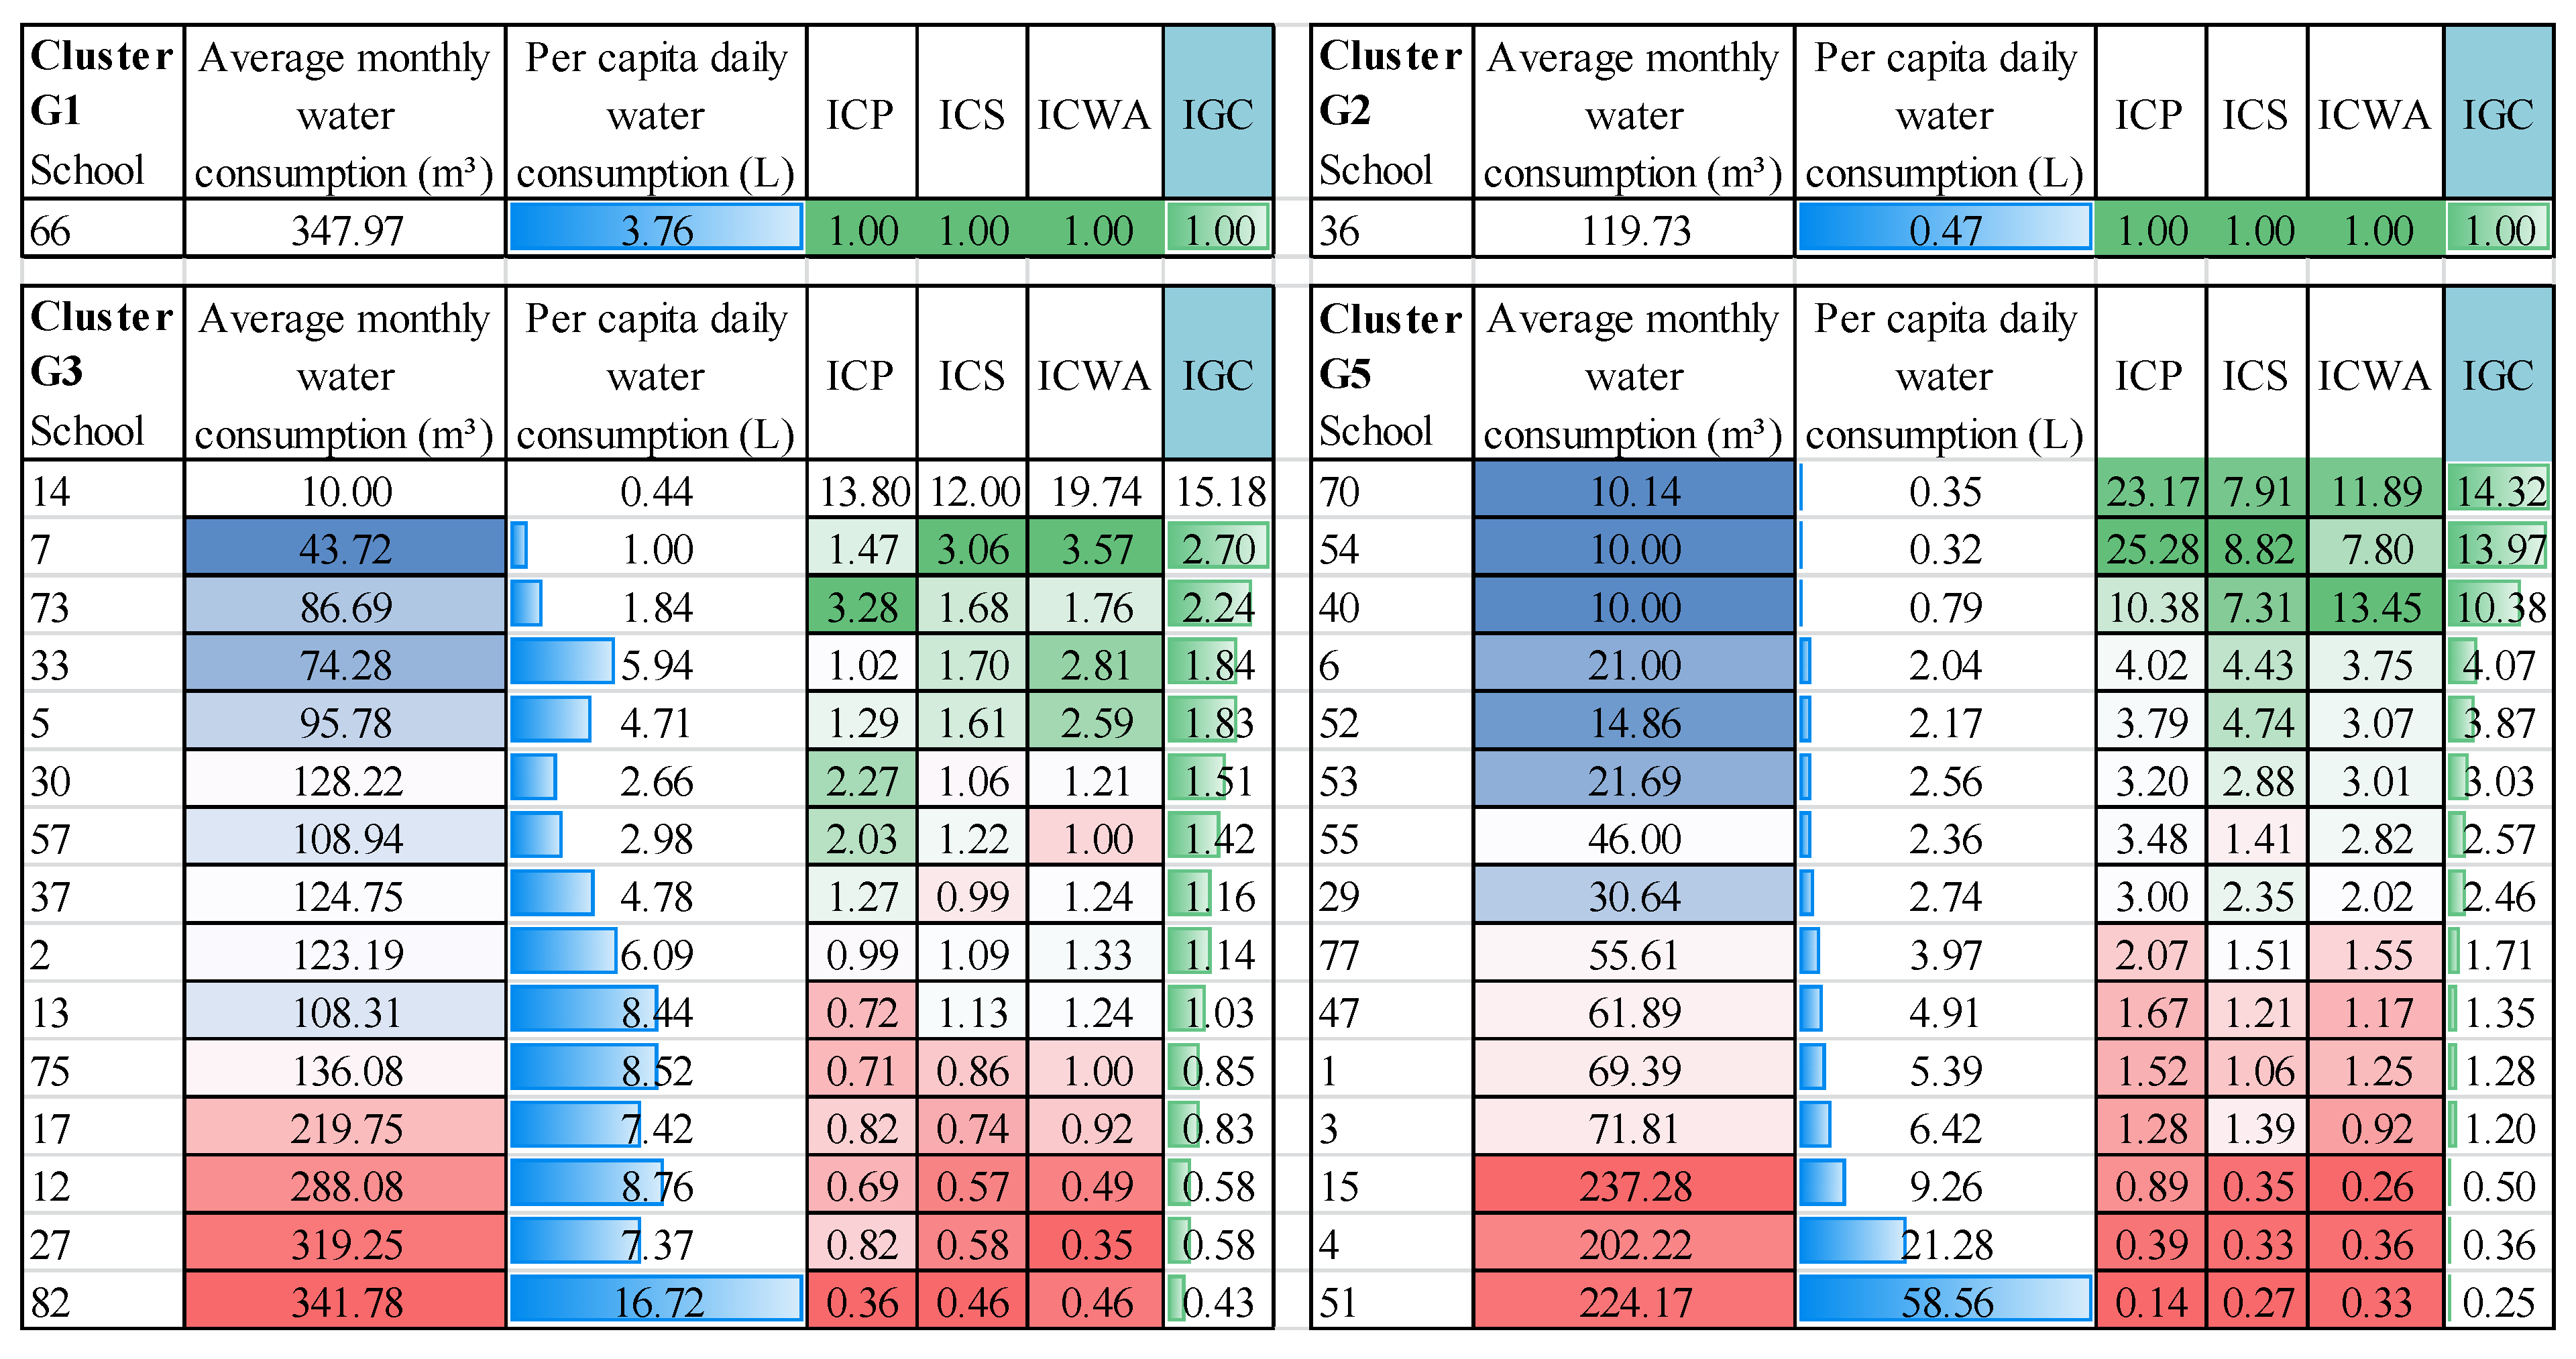
These three indicators refer to the three categories of variables grouped into three sets of variables in the data collection stage. In this sense, the benchmarking step categorises and organises the information on water consumption in the buildings evaluated based on the variables in the three categories. The development of the general consumption indicator aims to synthesise this information. To compare with previous results, in Figure 10 and Figure 11 the average monthly consumption and the daily per capita consumption are shown with the results of each indicator. Cluster G4 is shown in Figure 10 due to the number of buildings for better visualisation.
As for clusters G1 and G2, the three indicators show maximum possible results, which illustrates what a benchmark in a cluster would be. In cluster G3, school building 14 was taken out of the analysis for presenting an excessively low water consumption which led to an excessive-high general consumption indicator (IGC). This could not only indicate under-measurement in such a school but also impair the evaluation of the other buildings in this cluster as the general consumption indicator would be too low. Thus, the comparison would be difficult. In cluster G3, school building 82 presented a much greater per capita water consumption in comparison with others in the same cluster, which is corroborated by its low population consumption indicator (ICP). Similar behaviours were identified in clusters G3 and G5 regarding the school buildings with greater monthly water consumption and greater mainly of daily per capita water consumption.
Cluster G5 presented an even distribution and relations between monthly and per capita water consumption. However, when sorted by the general consumption indicator, several buildings changed their position in the ranking. School building 29 with less water consumption than school building 55 presented a lower general indicator, which is explained by greater population consumption indicator (ICP) and greater water appliances indicator (ICWA) in school building 55. This position interchange illustrates how assessing water efficiency using monthly water consumption or even by daily per capita water consumption is not enough. The great daily per capita water consumption presented by school building 51 must also be highlighted, which could indicate a leak. Even though the monthly water consumption is similar to others in the last ranking positions (school buildings 15 and 4), such great volumes should be deeper and locally investigated. This result is an interesting characteristic of this method as is possible to monitor the water distribution network by only updating data and possible leaks could be detected.
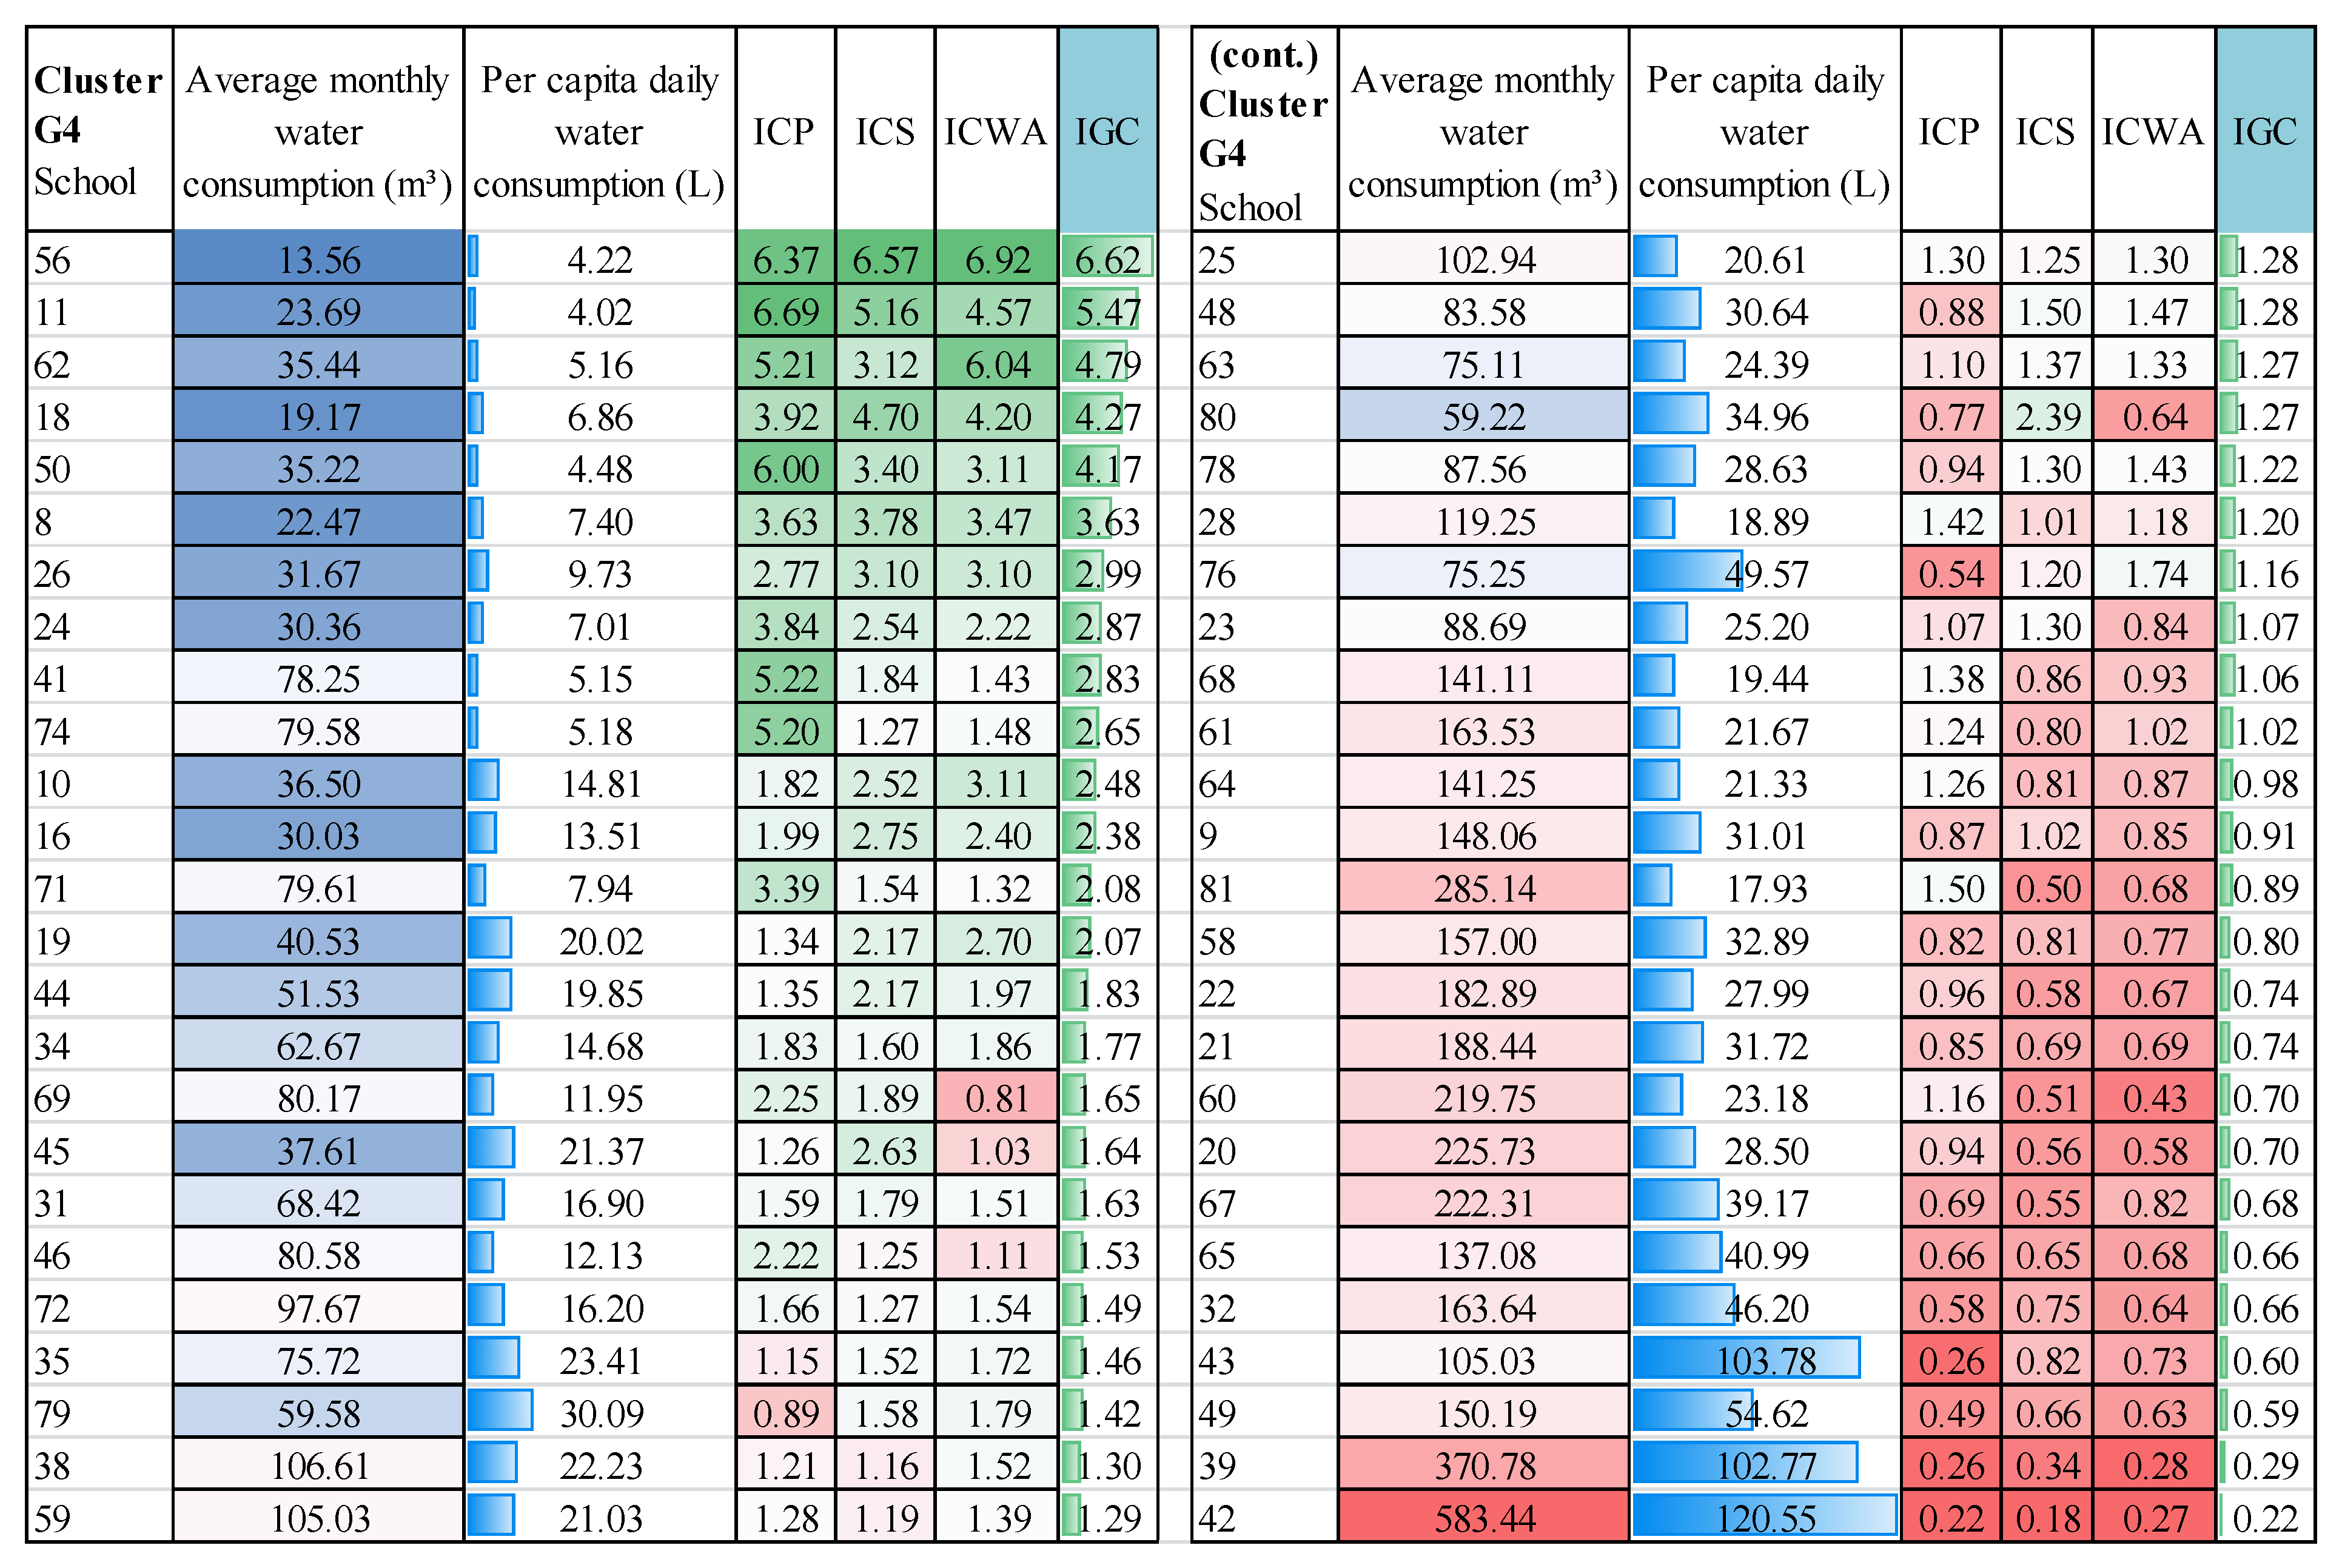
Cluster G3 presented more variations in buildings positions than cluster G5 when sorted by general consumption indicator instead of using the simple monthly and per capita water consumption ranking. Cluster G3 also had a building (school building 82) with much higher per capita water consumption than others with similar indicators related to population, influential spaces and water appliances. Figure 11 presents the benchmarking results for cluster G4.
Overall, the higher general consumption indicators (IGC) are related to lower water consumption. However, it was verified that this is not a rule. In some cases, it is possible to see the opposite behaviour. For instance, school 28 in cluster G4 presents greater average monthly water consumption (119.25 m3) than school buildings 76 and 23 with 75.25 m3 and 88.69 m3 of water consumed in a month, on average. However, the general consumption indicator (IGC) of building 28 is greater among these three buildings. Therefore, water is more efficiently used there. Moreover, in building 76, the population consumption indicator (ICP) is lower than influential spaces and water appliances indicators for the same building. In addition to the per capita water consumption, this could justify focusing water-saving initiatives on user behaviour.
To use the benchmarking results, the evaluation must focus not only on the general consumption indicator but also on other indicators. For building 69 in cluster G4, both influential spaces and population indicators are shown in green as the indicator related to water appliances is shown in red, and the general consumption indicator presents an intermediate result. This would suggest focusing on that set of variables to increase water savings on the building. In other words, this building should probably have its appliances replaced with more efficient ones.
Another useful result from the benchmarking system presented in this paper is the possibility to detect unusual water consumption in several buildings. School buildings 39, 42 and 43 present daily per capita water consumption much greater than others in the same cluster, which should be locally investigated to verify the possible occurrences of leaks. The reason for that is that buildings in a cluster are similar according to the variables used in the cluster analysis and such buildings should not be presenting such a greater water consumption than the others in cluster G4. The same logic should be used in the case of excessively low water consumption.
Although a deeper on-site analysis is recommended, this method could save valuable resources that would be spent on locally searching issues on buildings if a large distribution network is considered. In this case, the evaluation through the method presented in this paper would indicate not only the need of adopting initiatives aimed at water conservation in a building but also on which type of variable such initiatives should be addressed.
3.3. Discussion
The method proposed herein is useful for evaluating sets of buildings in terms of water consumption and was suitable to demonstrate that it is possible to properly address efforts on the variables according to the indicators. This is highly relevant in the development and application of programmes for the rational use of water in buildings. It is important to emphasise that the evaluation is limited to the variables of this work, but the method does not prevent more variables from being added or replaced.
As for the data analysis stage, it was initially expected to find similar building classes at the end of the cluster analysis stage. This step was able to meet this objective but showed more interesting results. It was possible to identify buildings with water consumption indicators either much greater or much lower than buildings in the same clusters. These buildings should be deeper investigated for the possibility of water consumption under-measurement. To confirm this hypothesis, audits would need to be carried out locally in such buildings. Even so, the identification, through the proposed method, of buildings whose water consumption is incompatible with their characteristics was considered satisfactory. Likewise, excessively low-efficiency results can be used to identify buildings with possible leakage problems as they have similar characteristics with others in the cluster, but with much higher water consumption. This methodology is suitable to be used in the remote detection of leaks, which is of great importance for network maintenance planning, especially considering dense and complex networks in which such detection is more difficult and expensive.
Considering the benchmarking results, the identification of buildings with different characteristics than the average in the clusters (e.g., much greater water consumption) proved to be relevant for water conservation. Identifying such differences could support correctly directing efforts, initiatives, and financial resources by the water distribution network managers. In a way, this remote monitoring system presents the following main advantages: the possibility of evaluating a water distribution network through the consumption of buildings remotely and without having to mobilise human resources and funds to locally investigate where there may be maintenance issues, such as leaks, or under-measurement occurrences.
As for the limitations to the method shown in this paper, efficiency definition and data available were the most significant. The efficiency definition for a building in this paper is related to the available data, i.e. the variables used to compose the three categories. Variables used in the area of water efficiency in buildings, such as user behaviour and comfort, were not included. Other examples are local climate and socioeconomic variables that could be used to compose a more complex efficiency definition. Specific variables, such as the difference of age on water consumption (that exists among students, teachers and staff) was not considered in this evaluation system. However, the non-utilisation of such variables does not decrease the method suitability as they can be included in future studies to increase the accuracy of the results.
4. Conclusions
The method proposed in this work is not geographically limited and does not impose a maximum number of buildings to be evaluated, it can be fed with more data and updated information on school buildings and, therefore, refined. In addition, there is the possibility of its adaptation for the evaluation of other types of buildings, since variables can be added to the benchmarking system. It is believed that with more data available, the accuracy of results can increase.
In conclusion, the method presented in this paper is suitable to be used in small to large sets of buildings in terms of water efficiency. It has to be refined and adjustments should be carried out to improve results accuracy. The method presents advantages such as being possible to identify low-efficiency, under-measurement or possible leakings in buildings, which can save resources. The benchmarking system presented in this paper is a low-cost tool for monitoring a water network through the buildings involved and can identify the type of variable that should be addressed to enhance water conservation in a particular building. On the other hand, the method also presents disadvantages, such as the limited data on which it has been developed, and the possibility of benchmarks attribution indicating under-measuring buildings, which can be overcome through an on-site evaluation.
Author Contributions
Conceptualization, R.A.F.; methodology, R.A.F. and E.G.; writing—original draft preparation, R.A.F.; writing—review and editing, R.A.F. and E.G.; supervision, E.G.; funding acquisition, E.G. All authors have read and agreed to the published version of the manuscript.
Funding
This research was funded by the Brazilian Council for Scientific and Technological Development—CNPQ, grant number 140878/2018–1.
Institutional Review Board Statement
Not applicable.
Informed Consent Statement
Not applicable.
Data Availability Statement
Data are contained within the article.
Acknowledgments
The authors acknowledge the Brazilian National Council for Scientific and Technological Development—CNPq (Grant no. 140878/2018-1), and the Federal University of Santa Catarina (UFSC) for the support received to carry out this study.
Conflicts of Interest
The authors declare no conflict of interest.
References
- Miller, G.T. Ciência Ambiental; 11a; Cengage Learning: São Paulo, Brasil, 2014; ISBN 978-85-221-0549-6. [Google Scholar]
- Jorgensen, B.; Graymore, M.; O’Toole, K. Household water use behavior: An integrated model. J. Environ. Manag. 2009, 91, 227–236. [Google Scholar] [CrossRef] [PubMed]
- Dai, J.; Wu, S.; Han, G.; Weinberg, J.; Xie, X.; Wu, X.; Song, X.; Jia, B.; Xue, W.; Yang, Q. Water-energy nexus: A review of methods and tools for macro-assessment. Appl. Energy 2018, 210, 393–408. [Google Scholar] [CrossRef]
- Padrón, R.S.; Gudmundsson, L.; Decharme, B.; Ducharne, A.; Lawrence, D.M.; Mao, J.; Peano, D.; Krinner, G.; Kim, H.; Seneviratne, S.I. Observed changes in dry-season water availability attributed to human-induced climate change. Nat. Geosci. 2020, 13, 477–481. [Google Scholar] [CrossRef]
- Cominola, A.; Giuliani, M.; Piga, D.; Castelletti, A.; Rizzoli, A.E. Benefits and challenges of using smart meters for advancing residential water demand modeling and management: A review. Environ. Model. Softw. 2015, 72, 198–214. [Google Scholar] [CrossRef] [Green Version]
- ANA. Conjuntura Recursos Hídricos Brasil; Agência Nacional de Águas: Brasília, Brazil, 2018. [Google Scholar]
- Vanham, D. A holistic water balance of Austria–how does the quantitative proportion of urban water requirements relate to other users? Water Sci. Technol. 2012, 66, 549–555. [Google Scholar] [CrossRef] [PubMed]
- Camp, R.C. Benchmarking: The search for industry best practices that lead to superior performance. Qual. Prog. 1989, 22, 62–69. [Google Scholar]
- Flores, R.A.; Ghisi, E. Water Benchmarking in Buildings: A Systematic Review on Methods and Benchmarks for Water Conservation. Water 2022, 14, 473. [Google Scholar] [CrossRef]
- Galindro, B.M.; Zanghelini, G.M.; Soares, S.R. Use of benchmarking techniques to improve communication in life cycle assessment: A general review. J. Clean. Prod. 2019, 213, 143–157. [Google Scholar] [CrossRef]
- Lankford, W.M. Benchmarking: Understanding the basics. Coast. Bus. J. 2000, 1, 57–62. [Google Scholar]
- Corton, M.L. Benchmarking in the Latin American water sector: The case of Peru. Util. Policy 2003, 11, 133–142. [Google Scholar] [CrossRef] [Green Version]
- Corton, M.L.; Berg, S.V. Benchmarking Central American water utilities. Util. Policy 2009, 17, 267–275. [Google Scholar] [CrossRef] [Green Version]
- Pedroso, L.P. Estudo das Variáveis Determinantes no Consumo de Agua em Escolas: O Caso das Unidades Municipais de Campinas, São Paulo [Study of the Determinants of Water Consumption in Schools: The Case of Municipal Units in Campinas, Sao Paulo]. Master’s Thesis, Faculdade de Engenharia Civil, Universidade Estadual de Campinas, Campinas, Brazil, November 2008. [Google Scholar]
- Antunes, L.N.; Ghisi, E. Water and energy consumption in schools: Case studies in Brazil. Environ. Dev. Sustain. 2019, 22, 4225–4249. [Google Scholar] [CrossRef]
- IBGE, Instituto Brasileiro de Geografia e Estatística. IBGE|Cidades@|SantaCatarina|Florianópolis|Panorama. Available online: https://cidades.ibge.gov.br/brasil/sc/florianopolis/panorama (accessed on 17 January 2022).
- GeoHack-Florianópolis. Available online: https://geohack.toolforge.org/geohack.php?pagename=Florianópolis¶ms=27_35_49_S_48_32_56_W_type:city_region:BR (accessed on 17 January 2022).
- Lê, S.; Josse, J.; Husson, F. FactoMineR: An R Package for Multivariate Analysis. J. Stat. Softw. 2008, 25, 1–18. [Google Scholar] [CrossRef] [Green Version]
- Dias, T.F.; Kalbusch, A.; Henning, E. Factors influencing water consumption in buildings in southern Brazil. J. Clean. Prod. 2018, 184, 160–167. [Google Scholar] [CrossRef]
- Garcia, J.; Salfer, L.R.; Kalbusch, A.; Henning, E. Identifying the Drivers of Water Consumption in Single-Family Households in Joinville, Southern Brazil. Water 2019, 11, 1990. [Google Scholar] [CrossRef] [Green Version]
- Ywashima, L.A. Avaliação do Uso de Água em Edifícios Escolares Públicos e Análise de Viabilidade Econômica da Instalação de Tecnologias Economizadoras nos Pontos de Consumo [Water Use Assessment in Public School Buildings and Economic Feasibility Analysis of Water-Saving Techonologies]. Master’s Thesis, Faculdade de Engenharia Civil, Universidade Estadual de Campinas, Campinas, Brazil, 2005. [Google Scholar]
- Kassambara, A. Practical Guide to Cluster Analysis in R: Unsupervised Machine Learning, 1st ed.; Online published; Sthda; 2017; Available online: https://www.datanovia.com/en/wp-content/uploads/dn-tutorials/book-preview/clustering_en_preview.pdf (accessed on 17 February 2022).
- de Melo, N.A.; Salla, M.R.; de Oliveira, F.R.G.; Frasson, V.M. Consumo de água e percepção dos usuários sobre o uso racional de água em escolas estaduais do Triângulo Mineiro. Ciência Eng. 2014, 23, 1–9. [Google Scholar] [CrossRef] [Green Version]
- Vinagre Díaz, J.J.; Wilby, M.R.; Rodríguez González, A.B.; García Muñoz, J. EEOnt: An ontological model for a unified representation of energy efficiency in buildings. Energy Build. 2013, 60, 20–27. [Google Scholar] [CrossRef]
- Belapurkar, N.; Harbour, J.; Shelke, S.; Aksanli, B. Building Data-Aware and Energy-Efficient Smart Spaces. IEEE Internet Things J. 2018, 5, 4526–4537. [Google Scholar] [CrossRef]
- ABNT, Associação Brasileira de Normas Técnicas. NBR 5626-Instalação Predial de Água Fria; ABNT: Rio de Janeiro, Brazil, 1998. [Google Scholar]
- Associação Brasileira de Normas Técnicas. NBR 5626-Sistemas Prediais de Água Fria e Água Quente—Projeto, Execução, Operação e Manutenção; ABNT: Rio de Janeiro, Brazil, 2020. [Google Scholar]
Figure 1.
The location of the city of Florianópolis, Brazil.

Figure 2.
Variables were investigated into three categories.

Figure 3.
Dendrogram resulted from the hierarchical clustering.

Figure 4.
Results of within-sum of squares—elbow method.

Figure 5.
Results of the k-means algorithm.

Figure 6.
The geographic location of school buildings in clusters G1, G2 and G3.

Figure 7.
The geographic location of school buildings in cluster G4.

Figure 8.
The geographic location of school buildings in cluster G5.

Figure 9.
Water consumption rankings for the five clusters.

Figure 10.
Benchmarking results for clusters G1, G2, G3 and G5.

Figure 11.
Benchmarking results for cluster G4.

Publisher’s Note: MDPI stays neutral with regard to jurisdictional claims in published maps and institutional affiliations. |
© 2022 by the authors. Licensee MDPI, Basel, Switzerland. This article is an open access article distributed under the terms and conditions of the Creative Commons Attribution (CC BY) license (https://creativecommons.org/licenses/by/4.0/).
Share and Cite
MDPI and ACS Style
Flores, R.A.; Ghisi, E. Benchmarking Water Efficiency in Public School Buildings. Sustainability 2022, 14, 3794. https://0-doi-org.brum.beds.ac.uk/10.3390/su14073794
AMA Style
Flores RA, Ghisi E. Benchmarking Water Efficiency in Public School Buildings. Sustainability. 2022; 14(7):3794. https://0-doi-org.brum.beds.ac.uk/10.3390/su14073794
Chicago/Turabian StyleFlores, Rafael Almeida, and Enedir Ghisi. 2022. "Benchmarking Water Efficiency in Public School Buildings" Sustainability 14, no. 7: 3794. https://0-doi-org.brum.beds.ac.uk/10.3390/su14073794
Note that from the first issue of 2016, this journal uses article numbers instead of page numbers. See further details here.