
Air Pollution and Public Bike-Sharing System Ridership in the Context of Sustainable Development Goals


1
Department of Policy and Planning Sciences, Graduate School of Systems and Information Engineering, University of Tsukuba, Tsukuba 305-8577, Japan
2
Faculty of Health and Sport Sciences, University of Tsukuba, Tsukuba 305-8577, Japan
3
Faculty of Engineering, Information and Systems, University of Tsukuba, Tsukuba 305-8577, Japan
*
Author to whom correspondence should be addressed.
Sustainability 2022, 14(7), 3861; https://0-doi-org.brum.beds.ac.uk/10.3390/su14073861
Submission received: 27 February 2022
/
Revised: 17 March 2022
/
Accepted: 22 March 2022
/
Published: 24 March 2022
(This article belongs to the Special Issue Tendencies and Strategies of Active Mobility to Promote Urban Sustainable Transportation Systems)
Abstract
:A bicycle-sharing system (BSS) has been implemented in Seoul, South Korea to promote green transportation policy as a Sustainable Development Goal (SDG) to mitigate climate change, reduce traffic jams, and promote physical activity. However, the concentration of air pollutants in Seoul often exceeds the standards of the World Health Organization, thereby creating a conflict with SDG 3 (Health). Therefore, it is important to recognize the trade-offs between actions targeted at SDGs as they might offset each other. In this context, a primary concern is investigating how the behavior of BSS users regarding outdoor air pollution appears. This study explores the relationship between ambient air pollution and the behavior of BSS riders in Seoul. We conducted a time-series analysis of associations between particulate air pollution and participation in the BSS. We used generalized additive models, adjusted for mean temperature, humidity, rainfall, day of the week, long-term trends, and seasonality to construct an exposure–response relationship. We observed a nonlinear relationship between increasing air pollution and bicycle ridership. This study method can be used as a basis for similar analyses to investigate BSS policies in other cities.
1. Introduction
The United Nations Sustainable Development Goals (SDGs) aim to ensure that human rights are secured for all people [1]. To implement the goals of this international pledge, the South Korean government established the Korean Sustainable Development Goals (K-SDGs) in 2018 to be achieved by 2030 in 17 areas to share global responsibilities (Table S1) [2,3]. Among the detailed targets to be achieved, both SDGs and K-SDGs aim to promote sustainable transport systems. In South Korea, the environmental and cost issue of transportation is one of the biggest concerns. The commuting rate by car is approximately 43.7% [4], transportation itself contributes to 34.3% of national greenhouse gas (GHG) emissions [5], and exhaust gases from road vehicles including passenger and freight are responsible for 14.5% of overall national air pollution (Table S2) [6]. In addition, traffic congestion costs, which refer to additional social costs such as loss of time value and increase in vehicle operating costs caused by traveling at less than normal speed because of traffic congestion, in the seven major cities were estimated at USD 25 billion in 2017 [5]. Therefore, the adoption of eco-friendly transportation is taking on an essential role in implementing environmental sustainability strategies for low-carbon green growth.
Efforts to encourage the use of bicycles as an alternative transportation option have been increasing worldwide, and public bike-sharing systems (BSSs) have been included in urban planning of several countries as policies to mitigate climate change, reduce traffic congestion, noise, and related air pollution [7,8]. In the U.S., bicycle-sharing services are implemented in 51 states [9], and the ‘Citi Bike Share Program’ in New York City (NYC), which was implemented in 2013, is one of the largest and most successful BSS in the U.S. More than 560 km of bike paths were built in NYC to revitalize this program, and the NYC government has taken legal deregulation measures, such as non-mandatory helmet wearing, to not discourage people from joining in BSS [10]. Hangzhou City of China operates the largest BSS in the world, which was introduced in 2008 and initiated by the local government to address increasing urban traffic and environmental pollution [11]. Similar efforts to build the infrastructure related to BSS are being introduced in urban planning policies worldwide. In most countries, when a bike lane is installed next to a road, a safety bar or mark and an intersection design that considers bicycle traffic is applied. In Japan, an underground bicycle parking lot was installed to maximize public space for citizens near subway stations. In Singapore, bicycle parking has been provided in optimal areas using Big Data analysis [12]. In Germany, a bicycle-friendly city development project has been implemented since 1979 under the slogan ‘Cycling Friendly City’. To increase cycling in urban designs, bicycle roads are implemented with the minimum number of detours, and safety at intersections is addressed [13]. The Great Bicycle Ring Route (GRAB) project of Rome has an even more complex infrastructure and offers multiple services, thereby attracting different users in different urban contexts, including historical landmarks, new neighborhoods, green space, and areas of contemporary urbanization [14].
The Korean central government has developed national cycling plans, strategies, and policies as a means of green transportation since 2008. The government aims to increase bike usage by expanding infrastructure such as bike roads. Therefore, approximately 3114 km of bike roads have been built nationwide over the past decade. The policy promoting bike use was closely implemented with the cooperation of local governments, including the capital city of South Korea, Seoul, which led to the introduction of a public BSS. In 2015, the Seoul Metropolitan Government (SMG) introduced the BSS, “Seoul Bike”. The major goal of SMG’s BSS is to achieve sustainable development, including environmental and new industry benefits, thereby protecting the environment and promoting economic growth simultaneously. Since SMG established the “Transportation Vision 2030” in 2013, which aims to increase the use of green transportation by 80%, SMG has planned to invest USD 20 million by 2020 to build bicycle roads connecting the entire city of Seoul to meet the government target.
The BSSs address environmental issues, and sociocultural and public health aspects of the interaction of several SDGs, such as sustainable cities and communities (SDG 11), climate action (SDG 13), social equality (SDG 5 and 10), infrastructure (SDG 9), and health (SDG 3). Moreover, in the context of SDGs, BSSs contribute to solving inequality by increasing the opportunity of economically marginalized classes to go to school and create job opportunities (SDG 5 and 10). It can also reduce cardiovascular and other diseases in people who mostly have a sedentary lifestyle (SDG 3). Furthermore, most of the other SDGs are also related to health and, hence, BSSs can indirectly contribute to them. One of the most important benefits of BSSs includes its contribution to public health. People might benefit from the physical exercise of riding a bicycle rather than driving or using public transportation. It has been reported that regular bicycle riding strengthens bones and joints, improves the functions of the heart and lungs, increases circulation, and reduces the risks of cardiovascular and respiratory diseases [15]. However, riders also have an increased risk of exposure to air pollutants, which is negatively associated with SDG3. Air pollution is recognized as the largest single environmental risk factor, as an estimated 4.2 million premature deaths were attributable to ambient outdoor air pollution in 2016 [16]. The intake of air pollutants increases considerably during cycling, which intensifies the detrimental health effects of air pollution [17]. A recent study observed that commuters walking and cycling in Stockholm were more exposed to traffic-related air pollution, thereby increasing their risk of premature death [18]. Previous studies estimated the impact of air pollution on all-cause mortality related to cycling [19,20], yet did not consider BSS and did not capture the rider’s behaviors of how they respond to air pollution to consider their health while supporting a sustainable mode of transportation.
The present study aims to investigate the relationship between ambient air pollution and the behavior of bicycle riders with a focus on the BSS. A time-series approach using generalized additive models (GAMs) was adopted to objectively describe the relationship between BSS participation and air pollution level in Seoul, the capital of South Korea, which has a population of approximately 10 million [21]. The annual mean concentration of particulate matter in Seoul far exceeds the WHO air quality guidelines (Table S3) [22,23,24]. We expect that our study will make a substantial contribution to the literature because the results help clarify aspects of BSSs that are not commonly considered in policies aiming toward a sustainable society.
2. Materials and Methods
2.1. BSS in Seoul
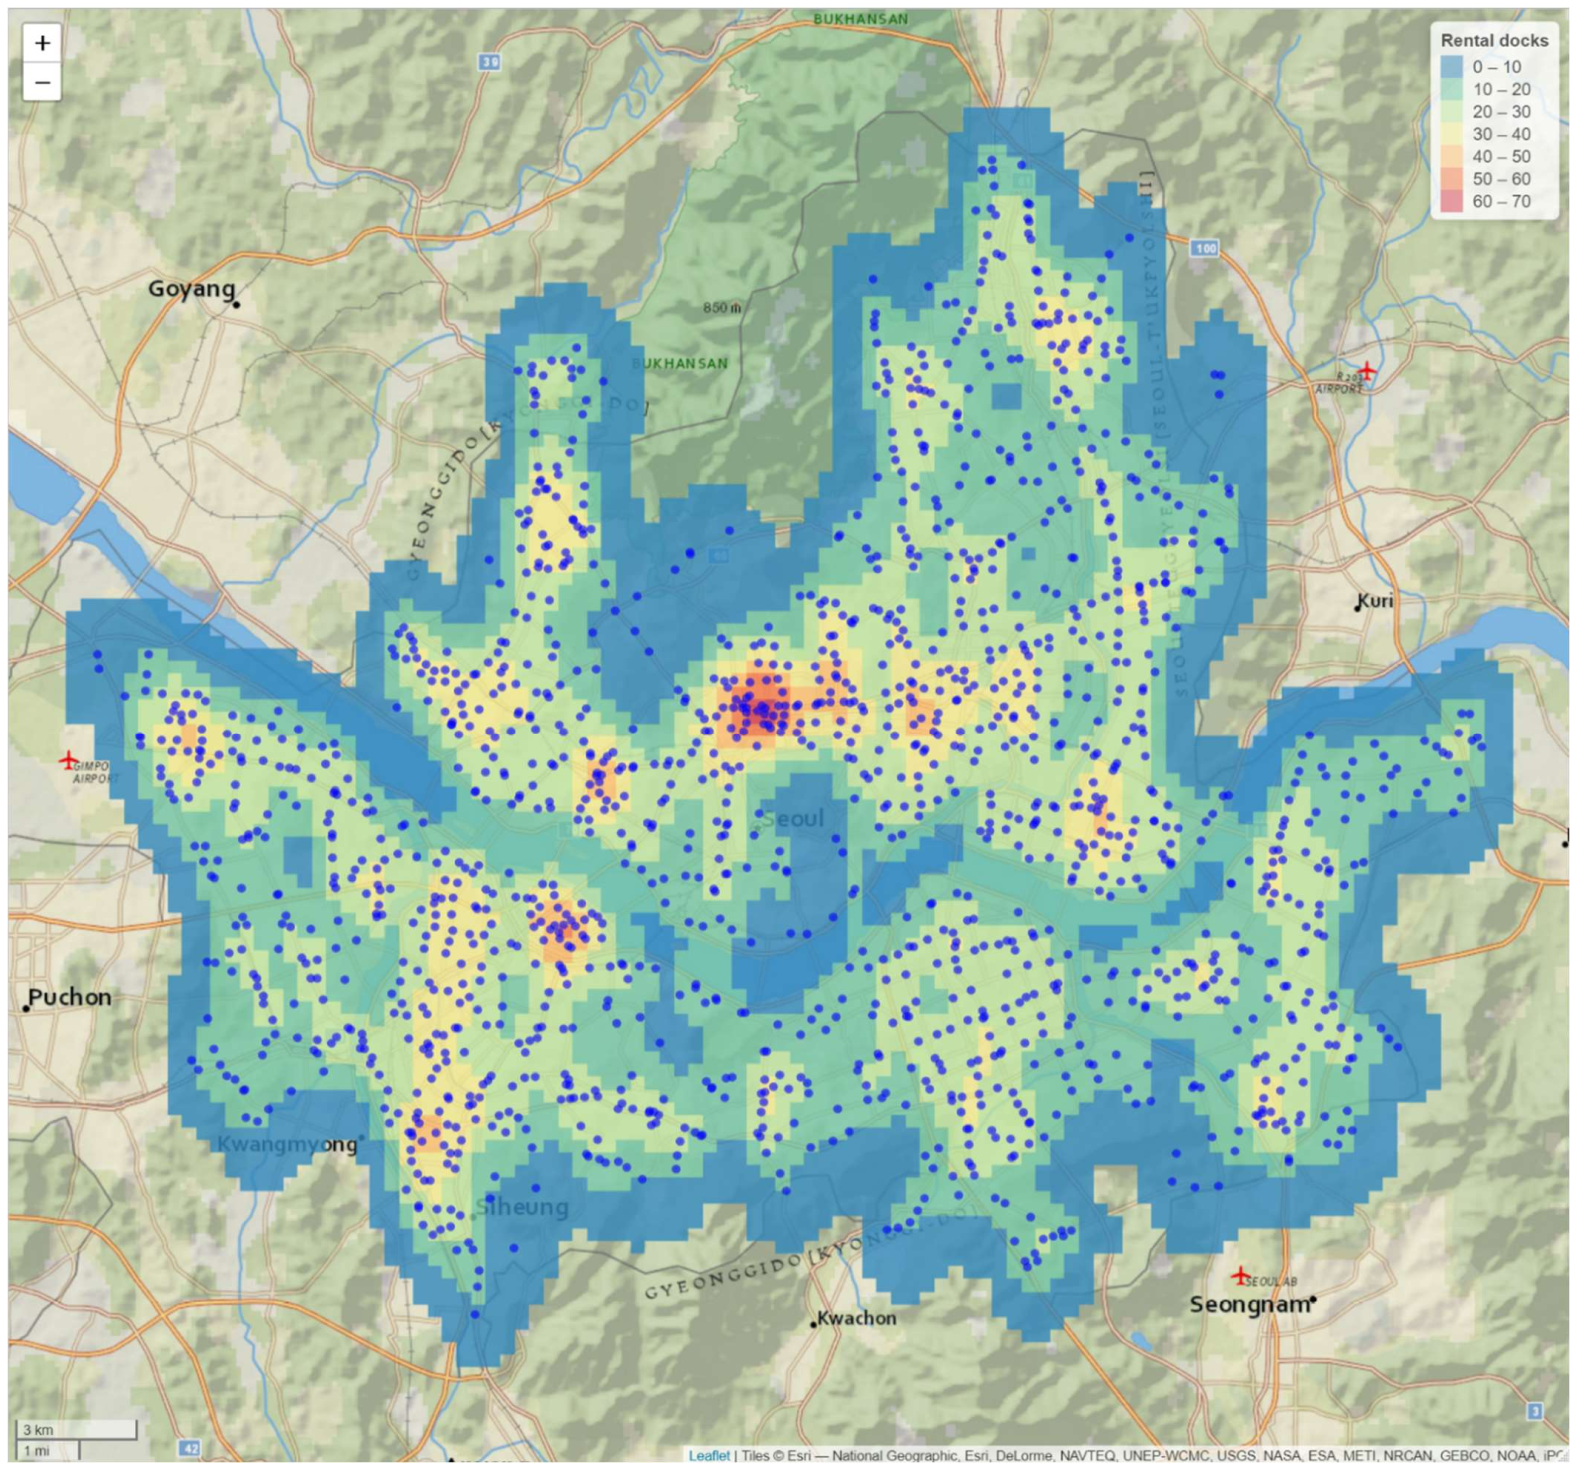
The BSS in Seoul was introduced in 2015 to address urbanization problems such as traffic congestion and air pollution and to improve the quality of life and health of citizens (Figure S1). BSS allows people to borrow and return bicycles from docking stations across the city (Figure 1), and these docks are bike racks that are used to lock and unlock (after online payment) the bicycles (Figure S2).
Table 1 shows that 17% of Seoul’s population (1.74 million people) used the BSS in 2019. Bicycle usage in South Korea has increased from 0.93% in 2005 to 1.51% in 2015, but it is still much lower compared to countries such as the Netherlands (36%) and Denmark (24%) [25]. However, since the 2015 launch of the bike-sharing scheme in Seoul, the number of bicycle riders has been increasing rapidly (Table 1).
2.2. Data
BSS data are publicly available in the Open Data Plaza (https://data.seoul.go.kr/, accessed on 26 February 2022) of the SMG. The study period was set from 1 January 2017 to 31 December 2019 because of the lack of reliability of earlier data (pilot operation in 2015–2016) and the COVID-19 pandemic in 2020–2021, which has influenced both ambient air pollution levels and BSS usage [26,27,28]. The BSS dataset was manipulated to generate three daily variables: number of riders, total distance ridden (m), and the total duration of rides (mins). The daily number of riders was calculated by summing the daily counts of riders. The total distance was calculated based on the measurements by the sensors installed on the bicycle wheels, and the total duration was calculated by summing the duration of all rides in a day. To analyze exposure to air pollutants, we focused on PM10 (particulate matter of an aerodynamic diameter of less than or equal to 10 μm), which can travel and lodge deep inside the lungs, and PM2.5 (particulate matter less than 2.5 μm in diameter), which can penetrate the lung barrier and enter the blood system [16]. The hourly concentrations of PM10 and PM2.5 were obtained from the Ministry of the Environment, Republic of Korea (KMOE). The daily representative concentrations were calculated by averaging the hourly values. Moreover, the corresponding meteorological variables, including temperature (°C), relative humidity (%), and rainfall (mm), were obtained from the Automated Synoptic Observing System of the Korea Meteorological Administration. We calculated the daily representative values by averaging [daily mean temperature (°C) and daily mean relative humidity (%)] or summing [daily total rainfall (mm)] the hourly values.
2.3. Statistical Analyses
We utilized nonparametric time-series analysis to analyze the nonlinear relationships between PM pollution and ridership variables to produce exposure–response curves by applying GAMs as an extension of the generalized linear model [29]. The strength of using GAMs is their high flexibility in estimating the smooth component of the model to fully capture the actual relationship, as the data determine the nature of the relationship between the response and the explanatory variables rather than assuming some form of parametric relationship. This modeling framework has been widely used to study the association between air pollution and related outcomes because nonlinear parameters can be effectively adjusted [30]. Separate models were fitted for the combination of exposure variables, PM10 and PM2.5, and three outcomes while controlling for covariates. Based on the existing literature on the weather conditions that affect bike-sharing users, our model was controlled for possible meteorological confounding factors, including daily mean temperatures (°C), daily mean relative humidity (%), and daily total rainfall (mm) [31]. Seasonality and long-term trends in bicycle ridership were included in the model as it has been demonstrated that seasonal differences exist in the impacts of PM levels on bike-sharing use in Seoul [32]. Day-of-week was also included in the model. Smoothing functions with a cubic spline basis were used to control the potential nonlinear effects of temperature and time trends. These functions were defined by a set of knots that were spread evenly through the covariate values using a conventional integrated-square second derivative penalty. Relative humidity and rainfall covariates were included as linear terms after their linearity was examined. The gaussian distribution was adopted in the GAM model for total distance ridden (m), and the total duration of rides (mins) and the quasi-Poisson distribution was adopted in the GAM model for daily number of riders since daily counts followed an over-dispersed Poisson distribution.
where µt is the expected outcomes [number of riders, total distance ridden (m), and the total duration of rides (mins)] on day t, p is the pollutants (PM10, PM2.5), and DOW is a categorical variable for the day of the week on day t. s(.) denotes the smoothing function realized by using cubic spline bases, with 4 degrees of freedom (df) for PM, with 5 df for temperature, and 7 df per year for time to adjust for seasonal and long-term trends, as based on a previous ecological study conducted in South Korea [33].
For nonlinear (reverse U-shaped) relationships, we fitted the value for each observation to the spline curve from the model and conducted a piecewise linear regression analysis to estimate the threshold of PM levels. Using a grid search method with a threshold of 20–60 μg/m3 for PM10 and 10–50 μg/ m3 for PM2.5, we observed that the point that produced the minimum Akaike information criterion (AIC) among the equally spaced grid point of 1 μg/ m3. We also conducted stratified analyses of weekday versus weekend rides to identify if the exposure–response relationship differed based on commuting versus leisure rides. SAS (version 9.4, SAS Institute, Inc., Cary, NC, USA) and R software (version 4.1.1, R Development Core Team) were used for data management and statistical analyses.
3. Results
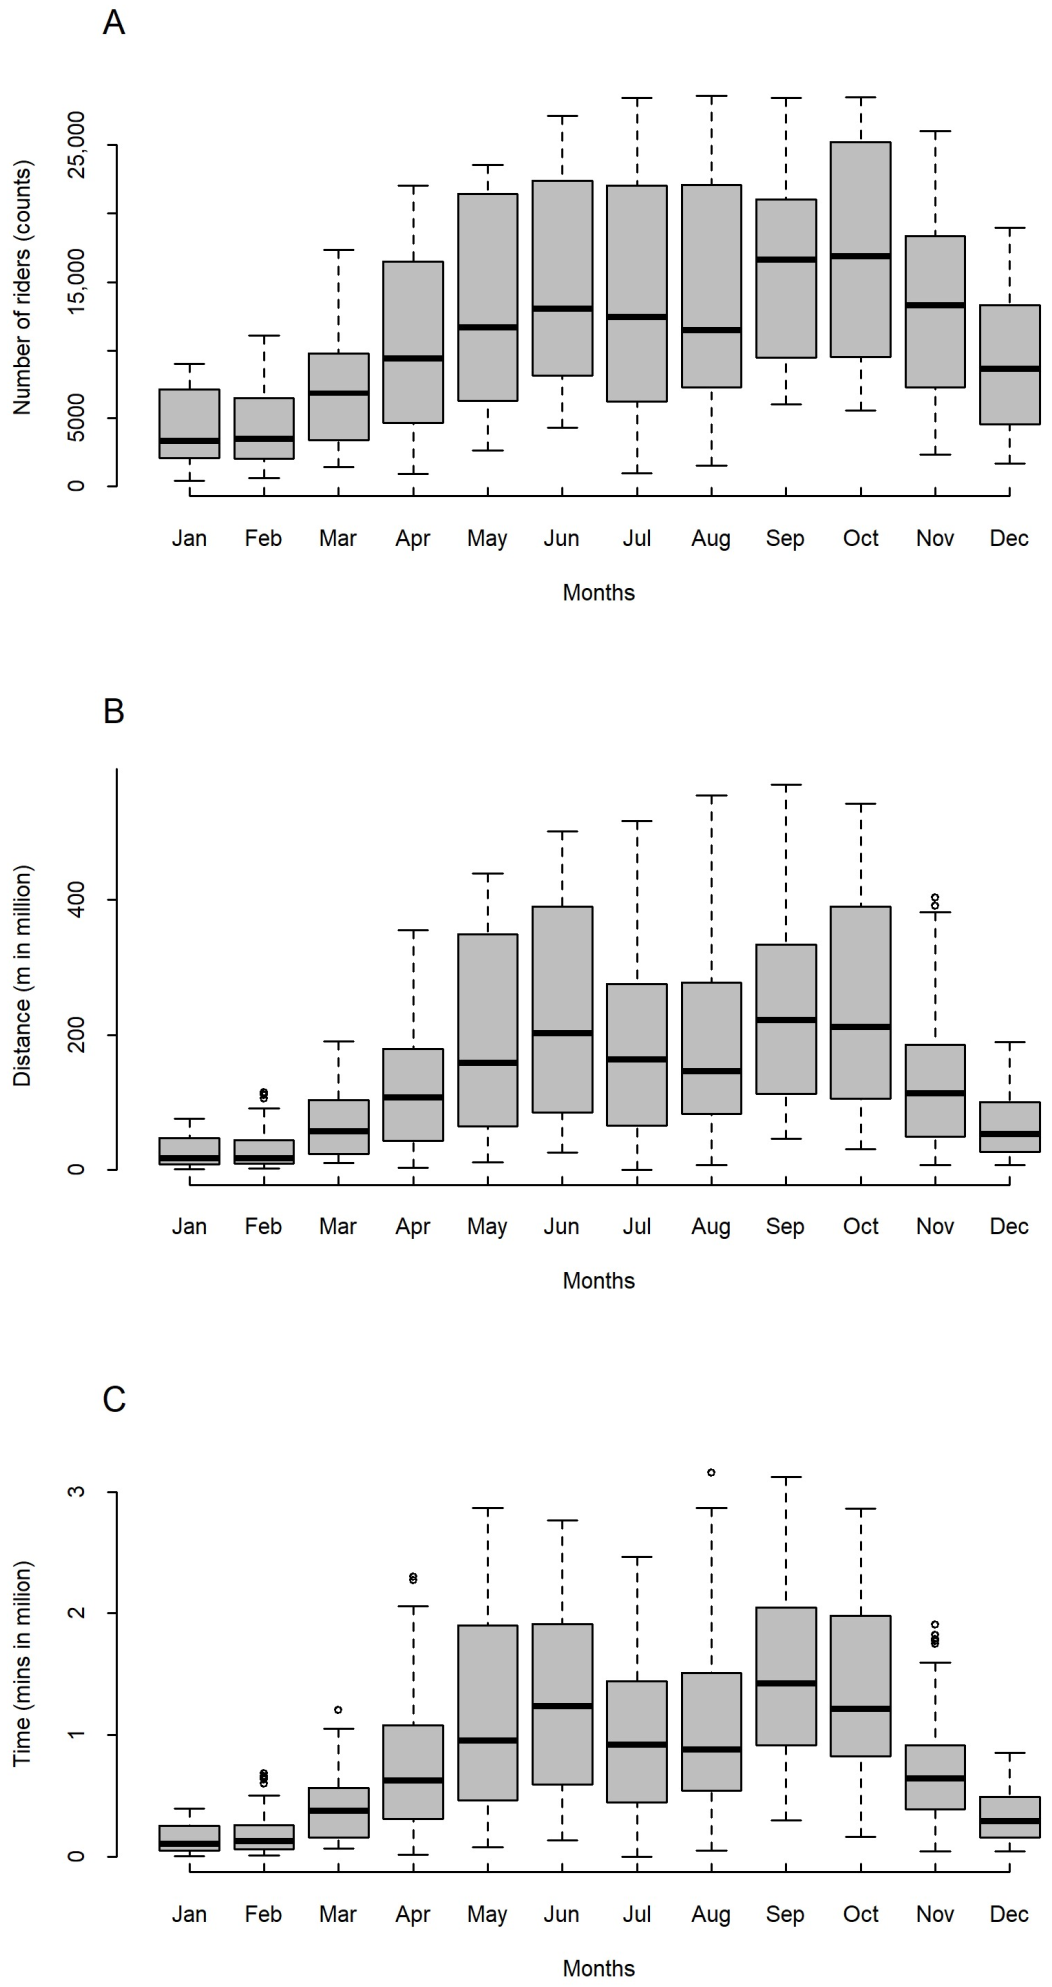
The Seoul BSS dataset included 12 million rides over 3 years (2017–2019), with an average of 11,434 daily rides. The monthly statistics of rides, including the number of riders, minutes ridden, and distance shown in Figure 2, are higher in warmer months (March through November) than in colder ones (December, January, and February). It is also noticeable that the usage is slightly lower in July and August compared to the adjacent months because of weather conditions. The summer in Seoul lasts from July to August, and it is the hottest (23–30 °C) and the wettest time of the year with the monsoon rains.
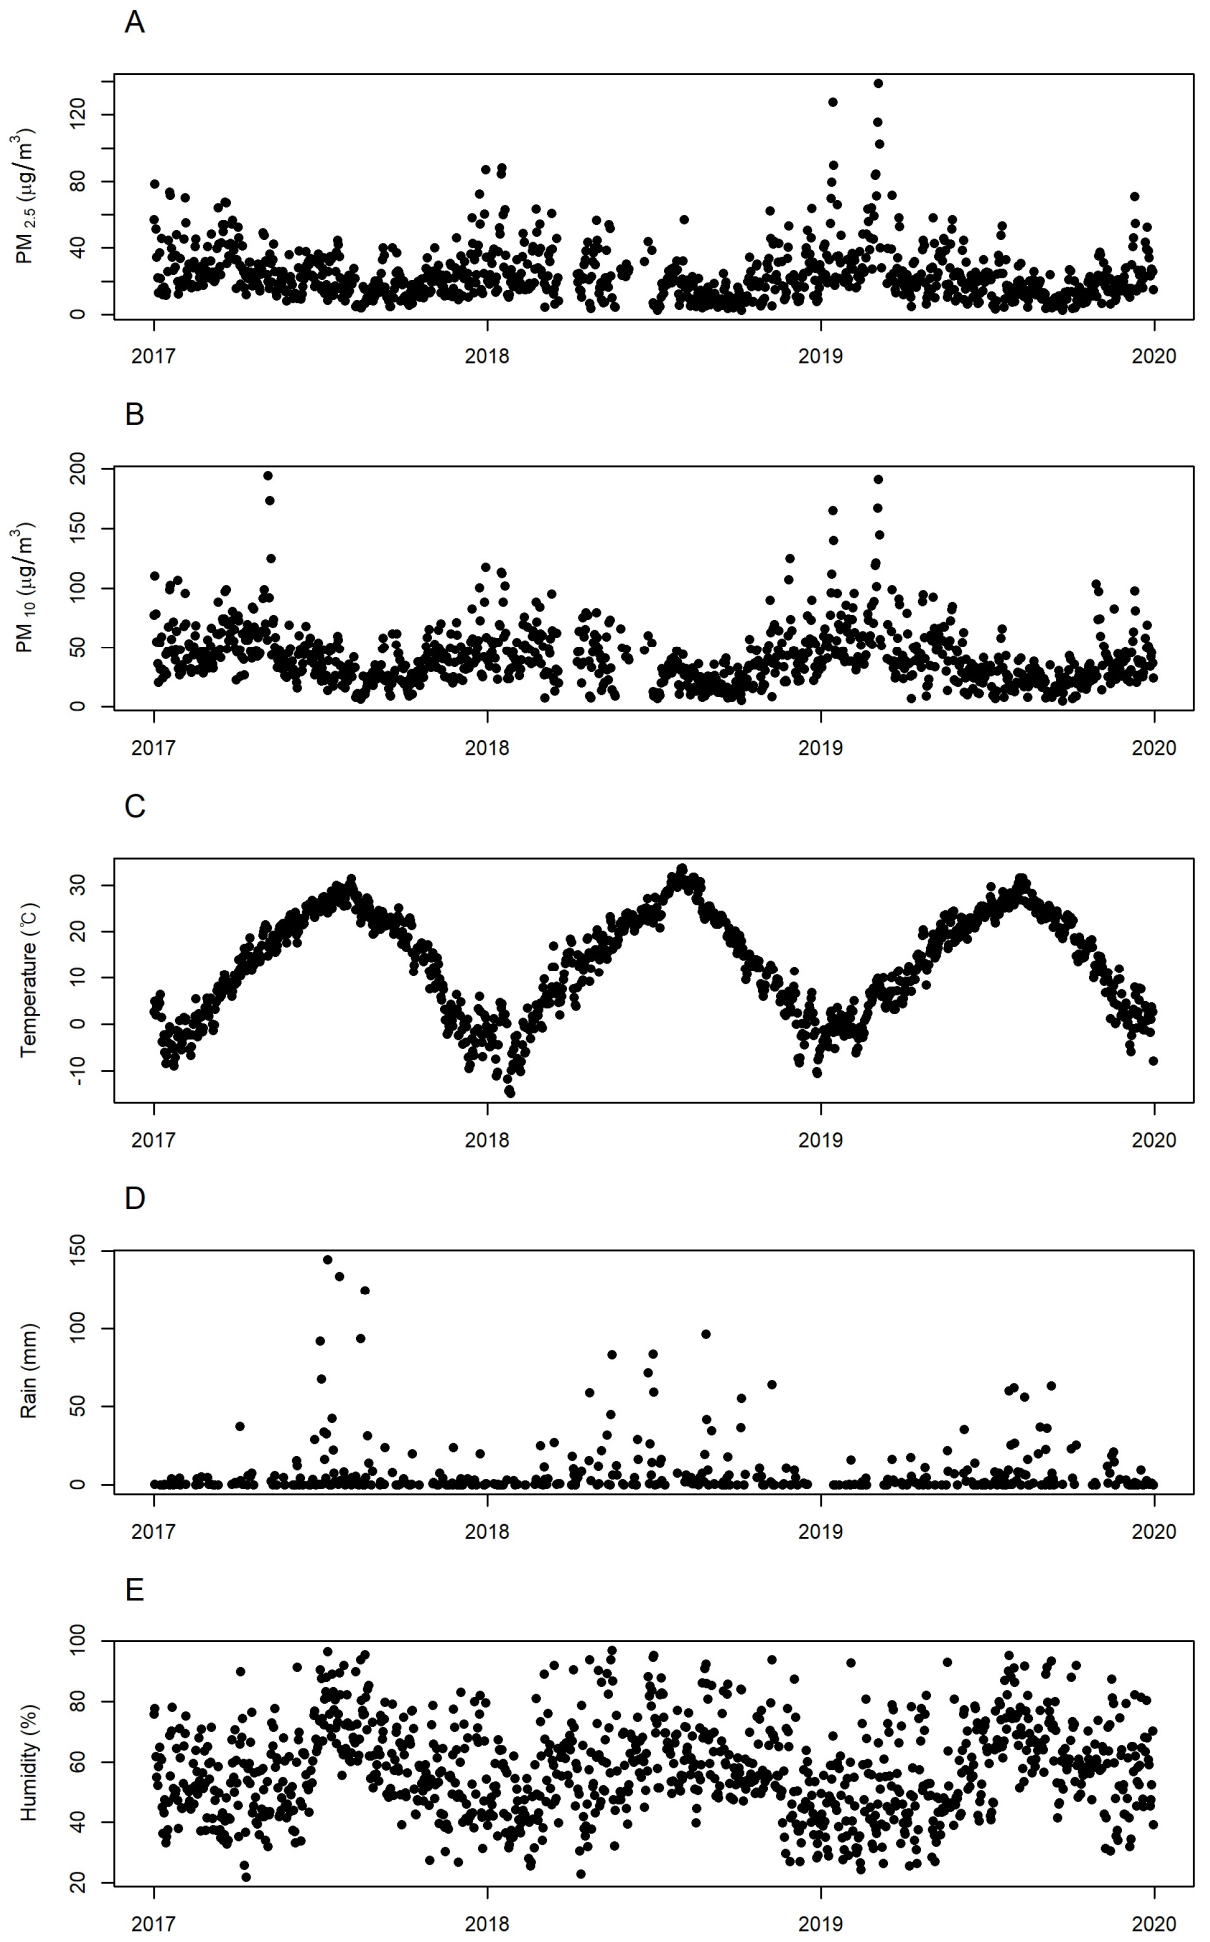
The seasonal dynamics of PM concentration levels were shown in Figure 3A,B; higher PM levels were observed in December through March than in other months. These fluctuations can be attributed to the use of fossil fuels for heating during the cold season and the yellow dust that blows from the Gobi Desert during the early spring season [34]. Also noticeable are extreme peaks in 2017 and 2019. Rapid external inflow and the influence of individual internal causes may show a sharp increase in concentration that does not follow the general trend. The high-concentration episodes in 2017 and 2019 were due to the combination of foreign inflows and atmospheric stagnation [35,36,37,38,39]. The meteorological factors, including daily mean temperature (Figure 3C), total rain (Figure 3D), and mean relative humidity (Figure 3E), also showed seasonal fluctuations.
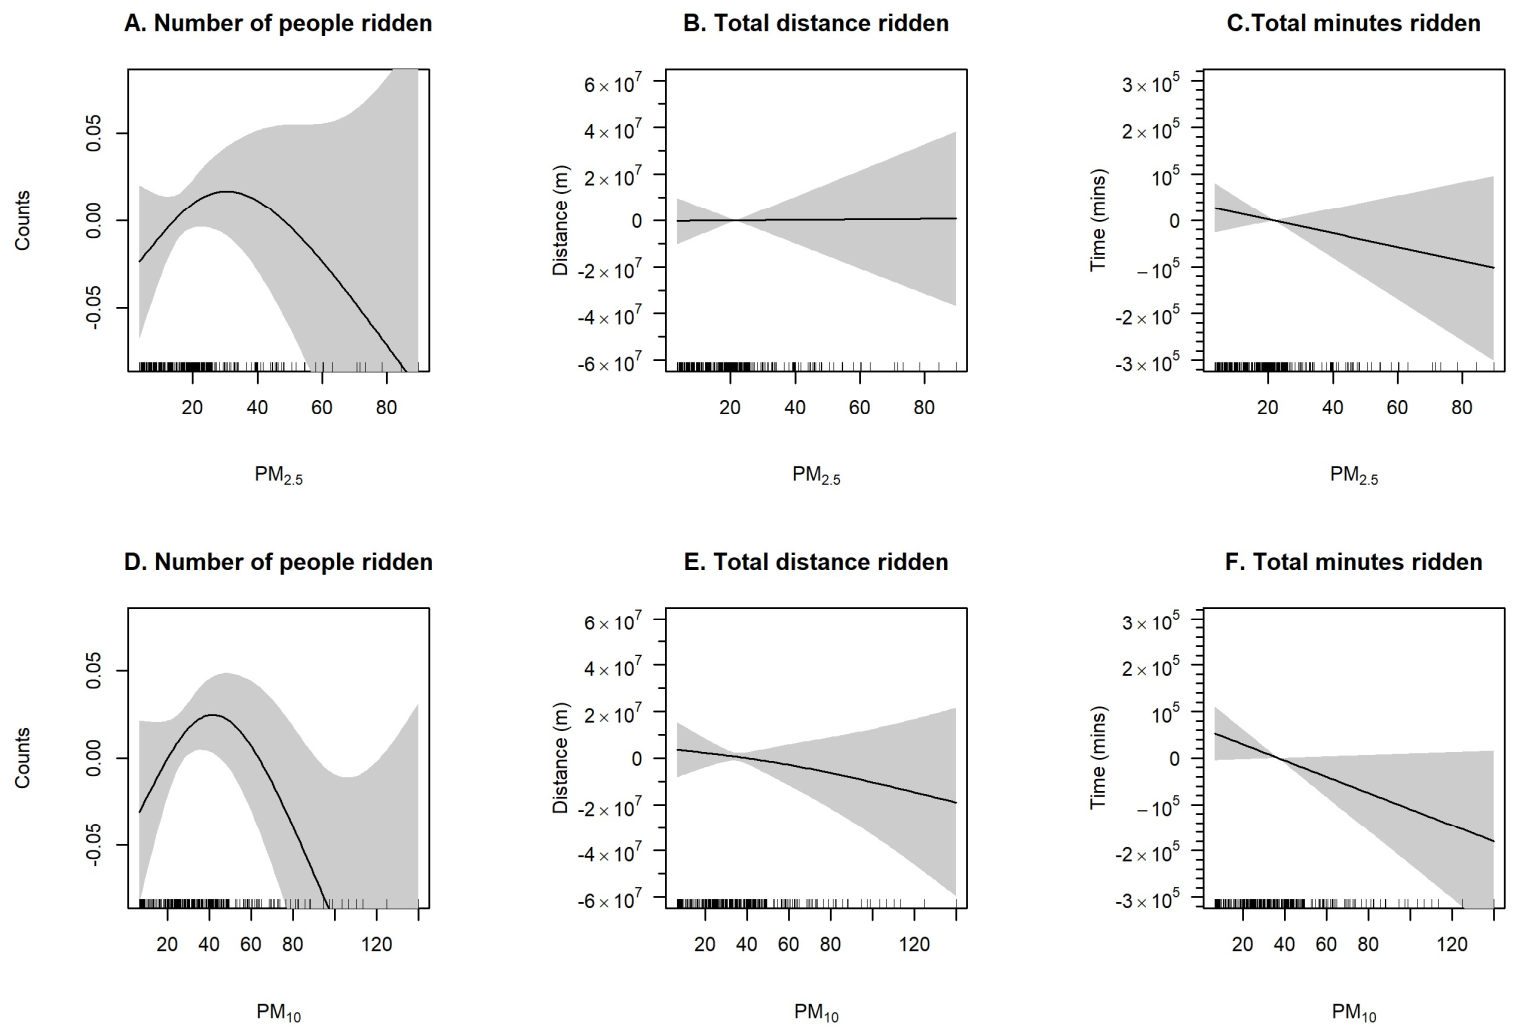
The results of the GAMs showed a nonlinear relationship of the PM with the daily number of riders (Figure 4A,D) and total distance (Figure 4B,E), and an almost linear decrease was observed without a threshold for total minutes ridden (Figure 4C,F). We further fitted piecewise linear regressions to estimate the threshold of PM levels where the curve changes from upward to downward. The estimated thresholds were 38 μg/m3 for PM2.5 (Figure S3A) and 52 μg/m3 for PM10 (Figure S3D) for the number of riders, 42 μg/m3 for PM2.5 (Figure S3B) and 60 μg/m3 for PM10 (Figure S3E) for the total distance ridden, and 42 μg/m3 for PM2.5 (Figure S3C) and 60 μg/m3 for PM10 (Figure S3F) for the total time ridden. Above these PM thresholds, ridership presented a nearly linear negative association with increasing PM levels.
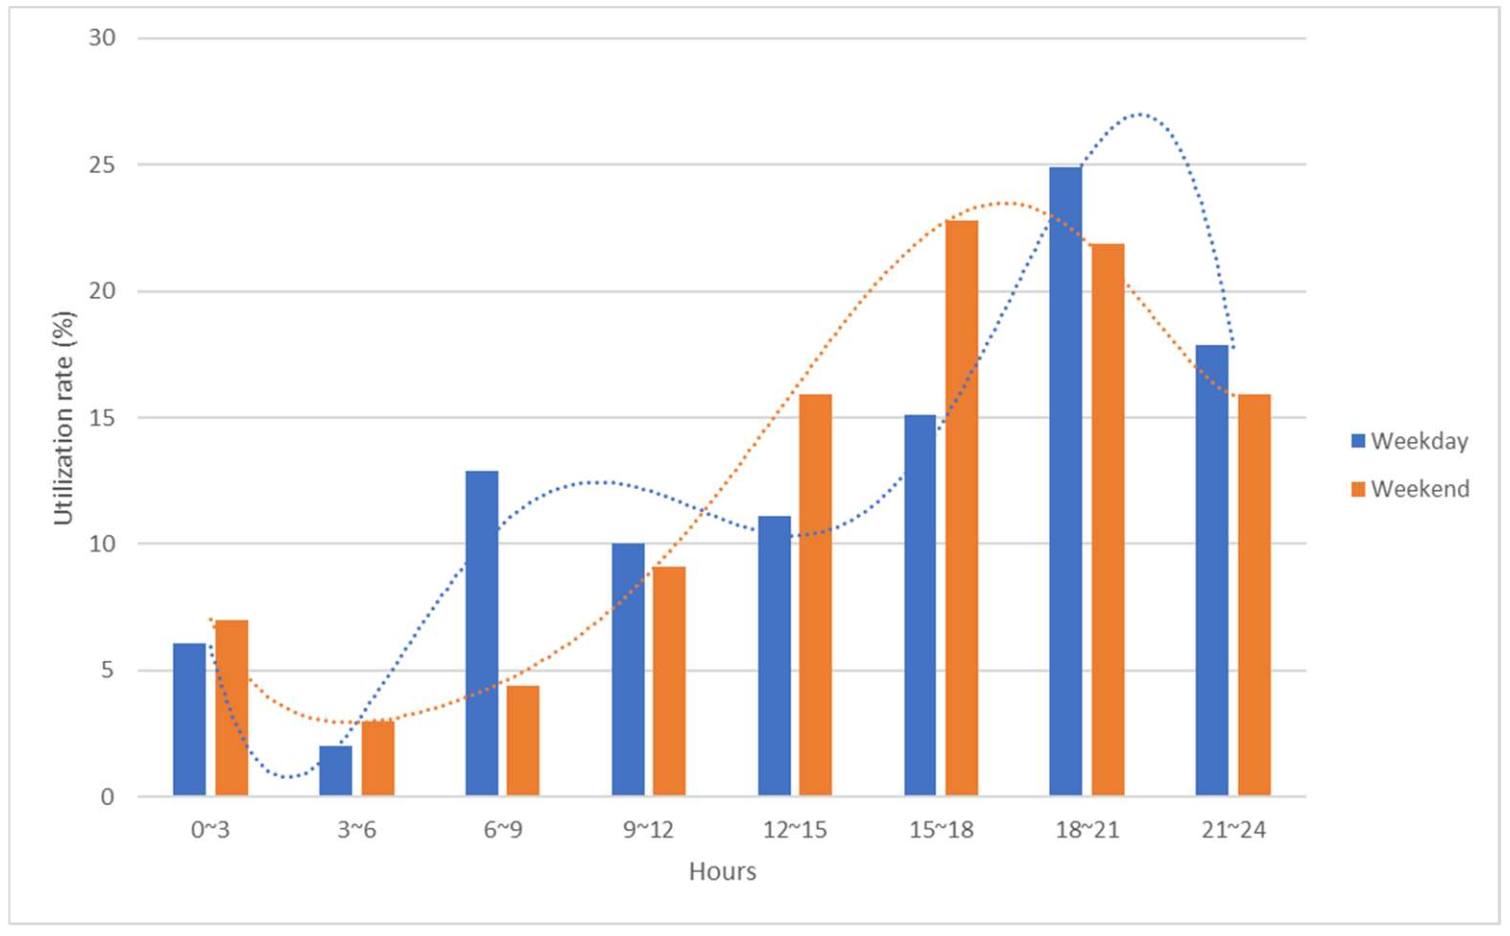
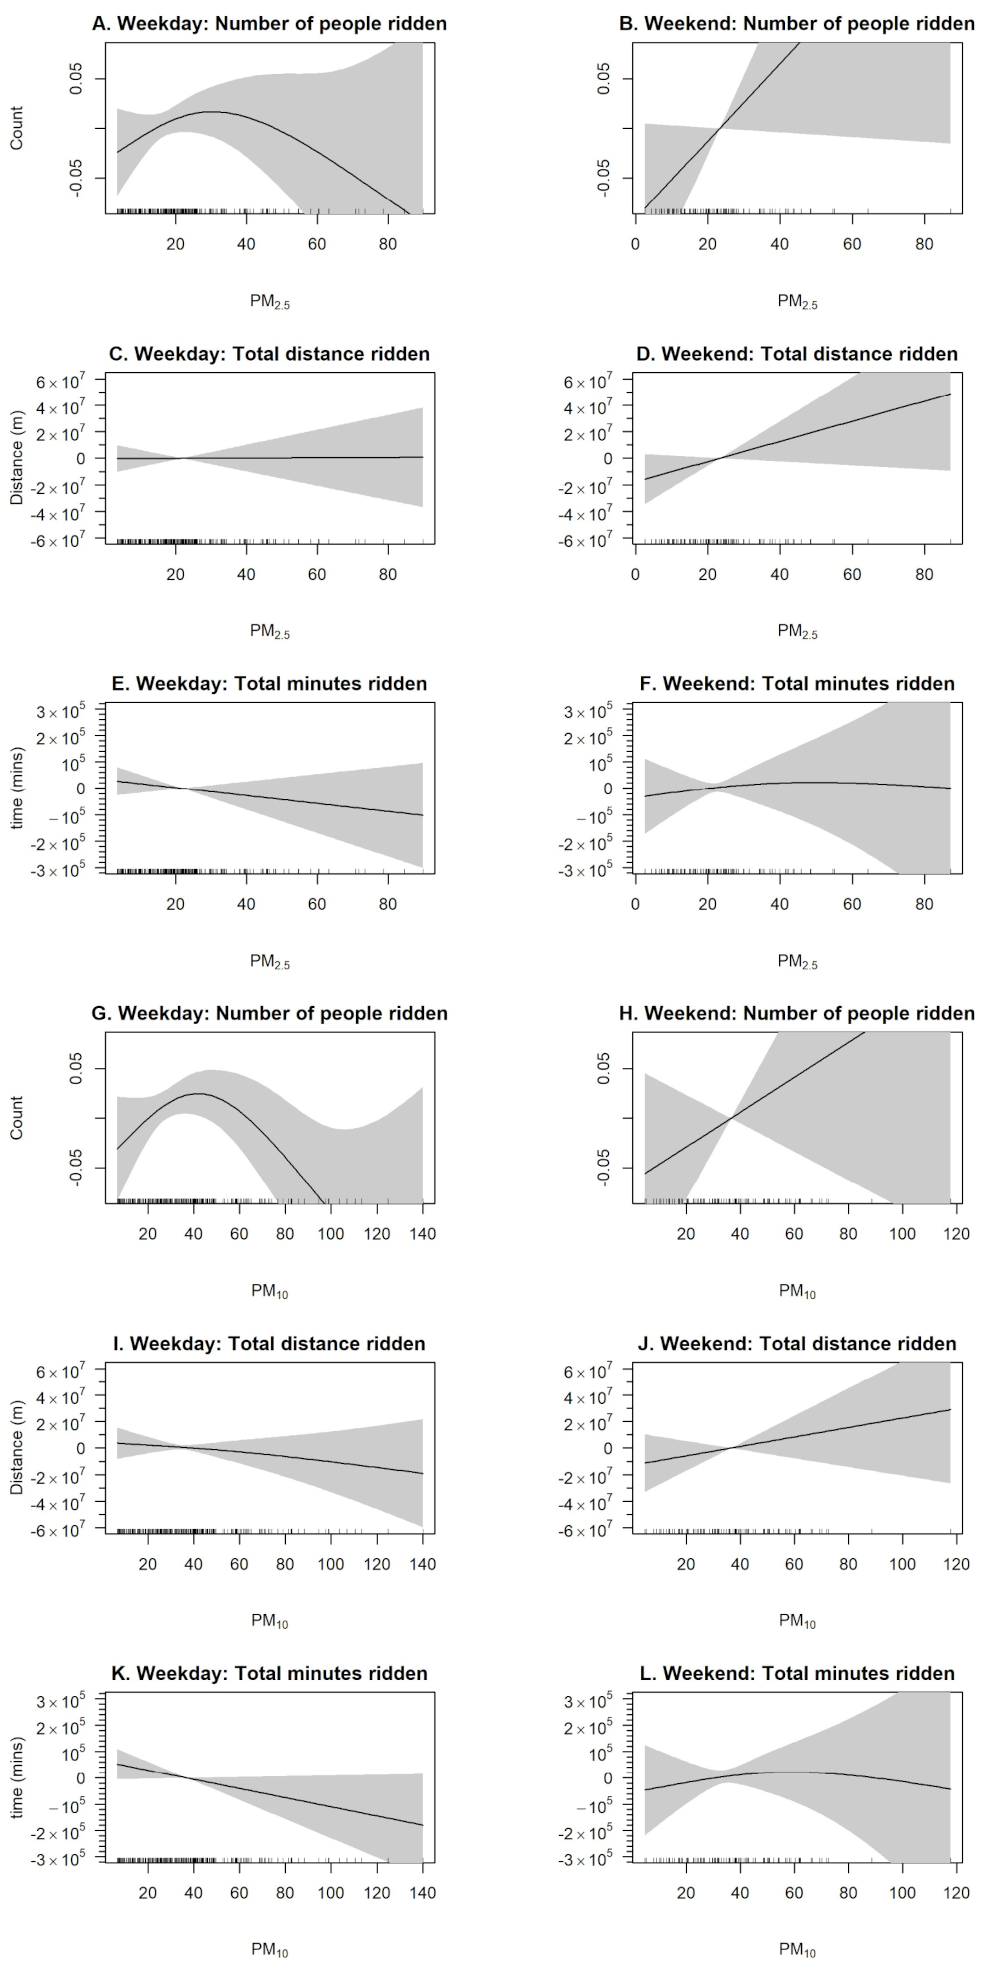
Two clear peaks (6–9 and 18–21) were observed during weekdays, indicating commuting behavior, whereas a single peak (15–18) was observed on weekends (Figure 5). To examine potential variations in the relationship between ridership and air pollution in commuting versus leisure rides, we performed a stratification analysis of weekday versus weekend rides (Figure 6). The exposure–response curves showed the nonlinear pattern with thresholds for weekday ridership (Figure 6A,G), while weekend analyses showed a linear positive association with increasing PM levels for the number of riders (Figure 6B,H). This implies that commuting riders are aware of PM levels, whereas leisure riders are not.
4. Discussion
The BSSs can help protect the environment as they represent a shift toward sustainable mobility by providing an affordable mode of transportation and facilitating the access of citizens to jobs and education, and improving the health of the citizens. However, public air pollution risk awareness and adaptation capacity should be discussed in line with the efforts of the BSSs, which encourage physical activity to improve human health and have adverse health impacts from air pollution exposure at the same time.
We investigated the relationship between participation in the BSS and ambient air pollution in a metropolitan area utilizing Big Data. We identified the impacts of air pollution in addition to weather conditions on ridership using a data-driven nonparametric time-series model, accounting for the nonlinearity of the relationship rather than a model-driven analysis. The model used in this study successfully controls the weather conditions, seasonal impacts, and long-term trends. Moreover, the ability of this model to handle nonlinear data structures can aid in the development of models that better represent the underlying data and, hence, increase our understanding of the BSSs. We observed nonlinear relationships with a threshold between ambient air pollution level and both the number of riders and total distance ridden. Moreover, we conducted stratified analyses of weekday versus weekend rides to identify if the exposure–response relationship differed based on commuting versus leisure rides. The results indicate that citizens of Seoul well utilize the BSS, and air pollution risk-averting behavior was observed for commuting riders. However, when leisure activities are more common on weekends, ridership tends to increase as air pollution levels increase. Previous studies indicate that perceptions of air quality and frequent access to air quality reports lead to unwarranted behavioral shifts [40]. An automated air pollution warning system was established in 2017 in Seoul, informing citizens within 7 minutes when the concentration of pollutants is higher than the specified standard (Table S4 and Figure S4). Citizens attempt to make a reasonable judgment based on factors such as the air pollutant monitoring system, health warning system, and risk perception. Although promoting behavioral changes in favor of emission-free vehicles and active modes of transport is beneficial for environmental and health effects, exposure to air pollution should also be considered.
The targets presented by the SDGs are highly interrelated and densely structured. Achieving some of these goals and targets simultaneously requires extra effort to manage their associations so that they become synergies instead of zero-sum games. Moreover, there is a lack of formal platforms that specify the relationships between the SDGs. Therefore, further research on BSS should be conducted on the link between policies and the related environmental, social, and health aspects of SDGs to clarify the best ways to achieve the goals for analyzing goals in an integrated manner to establish concrete targets, maximize synergies, and remove trade-offs for better policy coherence. Accordingly, it is important to ensure that the performance of each goal leads to an integrated policy that does not create losses in other fields.
We acknowledge several limitations. First, the study was conducted in a single city, so the results need to be interpreted cautiously as our findings may not be applicable to other areas. Second, we did not include the accidental risk or road congestion because of the unavailability of the data, both of which may considerably affect the ridership. Future research should consider incorporating these issues into the analysis.
5. Conclusions
This study conducted time-series analyses (2017–2019) of the associations between particulate matter (PM10 and PM2.5) and BSS ridership in Seoul, South Korea. We found nonlinear relationships with thresholds between PM concentration levels and BSS ridership. We also detected the air pollution risk-averting behaviors for commuting riders, whereas not for leisure riders. The method employed in this study and its applicability can be applied to investigate similar studies in cities that use a BSS to facilitate a sophisticated analysis and can be extended to other areas to aid in policymaking and determine the actions and strategies needed to achieve SDGs.
Supplementary Materials
The following supporting information can be downloaded at https://0-www-mdpi-com.brum.beds.ac.uk/article/10.3390/su14073861/s1: Table S1: Sustainable Development Goals (SDGs) of the United Nations and of South Korea (K-SDGs); Table S2: Air pollutant emission inventory by road vehicles in South Korea; Table S3: WHO Global air quality guidelines; Table S4: Annual statistics of particulate matter early-warning system during the study period in Seoul, South Korea; Figure S1: Stations and bicycle roads of bike-sharing system in Seoul, South Korea; Figure S2: Rental process of the bike-sharing system; Figure S3: Exposure–response relationship with piecewise linear regression analysis to estimate the threshold of PM level using a grid search method with the minimum Akaike information criterion. Figure S4: Air pollution warning system in Seoul, South Korea.
Author Contributions
Conceptualization, J.P.; methodology, J.P. and S.E.K.; formal analysis, J.P. and S.E.K.; data curation, J.P.; writing—original draft preparation, J.P.; writing—review and editing, S.E.K., Y.H., S.F.; supervision, Y.H. and S.E.K.; project administration, S.E.K.; funding acquisition, S.E.K. All authors have read and agreed to the published version of the manuscript.
Funding
The authors acknowledge the “Support for continued research and return to make career-building compatible with childcare and nursing care project for 2020” funded by the Center for Diversity, Accessibility and Career Development, University of Tsukuba and the JSPS Grants-in-Aid for Scientific Research (KAKENHI; 21K17894) in Japan.
Institutional Review Board Statement
This study used only data from public databases. No animals or human subjects were utilized in the study and therefore no institutional approval (IRB) was obtained.
Informed Consent Statement
Not applicable.
Data Availability Statement
The BSS data are publicly available from Open Data Plaza, https://data.seoul.go.kr/ (accessed on 26 February 2022).
Conflicts of Interest
The authors declare no conflict of interest. The funding body had no role in the design of the study, in the collection, analyses, or interpretation of data, in the writing of the manuscript, or in the decision to publish the results.
References
- Spencer, J. The sustainable development goals. In Design for Global Challenges and Goals; Series: Design for Social Responsibility; Routledge: Abingdon, UK; New York, NY, USA, 2021; pp. 12–25. ISBN 9781000356700. [Google Scholar]
- United Nations. Sustainable Development Goals. Available online: https://unric.org/en/united-nations-sustainable-development-goals/ (accessed on 26 February 2022).
- Ministry of the Environment. Sustainable Development Portal, Korean Sustainable Development Goals. Available online: http://ncsd.go.kr/ksdgs?content=3 (accessed on 26 February 2022).
- Korean Statistical Information Service (KOSIS). Population Census: Commuting Rate; Satistics of Korea: Daejeon, Korea, 2020; Available online: https://kosis.kr/statHtml/statHtml.do?orgId=101&tblId=DT_1PA2004&conn_path=I2 (accessed on 26 February 2022).
- KOTI. Paradigm Change in Traffic Congestion Cost Estimation and Traffic Congestion Cost Estimation Results in 2017; Korea Transport Institute: Sejong, Korea, 2020; Volume 267. (In Korean) [Google Scholar]
- National Air Emission Inventory and Research Center. Clean Air Policy Support System, Air Pollutant Emission Statistics; National Air Emission Inventory and Research Center: Cheongju-si, Korea, 2019. [Google Scholar]
- Giles-Corti, B.; Lowe, M.; Arundel, J. Achieving the SDGs: Evaluating indicators to be used to benchmark and monitor progress towards creating healthy and sustainable cities. Health Policy 2020, 124, 581–590. [Google Scholar] [CrossRef] [PubMed]
- Qiu, L.Y.; He, L.Y. Bike sharing and the economy, the environment, and health-related externalities. Sustainability 2018, 10, 1145. [Google Scholar] [CrossRef] [Green Version]
- Pan American Health Organization. Bicycle-Sharing Systems across the United States of America; Organización Panamericana de la Salud: Washington, DC, USA, 2020; ISBN 9789275122143. [Google Scholar]
- Pucher, J.; Buehler, R. Transport Reviews Making Cycling Irresistible: Lessons from The Netherlands, Denmark and Germany. Transp. Rev. 2008, 28, 495–528. [Google Scholar] [CrossRef]
- Shaheen, S.A.; Zhang, H.; Martin, E.; Guzman, S. China’s Hangzhou public bicycle. Transp. Res. Rec. J. Transp. Res. Board 2011, 2247, 33–41. [Google Scholar] [CrossRef] [Green Version]
- Carreira, R. End user involvement in the big data based service development process. In Marketing and Smart Technologies. Smart Innovation, Systems and Technologies; Rocha, Á., Reis, J., Peter, M., Bogdanović, Z., Eds.; Springer: Singapore, 2020; Volume 167, pp. 321–329. ISBN 9789811515637. [Google Scholar]
- Marquart, H.; Schlink, U.; Ueberham, M. The planned and the perceived city: A comparison of cyclists’ and decision-makers’ views on cycling quality. J. Transp. Geogr. 2020, 82, 102602. [Google Scholar] [CrossRef]
- Caravaggi, L.; Imbroglini, C.; Lei, A. Rome’s GRAB—Great Bicycle Ring Route—As Complex Landscape Infrastructure. Sustainability 2022, 14, 1023. [Google Scholar] [CrossRef]
- Oja, P.; Titze, S.; Bauman, A.; de Geus, B.; Krenn, P.; Reger-Nash, B.; Kohlberger, T. Health benefits of cycling: A systematic review. Scand. J. Med. Sci. Sports 2011, 21, 496–509. [Google Scholar] [CrossRef] [PubMed]
- World Health Organization (WHO). Ambient (Outdoor) Air Quality and Health. 2021. Available online: https://www.who.int/news-room/fact-sheets/detail/ambient-(outdoor)-air-quality-and-health (accessed on 25 December 2021).
- Raza, W.; Forsberg, B.; Johansson, C.; Sommar, J.N. Air pollution as a risk factor in health impact assessments of a travel mode shift towards cycling. Glob. Health Action 2018, 11, 1429081. [Google Scholar] [CrossRef] [Green Version]
- Engström, E.; Forsberg, B. Health impacts of active commuters’ exposure to traffic-related air pollution in Stockholm, Sweden. J. Transp. Health 2019, 14, 100601. [Google Scholar] [CrossRef]
- Tainio, M.; De Nazelle, A.J.; Götschi, T.; Kahlmeier, S.; Rojas-Rueda, D.; Nieuwenhuijsen, M.J.; De Sá, T.H.; Kelly, P.; Woodcock, J. Can air pollution negate the health benefits of cycling and walking? Prev. Med. 2016, 87, 233–236. [Google Scholar] [CrossRef] [Green Version]
- De Hartog, J.J.; Boogaard, H.; Nijland, H.; Hoek, G. Do the health benefits of cycling outweigh the risks? Environ. Health Perspect. 2010, 118, 1109–1116. [Google Scholar] [CrossRef]
- Korean Statistical Information Service (KOSIS). Population Sensus: Population Statistics; Statistics of Korea: Daejeon, Korea, 2020; Available online: https://kosis.kr/statHtml/statHtml.do?orgId=101&tblId=DT_1IN1502&conn_path=I2 (accessed on 25 December 2021).
- Ha, S.; Liu, D.; Zhu, Y.; Kim, S.S.; Sherman, S.; Grantz, K.L.; Mendola, P. Ambient temperature and stillbirth: A multi-center retrospective cohort study. Environ. Health Perspect. 2017, 125, 1–7. [Google Scholar] [CrossRef]
- World Health Organization & WHO European Centre for Environment. WHO Global Air Quality Guidelines: Particulate Matter (PM2.5 and PM10), Ozone, Nitrogen Dioxide, Sulfur Dioxide and Carbon Monoxide; World Health Organization: Geneva, Switzerland, 2021; ISBN 9240034226. [Google Scholar]
- World Health Organization. Air Quality Guidelines for Particulate Matter, Ozone, Nitrogen Dioxide and Sulphur Dioxide. Global Update 2005; World Health Organization: Geneva, Switzerland, 2006. [Google Scholar]
- Mispelon, C. ECF Cycling Barometer 2015; European Cyclists’ Federation: Brussels, Belgium, 2015. [Google Scholar]
- Han, B.S.; Park, K.; Kwak, K.H.; Park, S.B.; Jin, H.G.; Moon, S.; Kim, J.W.; Baik, J.J. Air quality change in Seoul, South Korea under COVID-19 social distancing: Focusing on PM2.5. Int. J. Environ. Res. Public Health 2020, 17, 6208. [Google Scholar] [CrossRef]
- Han, C.; Hong, Y.C. Decrease in ambient fine particulate matter during COVID-19 crisis and corresponding health benefits in Seoul, Korea. Int. J. Environ. Res. Public Health 2020, 17, 5279. [Google Scholar] [CrossRef]
- Ando, T.; Sato, T.; Hashimoto, N.; Tran, Y.; Konishi, N.; Takeda, Y.; Akamatsu, M. Variability in human mobility during the third wave of COVID-19 in Japan. Sustainability 2021, 13, 13131. [Google Scholar] [CrossRef]
- Dominici, F.; McDermott, A.; Zeger, S.L.; Samet, J.M. On the use of generalized additive models in time-series studies of air pollution and health. Am. J. Epidemiol. 2002, 156, 193–203. [Google Scholar] [CrossRef] [PubMed]
- Kim, S.E.; Honda, Y.; Hashizume, M.; Kan, H.; Lim, Y.-H.; Lee, H.; Kim, C.T.; Yi, S.-M.; Kim, H. Seasonal analysis of the short-term effects of air pollution on daily mortality in Northeast Asia. Sci. Total Environ. 2017, 576, 850–857. [Google Scholar] [CrossRef]
- Kim, K. Investigation on the effects of weather and calendar events on bike-sharing according to the trip patterns of bike rentals of stations. J. Transp. Geogr. 2018, 66, 309–320. [Google Scholar] [CrossRef]
- Kim, H. Seasonal impacts of particulate matter levels on bike sharing in Seoul, South Korea. Int. J. Environ. Res. Public Health 2020, 17, 3999. [Google Scholar] [CrossRef]
- Kim, S.E.; Lim, Y.-H.; Kim, H. Temperature modifies the association between particulate air pollution and mortality: A multi-city study in South Korea. Sci. Total Environ. 2015, 524–525, 376–383. [Google Scholar] [CrossRef]
- Kim, S.U.; Kim, K.Y. Physical and chemical mechanisms of the daily-to-seasonal variation of PM10 in Korea. Sci. Total Environ. 2020, 712, 136429. [Google Scholar] [CrossRef] [PubMed]
- Park, I.-S.; Kim, S.-H.; Jang, Y.W.; Park, M.-S.; Lee, J.; Owen, J.S.; Cho, C.-R.; Jee, J.-B.; Chae, J.-H.; Kang, M. Meteorological Characteristics during Periods of Greatly Reduced PM2.5 Concentrations in March 2020 in Seoul. Aerosol Air Qual. Res. 2021, 21, 200512. [Google Scholar] [CrossRef]
- Lee, D.; Choi, J.-Y.; Myoung, J.; Kim, O.; Park, J.; Shin, H.-J.; Ban, S.-J.; Park, H.-J.; Nam, K.-P. Analysis of a Severe PM 2.5 Episode in the Seoul Metropolitan Area in South Korea from 27 February to 7 March 2019: Focused on Estimation of Domestic and Foreign Contribution. Atmosphere 2019, 10, 756. [Google Scholar] [CrossRef] [Green Version]
- Oh, H.R.; Ho, C.H.; Koo, Y.S.; Baek, K.G.; Yun, H.Y.; Hur, S.K.; Choi, D.R.; Jhun, J.G.; Shim, J.S. Impact of Chinese air pollutants on a record-breaking PMs episode in the Republic of Korea for 11–15 January 2019. Atmos. Environ. 2020, 223, 117262. [Google Scholar] [CrossRef]
- Kim, H.; Zhang, Q.; Sun, Y. Measurement report: Characterization of severe spring haze episodes and influences of long-range transport in the seoul metropolitan area in March 2019. Atmos. Chem. Phys. 2020, 20, 11527–11550. [Google Scholar] [CrossRef]
- Park, D.H.; Kim, S.W.; Kim, M.H.; Yeo, H.; Park, S.S.; Nishizawa, T.; Shimizu, A.; Kim, C.H. Impacts of local versus long-range transported aerosols on PM10 concentrations in Seoul, Korea: An estimate based on 11-year PM10 and lidar observations. Sci. Total Environ. 2021, 750, 141739. [Google Scholar] [CrossRef] [PubMed]
- Neidell, M. Air quality warnings and outdoor activities: Evidence from Southern California using a regression discontinuity design. J. Epidemiol. Community Health 2010, 64, 921–926. [Google Scholar] [CrossRef] [PubMed]
Figure 1.
Bicycle docking stations (blue dots) in Seoul, South Korea.

Figure 2.
Monthly average (January 2017–December 2019) of daily (A) number of riders, (B) total distance ridden (m), and (C) total time ridden (mins) in Seoul (source: Open Data Plaza, https://data.seoul.go.kr/, accessed on 26 February 2022).
Figure 2.
Monthly average (January 2017–December 2019) of daily (A) number of riders, (B) total distance ridden (m), and (C) total time ridden (mins) in Seoul (source: Open Data Plaza, https://data.seoul.go.kr/, accessed on 26 February 2022).

Figure 3.
Particulate matter and meteorological data. Daily time-series from January 2017 to December 2019 in Seoul: (A) mean PM2.5 concentration, (B) mean PM10 concentration, (C) mean temperature, (D) total rainfall, and (E) mean relative humidity.
Figure 3.
Particulate matter and meteorological data. Daily time-series from January 2017 to December 2019 in Seoul: (A) mean PM2.5 concentration, (B) mean PM10 concentration, (C) mean temperature, (D) total rainfall, and (E) mean relative humidity.

Figure 4.
Exposure–response relationship between (A) daily number of riders and mean PM2.5 concentration, (B) total distance ridden (m) and mean PM2.5 concentration, (C) total time ridden (mins) and mean PM2.5 concentration, (D) daily number of riders and mean PM10 concentration, (E) total distance ridden (m) and mean PM10 concentration, and (F) total time ridden (mins) and mean PM10 concentration. Marks on the x-axis are observed data points, the y-axis represents the partial effect of each variable, and shaded areas indicate 95% confidence intervals.

Figure 5.
Hourly behavior of the BSS in weekdays and weekends.

Figure 6.
Weekday and weekend exposure–response relationship. Marks on x-axis are observed data points, y-axis represents the partial effect of each variable, and shaded areas indicate 95% confidence intervals. Exposure–response relationship between (A) number of people ridden and mean PM2.5 concentration on weekdays; (B) number of people ridden and mean PM2.5 concentration on weekends; (C) total distance ridden and mean PM2.5 concentration on weekdays; (D) total distance ridden and mean PM2.5 concentration on weekends; (E) total minutes ridden and mean PM2.5 concentration on weekdays; (F) total minutes ridden and mean PM2.5 concentration on weekends; (G) number of people ridden and mean PM10 concentration on weekdays; (H) number of people ridden and mean PM10 concentration on weekends; (I) total distance ridden and mean PM10 concentration on weekdays; (J) total distance ridden and mean PM10 concentration on weekends; (K) total minutes ridden and mean PM10 concentration on weekdays; (L) total minutes ridden and mean PM10 concentration on weekends.


Table 1.
Annual statistics of the BSS in Seoul (in thousand).
| BSS | 2015 1 | 2016 | 2017 | 2018 | 2019 |
|---|---|---|---|---|---|
| Registered members (cumulative) | 34 | 211 | 598 | 1094 | 1740 |
| Number of bicycles (cumulative) | 1 | 6 | 16 | 20 | 25 |
| Total number of rides | 114 | 1612 | 5031 | 10,062 | 19,075 |
| Average number of daily rides | 1 | 4 | 14 | 28 | 54 |
1 Started in September.
Publisher’s Note: MDPI stays neutral with regard to jurisdictional claims in published maps and institutional affiliations. |
© 2022 by the authors. Licensee MDPI, Basel, Switzerland. This article is an open access article distributed under the terms and conditions of the Creative Commons Attribution (CC BY) license (https://creativecommons.org/licenses/by/4.0/).
Share and Cite
MDPI and ACS Style
Park, J.; Honda, Y.; Fujii, S.; Kim, S.E. Air Pollution and Public Bike-Sharing System Ridership in the Context of Sustainable Development Goals. Sustainability 2022, 14, 3861. https://0-doi-org.brum.beds.ac.uk/10.3390/su14073861
AMA Style
Park J, Honda Y, Fujii S, Kim SE. Air Pollution and Public Bike-Sharing System Ridership in the Context of Sustainable Development Goals. Sustainability. 2022; 14(7):3861. https://0-doi-org.brum.beds.ac.uk/10.3390/su14073861
Chicago/Turabian StylePark, Jooho, Yasushi Honda, Sayaka Fujii, and Satbyul Estella Kim. 2022. "Air Pollution and Public Bike-Sharing System Ridership in the Context of Sustainable Development Goals" Sustainability 14, no. 7: 3861. https://0-doi-org.brum.beds.ac.uk/10.3390/su14073861
Note that from the first issue of 2016, this journal uses article numbers instead of page numbers. See further details here.