Article

Fish Feeds in Aquaponics and Beyond: A Novel Concept to Evaluate Protein Sources in Diets for Circular Multitrophic Food Production Systems

1
Department of Fish Biology, Fisheries and Aquaculture, Leibniz Institute of Freshwater Ecology and Inland Fisheries, Müggelseedamm 310, 12587 Berlin, Germany
2
Thaer Institute of Agricultural and Horticultural Sciences, Faculty of Life Sciences, Humboldt University Berlin, 10115 Berlin, Germany
3
Institute of Biology, Faculty of Life Sciences, Humboldt University Berlin, 10117 Berlin, Germany
*
Author to whom correspondence should be addressed.
Sustainability 2022, 14(7), 4064; https://0-doi-org.brum.beds.ac.uk/10.3390/su14074064
Submission received: 21 February 2022 / Revised: 24 March 2022 / Accepted: 25 March 2022 / Published: 29 March 2022

Abstract

:
With the general objective of optimizing internal nutrient recycling, circular multitrophic food production systems, e.g., combining fish, plant, and insect larvae production, rely on the quality and composition of sustainable nutritional inputs. Therefore, differences in dissolved and solid nutrient excretion patterns produced by Nile tilapia (Oreochromis niloticus) reared in recirculating aquaculture systems (RAS) with 5% daily water exchange and fed black soldier fly meal (BSFM), poultry by-product meal (PM), poultry blood meal (PBM) and fish meal (FM) as single protein sources were investigated to evaluate the potential for creating specific fish meal-free diets. Fish fed the FM and PM diet showed the significantly best (p < 0.05) and among each other similar (p > 0.05) growth performance (specific growth rate (SGR): 2.12 ± 0.04/2.05 ± 0.11; feed conversion ratio (FCR): 0.86 ± 0.03/0.92 ± 0.01), whereas the PBM diet caused significantly reduced performance (SGR: 1.30 ± 0.02; FCR: 1.79 ± 0.05) in comparison to the FM/PM diet as well as the BSF diet (SGR: 1.76 ± 0.07; FCR: 1.11 ± 0.05). The FM and PM diet resulted in a faster increase and significantly higher dissolved nitrogen and phosphorus levels, while the BSF diet caused faster accumulation and significantly elevated levels of dissolved potassium, magnesium, and copper. The PBM diet resulted in the feces with the significantly highest nutrient density (gross energy, crude protein, and amino acids) but overall much lower dissolved nutrient levels in the water. Results are discussed with regard to implications for developing circular multitrophic food production systems.

1. Introduction

Due to its rapid growth throughout the last decades and the associated challenges of achieving sustainability, the aquaculture industry increasingly had and has to focus on more responsible resource use and the reduction in environmental and ecological impacts [1,2,3,4,5]. With respect to feed formulations, efforts are ongoing to create more digestible, species-specific diets with high nutrient density to improve fish performance, foster effective nutrient use, and reduce solid and dissolved aquaculture waste production [6,7,8]. At the same time, the inclusion of valuable and finite marine resources in aquaculture feeds has continuously been reduced by replacing them with terrestrial plant and animal sources [2,9,10,11,12]. Recently, Colombo and Turchini [13] presented their vision of an “aquafeed 3.0”, which focuses on the use of promising ingredients made available through the recycling of nutrients. Following the principles of the bio-based economy and the circular bioeconomy, organic resources and biogenic wastes should be assigned to the most valuable use case with energy, heat, and fuels representing the least desirable, whereas the constant cascading and upcycling of such nutrient-rich resources into value-added products such as feeds or eventually even food is preferential [14,15,16]. From the perspective of the aquaculture industry, there are essentially two broad source streams through which such more sustainable aquafeeds could be realized. The first stream comprises feed ingredients upcycled from sector external sources such as terrestrial meat processing by-products, especially from poultry [17,18,19,20], insect larvae grown on biowastes [21,22,23,24,25], fisheries and seafood processing by-products [26,27,28], or single-celled organisms using waste streams [29,30,31]. The second stream encompasses feed ingredients upcycled from sector internal sources. Aquaculture slaughter waste could play an important role in the future [32,33] and, potentially, the recycling of nutrients from sludge into aquafeed ingredients through insect larvae [34], polychaetes [35,36], or vermicomposting [37,38] may present avenues toward more sustainable aquafeeds.
In addition to the above, the aquaculture industry also attempts to find solutions for more sustainable production forms that adopt principles of circularity. Land-based (indoor) recirculating aquaculture systems (RAS) enable intensive production under controlled conditions with drastically reduced water consumption compared to traditional production forms [39,40]. They further allow the effective collection and subsequent valorization of aquaculture sludge, currently through biogas production or application as agricultural fertilizer [41,42]. The natural extension of RAS is represented by aquaponic systems [43,44,45], which make use of the dissolved nutrients accumulated in the recirculating water of RAS through hydroponic plant production by permanent or on-demand coupling of RAS and hydroponic units [46]. In aquaponics, however, one of the challenges is that commonly available commercial fish feeds by themselves mostly do not provide ideal nutrient profiles required for plant growth [47,48]. Macronutrients such as phosphorus (P), potassium (K), calcium (Ca), and sulfur (S), as well as micronutrients such as iron (Fe), manganese (Mn), zinc (Zn), boron (B), and copper (Cu) often accumulate insufficiently or in inappropriate ratios in the production water [44,49,50,51].
The integration of recirculating aquaculture, aquaponics [43], and insect larvae as promising biowaste converters [21,23] into circular tri-trophic agricultural production systems that specifically combine fish, plant and insect larvae production [52] could present an avenue for maximizing the recycling of nutrients, water and energy and thereby minimizing waste. Hence, the objective of this study is to unite the above concept with the vision of marine resource independent aquafeeds by investigating specific fish meal-free diets using sustainable, readily available, and cheap protein sources as a basis for the interdependently united production of fish, plants, and insects. For this purpose, experimental diets based on black soldier fly larvae meal (BSFM) and by-products from the poultry industry (poultry by-product meal (PM), poultry blood meal (PBM), poultry fat) were formulated as fishmeal-devoid, single protein source diets, and compared to a fish meal-based diet in a RAS feeding trial with Nile tilapia (Oreochromis niloticus). BSFM was chosen as a resource due to its generally suitable nature as a protein source in aquafeeds [53,54,55,56], its potentially integral role as an agent and product of sustainable biowaste valorization [21,23,52,57]. Poultry by-products, also widely accepted as valuable ingredients in commercial fish feeds [17,18,58,59,60], were selected due to their wide availability [61], their status as waste or by-product, and their comparably low cost.
Along these lines, the main research objectives are (1) determination of fish performance when entirely replacing fish meal with the stated raw materials as the sole main protein source in the diet; (2) comparison of dissolved nutrient excretion patterns in low water exchange RAS in order to evaluate the potential for creating specialized aquaponic feeds using these protein sources; (3) evaluation of the produced quantity and nutritional quality of the collected fish feces with regard to their potential as a feed resource for insect larvae such as black soldier fly larvae, which can be reintroduced into fish feeds. Results are discussed and interpreted with respect to their implications in the context of combined fish, plant, and insect production in circular multitrophic systems.

2. Materials and Methods

2.1. Experimental Design

2.1.1. Experimental Diets

Four experimental diets (FM, BSF, PBM, PM) were formulated to be isonitrogenous (40% crude protein) and isocaloric (20 MJ/kg) with a crude fat content of 12%. The diets featured fish meal (FM—positive control), black soldier fly larvae meal (BSFM), poultry blood meal (PBM), and poultry by-product meal (PM) as the single main protein source, respectively. The inclusion levels of corn meal (11%), fish oil (3%), dicalcium phosphate (1.2%), and a vitamin/mineral premix (1%) were kept equal between all four diets. The inclusion levels of the main protein source (37.2–61.6%), wheat bran (19.9–39.4%), and poultry fat (1.4–7.2%) were adjusted between diets to reach the isonitrogenous and isocaloric objective. Diets were formulated and extruded at SPAROS I&D, Olhão, Portugal, (SPAROS) and shipped to the Leibniz Institute of Freshwater Ecology and Inland Fisheries (IGB) in Berlin, Germany, in February of 2021, where they were stored at −20 °C until use. Diet formulation and proximate composition, as well as amino acid and mineral composition, are presented in Table 1 and Table 2.

2.1.2. Experimental System Setup

The experimental system consisted of 16 rectangular glass tanks (L × W × H: 100 × 50 × 40 cm) with an operational water volume of 160 L each. Tanks were designed to represent independent recirculating aquaculture systems (RAS). Each tank was divided into four sections by perforated PVC boards (Figure 1): a fish rearing compartment (64 L), two fixed-bed biofilter compartments (32 L each) equipped with a 10 cm thick filter sponge (1 x PPI 20 + 1 × PPI 30, Schaumstoff-Meister, Straelen, Germany) each and a moving-bed bioreactor (MBBR) compartment (32 L) equipped with Hel-X biocarriers (HXF12KLL, Christian Stöhr, Marktrodach, Germany). Continuous water recirculation was achieved through the help of an air lift transporting the water from the MBBR to the fish rearing compartment. The space in front of the first filter sponge served as sedimentation and collection space for the fish feces. Two air stones provided water aeration as well as the uplift for the biomedia in the MBBR and an aquarium heater 8150 W, Hydor, Castelgomberto, Italy) was used to control water temperature. Artificial lighting for 12 h a day was provided by timer-controlled 29 W LED lamps (5500 K, LEDaquaristik, Hövelhof, Germany). The sides of the glass tanks were entirely opaque black covered to minimize any external visual influence on the fish.
To mature and synchronize the biofilters, tanks were stocked with a separate batch of Nile tilapia one month before the start of the experiment, and fish were fed a standard diet while running the system over a shared pump sump. One day before starting the trial, the entire system was emptied, cleaned, and refilled with pre-heated tap water (26 °C). From this point, each tank was operated separately, i.e., water was only recirculated within the individual tanks with the help of the air lifts. Physico-chemical water parameters were recorded daily during the trial.

2.1.3. Experimental Fish

Mixed-sex Nile tilapia fry bred at the IGB were used for the experiment. Prior to being introduced into the experimental tanks, the fish were reared in a flow-through system at 26 °C, fed a standard tilapia diet, and were size-graded several times in the two months leading up to the experiment in order to ensure homogeneity of sizes. Fish were not fed for 48 h before transfer into experimental tanks. Thirty fish were randomly allocated to each experimental tank. Initial body weight, total length, and biomass did not significantly differ between treatments.

2.1.4. Experimental Procedure and Sampling

Each dietary treatment was replicated in four randomly defined tanks (n = 4), and the total trial duration was 49 days. Fish were reared under a photoperiod regime of 12 h light:12 h darkness. Dead fish were removed from the tanks, and mortality was recorded. At the end of the experiment, fish were again weighed and measured individually.
From day two of the trial, fish were hand-fed twice per day. During the first week, the daily feed ration per tank was continuously increased from 0% to 2.5% of the initial mean biomass (day 1) of all 16 tanks in order to slowly adapt the fish to the new diets. At the end of the second and the fourth week, fish were batch weighed per tank, and the 2.5% daily ration was adjusted to the increase in the mean biomass of all 16 tanks. In total, 509 g of feed were administered per tank.
In order to resemble conditions in intensive RAS facilities, water exchange was set at 5% (8 L) of the system volume per day by manually siphoning the water out of the sedimentation chambers according to beforehand volumetrically defined tank markings before the first feeding event. In order to not alter dissolved nutrient profiles in the system water other than through the differing experimental feeds, no measures were taken to stabilize the pH value as would otherwise be performed in normal RAS operation to counteract metabolically induced water acidification. The removed water was replaced by pre-heated (26 °C) tap water. By siphoning the water from the tanks, all feces accumulating in the sedimentation chamber was removed as well and filtered through 90 µm nylon mesh (07-90/30, Sefar, Switzerland). Feces were collected daily and frozen at −80 °C. Total cumulative feces wet weight over the entire duration of the experiment was recorded per tank.
Oxygen, pH, temperature (HQ40d, Hach Lange, Düsseldorf, Germany), and electrical conductivity (pH/Cond 740i, WTW, Weilheim, Germany) were measured once daily before feeding and water exchange in the rearing compartment of the tanks. The pH and oxygen probes were calibrated weekly. Water samples for analysis of dissolved nutrients were taken from the rearing compartment of each tank on a weekly basis starting from day 1 of the trial, while, additionally, the exchange water (i.e., pre-heated tap water) was sampled in the first, fourth, and last week. The trial was conducted at the IGB in Berlin, Germany, from February until April 2021.

2.2. Sample Preparation and Chemical Analysis

2.2.1. Water Samples

Water samples (15 mL) were filtered (0.45 µm, Sartorius, Göttingen, Germany), fixed with 150 µL 2M HCl. NH4+-N, NO2-N, NO3-N, presented partly as total inorganic nitrogen (TIN) throughout this paper, and PO4-P (soluble reactive phosphorus—SRP) were measured using continuous flow analysis (CFA) (FSR Seal High-Resolution AA3 chemical analyzer, Seal Analytical, Norderstedt, Germany). B, Na, Mg, Si, S, K, Ca, Mn, Fe, Cu, and Zn were determined by inductively coupled plasma optical emission spectrometry (ICP-OES) (iCAP 7400 ICP-OES, Thermo Fisher Scientific, Voltam, MA, USA) [67].

2.2.2. Diets and Feces

Experimental diets and feces were analyzed for proximate composition, i.e., dry matter (DM), crude protein (CP), crude fat (CF), crude fiber (CFB), starch, ash, and essential and non-essential amino acid composition at the accredited laboratory SGS Analytics Germany (Augsburg, Germany) according to official standard methods [68,69,70,71]. For the proximate composition of the feed, the Kjeldahl method [69] was used to determine CP content, while the CP content of the feces was determined with the Dumas method [68]. For CP recovery calculations, feed CP content was further also determined with the Dumas method.
Diets and feces were further analyzed for mineral composition. Prior to analysis, samples were freeze-dried, homogenized in a mortar under liquid nitrogen, and there-after again freeze-dried until a constant weight was achieved. For elemental analysis, 150 mg of dry sample were first microwave-digested in aqua regia according to DIN EN 16174 [72] with a ratio of HCL to HNO3 of 1:3 and were then analyzed for B, Na, Mg, Al, Si, P, S, K, Ca, Mn, Fe, Cu, and Zn according to DIN EN ISO 11885 [67] by inductively coupled plasma optical emission spectrometry (ICP-OES) (iCAP 7400 ICP-OES, Thermo Fisher Scientific, Voltam, MA, USA).

2.3. Calculations

2.3.1. Proximate Composition

Nitrogen-free extract (NFE), gross energy (GE), and protein-to-energy ratio (P/E ratio) of the diets as well as the feces were calculated according to the analytically determined proximate components. The specific calculations are given as footnotes under the respective tables.

2.3.2. Fish Performance Indices

Fish performance indices considered included body weight gain (BWG), total length gain (TLG), feed conversion ratio (FCR), specific growth rate (SGR), condition factor (CF), protein efficiency ratio (PER), and thermal growth coefficient (TGC). To adjust for the distorting effect of mortality between tanks, FCR and PER were calculated on the basis of the average total amount of feed each individual remaining at the end of the trial has received, i.e., the sum of the average daily individual feed ration. The specific calculations are given as footnotes under the respective table.

2.3.3. Recovery of Dry Matter, Macronutrients, and Energy through Feces Collection

Recovery of DM, macronutrients (proximate components), and GE through the feces is expressed as the percentage of the respective component recovered in the feces throughout the duration of the entire trial. This is further expressed as recovery per kg of feed (as fed).

2.3.4. Feed Costs

Ingredient costs are based solely on the ingredient prices paid by SPAROS and thus exclude production, shipping, handling, and any other transaction costs. It should be noted that these prices may not be an accurate reflection of actual raw material prices of large volume orders. With this said, feed ingredient costs are calculated as € per kg of body weight gain.

2.4. Statistical Analysis

All data are presented as mean ± standard deviation. Differences in the means between treatments were determined by one-way analysis of variance (ANOVA) followed by a Bonferroni post-hoc test for multiple comparisons or, in case of a significant Leven’s test, a Games–Howell post-hoc test. Statistical significance was set at p < 0.05. All statistical analyses were performed using IBM SPSS.

3. Results

3.1. Feed—Amino Acid and Mineral Composition

Results for the amino acid composition as well as the mineral composition of the experimental diets are compiled in Table 2 and compared to requirements from the literature. Most notably, methionine content was below the requirement for young Nile tilapia in the BSF and the PBM diet, and similarly, the sum of methionine and cysteine was close to or below the cited requirement for these two diets. Furthermore, the BSF diet showed perhaps a slight insufficiency in threonine, while tryptophan content in the PM diet barely met the requirement. The content of all other essential amino acids (EAAs) was in the range of or exceeded the values stated in the references used [63,64].
In terms of mineral content, the PBM diet had Ca (5.7 g/kg) and P levels (7.8 g/kg) substantially below published requirements, while Fe content (0.85 g/kg) was considerably higher compared to all other diets. The BSF diet distinguished itself by notably higher K (12.6 g/kg), Mg (3.5 g/kg), Zn (0.15 g/kg), and Mn levels (0.24 g/kg), as well as slightly higher Cu levels (0.02 g/kg) compared to the other three diets, while Na content was highest in the FM (3.3 g/kg) and PM diet (2.8 g/kg). Metal content was in general comparably high in the FM diet, especially with regard to Al (0.25 g/kg), Ti (9 mg/kg), Ni (1.2 mg/kg), and Cd (0.61 mg/kg).

3.2. Fish Rearing and Performance

The daily system water exchange rate of 5% equated to a water exchange of 574 L/kg feed/day at the end of the trial (Table 3). Rearing conditions within and between all treatments were homogeneous within practically achievable limits and well within a satisfactory range for rearing tilapia. However, while temperature and oxygen concentration remained consistent over the entire experiment, the pH decreased, whereas conductivity increased for all treatments. Neither ammonium nor nitrite reached concerning levels in any of the treatments.
From the start, fish vigorously consumed the experimental diets, and diligent hand-feeding ensured all feed was ingested and none entered the adjacent sedimentation chamber. Initial body weight, initial total length, initial biomass as well as survival and condition factor did not significantly differ between diet groups (Table 4). Final body weight and final total length, body weight gain (BWG), and total length gain (LG), as well as thermal growth coefficient (TGC), were highest for fish fed the FM and PM diet and did not significantly differ between these two groups, whereas fish fed the BSF diet showed significantly lower values for these measures compared to the above groups. The lowest values were observed for fish fed the PBM diet, significantly differing from all other diets with respect to the above measures. No difference was found for the final biomass between FM, BSF, and PM, whereas PBM showed a significantly lower final biomass than all other diets. As feed amounts were kept equal between treatments and PBM fed fish exhibited the slowest growth rates, this is inversely reflected by fish of this treatment having received the significantly highest mean daily ration (MDR) as a percentage of biomass compared to fish from FM, BSF, and PM treatments, which, among each other, showed no significant difference.
On an as-fed as well as DM basis, non-significantly different feed conversion ratios of 0.86/0.79 and 0.92/0.86 were observed for the FM and PM diet, respectively, whereas the BSF diet resulted in significantly higher FCRs (1.11/1.03). FCRs observed for the PBM diet (1.79/1.64) were considerably and significantly higher compared to all other treatments. Similarly, SGR was highest and not significantly different for fish fed the FM and PM diets, whereas fish fed the PBM diet showed the significantly lowest SGR and fish fed the BSF diet taking up middle ground with a significantly lower SGR compared to fish fed the FM/PM diet and a significantly higher SGR than fish fed the PBM diet. Regarding PER, all diets differed significantly with FM resulting in the highest PER followed by PM, BSF, and PBM in that order. Finally, feed ingredient costs, expressed as € per kg of body weight gain, also differed significantly between all diets with PM showing the lowest cost (0.67 €) followed by FM (0.96 €), PBM (1.29 €), and lastly, BSF with the highest cost (2.21 €).

3.3. Water—Dissolved Nutrient Excretion Patterns

3.3.1. Macronutrients

Throughout the entire trial, TIN, SRP, and K concentrations in the RAS water showed fairly consistent upward trends for all diets (Figure 2). For TIN and SRP, the PBM diet clearly resulted in a slower accumulation rate, with mean concentrations being significantly lower at the end of the trial (TIN: 33.8 mg/L; SRP: 1.1 mg/L) compared to the other dietary treatments. On the other hand, mean TIN and SRP concentrations were consistently highest for the PM diet. In weeks 4–7, TIN concentration for the PM diet was significantly higher compared to the other diets. In the final week, the mean TIN concentration of the PM diet was still highest (60.2 mg/L); however, the difference was non-significant compared to the BSF diet with the next lower mean TIN concentration (54.6 mg/L). BSF (54.6 mg/L) and FM (51.9 mg/L) did not show notable differences among each other in the accumulation of TIN. With the exception of weeks 4 and 5, in which differences were significant, mean SRP concentration otherwise remained non-significantly higher for the PM diet in comparison to the FM diet. From week 2 onward, SRP concentration was significantly lower for the BSF diet compared to the FM and PM diet, with mean concentrations of 3.0, 4.3, and 4.7 mg/L at the end of the trial, respectively.
Notably, levels of Mg and especially K increased more swiftly for the BSF diet, with mean concentrations being consistently and significantly higher in comparison to the other diets, reaching 18.3 mg/L Mg and 22.9 mg/L K at the end of the trial. Even though partly significant, differences for Mg and K between the FM, PM, and PBM diets appeared minor, reaching 15.9, 15.0, and 13.9 mg/L Mg and 16.1, 16.1, 15.5 mg/L K at the end of the trial, respectively.
Ca and S did not accumulate in the RAS water for any of the diets, and, considering the entire length of the trial, no meaningful differences between the diets were detected. Taking the measurements for the tap water into account, Ca and S concentrations in the system waters appear to be closely linked to concentrations in the exchange water, although being slightly higher.

3.3.2. Micronutrients

Over the course of the trial, the concentrations of B, Fe, Na, Mn, and Zn did not show an accumulative trend up and above tap water concentrations (Figure 3). Although for Fe and Mn differences in mean concentrations were entirely non-significant between dietary treatments, the FM and PM diets did show significantly, yet in absolute terms marginally, higher Na concentrations compared to BSF and PBM during the last two weeks of the trial with final levels reaching 54.8 and 54.3 mg/L compared to 50.8 and 51.9 mg/L. Closely following exchange water concentrations, even though occasionally showing significant differences between the diets during the second half of the trial, no clearly discernible patterns emerged with respect to B concentrations. Even though Zn showed an upward trend over time for all diets except the PBM diet and the PM and BSF diet reached significantly higher concentrations compared to the PBM and FM diet, overall concentrations also remained at or below tap water values.
Similar to the other micronutrients, Cu levels for the FM, PBM, and PM diet closely followed tap water concentrations and were consistently at or below those levels. However, the BSF diet showed levels higher than in the tap water throughout as well as a noticeably faster increase in Cu concentration with differences being consistently significant from week 2 onward compared to the other diets, finally reaching 0.027 mg/L versus 0.018 mg/L (FM), 0.014 mg/L (PBM), and 0.017 mg/L (PM).

3.4. Feces—Solid Nutrient Excretion Patterns

3.4.1. Proximate Composition and Nutrient Recovery

In terms of proximate composition (Table 5), the results generally show that the feces produced by fish fed the FM and the PM diet were similar to each other on a dry matter basis and, in fact, do not show significant differences regarding any of the proximate components (CP: FM—15.4%/PM—17.2%; CF: FM—2.9%/PM—3.1%; CFB: FM—14.8%/PM—14.3%; ash: FM—21.8%/PM—21.4%; starch: FM—1.5%/PM—1.5%; NFE: FM—45.2%/PM—44%; GE: FM—12.5 MJ/kg/PM—12.8 MJ/kg; P/E ratio: FM—12.3/PM—13.4). Furthermore, the FM and PM feces had the lowest CP content and P/E ratio while having the highest ash and NFE content, the differences each being significant compared to the BSF and PBM feces.
On the other hand, the PBM feces had the highest CP content (53.4%), GE content (18.2 MJ/kg), and P/E ratio (29.4), whereas it is CFB (11.1%) and ash content (6.2%) were the lowest, all differences being significant compared to the other three feces types. The BSF feces took up middle ground with regard to CP content (26.6%), ash (10.5%), and P/E ratio (22.4), however, exhibited a significantly higher CFB (33.9%) and starch content (2.5%) compared to all other feces. A low percentage of DM was made up of starch also for FM (1.5%), PBM (1.7%), and PM (1.5%), with differences being non-significant, as well as CF, again with differences being non-significant between FM (2.9%), BSF (2.8%), PBM (2.4%), and PM (3.1%). Finally, the NFE content between the BSF (26.3%) and PBM feces (26.9%) did not show a significant difference but was considerably and significantly lower compared to the other two feces types (FM—45.2%/PM—44%).
Collecting the feces daily throughout the entire trial resulted in a non-significantly different total DM recovery for the FM diet (82.6 g), the BSF diet (78.6 g), and the PM diet (85.2 g), whereas the PBM diet resulted in a significantly and substantially higher DM recovery of 158 g (Table 6 and Figure 4). Similar to the entirely non-significant differences in proximate composition between the FM and PM feces alluded to in the preceding paragraph, also the recovery values of DM, nutrients, and energy, either expressed as a percentage of the total amount of the respective component fed throughout the trial (i.e., DM, GE, CP, CF, etc.) or expressed per kg of feed fed, were very close to each other with differences almost completely non-significant. Only recovery of NFE as a percentage of total NFE fed showed a significant, although minor, difference between the FM (28.6%) and the PM feces (31.3%).
Compared to the FM and PM feces, the BSF feces also showed no significant differences with respect to the percentage of DM, CF, starch, and GE recovered and similarly did not show significant differences regarding DM, CF, and starch recovered per kg of feed versus the above two feces types. However, significantly less GE energy recovery per kg of feed was recorded for the BSF diet (1.8 MJ/kg) compared to the PM (2.1 MJ/kg) and PBM diet (5.6 MJ/kg). The BSF diet accounted for the significantly lowest recovery of CFB relative to CFB fed but for the highest CFB recovery per kg of feed fed. The BSF diet also resulted in the significantly lowest NFE recovery per kg of feed and also a significantly lower recovery of ash (19.6%/16.2 g/kg) compared to the FM (30.5%/35.5 g/kg) and PM diet (33%/35.8 g/kg) while having a significantly higher CP recovery for both measures (9.9%/41 g/kg) compared to these two diets (FM—6.0%; 24.9 g/kg/PM—6.5%; 28.8 g/kg).
On the contrary, the PBM diet yielded the highest recovery in percentage as well as per kg feed terms with respect to DM (33.9%/310.4 g/kg), CP (39.3%/165.9 g/kg), CF (6.4%/7.5 g/kg), and GE (29%/5.6 MJ/kg). Percentage-wise, the PBM diet also resulted in the significantly highest ash recovery (44.1%) but, together with the BSF diet, had a significantly lower total ash recovery per kg of feed (PBM—19.2 g/kg/BSF—16.2 g/kg) versus the FM (35.5 g/kg) and PM diet (35.8 g/kg).

3.4.2. Minerals and Amino Acids

The content of every measured EAA and NEAA as a percentage of DM was considerably and significantly highest for the PBM feces (Table 5).
The FM feces showed a significantly lower sum of EAAs (4.3%) not only compared to the PBM feces (29.8%) but also to the BSF (5.5%) and the PM feces (6%), while also showing the lowest sum of NEAAs (5.7%), though the difference was only significant in comparison to the PBM (23.7%) and PM (8.5%) and non-significant in comparison to the BSF feces (6.4%). This was reflected in the FM feces having the significantly lowest content for half of the EAAs (Ile, Leu, Lys, Thr, Val) and many of the NEAAs (Ala, Gly, Pro, Ser). Despite apparently overall lower AA content in the FM feces compared to the other groups, methionine content was significantly higher in the FM feces (0.28%) than in the BSF (0.19%) and PM feces (0.24%), but lower than in the PBM feces (0.64%).
For most NEAAs (Cys, Pro, Ser, Asp+Asn, Glu+Gln, Tyr) as well as the sum of NEAAs, the PM feces showed significantly higher values in contrast to the BSF and the FM feces. In addition, the content of the EAAs Arg, Leu, and Thr was higher in the PM feces than in the above two feces types. For the most part, the BSF feces was situated between the FM and the PM feces in terms of both EAAs and NEAAs. However, the BSF feces had the significantly lowest arginine (0.48%) and methionine content (0.19%), while on the other hand showing a significantly higher histidine (0.60%) and tryptophan content (0.18%) in comparison to the FM (His: 0.27%; Trp: 0.13%) and PM feces (His: 0.22%; Trp: 0.13%). Tyrosine was not detected in the BSF feces.
With respect to mineral content, the composition of all four feces types was dominated by Ca and P, respectively, with Ca being the most abundant by a considerable margin, especially in the FM, BSF, and PM feces. In accordance with the overall low mineral content of the PBM feed, the related feces also showed the lowest mineral content, with all minerals being present at lower levels compared to the other feces types, except for S (5 g/kg) and Fe (1.8 g/kg), of which the content was the significantly highest of all feces types. The levels of Ca (13.4 g/kg), Mg (1.3 g/kg), K (0.38 g/kg), Al (0.04 g/kg), Zn (0.13 g/kg), Cu (0.03 g/kg), Cr (3.9 mg/kg), and Cd (0.12 mg/kg) in the PBM feces were the significantly lowest among the feces types.
The FM and PM feces were characterized by a sizably and significantly higher content of Ca (FM—64.6 g/kg; PM—66 g/kg) and P (FM—29 g/kg; PM—28.2 g/kg) compared to the BSF (Ca—25 g/kg; P—12.6 g/kg) and PBM feces (Ca—13.4 g/kg; P—9.4 g/kg) and furthermore featured a fair amount of similarity among each other with differences in Ca, P, S, Na, K, Zn, Mn, Cu, Ni, and Co being non-significant. Apart from the similarities between the FM and PM feces, the PM feces did exhibit significantly lower contents of Mg (2 g/kg), Fe (0.5 g/kg), Al (0.09 g/kg), Ti (3.6 mg/kg), Pb (0.96 mg/kg), Cd (0.24 mg/kg) compared to the FM feces with the Al content being the significantly lowest among all feces types. However, as suggested by the higher levels of these metals in the FM feed, the FM feces had significantly elevated Al (0.7 g/kg), Ti (27.6 mg/kg), and Cd (1.4 mg/kg) levels compared to all other feces.
The BSF feces, on the one hand, showed significantly lower levels of Ca (25 g/kg), P (12.6 g/kg), S (2.5 g/kg), Na (0.51 g/kg), Cr (6.3 mg/kg) and Co (0.45 mg/kg) compared to the FM and PM feces but on the other hand, showed the overall significantly highest levels of Zn (0.45 g/kg) and Mn (0.48 g/kg). Although K and Cu have accumulated in the process water to significantly higher concentrations for the BSF treatment, the differences in K and Cu in the feces between BSF, FM, and PM were minor and non-significant.

4. Discussion

4.1. Fish Performance

All relevant fish performance indicators, including final body weight and total length, BWG, LG, FCR, SGR, and TGC, paint a clear picture in terms of the suitability of the different protein sources as supporters of growth in Nile tilapia considering the evident rearing conditions and the dietary formulation approach applied.
In a meta-analysis, Galkanda-Arachchige et al. [17] found that many freshwater fish species can tolerate up to 100% FM replacement and the majority accept > 50% FM replacement with poultry by-product meal without difficulty, which agrees with the findings of this study. Although fish fed the PM diet on average performed slightly less well than fish fed the FM diet with regard to all indicators mentioned above, differences were minor and non-significant. However, PER for fish fed the PM diet was significantly lower compared to fish fed the FM diet, which in combination with the overall slightly reduced growth response suggests yet a slight superiority of FM for growth in Nile tilapia when used as the sole main protein source. Nevertheless, the results of this trial, especially considering the low FCRs observed for the FM and PM diet, indicate the high suitability of PM as a sole protein source and 100% replacement of FM in the diet of juvenile Nile tilapia.
This finding is generally supported by the published literature on PM in Nile tilapia diets with similar results recorded by Yones and Metwalli [60] and Hernández et al. [58], who found no significant reduction in growth performance and feed conversion at 100% FM replacement compared to the control diet. El-Sayed [74] also recorded a similar growth response for Nile tilapia at 100% FM replacement, while Fasakin et al. [75] successfully replaced 66% of the FM in the control diet without adversely affecting growth performance and feed conversion of hybrid tilapia (Oreochromis niloticus × Oreochromis mossambicus).
PM often has a lower content of the EAA lysine, methionine, and histidine compared to FM, and in some fish species, the reduced growth performance at high PM inclusion levels has been ascribed to this lack [17]. In this study, although lysine, methionine, and histidine were lower in the PM diet than in the FM diet, they were above published requirements for juvenile Nile tilapia and likely not limiting. However, tryptophan was on the low end compared to the other diets and just at or above requirements, potentially indicating a slight lack [63,64]. On the mineral side, no obvious insufficiencies were apparent for the PM diet.
However, in this study, the overall CP content of the diets was generally higher than in previous work on poultry meal in tilapia diets [58,60,74,75], and the CP content of the PM diet with 43.7% was above the targeted 40% CP and the 40.3% CP of the FM diet. This could have had an effect on the growth performance of the fish fed the PM diet. Alongside differing protein digestibility, the slightly higher CP in the PM diet could have perhaps contributed to the higher recorded CP as well as EAA/NEAA content in the PM feces. Nevertheless, although a diet with such a high inclusion of expensive FM is very unlikely in a commercial context, especially for omnivorous Nile tilapia, the PM diet resulted in a 30% lower cost per kg of body weight gain (0.67 €/kg BWG) than the FM diet (0.96 €/kg) and incurred the significantly lowest cost among all of the tested diets.
While resulting in significantly better growth performance as well as feed and protein conversion in comparison to the PBM diet, the BSF diet still produced inferior fish performance compared to the FM and PM diet. Various authors have replaced FM to a certain extent with BSFM in tilapia diets without adversely affecting growth performance.
While Agbohessou et al. [76] and Tippayadara et al. [77] found no adverse effects on the performance of tilapia when entirely replacing the FM in their control diets with BSFM, the findings of Taufek et al. [78], Rana et al. [79], Muin et al. [80], and Devic et al. [53] are in line with this study and show reduced performance above a certain level of FM replacement with 50% replacement or, in the case of [53], a BSFM inclusion of 80 g/kg diet being optimal. In this study as well, the BSF diet resulted in reduced growth and feed conversion compared to the FM diet. However, all of the above-cited studies have incorporated a fairly substantial amount of soybean meal or soybean products as a secondary protein source in their experimental diets and thus did not incorporate BSFM as the sole protein source as was performed in the present study. Furthermore, these authors opted for a considerably lower inclusion of the BSFM (8–30%) compared to this study (61.6%). This could have reduced potentially detrimental effects of high absolute BSF inclusion and moderated the differences in fish performance between FM control and BSF test diets even when replacing a majority of FM.
Although BSFM is overall regarded as a quality protein source for fish feeds due to its high protein content and relatively balanced AA profile [24,81], generally resembling the EAA pattern of FM [82], the BSF diet in this trial did have lower arginine, lysine, methionine, phenylalanine, threonine, methionine + cysteine levels than the other experimental diets as well as the lowest sum of EAAs. Especially, arginine, methionine, threonine, and methionine + cysteine were merely at or even below published requirements depending on the source [63,64], which could be one reason for the suppression of growth performance and feed conversion in comparison to our FM control diet. Depending on the digestibility of P in the BSF diet, also the low P content of 12.1 g/kg in comparison to the FM and PM diet could have affected growth performance. Furthermore, despite Nile tilapia generally being thought to have some advantages in digesting chitin [83], the elevated chitin levels likely to have resulted from the high BSFM inclusion opted for in this study may have interfered with protein digestibility as suggested by other authors [79,84,85]. It should, however, be noted that the nutrient composition of BSF larvae, especially protein, fatty acid, and mineral composition and to a lesser extent EAA pattern, can be altered through diet modification [24,86,87,88] as well as harvest timing [89], which may present avenues for optimizing BSFM for use in tilapia and other aquaculture diets. In terms of cost per kg body weight gain, the BSF diet did not perform well compared to the other diets with 2.21 €/kg, which primarily stresses the importance of further scaling and industrializing BSF larvae production in order to make prices more competitive (however, it should be noted that, due to low volume, the feed manufacturer paid a higher price than would be expected for large industrial volume orders).
Fish fed the PBM diet performed poorly compared to the other diets with strongly depressed feed conversion and growth. This result is consistent with the findings of other studies in which 50% total dietary blood meal inclusion [90], as well as 50–100% replacement of the FM in the control diets by PBM, resulted in reduced growth performance of tilapia [74,91]. However, Aladetohun and Sogbesan [92] recorded better growth of tilapia at 100% FM replacement by PBM compared to the FM control diet, demonstrating the inconsistent assessment of PBM as a protein source for tilapia [93].
The inferior growth performance observed in the present study for fish fed the PBM diet has likely to do with the low Ca (5.7 g/kg) and P content (7.8 g/kg) which are both below requirements [65,66]. Ca and P are both essential for bone and scale mineralization as well as various other physiological functions [66,94]. Ca plays an important role in nerve transmission, muscle contraction, maintenance of cell membrane integrity, and blood clotting. P is critical in, e.g., amino acid, lipid, and carbohydrate metabolism, as well as an integral component of ATP, phospholipids, and nucleic acids. Deficiencies in these two minerals can lead to reduced growth, as observed for the PBM diet in this trial. From the perspective of the EAA content, however, the PBM diet compares most favorably to the other diets, with the sum of EAAs actually being the highest. However, methionine was recorded slightly below the published requirement [63], and also methionine + cysteine barely matched requirements [64]. Nevertheless, Ca and P deficiency most probably caused the inferior fish performance, which is supported by the exceedingly high CP, as well as EAA/NEAA content, detected in the recovered feces as well as the low TIN accumulation in the process water, indicating reduced digestibility of otherwise valuable growth-supporting nutrients. On the one hand, these results clearly show the unsuitability of the PBM diet in the current form. However, on the other hand, the comparably favorable AA profile of the PBM diet in combination with the deficiencies in Ca and P perhaps present the opportunity to improve growth performance in such fish meal-free PBM diets for tilapia by increasing Ca and P either through mineral supplementation or strategic supplementation of the PBM with protein ingredients higher in Ca and P such as bone meals or PM.

4.2. Water—Implications for Plant Production

The second objective of this study was to evaluate the potential of alternative protein sources to address some of the nutrient imbalances and deficiencies often encountered in aquaponic waters [47,48]. For Ca, S, B, Fe, Na, and Mn, no meaningful differences were found between the experimental diets, and concentrations were closely related to tap water concentrations, i.e., exchange water, mostly corroborating the findings of other authors [47]. Delaide et al. [50] found the majority of the dissolved Ca, S, B, and Na originating from the tap water, while Strauch et al. [95] also found notable tap water influence on Ca, S, and Mg (they did not measure B and Na). These authors both report Fe and Mn predominantly originating from feed input. However, Strauch et al. [95] only removed the sludge from the system clarifier once a week while feces were removed daily in the present study, and water pH was substantially below what was recorded in this trial. Both may have increased the mineralization and solubilization of Fe, Mn, and other elements compared to the present study. Nevertheless, due to the considerable differences in Ca, S, B, Fe, Na, and Mn content between the experimental diets used in this study, the likelihood of substantially influencing the dissolved concentration of these nutrients by mere ingredient manipulation appears low under the experimental conditions faced (physico-chemical conditions, water exchange rate, feeding rate, fish species, sludge removal rate, etc.).
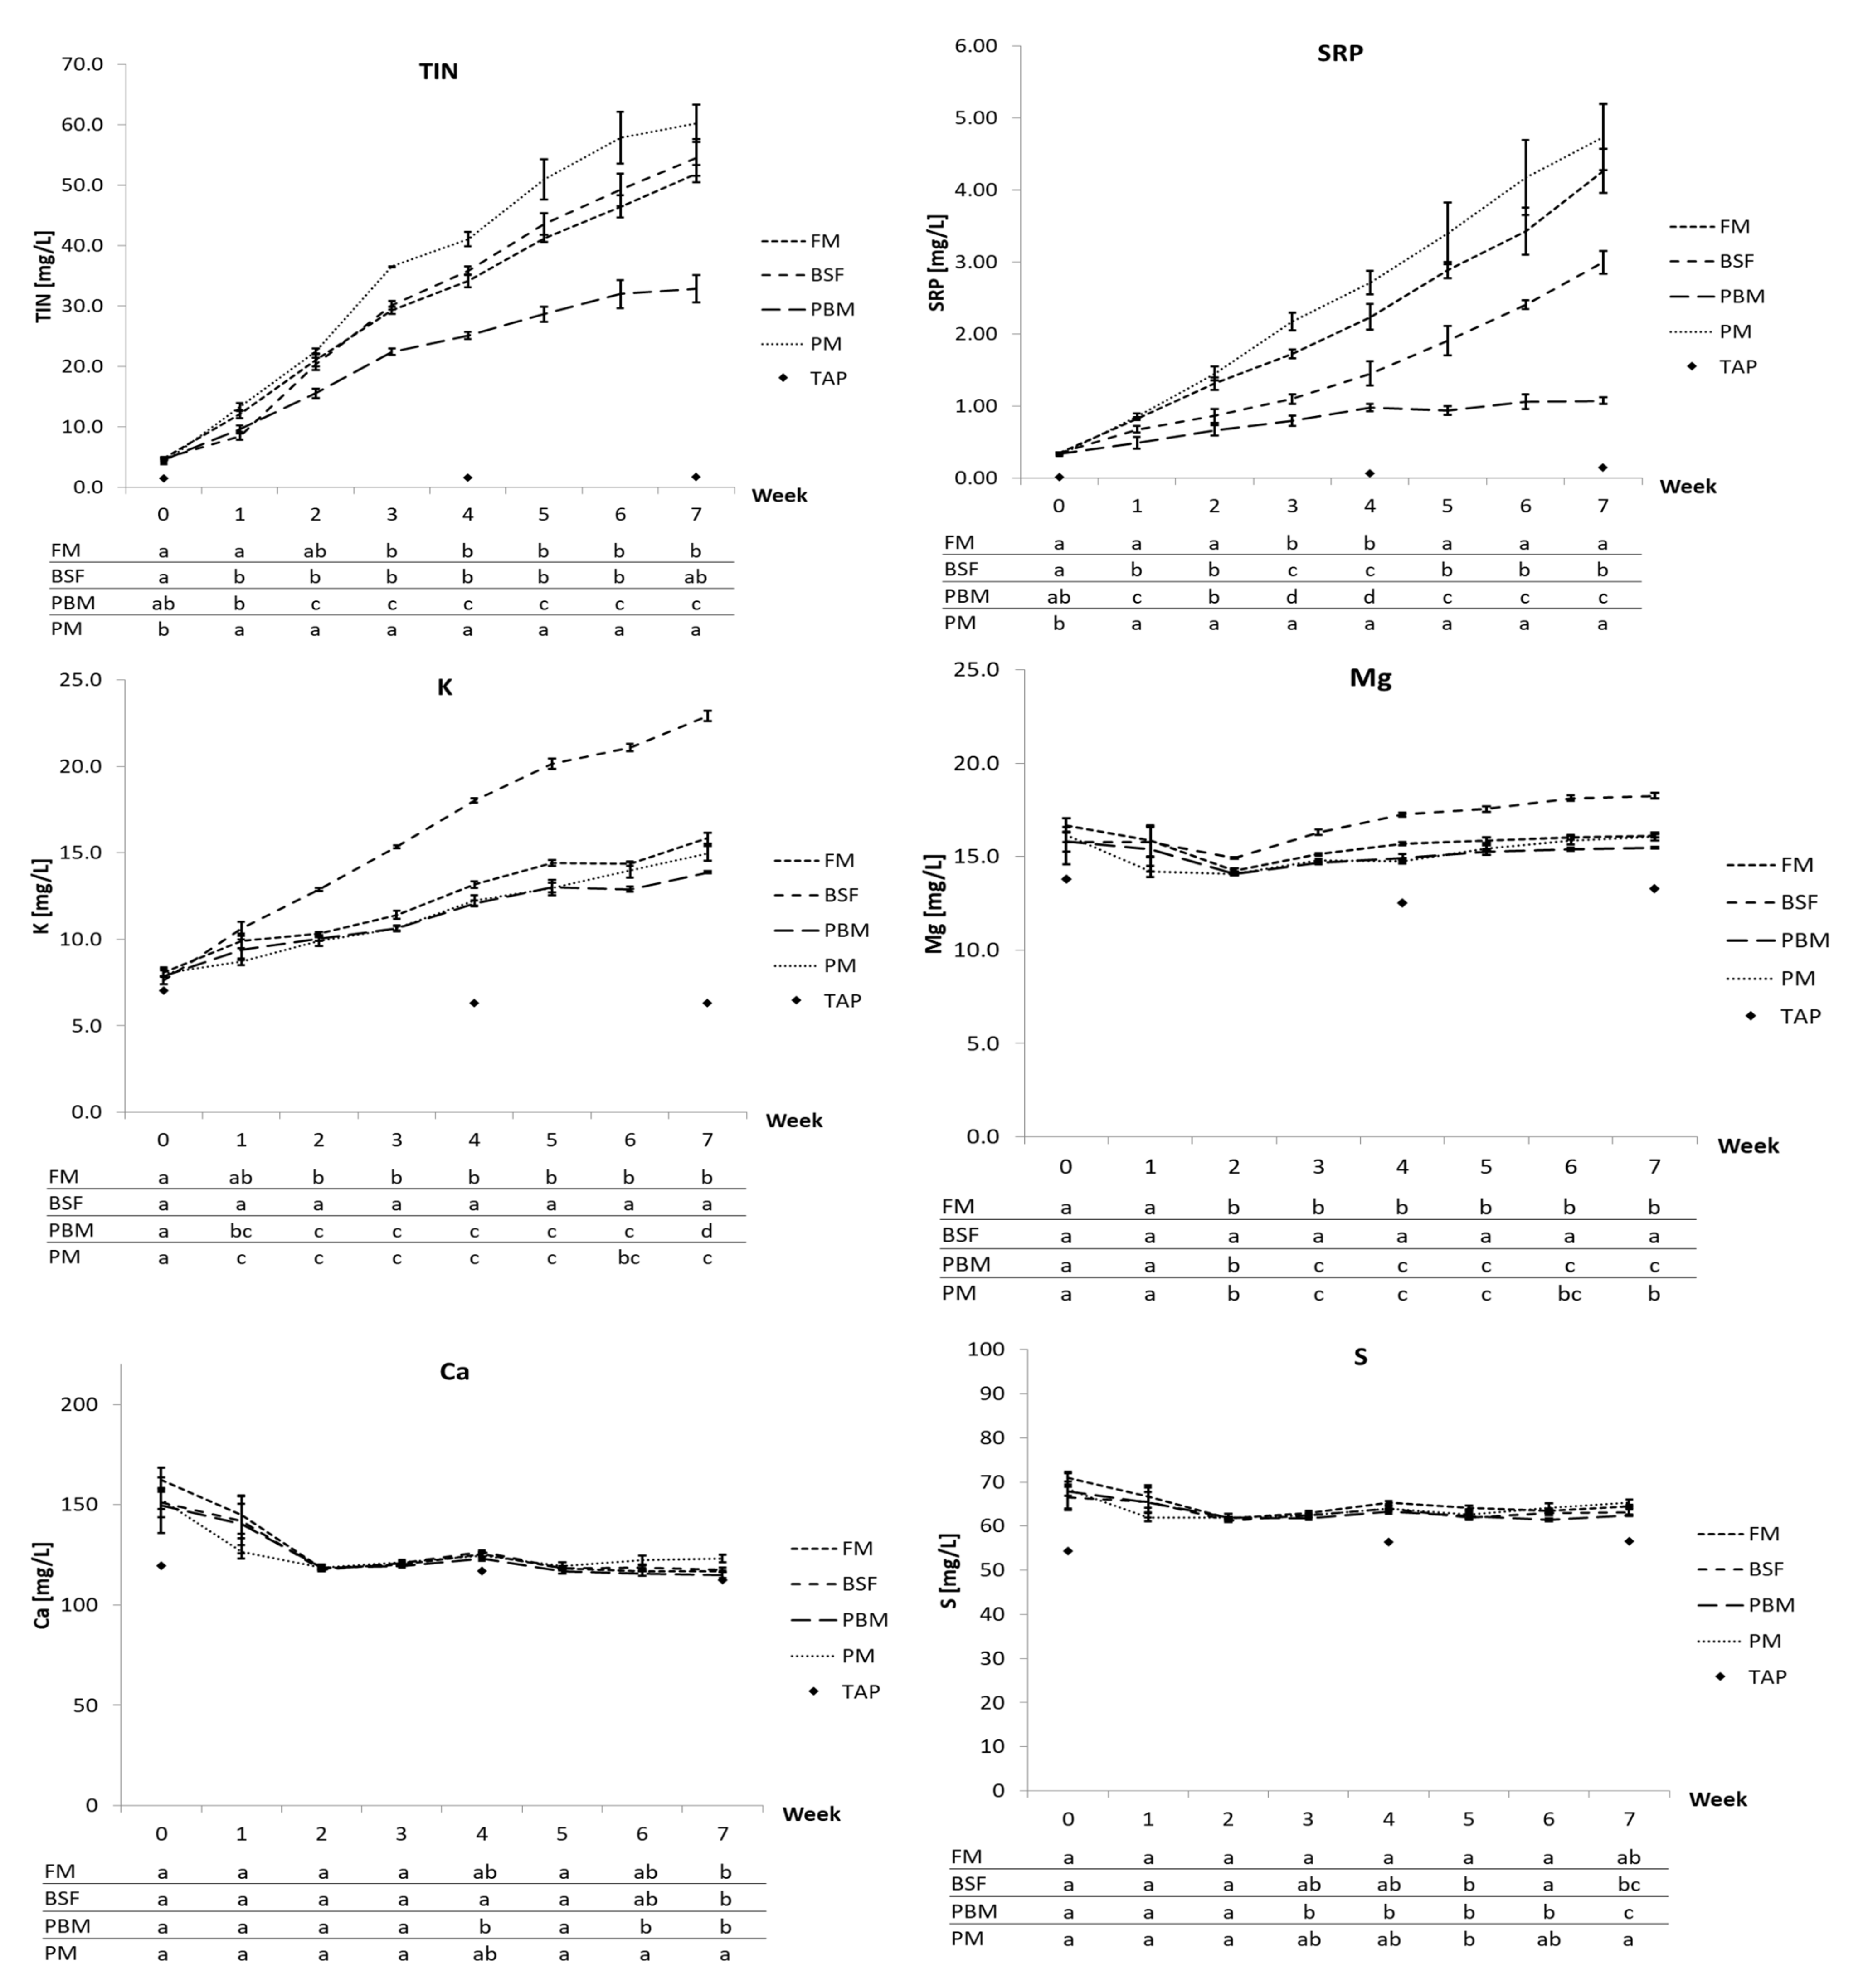
The most pronounced uptrend for all diets was recorded for TIN, SRP, and K, with partly significant differences between diets. As suggested, on the one hand, by the lower levels of P and K in the PBM diet and on the other hand by the poor diet digestibility and substantially higher recovery of CP in the feces (among other nutrients), especially TIN and SRP but also K, even though to a lesser extent, accumulated more slowly and reached lower concentrations. It is likely, however, that by fostering protein digestibility through alleviating the Ca and P deficiency in the PBM diet as discussed in Section 4.1, branchial nitrogen excretion and thereby process water TIN concentration could be increased. TIN accumulation for the FM and BSF diet were similar, whereas the PM diet resulted in consistently higher TIN concentrations, which may have been a direct consequence of its elevated protein level alluded to in Section 4.1. This will lead to absolutely more nitrogen added to the system through the feed and probably increased amino acid catabolism, eventually resulting in higher branchial nitrogen excretion [8,96]. Differences in the accumulation of SRP reflect the P contents in the diets, illustrating that not only FM and PM are superior SRP suppliers in diets for aquaponics but also highlighting that SRP, a mostly deficient plant nutrient in aquaponics [47,49,50,97], is influenceable by protein source choice. This agrees with efforts to reduce phosphorus excretion through appropriate feed formulation and ingredient choice, i.e., promoting diets with higher energy density and P digestibility as well as reducing the inclusion of protein sources high in P such as FM and other animal meals [6,98,99,100]. Consequentially, with the low price and the support of growth in Nile tilapia, PM appears to be a highly suitable protein source for aquaponic feeds that could spare marine ingredients while increasing SRP availability for plants and thereby reduce the need for additional phosphorus fertilization.
K accumulation, while being similar for the FM, PBM, and PM diet, was substantially elevated for the BSF diet, which is in line with its higher K content compared to the other diets. At the end of the trial, the mean K concentration in the process water of the BSF fed systems was 22.9 mg/L, roughly 45% higher than the 15.9 mg/L in the FM treatment, the next highest K concentration among the treatments. This shows that higher dietary K levels may translate well into higher dissolved K concentrations in the process water and that, in this case, the BSFM considerably added to the dietary K level in comparison to the other protein sources. The mineral content of BSF larvae is considered high among animal feed ingredients [24] and can be subject to considerable variability depending on the mineral composition of the feed substrate [82,88,101,102] as well as the life stage [89]. Due to this variability, it should not generally be inferred that BSFM is an appropriate protein source for increasing dissolved K excretion. However, if provided with feed high in K, seaweed being one example [88], BSF larvae seem capable of increasing dissolved K excretion if incorporated in diets at sufficiently high levels and could thus help to alleviate K deficiencies encountered in aquaponics [47,49,50,97].
From week 2 (first feed ration increase), Mg concentrations also increased steadily for all diets, although the accumulation rate was lower than for K. While differences in Mg concentration between the FM, PM, and PBM diets were minor, again the BSF diet stood out with a faster increase, leading to mean concentration of 18.3 mg/L Mg in week 7, 13.4% higher compared to the FM diet. This is in line with the higher Mg content measured in the BSF diet versus the other diets. Yet, in contrast to K, Mg concentrations are more governed by tap water concentration as illustrated by the 13.3 mg/L Mg measured in the tap water in week 7, which agrees with Delaide et al. [50] and Strauch et al. [95]. However, Strauch et al. [95] and Seawright et al. [49] found increased Mg accumulation at higher fish production intensities, supporting the result of the present study that Mg concentration can likely be manipulated through feed amount and composition.
Cu showed an accumulative trend over the entire trial for all diets as well, yet followed tap water concentrations very closely with levels for the most part being at or even below levels measured in the tap water, which agrees with Delaide et al. [50] and Strauch et al. [95]. However, the higher Cu content in the BSF diet in contrast to the other diets directly translated into higher Cu concentrations above tap water levels throughout the trial. Zn also showed an upward trajectory for all diets, yet primarily caused by tap water concentrations. However, from week 4, a comparably sharp rise up and above the tap water concentration was recorded for the systems fed the PM diet, which cannot be attributed to the higher Zn content of the diet. This rise coincided with a faster drop in water pH observed in the PM treatment, with the mean pH reaching 6.4 at the end of the trial versus 7.2 (FM), 7.9 (PBM), and 7.4 (BSF), which may have contributed to increased solubility of Zn.
For a long-term trial, it would be very insightful to compare nutrient concentrations and ratios to hydroponic standard solutions. However, due to the short trial duration not allowing for an equilibrium between feed input, water exchange rate, and nutrient accumulation to develop, nutrient concentrations recorded in the present study are considerably lower than in any kind of mature stabilized system (as also confirmed by the still rising concentrations of many of the dissolved nutrients at the end of the trial). In addition, nutrient ratios were not compared to hydroponic standard solutions since accumulation rates and initial concentrations differed between nutrients (e.g., as discussed for K and Mg), confirming the differential accumulation rates also reported by Seawright et al. [49].

4.3. Feces—Implications for Insect Larvae Production

In a tri-trophic agricultural system that interdependently integrates fish, plant, and insect larvae production [52], it is important to identify resource inputs that are either beneficial on all three production levels or beneficial on one without compromising the other two. Therefore, this study not only set out to compare fish performance and dissolved nutrient excretion with the objective of aquaponic diets in mind but also aimed to evaluate solid nutrient excretion by the fish with regard to potential nutritional suitability for insect larvae production (e.g., BSF larvae). Higher value insect larvae proteins, lipids, and minerals could then again be recycled back into the fish diets, further closing internal nutrient cycles and thereby minimizing waste and maximizing the use of initial resource inputs.

4.3.1. Feces Composition and Nutrient Recovery

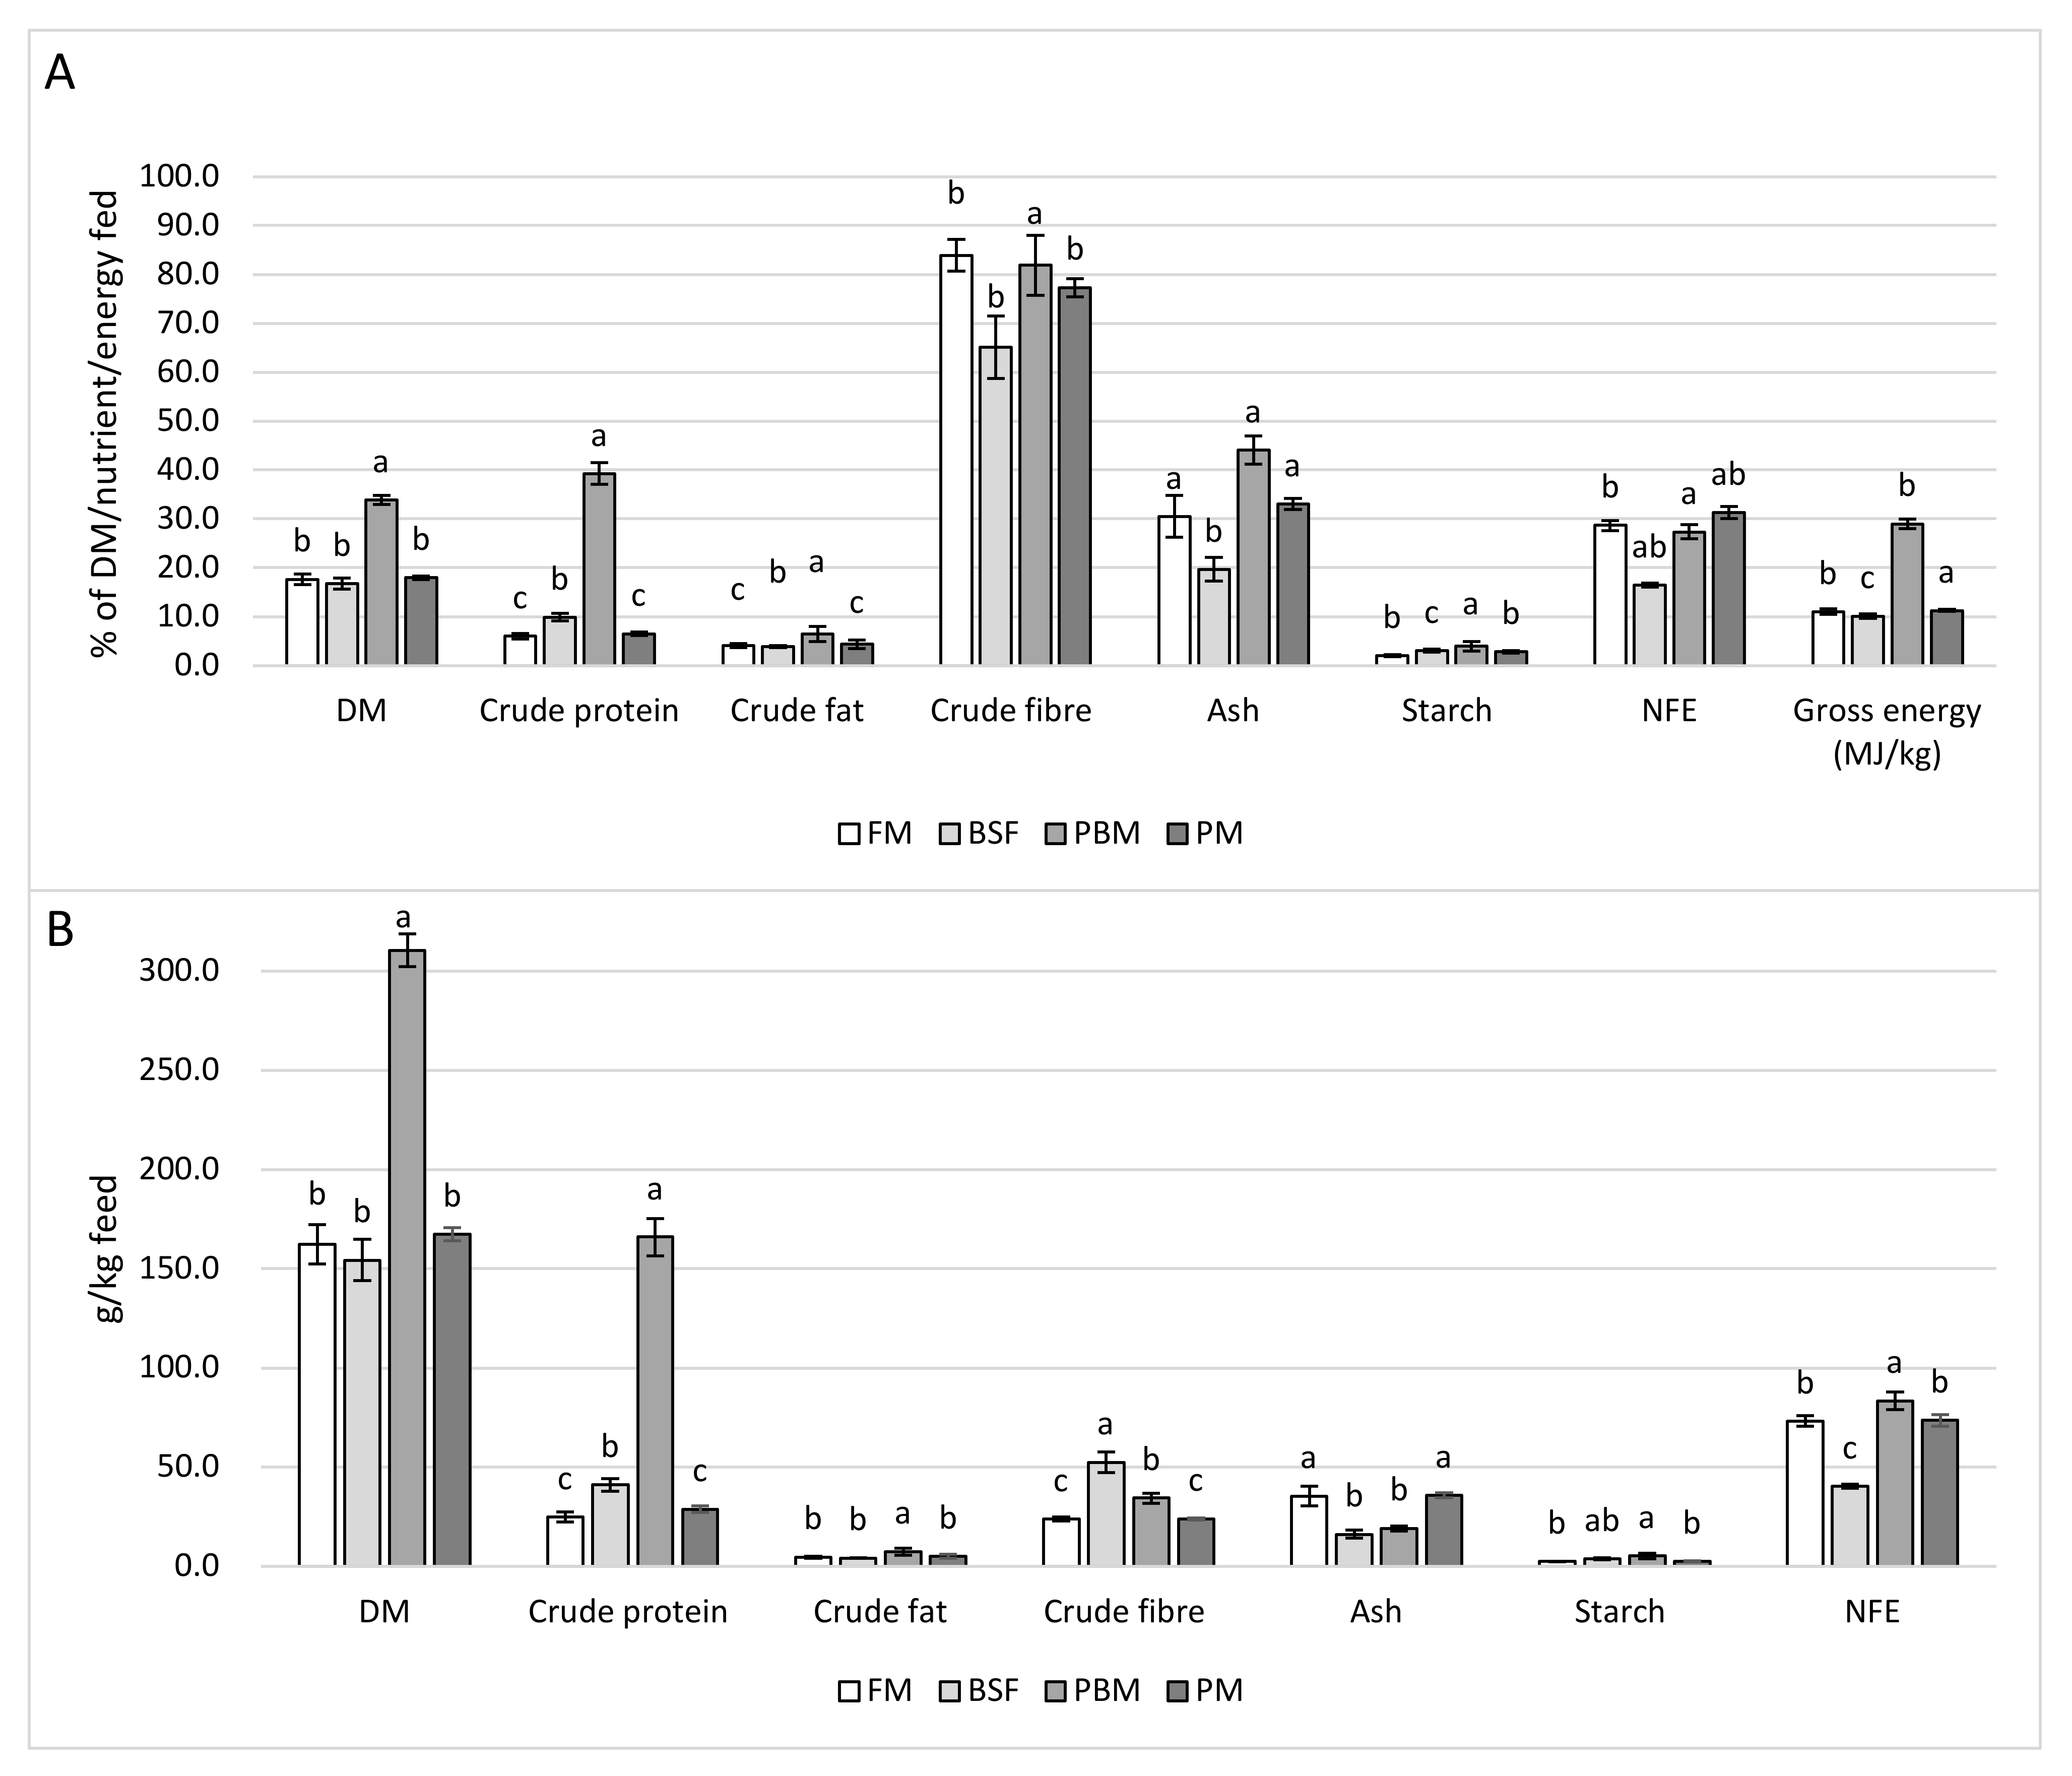
Mineral compositions found for the feces in this study were comparable to the ranges found for Nile tilapia published by other authors who identified the dominant mineral constituents to be Ca (24–66 g/kg DM) > P (13–33 g/kg DM) > S (4.7–6.6 g/kg DM) > Mg (2.2–3.8 g/kg DM) and reported reasonably similar ranges for other minerals as well [37,103,104]. Data published for African catfish sludge also suggests comparable ranges with Ca (27–38 g/kg DM) > P (15–19 g/kg DM > S (5 g/kg DM) > Mg (1.2–2 g/kg DM) [95,104]. Assuming a nitrogen-to-CP conversion factor of 6.25, the nitrogen measurements published for Nile tilapia sludge (equating to 22.7–25.6% CP in DM) [37,103,104] and African catfish sludge (equating to 11.1–25.9% CP in DM) [95,104] support the measurements made in the present study. With the exception of the PBM diet, showing strongly diminished growth performance and protein digestibility, which resulted in high DM recovery through feces collection, the other three feeds resulted in similar DM recovery, suggesting that the FM, PM, and BSF diet in a production setting would produce a similar raw material output that could then be provided downstream as a feed source for insect larvae production. Quantity and quality of the raw material collected will, however, likely be affected not only by feed composition but also by production-related factors such as uneaten feed, residence time of the feces in the water, the solids removal method, and the subsequent processing of the sludge.
The experimental diets resulted in feces with low CF and starch content. This, in combination with the low percentage recovery of the fed CF and starch through feces collection, indicates high digestibility of both of these nutrients in all four experimental diets. In line with the similar growth performance, FCR, and PER of the fish fed the FM and PM diet, the respective feces reflected a similar nutrient profile regarding all measured gross nutrients; however, they also had the lowest P/E ratio and CP content among all feces types. The low percentage recovery of the fed CP compared to the BSF and PBM diet further corroborates the effective use of the FM and PM diet and suggests higher CP digestibility. However, the weak fish performance achieved by the PBM diet is clearly reflected in the high CP content, GE content, and P/E ratio of the feces. The slightly less superior growth performance achieved by the BSF diet in contrast to the FM and PM diet is also reflected in the higher CP content of the BSF feces as well as the higher percentage recovery of fed CP. The higher ash content, as well as total ash, recovered per kg of feed of the FM and PM feces reflect the higher ash content of the FM and PM diet. On the contrary, the low ash content of the PBM diet resulted in the lowest ash content and recovery of ash per kg of feed, whereas the percentage recovery of the ash fed was highest for the PBM diet. This suggests that despite already limited mineral availability in the diet, biological availability appeared even more constrained, likely due to the previously discussed mineral/nutrient imbalances (Ca, P and methionine).
CFB content was higher in the BSF diet compared to the other diets, while the inclusion of cellulose, lignin, and hemicellulose from wheat bran and corn meal was lowest, indicating that a substantial amount of the CFB measured originated from the chitin in the BSFM. The high CFB content of the BSF diet was also reflected in the CFB content and CFB recovery per kg of feed of the BSF feces, being highest among dietary treatments. However, recovery of CFB as a percentage of CFB fed was, in fact, significantly lower compared to the other feces’ types. This suggests the higher digestibility of the chitin portion of the CFB in Nile tilapia compared to the cellulose/lignin/hemicellulose portion, corroborating the findings of other authors with regard to the ability of Nile tilapia to digest chitin [83].
In line with the weak fish performance and the high feces CP content, AA levels found in the PBM feces were above those found in the BSF, FM, and PM feces. While total AA content of the PBM feces was equal to its CP content, total AA content for the FM, BSF, and PM feces was only 65%, 45%, and 83%, respectively, indicating that a substantial portion of the CP measured in the latter three feces types may actually have originated from non-protein/non-AA nitrogen. This not only corroborates the poor protein and AA digestibility of the PBM diet but furthermore highlights the insufficiency of mere CP analysis for judging protein availability in fish feces and reveals the high variability in the ratio of CP to AAs that has to be expected.

4.3.2. Feces as Feed for Insect Larvae

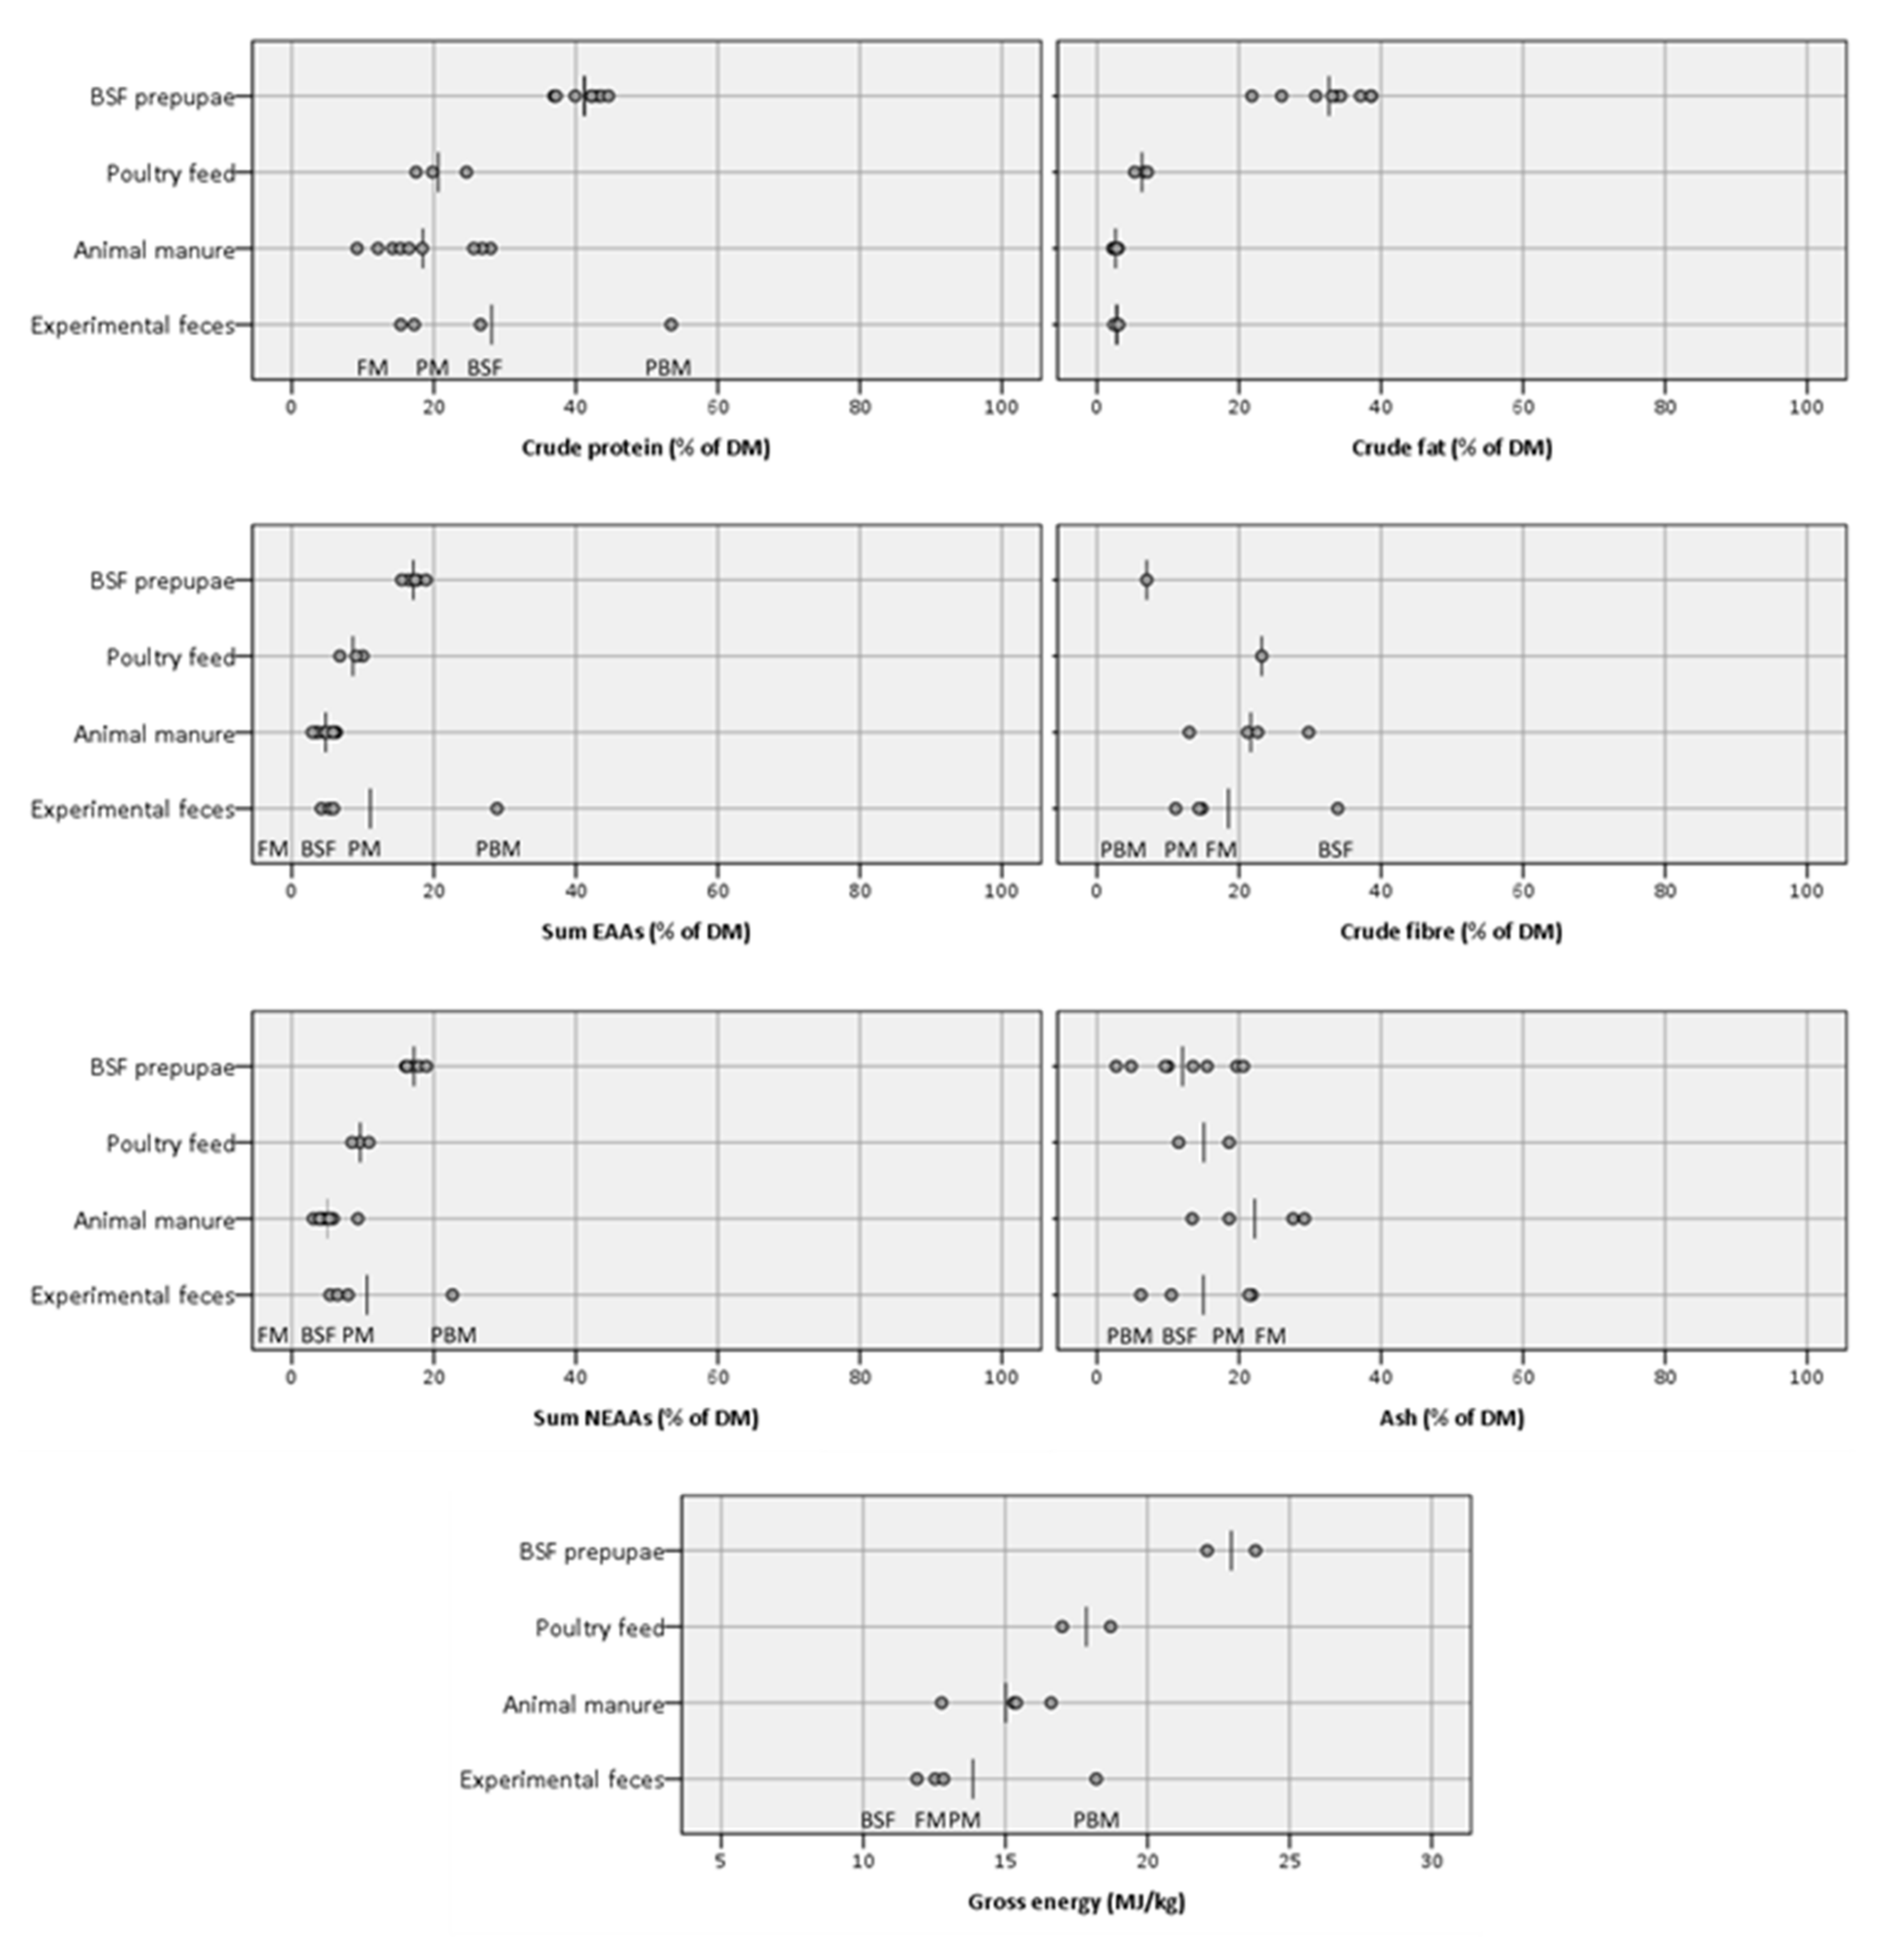
With the above details on feces composition and recovery in mind, important macronutrients were compared between the experimental feces and other relevant raw materials (Figure 5), including animal manures (often suggested as waste streams to be used for BSF larvae production [23,105,106,107,108]), poultry feed (a common reference diet in BSF trials [109,110,111]) as well as BSF larvae themselves. Disregarding the PBM feces, the other experimental feces appear approximately similar to other animal manures in terms of CP, CF as well as EAA, and ash content (except for the BSF feces with lower ash content) with perhaps slightly higher content of NEAAs, yet somewhat reduced GE content. The BSF feces shows a higher CFB content compared to animal manures, whereas the FM and PM show a lower CFB content. CP and ash content in poultry feed are in a similar range to what was found in the experimental feces, whereas the levels of CF and EAA/NEAA were somewhat higher, and GE was considerably higher in poultry feed. BSF larvae show substantially higher levels of CP, CF, EAAs/NEAAs, and GE (again excl. PBM), yet a more similar ash and a lower CFB content in comparison with the experimental feces. However, it should be noted that BSF larvae show a comparably wide range of ash and CF content, underpinning the tendency to more strongly reflect dietary characteristics in their body composition with respect to mineral and CF versus, e.g., CP or AA content [82,88,89,101,102,105].
Since protein content and protein quality of feed substrates, i.e., EAA composition, are likely to be of major importance for BSF larvae growth and development [105,112], EAA composition as well as EAA profile of the experimental feces were again contrasted with animal manures, poultry feed, and BSF larvae in order to better evaluate the protein quality of the feces with respect to their suitability to support insect larvae production. The whole-body amino acid composition of animals can be used as a proxy to determine their nutritional needs and to formulate adequate artificial diets [105,113,114]. Therefore, the percentage deviation in EAA content of the experimental feces, animal manures, and poultry feeds from whole body BSF larvae were calculated (Table 7). Apart from the PBM feces, which had much higher levels for all EAAs than BSF larvae, these results show that the other feces types, including animal manures, on average only reach 26–34% of the levels found in BSF larvae (FM: 26%; BSF: 31%; PM: 34%; animal manures: 31%), whereas the poultry feeds on average reach 48%, indicating its likely superiority as BSF larvae feed substrate with respect to absolute amounts of EAAs.
However, it is known in animal nutrition that not only the quantity of EAAs plays a role in protein quality but also the balance, i.e., ratio, of EAAs [114,115,116,117]. The ideal protein concept aims to determine the optimal ratios of EAAs in relation to lysine, often the first limiting EAA in animal feedstuffs [117], by identifying the whole body EAAs ratios with respect to the lysine of the animal in question. If dietary lysine requirement is experimentally determined, then also the requirements of all other EAAs can be specified. Accordingly, EAA ratios relative to lysine were compared between BSF larvae, which according to the ideal protein concept, represent the ideal balance of EAAs for BSF larvae nutrition, and the experimental feces as well as the other feed substrates discussed above (Table 7). The FM, BSF, and PM feces are on average similarly unbalanced in terms of their amino acid profile with an average absolute deviation of the EAAs ratios from the ratios found in BSF larvae of 66%, 58%, and 65%, respectively. Other animal manures on average deviate by 78% from the ideal ratios, although the standard deviation of this means with 119% much higher primarily due to exceedingly elevated arginine and tryptophan ratios, meaning these two AAs tend to be overrepresented in animal manures relative to lysine. As would be expected, the EAA profile of poultry feed, well-suited BSF larvae feed, is more balanced and closer to the ideal ratios found in BSF larvae with a mean deviation of only 34%. Although for most EAAs an underrepresentation was recorded in relation to lysine in the PBM feces, it had the on-average most balanced EAA profile with a mean absolute deviation of 27%. Nevertheless, the PBM feces is still more abundant in lysine compared to BSF larvae.
With diet quality, diet digestibility, and subsequently fish performance being superior for the BSF and especially the FM and PM diets and allegedly far closer to optimal than the PBM diet, it can be assumed, considering the specific life stage of Nile tilapia and the diet formulation strategy followed in this trial, that the nutritional quality of the FM, PM and BSF feces is what could more likely be expected in a production scenario versus the PBM diet. Overall, the nutritional quality of these fish feces (FM, PM, BSF) appears similar to terrestrial animal manures, whereas both of these raw material types seem similarly inferior to poultry feed, suggesting reduced suitability for BSF larvae production.

4.4. Potential for Integrating Aquaponics with Insect Larvae Production

In tri-trophic production systems, as the one proposed in this study, the principle of optimizing one production unit without compromising another alluded to previously should be of primary importance. This means to firstly fulfill the nutritional needs for adequate fish performance and health before secondly opting to enhance the composition of fish diets for downstream use of excreted nutrients within this window of adequacy. The FM and PM diet and, to a more limited extent, the BSF diet fulfilled this objective of nutritional adequacy for Nile tilapia. However, the better growth performance they enabled resulted in the collection of less raw material in the form of feces with a lower overall nutrient density. As suggested by [9], feed formulation should primarily be focused on combining complementary raw materials, which, together, fulfill the nutritional requirements of a particular species. In this sense, future research should identify other nutritionally valuable biowaste streams that complement the nutritional profiles of less nutrient-dense feces resulting from highly digestible fish feeds such as the FM or PM diet in a way that optimizes BSF larvae production. Furthermore, the high P content of the feces produced by diets such as the FM or PM diet combined with the discussed tendency of BSF larvae to reflect the mineral composition of the provided feed substrate may be beneficial in producing larvae with increased P content, which then again could represent a valuable P source in the fish diets not only to meet the requirements of fish but perhaps even to increase process water SRP accumulation in support of plant growth. Such a multitrophic production scenario could foster the recycling of P, which, in a standard aquaponic setting, would be hampered by the loss of P through sludge removal from the system.
Table 7. EAA content (% DM) and EAA ratio with respect to lysine of experimental feces, animal manures (ad. from [118,119]) and poultry feed (ad. from [109,110,111]) versus BSF larvae (ad. from [55,108,110,111,120]). Percentages calculated for the EAA content represent the extent to which an AA reaches the content found in BSF larvae, and percentages calculated for the EAA ratio represent the extent to which the ratio of an AA in relation to lysin differs from the ideal ratio in BSF larvae (total means for average deviation from ideal ratio are calculated with absolute percentages, i.e., negative deviations regarded as positive deviation).
EAA ContentBSF LarvaeFMBSFPBMPMAnimal ManurePoultry Feed
Lys2.47 ± 0.360.42 ± 0.0117%0.51 ± 0.0121%4.16 ± 0.19168%0.55 ± 0.0222%0.48 ± 0.1219%0.97 ± 0.2039%
Arg2.06 ± 0.230.57 ± 0.0228%0.48 ± 0.0323%2.72 ± 0.10132%0.90 ± 0.0644%1.17 ± 0.7857%1.39 ± 0.2567%
His1.30 ± 0.250.27 ± 0.0121%0.60 ± 0.0246%3.05 ± 0.12235%0.22 ± 0.0417%0.25 ± 0.0519%0.58 ± 0.1545%
Ile1.77 ± 0.190.44 ± 0.0125%0.61 ± 0.0034%2.34 ± 0.12132%0.66 ± 0.0337%0.51 ± 0.1029%0.85 ± 0.1448%
Leu2.89 ± 0.300.70 ± 0.0124%0.93 ± 0.0132%6.36 ± 0.26220%1.07 ± 0.0337%0.77 ± 0.2027%1.65 ± 0.1957%
Met0.79 ± 0.090.28 ± 0.0236%0.19 ± 0.0124%0.64 ± 0.0281%0.24 ± 0.0130%0.16 ± 0.0620%0.35 ± 0.1044%
Met + Cys1.27 ± 0.450.46 ± 0.0236%0.36 ± 0.0128%1.43 ± 0.04113%0.57 ± 0.0245%0.25 ± 0.1120%0.67 ± 0.1953%
Phe1.70 ± 0.270.52 ± 0.0131%0.62 ± 0.0436%3.62 ± 0.10213%0.73 ± 0.0343%0.41 ± 0.1624%1.09 ± 0.2464%
Phe + Tyr4.02 ± 0.410.88 ± 0.0122%0.62 ± 0.0415%4.64 ± 0.13116%1.26 ± 0.0531%0.68 ± 0.2817%1.61 ± 0.6340%
Thr1.48 ± 0.330.50 ± 0.0234%0.61 ± 0.0141%2.78 ± 0.11188%0.74 ± 0.0250%0.42 ± 0.1228%0.80 ± 0.1354%
Trp0.49 ± 0.180.13 ± 0.0026%0.18 ± 0.0136%0.92 ± 0.04189%0.13 ± 0.0026%0.42 ± 0.0987%0.15 ± -31%
Val2.58 ± 0.350.47 ± 0.0118%0.76 ± 0.0129%3.25 ± 0.16126%0.76 ± 0.0330%0.61 ± 0.1424%0.93 ± 0.1036%
26% ± 6%31% ± 9%159% ± 47%34% ± 10%31% ± 20%48% ± 11%
EAA RatioBSF LarvaeFMBSFPBMPMAnimal ManurePoultry Feed
Lys100 ± 0100 100 100 100 100 100
Arg84 ± 11137 ± 263%93 ± 411%65 ± 1−22%163 ± 594%274 ± 214226%146 ± 2074%
His50 ± 964 ± 230%117 ± 5135%73 ± 148%39 ± 6−21%54 ± 139%61 ± 1323%
Ile70 ± 5106 ± 151%119 ± 469%56 ± 0−20%119 ± 270%109 ± 2255%89 ± 927%
Leu115 ± 7169 ± 348%182 ± 459%153 ± 133%194 ± 269%164 ± 2943%174 ± 2052%
Met29 ± 467 ± 3137%36 ± 127%15 ± 0−46%43 ± 151%33 ± 916%38 ± 1332%
Met + Cys52 ± 21110 ± 3112%70 ± 135%34 ± 1−34%104 ± 199%51 ± 14−1%73 ± 2440%
Phe64 ± 6125 ± 395%120 ± 787%87 ± 235%132 ± 3105%88 ± 3237%115 ± 2378%
Phe + Tyr148 ± 15212 ± 443%120 ± 7−19%112 ± 2−25%228 ± 454%146 ± 51−2%164 ± 5510%
Thr66 ± 11119 ± 182%119 ± 381%67 ± 12%134 ± 2105%87 ± 1232%85 ± 1329%
Trp21 ± 831 ± 250%35 ± 269%22 ± 28%23 ± 113%103 ± 23404%21 ± 03%
Val101 ± 6113 ± 112%147 ± 545%78 ± 1−23%138 ± 236%131 ± 2829%98 ± 11−3%
66% ± 35%58% ± 34%27% ± 14%65% ± 32%78% ± 119%34% ± 24%
Figure 5. Comparison between the proximate composition of the experimental feces and other animal manures (poultry, pigs, cattle), poultry feed as well as BSF larvae (prepupae). Vertical lines represent the respective means of the data points. CP (ad. from [55,101,109,110,111,118,119,121]); CF (ad. from [55,101,109,110,111,119,121]); CFB (ad. from [110,119,121]) (note: only one data point for CFB for BSF prepupae); ash (ad. from [55,101,109,110,119,121]); GE (ad. from [109,111,119,121]); EAAs/NEAAs (ad. from [55,108,109,110,111,118,119,120]).
Sustainability 14 04064 g005

5. Conclusions

The results of this study support the general consensus that PM is a suitable protein source in tilapia nutrition. Diets with PM can, even at high inclusion levels as the sole main protein source, rival the growth and feed conversion performance of an entirely fish meal-based diet. Similarly formulated diets with BSFM and especially PBM do not match the fish performance achieved by the PM and FM diet, likely due to deficiencies with respect to certain EAAs and minerals, which would need to be addressed through either direct supplementation of minerals and crystalline EAAs or strategic incorporation of complementary ingredients.
It was further shown that dissolved excretion patterns of major plant macro- and micronutrients in low water exchange RAS, especially N, P, K, Mg, and Cu, differed significantly between experimental diets. Apart from supporting suitable growth and feed conversion in Nile tilapia and resulting in comparatively high dissolved N excretion, PM may serve as an alternative to FM even at high dietary inclusion as well as reduce P deficiencies in aquaponic waters at lower prices than FM if sufficiently incorporated in specialized aquaponic feeds. Even though not as supportive of growth in Nile tilapia with the applied diet formulation, BSFM appeared to be a considerable source of dissolved K, Mg, and Cu in the RAS water. This likely also makes it a worthwhile candidate in aquaponic feed formulations if prices reach greater parity with comparable protein sources and under the prerequisite of providing larvae with feed substrates rich in important plant nutrients such as K. The PBM diet, however, did not result in any noteworthy improvements of major dissolved plant macro- and micronutrients with the predominant reason being the poor digestibility and achieved growth performance of the diet likely caused by deficiencies in Ca and P. Therefore, a PBM diet supplemented with Ca and P needs to be retested in order to evaluate more realistic nutrient excretion.
Superior fish performance and feed use of especially the FM, PM, and, to a lesser extent, the BSF diet was reflected in reduced quantity and quality of nutrients recovered through feces collection and compared to other animal manures in terms of the nutritional composition. With the primary objective being fish performance and health before optimizing feces nutritional quality for insect larvae production, highly digestible fish feeds are preferable and lead to less nutrient-dense feces. Modification of feces nutritional quality by means of diet formulation thus seems likely limited to minor changes in overall feces nutrient density and restricted to specific (micro)nutrients. Therefore, the identification of complementary raw materials may be necessary to supplement fish feces for optimal insect larvae production.
When aspiring to combine fish, plant, and insect larvae production within one system, sustainable fish feeds have to be evaluated more broadly with a focus on nutrient excretion alongside fish performance since they represent one of the important nutrient inputs to be recycled in such systems. Taking the preliminary findings from this study, future research should investigate other sustainable protein sources (and additional dietary ingredients) as well as examine the strategic combination of different protein sources with regard to fish performance in conjunction with solid and dissolved nutrient excretion patterns. Building on such insights, it is then necessary to integrate concomitant hydroponic plant and insect larvae growth trials, which shed light on nutrient mass balances and recycling potential as well as the efficacy of such diets to enhance the overall productivity of the proposed multitrophic food production systems.

Author Contributions

C.S.: Conceptualization, methodology, and execution of the experiment, data acquisition, curation, analysis and visualization, writing—preparation of original draft and editing; K.K.: Conceptualization, supervision, resources, writing—review and editing. W.K. Conceptualization, supervision, project administration, funding acquisition, resources, writing—review and editing. All authors have read and agreed to the published version of the manuscript.

Funding

This research was funded by the Federal Ministry of Education and Research/PtJ Project Management Agency as part of Agricultural Systems of the Future (CUBES Circle), grant number 031B0733E.

Institutional Review Board Statement

This study did not require an application for approval according to communication with the Ethics Committee of the Landesamt für Gesundheit und Soziales (LAGeSo), Berlin.

Informed Consent Statement

Not applicable.

Data Availability Statement

The data are available online via the following link https://0-doi-org.brum.beds.ac.uk/10.6084/m9.figshare.19207902.v1 (accessed on 20 February 2022).

Acknowledgments

The authors would like to thank Tobias Goldhammer, Thomas Rossoll and Elisabeth Schütte from Dept. 1 and Viola Schöning, Hendrik Monsees, and Laura Klatt from Dept. 4 of the Leibniz Institute of Freshwater Ecology and Inland Fisheries for their support in laboratory analytics as well as planning and execution of this research.

Conflicts of Interest

The authors declare no conflict of interest.

References

  1. Klinger, D.; Naylor, R. Searching for solutions in aquaculture: Charting a sustainable course. Annu. Rev. Environ. Resour. 2012, 37, 247–276. [Google Scholar] [CrossRef] [Green Version]
  2. Naylor, R.L.; Goldburg, R.J.; Primavera, J.H.; Kautsky, N.; Beveridge, M.C.M.; Clay, J.; Folke, C.; Lubchenco, J.; Mooney, H.; Troell, M. Effect of aquaculture on world fish supplies. Nature 2000, 405, 1017–1024. [Google Scholar] [CrossRef] [PubMed] [Green Version]
  3. Naylor, R.L.; Hardy, R.W.; Buschmann, A.H.; Bush, S.R.; Cao, L.; Klinger, D.H.; Little, D.C.; Lubchenco, J.; Shumway, S.E.; Troell, M. A 20-year retrospective review of global aquaculture. Nature 2021, 591, 551–563. [Google Scholar] [CrossRef] [PubMed]
  4. Bostock, J.; McAndrew, B.; Richards, R.; Jauncey, K.; Telfer, T.; Lorenzen, K.; Little, D.; Ross, L.; Handisyde, N.; Gatward, I.; et al. Aquaculture: Global status and trends. Philos. Trans. R. Soc. B Biol. Sci. 2010, 365, 2897–2912. [Google Scholar] [CrossRef]
  5. Folke, C.; Kautsky, N. Aquaculture with its environment: Prospects for sustainability. Ocean Coast. Manag. 1992, 17, 5–24. [Google Scholar] [CrossRef]
  6. Lazzari, R.; Baldisserotto, B. Nitrogen and phosphorus waste in fish farming. Bol. Inst. Pesca 2008, 34, 591–600. [Google Scholar]
  7. Hardy, R.W.; Gatlin, D.M., III. Nutritional strategies to reduce nutrient losses in intensive aquaculture. In Proceedings of the Avances en Nutrición Acuícola VI. Memorias del VI Simposium Internacional de Nutrición Acuícola, Quintana Roo, México, 3–6 September 2002; Cruz-Suárez, L.E., Ricque-Marie, D., Tapia-Salazar, M., Gaxiola-Cortés, M.G., Simoes, N., Eds.; Universidad Autónoma de Nuevo León: San Nicolás de los Garza, Mexico, 2002. [Google Scholar]
  8. Cho, C.Y.; Bureau, D.P. A review of diet formulation strategies and feeding systems to reduce excretory and feed wastes in aquaculture. Aquac. Res. 2001, 32, 349–360. [Google Scholar] [CrossRef]
  9. Turchini, G.M.; Trushenski, J.T.; Glencross, B.D. Thoughts for the future of aquaculture nutrition: Realigning perspectives to reflect contemporary issues related to judicious use of marine resources in aquafeeds. N. Am. J. Aquac. 2019, 81, 13–39. [Google Scholar] [CrossRef]
  10. Hua, K.; Cobcroft, J.M.; Cole, A.; Condon, K.; Jerry, D.R.; Mangott, A.; Praeger, C.; Vucko, M.J.; Zeng, C.; Zenger, K.; et al. The future of aquatic protein: Implications for protein sources in aquaculture diets. One Earth 2019, 1, 316–329. [Google Scholar] [CrossRef] [Green Version]
  11. Bendiksen, E.Å.; Johnsen, C.A.; Olsen, H.J.; Jobling, M. Sustainable aquafeeds: Progress towards reduced reliance upon marine ingredients in diets for farmed Atlantic salmon (Salmo salar L.). Aquaculture 2011, 314, 132–139. [Google Scholar] [CrossRef]
  12. Oliva-Teles, A.; Enes, P.; Peres, H. Replacing fishmeal and fish oil in industrial aquafeeds for carnivorous fish. In Feed and Feeding Practices in Aquaculture; Davis, A.D., Ed.; Elsevier Ltd: Amsterdam, The Netherlands, 2015; pp. 203–233. [Google Scholar]
  13. Colombo, S.M.; Turchini, G.M. ‘Aquafeed 3.0’: Creating a more resilient aquaculture industry with a circular bioeconomy framework. Rev. Aquac. 2021, 13, 1156–1158. [Google Scholar] [CrossRef]
  14. Davis, C.B.; Aid, G.; Zhu, B. Secondary resources in the bio-based economy: A computer assisted survey of value pathways in academic literature. Waste Biomass Valorization 2017, 8, 2229–2246. [Google Scholar] [CrossRef] [Green Version]
  15. Stegmann, P.; Londo, M.; Junginger, M. The circular bioeconomy: Its elements and role in european bioeconomy clusters. Resour. Conserv. Recycl. X 2020, 6, 100029. [Google Scholar] [CrossRef]
  16. Carus, M.; Dammer, L. The “circular bioeconomy”-concepts, opportunities and limitations. Indust. Biotehnol. 2018, 1, 1–9. [Google Scholar] [CrossRef]
  17. Galkanda-Arachchige, H.S.C.; Wilson, A.E.; Davis, D.A. Success of fishmeal replacement through poultry by-product meal in aquaculture feed formulations: A meta-analysis. Rev. Aquac. 2020, 12, 1624–1636. [Google Scholar] [CrossRef]
  18. Luthada-Raswiswi, R.; Mukaratirwa, S.; O’brien, G. Animal protein sources as a substitute for fishmeal in aquaculture diets: A systematic review and meta-analysis. Appl. Sci. 2021, 11, 3854. [Google Scholar] [CrossRef]
  19. Campos, I.; Pinheiro Valente, L.M.; Matos, E.; Marques, P.; Freire, F. Life-cycle assessment of animal feed ingredients: Poultry fat, poultry by-product meal and hydrolyzed feather meal. J. Clean. Prod. 2020, 252, 119845. [Google Scholar] [CrossRef]
  20. Forster, I.; Dominy, W. Use of rendered terrestrial animal by-products in aquatic feeds. In Avances en Nutrición Acuícola VIII, Proceedings of the VIII Simposium Internacional de Nutrición Acuícola, Mazatlán, México, 15–17 November 2006; Suárez, L.E.C., Marie, D.R., Salazar, M.T., López, M.G.N., Cavazos, D.A.V., Ortega, A.C.P.C., Ortega, A.G.O., Eds.; Universidad Autónoma de Nuevo León: Monterrey, México, 2006; pp. 434–445. [Google Scholar]
  21. Bosch, G.; van Zanten, H.H.E.; Zamprogna, A.; Veenenbos, M.; Meijer, N.P.; van der Fels-Klerx, H.J.; van Loon, J.J.A. Conversion of organic resources by black soldier fly larvae: Legislation, efficiency and environmental impact. J. Clean. Prod. 2019, 222, 355–363. [Google Scholar] [CrossRef]
  22. Smetana, S.; Palanisamy, M.; Mathys, A.; Heinz, V. Sustainability of insect use for feed and food: Life cycle assessment perspective. J. Clean. Prod. 2016, 137, 741–751. [Google Scholar] [CrossRef]
  23. Diener, S.; Studt Solano, N.M.; Roa Gutiérrez, F.; Zurbrügg, C.; Tockner, K. Biological treatment of municipal organic waste using black soldier fly larvae. Waste Biomass Valorization 2011, 2, 357–363. [Google Scholar] [CrossRef] [Green Version]
  24. Barragan-Fonseca, K.B.; Dicke, M.; van Loon, J.J.A. Nutritional value of the black soldier fly (Hermetia illucens L.) And its suitability as animal feed—A review. J. Insects Food Feed 2017, 3, 105–120. [Google Scholar] [CrossRef]
  25. Lopes, I.G.; Lalander, C.; Vidotti, R.M.; Vinnerås, B. Using Hermetia illucens larvae to process biowaste from aquaculture production. J. Clean. Prod. 2020, 251, 119753. [Google Scholar] [CrossRef]
  26. Caruso, G. Fishery wastes and by-products: A resource to be valorised. J. Fish. Sci. 2015, 9, 80–83. [Google Scholar]
  27. Ideia, P.; Pinto, J.; Ferreira, R.; Figueiredo, L.; Spínola, V.; Castilho, P.C. Fish processing industry residues: A review of valuable products extraction and characterization methods. Waste Biomass Valorization 2020, 11, 3223–3246. [Google Scholar] [CrossRef]
  28. Torres, J.A.; Rodrigo-García, J.; Jaczynski, J.; Chen, Y.C. Recovery of by-products from seafood processing streams. In Maximising the Value of Marine By-Products; Shahidi, F., Ed.; Woodhead Publishing Limited: Sawston, UK, 2007; pp. 65–90. [Google Scholar]
  29. Sharif, M.; Zafar, M.H.; Aqib, A.I.; Saeed, M.; Farag, M.R.; Alagawany, M. Single cell protein: Sources, mechanism of production, nutritional value and its uses in aquaculture nutrition. Aquaculture 2021, 531, 735885. [Google Scholar] [CrossRef]
  30. Matassa, S.; Boon, N.; Pikaar, I.; Verstraete, W. Microbial protein: Future sustainable food supply route with low environmental footprint. Microb. Biotechnol. 2016, 9, 568–575. [Google Scholar] [CrossRef]
  31. Shah, M.R.; Lutzu, G.A.; Alam, A.; Sarker, P.; Kabir Chowdhury, M.A.; Parsaeimehr, A.; Liang, Y.; Daroch, M. Microalgae in aquafeeds for a sustainable aquaculture industry. J. Appl. Phycol. 2018, 30, 197–213. [Google Scholar] [CrossRef]
  32. Stevens, J.R.; Newton, R.W.; Tlusty, M.; Little, D.C. The rise of aquaculture by-products: Increasing food production, value, and sustainability through strategic utilisation. Mar. Policy 2018, 90, 115–124. [Google Scholar] [CrossRef] [Green Version]
  33. Jackson, A.; Newton, R.W. Project To Model the Use of Fisheries By-Products in the Production of Marine Ingredients with Special Reference to Omega- 3 Fatty Acids EPA and DHA; IFFO, University of Stirling: Stirling, UK, 2016. [Google Scholar]
  34. Schmitt, E.; Belghit, I.; Johansen, J.; Leushuis, R.; Lock, E.J.; Melsen, D.; Ramasamy Shanmugam, R.K.; Van Loon, J.; Paul, A. Growth and safety assessment of feed streams for black soldier fly larvae: A case study with aquaculture sludge. Animals 2019, 9, 189. [Google Scholar] [CrossRef] [Green Version]
  35. Wang, H.; Hagemann, A.; Reitan, K.I.; Ejlertsson, J.; Wollan, H.; Handå, A.; Malzahn, A.M. Potential of the polychaete Hediste diversicolor fed on aquaculture and biogas side streams as an aquaculture food source. Aquac. Environ. Interact. 2019, 11, 551–562. [Google Scholar] [CrossRef] [Green Version]
  36. Lim, J.A.; Loo, P.L.; Tan, K.S.; Ng, N.K. Fish culture waste improves growth and fatty acid composition of the polychaete Namalycastis sp. (Nereididae) and its potential use as feed for mud crabs. Aquac. Res. 2021, 52, 2622–2639. [Google Scholar] [CrossRef]
  37. Marsh, L.; Subler, S.; Mishra, S.; Marini, M. Suitability of aquaculture effluent solids mixed with cardboard as a feedstock for vermicomposting. Bioresour. Technol. 2005, 96, 413–418. [Google Scholar] [CrossRef] [PubMed]
  38. Kouba, A.; Lunda, R.; Hlaváč, D.; Kuklina, I.; Hamáčková, J.; Randák, T.; Kozák, P.; Koubová, A.; Buřič, M. Vermicomposting of sludge from recirculating aquaculture system using Eisenia andrei: Technological feasibility and quality assessment of end-products. J. Clean. Prod. 2018, 177, 665–673. [Google Scholar] [CrossRef]
  39. Ebeling, J.M.; Timmons, M.B. Recirculating aquaculture systems. In Aquaculture Production Systems; Tidwell, J.H., Ed.; John Wiley & Sons, Inc.: Ames, IW, USA, 2012; pp. 245–277. [Google Scholar]
  40. Martins, C.I.M.; Eding, E.H.; Verdegem, M.C.J.; Heinsbroek, L.T.N.; Schneider, O.; Blancheton, J.P.; D’Orbcastel, E.R.; Verreth, J.A.J. New developments in recirculating aquaculture systems in europe: A perspective on environmental sustainability. Aquac. Eng. 2010, 43, 83–93. [Google Scholar] [CrossRef] [Green Version]
  41. Del Campo, L.M.; Ibarra, P.; Gutierrez, X.; Takle, H. Utilization of Sludge from Recirculation Aquaculture Systems—Nofima Report 9/2010; Nofima: Tromsø, Norway, 2010. [Google Scholar]
  42. Sandvold, H.N.; Gregg, J.S.; Olsen, D.S. New pathways for organic waste in land-based farming of salmon: The case of Norway and Denmark. In From Waste to Value: Valorisation Pathways for Organic Waste Streams in Circular Bioeconomies; Klitkou, A., Fevolden, A.M., Capasso, M., Eds.; Routledge: London, UK, 2019; pp. 145–161. [Google Scholar]
  43. Kloas, W.; Groß, R.; Baganz, D.; Graupner, J.; Monsees, H.; Schmidt, U.; Staaks, G.; Suhl, J.; Tschirner, M.; Wittstock, B.; et al. A new concept for aquaponic systems to improve sustainability, increase productivity, and reduce environmental impacts. Aquac. Environ. Interact. 2015, 7, 179–192. [Google Scholar] [CrossRef] [Green Version]
  44. Graber, A.; Junge, R. Aquaponic systems: Nutrient recycling from fish wastewater by vegetable production. Desalination 2009, 246, 147–156. [Google Scholar] [CrossRef]
  45. Rakocy, J.E.; Masser, M.P.; Losordo, T.M. Recirculating Aquaculture Tank Production Systems: Aquaponics—Integrating Fish and Plant Culture; SRAC Publication No. 454; Southern Regional Aquaculture Center: Stoneville, MS, USA, 2006. [Google Scholar]
  46. Baganz, G.F.M.; Junge, R.; Portella, M.C.; Goddek, S.; Keesman, K.J.; Baganz, D.; Staaks, G.; Shaw, C.; Lohrberg, F.; Kloas, W. The aquaponic principle—It is all about coupling. Rev. Aquac. 2022, 14, 252–264. [Google Scholar] [CrossRef]
  47. Eck, M.; Körner, O.; Jijakli, M.H. Nutrient cycling in aquaponics systems. In Aquaponics Food Production Systems; Goddek, S., Joyce, A., Kotzen, B., Burnell, G., Eds.; Springer: Cham, Switzerland, 2019; pp. 231–246. [Google Scholar]
  48. Yep, B.; Zheng, Y. Aquaponic trends and challenges—A review. J. Clean. Prod. 2019, 228, 1586–1599. [Google Scholar] [CrossRef]
  49. Seawright, D.E.; Stickney, R.R.; Walker, R.B. Nutrient dynamics in integrated aquaculture-hydroponics systems. Aquaculture 1998, 160, 215–237. [Google Scholar] [CrossRef]
  50. Delaide, B.; Delhaye, G.; Dermience, M.; Gott, J.; Soyeurt, H.; Jijakli, M.H. Plant and fish production performance, nutrient mass balances, energy and water use of the paff box, a small-scale aquaponic system. Aquac. Eng. 2017, 78, 130–139. [Google Scholar] [CrossRef]
  51. Suhl, J.; Dannehl, D.; Kloas, W.; Baganz, D.; Jobs, S.; Scheibe, G.; Schmidt, U. Advanced aquaponics: Evaluation of intensive tomato production in aquaponics vs. conventional hydroponics. Agric. Water Manag. 2016, 178, 335–344. [Google Scholar] [CrossRef]
  52. Ulrichs, C. CUBES Circle. Available online: https://www.cubescircle.de/en/home/project (accessed on 25 January 2022).
  53. Devic, E.; Leschen, W.; Murray, F.; Little, D.C. Growth performance, feed utilization and body composition of advanced nursing Nile tilapia (Oreochromis niloticus) fed diets containing black soldier fly (Hermetia illucens) larvae meal. Aquac. Nutr. 2018, 24, 416–423. [Google Scholar] [CrossRef] [Green Version]
  54. Belghit, I.; Liland, N.S.; Waagbø, R.; Biancarosa, I.; Pelusio, N.; Li, Y.; Krogdahl, Å.; Lock, E.J. Potential of insect-based diets for atlantic salmon (Salmo salar). Aquaculture 2018, 491, 72–81. [Google Scholar] [CrossRef]
  55. St-Hilaire, S.; Sheppard, C.; Tomberlin, J.K.; Irving, S.; Newton, L.; McGuire, M.A.; Mosley, E.E.; Hardy, R.W.; Sealey, W. Fly prepupae as a feedstuff for rainbow trout, Oncorhynchus mykiss. J. World Aquac. Soc. 2007, 38, 59–67. [Google Scholar] [CrossRef]
  56. Adeoye, A.A.; Akegbejo-Samsons, Y.; Fawole, F.J.; Davies, S.J. Preliminary assessment of black soldier fly (Hermetia illucens) larval meal in the diet of African catfish (Clarias gariepinus): Impact on growth, body index, and hematological parameters. J. World Aquac. Soc. 2020, 51, 1024–1033. [Google Scholar] [CrossRef]
  57. Mertenat, A.; Diener, S.; Zurbrügg, C. Black soldier fly biowaste treatment—Assessment of global warming potential. Waste Manag. 2019, 84, 173–181. [Google Scholar] [CrossRef]
  58. Hernández, C.; Olvera-Novoa, M.A.; Hardy, R.W.; Hermosillo, A.; Reyes, C.; GonzÁlez, B. Complete replacement of fish meal by porcine and poultry by-product meals in practical diets for fingerling Nile tilapia Oreochromis niloticus: Digestibility and growth performance. Aquac. Nutr. 2010, 16, 44–53. [Google Scholar] [CrossRef]
  59. Goda, A.M.; El-Haroun, E.R.; Kabir Chowdhury, M.A. Effect of totally or partially replacing fish meal by alternative protein sources on growth of African catfish Clarias gariepinus (Burchell, 1822) reared in concrete tanks. Aquac. Res. 2007, 38, 279–287. [Google Scholar] [CrossRef]
  60. Yones, A.M.M.; Metwalli, A.A. Effects of fish meal substitution with poultry by-product meal on growth performance, nutrients utilization and blood contents of juvenile Nile tilapia (Oreochromis niloticus). J. Aquac. Res. Dev. 2015, 7, 1000389. [Google Scholar] [CrossRef]
  61. El Boushy, A.R.Y.; van der Poel, A.F.B. Poultry by-products. In Handbook of Poultry Feed from Waste; Springer: Dordrecht, The Netherlands, 2000; pp. 90–152. [Google Scholar]
  62. Kleiber, M. The Fire of Life. An Introduction to Animal Energetics; Krieger Publishing: New York, NY, USA, 1975. [Google Scholar]
  63. Diógenes, A.F.; Fernandes, J.B.K.; Dorigam, J.C.P.; Sakomura, N.K.; Rodrigues, F.H.F.; Lima, B.T.M.; Gonçalves, F.H. Establishing the optimal essential amino acid ratios in juveniles of Nile tilapia (Oreochromis niloticus) by the deletion method. Aquac. Nutr. 2016, 22, 435–443. [Google Scholar] [CrossRef]
  64. Do Nascimento, T.M.T.; Mansano, C.F.M.; Peres, H.; Rodrigues, F.H.F.; Khan, K.U.; Romaneli, R.S.; Sakomura, N.K.; Fernandes, J.B.K. Determination of the optimum dietary essential amino acid profile for growing phase of Nile tilapia by deletion method. Aquaculture 2020, 523, 735204. [Google Scholar] [CrossRef]
  65. Mjoun, K.; Rosentrater, K.; Brown, M.L. Tilapia: Environmental Biology and Nutritional Requirements. Fact Sheets. Paper 164. Available online: http://openprairie.sdstate.edu/extension_fact/164 (accessed on 25 January 2022).
  66. Lall, S.P. The minerals. In Fish Nutrition; Halver, J.E., Hardy, R.W., Eds.; Academic Press: Cambridge, MA, USA, 2003; pp. 259–308. [Google Scholar]
  67. DIN Deutsches Institut für Normung e.V. DIN EN ISO 11885: Water Quality—Determination of Selected Elements by Inductively Coupled Plasma Optical Emission Spectrometry (ICP-OES) (ISO 11885:2007); DIN Deutsches Institut für Normung e.V.: Berlin, Germany, 2009. [Google Scholar]
  68. DIN Deutsches Institut für Normung e.V. DIN EN ISO 16634-2: Food Products—Determination of the Total Nitrogen Content by Combustion According to the Dumas Principle and Calculation of the Crude Protein Content—Part 2: Cereals, Pulses and Milled Cereal Products (ISO 16634-2:2016); DIN Deutsches Institut für Normung e.V.: Berlin, Germany, 2016. [Google Scholar]
  69. EC (European Commission). Commission Regulation (EC) No 152/2009 of 27 January 2009 - Laying Down the Methods of Sampling and Analysis for the Official Control of Feed; EC (European Commission): Brussels, Belgium, 2009. [Google Scholar]
  70. DIN Deutsches Institut für Normung e.V. DIN EN ISO 13903: Animal Feeding Stuffs—Determination of Amino Acids Content (ISO 13903:2005); DIN Deutsches Institut für Normung e.V.: Berlin, Germany, 2005. [Google Scholar]
  71. SGS (SGS Analytics GmbH Germany). FOOD-PA 662: Bestimmung des Gehaltes an Gesamt-Tryptophan (Summe: Frei und Gebunden) in Lebens- und Futtermitteln Mittels LC—Aminosäureanalysator mit Ninhydrin; SGS (SGS Analytics GmbH Germany): Markkleeberg, Germany, 2021; Available online: https://www.sgs-analytics.de/fileadmin/user_as/SGS_Analytics/Urkunden_Zulassungen/Pr%C3%BCfverfahrensliste_SGS_Jena_akkred_Methoden_PL-14004-10_16.07.2021.pdf (accessed on 20 February 2022).
  72. DIN Deutsches Institut für Normung e.V. DIN EN 16174: Sludge, Treated Biowaste and Soil—Digestion of Aqua Regia Soluble Fractions of Elements; DIN Deutsches Institut für Normung e.V.: Berlin, Germany, 2012. [Google Scholar]
  73. Cho, C.Y. Feeding systems for rainbow trout and other salmonids with reference to current estimates of energy and protein requirements. Aquaculture 1992, 100, 107–123. [Google Scholar] [CrossRef]
  74. El-Sayed, A.F.M. Total replacement of fish meal with animal protein sources in Nile tilapia, Oreochromis niloticus (L.), feeds. Aquac. Res. 1998, 29, 275–280. [Google Scholar] [CrossRef] [Green Version]
  75. Fasakin, E.A.; Serwata, R.D.; Davies, S.J. Comparative utilization of rendered animal derived products with or without composite mixture of soybean meal in hybrid tilapia (Oreochromis niloticus × Oreochromis mossambicus) diets. Aquaculture 2005, 249, 329–338. [Google Scholar] [CrossRef]
  76. Agbohessou, P.S.; Mandiki, S.N.M.; Gougbédji, A.; Caparros, R.; Sakhawat, M.; De Jaeger, P.; Larondelle, Y.; Francis, F.; Lalèyè, P.A.; Kestemont, P. Total replacement of fish meal by enriched- fatty acid Hermetia illucens meal did not substantially affect growth parameters or innate immune status and improved whole body biochemical quality of Nile tilapia juveniles. Aquac. Nutr. 2021, 27, 880–896. [Google Scholar] [CrossRef]
  77. Tippayadara, N.; Dawood, M.A.O.; Krutmuang, P.; Hoseinifar, S.H.; Doan, H.V.; Paolucci, M. Replacement of fish meal by black soldier fly (Hermetia illucens) larvae meal: Effects on growth, haematology, and skin mucus immunity of Nile tilapia, oreochromis niloticus. Animals 2021, 11, 193. [Google Scholar] [CrossRef]
  78. Taufek, N.M.; Lim, J.Z.Y.; Bakar, N.H.A. Comparative evaluation of Hermetia illucens larvae reared on different substrates for red tilapia diet: Effect on growth and body composition. J. Insects Food Feed 2020, 7, 79–88. [Google Scholar] [CrossRef]
  79. Rana, K.M.S.; Salam, M.A.; Hashem, S.; Islam, M.A. Development of black soldier fly larvae production technique as an alternate fish feed. Int. J. Res. Fish. Aquac. 2015, 5, 41–47. [Google Scholar]
  80. Muin, H.; Taufek, N.M.; Kamarudin, M.S.; Razak, S.A. Growth performance, feed utilization and body composition of Nile tilapia, Oreochromis niloticus (Linnaeus, 1758) fed with different levels of black soldier fly, Hermetia illucens (Linnaeus, 1758) maggot meal diet. Iran. J. Fish. Sci. 2017, 16, 567–577. [Google Scholar]
  81. Priyadarshana, K.C.; Ruwandeepika, D. Substitution of fishmeal with black soldier fly Hermetia illucens Linnaeus, 1758 larvae in finfish aquaculture—A review. Asian Fish. Sci. 2021, 34, 114. [Google Scholar] [CrossRef]
  82. Henry, M.; Gasco, L.; Piccolo, G.; Fountoulaki, E. Review on the use of insects in the diet of farmed fish: Past and future. Anim. Feed Sci. Technol. 2015, 203, 1–22. [Google Scholar] [CrossRef]
  83. Fontes, T.V.; Oliveira, K.R.B.; Almeida, I.L.G.; Orlando, T.M.; Borges, R.P.; Costa, D.V.; Rosa, P.V. Digestibility of insect meals for Nile tilapia fingerlings. Animals 2019, 9, 181. [Google Scholar] [CrossRef] [PubMed] [Green Version]
  84. Shiau, S.Y.; Yu, Y.P. Dietary supplementation of chitin and chitosan depresses growth in tilapia, Oreochromis niloticus × O. Aureus. Aquaculture 1999, 179, 439–446. [Google Scholar] [CrossRef]
  85. Kroeckel, S.; Harjes, A.G.E.; Roth, I.; Katz, H.; Wuertz, S.; Susenbeth, A.; Schulz, C. When a turbot catches a fly: Evaluation of a pre-pupae meal of the black soldier fly (Hermetia illucens) as fish meal substitute—Growth performance and chitin degradation in juvenile turbot (Psetta maxima). Aquaculture 2012, 364–365, 345–352. [Google Scholar] [CrossRef]
  86. St-Hilaire, S.; Cranfill, K.; McGuire, M.A.; Mosley, E.E.; Tomberlin, J.K.; Newton, L.; Sealey, W.; Sheppard, C.; Irving, S. Fish offal recycling by the black soldier fly produces a foodstuff high in omega-3 fatty acids. J. World Aquac. Soc. 2007, 38, 309–313. [Google Scholar] [CrossRef]
  87. Barroso, F.G.; Sánchez-Muros, M.J.; Segura, M.; Morote, E.; Torres, A.; Ramos, R.; Guil, J.L. Insects as food: Enrichment of larvae of Hermetia illucens with omega 3 fatty acids by means of dietary modifications. J. Food Compos. Anal. 2017, 62, 8–13. [Google Scholar] [CrossRef]
  88. Liland, N.S.; Biancarosa, I.; Araujo, P.; Biemans, D.; Bruckner, C.G.; Waagbø, R.; Torstensen, B.E.; Lock, E.J. Modulation of nutrient composition of black soldier fly (Hermetia illucens) larvae by feeding seaweed-enriched media. PLoS ONE 2017, 12, e0183188. [Google Scholar] [CrossRef]
  89. Liu, X.; Chen, X.; Wang, H.; Yang, Q.; Ur Rehman, K.; Li, W.; Cai, M.; Li, Q.; Mazza, L.; Zhang, J.; et al. Dynamic changes of nutrient composition throughout the entire life cycle of black soldier fly. PLoS ONE 2017, 12, e0182601. [Google Scholar] [CrossRef] [Green Version]
  90. Otubusin, S.O. Effects of different levels of blood meal in pelleted feeds on tilapia, Oreochromis niloticus, production in floating bamboo net-cages. Aquaculture 1987, 65, 263–266. [Google Scholar] [CrossRef]
  91. Kirimi, J.G.; Musalia, L.M.; Magana, A.; Munguti, J.M. Performance of Nile tilapia (Oreochromis niloticus) fed diets containing blood meal as a replacement of fish meal. J. Agric. Sci. 2016, 8, 79–87. [Google Scholar] [CrossRef]
  92. Aladetohun, N.F.; Sogbesan, O.A. Utilization of blood meal as a protein ingredient from animal waste product in the diet of Oreochromis niloticus. Int. J. Fish. Aquac. 2013, 5, 234–237. [Google Scholar]
  93. Ogello, E.O.; Munguti, J.M.; Sakakura, Y.; Hagiwara, A. Complete replacement of fish meal in the diet of Nile tilapia (Oreochromis niloticus L.) grow-out with alternative protein sources. A Review. Int. J. Adv. Res. 2014, 2, 962–978. [Google Scholar]
  94. Ng, W.; Romano, N. A review of the nutrition and feeding management of farmed tilapia throughout the culture cycle. Rev. Aquac. 2013, 5, 220–254. [Google Scholar] [CrossRef]
  95. Strauch, S.M.; Wenzel, L.C.; Bischoff, A.; Dellwig, O.; Klein, J.; Schüch, A.; Wasenitz, B.; Palm, H.W. Commercial African catfish (Clarias gariepinus) recirculating aquaculture systems: Assessment of element and energy pathways with special focus on the phosphorus cycle. Sustainability 2018, 10, 1805. [Google Scholar] [CrossRef] [Green Version]
  96. Halver, J.E.; Hardy, R.W. Nutrient flow and retention. In Fish Nutrition; Halver, J.E., Hardy, R.W., Eds.; Academic Press: Cambridge, MA, USA, 2003; pp. 755–770. [Google Scholar]
  97. Robaina, L.; Pirhonen, J.; Mente, E.; Sánchez, J.; Goosen, N. Fish diets in aquaponics. In Aquaponics Food Production Systems; Springer: Cham, Switzerland, 2019; pp. 333–352. [Google Scholar] [CrossRef] [Green Version]
  98. Munguti, J.M.; Kirimi, J.G.; Obiero, K.O.; Ogello, E.O.; Kyule, D.N.; Liti, D.M.; Musalia, L.M. Aqua-feed wastes: Impact on natural systems and practical mitigations—A review. J. Agric. Sci. 2021, 13, 111. [Google Scholar] [CrossRef]
  99. Teodósio, R.; Engrola, S.; Colen, R.; Masagounder, K.; Aragão, C. Optimizing diets to decrease environmental impact of Nile tilapia (Oreochromis niloticus) production. Aquac. Nutr. 2020, 26, 422–431. [Google Scholar] [CrossRef]
  100. Turcios, A.E.; Papenbrock, J. Sustainable treatment of aquaculture effluents—What can we learn from the past for the future? Sustainability 2014, 6, 836–856. [Google Scholar] [CrossRef] [Green Version]
  101. Tschirner, M.; Simon, A. Influence of different growing substrates and processing on the nutrient composition of black soldier fly larvae destined for animal feed. J. Insects Food Feed 2015, 1, 249–259. [Google Scholar] [CrossRef]
  102. Abd El-Hack, M.E.; Shafi, M.E.; Alghamdi, W.Y.; Abdelnour, S.A.; Shehata, A.M.; Noreldin, A.E.; Ashour, E.A.; Swelum, A.A.; Al-sagan, A.A.; Alkhateeb, M.; et al. Black soldier fly (Hermetia illucens) meal as a promising feed ingredient for poultry: A comprehensive review. Agriculture 2020, 10, 339. [Google Scholar] [CrossRef]
  103. Monsees, H.; Keitel, J.; Paul, M.; Kloas, W.; Wuertz, S. Potential of aquacultural sludge treatment for aquaponics: Evaluation of nutrient mobilization under aerobic and anaerobic conditions. Aquac. Environ. Interact. 2017, 9, 9–18. [Google Scholar] [CrossRef] [Green Version]
  104. Goddek, S.; Delaide, B.P.L.; Joyce, A.; Wuertz, S.; Jijakli, M.H.; Gross, A.; Eding, E.H.; Bläser, I.; Reuter, M.; Keizer, L.C.P.; et al. Nutrient mineralization and organic matter reduction performance of RAS- based sludge in sequential UASB-EGSB reactors. Aquac. Eng. 2018, 83, 10–19. [Google Scholar] [CrossRef]
  105. Gold, M.; Tomberlin, J.K.; Diener, S.; Zurbrügg, C.; Mathys, A. Decomposition of biowaste macronutrients, microbes, and chemicals in black soldier fly larval treatment: A review. Waste Manag. 2018, 82, 302–318. [Google Scholar] [CrossRef] [PubMed]
  106. Sanchez Matos, J.; Barberino, A.T.M.S.; de Araujo, L.P.; Lôbo, I.P.; de Almeida Neto, J.A. Potentials and limitations of the bioconversion of animal manure using fly larvae. Waste Biomass Valorization 2020, 12, 3497–3520. [Google Scholar] [CrossRef]
  107. El-Dakar, M.A.; Ramzy, R.R.; Plath, M.; Ji, H. Evaluating the impact of bird manure vs. mammal manure on Hermetia illucens larvae. J. Clean. Prod. 2021, 278, 123570. [Google Scholar] [CrossRef]
  108. Newton, L.; Sheppard, C.; Watson, D.W.; Burtle, G.; Dove, R. Using the Black Soldier Fly, Hermetia illucens, as a Value-Added Tool for the Management of Swine Manure; Report for Mike Williams, Director of the Animal and Poultry Waste Management Centre; North Carolina State University: Raleigh, NC, USA, 2005. [Google Scholar]
  109. Schiavone, A.; De Marco, M.; Martínez, S.; Dabbou, S.; Renna, M.; Madrid, J.; Hernandez, F.; Rotolo, L.; Costa, P.; Gai, F.; et al. Nutritional value of a partially defatted and a highly defatted black soldier fly larvae (Hermetia illucens L.) meal for broiler chickens: Apparent nutrient digestibility, apparent metabolizable energy and apparent ileal amino acid digestibility. J. Anim. Sci. Biotechnol. 2017, 8, 51. [Google Scholar] [CrossRef] [PubMed]
  110. Spranghers, T.; Ottoboni, M.; Klootwijk, C.; Ovyn, A.; Deboosere, S.; De Meulenaer, B.; Michiels, J.; Eeckhout, M.; De Clercq, P.; De Smet, S. Nutritional composition of black soldier fly (Hermetia illucens) prepupae reared on different organic waste substrates. J. Sci. Food Agric. 2017, 97, 2594–2600. [Google Scholar] [CrossRef] [PubMed]
  111. De Marco, M.; Martínez, S.; Hernandez, F.; Madrid, J.; Gai, F.; Rotolo, L.; Belforti, M.; Bergero, D.; Katz, H.; Dabbou, S.; et al. Nutritional value of two insect larval meals (Tenebrio molitor and Hermetia illucens) for broiler chickens: Apparent nutrient digestibility, apparent ileal amino acid digestibility and apparent metabolizable energy. Anim. Feed Sci. Technol. 2015, 209, 211–218. [Google Scholar] [CrossRef]
  112. Barragán-Fonseca, K.B. Flies Are What They Eat—Tailoring Nutrition of bsf (Hermetia illucens) for Larval Biomass Production and Fitness. Ph.D. Thesis, Wageningen University, Wageningen, The Netherlands, 2018. [Google Scholar]
  113. Woods, M.J. The Determination of Nutrient Requirements and Development of Artificial Diets for the Mass Rearing of Insects of Economic Importance. Master’s Thesis, Stellenbosch University, Stellenbosch, South Africa, 2017. [Google Scholar]
  114. Rock, G.C.; King, K.W. Quantitative amino acid requirements of the red-banded leaf roller, Argyrotaenia velutinana (Lepidoptera: Tortricidae). J. Insect Physiol. 1967, 13, 175–186. [Google Scholar] [CrossRef]
  115. Furuya, W.M.; Pezzato, L.E.; Barros, M.M.; Pezzato, A.C.; Furuya, V.R.B.; Miranda, E.C. Use of ideal protein concept for precision formulation of amino acid levels in fish-meal-free diets for juvenile Nile tilapia (Oreochromis niloticus L.). Aquac. Res. 2004, 35, 1110–1116. [Google Scholar] [CrossRef]
  116. Wilson, R.P. Amino acids and proteins. In Fish Nutrition; Halver, J.E., Hardy, R.W., Eds.; Academic Press: Cambridge, MA, USA, 2003; pp. 143–178. [Google Scholar]
  117. Boisen, S.; Hvelplund, T.; Weisbjerg, M.R. Ideal amino acid profiles as a basis for feed protein evaluation. Livest. Prod. Sci. 2000, 64, 239–251. [Google Scholar] [CrossRef]
  118. Chen, X.; Zhao, G.; Zhang, Y.; Han, L.; Xiao, W. Nitrogen-to-protein conversion factors for crop residues and animal manure common in China. J. Agric. Food Chem. 2017, 65, 9186–9190. [Google Scholar] [CrossRef] [PubMed]
  119. Martin, J.H., Jr.; Loehr, R.C.; Pilbeamt, T.E. Animal manures as feedstuffs: Nutrient characteristics. Agric. Wastes 1983, 6, 131–166. [Google Scholar] [CrossRef]
  120. Caligiani, A.; Marseglia, A.; Leni, G.; Baldassarre, S.; Maistrello, L.; Dossena, A.; Sforza, S. Composition of black soldier fly prepupae and systematic approaches for extraction and fractionation of proteins, lipids and chitin. Food Res. Int. 2018, 105, 812–820. [Google Scholar] [CrossRef] [PubMed]
  121. Tran, G.; Gnaedinger, C.; Mélin, C. Black Soldier Fly Larvae (Hermetia illucens). Feedipedia, a Programme by INRAE, CIRAD, AFZ and FAO. Available online: https://www.feedipedia.org/node/16388 (accessed on 25 January 2022).
Figure 1. Individual RAS setup. A: fish rearing compartment; B: sedimentation chamber; C fixed-bed biofilters (filter sponges); D: moving-bed biofilter; E: circular air stones; F: biomedia; G: aquarium heater; H: stand pipe outlet to common pump sump; I: air lift.
Sustainability 14 04064 g001
Figure 2. Dissolved plant macronutrients in RAS water. Error bars represent standard deviations; different letters in each column of the tables below the graphs indicate a significant difference between groups (p < 0.05); n = 4.
Sustainability 14 04064 g002
Figure 3. Dissolved micronutrients in RAS water. Error bars represent standard deviations; different letters in each column of the tables below the graphs indicate a significant difference between groups (p < 0.05); n = 4.
Sustainability 14 04064 g003
Figure 4. Recovery of DM, nutrients, and energy through feces collection expressed as % of the total amount of DM, the respective nutrient and energy fed throughout the trial (A), and as g per kg of feed fed (as is) (B).
Sustainability 14 04064 g004
Table 1. Experimental diet formulation, ingredients cost, and proximate composition.
Ingredient Composition (% Incorporation)Experimental Diets
FMBSFPBMPM
Fish meal 151.0---
Black soldier fly larvae meal 2-61.6--
Poultry blood meal 3--37.2-
Poultry meal 4---56.4
Wheat bran 529.819.939.426.0
Corn meal 611.011.011.011.0
Vitamin and mineral premix 71.01.01.01.0
Dicalcium phosphate (DCP) 81.21.21.21.2
Fish oil 93.03.03.03.0
Poultry fat 103.02.37.21.4
Total100.0100.0100.0100.0
Ingredient cost (€/kg) 111.111.990.720.72
Proximate composition (%—as fed) 12
Dry matter (DM)91.90 ± 0.1092.30 ± 0.1091.60 ± 0.1093.05 ± 0.15
Crude protein (N × 6.25) (CP)40.30 ± 0.4040.35 ± 0.0540.90 ± 0.1043.70 ± 0.10
Crude fat (CF)11.55 ± 0.1511.10 ± 0.2011.60 ± 0.1011.85 ± 0.25
Crude fiber (CFB)2.85 ± 0.058.05 ± 0.154.20 ± 0.003.10 ± 0.00
Ash11.65 ± 0.058.25 ± 0.054.35 ± 0.0510.85 ± 0.05
Starch12.05 ± 0.4512.65 ± 0.2513.45 ± 0.059.00 ± 1.00
Nitrogen-free extract (NFE) 1325.55 ± 0.0524.55 ± 0.5530.55 ± 0.3523.55 ± 0.45
Gross energy (GE) (MJ/kg) 1418.48 ± 0.0318.14 ± 0.0019.49 ± 0.0019.05 ± 0.05
P/E ratio (g protein/MJ GE)21.81 ± 0.0322.25 ± 0.0320.98 ± 0.0522.93 ± 0.00
1 Super Prime: 66.3% CP, 11.5% CF, Pesquera Diamante, Peru. 2 Protein X (defatted Hermetia illucens meal): 58% CP, 9% CF, Protix B.V., The Netherlands. 3 Poultry blood meal: 89% CP, 0.47% CF, SONAC, The Netherlands. 4 Poultry meal 65: 65% CP, 12% CF, SAVINOR UTS, Portugal. 5 Wheat bran: 14.8% CP, 4.7% CF, Ribeiro e Sousa Lda, Portugal. 6 Corn meal: 8.6% CP; 4.3% CF, Casa Lanchinha, Portugal. 7 PREMIX Lda, Portugal. 8 DCP: 16.8% P, 20.9% Ca, PREMIX Lda, Portugal. 9 Sopropêche, France. 10 SAVINOR UTS, Portugal. 11 As acquired by SPAROS I&D. 12 Analyzed in duplicate; percentages given on as-fed basis; values represent means ± standard deviations. 13 NFE = 100% − (% CP + % CF + % CFB + % ash + % moisture). 14 Calculated using the factors 17.15, 23.64, 39.54 MJ/kg for NFE (carbohydrates), CP and CF, respectively [62].
Table 2. Diet amino acid composition, mineral composition, and published requirements of young Nile tilapia adapted from [63,64,65,66].
Experimental DietsRequirements
FMBSFPBMPM
Essential amino acids (EAAs) (%—as fed) [63][64]
Arginine (Arg)2.481.882.323.071.951.36
Histidine (His)1.241.182.070.990.540.47
Isoleucine (Ile)1.791.591.711.600.880.89
Leucine (Leu)3.202.524.242.961.501.33
Lysine (Lys)3.111.913.222.511.561.59
Methionine (Met)1.100.530.530.78-0.65
Phenylalanine (Phe)1.711.432.431.67-1.01
Threonine (Thr)1.751.471.961.631.451.64
Tryptophan (Trp)0.510.530.770.370.370.25
Valine (Val)1.861.892.291.711.180.96
Met + Cys1.530.851.091.260.99-
Phe + Tyr2.923.063.422.851.57-
Sum EAAs18.7514.9321.5417.2911.9910.15
Non-essential amino acids (NEAAs) (%—as fed)
Alanine (Ala)2.702.642.972.92
Cysteine (Cys)0.430.320.560.48
Glycine (Gly)2.652.121.704.66
Proline (Pro)1.982.391.813.02
Serine (Ser)1.611.571.761.79
Aspartic acid (Asp) + asparagine (Asn)3.583.103.453.29
Glutamic acid (Glu) + glutamine (Gln)5.854.784.755.99
Tyrosine (Tyr)1.211.630.991.18
Sum NEAAs20.0118.5517.9923.33
Minerals (g/kg—as fed) [65][66]
Ca26.7114.225.7227.607–7.5-
P19.1212.107.8318.649–109
S4.992.983.434.34
Mg2.213.481.411.760.5–0.590.6
Fe0.310.160.850.130.085–0.16-
Na3.270.931.252.78
K8.5712.635.957.682–3-
Al0.250.040.010.02
Zn0.0890.1510.0550.0920.02–0.030.02
Mn0.0470.2420.0500.046-0.01
Cu0.0150.0210.0140.018-0.0035
Ti (mg/kg)8.961.400.480.91
Cr (mg/kg)3.441.952.193.62
Ni (mg/kg)1.150.560.460.70
Co (mg/kg)0.720.130.180.77
Pb (mg/kg)0.540.070.660.11
Cd (mg/kg)0.610.470.070.09
Table 3. Experimental rearing conditions.
FMBSFPBMPM
O2 (mg/L) 17.42 ± 0.327.25 ± 0.327.46 ± 0.297.29 ± 0.32
Temperature (°C) 126.6 ± 126.6 ± 0.826.6 ± 0.726.7 ± 0.8
pH 17.86 ± 0.317.90 ± 0.238.09 ± 0.127.67 ± 0.49
Conductivity (µS/cm) 1995 ± 701006 ± 76965 ± 511005 ± 78
Water exchange (%/d)5.05.05.05.0
Final water exchange (L/kg feed/d)574574574574
NH4+-N (mg/L) 20.22 ± 0.110.25 ± 0.120.20 ± 0.100.21 ± 0.11
NO2--N (mg/L) 2<0.05<0.05<0.05<0.05
Values represent means ± standard deviations; n = 4. 1 Measured once daily before water exchange and feeding (n = 196). 2 Sampled once weekly before water exchange and feeding (n = 32).
Table 4. Fish performance indices and feed costs.
Fish Performance
FMBSFPBMPM
Survival (%) A82.5 ± 11.0 a93.3 ± 4.7 a85.0 ± 3.3 a83.3 ± 9.4 a
Initial body weight (g) C11.30 ± 1.36 a11.24 ± 1.27 a11.15 ± 1.23 a11.36 ± 1.41 a
Final body weight (g) B31.81 ± 4.48 a26.67 ± 3.77 b21.10 ± 2.87 c30.88 ± 4.53 a
BWG (g) 1A20.61 ± 0.76 a15.44 ± 0.69 b9.96 ± 0.24 c19.65 ± 1.68 a
Initial total length (cm) C8.60 ± 0.37 a8.60 ± 0.35 a8.58 ± 0.33 a8.64 ± 0.35 a
Final total length (cm) C12.31 ± 0.76 a11.60 ± 0.72 b10.72 ± 0.62 c12.19 ± 0.80 a
LG (cm) 2A3.73 ± 0.14 a3.01 ± 0.13 b2.14 ± 0.07 c3.57 ± 0.22 a
Initial biomass (g) A339 ± 8 a337 ± 9 a334 ± 4 a341 ± 1 a
Final biomass (g) A787 ± 86 a747 ± 33 a538 ± 17 b772 ± 55 a
Feed administered (g—as is)509509509509
MDR (% biomass/d) 3D1.85 ± 0.49 b1.95 ± 0.52 b2.35 ± 0.65 a1.88 ± 0.50 b
FCR (as fed) 4A0.86 ± 0.03 c1.11 ± 0.05 b1.79 ± 0.05 a0.92 ± 0.01 c
FCR (DM basis) 4A0.79 ± 0.03 c1.03 ± 0.05 b1.64 ± 0.05 a0.86 ± 0.01 c
SGR 5A2.12 ± 0.04 a1.76 ± 0.07 b1.30 ± 0.02 c2.05 ± 0.11 a
CF 6B1.70 ± 0.12 a1.71 ± 0.14 a1.70 ± 0.12 a1.70 ± 0.14 a
PER 7A2.88 ± 0.12 a2.23 ± 0.10 c1.37 ± 0.04 d2.47 ± 0.03 b
TGC 8A0.62 ± 0.01 a0.50 ± 0.02 b0.36 ± 0.01 c0.60 ± 0.04 a
Feed ingredient cost (€/kg body weight gain) a0.96 ± 0.04 c2.21 ± 0.10 a1.29 ± 0.04 b0.67 ± 0.01 d
Values represent means ± standard deviations; means in rows with different superscript letters are significantly different (p < 0.05). A n = 4; B n = 99–120; C n = 120; D n = 196. 1 BWG—mean body weight gain (g) = final mean body weight (g) − initial mean body weight (g). 2 LG—body length gain (cm) = final mean body length (cm)—initial mean body length (cm). 3 MDR—mean daily ration (%/d) = Sum(ri × 100)/trial duration (days); where i = day of trial (1–49) such that ri = ration (g)/biomass (g) of day i. 4 FCR—feed conversion ration = total feed fed per individual (g as fed or DM)/[final mean body weight (g)—initial mean body weight (g)]. 5 SGR—specific growth rate = [[ln(final mean body weight(g))—ln(initial mean body weight (g))]/trial duration (days)]] × 100. 6 CF—condition factor = (body weight (g)/total length (cm)3) × 100. 7 PER—protein efficiency ratio = (mean individual body weight gain (g)/CP fed per individual (g)). 8 TGC—thermal growth coefficient = 1000 × (final body weight (g) 1/3—initial body weight (g) 1/3) × (trial duration (days) × average temperature (°C)) [73].
Table 5. Feces proximate, amino acid, and mineral composition (DM basis).
Proximate Composition (%)Feces
FMBSFPBMPM
Crude protein (CP)15.35 ± 0.71 c26.58 ± 0.48 b53.43 ± 2.13 a17.23 ± 0.96 c
Crude fat (CF)14.75 ± 0.33 b33.90 ± 1.04 a11.08 ± 0.73 c14.33 ± 0.45 b
Crude fiber (CFB)2.90 ± 0.14 a2.78 ± 0.19 a2.40 ± 0.54 a3.05 ± 0.66 a
Ash21.83 ± 1.80 a10.48 ± 0.64 b6.18 ± 0.30 c21.40 ± 0.38 a
Starch1.50 ± 0.08 b2.50 ± 0.12 a1.70 ± 0.39 b1.50 ± 0.14 b
Nitrogen-free extract (NFE)45.18 ± 2.08 a26.28 ± 1.74 b26.93 ± 1.89 b44.00 ± 1.13 a
Gross energy (GE) (MJ/kg)12.52 ± 0.24 b11.89 ± 0.28 c18.20 ± 0.25 a12.82 ± 0.23 b
P/E ratio (g protein/MJ GE)12.26 ± 0.70 c22.37 ± 0.88 b29.35 ± 0.86 a13.43 ± 0.73 c
EAAs/NEAAs (%)
Arginine (Arg)0.57 ± 0.03 c0.48 ± 0.03 d2.72 ± 0.12 a0.90 ± 0.06 b
Histidine (His)0.27 ± 0.01 c0.60 ± 0.03 b3.05 ± 0.14 a0.22 ± 0.05 c
Isoleucine (Ile)0.44 ± 0.02 c0.61 ± 0.01 b2.34 ± 0.14 a0.66 ± 0.03 b
Leucine (Leu)0.70 ± 0.02 d0.93 ± 0.01 c6.36 ± 0.30 a1.07 ± 0.04 b
Lysine (Lys)0.42 ± 0.01 c0.51 ± 0.02 b4.16 ± 0.22 a0.55 ± 0.02 b
Methionine (Met)0.28 ± 0.02 b0.19 ± 0.01 d0.64 ± 0.03 a0.24 ± 0.01 c
Phenylalanine (Phe)0.52 ± 0.01 c0.62 ± 0.05 bc3.62 ± 0.12 a0.73 ± 0.03 b
Threonine (Thr)0.50 ± 0.02 d0.61 ± 0.01 c2.78 ± 0.12 a0.74 ± 0.03 b
Tryptophan (Trp)0.13 ± 0.01 c0.18 ± 0.01 b0.92 ± 0.05 a0.13 ± 0.01 c
Valine (Val)0.47 ± 0.02 c0.76 ± 0.01 b3.25 ± 0.18 a0.76 ± 0.04 b
Sum EAAs4.29 ± 0.12 c5.47 ± 0.12 b29.82 ± 1.34 a6.00 ± 0.29 b
Alanine (Ala)0.82 ± 0.03 c1.09 ± 0.03 b4.50 ± 0.20 a1.13 ± 0.07 b
Cysteine (Cys)0.18 ± 0.00 c0.18 ± 0.01 c0.79 ± 0.02 a0.34 ± 0.01 b
Glycine (Gly)1.14 ± 0.05 c1.52 ± 0.05 b2.37 ± 0.10 a1.69 ± 0.12 b
Proline (Pro)0.69 ± 0.04 d0.85 ± 0.03 c2.32 ± 0.08 a1.13 ± 0.05 b
Serine (Ser)0.49 ± 0.02 d0.60 ± 0.03 c2.23 ± 0.09 a0.75 ± 0.01 b
Aspartic acid (Asp) + asparagine (Asn)0.98 ± 0.03 c0.93 ± 0.02 c4.74 ± 0.21 a1.25 ± 0.05 b
Glutamic acid (Glu) + glutamine (Gln)1.10 ± 0.03 c1.30 ± 0.05 c5.69 ± 0.30 a1.65 ± 0.05 b
Tyrosine (Tyr)0.36 ± 0.01 c-1.03 ± 0.03 a0.53 ± 0.03 b
Sum NEAAs5.74 ± 0.17 c6.45 ± 0.15 c23.65 ± 1.00 a8.46 ± 0.38 b
Mineral composition (g/kg)
Ca64.57 ± 2.63 a24.98 ± 3.03 b13.45 ± 1.31 c65.96 ± 5.98 a
P28.96 ± 1.11 a12.55 ± 1.17 b9.43 ± 0.63 b28.17 ± 2.32 a
S2.85 ± 0.08 b2.46 ± 0.16 c5.00 ± 0.37 a2.95 ± 0.12 b
Mg2.58 ± 0.06 a2.05 ± 0.29 b1.34 ± 0.12 c1.99 ± 0.17 b
Fe1.09 ± 0.09 b0.53 ± 0.06 c1.83 ± 0.25 a0.50 ± 0.07 c
Na1.00 ± 0.02 a0.51 ± 0.08 b0.36 ± 0.02 b0.96 ± 0.08 a
K0.70 ± 0.01 a0.68 ± 0.10 a0.38 ± 0.02 b0.56 ± 0.06 a
Al0.70 ± 0.01 a0.16 ± 0.02 b0.04 ± 0.01 d0.09 ± 0.01 c
Zn0.28 ± 0.02 b0.45 ± 0.06 a0.13 ± 0.01 c0.32 ± 0.03 b
Mn0.16 ± 0.01 b0.48 ± 0.07 a0.08 ± 0.01 c0.15 ± 0.01 bc
Cu0.05 ± 0.00 a0.06 ± 0.01 a0.03 ± 0.00 b0.06 ± 0.01 a
Ti (mg/kg)27.64 ± 1.03 a4.64 ± 0.97 b1.32 ± 0.68 c3.58 ± 1.40 bc
Cr (mg/kg)10.13 ± 0.36 b6.32 ± 0.97 c3.90 ± 0.45 d12.10 ± 1.19 a
Ni (mg/kg)3.04 ± 0.19 a1.87 ± 0.29 bc1.55 ± 0.23 c2.41 ± 0.42 ab
Co (mg/kg)1.76 ± 0.05 a0.45 ± 0.06 b0.36 ± 0.05 b2.21 ± 0.56 a
Pb (mg/kg)1.63 ± 0.38 a1.17 ± 0.13 ab1.56 ± 0.11 ab0.96 ± 0.39 b
Cd (mg/kg)1.38 ± 0.02 a1.00 ± 0.08 b0.12 ± 0.02 d0.24 ± 0.02 c
Values represent means ± standard deviations; means in rows with different superscript letters are significantly different (p < 0.05); n = 4.
Table 6. DM, nutrient, and GE recovery through feces collection expressed as % of the total amount of DM, the respective nutrient and energy fed throughout the trial (A), and as g per kg of feed fed (as is) (B).
Nutrient Recovery
FMBSFPBMPM
Feed administered (g—as is)509509509509
Feed administered (g DM)468470466474
Feces collected (g—as is)728 ± 47 c816 ± 50 b1064 ± 20 a754 ± 12 bc
Feces collected (g DM)82.63 ± 5.06 b78.60 ± 5.30 b158.04 ± 4.22 a85.22 ± 1.68 b
(A) Recovery (% of the total amount of DM/the respective nutrient/energy fed throughout the trial)
DM17.66 ± 1.08 b16.73 ± 1.13 b33.89 ± 0.91 a17.99 ± 0.35 b
Crude protein5.97 ± 0.58 c9.87 ± 0.79 b39.27 ± 2.23 a6.49 ± 0.37 c
Crude fat4.08 ± 0.42 b3.85 ± 0.19 b6.45 ± 1.56 a4.30 ± 0.88 b
Crude fiber83.92 ± 3.27 a65.12 ± 6.41 b81.87 ± 6.11 a77.33 ± 1.86 a
Ash30.50 ± 4.26 b19.65 ± 2.43 c44.08 ± 2.87 a33.02 ± 1.12 b
Starch2.02 ± 0.19 b3.06 ± 0.31 ab3.94 ± 0.99 a2.79 ± 0.23 ab
NFE28.65 ± 1.05 b16.47 ± 0.42 c27.33 ± 1.44 b31.28 ± 1.25 a
Gross energy (MJ/kg)11.00 ± 0.57 b10.11 ± 0.45 b28.98 ± 1.02 a11.26 ± 0.23 b
(B) Recovery per kg of feed (as is) (g/kg)
DM162.31 ± 9.94 b154.39 ± 10.41 b310.42 ± 8.28 a167.39 ± 3.30 b
Crude protein24.95 ± 2.43 c41.05 ± 3.28 b165.90 ± 9.42 a28.83 ± 1.63 c
Crude fat4.72 ± 0.48 b4.27 ± 0.21 b7.48 ± 1.81 a5.09 ± 1.04 b
Crude fiber23.92 ± 0.93 c52.42 ± 5.16 a34.38 ± 2.56 b23.97 ± 0.58 c
Ash35.53 ± 4.96 a16.21 ± 2.00 b19.18 ± 1.25 b35.83 ± 1.22 a
Starch2.44 ± 0.23 b3.86 ± 0.39 ab5.30 ± 1.33 a2.51 ± 0.21 b
NFE73.20 ± 2.68 b40.44 ± 1.03 c83.49 ± 4.41 a73.67 ± 2.94 b
Gross energy (MJ/kg)2.03 ± 0.11 bc1.83 ± 0.08 c5.65 ± 0.20 a2.15 ± 0.04 b
Values represent means ± standard deviations; means in rows with different superscript letters are significantly different (p < 0.05); n = 4.
Publisher’s Note: MDPI stays neutral with regard to jurisdictional claims in published maps and institutional affiliations.

