Article

Promoting Self-Regulated Learning for Students in Underdeveloped Areas: The Case of Indonesia Nationwide Online-Learning Program

1
Department of Software Engineering, School of Applied STEM, Universitas Prasetiya Mulya, South Jakarta 12430, Indonesia
2
School of Business and Economics, Universitas Prasetiya Mulya, South Jakarta 12430, Indonesia
3
Department of Food Technology, School of Applied STEM, Universitas Prasetiya Mulya, South Jakarta 12430, Indonesia
4
Informatics Department, Universitas Gunadharma, West Jakarta 11730, Indonesia
*
Author to whom correspondence should be addressed.
Sustainability 2022, 14(7), 4075; https://0-doi-org.brum.beds.ac.uk/10.3390/su14074075
Submission received: 14 March 2022 / Accepted: 23 March 2022 / Published: 30 March 2022

Abstract

:
The COVID-19 pandemic has caused educators around the world to access online-learning systems. Applying the online system involves challenges, such as the students’ need to cope with changes in their learning process, where they must develop capabilities to manage their learning more independently. Self-Regulated Learning (SRL) is an approach considered to help us understand students’ ability to manage their learning strategies and achieve improved performance. This paper aims to investigate the SRL of Indonesian students in underdeveloped areas when using a learning management system (LMS), namely SPADA, initiated by the Indonesian government. This study employed the clickstream data (CSD) of SPADA to examine students’ SRL within the first nine months of its implementation. We also analyzed the correlation of certain activities in SPADA with the students’ SRL results. The findings suggest some positive indications of SPADA implementation, particularly in promoting the students’ SRL, either students in general or in the underdeveloped areas. Some improvements indeed still need to be made on the system, including in improving the platform architecture to gain a better measurement method on students’ SRL.

1. Introduction

The COVID-19 pandemic triggered extreme changes in almost all human activities, including in higher education. Strict social distancing regulations exerted by governments around the world forced higher education courses to become fully remote, using online learning formats immediately. One of the changes, referred to as emerging distance education, has inevitably caused several issues involving digital infrastructure, e-course materials, e-evaluation methods, and a lack of students’ motivation [1,2,3,4,5]. Higher education institutions globally responded to the sudden changes by developing several approaches (both technical and non-technical) to facilitate e-learning processes. Indeed, the shocking COVID-19 crisis motivated educational institutions as well as governments to generate innovations in e-learning systems that were as effective as possible. In this regard, the government in many countries faced complex and urgent educational issues that needed quick solutions [4]. Amongst the urgent issues was the inequality of access to education that became more visible during the pandemic in developing countries [6], including Indonesia [7,8].
Indonesia, as the fourth most populous nation globally, still lacks adequate human capital qualities [9,10] and has inescapably faced the complex issue of unequal education access during the pandemic. As an archipelago country (with more than 17 thousand islands), Indonesia incorporates distributed location spread across the country. Within Indonesia, 122 areas are considered underdeveloped areas or have low economic growth, lack good public infrastructure (e.g., electricity and internet connections), and offer poor health services [11]. The Indonesian government named these areas as the Frontier, Outermost, and Disadvantaged, or 3T (which stands for ‘Terdepan, Terluar, Tertinggal’ in the Indonesian language). In this regard, 3T areas are also referred to as having territorial boundaries with other countries. In 3T areas, universities face various limitations regarding not only the quality of infrastructures but also the capacity and resources relating to qualified education and updated knowledge [10,11]. University students in 3T areas are thus considered the most vulnerable regarding equal access to education, particularly when the pandemic hit Indonesia [10,11,12]. The Indonesian government indeed has devoted efforts to equalize these areas, even before the pandemic began, by initiating several programs to reduce the gaps. For example, it installed physical infrastructure and internet connections in 3T areas [10]. However, while the program was still running, the pandemic broke out and forced the government to immediately create an integrated educational program across the nation. The Indonesian Directorate General of Higher Education, the Ministry of Education, Culture, Research, and Technology began the integrated program in March 2021, which involved both hardware (such as 4G internet connections and tablets for students) and software (systems). One of the programs is a learning-management system (LMS), namely ‘Sistem Pembelajaran Daring Pendidikan Tinggi’ (SPADA DIKTI (SPADA DIKTI is written as ‘SPADA’ throughout this paper)), an online learning system for higher education (see https://spadadikti.id/ (accessed on 5 December 2021)). The courses in SPADA thus far had been developed not only by the Ministry of Education, but also by some universities that participated in the program. The main purpose of SPADA is to increase equality in qualified higher education in Indonesia (see https://spada.kemdikbud.go.id/berita/apa-itu-spada-indonesia (accessed on 5 December 2021)) [10]. SPADA is expected to help optimize university students’ learning process and outcomes during the pandemic, thus reaching a high level of impact on students’ learning behaviors. Considering that an e-learning process entails specific challenges for students, more attention should be devoted to helping students be successful in their learning process [1,2,4,13].
Some recent scholarly works have attempted to address the issues of the sudden shift to learning online due to the COVID-19 pandemic. For instance, Ref. [5] investigated the effects of applying online learning during the pandemic on students’ academic performance. Their study findings in comparing academic performances between students in specific groups reveal that good performers are negatively impacted by the shift, while the lower performers are not clearly conclusive. However, although the study involved 500 students, it mainly examines one particular course. Similarly, Ref. [14] discussed how online learning was applied in a sport course during the pandemic, including its advantages and challenges. Despite their convincing and promising findings, the recent studies mostly discuss one particular course, and rarely have they explored the application of online learning approaches in more massive data involving broader areas and more varied courses. By investigating broader data and coverage, we can enhance our knowledge about how one online system utilized by many students in different conditions and areas at the same time can (or cannot) influence the students’ learning performance. The present research therefore attempts to address this limitation by analyzing the effectiveness of SPADA as a new online learning system that had been applied by students at the nationwide scale during the COVID-19 pandemic. Furthermore, by focusing on some underdeveloped areas, we explore to what extent the new system had facilitated the students’ learning processes. Regarding the issue of limited access to online methods in some underdeveloped areas, one study by [6] discusses how students in Sri Lanka with very limited access to online learning coped with their limitations during the pandemic. Unlike their study, which focused on engineering courses by applying a survey method, our study adopts a different approach by using a more direct method (i.e., clickstream data) to examine students’ behavior when employing SPADA. In this way, we aim to complement the existing study by providing more accurate results on students’ behaviors.
One approach considered as the most essential to examine the effectiveness of online learning from the students’ side is Self-Regulated Learning (SRL) [15,16,17]. Adapting an SRL approach is arguably relevant to the context in which control of the learning process has been shifted from the educational institutions to students as individuals [4,17]. In the context of the COVID-19 pandemic, students not only face the multidimensional crisis of the pandemic (e.g., economic, social, health, and mental ramifications), but must also be responsible for their educational tasks or those that were previously carried out by the institutions (e.g., setting goals and managing the learning process). This extreme, consistently changing situation could be overwhelming to students [18,19]. Some students might be able to adapt and handle the situation well, while others might not [2,13,20,21]. The situation is becoming more challenging for students in underdeveloped areas, where access to internet infrastructure is a critical issue in digital learning. Therefore, understanding students’ SRL in online learning processes during the pandemic, especially in underdeveloped areas, is an important area of study [6,22]. This nascent phenomenon should be addressed in order to help students cope with the challenges they face and can thus help them improve their performance [17].
Previous scholarly works suggest that, by monitoring students’ SRL activities, educators or regulators can have a greater chance for success in implementing an online academic system [23,24,25]. Furthermore, as revealed by some scholars, the use of an SRL approach will be influenced by factors such as contextual and individual constraints, especially in terms of regulating self-motivation, cognition, and behavior [25,26]. This notion reveals the need to investigate the online system of SPADA regarding its role in promoting SRL, particularly in the context of underdeveloped or 3T areas. With more constraints (such as the lack of internet connection, access to the platform, and a supportive educational environment) than in other areas, 3T students might have less opportunity to visit the platform regularly, which potentially can inhibit them from actively managing their learning process [16]. Such circumstances can also prevent them from developing SRL strategies [7]. The novel study by [22], for instance, shows the drop of academic performance of students in Cambodia as they adopting online learning during the pandemic. This suggests an urgent call to evaluate the implementation of SPADA, especially in terms of how the platform facilitates the monitoring of SRL activities at the early stage of its implementation. Failure to identify any potential problems on the platform might harm the students’ SRL processes in the future and the system’s effectiveness in general [16].
In light of the above concern, this study seeks to examine how SPADA’s resources can facilitate Indonesian students’ SRL strategies. For this purpose, we analyze the platform’s clickstream data (CSD) after about nine months of implementation nationwide. By applying CSD, we can understand students’ behaviors based on the logs of time-stamped actions when they use SPADA. CSD typically consists of activities such as navigating between web pages or downloading and uploading files [27]. Since its launch, the SPADA platform has elicited participation among 558 universities and has around 70,000 users (lecturers and students) across Indonesia. This paper examines the overall student participation in SPADA and then focuses on students in 3T universities that were included in the government’s priority agenda. The research analyzes students’ behavioral patterns in using the SPADA clickstream data and categorizes them based on three SRL strategies: planning, monitoring, and regulating [16,28]. Sequentially, the 3T clickstream data is compared to the overall data in order to gain a better understanding of how 3T students have been dealing with the system thus far and how the system accommodates their behaviors using the SRL lenses. Notably, compared to students in non-3T areas who enjoy better facilities in accessing the SPADA platform since its launch, many 3T students rely on the government’s supporting facilities, such as VSAT (very-small-aperture terminal) installment, to enhance the quality of their internet connection and the distribution of tablets (for students with no computers or any supporting digital tools). So, despite the readiness of the SPADA system per se, its full implementation in some 3T areas should have been delayed due to gaps in the technical support until around November 2021, or when they had received more resources.
By conducting the initial study of SPADA implementation, we can better understand students’ e-learning behavioral patterns and explore any necessary improvements that can be made immediately. In other words, this study aims to help reduce potential gaps in educational performance, particularly in underdeveloped areas, and can be considered the foundation of an early-warning system for future development. By doing this, the regulators and academicians can reduce the possibility of course-level failure [13]. Against this backdrop, we thus formulate two research questions:
RQ1: What is the overall behavioral pattern of students in 3T areas compared to other areas using SPADA platform, and how can SPADA improve the students’ learning process?
RQ2: To what extent does the clickstream data of SPADA provide indicators of students’ SRL strategies?

2. Literature Background

2.1. Self-Regulated Learning (SRL)

The basic idea of self-regulated learning (SRL) is that effective learners can effectively self-regulate themselves to achieve personal learning goals [29]. In online learning methods, when direct support and guidance from teachers are absent, a self-regulated system for students is becoming more critical [16]. SRL is defined as the strategies of students to manage their learning process by regulating cognition as well as resource management to control their learning [30]. By possessing SRL, students can actively set goals and make plans for their learning, monitor their learning process, and adjust their study plans [16,30]. In this way, SRL allows students to transform their mental abilities into academic performance [17]. In addition to dealing with individually directed forms of learning (e.g., seeking information and discovery learning), the SRL approach also deals with social forms of learning, such as seeking assistance from teachers, friends, and parents [31]. This suggests that the SRL approach not only offers advantages to students but can also be beneficial to lecturers (in the ways they interact with students) and the school (in developing school management) [32]. Study regarding SRL offers a great opportunity for educators to measure students’ self-regulatory processes and how they construct their knowledge [32,33].
The proactive use of processes among students in the SRL concept has encouraged scholars to develop a number of instruments to assess SRL [16,28,34]. Regarded as ‘an overarching construct that captures how students direct and monitors their own learning processes and progress’ [28] (p. 3), SRL comprises three constructs: metacognitive, motivational, and behavioral [32]. The metacognitive construct involves goal setting and planning, organizing and transforming, information searching, rehearsing, and memorizing. The motivational construct includes self-evaluation and consequences. The behavioral construct includes environmental structuring; keeping records and monitoring; reviewing texts, notes, and tests; and seeking helps from teachers, parents, and friends [32] (p. 168). This approach suggests that the activities of SRL strategies comprise a complex interrelationship between cognitive, metacognitive, and motivational regulatory aspects [35]. In this sense, each student is responsible for constructing his or her own meanings, goals, and strategies based on information from either external or internal (one’s own mind) environments [30].
Furthermore, Pintrich [36] coined three types of SRL strategies: planning, monitoring, and regulating. Under the planning strategy, students prepare their cognitive strategy and organize and understand the materials by setting study goals, skimming a text, and addressing critical questions before reading through the text. Monitoring strategy refers to how students become aware of any distractions from their goals and then find ways to address them by using regulation strategies. Monitoring activities involve tracking of attention while reading the text or listening to lectures, self-testing on the material, and utilizing test-taking strategies during an examination period. Regulating strategy involves students rereading some parts of the material or asking themselves questions to check their own understanding of the material. Considered together, SRL activities include overviewing or orienting tasks and resources, making plans, evaluating the learning results, and monitoring or controlling all activities [29].

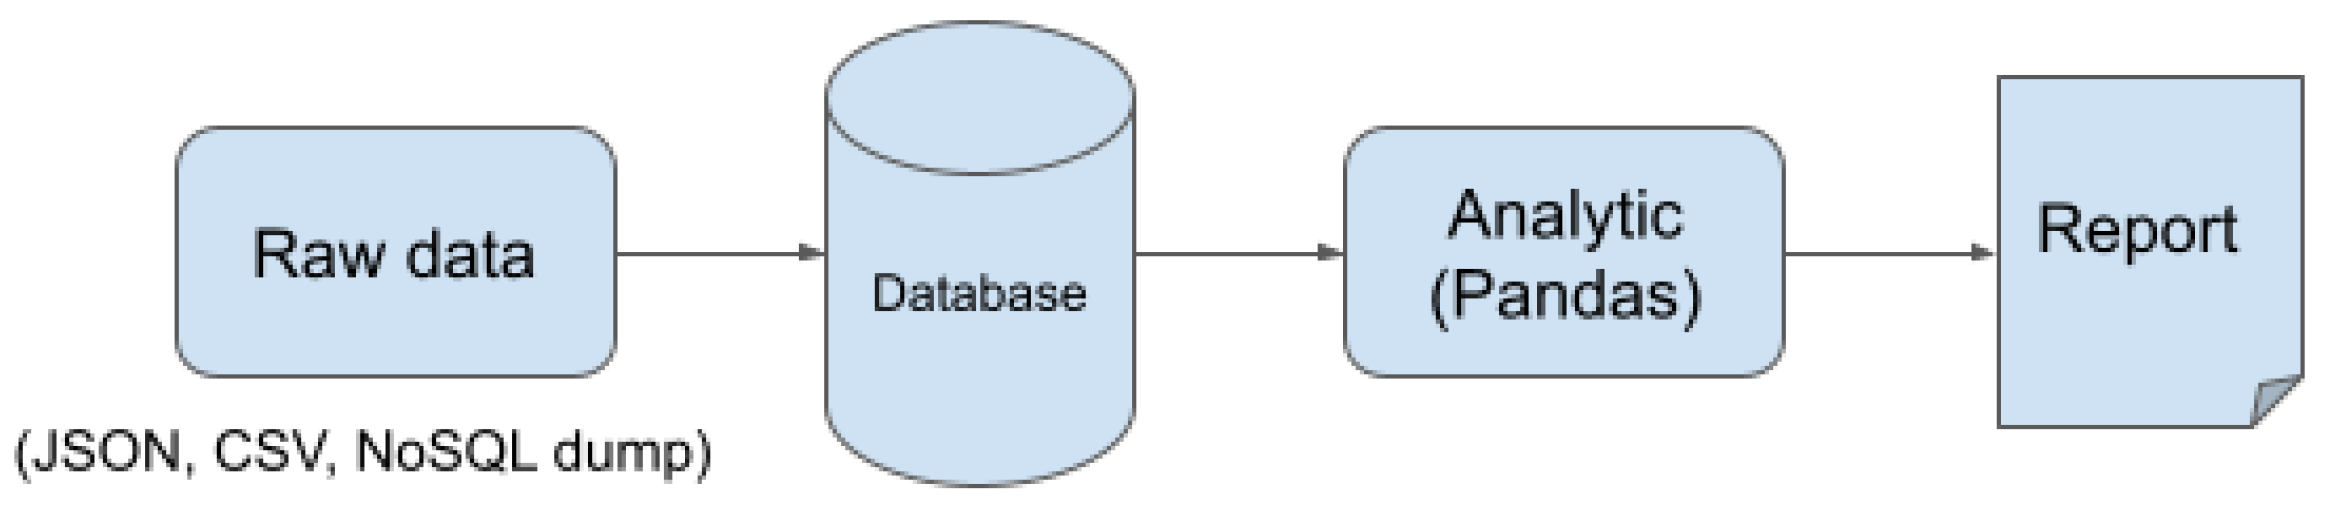
2.2. Clickstream Data (CSD)

The use of technology in education, particularly online-learning systems, helps us understand students’ SRL behaviors [28]. The measurement of digital learning suggests invaluable data through which lecturers or administrators can observe students’ learning behavioral patterns in real time [37]. This approach, known as the learning analytics technique, involves the collection of data produced by students when they learn and improve the learning [16], called clickstream data (CSD). CSD refers to the detailed logs of time-stamped actions from individuals interacting with an LMS that typically consists of events that the user initiates, such as navigating between web pages, downloading and uploading files, or clicking play on a video [27]. The CSD method is regarded as more beneficial to understanding SRL than the traditional self-reported data, because many students often deal with bias and find it difficult to recall past experiences. CSD helps us to collect timely and objective information about how students interact with online education resources, thus promising more objective and richer insight into the learning experience than many other methods can offer [28].
One major line of research on using CSD addresses the measurement of students’ SRL behaviors to gain a better understanding of the students’ learning, through which we can support how to improve their SRL strategies [38]. In this regard, CSD comprises detailed logs of students’ time-stamped actions when using the LMS platform or capturing the mechanical aspects of student behaviors, such as the overall level and frequency of activity, the temporal patterns of students’ online activity (both individually and relative to other students), and choices of which online resources students access [15]. Furthermore, analyzing CSD involves two main strategies: (1) aggregate non-temporal representations, and (2) time-dependent or sequence-dependent representations [28]. While the first strategy collects information over time in aggregate, the second retains the information of students’ behavior in more detail by capturing sequential or temporal aspects. The first approach offers data that can be analyzed using a multitude of statistical methods (e.g., multivariate regression to predict outcomes), but it does not present the sequential aspects of students’ behaviors. The second approach provides more nuanced temporal patterns of students’ behavior, but it is more complicated than the first method [28]. The present study attempts to capture SPADA clickstream data first by using both approaches and then examining how the data can be used to measure students’ SRL. The approach is expected to help enhance our understanding of the massive implementation of LMS on students’ SRL, such as the nationwide use of the SPADA platform. Overall, this study aims to explore how SPADA provides indicators to help us understand students’ SRL as well as to examine the overall 3T students’ SRL behavioral patterns compared to all students at the early stages of SPADA implementation.

3. Research Method and Data

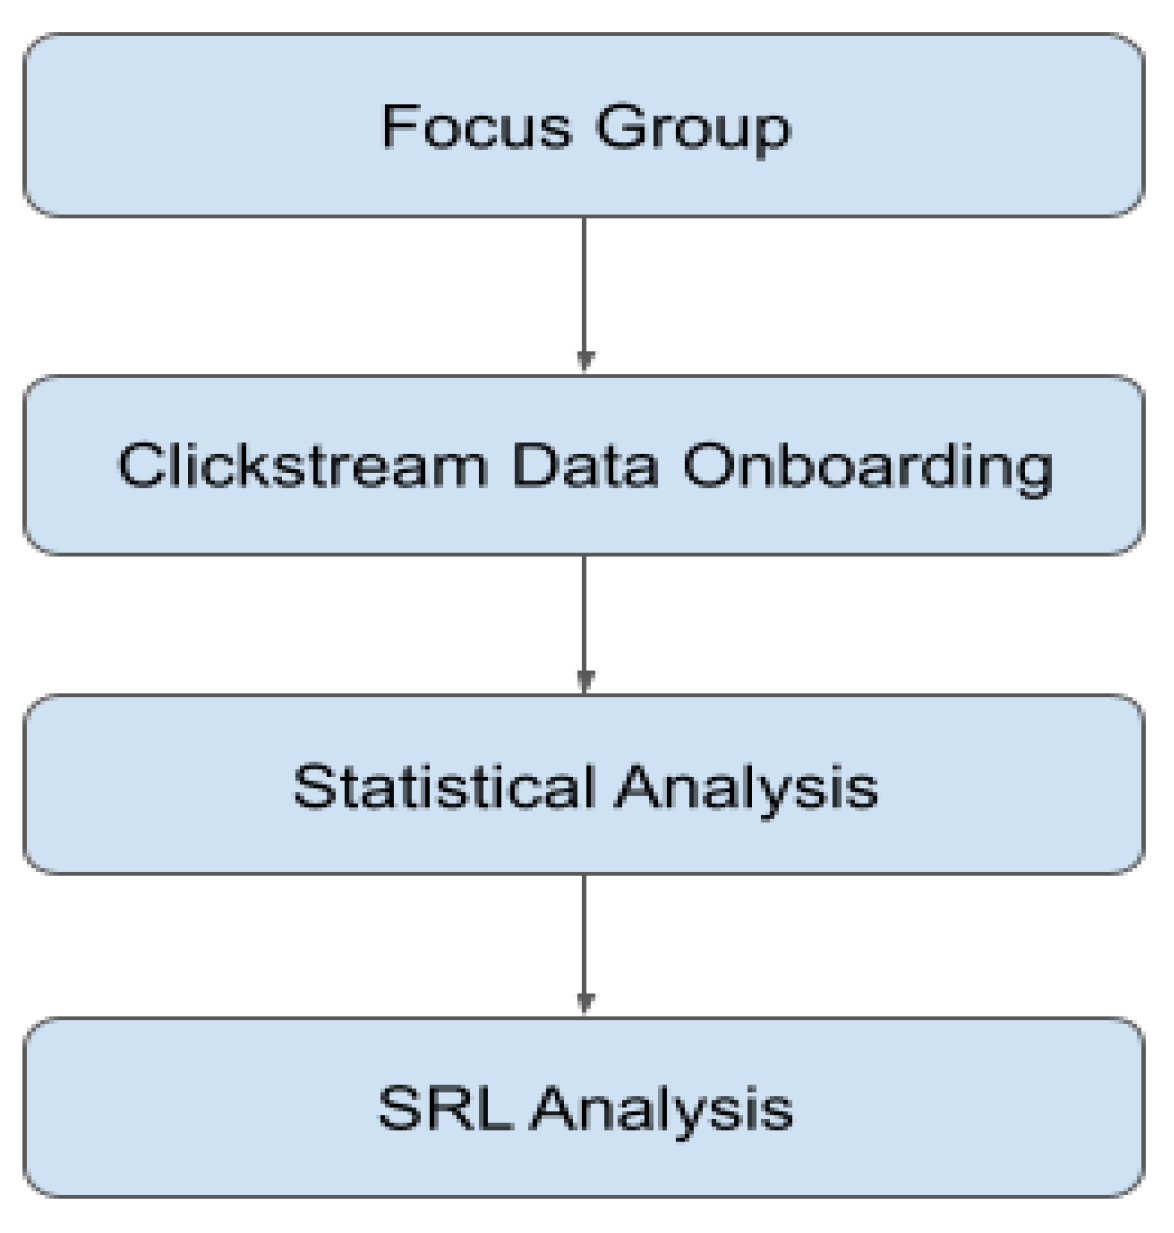
3.1. Research Method

This research focuses on the basic level of mechanical aspects on students’ behaviors based on clickstream data (CSD) during the first nine months of SPADA implementation [15]. In addition to using CSD as the main data, this study also applied other methods to support CSD, as outlined in the research flow chart (see Figure 1).
Before starting to retrieve CSD from SPADA, we conducted focus groups with various stakeholders who were the initiators and supporters of SPADA implementation, namely the representatives of the Directorate General of Higher Education as the initiator of SPADA, and vendors who had built and developed the platform. Based upon the focus groups’ results, we identified the types of CSD on the platform and then determined some features of the SRL measurement used in this study. In addition to determining SRL measurements based on SPADA’s CSD, we also used secondary data based on a survey of 697 students in 3T areas conducted by the Directorate General in November 2021. Based on the survey results, we gained a general picture of the 3T students’ perception about the SPADA platform regarding either the benefits or challenges they faced when using the platform. Because the data is considered as secondary, we do not explain it in more detail here.
Regarding the issue of data privacy, the names and identities of informants in this study (i.e., focus groups, survey, and CSD) are all treated anonymously. All personal data of SPADA users (such as user’s name, place of birth, user’s email and phone number) are not displayed in the dataset. The focus of data analyses is on the activities mainly related to accessing the SPADA modules, and each user was masked as a unique integer. Before starting the study, we had been granted ethical consent from the Directorate General to retrieve SPADA’s CSD within the timespan between March and November 2021, and to use the secondary data, solely purposed for this study.
In the beginning of the data analysis process, we performed data onboarding, which served to enter the data into the database, which was later analyzed using ‘Pandas’. Pandas is a fast, powerful, flexible, and easy approach that uses open-source data analysis and manipulation tools and is built onto the Python programming language (https://pandas.pydata.org/ (accessed on 25 January 2022)). By using Pandas, we enjoyed relatively easier and faster analysis. Figure 2 describes the process of retrieving CSD from the SPADA platform. The data obtained from SPADA was still raw, or in the form of json, csv, and NoSQL dump formats. CSD comprises user activities in the SPADA platform, from user signing up and login to other activities, such as accessing the learning modules.
Statistical analysis was carried out by conducting a general analysis based on the available statistical data regarding the use of SPADA in all existing universities on some activities performed by students on the platform. The main strategy employed to analyze CSD was ‘aggregate non-temporal representations,’ or collecting CSD in an aggregate manner to observe students’ activities using the platform [15]. We also attempted to use ‘sequence-dependent representations’ to gain more granular data, which could be helpful for us to understand better the students’ SRL behaviors. The data analysis will identify two issues: (1) the overall patterns of students in 3T areas compared to other students in general when employing SPADA platform, and (2) the extent of the existing SPADA platform in providing indicators of students’ SRL strategies (planning, monitoring, and regulating). In more detail, we also used Pearson Correlation analysis to gain a better understanding of the relationship between certain types of CSD characteristics.
At the final stage, SRL analysis deals with identifying and calculating the number of students’ activities and sequentially grouping them as SRL learning phases that include planning, monitoring, and regulating activities. We analyzed each phase of the SRL activities from all universities and then compared them with universities in 3T areas.

3.2. Data

3.2.1. Data Overview

This study involves the data retrieved from the SPADA platform after nine months of its implementation (from March to November 2021), comprising 558 universities, with deployment in 33 provinces throughout Indonesia, as depicted in Figure 3.
Regarding the universities in 3T areas that applied SPADA, they were spread over all parts of Indonesia, from the western part of the island of Sumatra to the central part of the island of Kalimantan and Java and the eastern part of Papua. This study is focused on evaluating the SPADA implementation in 25 universities in 3T areas located in Papua, East Nusa Tenggara, and East Maluku because they were considered to be the largest portion of SPADA usage among other 3T regions. Table 1 shows the 25 universities in 3T areas that participated in SPADA.
There are two main types of courses incorporated in the SPADA platform: (1) courses initiated by the Indonesian Ministry of Education and (2) courses initiated by universities. The latter are included in each university’s academic curriculum (compulsory for students) and mainly under the authorization of each university. Courses initiated by the Ministry of Education are grouped into several programs as follows:
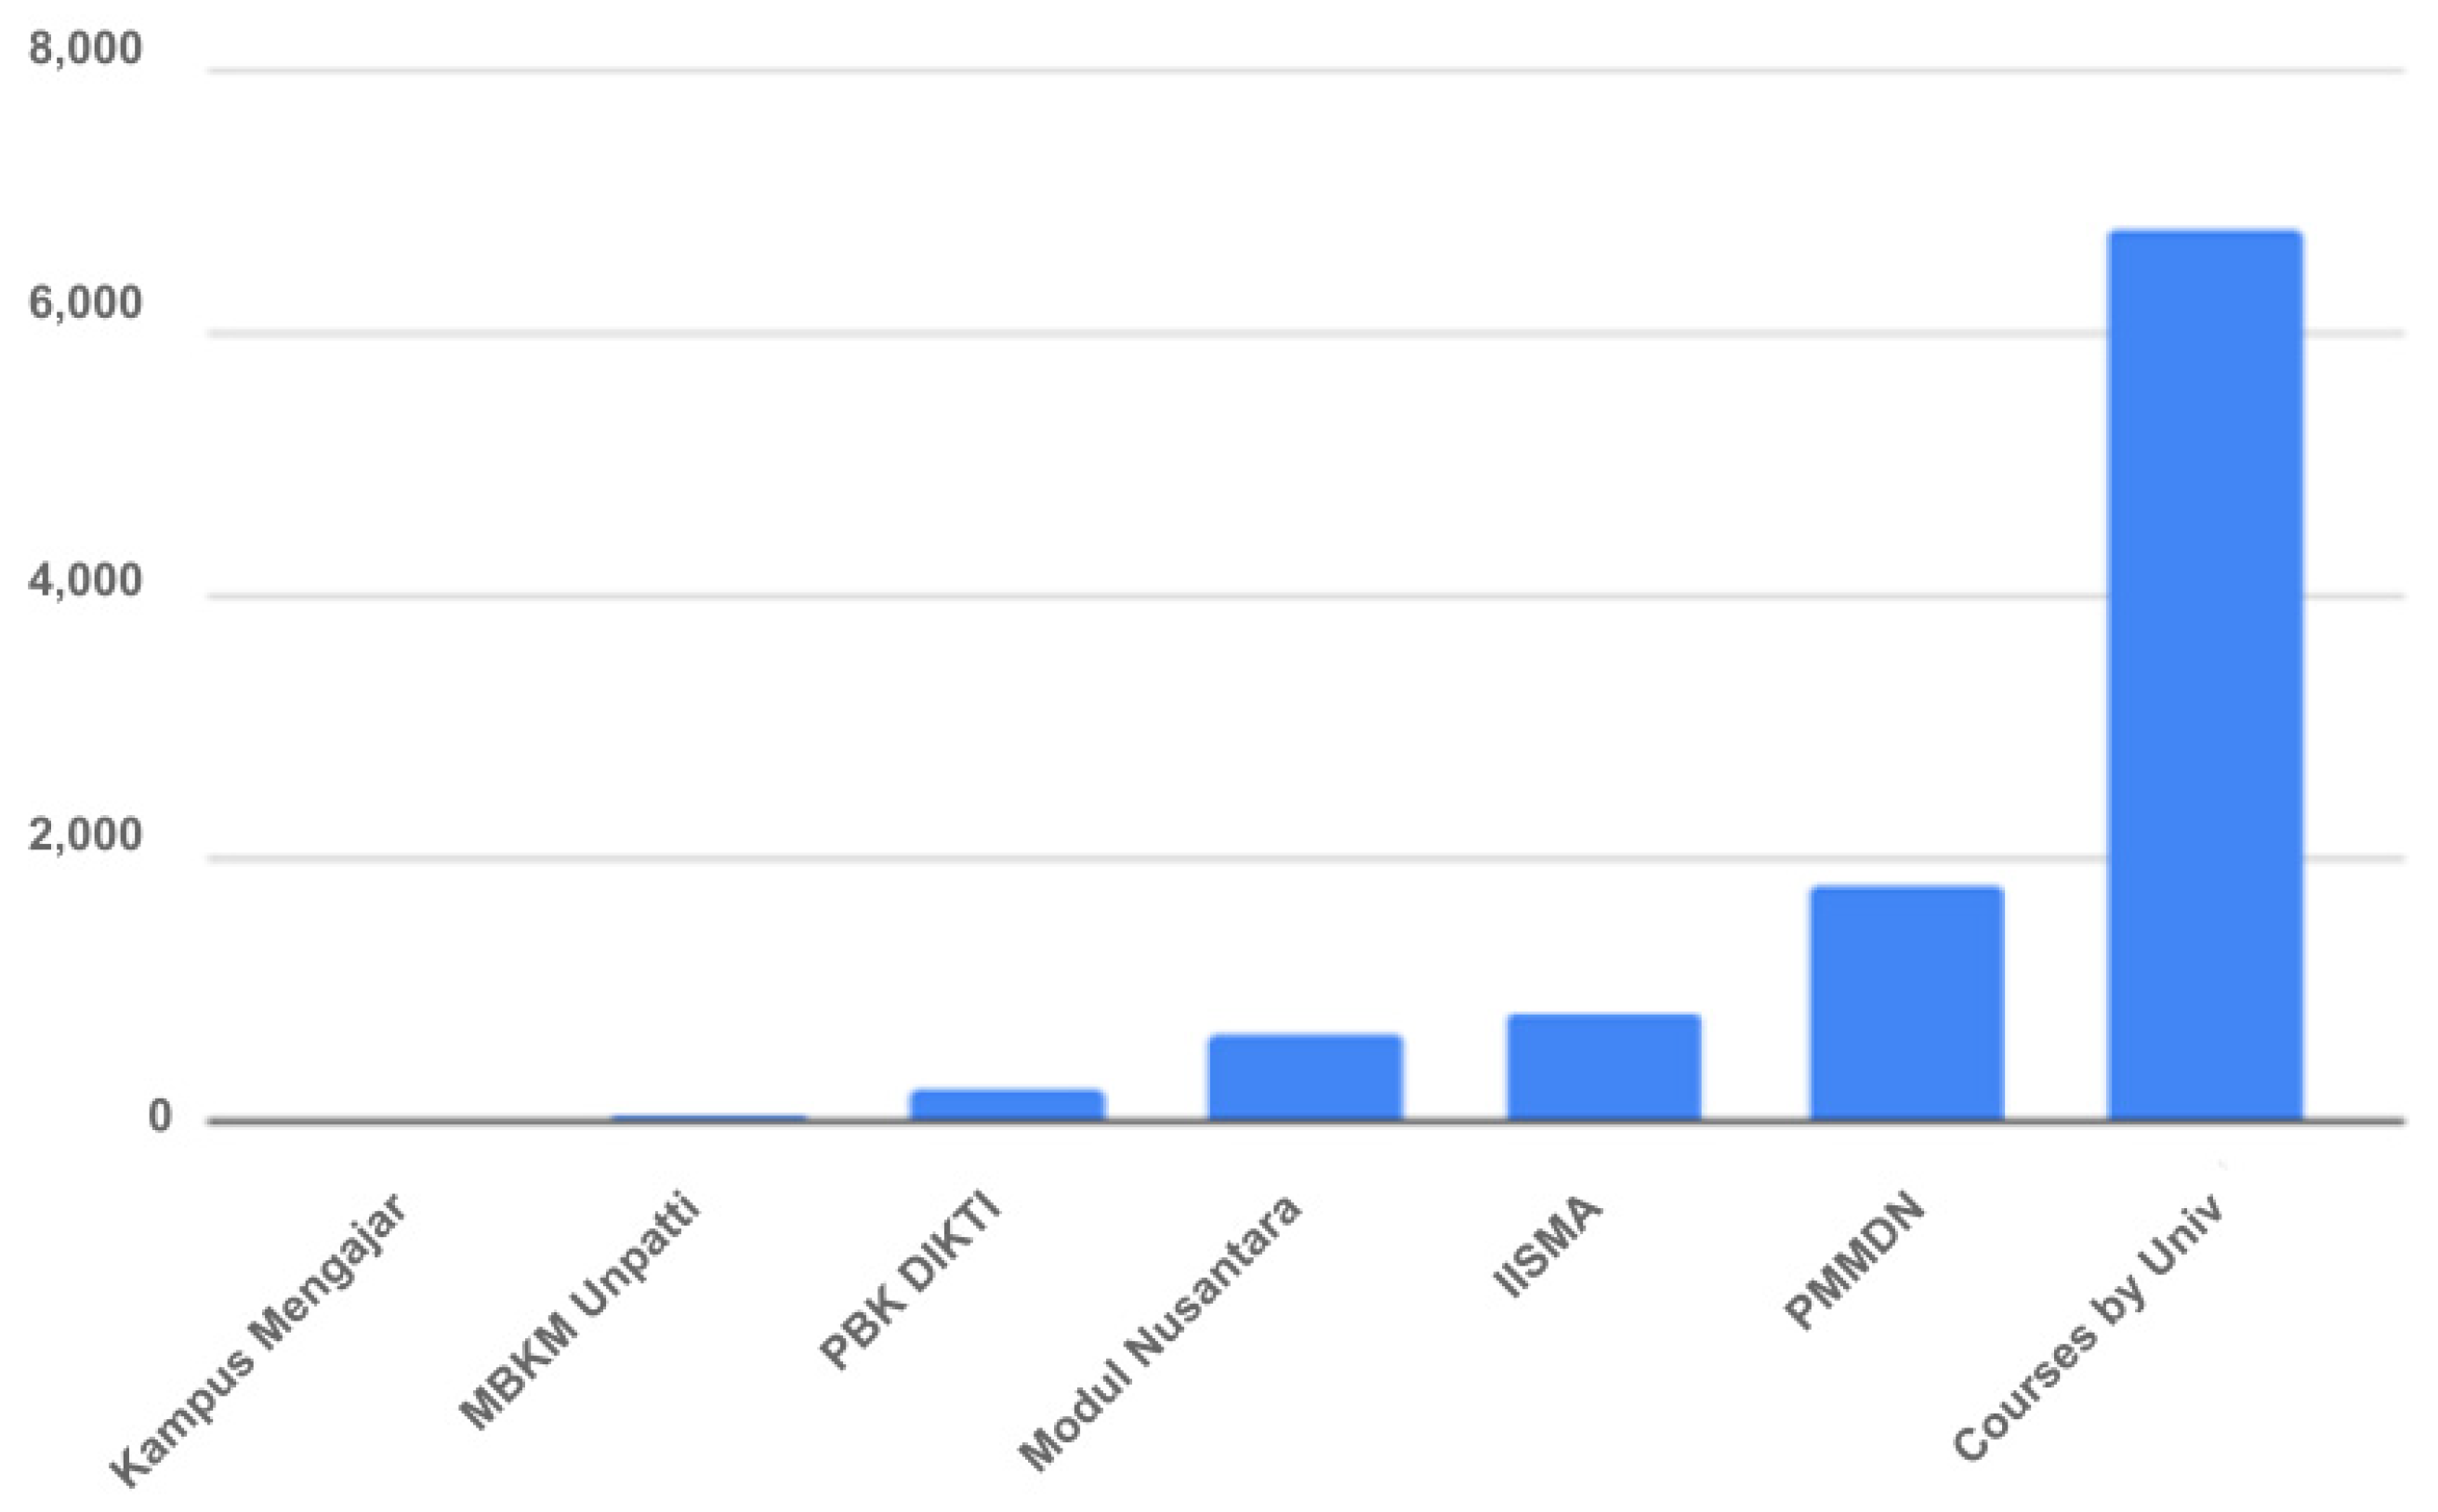
  • ‘Kampus Mengajar’: A program that provides students opportunities to help teachers and principals at the elementary and junior high school levels for one semester in carrying out learning activities.
  • ‘Penilaian Berbasis Kelas DIKTI’ (PBK DIKTI): A competency-based research program for lecturers at Indonesia universities.
  • ‘Modul Nusantara’: A 20-credit transfer course, an independent student exchange program in which students visit an area of Indonesia for one semester. Students can learn about specific areas and gain a comprehensive understanding of cultural diversities.
  • ‘Indonesian International Student Mobility Awards’ (IISMA): A scholarship scheme for Indonesian students to join a mobility program at an overseas university. Students spend one semester experiencing and learning the host country’s culture and undertaking practical assignments.
  • ‘Pertukaran Mahasiswa Merdeka Dalam Negeri’ (PMMDN): A student exchange program between regional clusters in Indonesia. The purpose is to exchange experiences and cultures so students can gain a better understanding of cultural diversity.
In general, the outline of each course in the platform comprises the Table of Content, Course Introduction (video, material, core discussion, discussion forum), and Course Modules (e-text and video) and Exams (mid and final). Figure 4 shows the distribution of each course enrolled by students on the SPADA platform, as accumulated during the first nine months. The highest number of program activities was achieved by the courses initiated by universities, as shown on the far-right sides of the chart.

3.2.2. Data Description

The data collected were mainly the students’ activity logs, such as clicking, viewing, downloading, chatting, and working on assignments and exams. The data were retrieved from the database of the SPADA platform, which can be considered the typical format of CSD [28]. Because this study involved all of the SPADA population, we did not adopt any particular sampling method. The data were treated in an aggregate manner, comprising male and female undergraduate students across Indonesia, aged between 18 and 23 years. Based on the data, we identified the students’ SRL activities, consisting of planning, monitoring, and regulating activities [16]. The CSD retrieved from the platform comprised two types, namely time- or sequence-dependent representations and aggregate non-temporal representations [28]. The next section describes each data type.
Regarding the issues of reliability and validity on applying the CSD approach to examine SRL, the data used in this study were all retrieved automatically from the SPADA platform that represented ‘timely, fine-grained, and comprehensive measures of SRL’ [39]. Technically, there is a specific code embedded in the platform that is purposed to detect the behaviors of students when accessing the platform. The code is associated with events pointed to specific activities, such as clicking the sign-up button, or navigating to successful exam submission. Whenever an event is triggered, the code will directly send the data record to the database with the help of cloud computing technology. Based on that trigger, when a number of users click the same event, then the same result will be acquired. This indicates that the CSD of SPADA has a high inter-rater reliability.

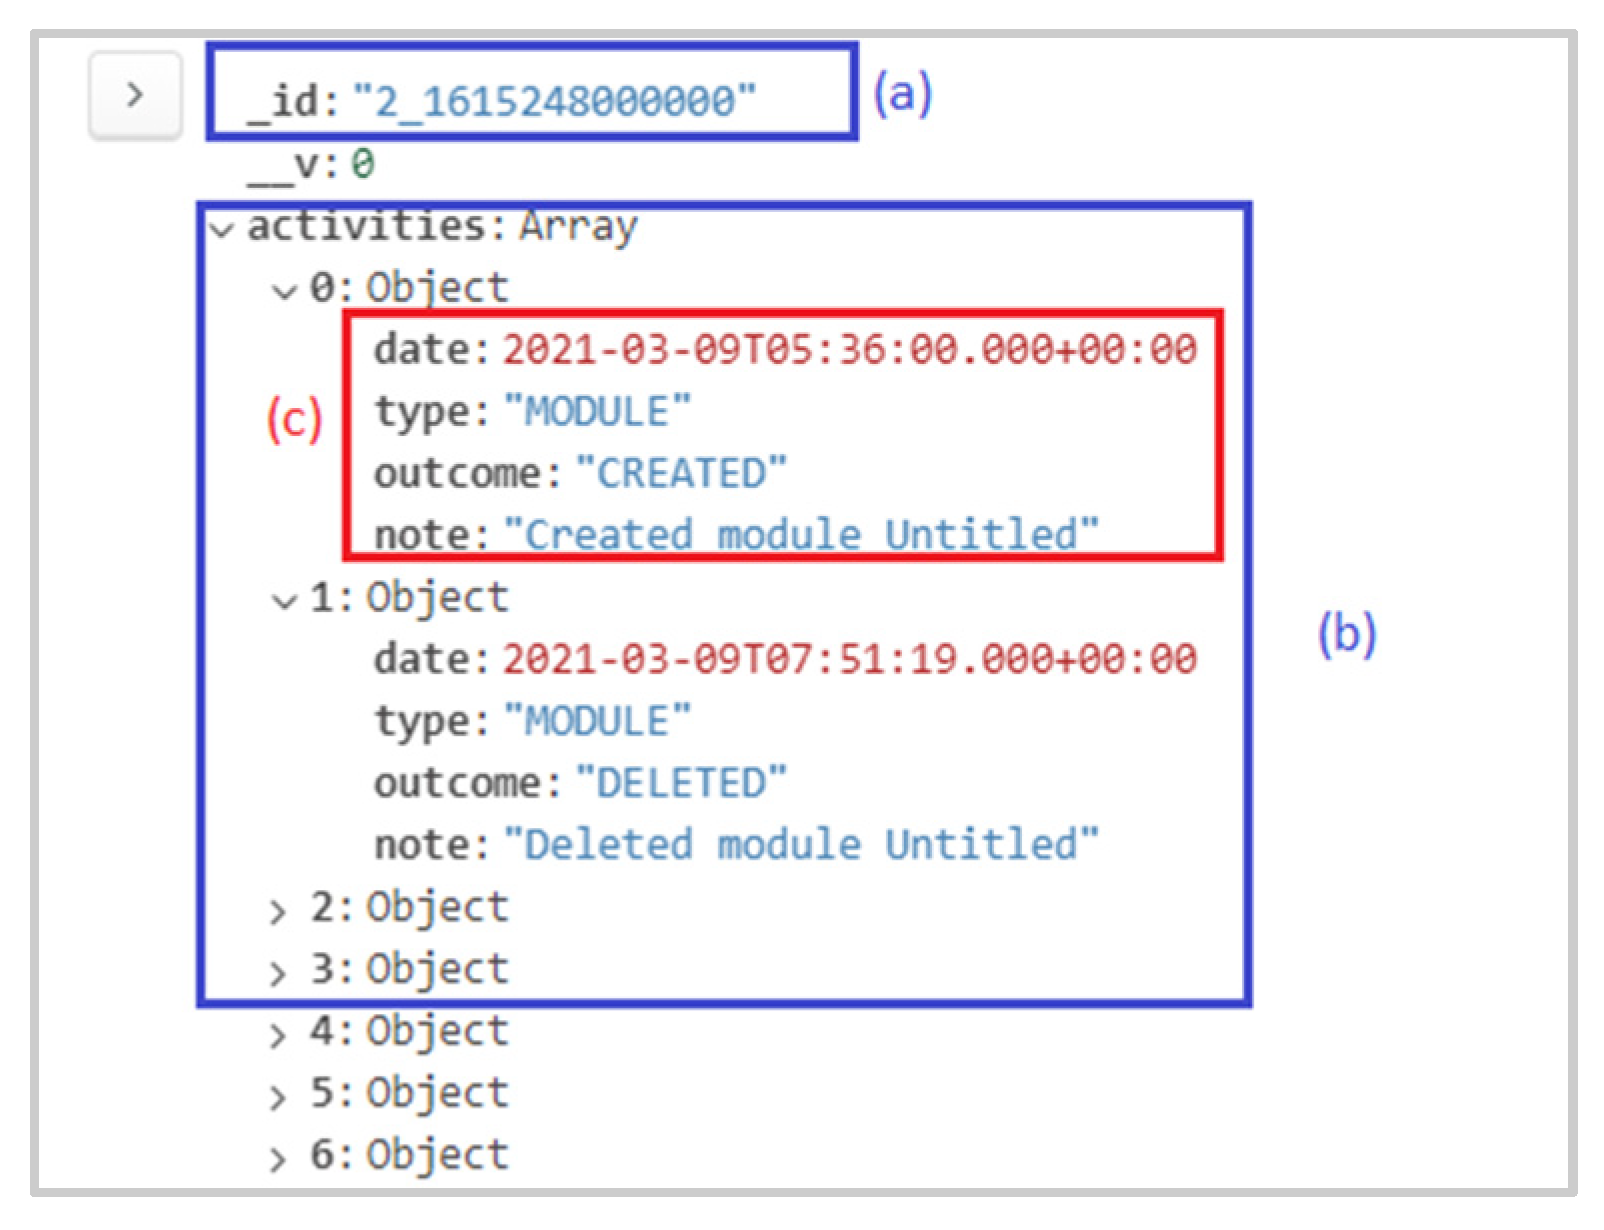
3.2.3. Sequence-Dependent Representations

Sequence-dependent representation is data based on a NoSQL dump that was extracted from the system during the period of March to November 2021. The NoSQL dump data is a collection of data records retrieved from user activities when clicking the loading button on the SPADA system. Figure 5 represents one example of SPADA’s sequence-dependent data.
One data record consists of two main fields, namely: (a) ‘_id’ and (b) activities. ‘_id’ is the unique identity of the user who has been registered in the system, while activities are data in the form of an array that contains a list of all activities carried out by the related user. One user can have one or more activities depending on the intensity of use in the system. Each activity recorded as in the (c) has the following fields:
  • Date: The timestamp of the activity carried out in both date format and time details (up to the order of seconds)
  • Type: The resource on SPADA accessed by the user. Based on existing search results, some available resources are coded as: ‘MODULE’, ‘COURSE’, ‘CONTENT’, ‘SUB_MODULE’, ‘ASSIGNMENT’, ‘USER’, ‘SIGN_IN’, ‘THREAD’, ‘EXAM’, and ‘STUDENT’. For example, one resource in the form of a course learning module on SPADA will be recorded as ‘MODULE’ on the CSD.
  • Outcome: The activities performed by the users. The activities performed are coded as: ‘CREATED’, ‘DELETED’, ‘UPDATED’, ‘READ’, ‘SUBMITTED’, ‘SIGNED_IN’, ‘JOIN’, ‘TAKE’, ‘ENROLLED’, ‘REVIEWED’, ‘LEFT’, ‘GET’, ‘REMOVED’, ‘DELETED_REPLY’, ‘RECALCULATED’, and ‘DUPLICATED’. For example, if a user reads a learning module on the system, then it will be coded as ‘READ’ on the CSD.
  • Note: More detail descriptions of the activities performed by users on the SPADA system.

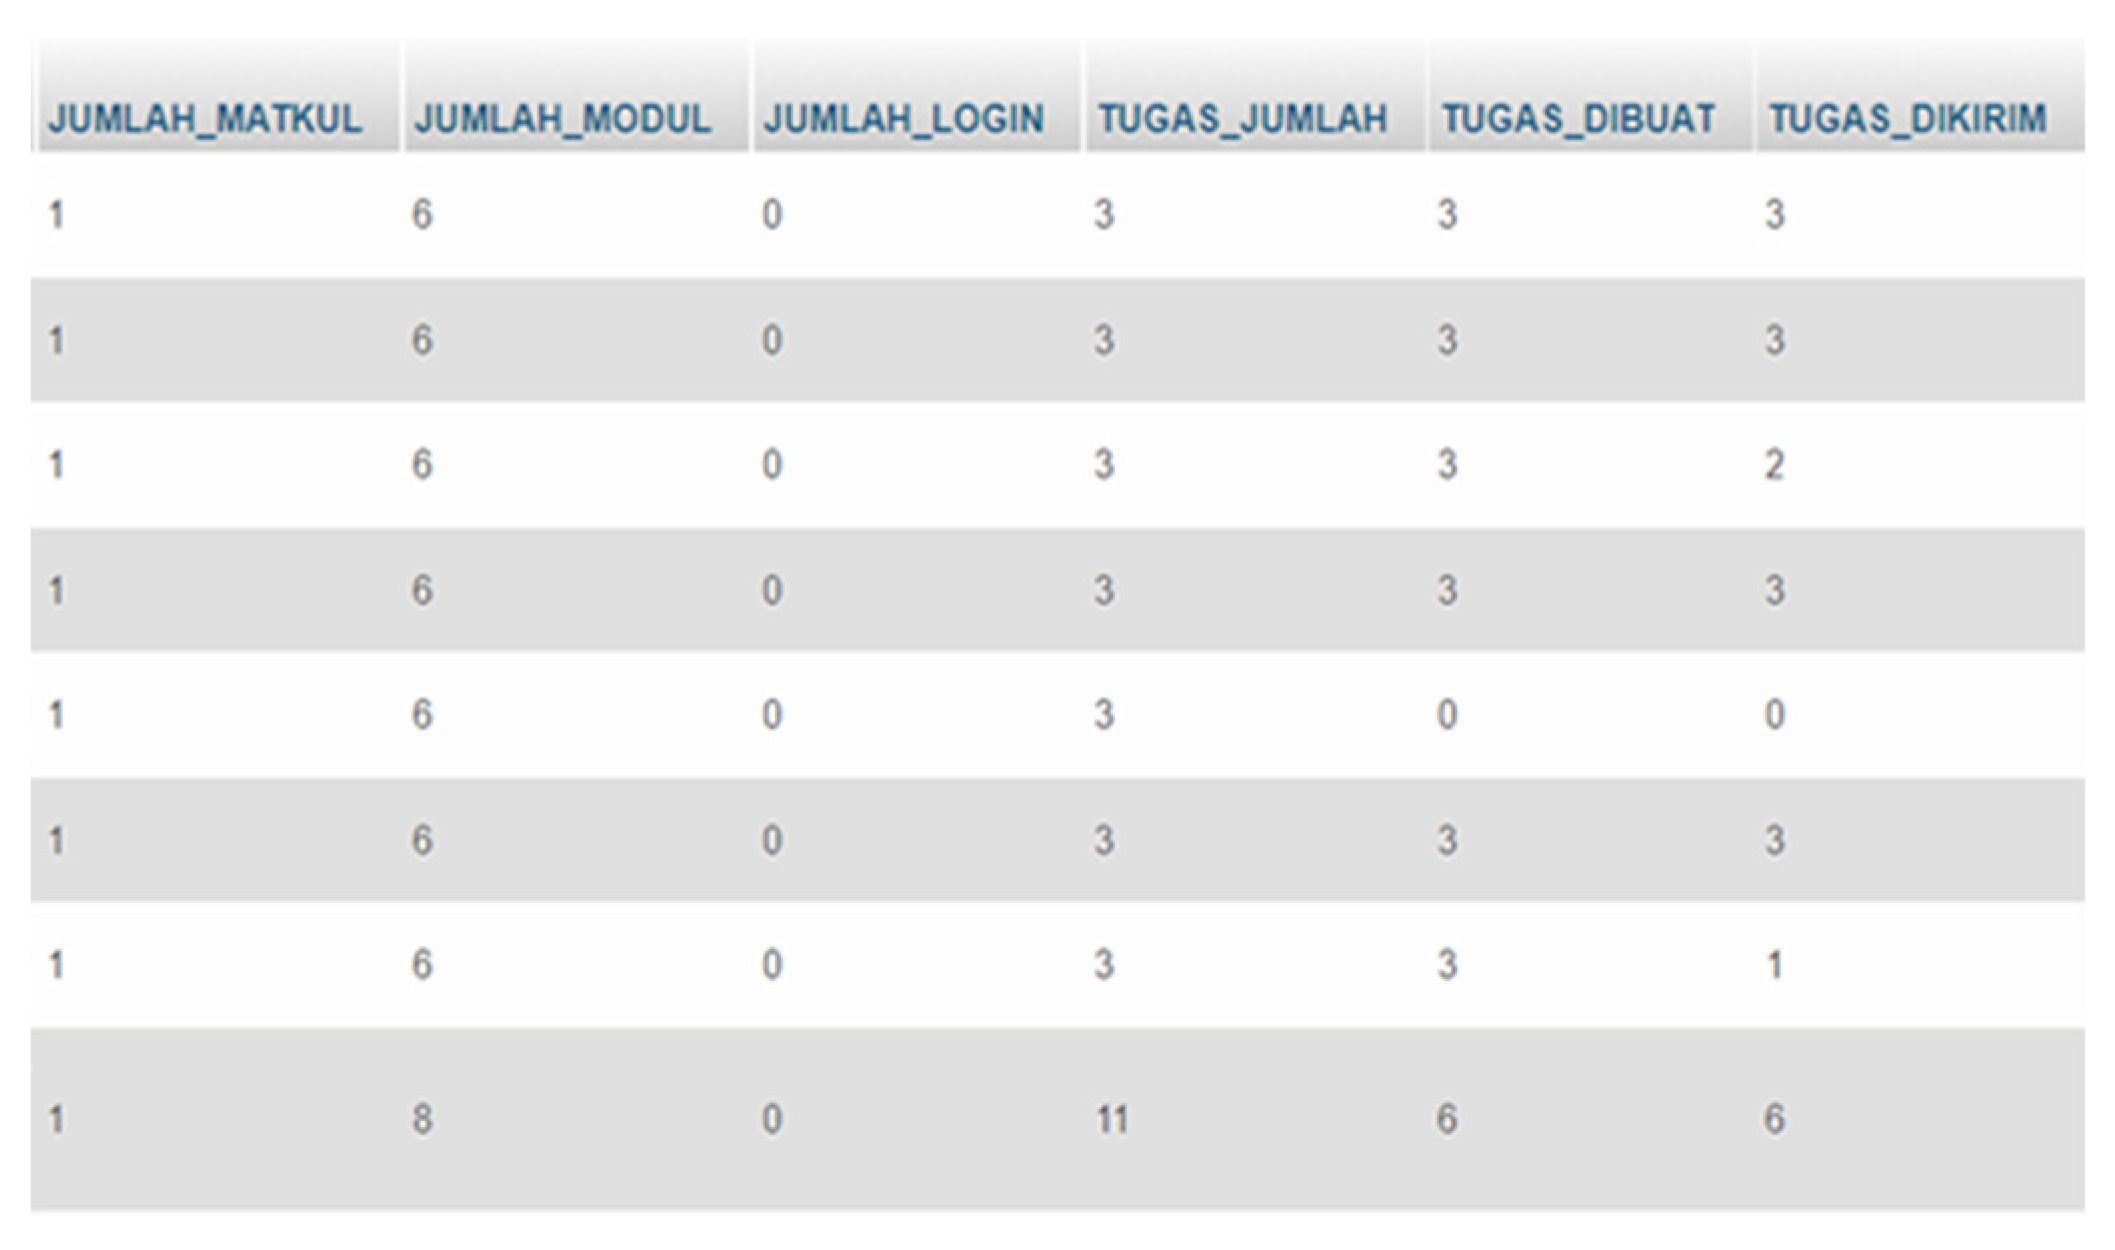
3.2.4. Aggregate Non-Temporal Representations
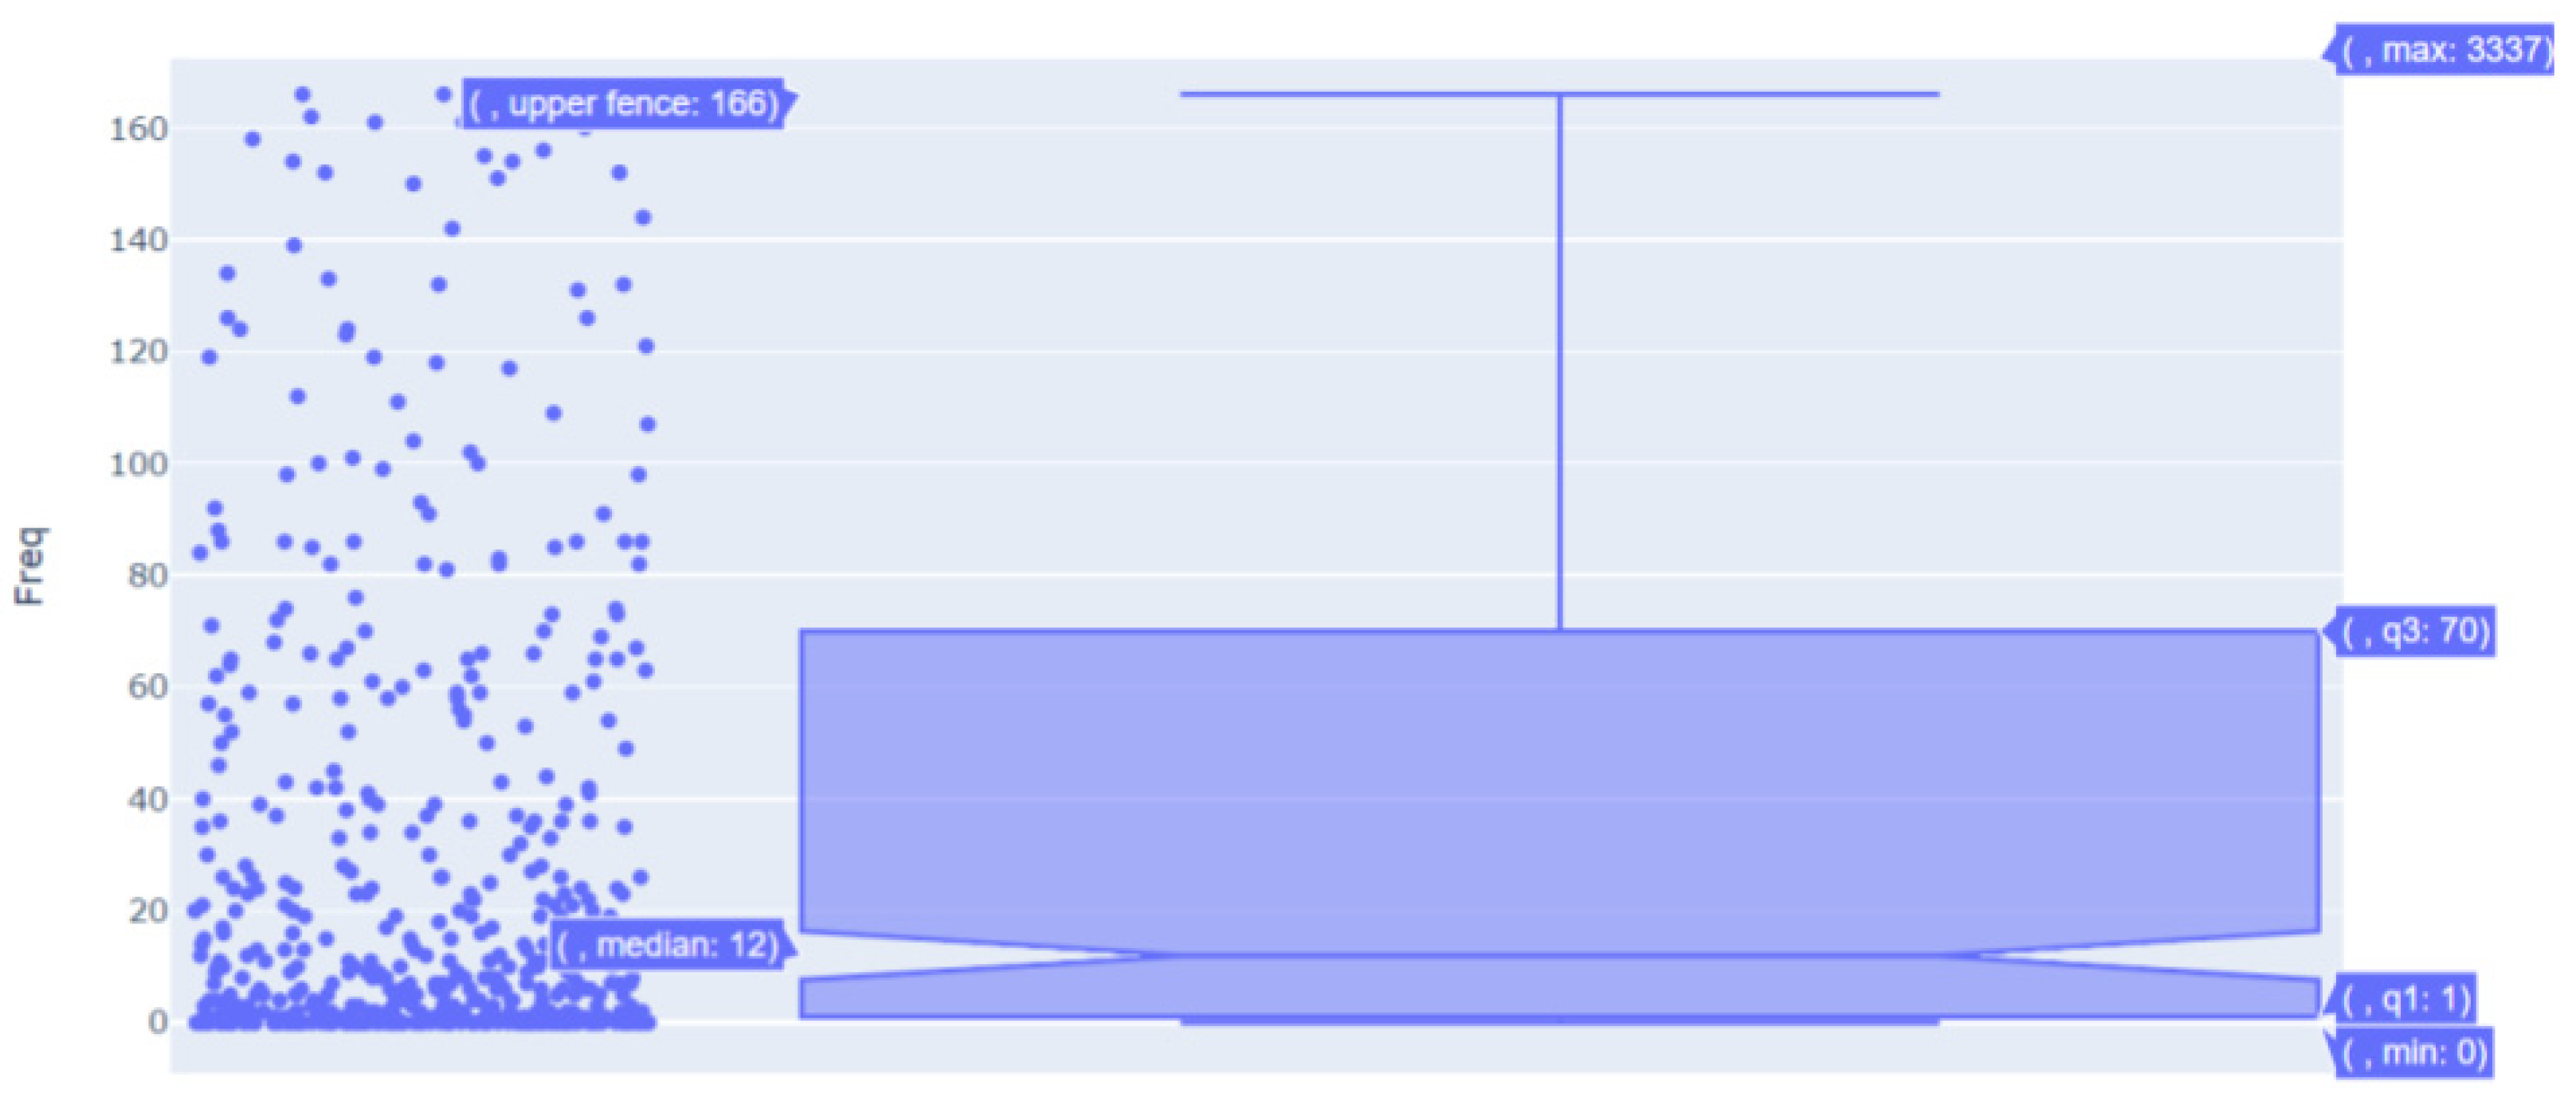
Aggregate non-temporal representation is the accumulation of activities that have been carried out by users in accessing the SPADA platform. For each user, there is a detailed description of the intensity with which activities are carried out, such as the number of course registrations, the number of logins, and the number of accessing assignments and collecting. Figure 6 shows an example of aggregate non-temporal representation of CSD in the SPADA platform.
Both the time-dependent data and aggregate non-temporal data described above play important roles in further analyzing the students’ SRL when using the SPADA platform. Table 2 summarizes the collected CSD based on its type and size.
Furthermore, in order to analyze the activities regarded as self-regulated learning (SRL) generated from the platform, we mapped the activity categories contained in the time-dependent representations of activities. The SRL approach in this study is referred to in [16] and formulates SRL behaviors as planning, monitoring, and regulating phases, as outlined in Table 3 and described in the following. The SRL behavior consists of CSD type and CSD outcome, in which the CSD type is a type of resource available on the SPADA platform, while CSD outcome is an activity carried out on these resources. In this case, the CSD type can appear in several phases, while the outcome CSD can only appear once in accordance with the SRL phase of the activities carried out.
Planning refers to students’ effort to organize learning before starting to join a lecture, such as viewing the course’s table of content and course introduction parts, clicking the introduction video, downloading introduction material (syllabus) and module materials, and introducing him/herself on the discussion forum. In this phase, we consider the CSD types related to this as login activities and registration of lecture materials in the form of module, sub-module, or other resources. We considered that the most suitable assumption based on SPADA is to combine into this phase the CSD types ‘MODULE’, ‘COURSE’, ‘CONTENT’, ‘SUB_MODULE’, and ‘SIGN_IN’, with ‘SIGNED_IN’ and ‘JOIN’, along with the CSD outcome ‘ENROLLED’. These activities mostly take place before the class begins.
Monitoring involves students’ activities when the courses were run (for one semester). This involves the students’ activities of downloading the course materials (including assignments and exams), working on the course material (reading and posting queries on the discussion forum), and testing their knowledge on the course materials (working on assignments or exams and submitting them). The behaviors that can be observed are viewing and solving assignments and/or examinations (mid and final) or completing quizzes or questions in each module. In this phase, we incorporated the CSD types of ‘MODULE’, ‘COURSE’, ‘CONTENT’, ‘SUB_MODULE’, ‘ASSIGNMENT’, ‘EXAM’ with ‘CREATED’, ‘DELETED’, ‘UPDATED’, ‘READ’, and ‘SUBMITTED’ as the CSD outcomes.
Regulating refers to students’ activities to acquire and/or reinforce knowledge by reflecting or reviewing their study results (re-reading the course materials after viewing their exam results). The activities are the results of the monitoring phase, upon which the students could regulate (improve) their learning process. However, only a few resources for regulating activities can be learned from the existing SPADA CSD thus far. For example, there was no clear indicator to observe whether a student has re-read the course material or not. Therefore, we attempted to combine the CSD type of ‘EXAM’ with ‘REVIEWED’ to examine the regulating behaviors. We inferred that, when a student clicked the ‘REVIEWED’ button after taking an exam, he or she could be considered to have attempted to regulate their learning process based upon their study results. By reviewing the study results, the student could make improvements in their learning process.

4. Data Analysis

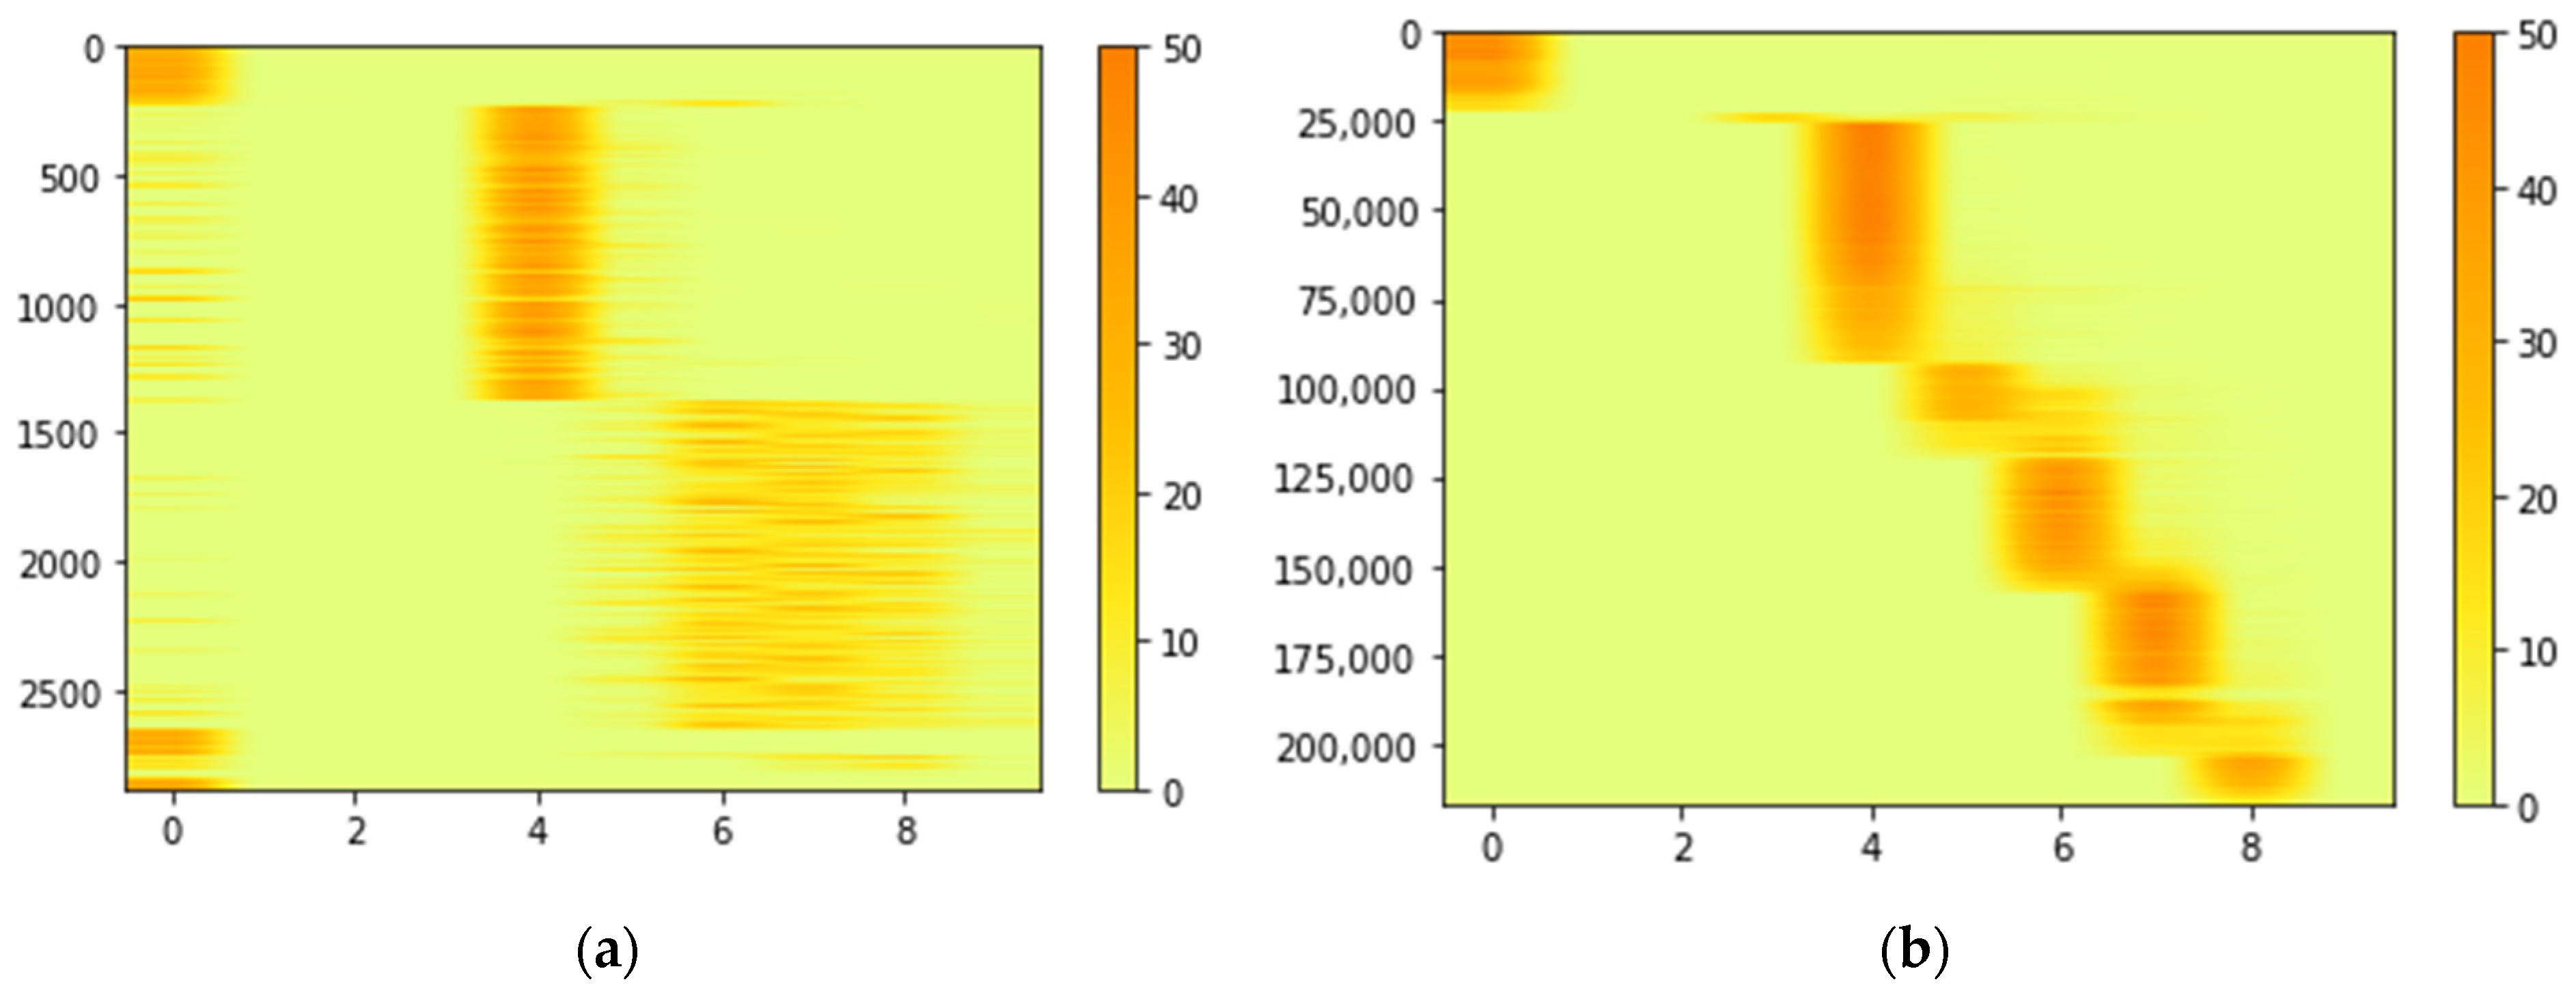
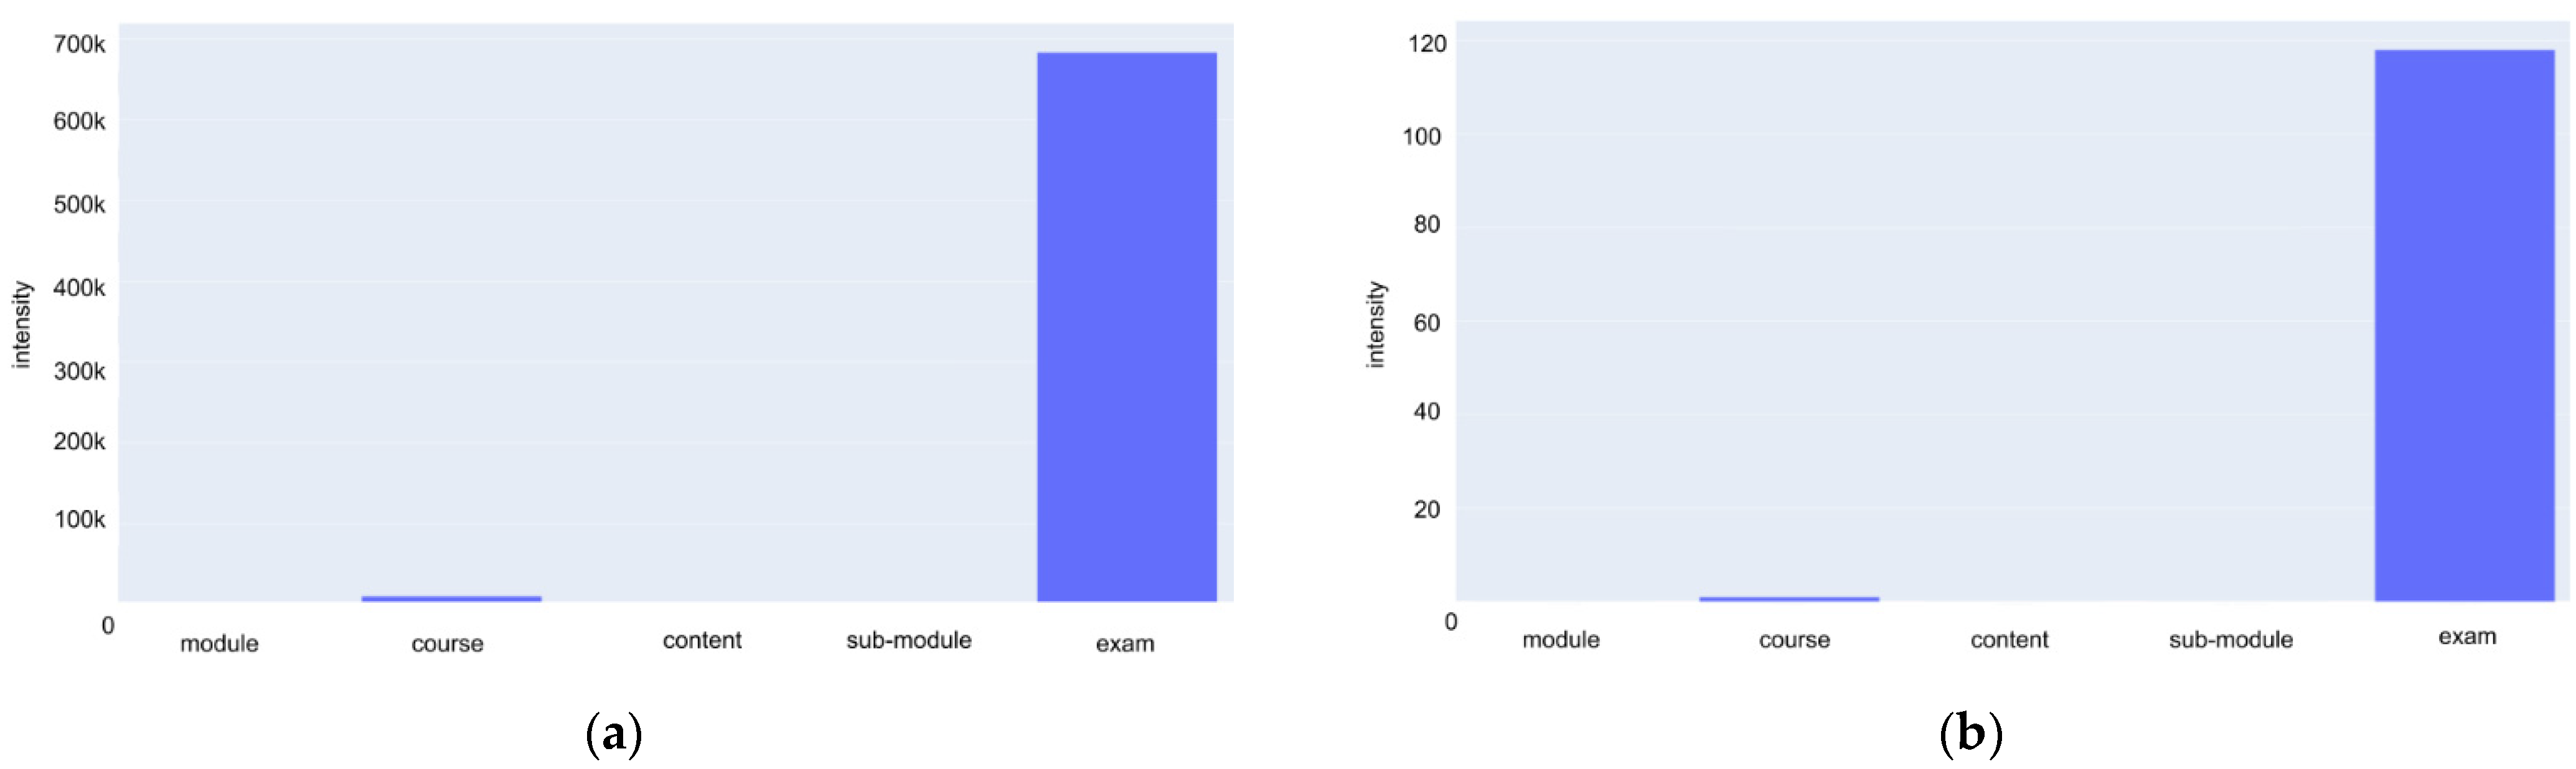
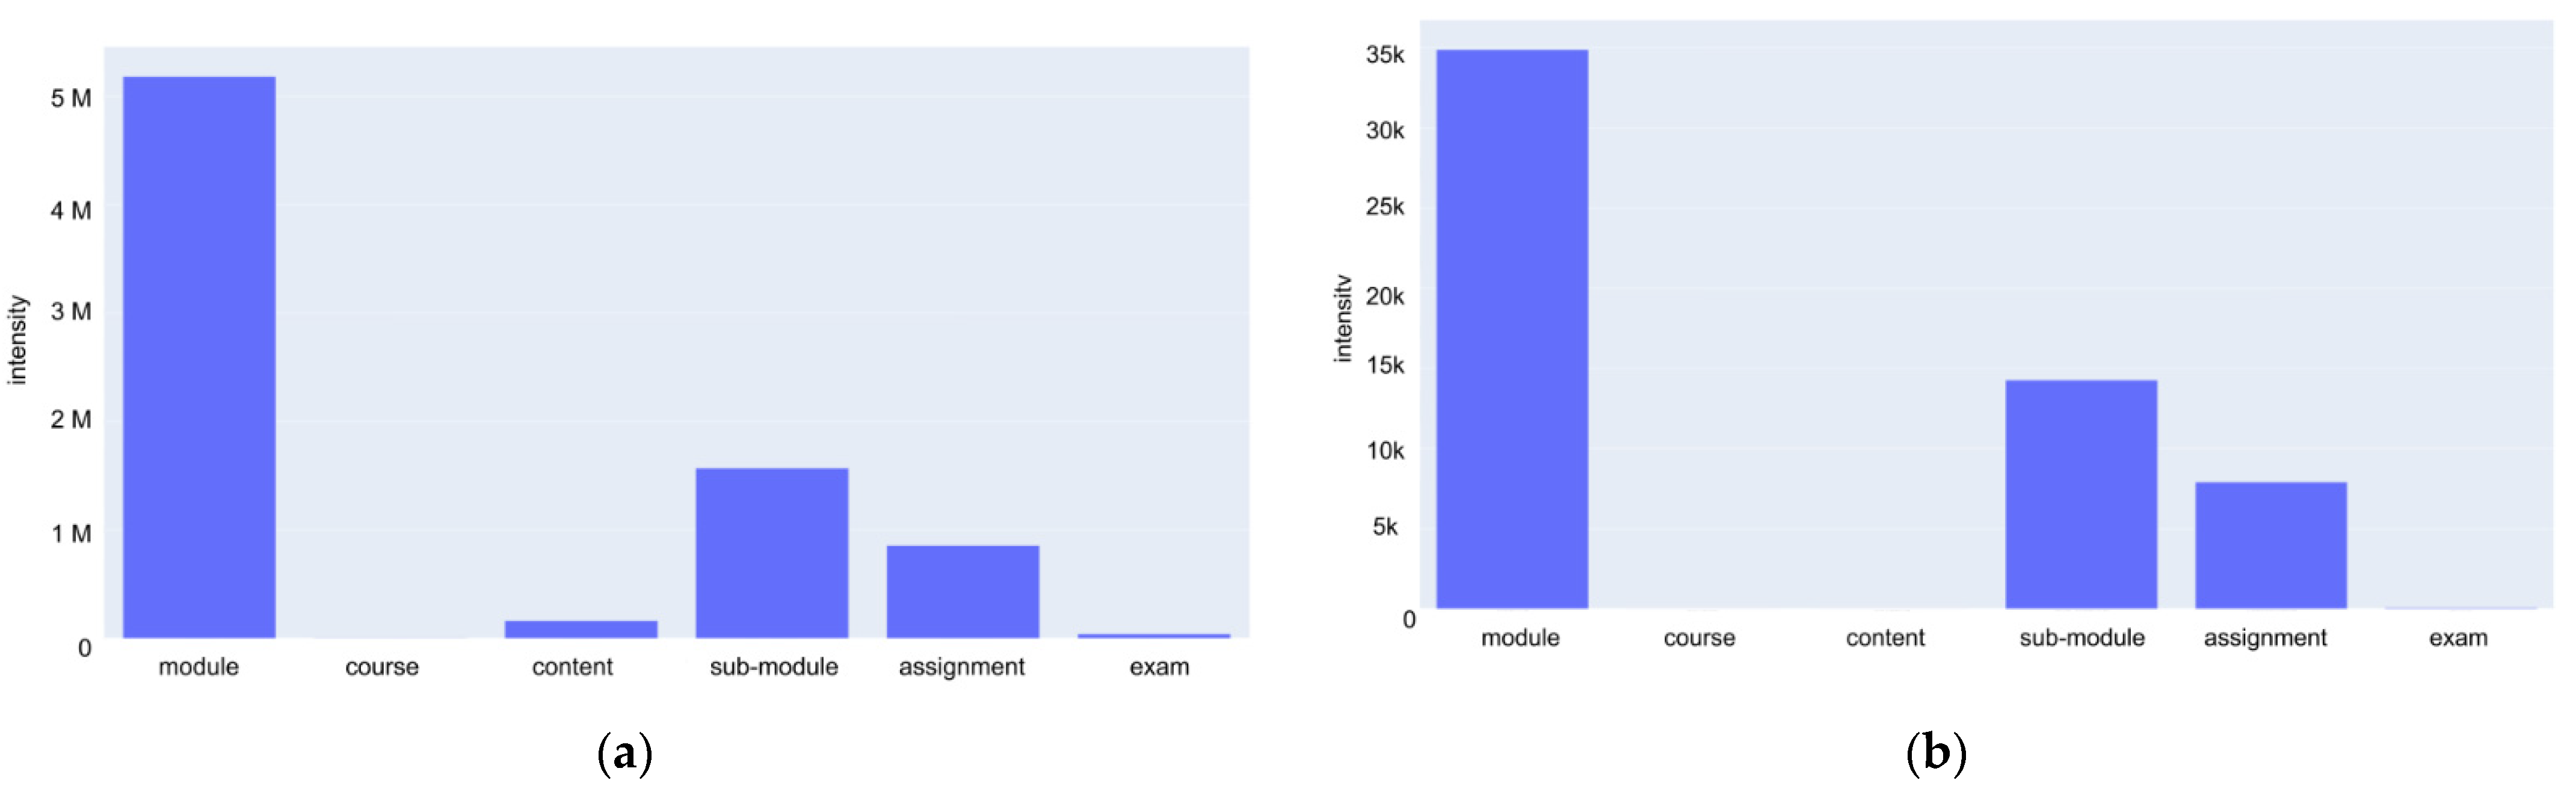
4.1. CSD of Overall Behavior Patterns

Derived from CSD retrieved from the SPADA platform, we examined how the users utilized resources on the platform. For this purpose, we divided the resources into modules and tasks or assignments. Modules refer to the course materials created and managed by lecturers on the platform, while assignments refer to the collection of questions to evaluate students’ learning progress. Previous scholarly works reveal that the higher the intensity of students accessing these two resources, the more optimal their utilization of learning processes will be on the platform [18,23]. Our findings indicate that the use of the SPADA platform in general reached a fairly high intensity within the first nine months of its implementation. Nevertheless, the current usage has not yet been evenly distributed in all universities, where only students in certain universities had actively employed the platform, as shown in Figure 7. Here, the maximum number of frequency activities is 3337 times. Moreover, the average is only twelve activities, which is very low compared to the maximum number.
Moreover, regarding the CSD of students’ activities, it seems that the number of students attempting to utilize the platform resources is increasing over time, despite various challenges they might have been facing. Here, we can see the tendency of increased usage in the activities of modules, assignments, and discussions, as SPADA’s main resources to support the learning processes (see Figure 8). The intensity of activities in accessing modules and assignments reached 5000 times; some universities even reached more than 20 thousand access points of modules and 10 thousand access points for assignments. However, the number of averages from each activity is relatively low compared to the maximum intensity. Here, the average number of modules, assignments, and discussions are 128, 105, and 0, respectively. The number zero for average frequency of discussions means that, mostly, there is no activity related to discussions in all universities.
The findings show that some universities succeeded in communicating and managing the platform for their students within a short period of time. However, as some universities seemed to not yet be utilizing the platform fully, this certainly needs further attention. In this regard, we spotted the low performance of SPADA utilization, mostly among the students in 3T universities, where only 1.56 percent actively participated in SPADA.

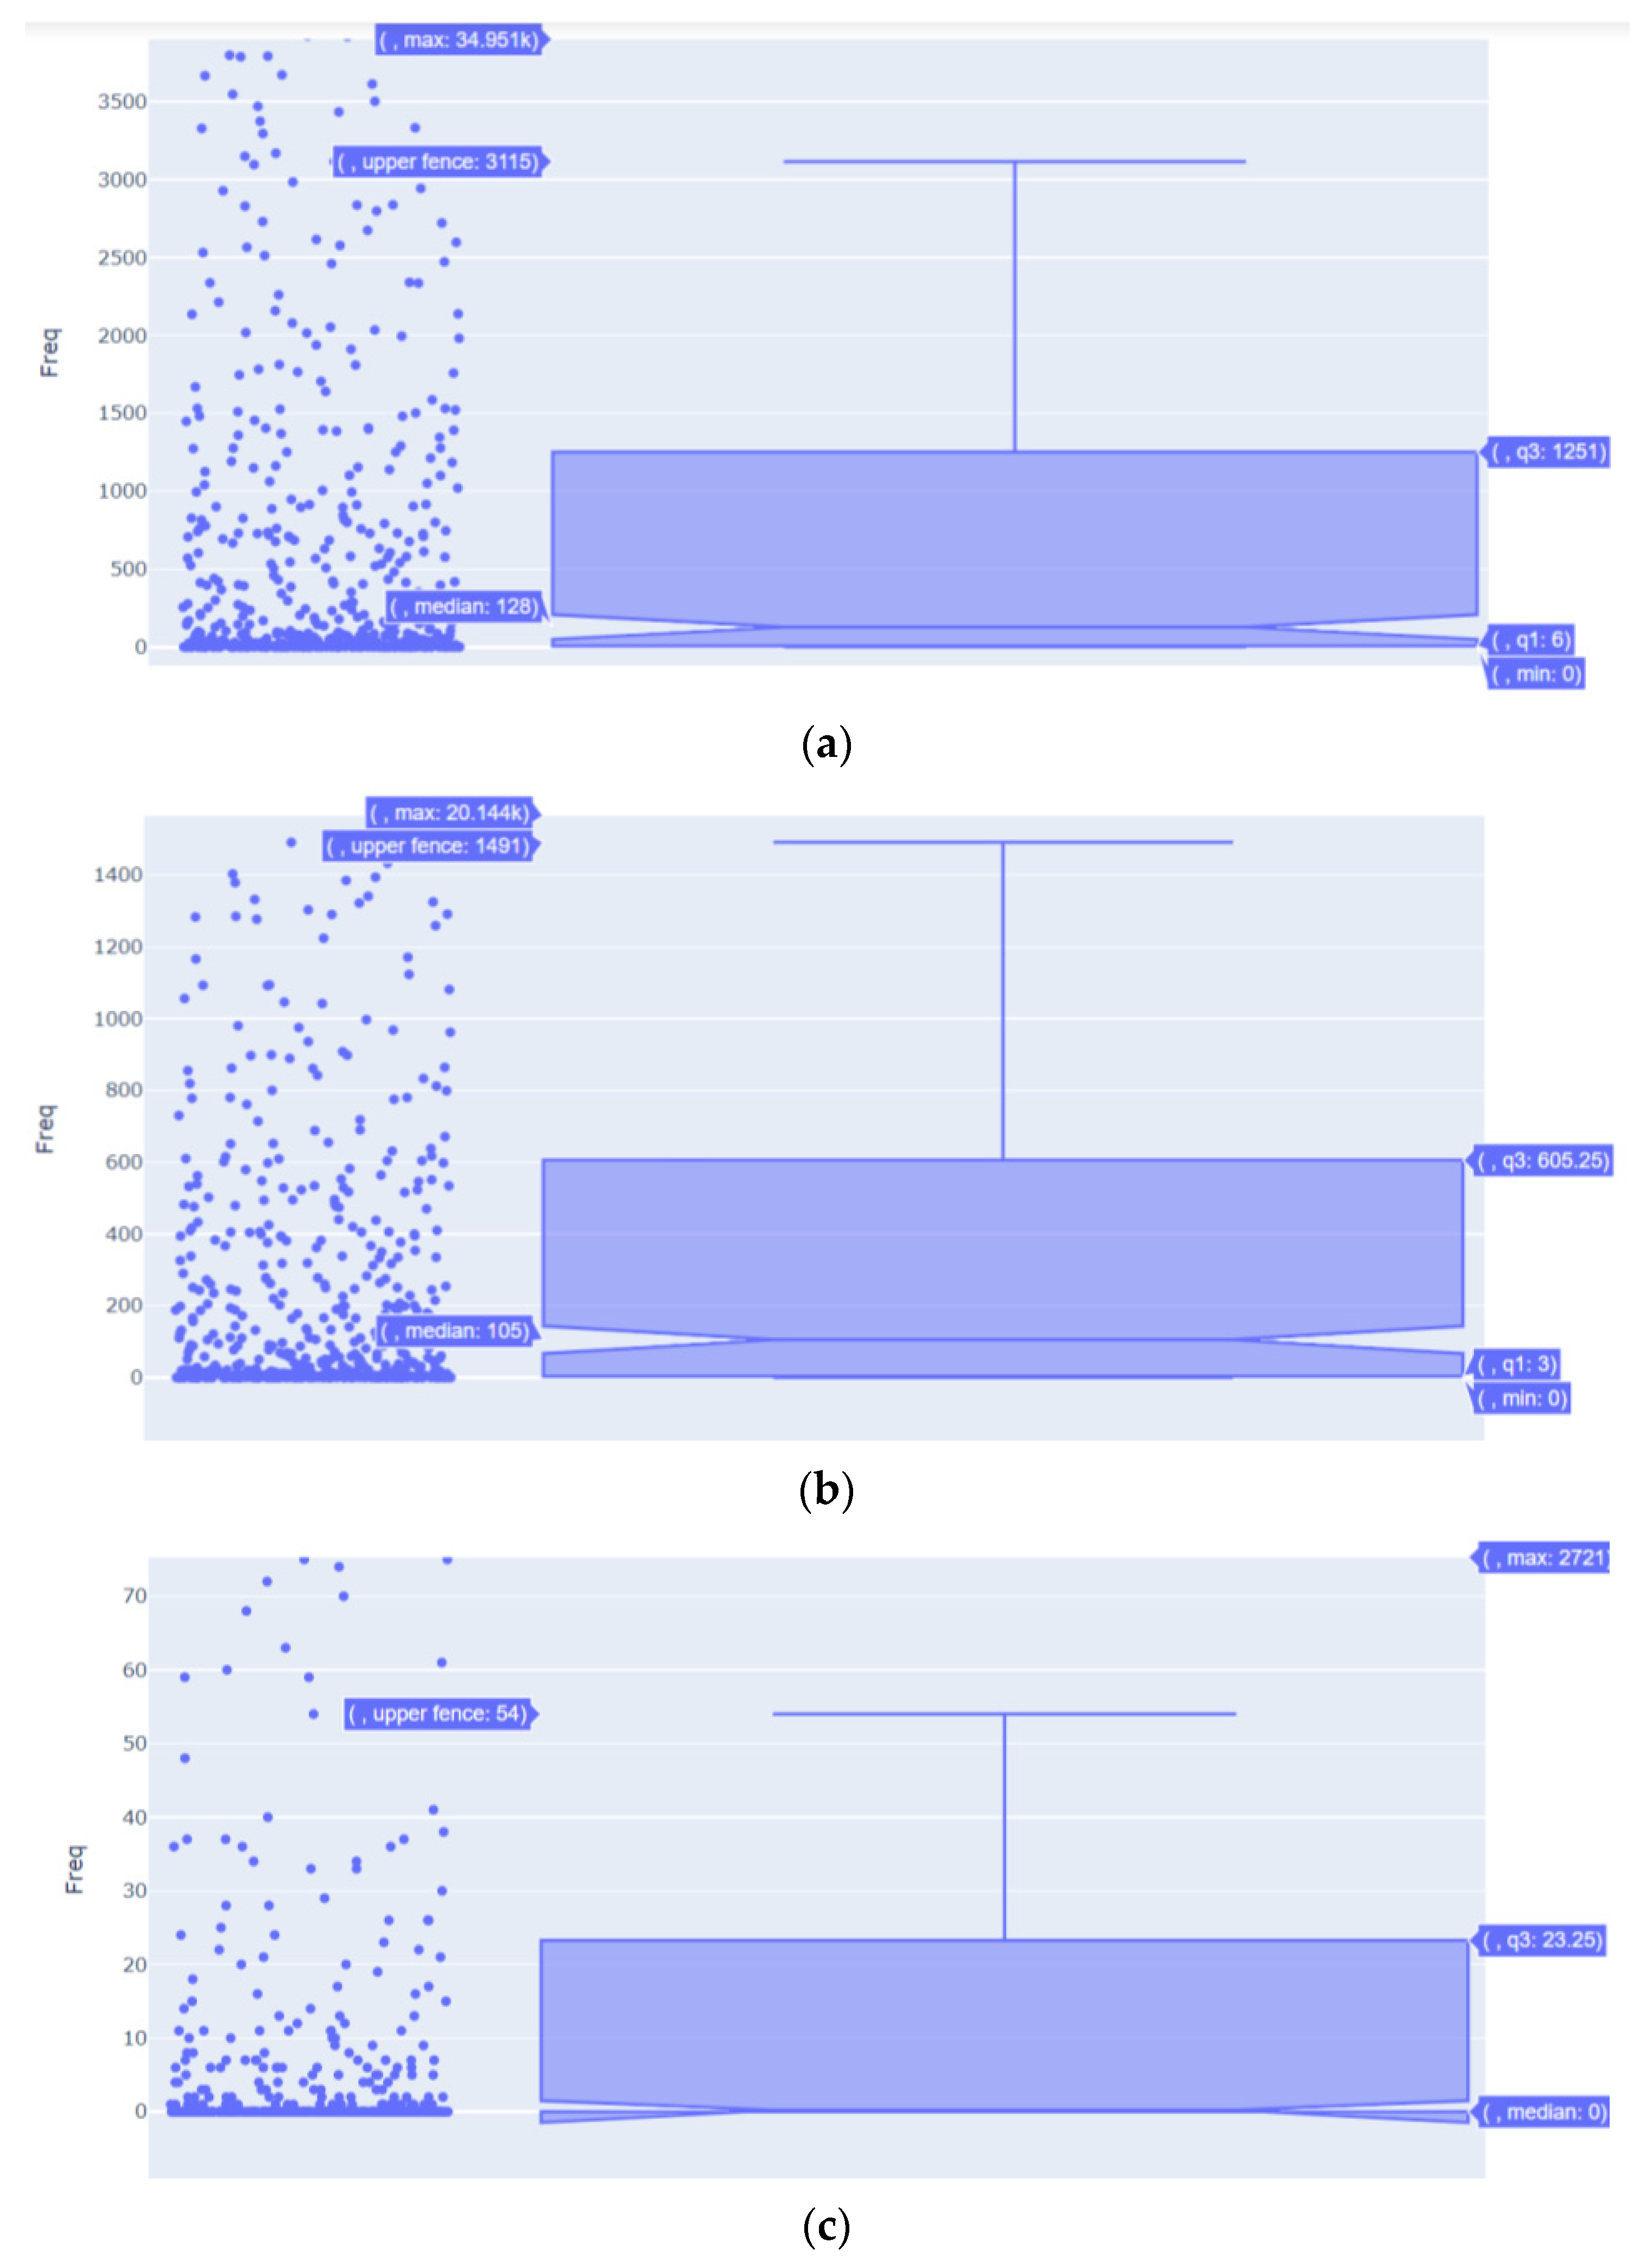
4.2. CSD in 3T Universities

Derived from the finding of low student participation in 3T, this indicates that the students faced more challenges than those in more developed areas. In this case, we observed the intensity of 3T students and all students in accessing SPADA, as depicted in Figure 9. Here, the horizontal X-axis shows the index (idx) of months where idx = 0 represents March 2021, while the vertical Y-axis shows the users who accessed SPADA. By observing the plot, we can see how often a user accessed the platform in a month within the time-span between March and November 2021, showed by color intensity of 0 to 50.
Based on the data, the SPADA implementation in its early usage (between March and April 2021) demonstrates that 3T students presented high intensity, as depicted in Figure 9. However, the intensity suddenly dropped in April 2021, and then plateaued until July 2021. This trend occurred in all universities, not only in 3T areas. Interestingly, there is a gradual increase of CSD activities in 3T universities between May and July 2021, which is not found in all universities. Considering the fact that the government’s supporting resources to 3T universities (e.g., VSAT and tablets) arrived in November 2021, it seems that some students in 3T areas had devoted their own efforts to get access to SPADA before the government’s support arrived. This can be regarded as a good sign that the 3T students embraced the new digital learning system despite the challenges they faced in accessing the platform. Moreover, by correlating this finding with the low progress of SPADA usage in 3T universities, we infer that technical issues (e.g., infrastructure and internet connections) might not be the greatest challenge faced by the 3T students, but non-technical issues (such as students’ motivation to learn and the ability to self-regulate their learning process) might be more critical.
Furthermore, the CSD revealed higher intensity results in August 2021, reaching almost 100,000 times the intensity of the month before. After referring to events that happened during that month, we assert that this interesting finding might be caused by two events: (1) it was the month before a new semester began (September), in which students needed to sign on to the platform, and (2) the execution of new courses arose, conducted by the Directorate General of Higher Education, namely PMMDN and Modul Nusantara. The new courses were student exchange programs and fell under the umbrella of the ‘Merdeka Belajar Kampus Merdeka’ (MBKM) campaign. Apparently, the new courses had attracted many students, hence contributing to the leap in SPADA activities. Not surprisingly, after the two programs ended, the intensity of activities on the platform plummeted drastically. This situation occurred for all universities. Evidently, the students were more encouraged to utilize the SPADA programs either when they were obligated to take compulsory courses (academic curriculum) or were attracted to student exchange programs as non-compulsory courses.
Figure 10 show the SPADA usage at 3T universities, specifically: (a) activities by lecturers and students on related courses, (b) activities on modules and courses (viewing or reading), (c) activities on assignments (viewing, downloading, submitting), and (d) activities on discussion (posting queries or comments). We excluded the outliers from the graphs and gave labels for maximum value, upper fence, 3th quarter (q3), median, and 1st quarter (q1) for each boxplot.
Firstly, as depicted in Figure 10a, we can see that some students tried to access the platform, although the usage rate is still low (around 8.99 percent of all 3T universities). The data shows that only a few universities had more than 40 activities, and others had activities with values between 0 and 40, and averaged around 12 activities. Similarly, Figure 10b shows that the average frequency is around 82, which had activities on courses and modules. In Figure 10c, we can see that although a number of assignments had been given by the lecturers, only a few students (average frequency is 48) worked and submitted the tasks. This interesting finding suggests an opportunity for further study to understand why the majority of 3T students failed to work on the assignments. This might be caused by technical issues (such as problems with internet connections or the SPADA system itself when the students tried to download or submit the work) or non-technical issues (such as the students’ lack of understanding of the assignments). The latter piques our curiosity about whether the students initiated the use of the discussion forum on the platform when they needed explanation from the lecturer. The possible answer can be found in Figure 10d, which shows that the discussion feature had not been optimally employed by the students in 3T areas thus far. Here, we found the frequency average is only four times. This finding leads to a concern, because a discussion forum, either between students and lecturers or amongst themselves, is important to support students’ learning processes, to clarify materials that are not being understood, and to exchange perspectives as part of the intellectual exercise.
Simultaneously with the CSD analysis, we also analyzed the results of a data survey conducted by the Directorate General of Higher Education in November 2021 among 697 students in 3T universities. The survey data revealed that the first challenge faced by the students when they started accessing the platform was Internet accessibility due to financial problems (38.02 percent), followed by the limited socialization of SPADA program (28.4 percent) and inconvenient learning environment (34.38 percent). These findings suggest that the SPADA program still needs to be intensively communicated and supported by each university’s rules and administration services. Furthermore, the survey data also shows that 3T students faced various constraints during the process of using the platform. As shown in Figure 11, economic condition and unconducive environment are among the top constraints faced by 3T students. These findings might be related to the COVID-19 crisis, which involved multi-dimensional issues, particularly for people in underdeveloped areas.
In brief, the findings thus far demonstrate the initial picture of possible factors (either inhibiting or facilitating) that influence 3T students when dealing with their SRL through the SPADA platform. The data also indicates that non-technical issues might be more critical than technical issues in influencing students’ learning motivation and process. The following section discusses how SPADA provides indicators for us to monitor students’ SRL activities.

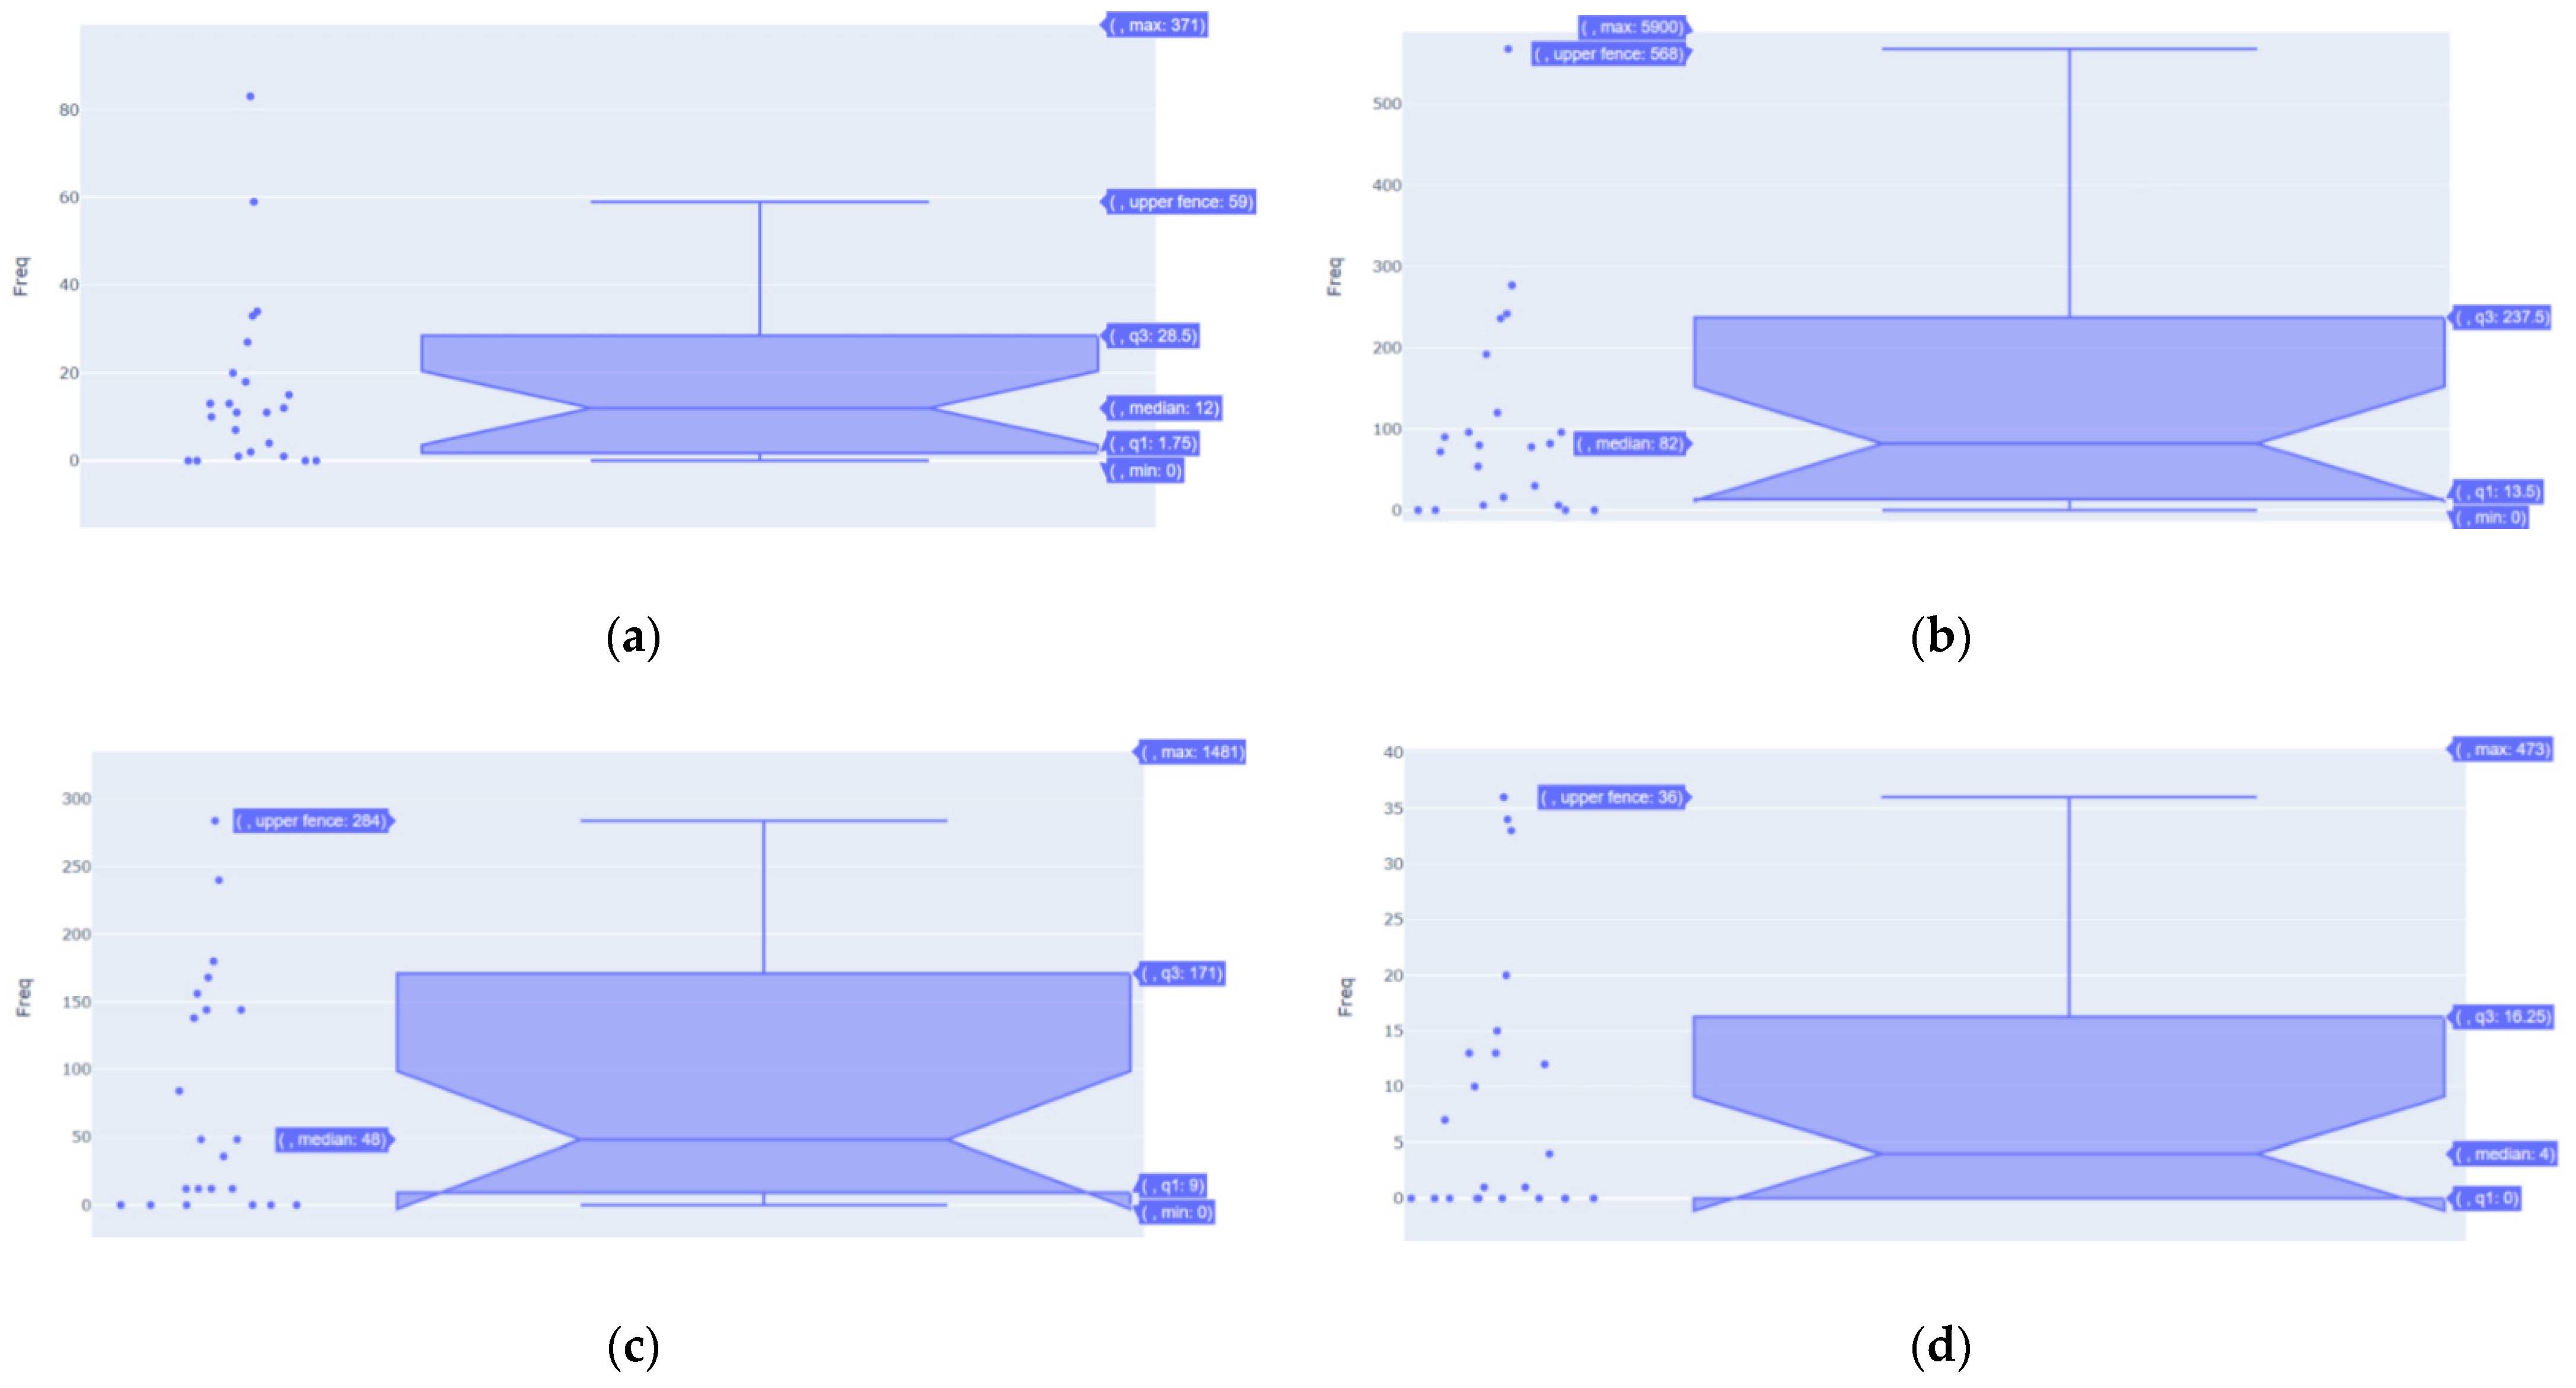
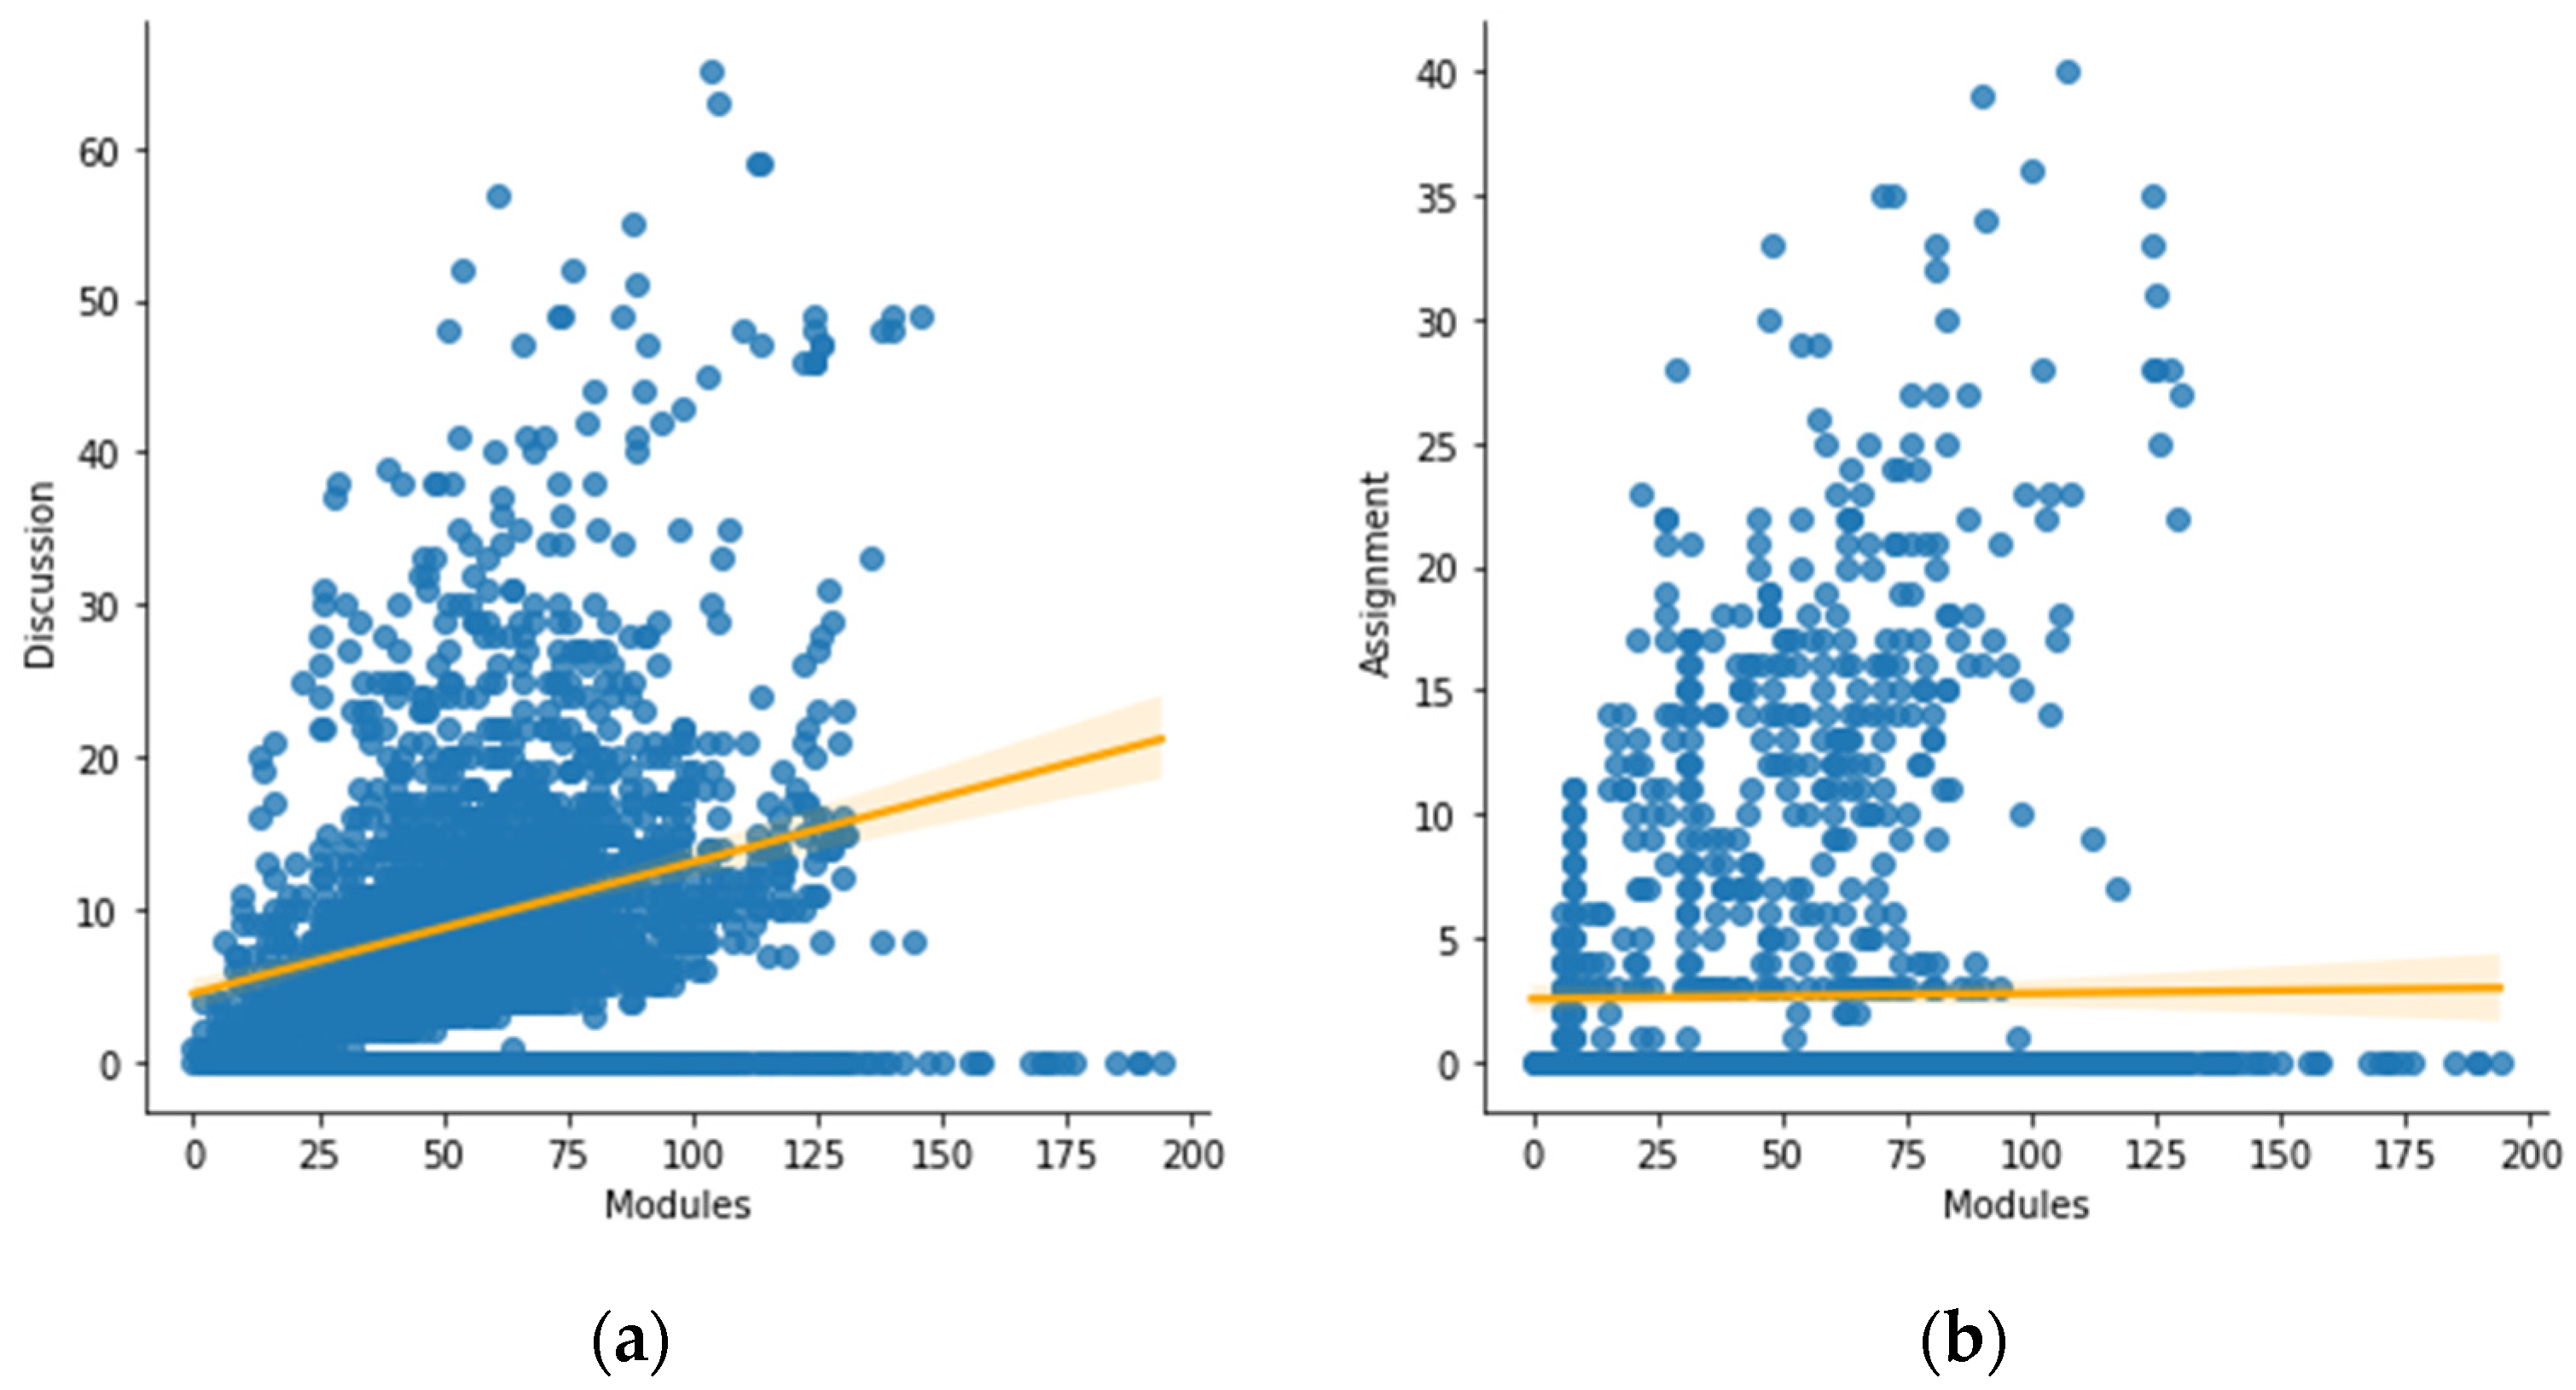
4.3. Correlation Analysis of SRL

To measure the effectiveness of the SPADA platform in examining the students’ SRL behavior, we performed a correlation analysis using the Pearson Correlation method. At first, we assumed that the objective of SRL can be achieved by looking at the students’ academic performance. Nevertheless, we could not collect the data of students’ grades of assignments and exams from the platform. This might either be caused by the platform’s limitation or the universities’ policies about the confidentiality of student grading. To address this limitation, we employed the data on students’ accessing the ‘discussion’ forum and working on ‘assignments/exams’ in order to analyze the correlation between them. Intuitively, a student will have better results in a course if he/she engages in more discussions so that they can work and submit assignments well. In order to achieve this objective, the modules should be accessed more frequently during the learning process. Therefore, in this correlation analysis we examined three main parameters: module, discussion, and assignment. The plot of each dot in the correlation process is depicted in Figure 12, involving the data of all universities under studied. Here, the blue dots represent the distribution mapping of the above mentioned parameters, while the orange lines show the strength of the linear relationship between a pair of variables in each figures.
The two figures show that all the correlation indexes are positive, which means that there is a relationship between the parameters. However, the correlation result of modules and assignment (0.01) is slightly less than the correlation of modules and discussion (0.27). The smaller number of the index indicates a weak relationship between modules and assignment. Apparently, the students tended to be more active in the discussions in some modules rather than working and accomplishing the modules’ assignments. In general, the data shows that not all assignments in a number of courses across the universities have been accomplished. This suggests further investigation is required regarding what is behind this behavior, as working on assignments is regarded as one of the important aspects in a learning process, particularly in how students can monitor and regulate themselves to improve. By understanding the issues better, we can generate improvements of both technical and non-technical aspects.

5. Results

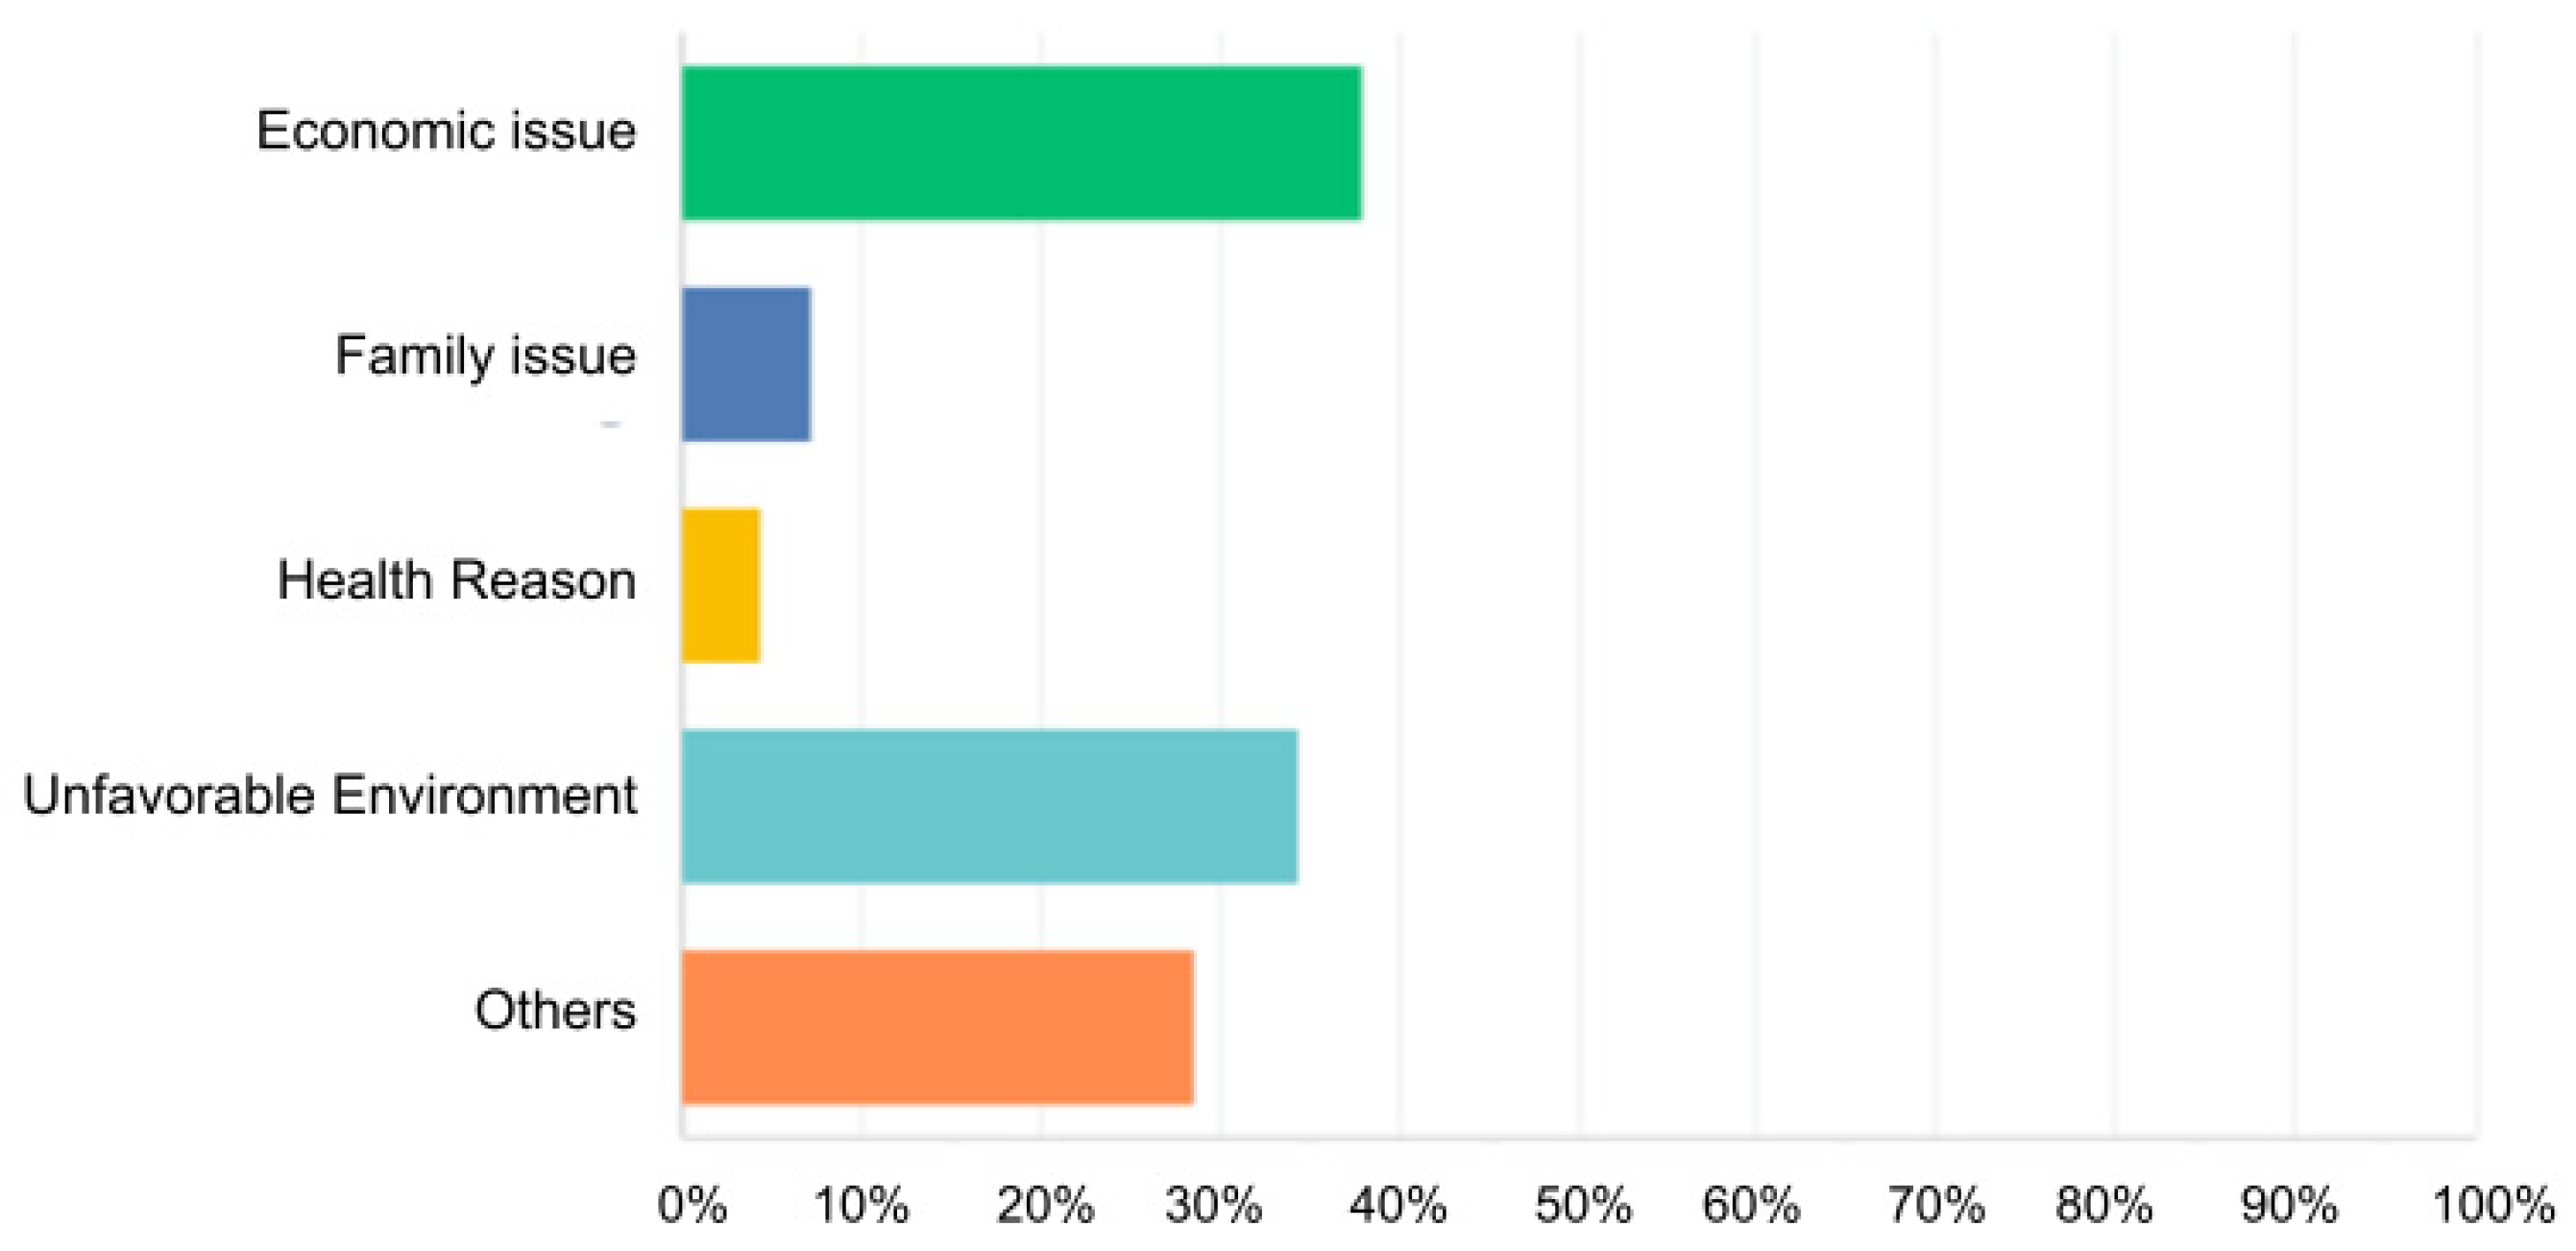
5.1. User Acquisition of SPADA DIKTI

After nine months of SPADA implementation (from March to November 2021), the platform had been used by 558 universities throughout Indonesia. As a start, this can be regarded as a good result of the program, reaching about 16 percent of universities within a short time, especially considering that Indonesia is an archipelago country with various limitations. In this nationwide program, the present study indicates that the students who had been given access to the platform responded positively on the platform as their part of the learning processes during the pandemic. The finding demonstrate that the courses initiated by universities seemed to gain more popularity than those initiated by DIKTI, reaching around 7000 records of activities. This indicates that the students tended to participate in courses included in the academic curriculum or in those that were compulsory. The next most popular was the PMMDN program, with almost 2000 records, followed by the IISMA program. Apparently, the student exchange programs (either inside or outside Indonesia) were considered attractive by the students after completing the compulsory courses. Future investigation can be conducted to explore more about this result for further improvements, for instance, in developing the courses’ quality and innovativeness.

5.2. The Indicators of SRL

This study has examined how the current SPADA platform facilitated indicators of students’ SRL activities in 3T universities compared to activities from all universities. We grouped the CSD of SPADA activities that were accumulated from March to November 2021 into SRL phases (planning, monitoring, regulating) by referring to criteria we explained in the previous section.
In the planning phase, we employed the criteria of CSD types: MODULE, COURSE, CONTENT TYPE, SUB-MODULE, and SIGN-IN. As depicted in Figure 13, we see that the most records in the planning phase is the SIGN-IN activity for all universities.
Figure 13a demonstrates that very few students (in all areas) clicked ‘COURSE’, perhaps to learn about the course’s material after signing in, and no other activities occurred in this phase. Referring to the concept of SRL [16], such low activities in the planning phase show an initial signal that most students might not conduct optimal planning activities on the platform prior to the class. We suspect that this happened during the times in which the class registration had been done before the SPADA platform launched in March 2021. Normally, the course registration for a new semester (March period) takes place between January and February. Therefore, before starting to use the SPADA platform in March or April 2021, the students could already have completed some initial or planning activities, such as reading the course syllabus or communicating with the lecturer using other methods (e.g., email). In other words, since the launch of SPADA did not coincide with the start of a new semester, the low rate of planning activities on the SPADA platform might not represent the normal use of the planning phase in the online-learning system. We propose that SPADA should accommodate open courses across universities, so that students can proactively choose and prepare themselves for the listed courses. In other words, the students can create their study plan based on their needs and interest.
Regarding the monitoring phase, SPADA’s CSD shows high-intensity activities by 3T universities, as shown in Figure 14. There is a similar pattern between all universities and 3T universities, showing that the MODULE activity gained the highest records across the universities, followed by SUB_MODULE and ASSIGNMENT activities. This shows a positive indicator that the students had attempted to utilize the platform by viewing and downloading the course materials (in MODULE and SUB_MODULE) before working on the assignments. However, the SPADA data could not provide more comprehensive and detailed information about monitoring activities, such as whether the students read and tested their knowledge, tried to track their attention on the course, or monitored their learning progress. For example, the CSD did not provide data on students’ time spent on viewing the modules, which could be assumed as they were reading them. Moreover, we could not capture the sequential patterns of students’ behaviors from one point to another, whereby we could monitor, for instance, what students did after viewing the modules, after viewing the exam grades, or other possible sequential patterns related to monitoring behaviors. Based on the data, we can analyze how they utilized the platform to monitor and improve their learning processes and then compared the monitoring with regulating activities.
In the regulating phase, the CSD provides very limited data. We could mainly capture the students’ activities on EXAM, i.e., submitting the answers. However, we could not capture the critical behaviors of students related to regulating activities, such as to acquire and/or reinforce knowledge after they got the exam or assignment results. The CSD did not provide data on whether the students re-read the course materials after viewing their exams results, by which we could assume that they tried to regulate their learning processes. Furthermore, we also did not find the REVIEWED activities from the students, which can be regarded as an important behavior in regulating strategy, where the students could make improvements in their future learning process. This limited the regulating activities on the part of students that occurred not only in 3T areas but also in all universities.
Thus far, the findings of SPADA’s initial data suggest that the platform is still very limited in providing indicators for us to learn and understand the students’ SRL, including important indicators in each phase. In the three SRL phases, we could also not find an indication of students’ activities in the discussion forum, including when preparing the exams or after the exams had been completed. Although discussions with their peers or teachers could be conducted through other methods (email or chat platforms such as WhatsApp), utilizing the discussion forum on LMS could be beneficial for not only the students but also the lecturers, to allow them to track the learning processes as a whole. In brief, the limitations of the SPADA platform to facilitate SRL monitoring could potentially prevent us from understanding how the students cope with the distance learning challenges and their SRL progress.

6. Discussion

The research findings have identified the utilization of the SPADA platform after the first nine months across Indonesia. The specific context of underdeveloped areas in Indonesia offers a good background to help us understand the extent of students’ acceptance amidst several limitations compared to more developed areas. Indonesia represents an emerging economy with a large population and offers unique characteristics as an archipelago country.

6.1. Theoretical Contributions

The present research complements the existing theories [28,37], particularly in demonstrating the usage of CSD in LMS to observe and analyze students’ activities in a short span of time. The measurement of SRL using CSD from LMS enhances the existing empirical studies that mostly apply other intervention tools to examine SRL [16,28]. Indeed, there have been several important studies regarding the use of LMS on the SRL approach in general higher institutions [28,30,33,40,41,42]. However, to the best of our knowledge, only a few studies have investigated the usage of LMS at a nationwide level. By exploring the SRL using CSD at the massive scale, our study contributes to exploring the effectiveness of online learning during the COVID-19 crisis [5,6,14,22]. Unlike existing studies, our study offers a better understanding on how students in different areas cope with both technical and non-technical issues during the pandemic, especially when implementing the new online learning system. Moreover, different to the existing use of CSD on SRL, which mostly relates to students’ time-management skills in certain courses/classes (see [28], p. 8), our study applies a behavioral pattern of data on a broader scale across the country.
Regarding the CSD of learning activities, our study revealed an interesting finding in the case of 3T students. We found that very few (less than 25 percent) of 3T students had worked on the assignments and exams. Based on the CSD, we can see that most of them did not work on or submit assignments or exams. This is also shown in the correlation analysis, where most students did not respond positively on the modules’ assignments. However, we could not investigate this issue further due to the limited data on the platform. Apparently, the students did not optimize the discussion forum on the platform to seek assistance, either from lecturers or their peers, when encountering difficulties [28]. In other words, there was a lack of social learning on the part of students when facing challenges [32]. By correlating the CSD with the survey data, we found an indication that 3T students perceived non-technical aspects as the significant challenges for them, namely their economic condition and an unconducive environment. In this case, we suggest that universities or regulators address such non-technical issues faced by 3T students, while simultaneously providing technical support. This finding corroborates existing studies regarding challenges faced by students in adopting online learning [4,8,13,20,43]. Having personal or emotional problems might inhibit some students to openly communicate their learning problems in the discussion forum. As noted by [17], when using an online-learning platform, every student faces different issues as well as benefits differently from the platform’s resources. Therefore, the educators and regulators need to integrate human aspects and learning theories when developing the online-learning system and its environments (as adaptive support systems) in order to help each student to optimize his or her learning process. If these supports are put in place, we can expect more interactions between lecturers and students. The notion of devoting more attention to students’ personal issues in using LMS has the potential to also be applied in underdeveloped or remote areas of other countries. Several existing studies have indeed compared the readiness of students between countries (such as [7,18,44]), but rarely have they focused on underdeveloped areas.

6.2. Practical Contributions

In addition to theoretical contributions, the present study also provides practical contributions for Indonesian regulators and universities regarding how SPADA can be improved to support the examination of students’ SRL strategies. The CSD retrieved between March and November 2021 shows fluctuating trends of usage, either by 3T students or non-3T students. The intensive use was particularly observed at the beginning of a new semester (March/April and August), when students attempted to sign in to the related courses. This suggests the need for more intensive communication with either the existing SPADA users or non-users (to participate in the platform). Overall, by considering various challenges faced by the initiators of SPADA and its users, such as in disseminating information about SPADA due to the infrastructure and resources limitations, the results of SPADA implementation within a short period could be regarded as quite satisfying. Regardless of the COVID-19 phenomenon, promoting SRL through a digital educational platform, particularly for students in underdeveloped areas, is critical for the future.
Despite its unequal accessibility on the platform (between 3T and all areas) and fluctuating usage (of all users), the platform has enabled students in 3T areas to embark on the digital learning program during the COVID-19 pandemic. Although the number is still considered low, we observed similar patterns in the general usage of SPADA resources between 3T students and students in all areas. This indicates that, although students in underdeveloped areas were facing more challenges than in more developed areas (such as the availability of supporting facilities and infrastructure), some students had successfully managed the challenges by themselves and aligned their learning processes with students in other areas. One example of a similar pattern is seen in popular courses. Based on the CSD, we found that the most popular courses were those that related to the academic curriculum (initiated by universities) and student-exchange programs (initiated by the government). It seems that such cultural-related programs reflect the students’ preference that enticed them to join. Further research could explore students’ needs and aspirations when developing educational programs in the future.
The current platform’s resources still failed to enable the provider and the lecturers to monitor students’ SRL behaviors and to help the students to improve their self-regulated strategies to achieve better learning performance. For example, the planning phase can be facilitated by resources or features that function to arrange class or individual learning schedules. Furthermore, SPADA can also be facilitated by a reminder feature, through which students can fill in their schedules for upcoming teaching (synchronous), assignments and exams, and more individual learning activities. By adding the reminder feature completed by students, we can monitor how the students plan and regulate their learning processes. In the regulating phase, the reminder can be highlighted in the feedback features on the results of accessing resources. For example, each course offers special comments for discussion and responses to existing lectures. In this regard, we propose to regularly conduct a survey parameter that monitors students’ level of understanding. In this way, the platform can provide more significant impacts in measuring the students’ SRL level. Regardless of the platform’s limitations in facilitating the SRL monitoring phase, the present study expands our understanding on the usage of LMS to capture SRL on a massive scale (nationwide). Based on this understanding, further research and improvements should be conducted to analyze the broad scope of LMS usage, particularly in investigating students’ behavior.
Thus far, we reveal the effectiveness of SPADA in providing some indicators of SRL. In the early-stage implementation, this can be considered a good signal in which the platform has incorporated features to support the students’ learning process, and at the same time, the CSD analyzes SRL behaviors. However, more improvements definitely still need to be made in at least two ways: (1) develop more complete and massive outreach to many universities to encourage the sustainability of this program, and (2) improve the system by adding more features related to SRL activities that can encourage students to use them regularly. Completion of these two strategies will offer a more significant impact on the use of SPADA, both for the regulator and universities, and especially for the students. In future work, we will focus our study on the SRL patterns of students in underdeveloped areas when using SPADA after it has been improved. The pattern of SRL activities in underdeveloped areas is considered to be unique due to the existing limitations, such as geography, internet quality, economics, and family environment. By understanding the SRL patterns, more tailored materials and methods can be designed and delivered for students in underdeveloped areas. The findings of this study may also potentially be applied in other contexts, where enabling regulators or universities to make any improvements or intervention on an LMS platform can help address the issue of inequity in higher education at a nationwide scale.

6.3. Limitations

The present study also has several limitations. First, the SPADA platform is still very limited in providing indicators that can be used to monitor students’ SRL behaviors and strategies. In the planning phase, the platform should provide data on how students prepare their learning strategy (including goal setting), organize the materials, and address critical questions before the course begins. In the monitoring phase, the platform should provide data to observe the students’ awareness of disruptions against their goals and find more effective ways to cope with the disruption [36]. A regulating strategy is also important to understand how students reflect their learning progress and make improvements for the future [36]. Furthermore, the use of CSD in understanding SRL can be more advantageous if it can incorporate more detailed and objective insights in order to make the necessary interventions that can affect students’ SRL behaviors [16,28]. Second, as the data is treated in an aggregate manner and the SPADA platform was not able to display more detailed information, some nuances phenomena were not captured, particularly those that related to the students’ specific learning behaviors. Based on the data analysis of behavioral patterns on students’ SRL behaviors and the comparison between 3T students and non-3T students, we find that the SPADA CSD potentially provides indicators of Indonesian students’ SRL behaviors at the aggregate level, and not at the more granular level [37]. The main finding suggests that the platform needs to be improved with more advanced analytic techniques so that both the universities and the regulator can monitor the students’ SRL and determine how they improve their learning process over time. This entails a need for further investigation, along with the improvement of SPADA capabilities. Second, due to the platform’s limitation to provide final grading as the learning results, this study is not able to compare and contrast some groups of data. For instance, between courses and areas and the students’ performance in those groups based on their final grading. By analyzing the groups, we might gain a better understanding on certain characteristics of students. Third, this study did not explore the aspect of students’ background related to their SRL results. Some students, for example, might have been struggling with personal problems that affected their performance of self-managed study. We also did not know why the discussion feature of some courses were not applied by users. Such limitations can be studied further by using more qualitative approaches.

7. Conclusions

The research provides a picture of the implementation of the SPADA platform as part of the Indonesian government’s efforts to create equal access to higher education across the Indonesian archipelago. Our work addresses the research questions by showing the comparison of behavioral patterns between the students in 3T and non-3T areas in using the platform by examining CSD to understand their SRL. The findings suggest that the SPADA platform is still very limited in providing optimal indicators to learn and understand the students’ SRL capabilities. At the same time, the positive results of the correlation measurement indicate that, by the students taking more modules in the platform, they seemed to be more able to improve their learning process, such as through discussions (with other students and lecturers) and working on the assignments. Although the current rate of usage intensity has still been low (particularly on the students’ routine activities), the finding indicates that the platform has the potential of gaining increased user acquisition within a short span of time. Further improvements on the platform are certainly still needed, particularly in its ability to monitor students’ SRL behaviors. Regarding the context of underdeveloped areas, we identify an optimistic finding where some students in 3T areas have devoted their efforts to cope with their limitations and proved that they could catch up with students in other areas. By referring to the initial purpose of initiating the SPADA program to address the inequality issue of higher education, this study confirms that, by employing the SRL approach, the regulators and universities can actively monitor students’ learning processes. In this way, the access to qualified education and the expected learning performance throughout the nation can be continuously improved.

Author Contributions

Conceptualization, P.N.M.R. and I.H.; data curation, P.N.M.R. and I.H.; formal analysis, P.N.M.R. and I.H.; investigation, P.N.M.R.; methodology, P.N.M.R., I.H. and P.P.; software, P.N.M.R.; supervision, P.P. and D.R.; validation, P.N.M.R., I.H., P.P. and D.R.; writing—original draft, I.H.; writing—review and editing, P.N.M.R., I.H. and P.P. All authors have read and agreed to the published version of the manuscript.

Funding

This research (including the APC) was funded by ‘Kementerian Pendidikan, Kebudayaan, Riset, dan Teknologi Republik Indonesia’ (the Ministry of Education, Culture, Research, and Technology, the Republic of Indonesia), grant number: not-to-be disclosed.

Institutional Review Board Statement

The study was conducted according to the copyright permission granted by the Directorate General of Higher Education, the Republic of Indonesia (Document Number: 2839/EI/TU/2021).

Informed Consent Statement

Informed consent was obtained from all subjects involved in the study.

Data Availability Statement

The data presented in this study are available on request from the corresponding author.

Acknowledgments

The authors would like to thank the Indonesian Ministry of Education and Culture, Research, and Technology for the research funding and for providing the data used in this research. In addition, we also thank Yusep Rosmansyah (Institut Teknologi Bandung) and the SPADA DIKTI team for useful discussions and supports.

Conflicts of Interest

The authors declare no conflict of interest.

References

  1. Adeyeye, B.; Ojih, S.E.; Bello, D.; Adesina, E.; Yartey, D.; Ben-Enukora, C.; Adeyeye, Q. Online Learning Platforms and Covenant University Students’ Academic Performance in Practical Related Courses during COVID-19 Pandemic. Sustainability 2022, 14, 878. [Google Scholar] [CrossRef]
  2. Adnan, M.; Anwar, K. Online learning amid the COVID-19 pandemic: Students’ perspectives. J. Pedagog. Sociol. Psychol. 2020, 2, 45–51. [Google Scholar] [CrossRef]
  3. Aristovnik, A.; Keržič, D.; Ravšelj, D.; Tomaževič, N.; Umek, L. Impacts of the COVID-19 Pandemic on Life of Higher Education Students: A Global Perspective. Sustainability 2020, 12, 8438. [Google Scholar] [CrossRef]
  4. Karadag, E.; Su, A.; Ergin-Kocaturk, H. Multi-level analyses of distance education capacity, faculty members’ adaptation, and indicators of student satisfaction in higher education during COVID-19 pandemic. Int. J. Educ. Technol. High. Educ. 2021, 18, 1–20. [Google Scholar] [CrossRef] [PubMed]
  5. Nazempour, R.; Darabi, H.; Nelson, P.C. Impacts on Students’ Academic Performance Due to Emergency Transition to Remote Teaching during the COVID-19 Pandemic: A Financial Engineering Course Case Study. Educ. Sci. 2022, 12, 202. [Google Scholar] [CrossRef]
  6. Ilangarathna, G.A.; Ranasinghe, Y.; Weligampola, H.; Attygalla, E.; Ekanayake, J.; Yatigammana, S.; Pinnawala, M.; Godaliyadda, R.; Herath, V.; Ekanayake, P.; et al. A Comprehensive Overview of Education during Three COVID-19 Pandemic Periods: Impact on Engineering Students in Sri Lanka. Educ. Sci. 2022, 12, 197. [Google Scholar] [CrossRef]
  7. Churiyah, M.; Sholikhan, S.; Filianti, F.; Sakdiyyah, D.A. Indonesia Education Readiness Conducting Distance Learning in COVID-19 Pandemic Situation. Int. J. Multicult. Multirelig. Underst. 2020, 7, 491–507. [Google Scholar] [CrossRef]
  8. Eze, S.C.; Chinedu-Eze, V.C.; Bello, A.O. The utilisation of e-learning facilities in the educational delivery system of Nigeria: A study of M-University. Int. J. Educ. Technol. High. Educ. 2018, 15, 34. [Google Scholar] [CrossRef]
  9. Dwiyanto, F.A.; Elmunsyah, H.; Yoto, Y. Indonesian online learning system evaluation framework based on UTAUT 2.0. Bull. Soc. Inform. Theory Appl. 2020, 4, 83–90. [Google Scholar] [CrossRef]
  10. Fadhil, I.; Sabic-El-Rayess, A. Providing Equity of Access to Higher Education in Indonesia: A Policy Evaluation. Indones. J. Learn. Adv. Educ. 2020, 3, 57–75. [Google Scholar] [CrossRef]
  11. Arifin, M.H. The Role of Higher Education in Promoting Social Mobility in Indonesia. Eur. J. Multidiscip. Stud. 2017, 6, 233. [Google Scholar] [CrossRef] [Green Version]
  12. Moeliodihardjo, B.Y. Equity and Access in Higher Education; World Bank: Jakarta, Indonesia, 2013. [Google Scholar]
  13. Alamri, M.M. Investigating Students’ Adoption of MOOCs during COVID-19 Pandemic: Students’ Academic Self-Efficacy, Learning Engagement, and Learning Persistence. Sustainability 2022, 14, 714. [Google Scholar] [CrossRef]
  14. Moustakas, L.; Robrade, D. The Challenges and Realities of E-Learning during COVID-19: The Case of University Sport and Physical Education. Challenges 2022, 13, 9. [Google Scholar] [CrossRef]
  15. Baker, R.S.; Yacef, K. The State of Educational Data Mining in 2009: A Review and Future Visions. J. Educ. Data Min. 2009, 1, 3–17. [Google Scholar] [CrossRef]
  16. Cicchinelli, A.; Veas, E.; Pardo, A.; Pammer-Schindler, V.; Fessl, A.; Barreiros, C.; Lindstädt, S. Finding traces of self-regulated learning in activity streams. In Proceedings of the 8th International Conference on Learning Analytics and Knowledge, Sydney, Australia, 7–9 March 2018; pp. 191–200. [Google Scholar] [CrossRef] [Green Version]
  17. Wong, J.; Baars, M.; Davis, D.; Van Der Zee, T.; Houben, G.-J.; Paas, F. Supporting Self-Regulated Learning in Online Learning Environments and MOOCs: A Systematic Review. Int. J. Hum.-Comput. 2018, 35, 356–373. [Google Scholar] [CrossRef]
  18. Soria-Barreto, K.; Ruiz-Campo, S.; Al-Adwan, A.S.; Zuniga-Jara, S. University Students Intention to Continue Using Online Learning Tools and Technologies: An International Comparison. Sustainability 2021, 13, 13813. [Google Scholar] [CrossRef]
  19. Stahl, G.; McDonald, S.; Stokes, J. ‘I see myself as undeveloped’: Supporting Indigenous first-in-family males in the transition to higher education. High. Educ. Res. Dev. 2020, 39, 1488–1501. [Google Scholar] [CrossRef]
  20. Martha, A.; Junus, K.; Santoso, H.; Suhartanto, H. Assessing Undergraduate Students’ e-Learning Competencies: A Case Study of Higher Education Context in Indonesia. Educ. Sci. 2021, 11, 189. [Google Scholar] [CrossRef]
  21. Kumar, J.A.; Osman, S.; Sanmugam, M.; Rasappan, R. Mobile Learning Acceptance Post Pandemic: A Behavioural Shift among Engineering Undergraduates. Sustainability 2022, 14, 3197. [Google Scholar] [CrossRef]
  22. Chet, C.; Sok, S.; Sou, V. The Antecedents and Consequences of Study Commitment to Online Learning at Higher Education Institutions (HEIs) in Cambodia. Sustainability 2022, 14, 3184. [Google Scholar] [CrossRef]
  23. Bond, M.; Bedenlier, S.; Marín, V.I.; Händel, M. Emergency remote teaching in higher education: Mapping the first global online semester. Int. J. Educ. Technol. High. Educ. 2021, 18, 1–24. [Google Scholar] [CrossRef] [PubMed]
  24. Tsai, C.-W.; Shen, P.-D.; Fan, Y.-T. Research trends in self-regulated learning research in online learning environments: A review of studies published in selected journals from 2003 to 2012. Br. J. Educ. Technol. 2013, 44, E107–E110. [Google Scholar] [CrossRef]
  25. Winters, F.I.; Greene, J.A.; Costich, C.M. Self-Regulation of Learning within Computer-based Learning Environments: A Critical Analysis. Educ. Psychol. Rev. 2008, 20, 429–444. [Google Scholar] [CrossRef]
  26. Azevedo, R. Using Hypermedia as a Metacognitive Tool for Enhancing Student Learning? The Role of Self-Regulated Learning. Educ. Psychol. 2005, 40, 199–209. [Google Scholar] [CrossRef]
  27. Kop, R. The challenges to connectivist learning on open online networks: Learning experiences during a massive open online course. Int. Rev. Res. Open Distrib. Learn. 2011, 12, 19–38. [Google Scholar] [CrossRef]
  28. Baker, R.; Xu, D.; Park, J.; Yu, R.; Li, Q.; Cung, B.; Fischer, C.; Rodriguez, F.; Warschauer, M.; Smyth, P. The benefits and caveats of using clickstream data to understand student self-regulatory behaviors: Opening the black box of learning processes. Int. J. Educ. Technol. High. Educ. 2020, 17, 1–24. [Google Scholar] [CrossRef]
  29. Bannert, M.; Reimann, P.; Sonnenberg, C. Process mining techniques for analysing patterns and strategies in students’ self-regulated learning. Metacognition Learn. 2013, 9, 161–185. [Google Scholar] [CrossRef]
  30. Roll, I.; Winne, P. Understanding, evaluating, and supporting self-regulated learning using learning analytics. J. Learn. Anal. 2015, 2, 7–12. [Google Scholar] [CrossRef] [Green Version]
  31. Zimmerman, B.J. Self-Regulated Learning and Academic Achievement: An Overview. Educ. Psychol. 1990, 25, 3–17. [Google Scholar] [CrossRef]
  32. Zimmerman, B.J. Investigating Self-Regulation and Motivation: Historical Background, Methodological Developments, and Future Prospects. Am. Educ. Res. J. 2008, 45, 166–183. [Google Scholar] [CrossRef]
  33. Lewis, B.A.; MacEntee, V.M.; DeLaCruz, S.; Englander, C.; Jeffrey, T.; Takach, E.; Wilson, S.; Woodall, J. Learning Management Systems Comparison. In Proceedings of the 2005 Informing Science and IT Education Joint Conference, Flagstaff, AZ, USA, 17–19 June 2005. [Google Scholar]
  34. Fournier, H.; Kop, R.; Durand, G. Challenges to research in MOOCs. J. Online Learn. Teach. 2014, 10, 1–15. [Google Scholar]
  35. Boekaerts, M. Self-regulated learning: Where we are today. Int. J. Educ. Res. 1999, 31, 445–457. [Google Scholar] [CrossRef]
  36. Pintrich, P.R. The role of motivation in promoting and sustaining self-regulated learning. Int. J. Educ. Res. 1999, 31, 459–470. [Google Scholar] [CrossRef]
  37. Fischer, C.; Pardos, Z.A.; Baker, R.S.; Williams, J.J.; Smyth, P.; Yu, R.; Slater, S.; Baker, R.; Warschauer, M. Mining Big Data in Education: Affordances and Challenges. Rev. Res. Educ. 2020, 44, 130–160. [Google Scholar] [CrossRef] [Green Version]
  38. Pintrich, P.R. A Conceptual Framework for Assessing Motivation and Self-Regulated Learning in College Students. Educ. Psychol. Rev. 2004, 16, 385–407. [Google Scholar] [CrossRef] [Green Version]
  39. Li, Q.; Baker, R.; Warschauer, M. Using clickstream data to measure, understand, and support self-regulated learning in online courses. Internet High. Educ. 2020, 45, 100727. [Google Scholar] [CrossRef]
  40. Eom, S.B. Effects of LMS, self-efficacy, and self-regulated learning on LMS effectiveness in business education. J. Int. Educ. Bus. 2012, 5, 129–144. [Google Scholar] [CrossRef]
  41. Araka, E.; Maina, E.; Gitonga, R.; Oboko, R.; Kihoro, J. University Students’ Perception on the Usefulness of Learning Management System Features in Promoting Self-Regulated Learning in Online Learning. Int. J. Educ. Dev. Using Inf. Commun. Technol. 2021, 17, 45–64. [Google Scholar]
  42. García-Peñalvo, F.J.; Conde, M.Á.; Zangrando, V.; García-Holgado, A.; Seoane, A.M.; Alier, M.; Galanis, N.; Brouns, F.; Vogten, H.; Griffiths, D.; et al. TRAILER Project (Tagging, Recognition, Acknowledgment of Informal Learning Experiences) A Methodology to Make Learners’ Informal Learning Activities Visible to the Institutions. J. Univers. Comput. Sci. 2013, 19, 1661–1683. [Google Scholar] [CrossRef]
  43. Kim, E.-J.; Kim, J.; Han, S.-H. Understanding Student Acceptance of Online Learning Systems in Higher Education: Application of Social Psychology Theories with Consideration of User Innovativeness. Sustainability 2021, 13, 896. [Google Scholar] [CrossRef]
  44. Tang, Y.M.; Chen, P.C.; Law, K.M.; Wu, C.; Lau, Y.-Y.; Guan, J.; He, D.; Ho, G. Comparative analysis of Student’s live online learning readiness during the coronavirus (COVID-19) pandemic in the higher education sector. Comput. Educ. 2021, 168, 104211. [Google Scholar] [CrossRef] [PubMed]
Figure 1. Research Flow Chart.
Sustainability 14 04075 g001
Figure 2. The Process of Collecting SPADA CSD.
Sustainability 14 04075 g002
Figure 3. Area Coverage of SPADA in Indonesia.
Sustainability 14 04075 g003
Figure 4. Number of Program Activities in SPADA Platform.
Sustainability 14 04075 g004
Figure 5. Sequence-dependent representations of CSD SPADA (example).
Sustainability 14 04075 g005
Figure 6. Aggregate non-temporal representations of CSD SPADA (example).
Sustainability 14 04075 g006
Figure 7. Frequencies of activities by students from all universities.
Sustainability 14 04075 g007
Figure 8. The usage of SPADA DIKTI for (a) Module, (b) Assignment, (c) Discussion.
Sustainability 14 04075 g008
Figure 9. The intensity of SPADA usage between March and November 2021 by the 3T universities (a) and all universities (b).
Sustainability 14 04075 g009
Figure 10. Frequencies in using SPADA platform by universities from the 3T regions shown by number of: (a) students, (b) accessing courses and modules, (c) assignment submission, and (d) discussions.
Sustainability 14 04075 g010
Figure 11. Students’ constraints in accessing SPADA.
Sustainability 14 04075 g011
Figure 12. Correlation analysis between the numbers accessing: (a) modules and discussion, (b) modules and assignment.
Sustainability 14 04075 g012
Figure 13. SRL planning activities: (a) overall universities and (b) 3T universities.
Sustainability 14 04075 g013
Figure 14. SRL monitoring activities: (a) overall universities and (b) 3T universities.
Sustainability 14 04075 g014
Table 1. List of 3T universities in Papua, East Nusa Tenggara, and East Maluku areas.
University NameProvince
STKIP PGRI BangkalanJawa Timur
STKIP Taman Siswa BimaNusa Tenggara Barat
STKIP Yapis DompuNusa Tenggara Barat
Universitas Gunung RinjaniNusa Tenggara Barat
Universitas HamzanwadiNusa Tenggara Barat
Universitas Qamarul Huda Badaruddin BaguNusa Tenggara Barat
Universitas SamawaNusa Tenggara Barat
Universitas Teknologi SumbawaNusa Tenggara Barat
Iisip Yapis BiakPapua
STIKES Maranatha KupangNusa Tenggara Timur
Universitas FloresNusa Tenggara Timur
Universitas Katolik Indonesia Santu Paulus RutengNusa Tenggara Timur
Universitas Kristen Wira Wacana SumbaNusa Tenggara Timur
Universitas Tribuana KalabahiNusa Tenggara Timur
IKIP Gunung SitoliSumatera Utara
STKIP Nias SelatanSumatera Utara
Sekolah Tinggi Ilmu Administrasi BantenBanten
STISIP Banten RayaBanten
STKIP SetiabudhiBanten
Sekolah Tinggi Ilmu Administrasi AmuntaiKalimantan Selatan
Sekolah Tinggi Ilmu Pertanian AmuntaiKalimantan Selatan
STKIP Persada KhatulistiwaKalimantan Barat
Universitas Musamus MeraukePapua
Universitas TimorNusa Tenggara Timur
Universitas TrunojoyoJawa Timur
Table 2. Type and Size of SPADA Clickstream Data.
Data NameType of CSDData Size
Student activitiesnon-temporal57,417 records
Lecturer activitiesnon-temporal8950 records
Course materialsnon-temporal10,168 records
Aggregate activitiestime-dependent216,951 records
Table 3. SRL Phases of SPADA Clickstream Data.
SRL PhaseCSD TypeCSD Outcome
Planning‘MODULE’, ‘COURSE’, ‘CONTENT’,
‘SUB_MODULE’,’SIGN_IN’
‘SIGNED_IN’, ‘JOIN’,
‘ENROLLED’
Monitoring‘MODULE’, ‘COURSE’, ‘CONTENT’,
‘SUB_MODULE’,
s‘ASSIGNMENT’, ‘EXAM’
‘CREATED’, ‘DELETED’, ‘UPDATED’, ‘READ’, ‘SUBMITTED’
Regulating‘EXAM’‘REVIEWED’
Publisher’s Note: MDPI stays neutral with regard to jurisdictional claims in published maps and institutional affiliations.

