Article

Self-Rated Health and Socioeconomic Status in Old Age: The Role of Gender and the Moderating Effect of Time and Welfare Regime in Europe

1
Department of Health Systems Management, The Max Stern Yezreel Valley College, Yezreel Valley 1930600, Israel
2
The Minerva Center on Intersectionality in Aging (MCIA), University of Haifa, Haifa 3498838, Israel
3
Healthy Aging, Tel-Aviv 6433222, Israel
4
Department of Gerontology, Faculty of Social Welfare and Health Sciences, University of Haifa, Haifa 3498838, Israel
*
Author to whom correspondence should be addressed.
Sustainability 2022, 14(7), 4240; https://0-doi-org.brum.beds.ac.uk/10.3390/su14074240
Submission received: 26 February 2022 / Revised: 25 March 2022 / Accepted: 30 March 2022 / Published: 2 April 2022
(This article belongs to the Special Issue Health in All: Global Health and Sustainable Development Goals)

Abstract

:
Research has shown that health status and self-rated health (SRH) are correlated not only with age and gender but also with socioeconomic determinants, such as income, education, and employment status, in the course of life and in late life. Much less investigated, however, are gender differences in the association between socioeconomic factors and SRH and how the connection differs among the European welfare state regimes. This study examines the association between SRH and socioeconomic status in later life and in relation to gender and welfare state regime characteristics. Using SHARE data, it builds an analytical sample of respondents aged 60–70 (1275 men, 1544 women) who participated in Wave 1 and, ten years later, in Wave 6. The analysis regresses SRH by gender on socioeconomic status, controlling for various sociodemographic, health, and socioeconomic variables, as well as welfare regime indicators, at two points in time. Past health variables are also controlled for in order to evaluate their effect on SRH at the time of the investigation. A significant gender gap in SRH is found from childhood to late life. The association of socioeconomic status with poorer SRH is significant over time and within welfare state regimes. Consequently, the relationship between gender and SRH, and the extent to which it varies by socioeconomic position, does appear to differ across welfare state regimes. In all regimes and all points in time, including retrospective childhood SRH, women report poorer health than men. The analysis underscores the association between SRH and socioeconomic status in relation to gender in late life and finds that it correlates differently for men and women. The odds of women experiencing poorer SRH are higher, although they become more moderate over time. Even under the most egalitarian welfare regimes, gender differences in the nexus of SRH and socioeconomic status do not favor women.

1. Introduction

Population ageing is a global phenomenon caused mostly by improved medical care and lower infectious disease mortality [1]. As people live longer, the number of their diseases and physical functional limitations tends to increase, making health a major concern in later life. This is mirrored in self-rated health (SRH), a common measure of health status based on individuals’ reportage of their state of health [2,3]. SRH has usually been found to worsen with age [4,5,6,7], leaving people in need of more resources to provide for themselves with during the lengthy years ahead in good health or to cope with the diverse health and functional challenges that they may face [7,8].
Although women outlive men, they tend to suffer from more chronic illnesses that limit their Activities of Daily Living and often rate their health as poorer than men [2,9]. Research shows that health status and SRH are correlated not only with age and gender but also with socioeconomic determinants such as income, education, and employment status in the course of life and in late life [10,11,12,13]. Much less investigated, however, are gender differences in the association between socioeconomic factors and SRH, and differences in this association by welfare state regime have hardly been studied at all. Women are found to rate their health as poorer than men rate their own [6]. Such is found even though they outlive men [14] and even though the gender gaps in SRH have an even more complicated dimension once viewed within a comparative welfare state context. Hence, the study that follows focuses on gender differences.
This study examines the association between SRH and socioeconomic status in later life and in relation to gender and welfare state regime (hereinafter also: welfare regime). A welfare regime comprises a package of benefits allocated on the basis of more or less restrictive criteria [15]. Welfare regime is an important path to follow because it appears to account for approximately half of national-level variation in health inequalities among European countries [16].
Using a longitudinal database of older Europeans, the study tests this nexus under four different welfare state regimes at an initial point in time and ten years later, controlling for various confounders. It breaks new ground by asking whether the gender aspect of SRH is affected differently by economic determinants of the different welfare state regimes under which older men and women live. A long-term analysis of this kind, taking into account possible changes in SRH during older adults’ lifetime from the comparative perspective of the different welfare regimes under which they live, affords an in-depth, thoroughgoing, and exacting examination of global health and sustainable developments. Based on Sustainable Development Goals (SDGs), such an analysis offers a unique opportunity to promote public health debate by viewing good health and well-being (goal 3) and gender equality (goal 5) through an integrated approach. With its emphasis on an international comparison of long-term changes in selected health indicators among older adults, it makes a meaningful contribution to the existing scientific knowledge and literature.

2. Literature Review

Health is commonly measured in terms of objective parameters such as the number of chronic illnesses or physical limitations [4,17]. However, it can also be judged in subjective ways, such as individuals’ reportage of their state of health—SRH [2,3]. Subjective health perception, unlike objective parameters, combines physical and emotional factors and a sense of well-being and satisfaction of life [18]. Even so, SRH appears to be a reasonably realistic metric that conforms to doctors’ evaluations of patients’ state of health [6]. Even when adjusted for objective health indicators, this common measure of health status has been found to be a strong predictor of morbidity and mortality [3,19,20].
In the data analysis reported here, large disparities in SRH are found among socioeconomic groups differentiated by income or education [21]. On average, across OECD countries, 69% of people surveyed rated their health as “good” or “very good”, and only 62% of those with a lower income did so. The difference relative to people with a higher income, nearly 80% of whom reported “good health,” is significant. In some EU countries, the gap is much wider: up to 20% in Austria and 25% in Germany. Furthermore, in all EU countries that belong to the OECD, people’s SRH tended to decline with age and men were more likely to report being in “good health” than are women.
Self-rated health is affected by personal variables, of which one of the most significant is age. Given that most illnesses are more prevalent among the older population than among others, SRH is expected to worsen in advanced age [4,6]. Namely, as people age their perceptions of health decline and the prevalence of poor to moderate SRH increases [22], although it has been found that, while both health status and SRH deteriorate in old age, people over the age of eighty tend to underestimate the decline [23].
In addition to age, subjective health rating has a gender perspective. The gender gap in regard to aging is not only biological (e.g., life expectancy). Aging is very different for women and men in almost all aspects of life, particularly when the multiple personal, social, economic, and professional aspects that make the life courses of women and men differ significantly are borne in mind [24,25,26,27,28].
It is common to find in research that women rate their own state of health lower than men do, even though women on average live longer [6,14]. For example, [29] found that almost twice as many women as men judged their health as poor and that women reported more symptoms. Nevertheless, although the proportions of persons reporting their health as fair or poor for their age are higher among women in most age groups, it is the conventional wisdom in medical sociology and social epidemiology that men die earlier than women in industrialized societies [2].
Beyond age and gender, older adults’ SRH is affected by other background variables, such as socioeconomic ones [4,13,16,30,31,32]. Men and women of low socioeconomic status are likely to be less healthy than those of high status; what is more, the lower their socioeconomic status is, the more prevalent lower SRH becomes [33]. Moreover, socioeconomic status in old age is found to be correlated with self-rating of health in terms of one or more different socioeconomic variables, including not just income or education but also employment or past occupation [10,22].
SRH is affected not only by personal variables but also by institutional and contextual variables, and gender differences in this metric become more complicated when viewed within a comparative welfare state context. As proposed by [34,35], welfare state regimes differ from each other in several distinct ways. While the historical typology of these regimes has been criticized and the classification of states within it has varied, it still serves as a foundation for comparative research [36,37,38]. For example, [39] found that women in Social Democratic welfare states (in which all citizens are enrolled in a single universal welfare system and are equally eligible) and in those with Southern (Mediterranean) regimes (in which citizens are assisted by the state only when personal resources are exhausted and where traditional values encourage family assistance) are more likely to report worse self-rated health than men. No gender differences in SRH are reported in Corporatist (Continental) states (where assistance is means-tested and modest social insurance plans typically target lower-income individuals) [40]. Moreover, once socioeconomic status is taken into consideration, the negative relationship between unemployment and self-rated health is found to be consistent across Europe; even so, it varies by welfare state regime [41].
Notably, health perception measurements that cross countries and welfare state regimes are difficult to interpret because studies on the topics are designed in different distinctive ways, economic variables (income, education, or occupation) are calculated or evaluated differently, and different parts of the socioeconomic gradient are compared [33]. Hence, it is important to devote further attention to the mechanisms of different welfare state regimes because they appear to account for approximately half of the national-level variation in health inequalities among European countries; in terms of SRH, some mechanisms yield better SRH outcomes than others [16]. Therefore, from the perspective of a country or a welfare state regime, the fact that women outlive men on average but show higher levels of morbidity, disability, and co-morbidities suggests the need to address gender-responsive policies and practices and further investigate the effect of welfare state regimes [42,43].
As noted, a wide range of determinants correlate with SRH. One accepted way of dealing with the broad set of factors that may correlate with the independent variable is the estimation of a multivariate step-by-step regression. In such a procedure, variables are inserted in a stepwise manner, each step adding another row of potential explanatory variables to the estimation framework. This method is recognized in the econometric literature as more efficient and accurate than alternatives because it allows the investigator to identify the marginal contribution of each stage to the total explanation of the model by including additional variables that were not part of the statistical model previously. Thus, the total specific statistical correlation originating in the insertion of each group of explanatory variables into the model is determined with accuracy and potential causality problems are averted (for elaboration, see [44,45]).
The importance of both longitudinal [46] and comparative research is increasingly understood in gerontological science [47]. Investigators realize that aging is both a life-long process and that a local cultural experience is best analyzed through the dynamic process of a longitudinal study [48,49]. Furthermore, gerontologists find the aged to be highly diverse in their psychological and physiological characteristics, material security, and lifestyle, and they presume that this is due to growing differentiation over the course of life [47]. This understanding serves as the basis for the current study, in which Big Data from longitudinal and international surveys facilitate comparative international global research and investigation of gender and healthcare policy perspectives by using and analyzing the same individuals over a specified period of time. Such a study, comparing long-term developments under different welfare regimes, enhances the analysis of global health and sustainable developments that adds depth and yields an accurate map of insights into long-term perceptions and processes among older adults. The outcome is a unique opportunity to promote public health debate through the lens of good health and well-being (goal 3) and gender equality (goal 5)—two of the Sustainable Development Goals (SDGs).

3. Research Objectives

In view of the complicated interrelations of SRH in older ages, personal variables of gender and socioeconomic status, and the institutional variable of the welfare state regime, the current study has four main objectives: to examine (a) gender differences in older persons’ self-rated health; (b) whether socioeconomic status affects SRH differently between men and women; (c) whether these differences change as people age; and (d) whether socioeconomic variables have different impacts on self-rated health under different welfare state regimes and over time.
To our knowledge, the association between health perception and socioeconomic status has not been adequately researched to date in terms of these objectives. With the literature review borne in mind, this study raises four hypotheses: (a) There is a difference in self-rated health between men and women; (b) there is a gender difference in the effect of socioeconomic status on SRH; (c) as people age over a ten-year period, the effect of socioeconomic status on SRH may weaken but will not disappear; and (d) the association between a socioeconomic variable and SRH may present differently in different welfare state regimes.

4. Materials and Methods

4.1. Sample

This study adopted a quantitative base methodology using various statistical analyses atop the SHARE survey data platform [48,50]. The SHARE database, the largest gerontological panel database currently available in Europe, contains information on a large number of respondents, facilitating the investigation of associations of different variables and relevant areas [51,52,53,54].
The target population of SHARE comprises persons aged 50+ and their spouses/partners. The SHARE sampling protocol follows a four-stage process where, in the ideal case, all participating countries would have a probability-based sample from an official register of individuals that covers the population of interest (see: [55]). The analytical sample in this study was limited to respondents aged 60–70 in Wave 1 of SHARE who also participated in Wave 6, held about ten years later (the average time interval between the interviews). The purpose here was to focus on the age group among which SRH is fairly realistic and to avoid the aforementioned tendency among those over eighty years of age to underestimate the deterioration of their health.
Wave 1 of SHARE (2004–2006) served as a baseline for the present inquiry. Wave 6 (2015) provided follow-up data on participants in both waves from ten countries: Austria, Belgium, Denmark, France, Germany, Israel, Italy, Spain, Sweden, and Switzerland. The research population—1275 men and 1544 women—allowed a comparison of the same interviewers in both waves, the gender differences, and the interviewees’ perception of their health as young–old in Wave 1 and, in greater part, as retirees ten years afterward.

4.2. Variables

4.2.1. Dependent Variable

Self-rated health (SRH) was elicited by asking the respondents to rate their overall health on a scale of (1) excellent to (5) poor (“Would you say your health is: (1) excellent… (5) poor?”) (see: [56,57]). This frequently asked question has proved to be a good indicator of general physical health [58]. The study relies on SRH for its analysis of health because SRH is found to be a better predictor of mortality than objective measurements of health status and because it reflects individuals’ integrated perception of their health in its biological, psychosocial, and social dimensions [3,57,59,60].

4.2.2. Independent Variables

The independent variables reflect three groups of control variables: socioeconomic, sociodemographic background, and health. The socioeconomic variables included the respondent’s education and employment status and the household’s ability to make ends meet, and household net income. Education status was divided into groups in order to better compare levels of education, based on the coding of the International Standard Classification of Education—ISCED-97 [61,62]. Employment status comprised (1) employed or self-employed, (2) retired, (3) homemaker, and (4) unemployed (including respondents who reported being ill). The “makes ends meet” variable was arrayed on a scale from (1) easily to (4) with great difficulty. Total household net income was the annual sum of the household members’ monthly net income from all sources, reported in euros and modeled as a continuous variable (log).
The sociodemographic background variables included living with a spouse, which was scored (1) yes if the respondent lived with a spouse and (2) no otherwise; and both the number of children and of grandchildren was included in the analysis as a continuous variable. The most widely used scheme for classifying countries on the basis of welfare provision is that developed by [34,35]. Based on this classification, a variable denoting the welfare state regime was created: (1) Social Democratic—Denmark, Sweden; (2) Continental—Austria, Belgium, Germany, France, Switzerland; (3) Mediterranean—Italy, Spain; and (4) Mixed—Israel [34,35,37,38,39].
The health status variables that were controlled for comprised three other health variables reported by respondents: chronic diseases, ADL, and depression. Chronic diseases were scored as a counting variable (0–13) reflecting the number of physician-diagnosed chronic health conditions that the respondents reported. ADL denotes limitations in basic Activities of Daily Living (dressing, bathing, eating, getting in or out of bed, walking, and toileting). Depression was measured on the Euro-D scale, which is based on self-reportage of twelve depressive symptoms [63].
In addition, past health variables were controlled for to evaluate their effect on SRH at the time of investigation. SRH in childhood was elicited by asking the respondents to describe their health during childhood on a scale that ranged from (1), excellent, to (5), poor. In Wave 6, SRH in Wave 1 was used as a control variable regressed on Wave 6 SRH. The macrovariable “health expenditure”, representing per-capita health expenditure in the respondent’s country, was generated from the OECD data [21]; it was implemented in order to investigate its effect on the correlation between the individual’s socioeconomic variable and the welfare state regime under which he or she lived.

4.3. Data Analysis

The analysis proceeded in stages and was conducted separately for men and women in order to gauge the strength of the association within each gender [22,64]. First, a univariate description of the dependent and independent variables was performed in Wave 1, followed by Anova or Chi2 tests to calculate the gender gap significance of each variable. Self-rated health from childhood to Wave 1 and Wave 6 was analyzed to address the first research question, the one relating to the self-rated health gender gap, along with a broader analysis of all variables.
Second, a multivariate step-by-step ordered logit model regression was carried out to produce predicted odds ratios (ORs) (see: [65]) for men and for women separately. This was performed in order to answer the second research question: whether socioeconomic status had a different impact on the SRH of men than on women, controlling step by step for sociodemographic variables, health variables, and country percentage of expenditure on health. Econometric investigators recognize multivariate step-by-step regression as more efficient and accurate than alternatives because it allows them to identify the marginal contribution of each stage to the total explanation of the model by including additional variables that had not been incorporated into the statistical model before. The outcome is an accurate determination of the total specific statistical correlation that originates in the insertion of each group of explanatory variables into the model; it averts accuracy and potential causality problems (for elaboration, see [44,45]). The first multivariate analysis regressed the self-rated-health dependent variable in baseline Wave 1 with the socioeconomic variables (Model 1) to examine the research question of whether gender differences exist in the association between socioeconomic status and SRH. Background variables were added in subsequent steps, including demographic variables in Step 2 (in order to evaluate the influence on the socioeconomic variables—Model 2); this was followed by a regression in the same manner in Step 3 with the addition of health variables.
Third, a multivariate ordered logit model regression was employed to produce predicted odds ratios (ORs) within each welfare state regime for men and women together in order to test for differences in the association of the variables with SRH. The first analysis examined the association between socioeconomic variables and the dependent variable. The next step controlled for sociodemographic variables, health variables, and the country percentage of expenditure on health. In each step, the gender variable was added in order to examine its influence on SRH.
Finally, the same analysis was made in Wave 6 following the same steps: a univariate description of the dependent and independent variables followed by Anova or Chi2 tests and a multivariate ordered logit model regression as described for Wave 1. An additional variable was added to control for past health (SRH in Wave 1—Model 3). The results for baseline (Wave 1) and follow-up (Wave 6) were then compared in order to answer the fourth research question, concerning the association of socioeconomic variables and SRH as people age. The statistics presented in the multivariate analyses are expressed in odds ratios (ORs) that show the likelihood of respondents who have a given characteristic experiencing a specific outcome.

5. Results

5.1. Descriptive Statistics

The univariate descriptive statistics of the study population are presented in Table 1. The sample had a majority of women (54.78%) and a mean age of 65.2 for men and 65.03 for women. “Excellent” to “good” SRH was 79.3% for men as against 71.57% for women in Wave 1 and 92.08% for men and 89.05% for women in childhood.
In terms of respondents’ economic status, men were better off in all variables. For example, 24.71% of male respondents had academic education as against 17.94% of women. In Wave 1, 19.14% of men were still employed or self-employed and 76.47% defined themselves as retired, as against 11.14% of women who reported being employed or self-employed and 24.22% as homemakers. A higher percentage of men in Wave 1 than of women reported that they could easily make ends meet: 68.31% and 61.79%, respectively.
Turning to health status variables in Wave 1, men were slightly less limited in their Activities of Daily Living, with 94.43% reporting no ADL limitations. Women had on average more chronic diseases (1.73, SD 1.48) than men did (1.39, SD 1.25). Women also reported more depressive symptoms (2.62, SD 2.22) than men (1.58, SD 1.72). All the differences between men and women were tested and found to be significant.
In Wave 6 SRH (Table 1), the most conspicuous change was in socioeconomic status. As expected, “working” as the respondent’s self-defined current job situation fell dramatically, to 2.43% among men and 1.3% among women. The main gender difference was in declaring “retired” or “homemaker” as the employment status. Thus, 19.17% of women still reported “homemaker” and 76.06% reported “retired”; added together, the proportion resembled that of men, 95.53% of whom reported being retired.

5.2. Analyzing Gender Differences in SRH

With regard to the first research question, the findings show that in Wave 1 the mean SRH of men was 2.728 and that 20.7% rated their health as less than good. The mean SRH of women was higher, at 2.927 and 28.43%, respectively, and the gap was found to be significant. The gender gap was again significant in Wave 6, with 37.41% of men and 43.33% of women rating their health as less than good. This gender difference was also valid in the respondents’ retrospective reportage of their SRH in childhood (Figure 1).
These findings clearly support previous findings that stress the gender aspect of SRH in general and in old age specifically [41,59,64] and contradict others that claim that gender differences in SRH disappear in late adulthood [66].

5.3. Analyzing the Association between Socioeconomic Status and SRH

Turning to the second research question, inquiring about the existence of an association between socioeconomic status and SRH, the findings were as follows: The multivariate analysis first regressed the dependent variable, SRH, on the study variables (Table 2). A multivariate step-by-step ordered logit model regression was conducted. The first step of the multivariate analysis (Model 1) examined the association between socioeconomic variables and SRH. The next step (Model 2) controlled for background variables. The third step (Model 3) controlled for objective health variables reported by the respondents, including longitudinal analysis using past SRH (in childhood for both waves and SRH in Wave 1 for Wave 6), and the last step controlled for each respondent’s country health expenditure.
As shown in Table 2, men’s SRH in Wave 1 (Model 1) was significantly associated with all sociodemographic variables except for net household income. Adding sociodemographic variables in Model 2 (including welfare state regime) led to a slight change in the OR of the socioeconomic variable. In Models 3 and 4, only education remained significant. Having a high school education in Wave 1 yielded an OR of 1.363 (Model 1), and having an elementary school education more than doubled the risk of poorer SRH, to OR 2.024. In Model 4, controlling for all study variables, men’s OR was 1.420 for high school education and 1.963 for elementary school.
The strong association found in the multivariate analysis on women was similar although more intense in some variables. Education was as significant among women as among men but the OR of having a high school education was higher for women in all models, the same as “elementary school” in Models 1 and 2, but a bit lower than men in Models 3 and 4. The current job situation in Wave 1 had a significant effect on women in all categories and in all models. Being retired yielded a higher OR for women in all models of Wave 1 (from OR 2.548 in Model 1 to OR 1.765 in Model 4). Being a homemaker tripled the risk of poorer health in Model 1 and doubled the risk in Model 4, and being unemployed ranged in Wave 1 from OR 4.753 in Model 1 to OR 2.364 in Model 4. Making ends meet was higher for women, as great difficulty in making ends meet was noted in all models (from OR 4.035 in Model 1 to OR 1.776 in Model 4).
Overall, then, for both men and women, socioeconomic variables were associated with poorer SRH when respondents were less educated, not employed, or having difficulty in making ends meet. The intensity of the risk was higher among women than among men in comparison with a better-off group in the same categories within the gender. Again, these findings support previous findings in this field [22,64].

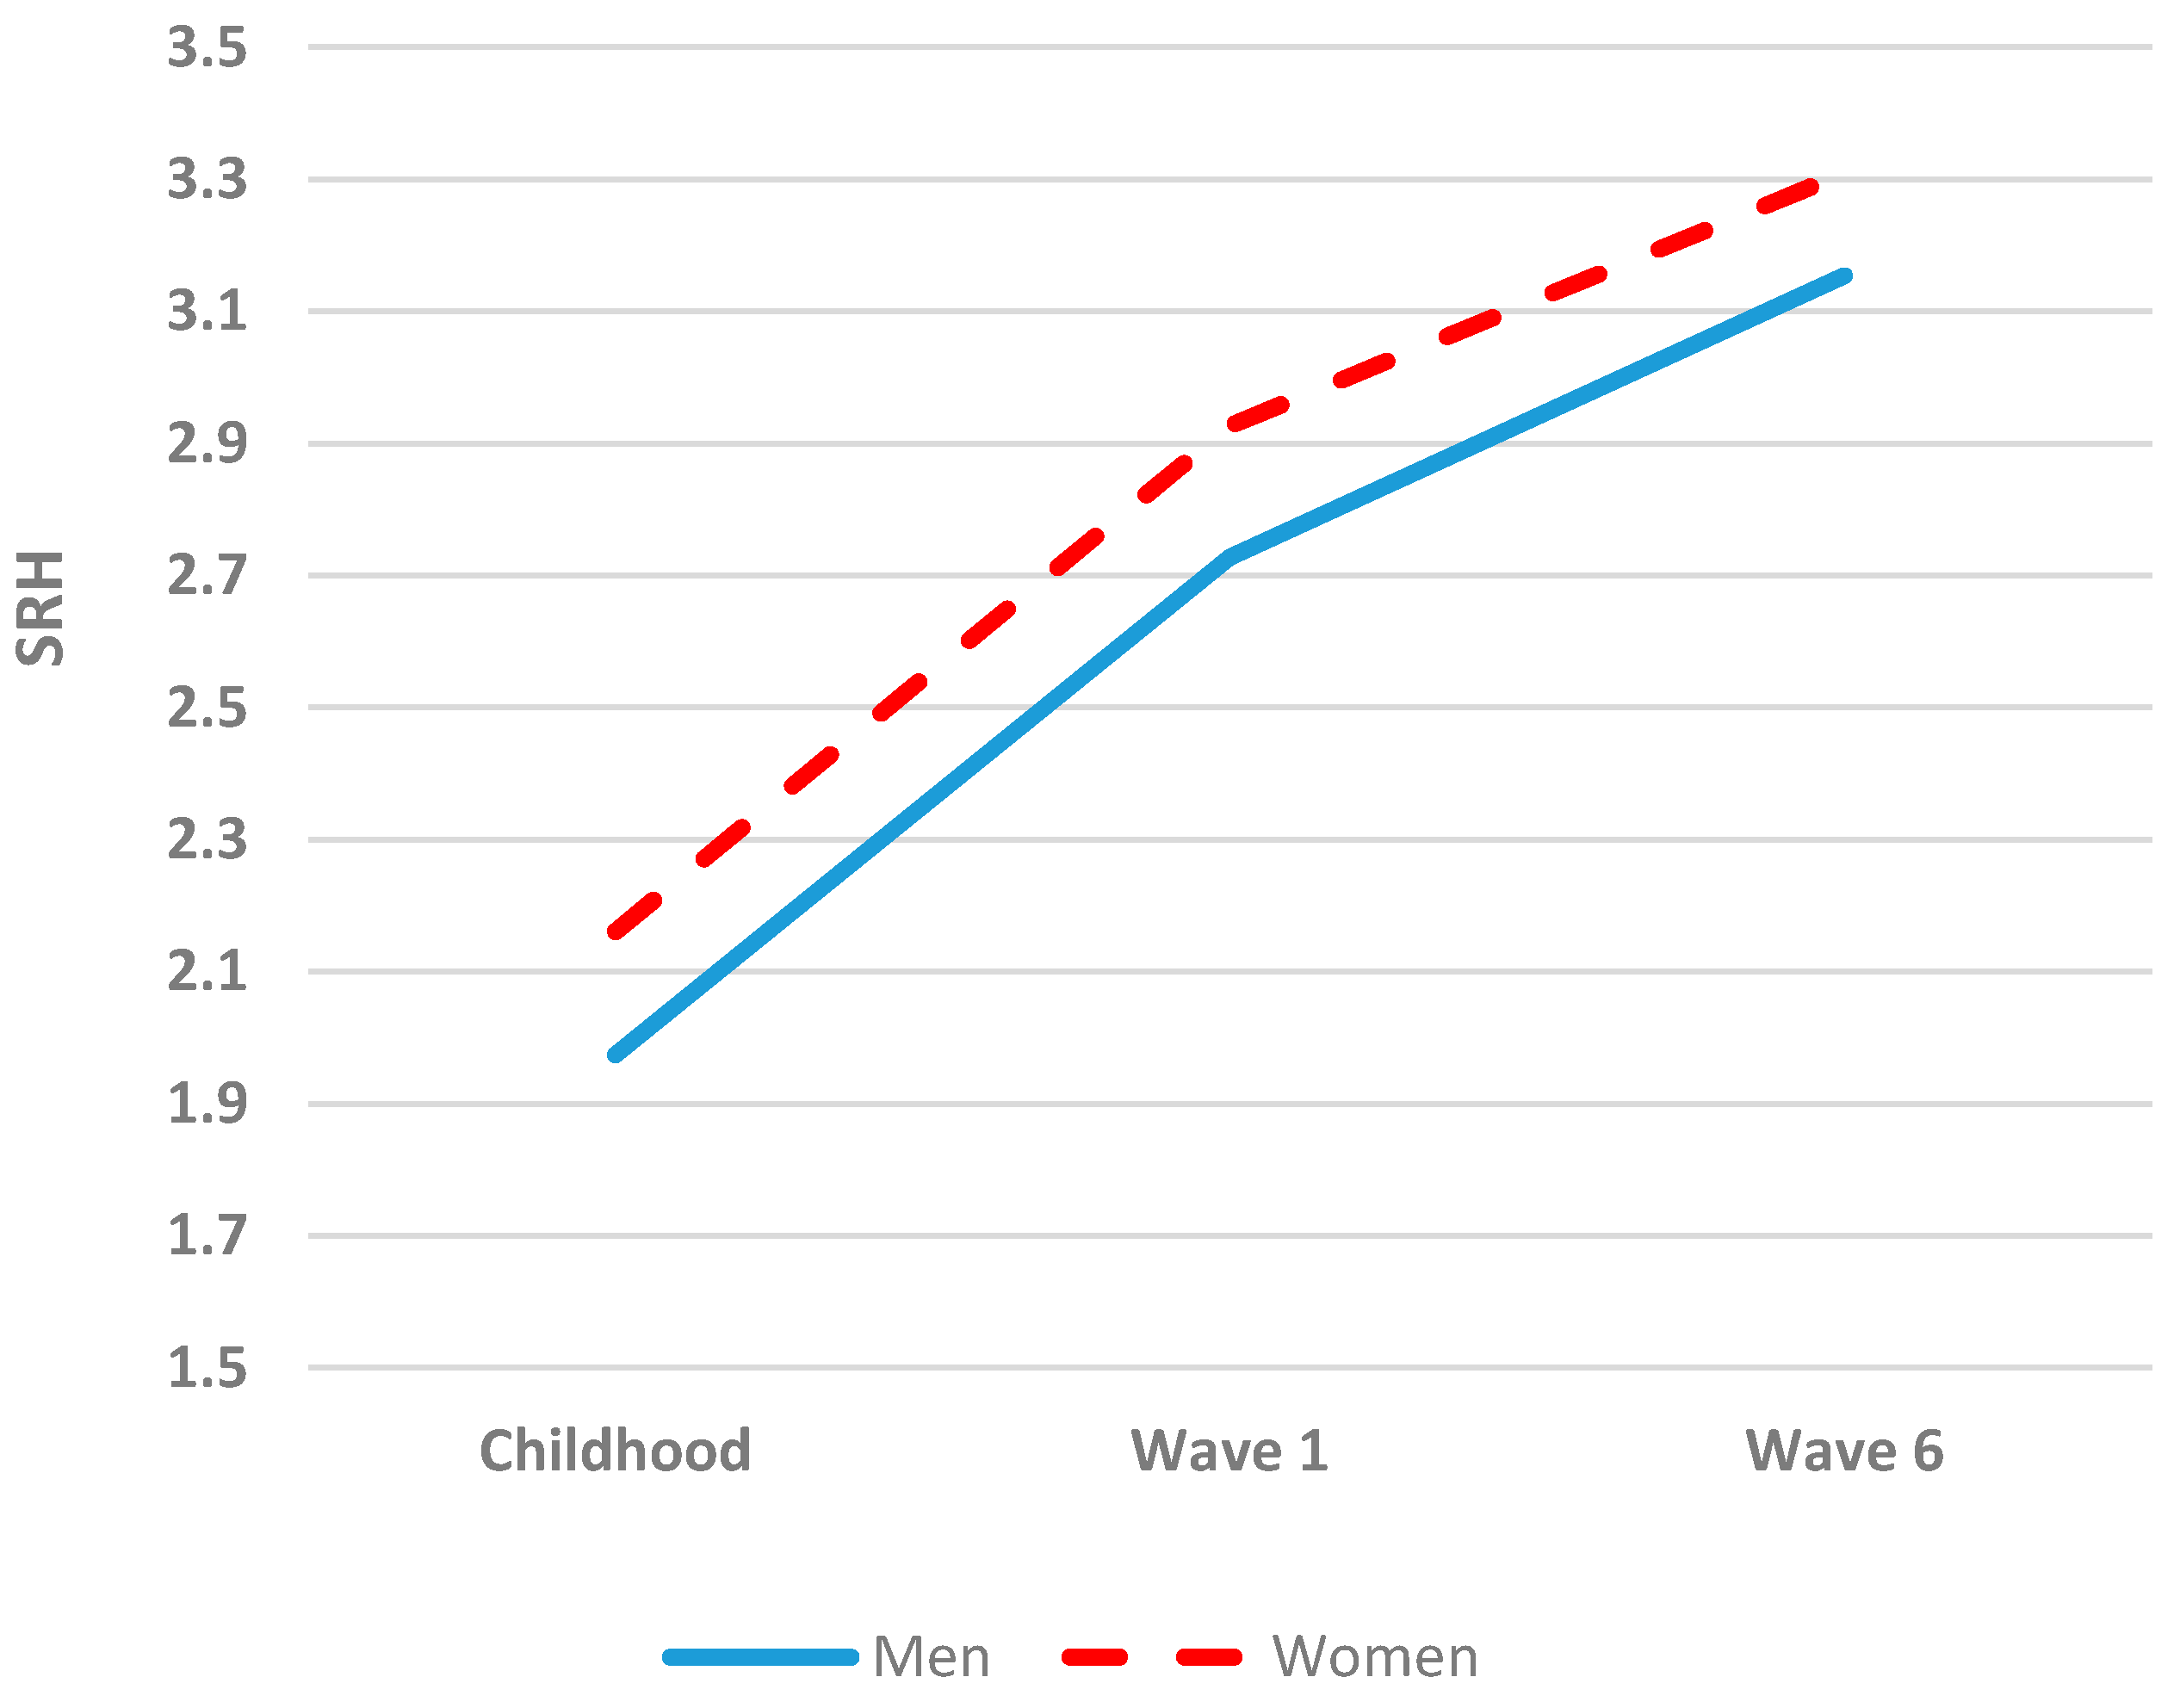
5.4. SRH and Socioeconomic Status over Time

At this stage of the analysis, after the findings about gender differences and the effect of socioeconomic variables were reviewed, a further analysis was made to better understand the effect of time on all these interactions. For this purpose, a multivariate analysis regressed Wave 6 in the same manner in order to examine the last research question: whether the association found in Wave 1 remained valid, weakened, or disappeared ten years later (age 70–80) (Table 3).
The associations among socioeconomic variables (e.g., education and current job situation) remained significant as the respondents aged, and the likelihood of poorer SRH remained higher for women in almost all categories, although it weakened for both genders when health background variables were entered (Models 3 and 4). This finding may support other research, in which it was found that the SRH differentials observed in old age can be explained only partly by current social conditions [64]. What is more, it contradicts another claim: that the gender gap in SRH, if any, disappears in old age [59,66].

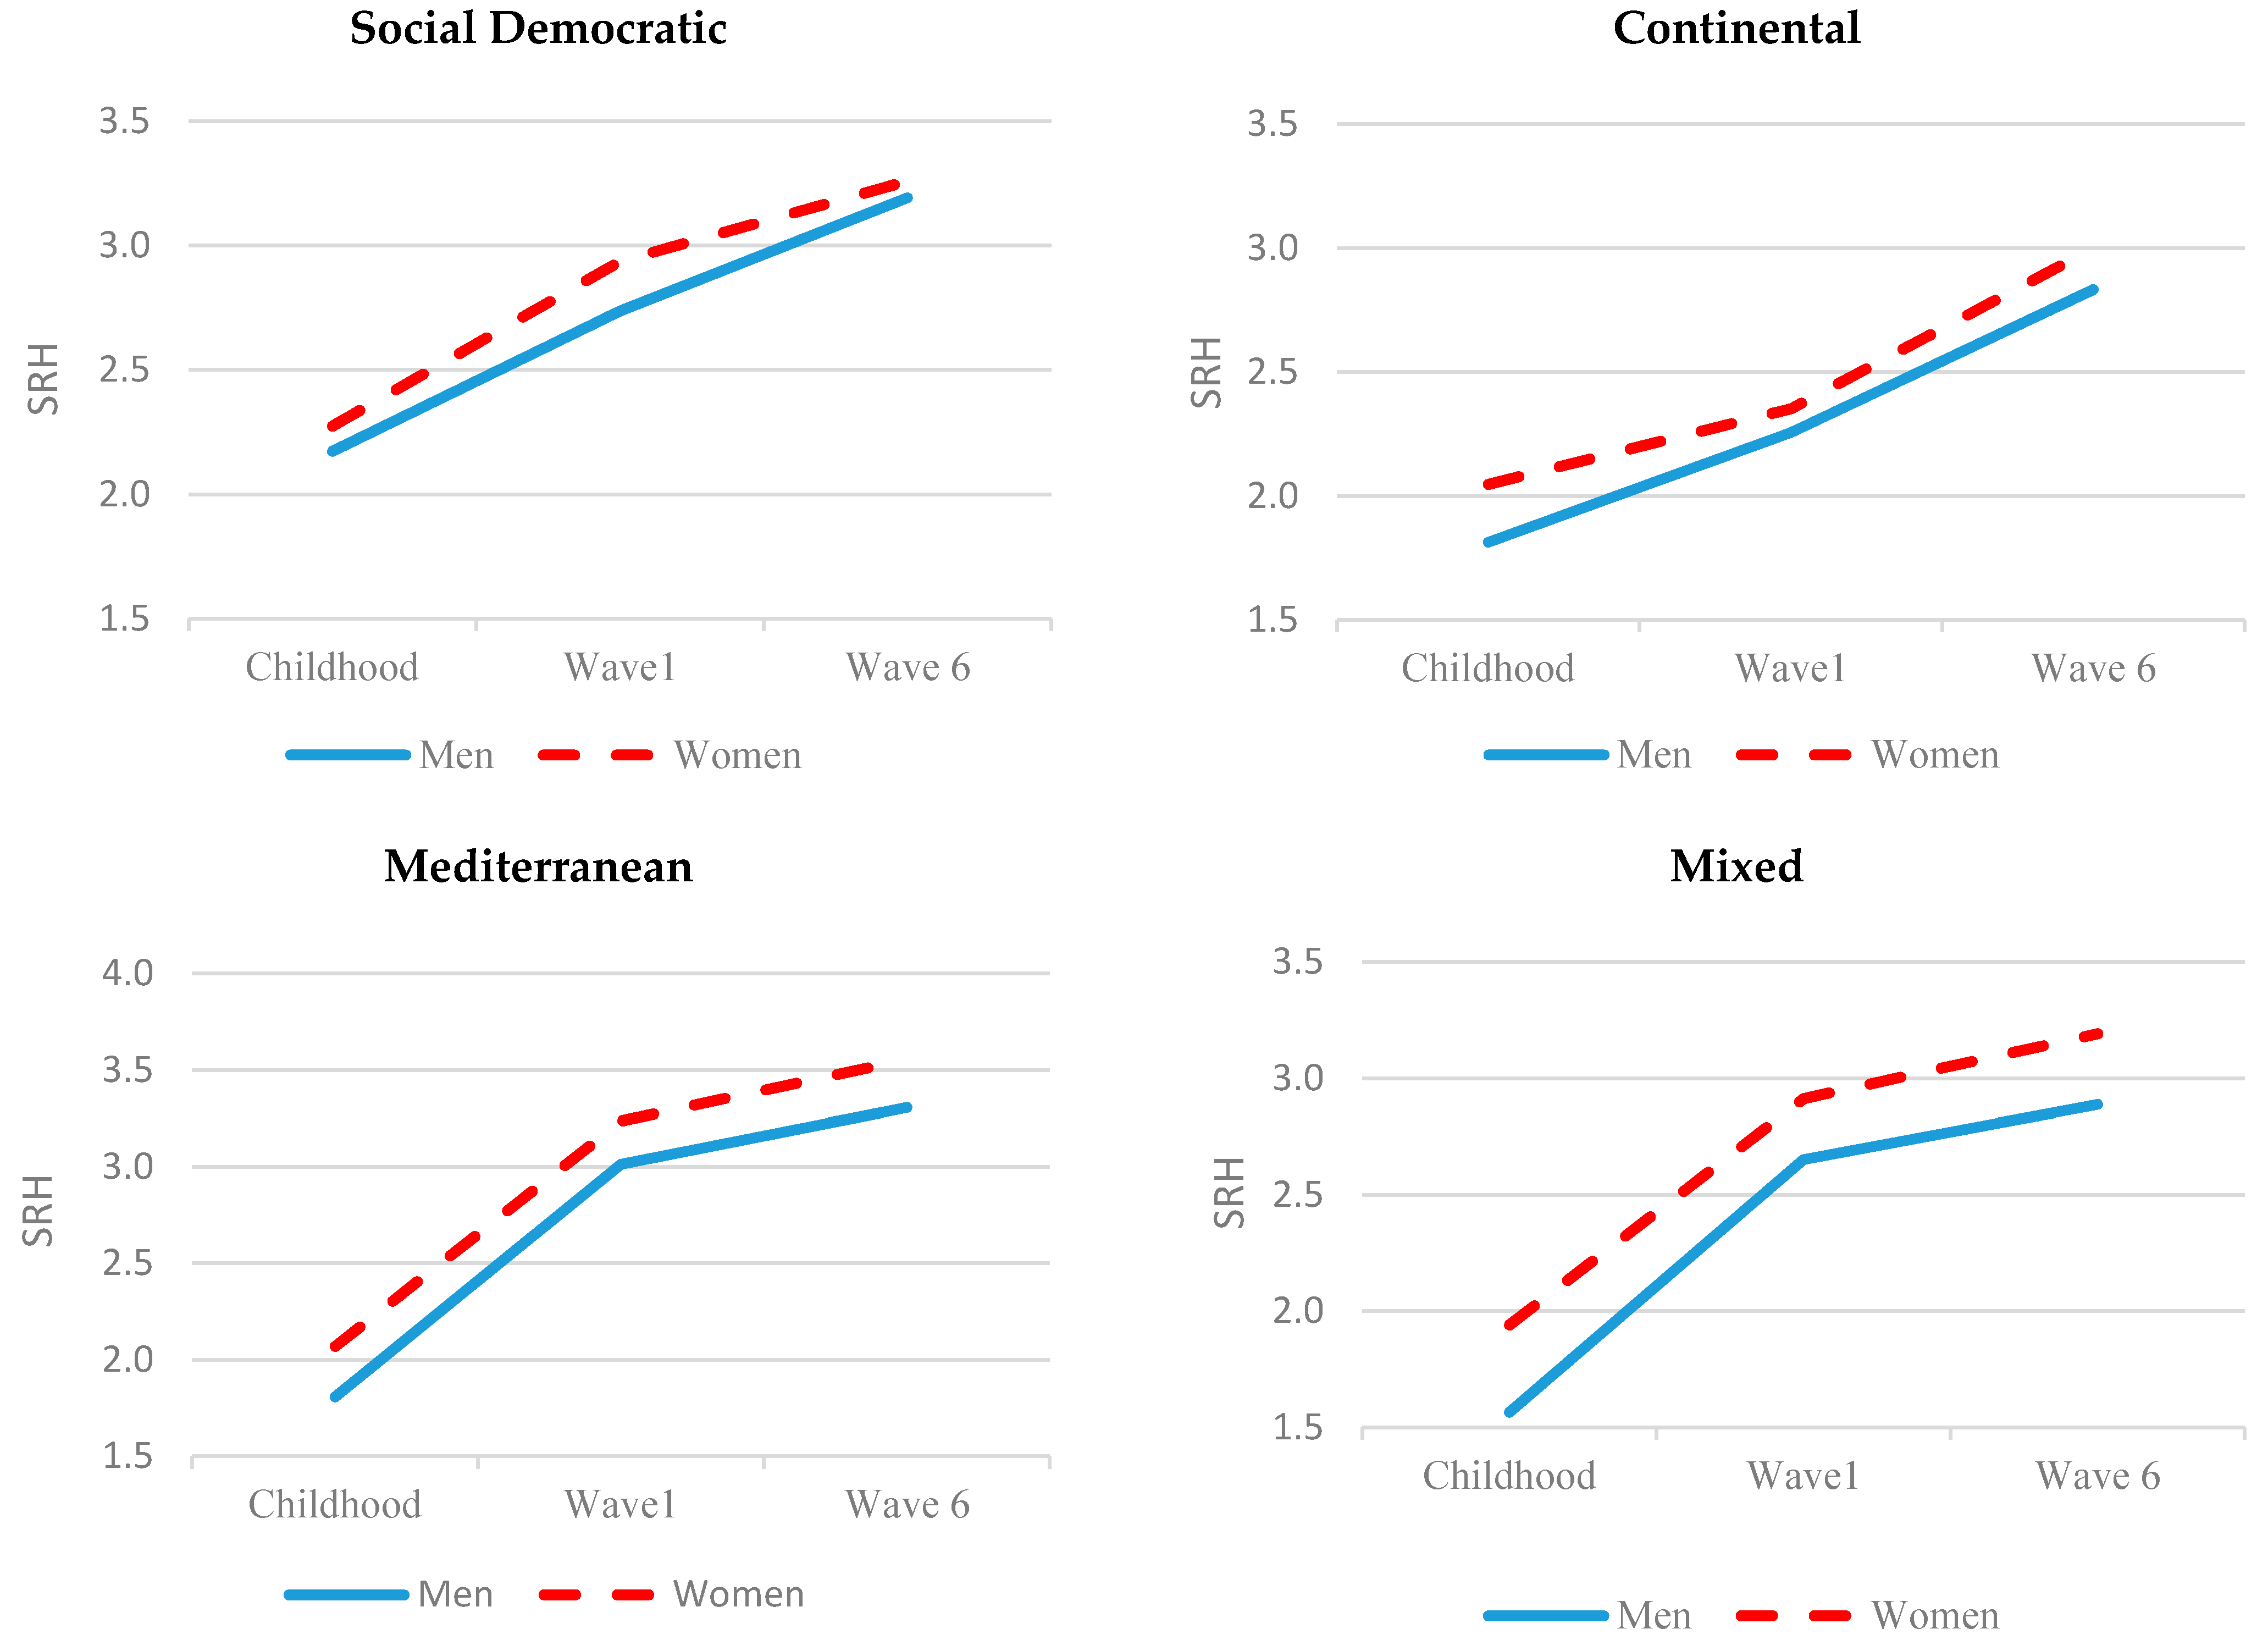
5.5. SRH and Socioeconomic Status within a Welfare State Regime

Finally, the last research question moved beyond examining microlevel personal traits and investigated the broader macro- and sociocontextual sphere of the association between welfare state regime and gender differences in SRH. The findings of this stage show that the SRH of men and women is differently affected by economic factors within welfare state regimes (Figure 2).
In Wave 1, 7.62% of men in Social Democratic regime countries reported less-than-good SRH, as did 19.12% of men in Continental regime states, 31.18% of those living under a Mediterranean regime, and 30.48% of male respondents in the Mixed regime. Less-than-good SRH among women was higher under all regimes: 12.28% under the Social Democratic regime, 23.79% under the Continental regime, 45.27% under the Mediterranean regime, and 34.55% under the Mixed regime. The percentage of those with less-than-good SRH was higher in Wave 6 among both genders and, although the percentage gap narrowed, the SRH ratings remained in women’s disfavor.
To examine the fourth research question, an additional multivariate analysis was performed within each welfare state regime (Table 4). As the results reflect, the association between SRH and socioeconomic variables differs from one welfare state regime to the other and from the results of the entire sample. Specifically, education was significant in Wave 1 under the Social Democratic and the Continental regimes but not under the Mediterranean and the Mixed regimes. Current job situation appeared to be significant in Social Democratic regime countries in Wave 1 and 6 (retired and unemployed) but not under other regimes. Having great difficulty in making ends meet was significant for both the Continental regime and the Mixed regime, especially as people grew older in Wave 6. Gender was significant only under the Mediterranean regime in Model 1 (OR 1.724 in Wave 1 and OR 1.763 in Wave 6).
In sum, the analyses show that although differences in SRH between men and women are demonstrated, they weaken when the gender effect is analyzed together with other background variables. The regimes do differ in the association between some socioeconomic variables, as shown. These findings support those of [43], who found no consistent pattern of socioeconomic position in relation to the gender gap in men’s and women’s SRH. In other words, as this study suggests, the gap between men and women in SRH can be partly explained by the welfare state regime under which they live.

6. Discussion

The aim of this study was to investigate whether a gender difference exists in self-rated health in late life, considering the association between SRH and socioeconomic status and in different welfare state regimes. A long-term analysis of this kind, comparing the state of affairs under different welfare regimes, is useful in investigating global health and sustainable developments in a way that adds depth and yields an accurate map of insights into long-term perceptions and processes among older adults. Based on the Sustainable Development Goals (SDGs), it offers a unique opportunity to promote public health debate by taking an integrated approach to the study of good health and well-being (goal 3) and gender equality (goal 5).
The study was based on data from two waves of the SHARE project. As described presently, the analyses underscored previous findings in the literature that demonstrate a connection between socioeconomic status and health and people’s rating of their own health [4,16,33]. However, examination of the interaction between gender perspective in later life and specific aspects of socioeconomic status in four welfare state regimes revealed a unique and, perhaps, a more elucidative association with health in view of health perception.
The results suggest that the relationship between gender and SRH, and the extent to which it varies by position on the socioeconomic ladder, do in fact differ across European welfare state regimes [67,68]. In all regimes and at all points in time, including retrospective reportage of childhood SRH, women reported poorer health than men. Some of the results (e.g., those pertaining to Social Democratic and Mediterranean regimes) may be addressed by drawing on welfare state regime theory. Findings relating to other regimes (e.g., Continental and Mixed) are more challenging to the classic classification that this theory establishes.
The results of the analysis of the SRH gap among the different regimes emphatically confirm the typology of welfare states. The gap is relatively moderate under the Social Democratic and the Continental regimes, whereas women under Mediterranean and Mixed regimes are more likely than men to report poorer SRH. These gap differences in SRH may be explained by the different welfare policies and the way they address unique feminine roles. For example, women who live under a Social Democratic regime experience progressive public policies that help them cope with their dual tasks as caregivers and providers [69]. Conversely, under the Mediterranean regime the fairly restrictive traditional gender roles for women and their economic dependency are less mediated by welfare policies, and their poorer SRH may reflect the lack of state support for women and their low economic status and political participation.
Furthermore, by delving into the findings about the association between socioeconomic status and self-rated health, it is found perceptibly that men and women are affected similarly within each welfare state regime, although the intensity of the effect is to women’s disadvantage in most socioeconomic determinants. Under the Social Democratic and Continental regimes, education and current job situation are more significant for both genders. As these welfare states are widely considered the most progressive in terms of gender equality—in terms of encouraging women to participate in the labor force and attain higher education—scanty education and unemployment affect their SRH in the same way that they affect men [4,10,12,13]. Under the Mediterranean welfare state regime, people’s perception of their economic status influences their SRH, reflecting the lower generosity of state policy in allocating social benefits, especially in late life, and weaker emphasis on gender equality.
This study is unique not only in the way it explores the differences in gender SRH under various welfare state regimes but also in its longitudinal point of view. As life expectancy rises and people spend more and more years in retirement, research needs to address the way SRH is affected by socioeconomic status and its change over time. Although it was claimed in previous research that people tend to underestimate the decline in their health as they age [23], this study offers another view on the different influence of socioeconomic status with age and within a given welfare state regime in Wave 6. Thus, with the lapse of ten years, the way people perceived their financial security contributed to their SRH, except among those who lived under the Social Democratic regime. These findings may be easily supported by the welfare state regime policy, on the assumption that the better the welfare state and its laws enhance financial security via adequate retirement and pension plans, the weaker the impact of personal financial security on SRH [18]. It is noteworthy that under the Mediterranean welfare state regime, which assures less financial security in old age and has yet to establish gender equality, self-rated financial security is the most influential determinant of SRH, especially among women.

7. Conclusions

The study suggests that the nature of gender differences in SRH can be explained to some extent by the welfare state typology. Therefore, achieving gender equality in health perception in later life will require an additional policy response in various domains of health and economics, taking into account the tension between traditional and modern roles that are differently experienced by men and women in the course of their lives. Even under the most progressive regimes (e.g., Social Democratic), the interventions of income redistribution and extensive public service provision alone cannot yet overcome the mechanisms at play in terms of gender and health. Such is the case a fortiori under other regimes, in which women need to overcome more acute gender discrimination and a wider gender pay gap at work without the mediation of a welfare policy that would support change in their traditional role in society.
Although the results of this study are somewhat in line with the welfare state typology, the typology does not yield a full understanding of the gender gap in SRH. Although the current welfare state regime theory clearly offers some explanatory insights, it may not be totally useful in examining gender and health unless it refers to gender inequalities in public health policy and other policy domains. Moreover, the change in gender roles during the past decades and the demands on women to provide for their families while remaining responsible for caregiving, all without sufficient welfare policy support, may contribute to a future decline in SRH. Further research in this area of inquiry is, thus, clearly warranted.
Women face specific challenges that are hardly reflected in practical policies [70]. Therefore, gender-responsive policies, programs, and practices that address the rights, strengths, and needs of women in stages of aging and throughout the life course need to be rephrased [71,72]. Policymakers under the various welfare regimes should consider gender, age, and equity in their future planning in order to mitigate health inequality across societies.

Author Contributions

A.T.-S. was in charge of the conceptualization of the study and supervising its data analyses and contributed to writing and editing the manuscript; A.P. was in charge of the data analysis and contributed to writing and editing the manuscript of the study; I.D. was in charge of the conceptualization of the study and contributed to writing and editing the manuscript. All authors have read and agreed to the published version of the manuscript.

Funding

This research did not receive any specific grant from funding agencies in the public, commercial, or not-for-profit sectors.

Institutional Review Board Statement

Not applicable.

Informed Consent Statement

Not applicable.

Data Availability Statement

Data was obtained from SHARE and are available at http://www.share-project.org/home0.html (accessed on 2 April 2022) with the permission of SHARE.

Acknowledgments

This paper uses data from SHARE Waves 1 and 6 DOIs: 10.6103/SHARE.w1.800, 10.6103/SHARE.w6.800), see Börsch-Supan et al. (2013) for methodological details. The SHARE data collection has been funded by the European Commission, DG RTD through FP5 (QLK6-CT-2001-00360), FP6 (SHARE-I3: RII-CT-2006-062193, COMPARE: CIT5-CT-2005-028857, SHARE-LIFE: CIT4-CT-2006-028812), FP7 (SHARE-PREP: GA N°211909, SHARE-LEAP: GA N°227822, SHARE M4: GA N°261982, DASISH: GA N°283646) and Horizon 2020 (SHARE-DEV3: GA N°676536, SHARE-COHESION: GA N°870628, SERISS: GA N°654221, SSHOC: GA N°823782, SHARE-COVID19: GA N°101015924) and by DG Employment, Social Affairs & Inclusion through VS 2015/0195, VS 2016/0135, VS 2018/0285, VS 2019/0332, and VS 2020/0313. Addi-tional funding from the German Ministry of Education and Research, the Max Planck Society for the Advancement of Science, the U.S. National Institute on Aging (U01_AG09740-13S2, P01_AG005842, P01_AG08291, P30_AG12815, R21_AG025169, Y1-AG-4553-01, IAG_BSR06-11, OGHA_04-064, HHSN271201300071C, RAG052527A), and from various national funding sources is gratefully acknowledged (see www.share-project.org, accessed on 24 March 2022).

Conflicts of Interest

The authors declare no conflict of interest.

References

  1. Mathers, C.D.; Stevens, G.A.; Boerma, T.; White, R.A.; Tobias, M.I. Causes of international increases in older age life expectancy. Lancet 2015, 385, 540–548. [Google Scholar] [CrossRef]
  2. Macintyre, S.; Hunt, K.; Sweeting, H. Gender differences in health: Are things really as simple as they seem? Soc. Sci. Med. 1996, 42, 617–624. [Google Scholar] [CrossRef]
  3. Idler, E.L.; Benyamini, Y. Self-Rated Health and Mortality: A Review of Twenty-Seven Community Studies. J. Health Soc. Behav. 1997, 38, 21–37. [Google Scholar] [CrossRef] [Green Version]
  4. Franks, P.; Gold, M.R.; Fiscella, K. Sociodemographics, self-rated health, and mortality in the US. Soc. Sci. Med. 2003, 56, 2505–2514. [Google Scholar] [CrossRef]
  5. Stenholm, S.; Westerlund, H.; Head, J.; Hyde, M.; Kawachi, I.; Pentti, J.; Kivimäki, M.; Vahtera, J. Comorbidity and Functional Trajectories From Midlife to Old Age: The Health and Retirement Study. J. Gerontol. Ser. A 2014, 70, 332–338. [Google Scholar] [CrossRef] [Green Version]
  6. Szwarcwald, C.L.; Souza-Júnior, P.R.B.D.; Esteves, M.A.P.; Damacena, G.N.; Viacava, F. Socio-demographic determinants of self-rated health in Brazil. Cad. De Saúde Pública 2005, 21, S54–S64. [Google Scholar] [CrossRef] [Green Version]
  7. World Health Organization. Health and Ageing: A Discussion Paper. Available online: http://apps.who.int/iris/bitstream/10665/66682/1/WHO_NMH_HPS_01.1.pdf (accessed on 24 March 2022).
  8. Stoller, M.A.; Stoller, E.P. Perceived income adequacy among elderly retirees. J. Appl. Gerontol. 2003, 22, 230–251. [Google Scholar] [CrossRef]
  9. Arber, S.; Cooper, H. Gender differences in health in later life: The new paradox? Soc. Sci. Med. 1999, 48, 61–76. [Google Scholar] [CrossRef]
  10. Kunst, A.E.; Geurts, J.J.; Berg, J.V.D. International variation in socioeconomic inequalities in self reported health. J. Epidemiol. Community Health 1995, 49, 117–123. [Google Scholar] [CrossRef] [Green Version]
  11. van Kippersluis, H.; O’Donnell, O.; van Doorslaer, E.; Van Ourti, T. Socioeconomic differences in health over the life cycle in an Egalitarian country. Soc. Sci. Med. 2010, 70, 428–438. [Google Scholar] [CrossRef] [Green Version]
  12. Leão, T.; Campos-Matos, I.; Bambra, C.; Russo, G.; Perelman, J. Welfare states, the Great Recession and health: Trends in educational inequalities in self-reported health in 26 European countries. PLoS ONE 2018, 13, e0193165. [Google Scholar] [CrossRef] [Green Version]
  13. Stronks, K.; Van De Mheen, H.; Bos, J.V.D.; MacKenbach, J.P. Smaller Socioeconomic Inequalities in Health among Women: The Role of Employment Status. Int. J. Epidemiol. 1995, 24, 559–568. [Google Scholar] [CrossRef]
  14. Newman, A.B.; Brach, J.S. Gender Gap in Longevity and Disability in Older Persons. Epidemiol. Rev. 2001, 23, 343–355. [Google Scholar] [CrossRef] [Green Version]
  15. Dykstra, P.A. Cross-national Differences in Intergenerational Family Relations: The Influence of Public Policy Arrangements. Innov. Aging 2018, 2, igx032. [Google Scholar] [CrossRef] [Green Version]
  16. Eikemo, T.A.; Bambra, C.; Judge, K.; Ringdal, K. Welfare state regimes and differences in self-perceived health in Europe: A multilevel analysis. Soc. Sci. Med. 2008, 66, 2281–2295. [Google Scholar] [CrossRef] [Green Version]
  17. Lynn, J.; Adamson, D. Living Well at the End of Life: Adapting Health Care to Serious Chronic Illness in Old Age; Rand Corporation: Santa Monica, CA, USA, 2003. [Google Scholar]
  18. Linn, B.S.; Linn, M.W. Objective and self-assessed health in the old and very old. Soc. Sci. Med. Part A Med. Psychol. Med. Sociol. 1980, 14, 311–315. [Google Scholar]
  19. DeSalvo, K.B.; Bloser, N.; Reynolds, K.; He, J.; Muntner, P. Mortality prediction with a single general self-rated health question. A meta-analysis. J. Gen. Intern. Med. 2006, 21, 267–275. [Google Scholar] [CrossRef] [Green Version]
  20. Kawada, T. Self-rated health and life prognosis. Arch. Med Res. 2003, 34, 343–347. [Google Scholar] [CrossRef]
  21. OECD. Health at a Glance 2015: OECD Indicators; OECD Publishing: Paris, France, 2015. [Google Scholar]
  22. McFadden, E.; Luben, R.; Bingham, S.; Wareham, N.; Kinmonth, A.-L.; Khaw, K.-T. Social inequalities in self-rated health by age: Cross-sectional study of 22 457 middle-aged men and women. BMC Public Health 2008, 8, 230. [Google Scholar] [CrossRef] [Green Version]
  23. Henchoz, K.; Cavalli, S.; Girardin, M. Health perception and health status in advanced old age: A paradox of association. J. Aging Stud. 2008, 22, 282–290. [Google Scholar] [CrossRef]
  24. Calasanti, T. Feminist Gerontology and Old Men. J. Gerontol. 2004, 59, S305–S314. [Google Scholar] [CrossRef] [Green Version]
  25. Freixas, A.; Luque, B.; Reina, A. Critical Feminist Gerontology: In the Back Room of Research. J. Women Aging 2012, 24, 44–58. [Google Scholar] [CrossRef]
  26. Hooyman, N.; Browne, C.V.; Ray, R.; Richardson, V. Feminist Gerontology and the Life Course. Gerontol. Geriatr. Educ. 2002, 22, 3–26. [Google Scholar] [CrossRef]
  27. Liu, Y.; Arai, A.; Kanda, K.; Lee, R.B.; Glasser, J.; Tamashiro, H. Gender gaps in life expectancy: Generalized trends and negative associations with development indices in OECD countries. Eur. J. Public Health 2013, 23, 563–568. [Google Scholar] [CrossRef] [Green Version]
  28. McMullin, J.A.; Cairney, J. Self-esteem and the intersection of age, class, and gender. J. Aging Stud. 2004, 18, 75–90. [Google Scholar] [CrossRef]
  29. Anson, O.; Paran, E.; Neumann, L.; Chernichovsky, D. Gender differences in health perceptions and their predictors. Soc. Sci. Med. 1993, 36, 419–427. [Google Scholar] [CrossRef]
  30. Adler, N.E.; Boyce, T.; Chesney, M.A.; Cohen, S.; Folkman, S.; Kahn, R.L.; Syme, S.L. Socioeconomic status and health: The challenge of the gradient. Am. Psychol. 1994, 49, 15. [Google Scholar] [CrossRef]
  31. Deaton, A.S.; Paxson, C.H. Aging and inequality in income and health. Am. Econ. Rev. 1998, 88, 248–253. [Google Scholar]
  32. Smith, J.P.; Kington, R. Demographic and economic correlates of health in old age. Demography 1997, 34, 159–170. [Google Scholar] [CrossRef]
  33. Huisman, M.; Read, S.; Towriss, C.A.; Deeg, D.J.H.; Grundy, E. Socioeconomic Inequalities in Mortality Rates in Old Age in the World Health Organization Europe Region. Epidemiol. Rev. 2013, 35, 84–97. [Google Scholar] [CrossRef] [Green Version]
  34. Esping-Andersen, G. The Three Political Economies of the Welfare State. Int. J. Sociol. 1990, 20, 92–123. [Google Scholar] [CrossRef] [Green Version]
  35. Esping-Andersen, G. Social Foundations of Postindustrial Economies; Oxford University Press: Oxford, UK, 1999. [Google Scholar]
  36. Katz, R.; Lowenstein, A.; Halperin, D.; Tur-Sinai, A. Generational Solidarity in Europe and Israel. Can. J. Aging/La Rev. Can. Du Vieil. 2015, 34, 342–355. [Google Scholar] [CrossRef] [PubMed]
  37. Srakar, A.; Hrast, M.F.; Hlebec, V.; Majcen, B. Social exclusion, welfare-state regime and unmet long-term care need: Evidence from SHARE. Ageing Eur. Supporting Policies Incl. Soc. 2015, 17, 189. [Google Scholar]
  38. Wallace, L.M.K.; Theou, O.; Pena, F.; Rockwood, K.; Andrew, M.K. Social vulnerability as a predictor of mortality and disability: Cross-country differences in the survey of health, aging, and retirement in Europe (SHARE). Aging Clin. Exp. Res. 2015, 27, 365–372. [Google Scholar] [CrossRef] [PubMed]
  39. Bambra, C.; Pope, D.; Swami, V.; Stanistreet, D.; Roskam, A.; Kunst, A.; Scott-Samuel, A. Gender, health inequalities and welfare state regimes: A cross-national study of 13 European countries. J. Epidemiol. Community Health 2009, 63, 38–44. [Google Scholar] [CrossRef] [Green Version]
  40. Silverstein, M.; Tur-Sinai, A.; Lewin-Epstein, N. Intergenerational Support of Older Adults by the ‘Mature’ Sandwich Generation: The Relevance of National Policy Regimes. Theor. Inq. Law 2020, 21, 55–76. [Google Scholar] [CrossRef] [Green Version]
  41. Bambra, C.; Eikemo, T.A. Welfare state regimes, unemployment and health: A comparative study of the relationship between unemployment and self-reported health in 23 European countries. J. Epidemiol. Community Health 2008, 63, 92–98. [Google Scholar] [CrossRef] [Green Version]
  42. Majeed, T.; Forder, P.; Mishra, G.; Byles, J. Women, Work, and Illness: A Longitudinal Analysis of Workforce Participation Patterns for Women Beyond Middle Age. J. Womens Health 2015, 24, 455–465. [Google Scholar] [CrossRef]
  43. World Health Organization. Women, Ageing and Health: A Framework for Action: Focus on Gender. Available online: https://apps.who.int/iris/bitstream/handle/10665/43810/9789241563529_eng.pdf?sequence=1&isAllowed=y (accessed on 24 March 2022).
  44. Liu, C.; Zhang, M.; Zheng, M.; Chen, Y. Step-by-Step Regression: A More Efficient Alternative for Polynomial Multiple Linear Regression in Stream Cube. In Proceedings of the Pacific-Asia Conference on Knowledge Discovery and Data Mining, Seoul, Korea, 30 April–2 May 2003; Springer: Berlin/Heidelberg, Germany, 2003; pp. 437–448. [Google Scholar]
  45. Andreev, A.O.; Demina, N.; Nefedyev, Y.; Demin, S.A.; Zagidullin, A.A. Modeling of the physical selenocentric surface using modern satellite observations and harmonic analysis methods. J. Phys. Conf. Ser. 2018, 1038, 012003. [Google Scholar] [CrossRef]
  46. Schaie, K.W. What Can We Learn From Longitudinal Studies of Adult Development? Res. Hum. Dev. 2005, 2, 133–158. [Google Scholar] [CrossRef] [Green Version]
  47. Nelson, E.A.; Dannefer, D. Aged Heterogeneity: Fact or Fiction? The Fate of Diversity in Gerontological Research. Gerontologist 1992, 32, 17–23. [Google Scholar] [CrossRef] [PubMed]
  48. Börsch-Supan, A.; Brandt, M.; Hunkler, C.; Kneip, T.; Korbmacher, J.; Malter, F.; Schaan, B.; Stuck, S.; Zuber, S. Data Resource Profile: The Survey of Health, Ageing and Retirement in Europe (SHARE). Int. J. Epidemiol. 2013, 42, 992–1001. [Google Scholar] [CrossRef] [PubMed]
  49. Juster, F.T.; Suzman, R. An Overview of the Health and Retirement Study. J. Hum. Resour. 1995, 30, S7. [Google Scholar] [CrossRef]
  50. Börsch-Supan, A. Survey of Health, Ageing and Retirement in Europe (SHARE) Wave 6. (Version: 6.0.0); SHARE-ERIC: Munich, Germany, 2017. [Google Scholar]
  51. Carmel, S.; Tur-Sinai, A. Cognitive decline among European retirees: Impact of early retirement, nation-related and personal characteristics. Ageing Soc. 2021, 1–27. [Google Scholar] [CrossRef]
  52. Tur-Sinai, A.; Casanova, G.; Lamura, G. Changes in the Provision of Family Care to Frail Older People in Familistic Welfare States: Lessons From Israel and Italy. J. Aging Health 2020, 32, 972–986. [Google Scholar] [CrossRef]
  53. Tur-Sinai, A.; Spivak, A. How Generous are Societies Toward Their Elderly? A European Comparative Study of Replacement Rates, Well-Being and Economic Adequacy. Soc. Indic. Res. 2021, 1–35. [Google Scholar] [CrossRef]
  54. Tur-Sinai, A.; Teti, A.; Rommel, A.; Hlebec, V.; Yghemonos, S.; Lamura, G. Cross-national data on informal caregivers of older people with long-term care needs in the European population: Time for a more coordinated and comparable approach. J. Biosoc. Sci. 2022, 5, 1–5. [Google Scholar] [CrossRef]
  55. Bergman, M.; De Luca, G.; Scherpenzeel, A. Sampling Design and Weighting Strategies. In SHARE Wave 6: Panel Innovations and Collecting Dried Blood Spots; Malter, F., Börsch-Supan, A., Eds.; Munich Center for the Economics of Aging (MEA): Munich, Germany, 2017. [Google Scholar]
  56. Murata, C.; Kondo, T.; Tamakoshi, K.; Yatsuya, H.; Toyoshima, H. Determinants of self-rated health: Could health status explain the association between self-rated health and mortality? Arch. Gerontol. Geriatr. 2006, 43, 369–380. [Google Scholar] [CrossRef]
  57. Tur-Sinai, A.; Soskolne, V. Socioeconomic status and health behaviors as predictors of changes in self-rated health among older persons in Israel. Health Soc. Care Community 2021, 29, 1461–1472. [Google Scholar] [CrossRef]
  58. Dwyer, D.S.; Mitchell, O.S. Health problems as determinants of retirement: Are self-rated measures endogenous? J. Health Econ. 1999, 18, 173–193. [Google Scholar] [CrossRef] [Green Version]
  59. Jylhä, M.; Guralnik, J.M.; Ferrucci, L.; Jokela, J.; Heikkinen, E. Is Self-Rated Health Comparable across Cultures and Genders? J. Gerontol. Ser. B Psychol. Sci. Soc. Sci. 1998, 53, S144–S152. [Google Scholar] [CrossRef] [PubMed] [Green Version]
  60. Mossey, J.M.; Shapiro, E. Self-rated health: A predictor of mortality among the elderly. Am. J. Public Health 1982, 72, 800–808. [Google Scholar] [CrossRef] [PubMed] [Green Version]
  61. Schneider, S.L.; Kogan, I. The International Standard Classification of Education 1997: Challenges in the Application to National Data and the Implementation in Cross-National Surveys in The International Standard Classification of Education (ISCED-97). An Evaluation of Content and Criterion Validity for 15 European Countries; MZES: Mannheim, Germany, 2018; pp. 13–46. [Google Scholar]
  62. UNESCO. International Standard Classification of Education-ISCED 1997; UNESCO: Montreal, QC, Canada, 1997. [Google Scholar]
  63. Castro-Costa, E.; Dewey, M.; Stewart, R.; Banerjee, S.; Huppert, F.; Mendonca-Lima, C.; Büla, C.; Reisches, F.; Wancata, J.; Ritchie, K.; et al. Prevalence of depressive symptoms and syndromes in later life in ten European countries. Br. J. Psychiatry 2007, 191, 393–401. [Google Scholar] [CrossRef] [PubMed]
  64. Nicholson, A.; Bobak, M.; Murphy, M.; Rose, R.; Marmot, M. Socio-economic influences on self-rated health in Russian men and women—A life course approach. Soc. Sci. Med. 2005, 61, 2345–2354. [Google Scholar] [CrossRef] [Green Version]
  65. Tur-Sinai, A.; Halperin, D.; Ben David, N.; Lowenstein, A.; Katz, R. Cessation of Care for Frail Older Adults: Physical, Psychological and Economic Outcomes for Family Carers. Int. J. Environ. Res. Public Health 2022, 19, 3570. [Google Scholar] [CrossRef]
  66. McCullough, M.E.; Laurenceau, J.-P. Gender and the Natural History of Self-Rated Health: A 59-Year Longitudinal Study. Health Psychol. 2004, 23, 651–655. [Google Scholar] [CrossRef] [Green Version]
  67. Cesaretti, R.; Lobo, J.; Bettencourt, L.M.A.; Ortman, S.G.; Smith, M.E. Population-Area Relationship for Medieval European Cities. PLoS ONE 2016, 11, e0162678. [Google Scholar] [CrossRef] [Green Version]
  68. Ganguli, I.; Hausmann, R.; Viarengo, M. Gender Differences in Professional Career Dynamics: New Evidence from a Global Law Firm. Economica 2020, 88, 105–128. [Google Scholar] [CrossRef]
  69. Collins, C. Is Maternal Guilt a Cross-National Experience? Qual. Sociol. 2021, 44, 1–29. [Google Scholar] [CrossRef]
  70. Foster, L.; Walker, A. Gender and active ageing in Europe. Eur. J. Ageing 2013, 10, 3–10. [Google Scholar] [CrossRef] [Green Version]
  71. Reynolds, M.C.; Palmer, S.B.; Barton, K.N. Supporting Active Aging for Persons with Severe Disabilities and Their Families Across the Life Course. Res. Pract. Pers. Sev. Disabil. 2019, 44, 211–223. [Google Scholar] [CrossRef]
  72. World Health Organization. A Framework for Action on Women, Ageing and Health (No. WHO/FCH/ALC/2008.1). Available online: https://apps.who.int/iris/bitstream/handle/10665/70713/WHO_FCH_ALC_2008.1_eng.pdf (accessed on 24 March 2022).
Figure 1. SRH differences between men and women in childhood, Wave 1 and Wave 6.
Sustainability 14 04240 g001
Figure 2. SRH differences between men and women in childhood, Wave 1 and Wave 6 by welfare regime.
Sustainability 14 04240 g002
Table 1. Descriptive statistics of study variables and bivariate analyses in Wave 1 and Wave 6, by gender of respondents aged 60–70 in Wave 1.
VariableCategoriesWave 1 Wave 6 F/X2
MenWomenMenWomen
45.2254.78 45.2254.78
Self-rated health—%Excellent13.5710.5627.80 ***6.124.2116.89 **
Very good24.6320.47 18.1214.9
Good41.1040.54 38.3537.56
Fair16.7822.54 29.0232.32
Poor3.925.89 8.3911.01
Age—mean (SD) 65.2 (2.83)65.03 (2.77)2.6675.87 (2.88)75.66 (2.81)3.58
Living with spouse—%Yes85.271.7109.70 ***78.357.9205.90 ***
No14.8028.3 28.7042.1
Children—mean (SD) 2.41 (1.46)2.42 (1.54)0.052.39 (1.53)2.42 (1.54)0.29
Grandchildren—mean (SD) 2.75 (3.13)3.41 (3.42)27.66 ***3.88 (3.50)4.16 (3.54)4.65 *
Welfare regime—%Social Democratic21.1019.111.99
Continental45.2546.76
Mediterranean25.4125.32
Mixed8.248.81
Education—%University24.7117.9420.14 ***24.8617.9420.89 ***
High school42.2744.43 42.2744.62
Elementary school 33.0237.63 32.8637.44
Employment status—%Employed/self-emp.19.1411.14364.66 ***2.431.3296.32 ***
Retired76.4761.20 95.5375.06
Homemaker 24.22 19.17
Unemployed4.393.43 2.044.47
Make ends meet—%Easily32.7829.0814.07 **47.3740.0924.37 **
Fairly easily35.5332.71 29.4929.21
Some difficulty24.3128.3 17.4922.09
Great difficulty7.379.91 5.658.61
Net household income (ln) 9.51 (2.52)9.19 (2.69)10.3 **10.14 (1.04)9.89 (1.12)37.88 ***
ADL—%No ADL94.4392.646.53 *86.4084.371.62
1 ADL or more5.577.36 13.6015.63
Chronic diseases—mean (SD) 1.39 (1.25)1.73 (1.48)41.58 ***1.96 (1.55)2.30 (1.67)31.01 ***
Depression—mean (SD) 1.58 (1.72)2.62 (2.22)186.5 ***1.96 (1.93)2.89 (2.31)132.31 ***
Childhood health status—%Excellent41.2533.0324.40 ***
Very good29.7331.09
Good21.1024.94
Fair6.128.55
Poor1.802.40
Note: ADL—limitations in Activities of Daily Living. Significance levels: * p < 0.05, ** p < 0.01, *** p < 0.001.
Table 2. Ordered logistic regression analysis with self-rated health in Wave 1 as dependent variable (N = 2819) (odds ratio).
Variables MenWomen
Model 1Model 2Model 3Model 4Model 1Model 2Model 3Model 4
Education (Ref. university)
High school 1.363 *1.417 **1.455 **1.420 **1.753 ***1.716 ***1.694 ***1.656 ***
Elementary school and less2.024 ***2.117 ***1.942 ***1.963 ***2.262 ***1.980 ***1.759 ***1.735 ***
Current job situation
(Ref. employed/self-employed)
Retired 1.644 ***1.512 **1.2231.2382.548 ***2.147 ***1.773 **1.765 **
Homemaker 3.133 ***2.128 ***1.858 **1.901 **
Unemployed 1.885 *1.898 *1.4171.4914.753 ***4.006 ***2.345 **2.364 **
Make ends meet (Ref. easily)
Fairly easily 1.286 *1.2211.1981.1991.350 *1.2191.1471.144
Some difficulty 2.200 ***1.874 ***1.491 **1.506 **2.780 ***2.280 ***1.748 **1.736 ***
Great difficulty1.953 **1.642 *1.0951.0574.035 ***3.234 ***1.798 **1.776 **
Net household income0.9650.9860.9790.9790.9810.9620.9680.967
Living with spouse 0.7720.8760.871 0.9591.0581.056
No. of children 1.0161.0151.011 1.0251.0571.057
No. of grandchildren 0.9720.9710.974 1.0010.9750.975
Welfare regime (Ref. Social Democratic)
Continental 2.362 ***2.623 ***1.922 ** 2.149 ***2.079 ***1.749 **
Mediterranean 2.624 ***3.112 ***3.655 *** 2.903 ***2.491 ***2.689 ***
Mixed 2.630 **2.285 **3.710 *** 1.4451.4551.827
ADL 5.677 ***5.595 *** 4.629 ***4.668 ***
Chronic diseases 1.857 ***1.864 *** 1.662 ***1.670 ***
Depression 1.222 ***1.223 *** 1.235 ***1.235 ***
Childhood health status 1.285 ***1.276 *** 1.203 ***1.201 ***
Health expenditure 1.318 * 1.159
Notes: N = 1275 men, 1544 women, OR: odds ratio, Ref.: reference category. ADL: limitations in Activities of Daily Living. Significance levels: * p < 0.05, ** p < 0.01, *** p < 0.001.
Table 3. Ordered logistic regression analysis with self-rated health in Wave 6 as dependent variable (N = 2819) (odds ratio).
Variables MenWomen
Model 1Model 2Model 3Model 4Model 1Model 2Model 3Model 4
Education (Ref. university)
High school 1.349 *1.342 *1.2341.1621.435 **1.395 *1.0741.036
Elementary school and less1.666 ***1.734 ***1.417 *1.3432.068 ***1.738 ***1.1751.153
Current job situation
(Ref. employed/self-employed)
Retired 2.756 **2.618 **3.278 **3.405 ***2.563 *2.563 **1.9692.114
Homemaker 2.822 *2.385 *1.9072.144
Unemployed 5.674 ***5.543 **2.5532.512 *9.677 ***8.816 ***3.275 *3.619 *
Make ends meet (Ref. easily)
Fairly easily 1.321 *1.2401.2221.2481.258 *1.2551.1391.133
Some difficulty 1.662 ***1.541 **1.1481.1772.275 ***2.242 ***1.363 *1.364 *
Great difficulty1.886 **1.693 *1.0871.1013.801 ***3.577 ***1.861 **1.829 *
Net household income0.9480.9601.0551.0450.9250.9170.9540.948
Living with spouse 0.8971.0311.020 1.1271.2201.216
No. of children 0.9910.9480.949 0.9980.9830.982
No. of grandchildren 0.9870.9890.993 1.0381.045 *1.044 *
Welfare regime (Ref. Social Democratic)
Continental 1.950 ***1.2591.418 * 1.504 **0.8610.942
Mediterranean 1.840 ***1.3365.243 *** 1.961 ***1.2453.054 **
Mixed 1.750 **1.29116.565 *** 0.9590.6613.728 *
ADL 3.875 ***4.035 *** 2.615 ***2.653 ***
Chronic diseases 1.368 ***1.383 *** 1.405 ***1.418 ***
Depression 1.298 ***1.300 *** 1.269 ***1.268 ***
Childhood health status 1.0911.071 1.107 *1.102 *
Self-rated health in Wave 1 2.071 ***2.065 *** 2.002 ***2.003 ***
Health expenditure 2.076 *** 1.626 **
Notes: N = 1275 men, 1544 women, OR: odds ratio, Ref.: reference category. ADL: limitations in Activities of Daily Living. Significance levels: * p < 0.05, ** p < 0.01, *** p < 0.001.
Table 4. Ordered logistic regression analysis with self-rated health as dependent variable in Wave 1 and Wave 6 by welfare regime (odds ratio).
VariablesSocial DemocraticContinentalMediterraneanMixed
Model 1Model 2Model 1Model 2Model 1Model 2Model 1Model 2
Wave 1
Gender1.2180.9881.236 *0.8981.724 ***0.9560.8630.539
Education (Ref University)
High school1.876 **1.648 *1.611 ***1.743 ***1.3201.3541.1021.236
Elementary school and less2.049 **1.965 **1.953 ***1.921 ***2.581 **2.139 *0.8620.921
Current job situation
(Ref. employed/self-employed)
Retired1.826 **1.690 **1.843 ***1.530 *1.2420.9441.4431.009
Homemaker1.8031.5001.959 **1.4561.0961.1121.8941.405
Unemployed6.800 ***6.737 ***2.183 *1.2942.0600.9991.4770.758
Make ends meet (Ref. easily)
Fairly easily1.524 *1.3591.1171.0611.1801.2461.7621.591
Some difficulty4.354 ***3.206 ***1.407 *1.0642.841 ***2.363 **2.681 **2.334 *
Great difficulty2.4051.2191.5891.0743.226 ***2.038 *3.523 **1.895
Net household income0.9700.9230.917 *0.9281.0601.0500.9700.960
Wave 6
Gender1.2821.0240.9400.6861.763 ***1.1730.7880.650
Education (Ref. university)
High school1.1811.0301.487 ***1.503 **1.6921.3260.9520.865
Elementary school and less1.783 **1.925 **1.657 ***1.478 **2.687 **2.361 *0.6090.276 **
Current job situation
(Ref. employed/self-employed)
Retired4.256 *5.588 **1.2561.1763.8973.6332.552 *3.797 **
Homemaker4.4900.8921.1171.1243.3103.3546.908 **6.902 **
Unemployed120.9 ***35.39 ***2.7341.4499.941 **5.1616.218 **1.708
Make ends meet (Ref. easily)
Fairly easily1.1161.0271.2091.0601.0431.0821.920 *2.888 **
Some difficulty1.5761.2951.806 ***1.3141.547 *1.2034.460 ***3.536 **
Great difficulty1.2690.9403.649 ***1.788 *1.997 **1.4035.855 ***4.439 **
Net household income0.8910.8290.809 ***0.815 **1.0751.136 *1.0901.154
Notes: N = 564 Social Democratic, 1299 Continental, 715 Mediterranean, 241 Mixed. Odds Ratio, Ref.: Reference Category. Self-rated health. ADL: limitations in Activities of Daily Living. Significance levels: * p < 0.05, ** p < 0.01, *** p < 0.001.
Publisher’s Note: MDPI stays neutral with regard to jurisdictional claims in published maps and institutional affiliations.

