The Overall and Disaggregate China’s Bank Efficiency from Sustainable Business Perspectives


1
Department of Finance, Chihlee University of Technology, New Taipei City 220305, Taiwan
2
Department of Applied Economics, Fo Guang University, Yilan 262307, Taiwan
3
School of Accounting, Guangzhou Nanfang College, Guangzhou 510970, China
4
Department of Business Administration, Chihlee University of Technology, New Taipei City 220305, Taiwan
*
Author to whom correspondence should be addressed.
Sustainability 2022, 14(7), 4366; https://0-doi-org.brum.beds.ac.uk/10.3390/su14074366
Submission received: 3 March 2022
/
Revised: 29 March 2022
/
Accepted: 1 April 2022
/
Published: 6 April 2022
Abstract
:The goal of the basic business perspective has switched from previously maximizing profit to the current three fields of environment, society, and the economy, within the viewpoint of corporate social responsibility (CSR). This study, from the perspective of sustainability, discusses the current business model of the relationship between CSR and the performance of the Industrial and Commercial Bank of China (ICBC), a state−owned bank, with SBM-DEA and Tobit regression methods, and it puts forward a direction for improvement for future business models. Through the analysis of the years from 2010 to 2018, it has been found that the years with the best performances are 2010, 2011, and 2018, and some empirical evidence from the ICBC is as follows. First, corporate financial leverage closely follows gross domestic product (GDP) growth in terms of utilizing total assets. The ICBC seems to place less attention on its sales and on the number of deposits because of its high ratio of government stock holdings. Second, the ICBC raises labor productivity through education and training of its employees as well as through the proper utilization of capital for input-side management. Lastly, performance has improved as the ICBC has focused more on long-term society contributions, which are directed toward charity donations, loans for poverty alleviation, and green economy development in terms of output-side management. Therefore, through the above three CSR strategies, the ICBC has positively contributed toward environmental innovation and the societal transition of China, and its practices can be used as a sustainable model for future development.
1. Introduction
The Industrial and Commercial Bank of China (ICBC) is not only one of the “Big Four” state−owned commercial banks in China, but its paid-in capital in 2013 was also the highest in the world of any bank. Based on the ICBC’s goodwill and reputation, its business activity follows corporate social responsibility (CSR), defined by the European Commission [1] as the responsibility of enterprises in regard to their impacts on society. As CSR has evolved into being one part of a basic sustainable business perspective, an enterprise’s goal now is to not only maximize profit but to also enhance sustainable development through the three channels of environment, society, and economy. Commercial banks can follow a green credit policy by controlling/restricting loans to high pollution industries or by issuing more loans to help green economy development. According to China’s national society policy, commercial banks must pay more attention to loans for poverty alleviation and charity donations. Moreover, they have the duty to stabilize national economic growth when the nation suffers from a financial crisis. Chen and Pan [2] investigate the sustainability of 13 commercial banks in China and conclude that state−owned commercial banks have the highest sustainability, perhaps due to their strong performances for society and the environment as well as due to their early development of green credit businesses.
Even if the concept of CSR is extensively mentioned by commercial banks, their businesses and management do not ignore the market competition. A traditional business model can be treated as being an appropriate competitive strategy that can help pave a successful path for business operations. Traditional business models reveal dynamic changes over a certain time period. Voelpel et al. [3] call this business model of change by time a business model reinvention. The traditional business model has undergone significant changes, from the early goal of profit maximization to the current themes of corporate social responsibility, corporate sustainable development, etc., revealing its own dynamic revolution. Furthermore, Stubbs and Cocklin [4] develop a sustainable business model to drive sustainability concepts into a firm’s decision making. Their analysis finds that the core idea for achieving corporate sustainability includes changes in corporate internal structure, corporate cultural capabilities for sustainability, and the collaboration of key corporate stakeholders.
Sustainability for the banking industry implies designing financial products and services to meet people’s needs and to adhere to environmental protection in order to create value-added industrial profit. Fisk [5] believed that the triple bottom line of sustainability encompasses people, the planet, and profit. Bocken and Short [6] think that sustainable business models can be designed by a system change in organizations. Some studies’ business models focuses on how a company conducts business (Margretta [7], Zott and Ami [8], Beattie and Smith [9]), whereas some paid attention to how a company converts resources and capabilities into economic value (Teece [10]). Banks engage in sustainable activities and practice CSR activities in order to strategically create value and improve their public image.
A recent trend in the banking industry is to build up corporate sustainable development through green finance. The Green Credit Policy was implemented in China’s banking industry in 2007, when the “Opinions on Implementing Environmental Protection Policies and Regulations to Prevent Credit Risks” was jointly initiated by the Ministry of Environmental Protection, the People’s Bank of China, and the China Banking Regulatory Commission (Aizawa and Yang [11]). The Green Credit Policy requires that banks (whether state−owned, joint−stocks banks, or credit unions) must offer low interest rate loans to environment-friendly industries and must restrict loans to polluting industries. The three main guiding spirits of the Green Credit Policy are to strengthen commercial banks’ environmental management performance, to share environmental information between the environmental authority and financial institutions, and to provide some practice tools and responsibilities by means of environmental taxes, green trade, green insurance, green securities, green credit, ecological compensation mechanisms, and green government procurement.
Afuah [12] presents the business model and defines it as a firm’s activities that create customers’ value added, such as low-cost or differentiated products, which then puts the firm in an advantageous position of business competition. Shafer et al. [13] emphasize that the business model is not a strategy, and they define it as a value network that represents a firm’s core logic and strategic choices in order to create and capture business value. Lambert and Davidson [14] reviewed the literature in the field of business models on electronic databases from 1996 to 2010, presenting the relationship between business models and enterprise performance and highlighting business model innovation in existing studies. Yip and Bocken [15] investigate customers’ receptiveness to sustainable business models in the banking industry and develop eight sustainable business models, whereby the most popular business model to customers is the model that uses digital channels with a minimized environmental impact and great momentum for delivering services. We are curious about what the most popular business model to customers is and which is also acceptable to the firm’s stakeholders, since a benefit conflict sometimes occurs between the two sides. Based on business operation efficiency, this paper targets to find the most appropriate business model from the direction of company owners and management.
As a state−owned commercial bank, the Industrial and Commercial Bank of China started a series of financial reforms, such as operation efficiency improvement and privatization, in 2001 after China entered the World Trade Organization (WTO) and set up its business arm of green credit in 2007. Chan-Olmsted and Ha [16] found that the adoption of Internet elements directly influences a business model by, for example, causing changes to revenue structure and competitive strategy. DeYoung [17] examined the impact of an Internet-based business model on the banking industry and concluded that such a successful business model should depend on sufficient scale and experienced management practices. Mester et al. [18] believe that the core technology in the commercial lending business model is to monitor. Their result also implies that monitoring is a method to enhance enterprise value. Akhigbe and McNulty [19] established a link between bank monitoring and bank profit efficiency in order to strengthen the business management model in this industry. Allen et al. [20] explore the ICBC’s advantageous model during its privatization process and its management institution. The trends of artificial intelligence (AI) and big data have pushed the banking industry to heavily depend on Internet technology.
The banking industry has a high degree of monitoring and control given by any national government in order to maintain domestic financial stability. Profit capture and risk management are two main indicators for monitoring and control in this industry. Starting from the subprime mortgage crisis in 2008 and along with the rising issue of climate change, the business model of the banking industry has changed. Paulet et al. [21] explore the behavior model change of the banking industry after the subprime mortgage crisis. They separate the types of banks into conventional banks and ethical banks and find that these different types have their own distinct business models. Their research concludes that the behavior model of conventional banks has changed under the new regulatory framework, but the behavior model of ethical banks has scarcely been altered under the new financial context.
The Green Credit Policy in China announced in 2007, which involves financial and environmental regulations, is a form of sustainable development. Cabrita and Bontis [22] indicated that a bank’s information systems should function to transfer human capital into organizational capability that potentially provides business intelligence, valuable insights, and critical decision-making models to managers. Guo [23] examines the execution of the Green Credit Policy and shows that there is insufficient information on corporate environmental performance, weak market incentive, and a lack of knowledge and capacity for banking staff and the government’s environmental affairs, which are future challenges for policy success. Li et al. [24] find that the Green Credit Policy has made China’s banking industry become more responsible toward environment sustainable development, in which non-polluting companies find it easier to receive loans from banks than do polluting ones due to banks’ new decision-making process for loans.
The historical business model of the banking industry has been undergoing dramatic changes caused by finance and business globalization, the development of information and communication technology, and the regulation of financial and environmental laws. Cabrita and Bontis [22] pointed out that the banking industry in Portugal has changed from the traditional goals of revenue creation on deposits and loans to new business models, such as high added-value creation through mutual funds and estate management. An interesting observation is that the business goal change under new business frameworks brings either greater business efficiency or lesser business efficiency. The current literature pays scant attention to evaluating different business models. Yip and Bocken [15] suggest eight kinds of sustainable business models for the banking industry. Seol et al. [25] apply data envelopment analysis (DEA) to decide the best business model in the manufacturing industry. Fukuyama and Tan [26] have decomposed Chinese banks’ overall inefficiency performance indicator into five component indicators: sub-indicators of innovation, two kinds of stability, profitability, and CSR for overall and disaggregate efficiency analysis models, and they have found that state−owned commercial banks have a higher level of corporate social responsibility inefficiency than the others’ inefficiencies. Fukuyama and Tan [27] also firstly consider the number of employees as an input as a CSR indicator, and they develop donations, balances of green credits, and loans to small and middle enterprises (SMEs) as the others indicators for Chinese banking industries. Some of the main results show that the potential increasing number of employees provides benefits to improve society unemployment and poverty, and overall indirect technical efficiency is negatively affected by green credits significantly, whereas an increase in donations improves indirect allocative efficiency. The above research indeed provides a more complete idea for banks to incorporate CSR into business performance indicators for developing business models, and offers a valuable structure for examining individual banks.
Our research follows the identification of sustainable business models by Yip and Bocken [15] with an adjustment and adopts the DEA approach to evaluate relative efficiency scores under the business activities of the Industrial and Commercial Bank of China (ICBC). We first discuss the overall and directional operational efficiency of the ICBC from 2010 to 2018 from the perspective of corporate social responsibility. Each year is regarded as a DMU for efficiency comparison. The SBM-DEA model proposed by Tone [28,29] and revised by Tsutsui and Goto [30] and Chang [31] is adopted to calculate the efficiency values. SBM-DEA is used to measure and improve the slack-based measurement of input and output, which can contribute to our analysis. The amount of labor (persons) and total assets are used as inputs, and from sustainable business perspectives, environment direction, society direction, and economy direction are used as outputs. Next, we adopt Tobit regression analysis to find the effects of the independent variables, i.e., DA, and three control variables, i.e., ROA, SIZE, and GDPg, on overall efficiency and disaggregate efficiency of the environment, society, and the economy for analyzing different models of the ICBC’s sustainable development and for finding the key indicators. Since most of the previous studies on this issue focused on the overall banking industry rather than on an individual bank, this research, represented by a state−owned bank, helps to better grasp and understand the sustainable development strategy of an individual one.
The remainder of this paper is organized as follows. Section 2 offers the methodology for the evaluation of different models from sustainable business perspectives. Section 3 conducts several results of empirical analysis. Section 4 provides a discussion and recommendation for sustainable business models in the banking industry. Finally, concluding remarks drawn from this study are addressed in Section 5.
2. Empirical Methodologies
The concept of efficiency initially started from Farrel [30] and then Charnes et al. [31], who embody efficiency into a numerical estimation by applying linear programming to compute efficiency scores. Since they set an assumption of constant returns to scale (CRS) into the production function, their model is named the DEA-CRS model, or the CCR model. Banker et al. [32] extend the CRS assumption into variable returns to scale (VRS), named the DEA-VRS model or the BCC model. More detailed model developments of DEA are mentioned in Cooper et al. [33].
Tone [34,35] proposes the slack-based measure (SBM) method to compute the efficiency score, turning SBM-DEA into a popular model in the efficiency literature. This study applies an SBM-DEA model revised from Tsutsui and Goto [28] and Chang [29] to compute the technical efficiency scores of decision-making units (DMUs). There are n DMUs in the SBM-DEA model setup. In this article, there are nine DMUs as evaluated samples. The small sample size is accepted because DEA is a frontier-based linear programming technique which has no requirement of sample size [36]. In addition, we reviewed the past literature about the SBM-DEA model by Tone and Tsutsui [37,38,39], which does not mention any sample size limitation when using the SBM-DEA model. Let y = f(x) represent the production function, where the symbols y, x, and f respectively stand for outputs, inputs, and frontier. The computation of the production technical efficiency score by the SBM-DEA model is:
The constraints in model (1) describe the DMU’s production mode in which each DMU uses input X to produce output Yk, which represents the advantage of the DEA model for estimating the situation of multiple inputs and multiple outputs, where X and Yk are the vectors of input and output, respectively. The output vector Yk represents the outputs belonging to the kth sustainable business perspective, such as some outputs, including the economy, society, the environment, and other perspectives, where k = 1, 2, …, K. DMU 0 in Equation (1) uses the ith input (xi0) to produce the jth output in field k (ykj0), where i = 1, 2, …, I and j = 1, 2, …, J. The symbols si0 and skj0 represent the ith output slack and the jth output slack in sustainable business perspective k for DMU 0, respectively. The symbol λ represents the weight vector that connects all DMUs’ inputs and outputs by a linear combination. As the weight for DMU 0 to other DMUs is not zero, this means that DMU 0 is a peer to the DMU with a weight that is not zero, and that a higher weight means that the peer is more important to DMU 0.
The objective function in Equation (1) computes the score of overall technical efficiency (θ0) of DMU 0, where θ0 ∈ [0, 1]. The objective function involves various production technical efficiencies in different perspectives and pools them into one. When θ0 = 1, it means that DMU 0 is a relatively effective DMU at production compared with other DMUs; when θ0 < 1, it means that DMU 0 is a relatively ineffective DMU due to insufficient outputs compared to other DMUs.
The decomposition of the objective function can also compare DMU 0’s scores of overall technical efficiency in different sustainable business perspectives, as follows:
where θk0 presents DMU 0’s score of technical efficiency for a bank’s sustainable business perspective k. In actuality, the scores of θ0 and θk0 are the concepts of overall and disaggregate efficiencies proposed by Hu and Wang [40]. This study lists two different points on this concept to compare with theirs: (i) Their model is an input-oriented radical DEA model, and our model is a non-oriented SBM-DEA model; (ii) The disaggregate efficiency estimation in their model applies a ratio of the target amount of input to the actual amount of input, whereas the disaggregate efficiency in this study is one of the components in the objective function. Figure 1 illustrates the concept of disaggregate efficiency. There are three frontiers of fields 1, k, and K that face the same amount of input in Figure 1. The optimal amount of input is xi0−si0 for DMU 0. Its optimal amounts of outputs in fields 1, k, and K are y1j0 + s1j0, yk0 + skj0, and yKj0 + sKj0, respectively. The outputs in the three different fields have different adjustive directions and different increments in order to reach the optimal output level.
where θk0 is DMU 0’s efficiency measure for its sustainable business perspective in field k; LEV0 is the variable relative to financial leverage; Z0 is a vector of control variables; and u0 is a stochastic error term. This study employs the Tobit regression approach, which is more suitable if the dependent variables (efficiency measure θk0 in the current case) are limited or censored from below, above, or both (Vidyarthi [41]).
θk0 = c + a1LEV0 + a2Z0 + u0,
The independent variable for financial leverage is the debt to total assets ratio (DA). Based on the agency cost hypothesis, DA should have a positive leverage effect on DMU’s performance (Margaritis and Psillaki [42]). This represents that the higher leverage ratio should encourage higher efficiency, which is also in line with the efficiency–risk hypothesis, and efficiency has a positive effect on leverage. There also collect three control variables as follows: the first control variable is the ratio of profits to total assets (ROA) for profitability measurement. The DMU with more profit measured by ROA generally exhibits better business management and thus is expected to be more efficient. The natural log of DMU 0’s sales for a business size measurement (SIZE), and the national GDP growth as a proxy for DMU 0’s growth prospects and investment opportunities (GDPg) are collected in Equation (3). An inconsistent viewpoint appears on SIZE to DMU’s performance. Vidyarthi [41] and Himmelberg et al. [43] point out that a large-size firm may enjoy economies of scale to perform with better efficiency. However, Williamson [44] notes that a larger firm faces hierarchical managerial inefficiency and may incur larger monitoring costs. Lastly, GDPg is expected to bring a positive effect on DMU’s performance (Claessens et al. [45], Maury [46], King and Santor [47]).
3. Empirical Results
This section aims to find the core point in the business model of the banking industry by taking the Industrial and Commercial Bank of China as the empirical case. The production approach and the intermediation approach are two common ways to evaluate performance in the banking industry. This paper adopts the production approach as the analytical method.
3.1. Variables and Data Description
This study applies the production approach for the banking industry to choose input and output factors and defines the sustainability business model for the banking industry in order to match China’s expectations of national development in its banking industry.
Holod and Lewis [48] indicate that the production approach in the banking industry treats deposits as outputs, since a bank employs financial and human assets to serve its customers. Weber [49] also presents the output factors of sustainability development in order to characterize the sustainable business model of the banking industry. Hence, their papers form a criterion for the choice of input and output variables herein. The Industrial and Commercial Bank of China is the case study in this paper. The research period spans 2010–2018, and the data source is its annual reports. Table 1 summarizes variables’ specifications of inputs and outputs for a sustainable business model in the banking industry.
Table 2 is a descriptive statistical table of the input and output factors for the Industrial and Commercial Bank of China from 2010 to 2018, and all financial variables are deflated into real ones by the consumer price index (CPI) with 2010 as the base year. The output variable with the largest coefficient of variation (CV) is the amount of loans for poverty alleviation, followed by the amount of loans for green economy development. This implies that China has paid much attention not only to society development, but also to environment protection. For inputs, the CV for the amount of labor is larger than that for total assets, implying that the ICBC has hired more employees than it has used its total assets to augment its economics of scale. Based on the output CV measurement, descriptive statistics analysis shows that China has put more attention into solving the problems of society and the environment than those of the economy. The smallest output CV is the amount of deposits, which does not necessarily imply that the economy has been ignored. Hence, to obtain more information from the raw data, we need to apply the DEA approach in this study.
3.2. Results on Overall and Disaggregate Bank’s Efficiencies
From the efficiency analysis, Table 3 shows that the lowest mean score of disaggregate efficiency is environment efficiency instead of economy efficiency. This result is different from that in Table 2, which comments that economic performance is weak compared to the performances of the environment and society. This different result is a result of the efficiency analysis in Table 3 considering the factors of input and output at the same time. The trend of aggregate efficiency from 2010 to 2018 for the ICBC is a V shape in which the top points are 2010, 2011, and 2018, and the bottom point is 2015. The reason for the lowest aggregate efficiency in 2015 is that the lowest society efficiency, the second lowest environment efficiency, and society efficiency are even lower than aggregate efficiency. The trends of environment efficiency and economy efficiency have the same shape with aggregate efficiency, in which the bottom point is located at 2015, and the bottom point of society efficiency appears at 2014. This paper presents a similar finding to that of Chen and Pan [2], who investigate the sustainability of 13 Chinese-listed commercial banks, including state−owned commercial banks, and conclude that their sustainability exhibits a decreasing trend over the period 2012–2016.
The GDP (gross domestic product) growth rates of China have been slowing down since 2010. Moreover, China experienced a stock market crash, causing market losses of over 3.2 trillion USD in 2015. In order to reverse the country’s economic performance, China initiated reforms in the financial market, including when its central bank announced the removal of the ceiling on bank deposit interest rates and the stipulation of a loan-to-deposit ratio of 75% for liquidity improvement. In addition, the central bank provided 2.5 trillion USD for local governments to control their spiraling debt. This series of financial reforms paved the way for further financial marketization and enhanced funding opportunities. Afterward, the performances of the ICBC on production technology, the environment, society, and the economy improved. Financial market liberalization and capital liquidity improvements activated the capital and money markets to increase the amount of deposits, loans for green economy development, and loans for poverty alleviation. The banking industry in China also has more cash for charity donations.
Zhang et al. [50] study the social-ecological-economic system of eastern China and conclude that poverty alleviation, ecosystem protection, and economic growth cannot be obtained at the same time. The business model for the ICBC in the fields of the environment, society, and the economy shows that their performance can be achieved at the same time since their efficiency trends are the same. The different results between Zhang et al. [50], with a macro−level investigation, and our paper, with a micro-level investigation, may be explained by Mosley [51], who provides a viewpoint of the micro–macro paradox.
3.3. Results of Different Bank’s Sustainable Business Perspectives
This paper uses Tobit regression to estimate Equation (3) which was also applied by Vidyarthi [41]. Table 4 presents the regression analysis results on the business models to discuss the effects of the independent variables, i.e., DA, ROA, SIZE, and GDPg, on aggregate efficiency, environment efficiency, society efficiency, and economy efficiency. The four business models have high adjusted R-squared, and their results of F-statistic are significant under the 5% level. This implies that the four independent variables have a strong ability to explain the dependent variables. For the individual independent variable DA, it has a positive significant influence on aggregate efficiency, environment efficiency, and economy efficiency. In other words, high financial leverage by the ICBC can help raise its aggregate efficiency, environment efficiency, and economy efficiency. For the independent variable ROA, a high ROA causes all efficiency scores in the business models to decrease. This result shows that the ICBC, as a state−owned enterprise, does not make profit as its sole business target, and that the improvement of social welfare, even with a profit loss, may raise its business efficiency. However, the ICBC’s size, i.e., its number of sales, does not have a significant influence on the efficiency scores of the four business models. This result is similar to that of ROA because the ICBC does not make profit its main business target. The national factor, i.e., GDPg, has a positive and significant influence on the efficiency scores of the four business models. In other words, a stronger GDP growth rate pushes the ICBC’s business efficiency higher.
All independent variables have the strongest influence on society efficiency. In other words, changes to all independent variables at the same time affect the society efficiency score more than the efficiency scores of the other business models. This result implies that the behavior of the ICBC to increase loans for poverty alleviation and charity donations can be realized by a high DA and GDPg and a low ROA. Changes in the independent variables DA and GDPg have a secondary strength effect on the aggregate efficiency score, whereas ROA has a similar effect on environment efficiency. Compared to the past literature, Table 4 shows that DA has a positive leverage effect on a DMU’s performance, which matches the agency cost hypothesis. The result of the ROA deviates from the general idea that a DMU with a high ROA is expected to be more efficient. One possible reason is that the ICBC is a state−owned enterprise that does not make high profit its business goal. The variable SIZE may be good or bad to a DMU’s efficiency based on the past literature’s results. The results in this paper are that SIZE, i.e., the ICBC’s sales, does not have a significant influence on its efficiency scores. Finally, the finding of GDPg causing a positive effect on the ICBC’s performance is supported by past research.
3.4. Results of Peer Analysis during Sampling Periods
According to aggregate efficiency, the ICBC in the years 2010, 2011, and 2018 exhibits the best performance among all data periods. This study further applies peer analysis to find the ICBC’s best performance among those three years. The results in Table 5 show that the peer count of the ICBC’s performance in 2010 is seven times, in 2018 is five times, and in 2011 is four times. Hence, the most valuable year for inefficient DMUs to learn about the ICBC’s performance is year 2010. The other information in Table 5 indicates that a DMU’s ranking is based on its aggregate efficiency score. It indicates that three DMUs with top ranks are benchmarking units for the other six DMUs. The bottom ranking shows that the DMU’s performance is relatively inefficient, and these inefficient units can find the effective DMU(s) to learn in order to improve ineffective performances. The peer weight stands at a level in which inefficient DMUs put attention toward the benchmarking DMUs. For example, the ranking of the ICBC’s performance in 2012 is six. Since the ICBC’s performance in 2012 with the aggregate efficiency score being 0.506 is inefficient, its peer count is zero, and it should refer to the other effective DMU(s) for learning. In this case, its peers are the ICBC’s performances in years 2010, 2011, and 2018, and it can assign peer weights of 0.355 to 2010, 0.540 to 2011, and 0.105 to 2018 in order to become a benchmarking unit.
3.5. Learning from the Best Business Model of Bank
The peer counts of the ICBC’s performance in 2010 and 2018 are listed as the top two among all data periods; hence, it is meaningful to investigate the ICBC’s behaviors during these two years. Figure 2 draws the standardized data on inputs and outputs and their trends, in which the trend of charity donations has a relatively larger wave than those of the other variables, and its trend runs stable upward after 2014. The amount of labor in the ICBC has a large jump in 2011 and then becomes smooth after 2012. Comparing the amounts of two input factors, i.e., total assets and labor, between 2010 and 2018, we can see that the input size of the ICBC has an obvious increase, as do the ICBC’s amount of outputs. However, the ratio of total assets to amount of labor becomes small when comparing 2018 to 2010, because human resources in the ICBC have created a larger output effect than capital for the year 2018.
For the outputs, the rank of the amount of deposits is last among the four kinds for both 2010 and 2018, implying that the ICBC, as a state−owned bank, is not putting any more attention toward increasing customer deposits. Loans for poverty alleviation and charity donations are two outputs relative to society efficiency. There is a large gap between them in 2010, but this gap becomes small in 2018, because of a large increase in loans for poverty alleviation. The ranking of loans for green economy development is initially second in 2010 and then is third in 2018, since the loan for green economy development in 2018 was caught up by the loan for poverty alleviation. This result implies that the ICBC has recently put more attention toward society issues than environmental issues.
The ICBC’s performance in 2011 is also valuable for reference, because its peer count is listed at third, and the aggregate efficiency score for this year is also unity, thus becoming a benchmark DMU. Except for a similar size in the amount of labor and a decrease in charity donations, the other variables increase in 2011 compared to year 2010. The variable of charity donations has a different size for the years 2010, 2011, and 2018. These years are benchmarking units among all data periods, implying that the variable of charity donations may have a weak influence on the ICBC’s performance when the ICBC is performing well. The amount of labor for the years 2010, 2011, and 2018 remains at the bottom compared to the other variables, and the aggregate efficiency scores for these three years are unity and listed as benchmarking units. Contrary to the years 2012, 2013, 2014, and 2015, the amounts of labor remain at top, and the aggregate efficiency scores for these years are lower than unity and are listed as inefficient units. From this viewpoint, the variable of the amount of labor has a large influence on the ICBC’s performance.
Table 6 shows the correlation coefficient between the ICBC’s various efficiency scores and all input and output variables. We combine two input variables into a ratio of the total assets to the amount of labor in order to examine the substitution effect of the input factor on the ICBC’s performance. This paper finds that the ratio of total assets to the amount of labor has the highest correlation coefficient with the ICBC’s efficiency scores compared to the other variables. Charity donations have the second highest correlation coefficient with the ICBC’s efficiency scores. On average, the correlation coefficient of loans for green economy development to the ICBC’s efficiency scores is larger than that of loans for poverty alleviation to the ICBC’s efficiency scores. The weakest correlation coefficient of all variables to the ICBC’s efficiency scores is the amount of deposits, as there is a negative correlation coefficient between the amount of deposits and the ICBC’s society efficiency score. Except for the ratio of total assets to the amount of labor, exhibiting the highest correlation coefficient to society efficiency score, the other variables’ correlation coefficients all have the highest correlation coefficient to environment efficiency score. The analysis in Table 6 implies that the ratio of total assets to the amount of labor may be a critical indicator for the ICBC’s business and management. In addition, the ICBC should pay more attention to the amount of deposits because of a weak correlation coefficient to the ICBC’s efficiency score, even though there is a negative correlation coefficient to its society efficiency score.
4. Discussion
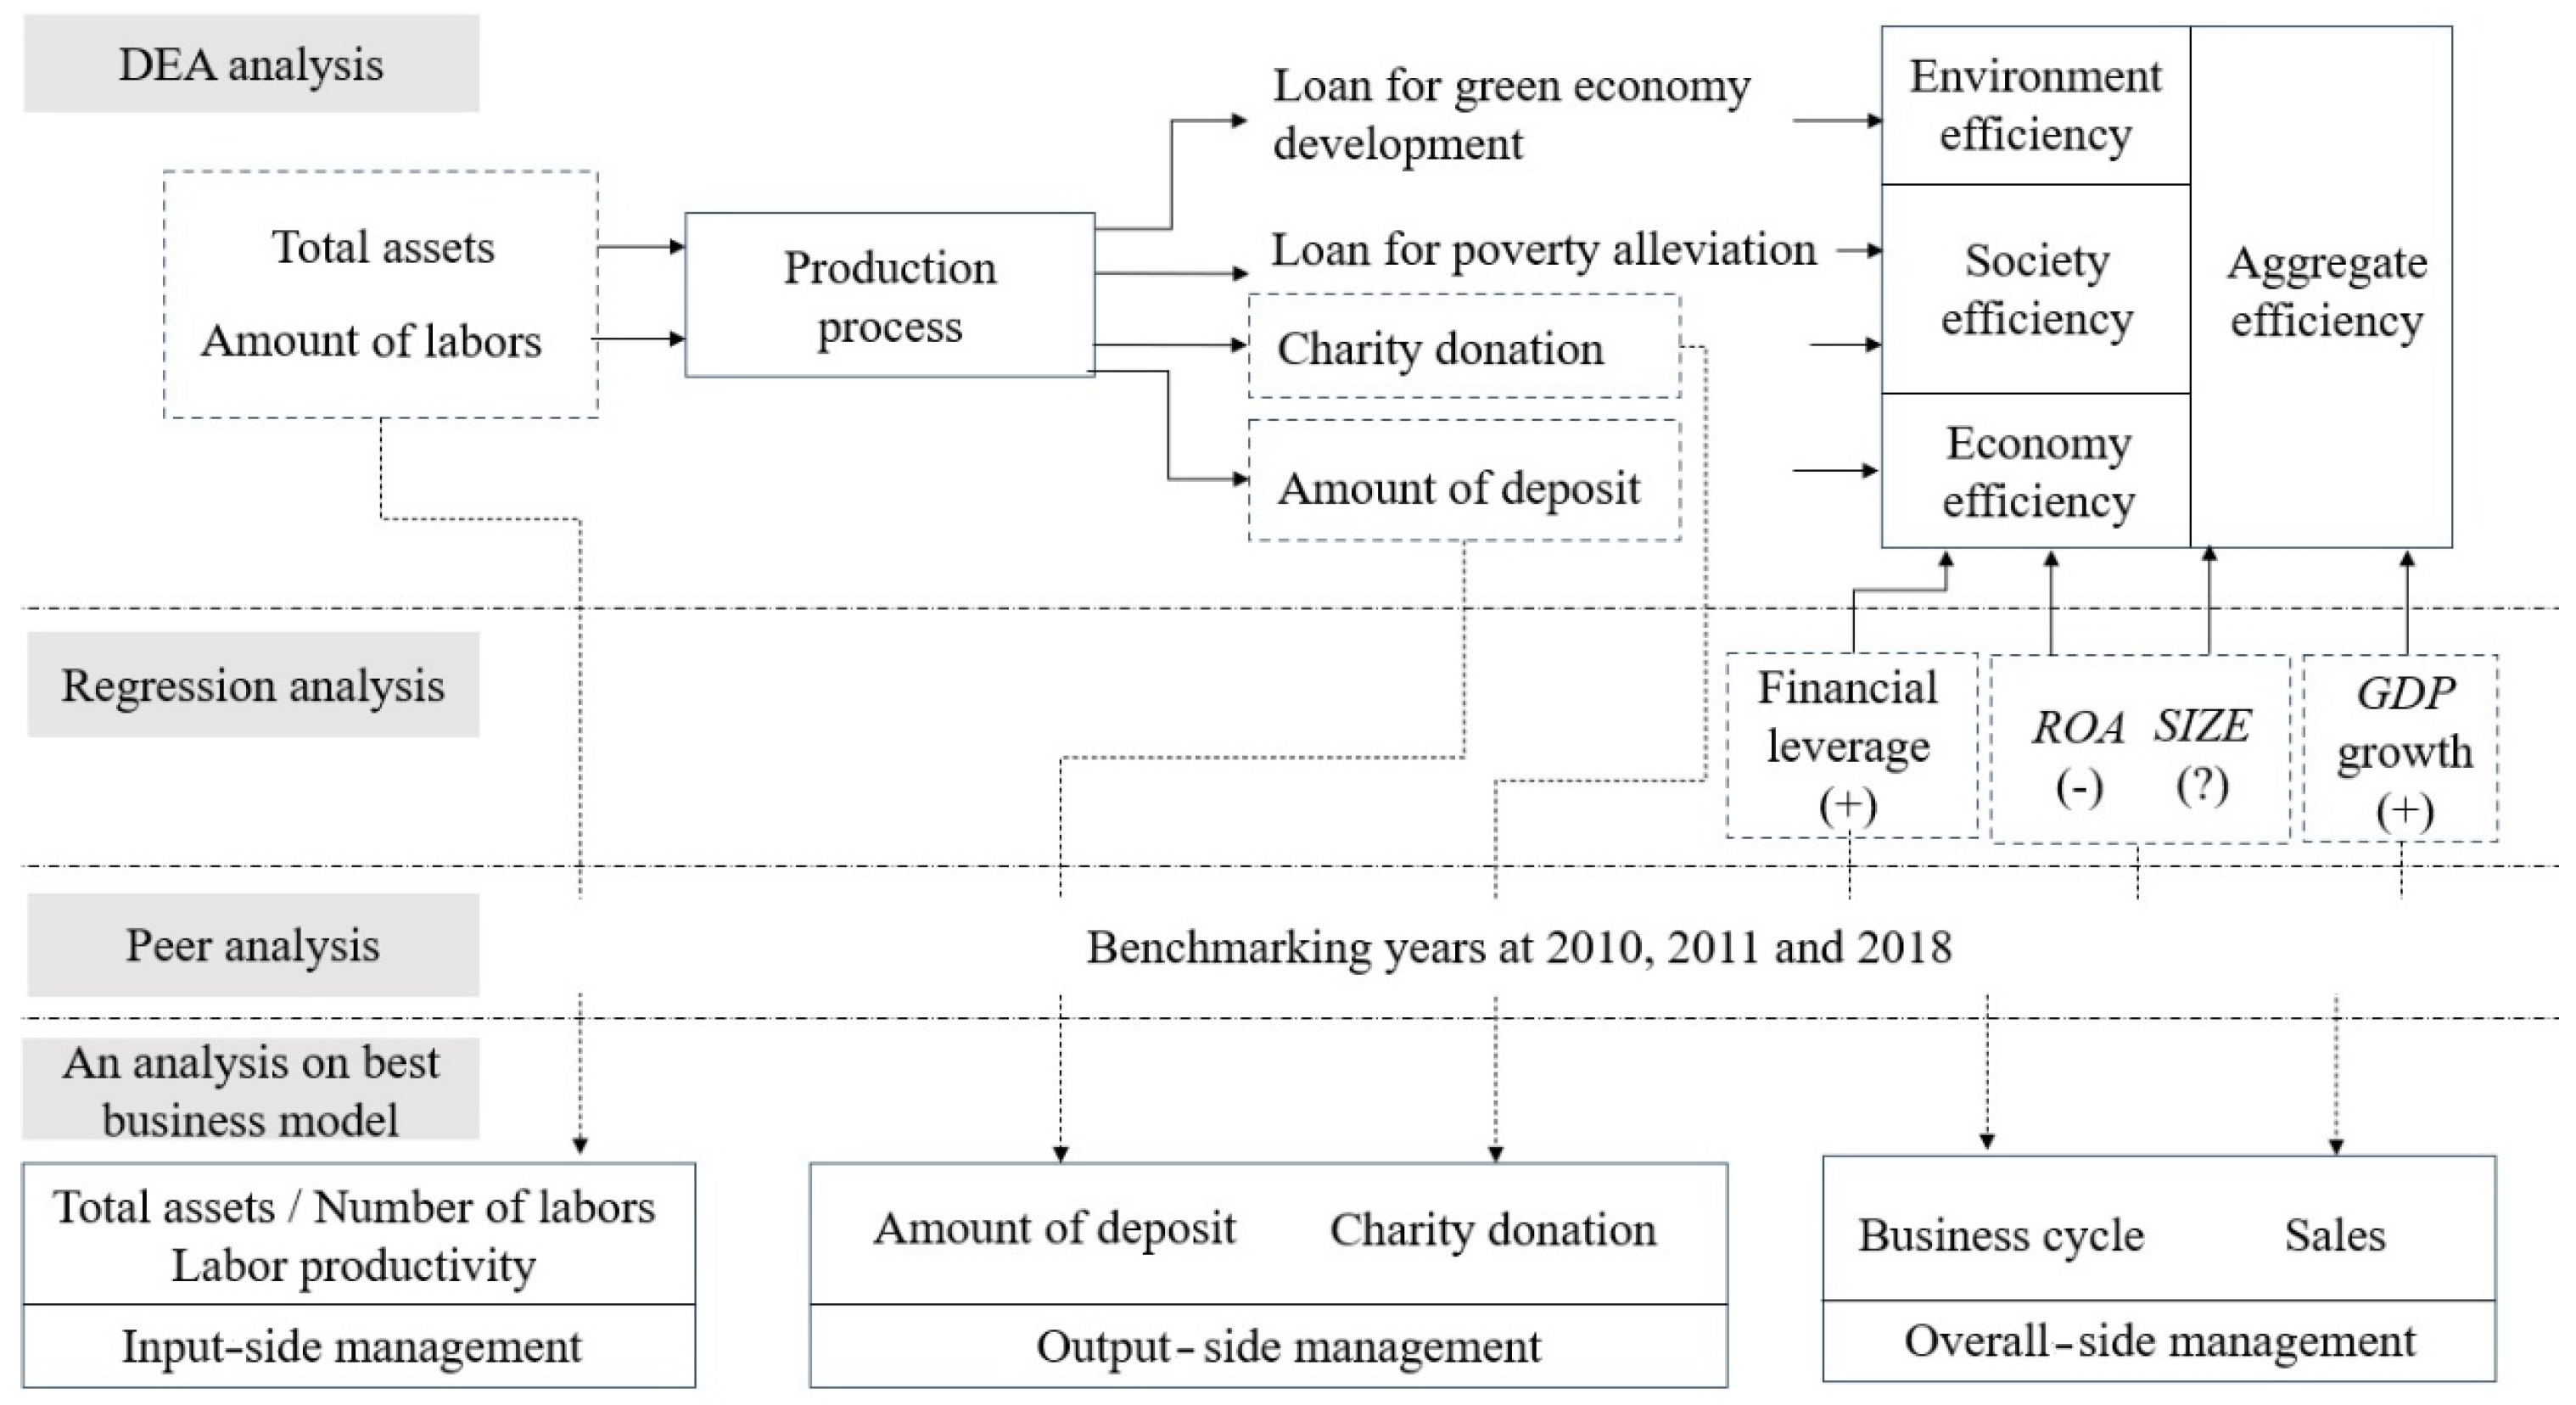
Based on a comprehensive analysis that covers DEA analysis, regression analysis, peer analysis, and best business model analysis, this study targets finding a successful business model of the ICBC for the years 2010, 2011, and 2018 when the scores of aggregate efficiency, the environment, society, and the economy are all unity and are listed as benchmarking units and peers for the other units. The analysis flow chart in Figure 3 summarizes some features of the ICBC’s business model in 2010, 2011, and 2018. In DEA analysis, two input factors and five output factors decide the aggregate efficiency, which can be divided into environment efficiency, society efficiency, and economy efficiency. We use regression analysis to find the effects of financial leverage, ROA, sales size, and GDP growth on the ICBC’s business and management efficiency. Peer analysis finds the best business model of the ICBC, and the best business model analysis finds the best business model’s features.
Based on Figure 3, the recommendation for input-side management is that the amount of labor should be kept at a low level compared to total assets, which makes the ICBC show excellent performance, just as in 2010, 2011, and 2018. Those three years have benchmarking units, whereas year 2012, 2013, 2014, and 2015 have inefficient units. The proper application of human resources is exhibited when there is less labor at higher productivity. Less hired labor and strong capital operations may be the key point for the ICBC to improve performance. Hence, the first condition to a successful business model for the ICBC is to increase labor productivity through education and training, less hired labor, and strong capital application via financial leverage.
For output-side management, the variable of charity donations for years 2010 and 2011 has a large difference in size, but it does not affect the ICBC’s performance, since the efficiency scores for these two years are unity. However, charity donations exhibit the second highest correlation coefficient to the ICBC’s efficiency scores, denoting that the effect of charity donations more easily appears in the long term than in the short term. Long-term social responsibilities are likely to be more important than short-term social responsibilities. Hence, the second condition to a successful business model for the ICBC is to emphasize its long-term social responsibilities and contributions. In addition, loans for poverty alleviation and green economy development as well as long-term deposit service for civilians’ wealth protection and management should also be emphasized.
The ICBC’s scores of aggregate efficiency, environment, society, and economy are easily affected by financial leverage, GDP growth, and profit ratio, in which the former two variables have a positive effect, and the latter one has a negative effect. In addition, the ICBC’s sales size has an insignificant influence on its performance. Hence, the third condition to a successful business model for the ICBC is that its financial leverage utilization should follow the business cycle. The ICBC does not put more attention toward its profit ratio and sales size because of the high ratio of government stockholdings in the ICBC; as such, the bank focuses more on helping to implement national policies. However, ROA and sales size are critical results of market competition that the ICBC should target to a greater extent in the future.
In the past decade, China’s environmental policy has switched from end-of-pipe, command, and control-based regulation to market-based instruments such as green public procurements, environmental taxes, and green trade policies. Recently, China has begun to promote the development of green finance, in which its domestic financial sector plays an important role, such as loaning for green economy development, pursuing initial public offerings (IPOs), or conducting refinancing after passing environmental assessments. In 1986, China initiated the “China Poverty Alleviation Program”, which initially targeted rural poverty counties to help farmers improve farming techniques and gain agricultural market information. Rural commercial banks have implemented poverty alleviation programs, and the major players in the financial system and important providers of finance in non-urban areas are the “Big Four” state−owned banks, including the Industrial and Commercial Bank of China, the Agricultural Bank of China, the Bank of China, and the China Construction Bank. In the ICBC’s business model, we find that its input of loans for poverty alleviation and charity donations are for the “China Poverty Alleviation Program”. Thus, its business model has switched to contributing more to the country’s environmental innovation and societal transition.
To sum up the above discussion, when we focus on the input-output indicators of the ICBC in the three benchmark years of 2010, 2011, and 2018, we can find that a lower number of employees and assets can produce higher social, environmental, and economic output, and appropriate leverage can strengthen this effect. The ICBC’s business model can be used as a reference for other banks to carry out their sustainable operations.
5. Concluding Remarks
The early business model of targeting profit has dynamically switched to the current business goal of corporate social responsibility, thus revealing a very dynamic change. The goals of sustainable business models include the fields of the environment, society, and the economy. This study takes the Industrial and Commercial Bank of China as a case study and uses the year as a decision-making unit in order to find a benchmarking unit as a peer that can be a reference of learning for other inefficient units. The observation period is from 2010 to 2018 (9 years in total), and the benchmarking units for the business model are 2010, 2011, and 2018. In this study, we also explore the ICBC’s contributions toward environmental innovation and societal transition in China.
Based on the bank’s benchmarking business models for the years 2010, 2011, and 2018, this study provides recommendations for the ICBC as follows. (i) From the previous analysis, we find that financial leverage has a positive impact on performance, which is consistent with the research results of Margaritis and Psillaki [41]. Proper capital utilization has helped the ICBC boost its performance. Thus, the bank should continue to target its financial leverage and the ratio of total assets to the amount of labor. (ii) The ICBC’s performances on sales and the amount of deposits are weak, perhaps because the bank has a high ratio of government stockholdings, which places less attention on market competition. However, market competition is a factor on which the ICBC should focus more in the future. (iii) The ICBC’s input-side management should raise the ratio of total assets to the amount of labor. Aside from appropriate financial leverage, the bank can also improve labor productivity via education and training. (iv) In terms of output-side management, charity donations similarly appear to be a temporary and short-term social responsibility and contribution, but they have had an obvious effect on the ICBC’s performance when looking at the full data observation period. Hence, the ICBC should focus more on its long-term mission and contributions, such as loans for green economy development and poverty alleviation. The ICBC’s strong business model has helped China’s environmental innovation and society development, including contributions such as loans for green economy development and poverty alleviation as well as charity donations. Such business actions not only help the ICBC achieve its CSR goals, but they also help satisfy the direction of social sustainable development for China.
This research takes a representative of China’s state−owned banks as the object, and its contributions are as follows: firstly, we find that the ICBC has unique business experience in sustainable development, and appropriate financial leverage can contribute to overall performance, which is in line with the efficiency–risk hypothesis and the agency cost hypothesis. In addition, in the business model of the base year, we can find that maintaining low human input and improving environmental, social, and economic output can achieve the best efficiency, which shows that a balance can be achieved in terms of operating costs and social benefits, which is a sustainable business model worthy of imitation. This can lead the government to propose more favorable incentive plans to guide banks to pay more attention to environmental and social issues and to adjust to a sustainable business model.
This study provides business recommendations to the ICBC based on the years when it exhibited the best performance along with its corporate social responsibility. However, a drawback is that the ICBC is the only subject of this case study. In empirical analysis, we suggest that the ICBC should pay more attention to market competition in banking due to its weak performances in sales and amount of deposits. In the future, one possible way to investigate market competition in the banking industry is to add more banks as decision-making units and compare them with the ICBC.
Author Contributions
Conceptualization, methodology, and software, M.-C.C.; writing—original draft preparation, M.-C.C., C.-P.C., C.-C.L. and Y.-M.X.; writing—review and editing, visualization, and supervision, M.-C.C. All authors have read and agreed to the published version of the manuscript.
Funding
This research received no external funding.
Institutional Review Board Statement
Not applicable.
Informed Consent Statement
Informed consent was obtained from all subjects involved in the study.
Data Availability Statement
Data are not publicly available, though the data may be made available on request from the corresponding author.
Conflicts of Interest
The authors declare no conflict of interest.
References
- European Commission. A Renewed EU Strategy 2011–14 for Corporate Social Responsibility; European Commission: Brussels, Belgium, 2011. [Google Scholar]
- Chen, K.; Pan, Y. Sustainability of China’s listed commercial banks under background of the ‘new normal’. Asia-Pac. J. Account. Econ. 2020, 27, 685–702. [Google Scholar] [CrossRef]
- Voelpel, S.C.; Leibold, M.; Tekie, E.B. The wheel of business model reinvention: How to reshape your business model to leapfrog competitors. J. Change. Manag. 2004, 4, 259–276. [Google Scholar] [CrossRef]
- Stubbs, W.; Cocklin, C. Conceptualizing a “sustainability business model”. Organ. Environ. 2008, 21, 103–127. [Google Scholar] [CrossRef]
- Fisk, P. People Planet Profit: How to Embrace Sustainability for Innovation and Business Growth; Kogan Page Publishers: London, UK, 2010. [Google Scholar]
- Bocken, N.M.; Short, S.W. Towards a sufficiency-driven business model: Experiences and opportunities. Environ. Innov. Soc. Transit. 2016, 18, 41–61. [Google Scholar] [CrossRef] [Green Version]
- Magretta, J. Why business models matter. Harv. Bus. Rev. 2002, 80, 86–92. [Google Scholar]
- Zott, C.; Amit, R. Business model design: An activity system perspective. Long Range Plann. 2010, 43, 216–226. [Google Scholar] [CrossRef]
- Beattie, V.; Smith, S.J. Value creation and business models: Refocusing the intellectual capital debate. Br. Account. Rev. 2013, 45, 243–254. [Google Scholar] [CrossRef]
- Teece, D.J. Business models, business strategy and innovation. Long Range Plann. 2010, 43, 172–194. [Google Scholar] [CrossRef]
- Aizawa, M.; Yang, C. Green credit, green stimulus, green revolution? China’s mobilization of banks for environmental cleanup. J. Environ. Dev. 2010, 19, 119–144. [Google Scholar] [CrossRef]
- Afuah, A. Business Models: A Strategic Management Approach; McGraw-Hill Irwin: New York, NY, USA, 2004. [Google Scholar]
- Shafer, S.M.; Smith, H.J.; Linder, J.C. The power of business models. Bus. Horiz. 2005, 48, 199–207. [Google Scholar] [CrossRef]
- Lambert, S.C.; Davidson, R.A. Applications of the business model in studies of enterprise success, innovation and classification: An analysis of empirical research from 1996 to 2010. Eur. Manag. J. 2013, 31, 668–681. [Google Scholar] [CrossRef]
- Yip, A.W.; Bocken, N.M. Sustainable business model archetypes for the banking industry. J. Clean. Prod. 2018, 174, 150–169. [Google Scholar] [CrossRef]
- Chan-Olmsted, S.M.; Ha, L.S. Internet business models for broadcasters: How television stations perceive and integrate the Internet. J. Broadcast. Electron. 2003, 47, 597–616. [Google Scholar] [CrossRef]
- DeYoung, R. The performance of internet-based business models: Evidence from the banking industry. J. Bus. 2005, 78, 893–947. [Google Scholar] [CrossRef] [Green Version]
- Mester, L.J.; Nakamura, L.I.; Renault, M. Transactions accounts and loan monitoring. Rev. Financ. Stud. 2007, 20, 529–556. [Google Scholar] [CrossRef]
- Akhigbe, A.; McNulty, J.E. Bank monitoring, profit efficiency and the commercial lending business model. J. Econ. Bus. 2011, 63, 531–551. [Google Scholar] [CrossRef]
- Allen, F.; Qian, J.Q.; Shan, S.C.; Zhao, M. The IPO of Industrial and Commercial Bank of China and the ‘Chinese Model’ of privatizing large financial institutions. Eur. J. Financ. 2014, 20, 599–624. [Google Scholar] [CrossRef]
- Paulet, E.; Parnaudeau, M.; Relano, F. Banking with ethics: Strategic moves and structural changes of the banking industry in the aftermath of the subprime mortgage crisis. J. Bus. Ethics 2015, 131, 199–207. [Google Scholar] [CrossRef]
- Cabrita, M.D.R.; Bontis, N. Intellectual capital and business performance in the Portuguese banking industry. Int. J. Technol. Manag. 2008, 43, 212–237. [Google Scholar] [CrossRef] [Green Version]
- Guo, P. Financial policy innovation for social change: A case study of China’s green credit policy. Int. Rev. Sociol. 2014, 24, 69–76. [Google Scholar] [CrossRef]
- Li, X.; Yin, H.; Liu, J. Is China’s banking industry embracing sustainable investment? Appl. Econ. Lett. 2018, 25, 1269–1272. [Google Scholar] [CrossRef]
- Seol, H.; Lee, S.; Kim, C. Identifying new business areas using patent information: A DEA and text mining approach. Expert Syst. Appl. 2011, 38, 2933–2941. [Google Scholar] [CrossRef]
- Fukuyama, H.; Tan, Y. Implementing strategic disposability for performance evaluation: Innovation, stability, profitability and corporate social responsibility in Chinese banking. Eur. J. Oper. Res. 2022, 296, 652–668. [Google Scholar] [CrossRef]
- Fukuyama, H.; Tan, Y. Corporate social behaviour: Is it good for efficiency in the Chinese banking industry? Ann. Oper. Res. 2021, 306, 383–413. [Google Scholar] [CrossRef]
- Tone, K. A slack-based measure of efficiency in data envelopment analysis. Eur. J. Oper. Res. 2001, 130, 498–509. [Google Scholar] [CrossRef] [Green Version]
- Tone, K. A slack-based measure of super-efficiency in data envelopment analysis. Eur. J. Oper. Res. 2002, 143, 32–41. [Google Scholar] [CrossRef] [Green Version]
- Tsutsui, M.; Goto, M. A multi-division efficiency evaluation of US electric power companies using a weighted slacks-based measure. Socio-Econ. Plan. Sci. 2009, 43, 201–208. [Google Scholar] [CrossRef]
- Chang, M.C. Room for improvement in low carbon economies of G7 and BRICS countries based on the analysis of energy efficiency and environmental Kuznets curves. J. Clean. Prod. 2015, 99, 140–151. [Google Scholar] [CrossRef]
- Farrel, M.J. The measurement productive efficiency. J. R. Stat. Soc. 1957, 120, 253–290. [Google Scholar] [CrossRef]
- Charnes, A.; Cooper, W.W.; Rhodes, E. Measuring the efficiency of decision making units. Eur. J. Oper. Res. 1978, 2, 429–444. [Google Scholar] [CrossRef]
- Banker, R.D.; Charnes, A.; Cooper, W.W. Some models for estimating technical and scale inefficiencies in data envelopment analysis. Manag. Sci. 1984, 30, 1078–1092. [Google Scholar] [CrossRef] [Green Version]
- Cooper, W.W.; Seiford, L.M.; Tone, K. Introduction to Data Envelopment Analysis and Its Uses: With DEA-Solver Software and References; Springer Science & Business Media: Berlin/Heidelberg, Germany, 2006. [Google Scholar]
- Cook, W.D.; Tone, K.; Zhu, J. Data envelopment analysis: Prior to choosing a model. Omega 2014, 44, 1–4. [Google Scholar] [CrossRef]
- Tone, K.; Tsutsui, M. Network DEA: A slacks-based measure approach. Eur. J. Oper. Res. 2009, 197, 243–252. [Google Scholar] [CrossRef] [Green Version]
- Tone, K.; Tsutsui, M. Dynamic DEA: A slacks-based measure approach. Omega 2010, 38, 145–156. [Google Scholar] [CrossRef] [Green Version]
- Tone, K.; Tsutsui, M. Dynamic DEA with network structure: A slacks-based measure approach. Omega 2014, 42, 124–131. [Google Scholar] [CrossRef] [Green Version]
- Hu, J.L.; Wang, S.C. Total-factor energy efficiency of regions in China. Energy Policy 2006, 34, 3206–3217. [Google Scholar] [CrossRef]
- Vidyarthi, H. Dynamics of intellectual capitals and bank efficiency in India. Serv. Ind. J. 2019, 39, 1–24. [Google Scholar] [CrossRef]
- Margaritis, D.; Psillaki, M. Capital structure, equity ownership and firm performance. J. Bank. Financ. 2010, 34, 621–632. [Google Scholar] [CrossRef]
- Himmelberg, C.; Hubbard, G.; Palia, D. Understanding the determinants of managerial ownership and the link between ownership and performance. J. Financ. Econ. 1999, 53, 353–384. [Google Scholar] [CrossRef] [Green Version]
- Williamson, O.E. Hierarchical control and optimum firm size. J. Polit. Econ. 1967, 75, 123–138. [Google Scholar] [CrossRef]
- Claessens, S.; Djankov, S.; Fan, J.; Lang, L. Disentangling the incentive and entrenchment effects of large shareholdings. J. Financ. 2002, 57, 2741–2771. [Google Scholar] [CrossRef]
- Maury, B. Family ownership and firm performance: Empirical evidence from Western European corporations. J. Corp. Financ. 2006, 12, 321–341. [Google Scholar] [CrossRef]
- King, M.R.; Santor, E. Family values: Ownership structure, performance and capital structure of Canadian firms. J. Bank. Financ. 2008, 32, 2423–2432. [Google Scholar] [CrossRef] [Green Version]
- Holod, D.; Lewis, H.F. Resolving the deposit dilemma: A new DEA bank efficiency model. J. Bank. Financ. 2011, 35, 2801–2810. [Google Scholar] [CrossRef]
- Weber, O. Corporate sustainability and financial performance of Chinese banks. Sustain. Account. Manag. 2017, 8, 358–385. [Google Scholar] [CrossRef] [Green Version]
- Zhang, K.; Dearing, J.A.; Dawson, T.P.; Dong, X.; Yang, X.; Zhang, W. Poverty alleviation strategies in eastern China lead to critical ecological dynamics. Sci. Total Environ. 2015, 506, 164–181. [Google Scholar] [CrossRef] [Green Version]
- Mosley, P. Aid-effectiveness: The micro-macro paradox. Ids Bull. 1986, 17, 22–27. [Google Scholar] [CrossRef] [Green Version]
Figure 1.
Production technical efficiency in various fields.

Figure 2.
Trend analysis in the input and output variables.

Figure 3.
An analysis flow chart of the ICBC’s sustainable business model.


Table 1.
Variables’ specifications for a bank’s sustainable business perspectives.
| Directions | Modes | Output Factors (Unit) | Indicator(s) in Holod and Lewis [48], and Weber [49] | Input Factors |
|---|---|---|---|---|
| Environment | Green economy | Amount of loans for green economy Development (100 million RMB) | Green industry loans | |
| Society | Society policy | Amount of loans for poverty alleviation (100,000 RMB) | Funds for developing countries, rural areas | Total assets (100 million/RMB) |
| Enterprise image | Charity donation (100,000 RMB) | Other products and services addressing social issues | Amount of labor (persons) | |
| Economy | Traditional business | Amount of deposits (100 million RMB) | A standard output for the production approach in the banking industry |
Table 2.
Descriptive statistics of input and output variables (CPI = 100 in 2010).
| Factor | Direction | Item | Standard Deviation | Mean | Coefficient of Variation |
|---|---|---|---|---|---|
| Outputs | Environment | Amount of loans for green economy development | 1918.350 | 6798.435 | 0.282 |
| Society | Amount of loans for poverty alleviation | 580.544 | 1324.734 | 0.438 | |
| Charity donations | 1530.700 | 5498.269 | 0.278 | ||
| Economy | Amount of deposits | 21,699.501 | 139,889.930 | 0.155 | |
| Inputs | Input 1 | Total assets | 32,045.863 | 182,373.776 | 0.176 |
| Input 2 | Amount of labor | 194,068.813 | 354,092.778 | 0.548 |
Table 3.
Results of overall and disaggregate bank efficiencies.
| Year | Overall Efficiency | Disaggregate Efficiency | ||
|---|---|---|---|---|
| Environment | Society | Economy | ||
| 2010 | 1.000 | 1.000 | 1.000 | 1.000 |
| 2011 | 1.000 | 1.000 | 1.000 | 1.000 |
| 2012 | 0.506 | 0.496 | 0.465 | 0.556 |
| 2013 | 0.498 | 0.443 | 0.537 | 0.516 |
| 2014 | 0.421 | 0.436 | 0.358 | 0.471 |
| 2015 | 0.417 | 0.434 | 0.360 | 0.458 |
| 2016 | 0.660 | 0.695 | 0.619 | 0.666 |
| 2017 | 0.747 | 0.810 | 0.666 | 0.766 |
| 2018 | 1.000 | 1.000 | 1.000 | 1.000 |
| Mean | 0.701 | 0.667 | 0.715 | 0.694 |
Table 4.
Regression analysis on the bank’s different sustainable business perspectives.
| Overall Efficiency (Business Model 1) | Environment Efficiency (Business Model 2) | Society Efficiency (Business Model 3) | Economy Efficiency (Business Model 4) | |||||
|---|---|---|---|---|---|---|---|---|
| Coefficients | S.E. | Coefficients | S.E. | Coefficients | S.E. | Coefficients | S.E. | |
| Constant | −36.323 * | 14.665 | −30.736 * | 12.723 | −43.758 * | 19.908 | −34.497 * | 13.724 |
| DA | 28.679 * | 12.019 | 24.920 * | 10.428 | 33.728 | 16.317 | 27.275 * | 11.248 |
| ROA | −2.973 *** | 0.537 | −3.040 *** | 0.466 | −3.106 ** | 0.729 | −2.764 *** | 0.502 |
| SIZE | 1.361 | 0.775 | 1.140 | 0.672 | 1.664 | 1.052 | 1.291 | 0.725 |
| GDPg | 0.334 ** | 0.101 | 0.322 ** | 0.088 | 0.370 * | 0.138 | 0.311 ** | 0.095 |
| Adjusted R-squared | 0.896 | 0.925 | 0.833 | 0.895 | ||||
| F-statistic | 18.299 *** | 25.662 *** | 10.962 ** | 17.980 *** | ||||
| Obs. | 9 | 9 | 9 | 9 | ||||
Notes: SE means standard error; *** stands for a 1% significance level; ** stands for a 5% significance level; * stands for a 10% significance level.
Table 5.
Results of peer analysis during the sampling period.
| DMU | Aggregate Efficiency | Ranking | Peer | Peer Weight | Peer Count |
|---|---|---|---|---|---|
| 2010 | 1.000 | 1 | 2010 | 1.000 | 7 |
| 2011 | 1.000 | 1 | 2011 | 1.000 | 4 |
| 2012 | 0.506 | 6 | 2010 | 0.355 | 0 |
| 2011 | 0.540 | ||||
| 2018 | 0.105 | ||||
| 2013 | 0.498 | 7 | 2010 | 0.422 | 0 |
| 2011 | 0.543 | ||||
| 2018 | 0.035 | ||||
| 2014 | 0.421 | 8 | 2010 | 1.000 | 0 |
| 2015 | 0.417 | 9 | 2010 | 1.000 | 0 |
| 2016 | 0.660 | 5 | 2010 | 0.123 | 0 |
| 2011 | 0.532 | ||||
| 2018 | 0.345 | ||||
| 2017 | 0.747 | 4 | 2010 | 0.492 | 0 |
| 2018 | 0.508 | ||||
| 2018 | 1.000 | 1 | 2018 | 1.000 | 5 |
Table 6.
Regression analysis for bank’s sustainable business perspectives.
| Variable/Performance | Aggregate Efficiency | Disaggregate Efficiency | ||
|---|---|---|---|---|
| Environment | Society | Economy | ||
| Amount of loans for green economy development | 0.312 | 0.374 | 0.253 | 0.304 |
| Amount of loans for poverty alleviation | 0.304 | 0.341 | 0.270 | 0.297 |
| Charity donations | 0.458 | 0.464 | 0.456 | 0.445 |
| Amount of deposits | 0.009 | 0.068 | −0.040 | 0.001 |
| Total assets/Amount of labor | 0.691 | 0.663 | 0.703 | 0.695 |
Publisher’s Note: MDPI stays neutral with regard to jurisdictional claims in published maps and institutional affiliations. |
© 2022 by the authors. Licensee MDPI, Basel, Switzerland. This article is an open access article distributed under the terms and conditions of the Creative Commons Attribution (CC BY) license (https://creativecommons.org/licenses/by/4.0/).
Share and Cite
MDPI and ACS Style
Chang, M.-C.; Chen, C.-P.; Lin, C.-C.; Xu, Y.-M. The Overall and Disaggregate China’s Bank Efficiency from Sustainable Business Perspectives. Sustainability 2022, 14, 4366. https://0-doi-org.brum.beds.ac.uk/10.3390/su14074366
AMA Style
Chang M-C, Chen C-P, Lin C-C, Xu Y-M. The Overall and Disaggregate China’s Bank Efficiency from Sustainable Business Perspectives. Sustainability. 2022; 14(7):4366. https://0-doi-org.brum.beds.ac.uk/10.3390/su14074366
Chicago/Turabian StyleChang, Ming-Chung, Chiang-Ping Chen, Chien-Cheng Lin, and Yu-Ming Xu. 2022. "The Overall and Disaggregate China’s Bank Efficiency from Sustainable Business Perspectives" Sustainability 14, no. 7: 4366. https://0-doi-org.brum.beds.ac.uk/10.3390/su14074366
Note that from the first issue of 2016, this journal uses article numbers instead of page numbers. See further details here.