
Plastic Waste Management in India: Challenges, Opportunities, and Roadmap for Circular Economy

 , , , and
Abstract
:
1. Introduction
1.1. Plastic Production and PW

| Polymer Type and Chemical Structure. | Resin Identification Code | General Application as Virgin Material | Properties | Toxic Chemical Present | Advantage | Challenges | Recycled Products |
|---|---|---|---|---|---|---|---|
Polyethylene terephthalate (PET) |  | Bottle application because they are inexpensive, lightweight, and shatter-resistant | Clarity, strength, toughness, barrier to gas and moisture | BPA, leach antimony | More convenient (less energy intensive) for chemical recycling (catalytic methods) than thermolysis | Costly thermochemical process and hazardous byproduct generation, fiber quality is less purified than recycled material, toxic production process for nanoparticles | Mineral/drinking water bottles, cosmetic bottles |
High-density polyethylene (HDPE, or PE-HD) |  | Bottles, carry bags, milk pouches, recycle bins, etc. | Stiffness, strength, toughness, moisture resistance, permeability to gas | Unknown | Less extraction of fossil fuel, less dependence on petrochemical production, more convenient (less energy intensive) for chemical recycling (catalytic methods) than thermolysis | Expensive conversion process (isolation and purification), less effective mechanical properties than conventional recycled material | Tubes, sewer pipes, pallets, boxes, buckets, toys, bottles for detergents, construction, cable insulation, packaging of food products |
Polyvinyl chloride (PVC) |  | For pipes and fittings, tarpaulins, medical apps., etc. | Versatility, ease of blending, strength, toughness | Phthalates | Less extraction of fossil fuel, reduced volume to landfill, less dependence on petrochemical production, more convenient (less energy intensive) for chemical recycling (catalytic methods) than thermolysis | Fiber quality is less purified than recycled material, expensive conversion process (isolation and purification), less effective mechanical properties than conventional recycled material | Sewer pipes, window frames, construction, flooring, wallpaper, bottles, car interiors, medical products, planks, etc.) |
Low/linear low-density polyethylene (LDPE/LLDPE) |  | Plastic bags, various containers, dispensing bottles, wash bottles, tubing, etc. | Ease of processing, strength, toughness, flexibility, ease of sealing, barrier to moisture | Unknown | Less extraction of fossil fuel, utilized as mixed plastic, ink affinity, hydrophobicity, durablility, less dependence on petrochemical production, more convenient (less energy intensive) for chemical recycling (catalytic methods) than thermolysis | Relatively complex process for the reduction in variability in thermal and mechanical properties, hazardous solvent utilization, expensive conversion process (isolation and purification), less effective mechanical properties than conventional recycled material | Flexible packaging, bin liners, carrier bags, tubes, agricultural mulch film, agricultural sheet, construction film, cling-film, heavy-duty sacks |
Polypropylene/polypropene (PP) |  | Auto parts, industrial fibers, food containers, etc. | Strength, toughness, resistance to heat, chemicals, grease and oil, versatility, barrier to moisture | Unknown | Less extraction of fossil fuel, utilized as mixed plastic, reduced volume to landfill, convenient and less toxic component utilization in processing, lucrative applications in multiple advanced technologies | Relatively complex process for the reduction in variability in thermal and mechanical properties, fiber quality is less purified than recycled material, unwanted wax production affects equipment, toxic production process for nanoparticles | Pipes, pallets, boxes, furniture, car parts, pots of yogurt, buckets, butter, margarine, fibers, milk crates |
Polystyrene (PS)/expended Polystyrene (PS-E) |  | Food service packaging, disposable cups, tray pitchers, refrigerators, liners, etc. It may also be used as cushioning materials for fresh produce, electronic or appliance industries, etc. | Versatility, clarity, easy formation | Leaks toxic chemicals when heated | Less extraction of fossil fuel, utilized as mixed plastic, less dependence on petrochemical production, more convenient (less energy intensive) for chemical recycling (catalytic methods) than thermolysis | Expensive conversion process (isolation and purification), less effective mechanical properties than conventional recycled material | Clothes hangers, park benches, flowerpots, toys, spoons, cutlery, picture frames, seeding containers |
| Thermoset plastics |  | Thermoset plastics, multilayer and laminates, Bakelite, polycarbonate (PC), etc. | Stiffness, hardness, brittleness, chemical and stain resistance, good electrical insulators, non-remoldability | BPA | - | - | CDs, pallets, floors, roofs, furniture, sheeting, benches, shoe soles |
1.2. Research Motivation and Scope of the Article
1.3. Research Contribution of the Article
2. Research Methodology
3. Overview of Plastic Production and WASTE Management in India
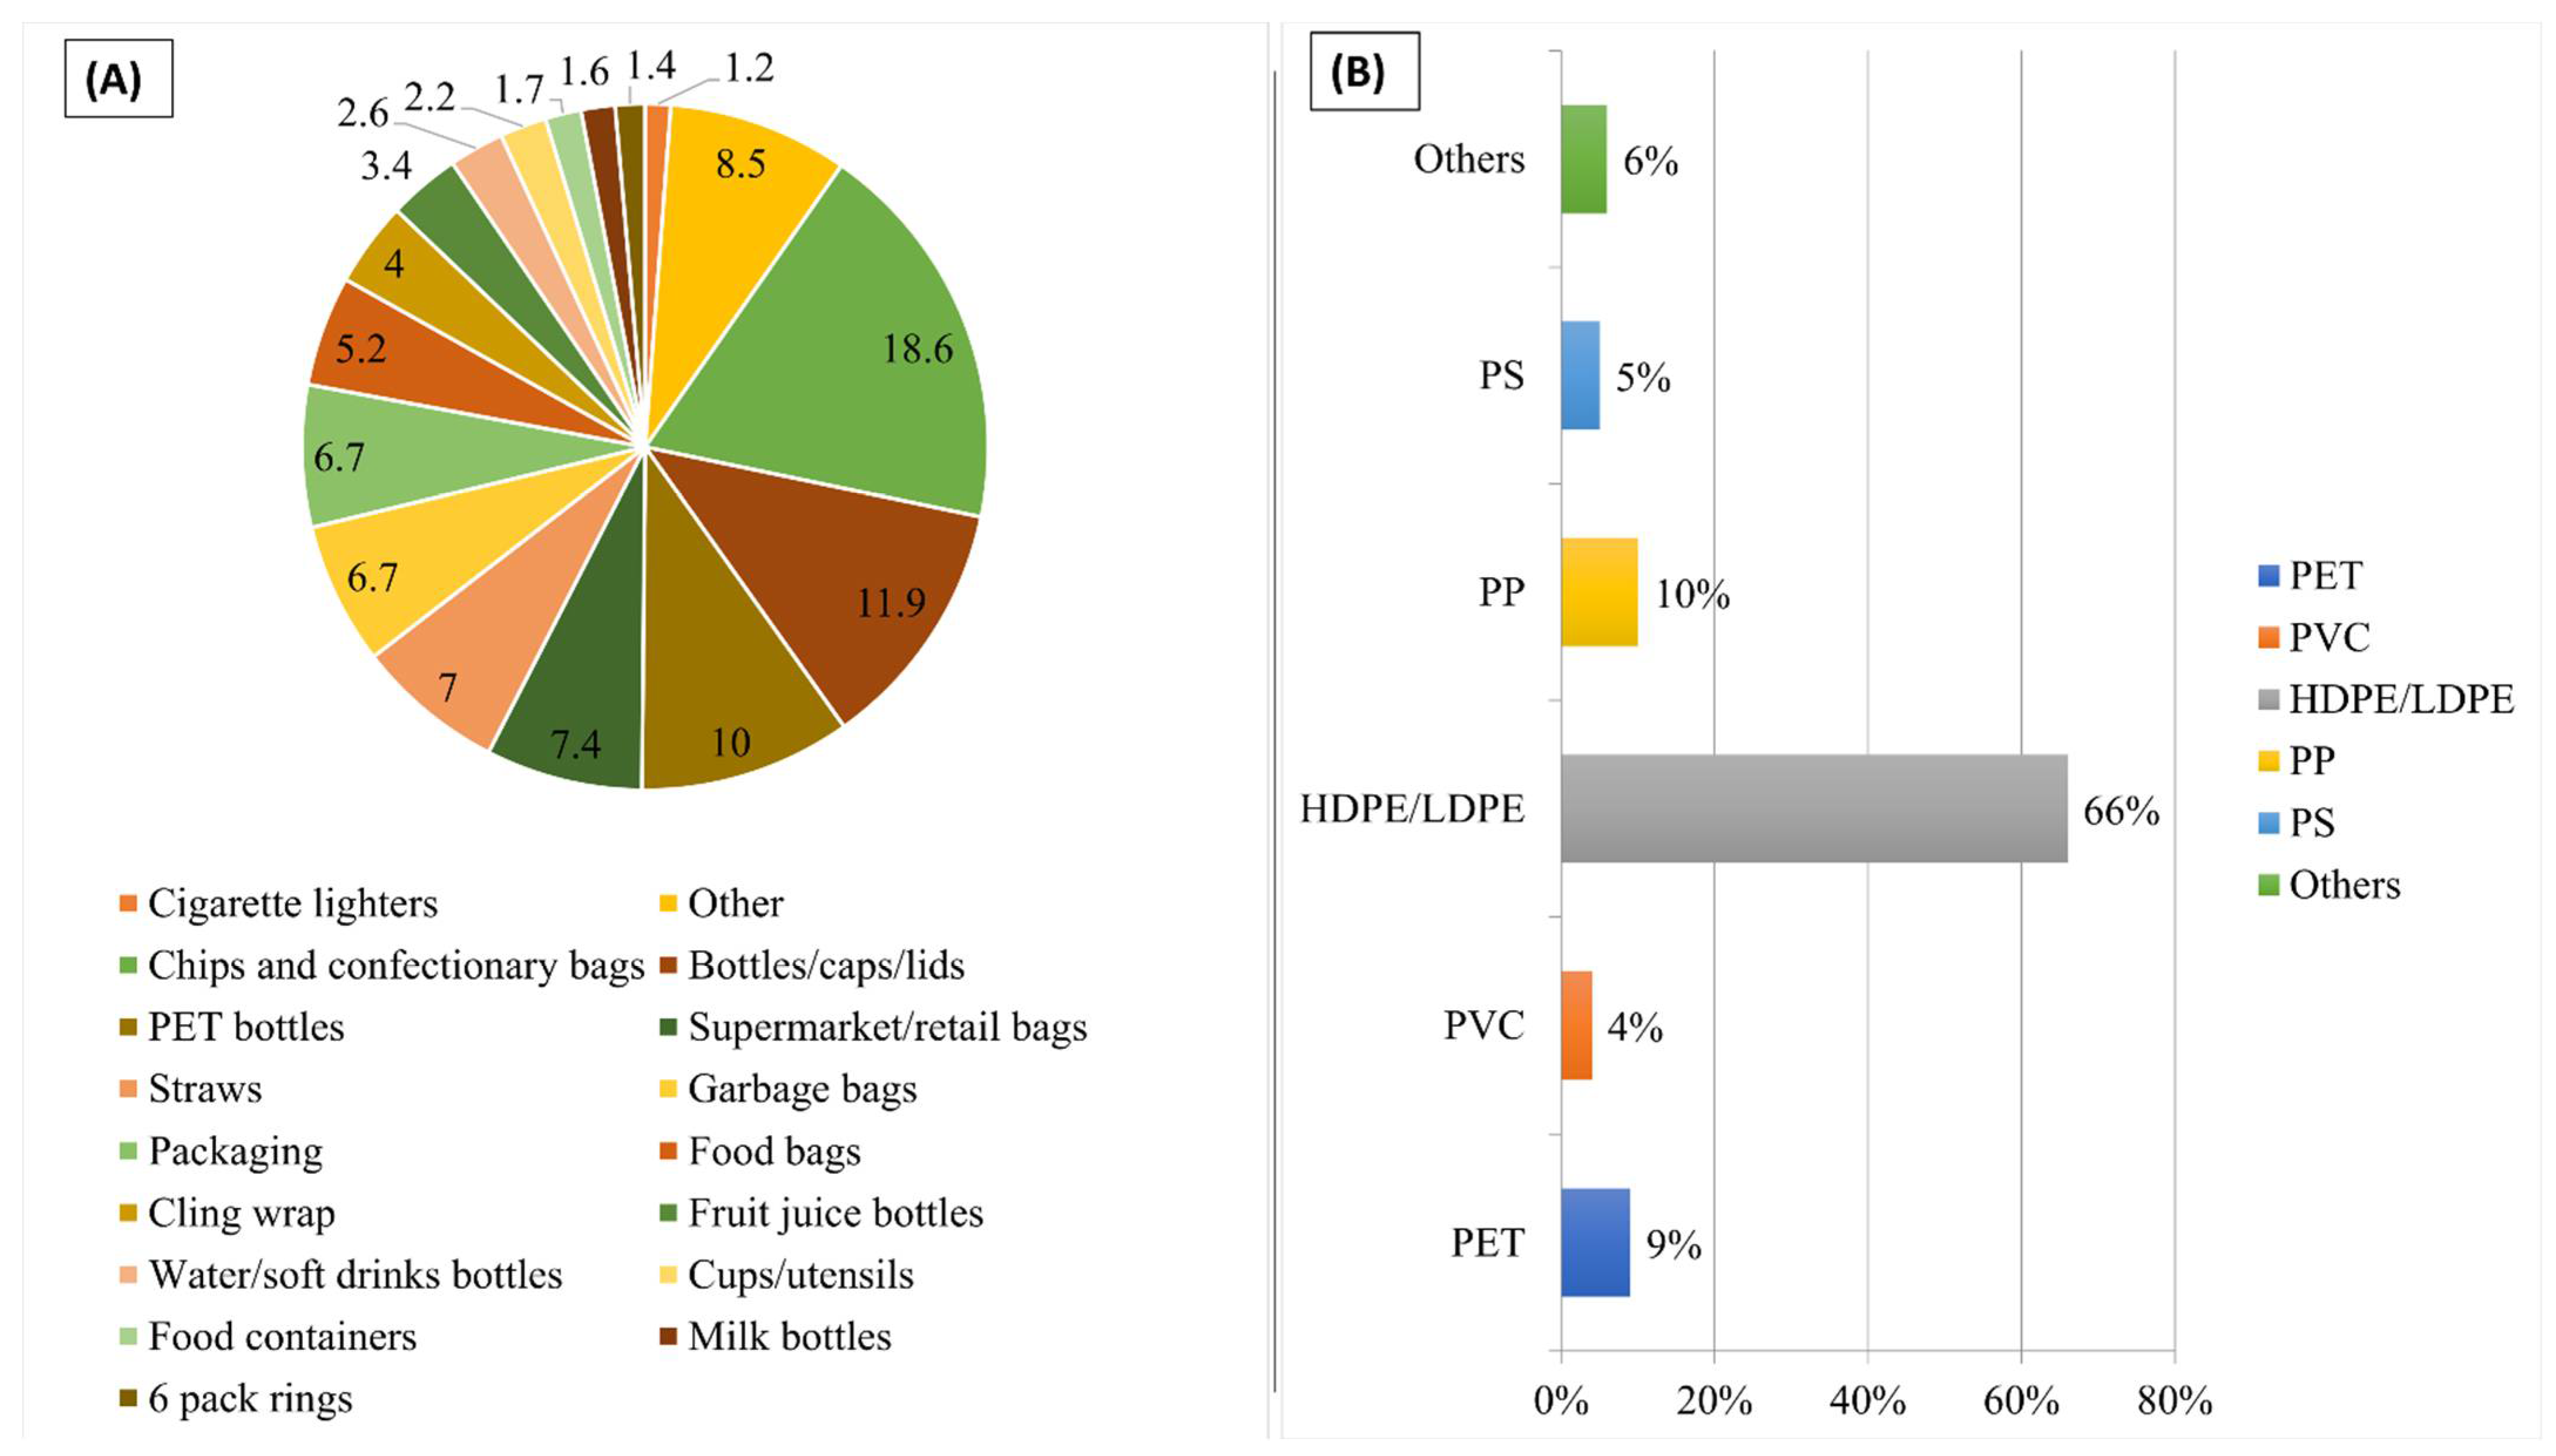
3.1. Categories and Sources of PW
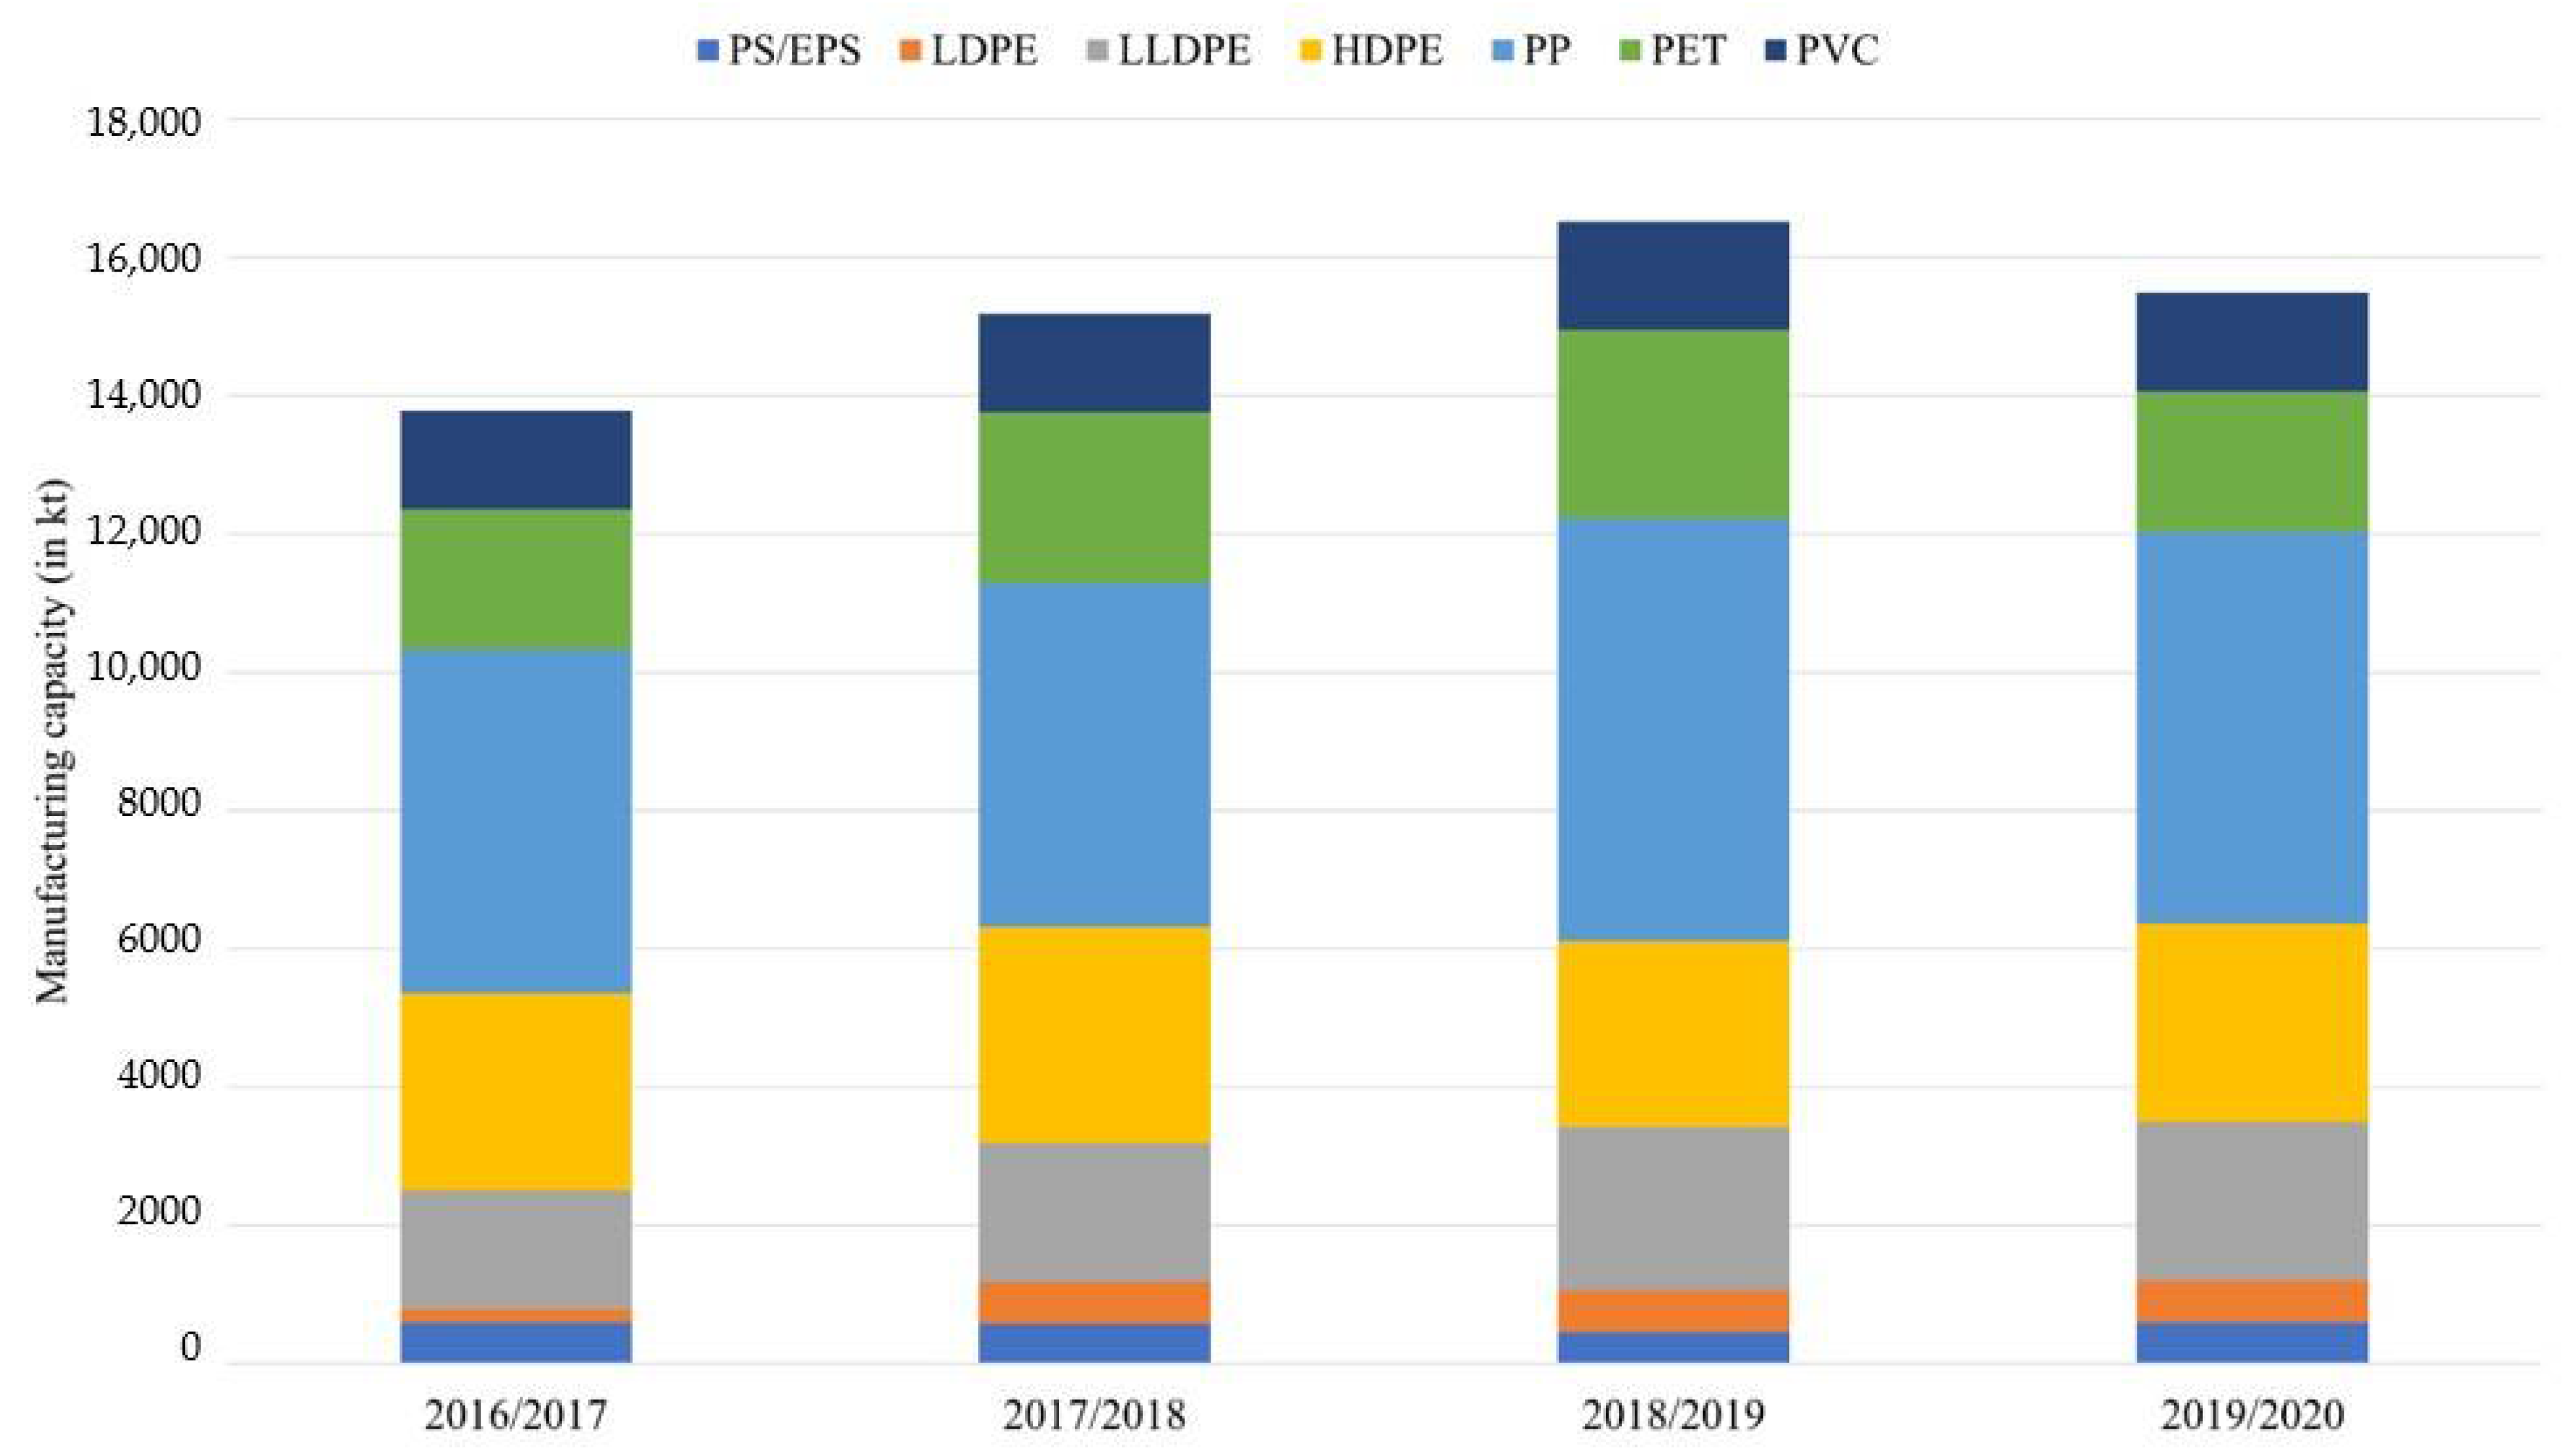
3.2. Plastic Production Industry and Consumption in India
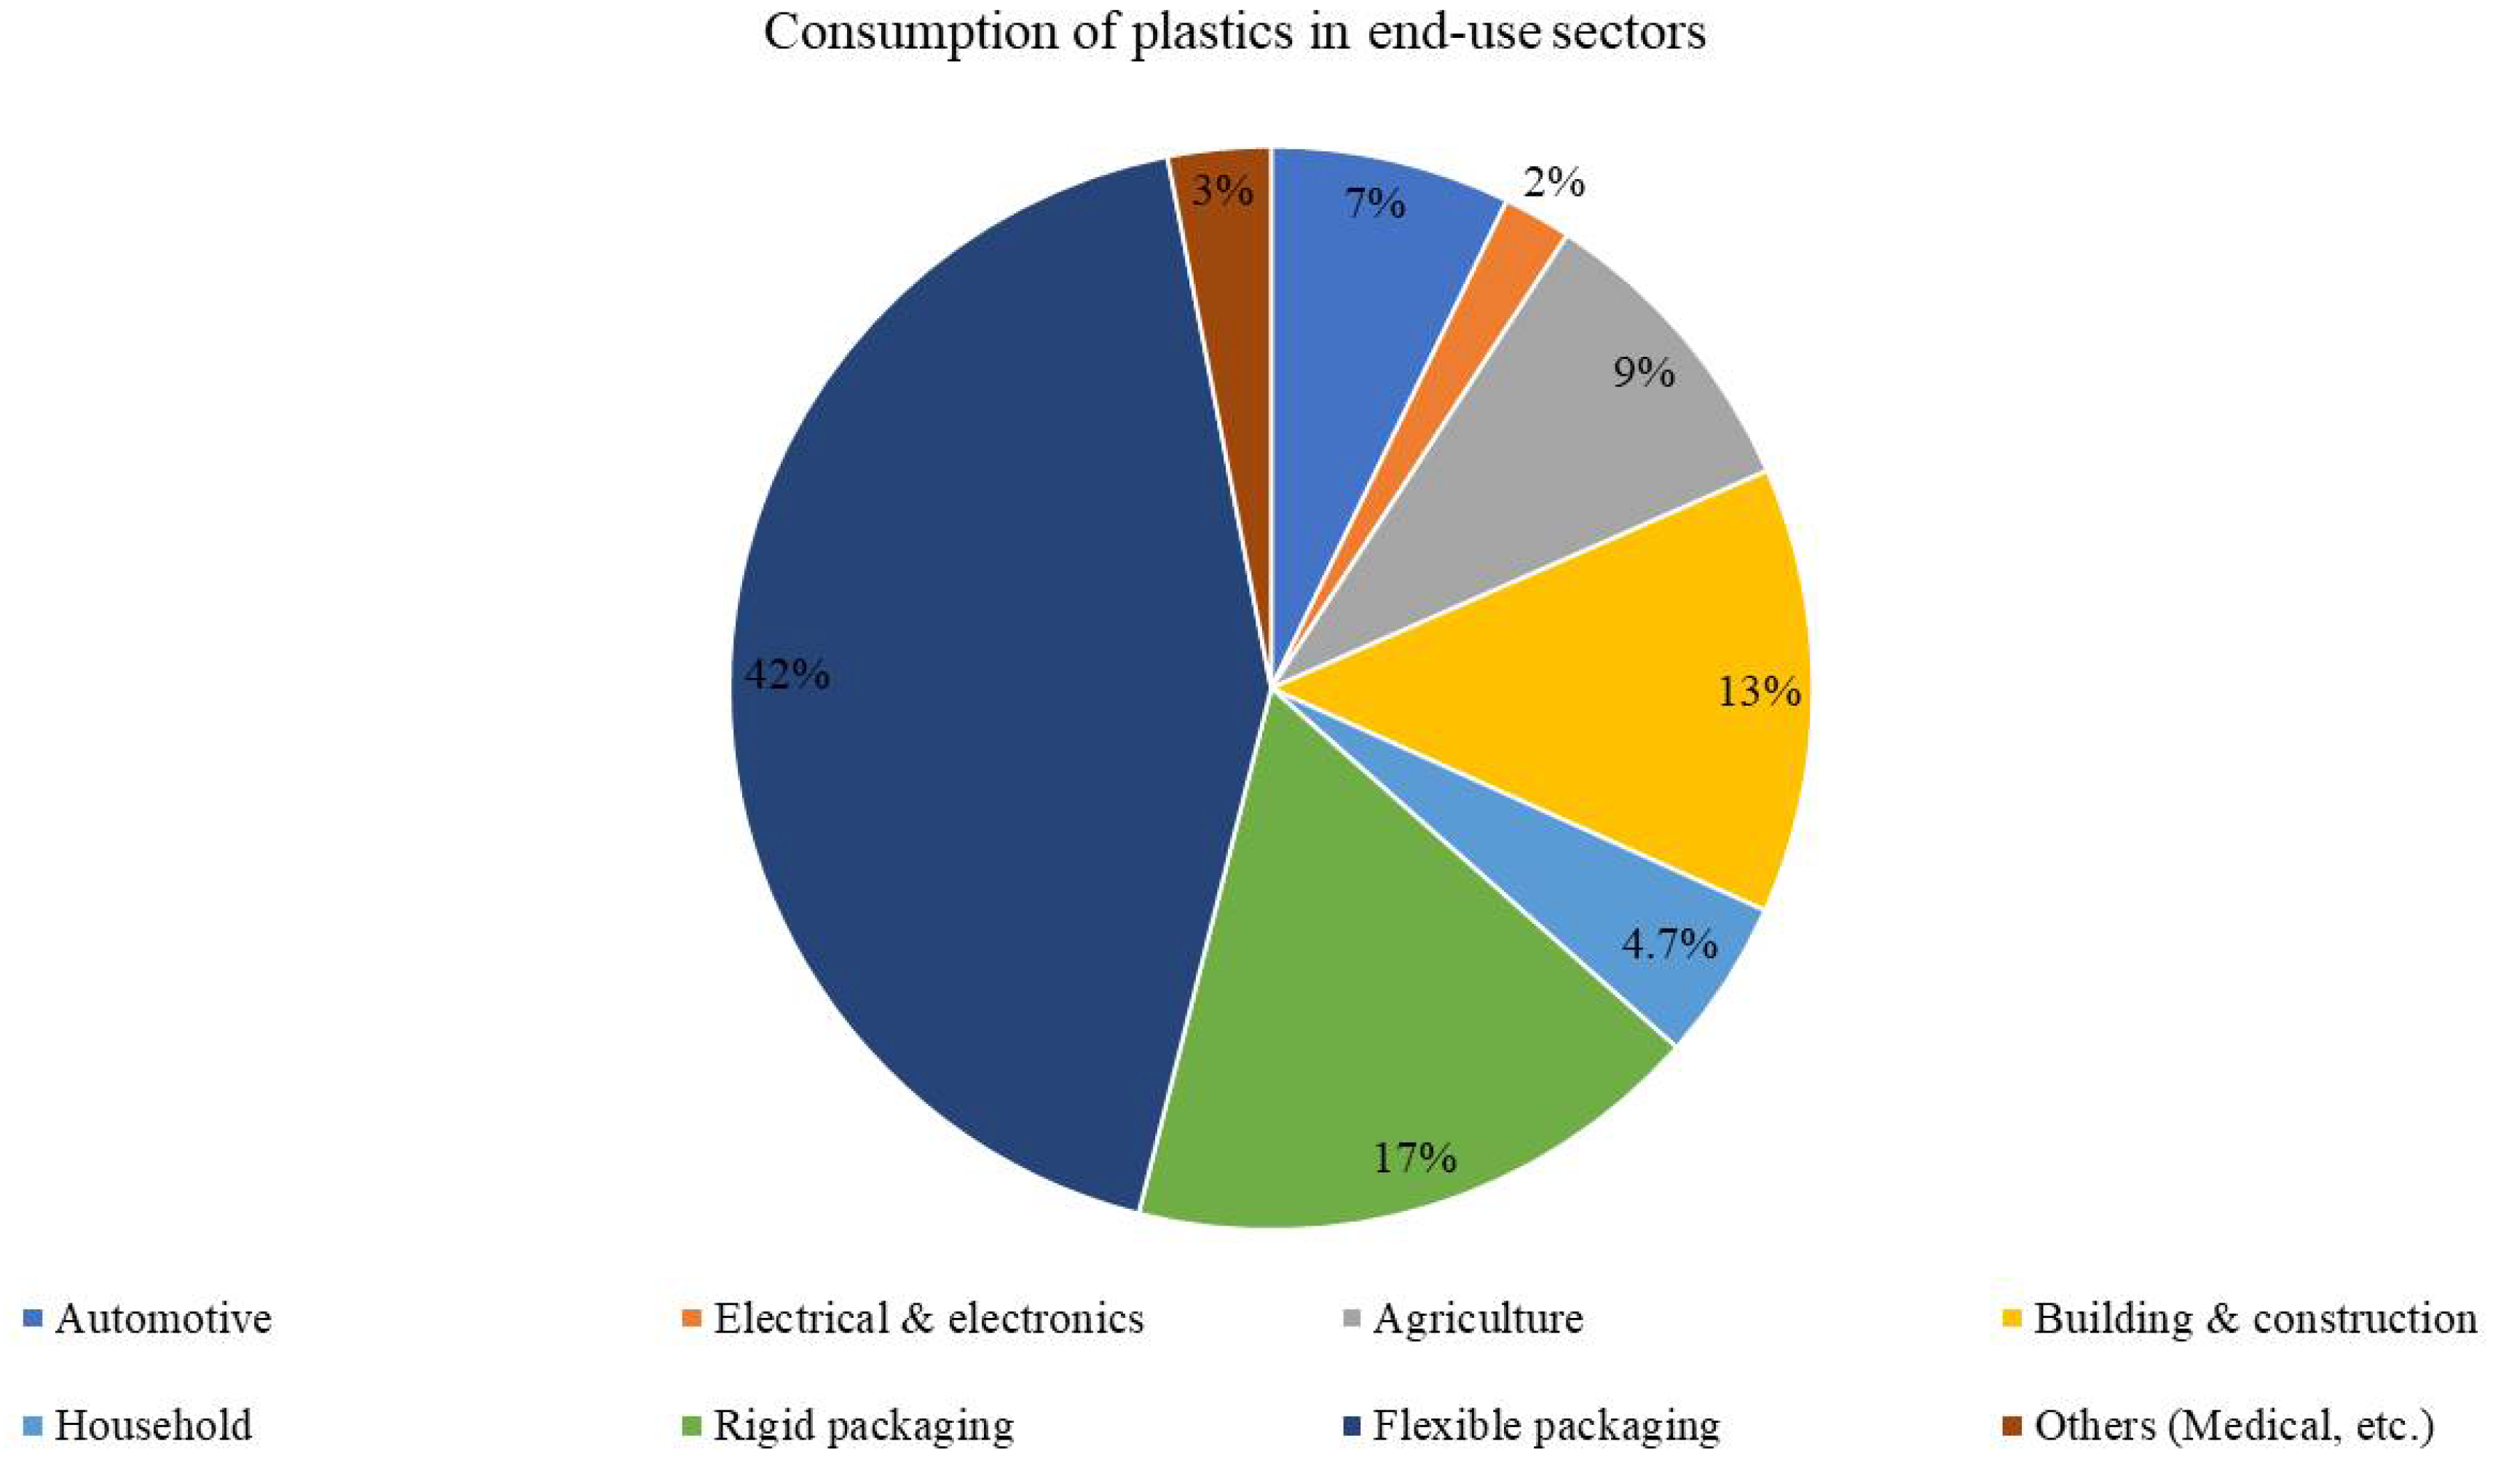
3.3. Plastic Consumption by Sectors
3.3.1. Packaging Industry
3.3.2. Agricultural Sector
3.3.3. Construction and Infrastructure
3.3.4. Automobile Manufacturing Sector
3.3.5. Plastics from the Biomedical Sector
3.3.6. Electrical and Electronic Equipment (EEE) Manufacturing Industry
3.3.7. Solar PV and LED Manufacturing Sector
3.4. Assessment on PW Management and Generation in India
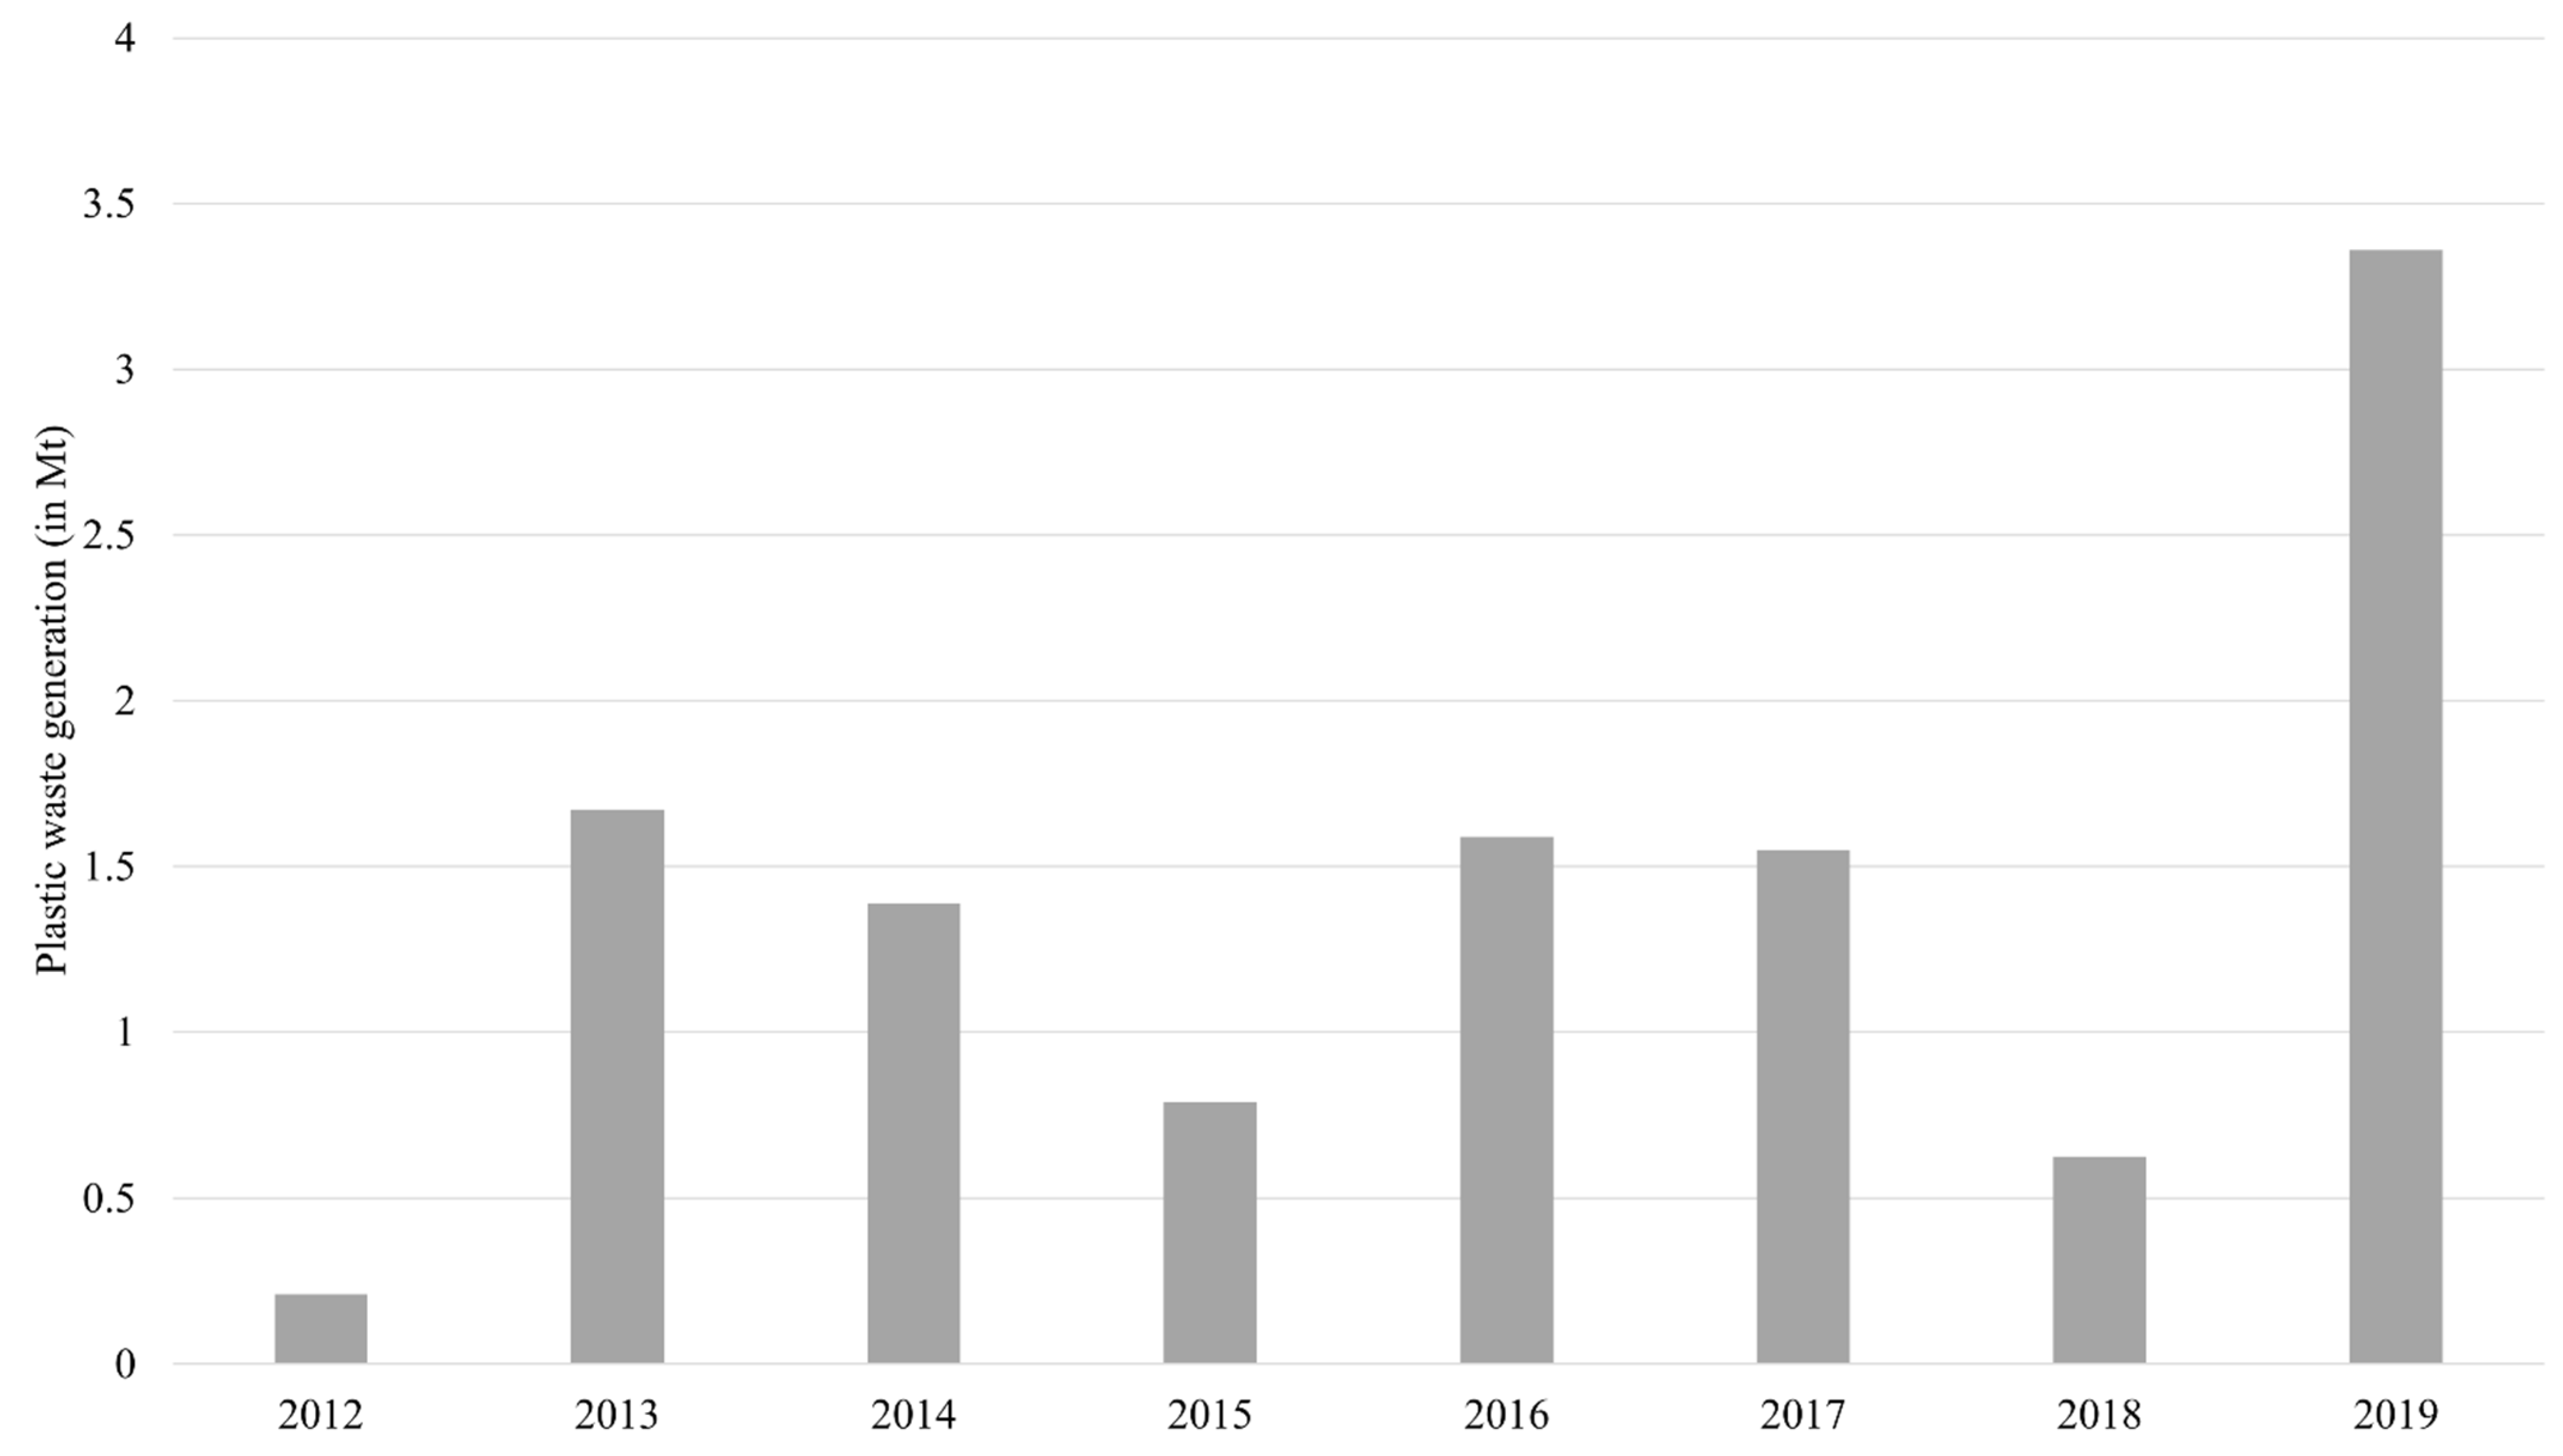
3.4.1. PW Generation in India
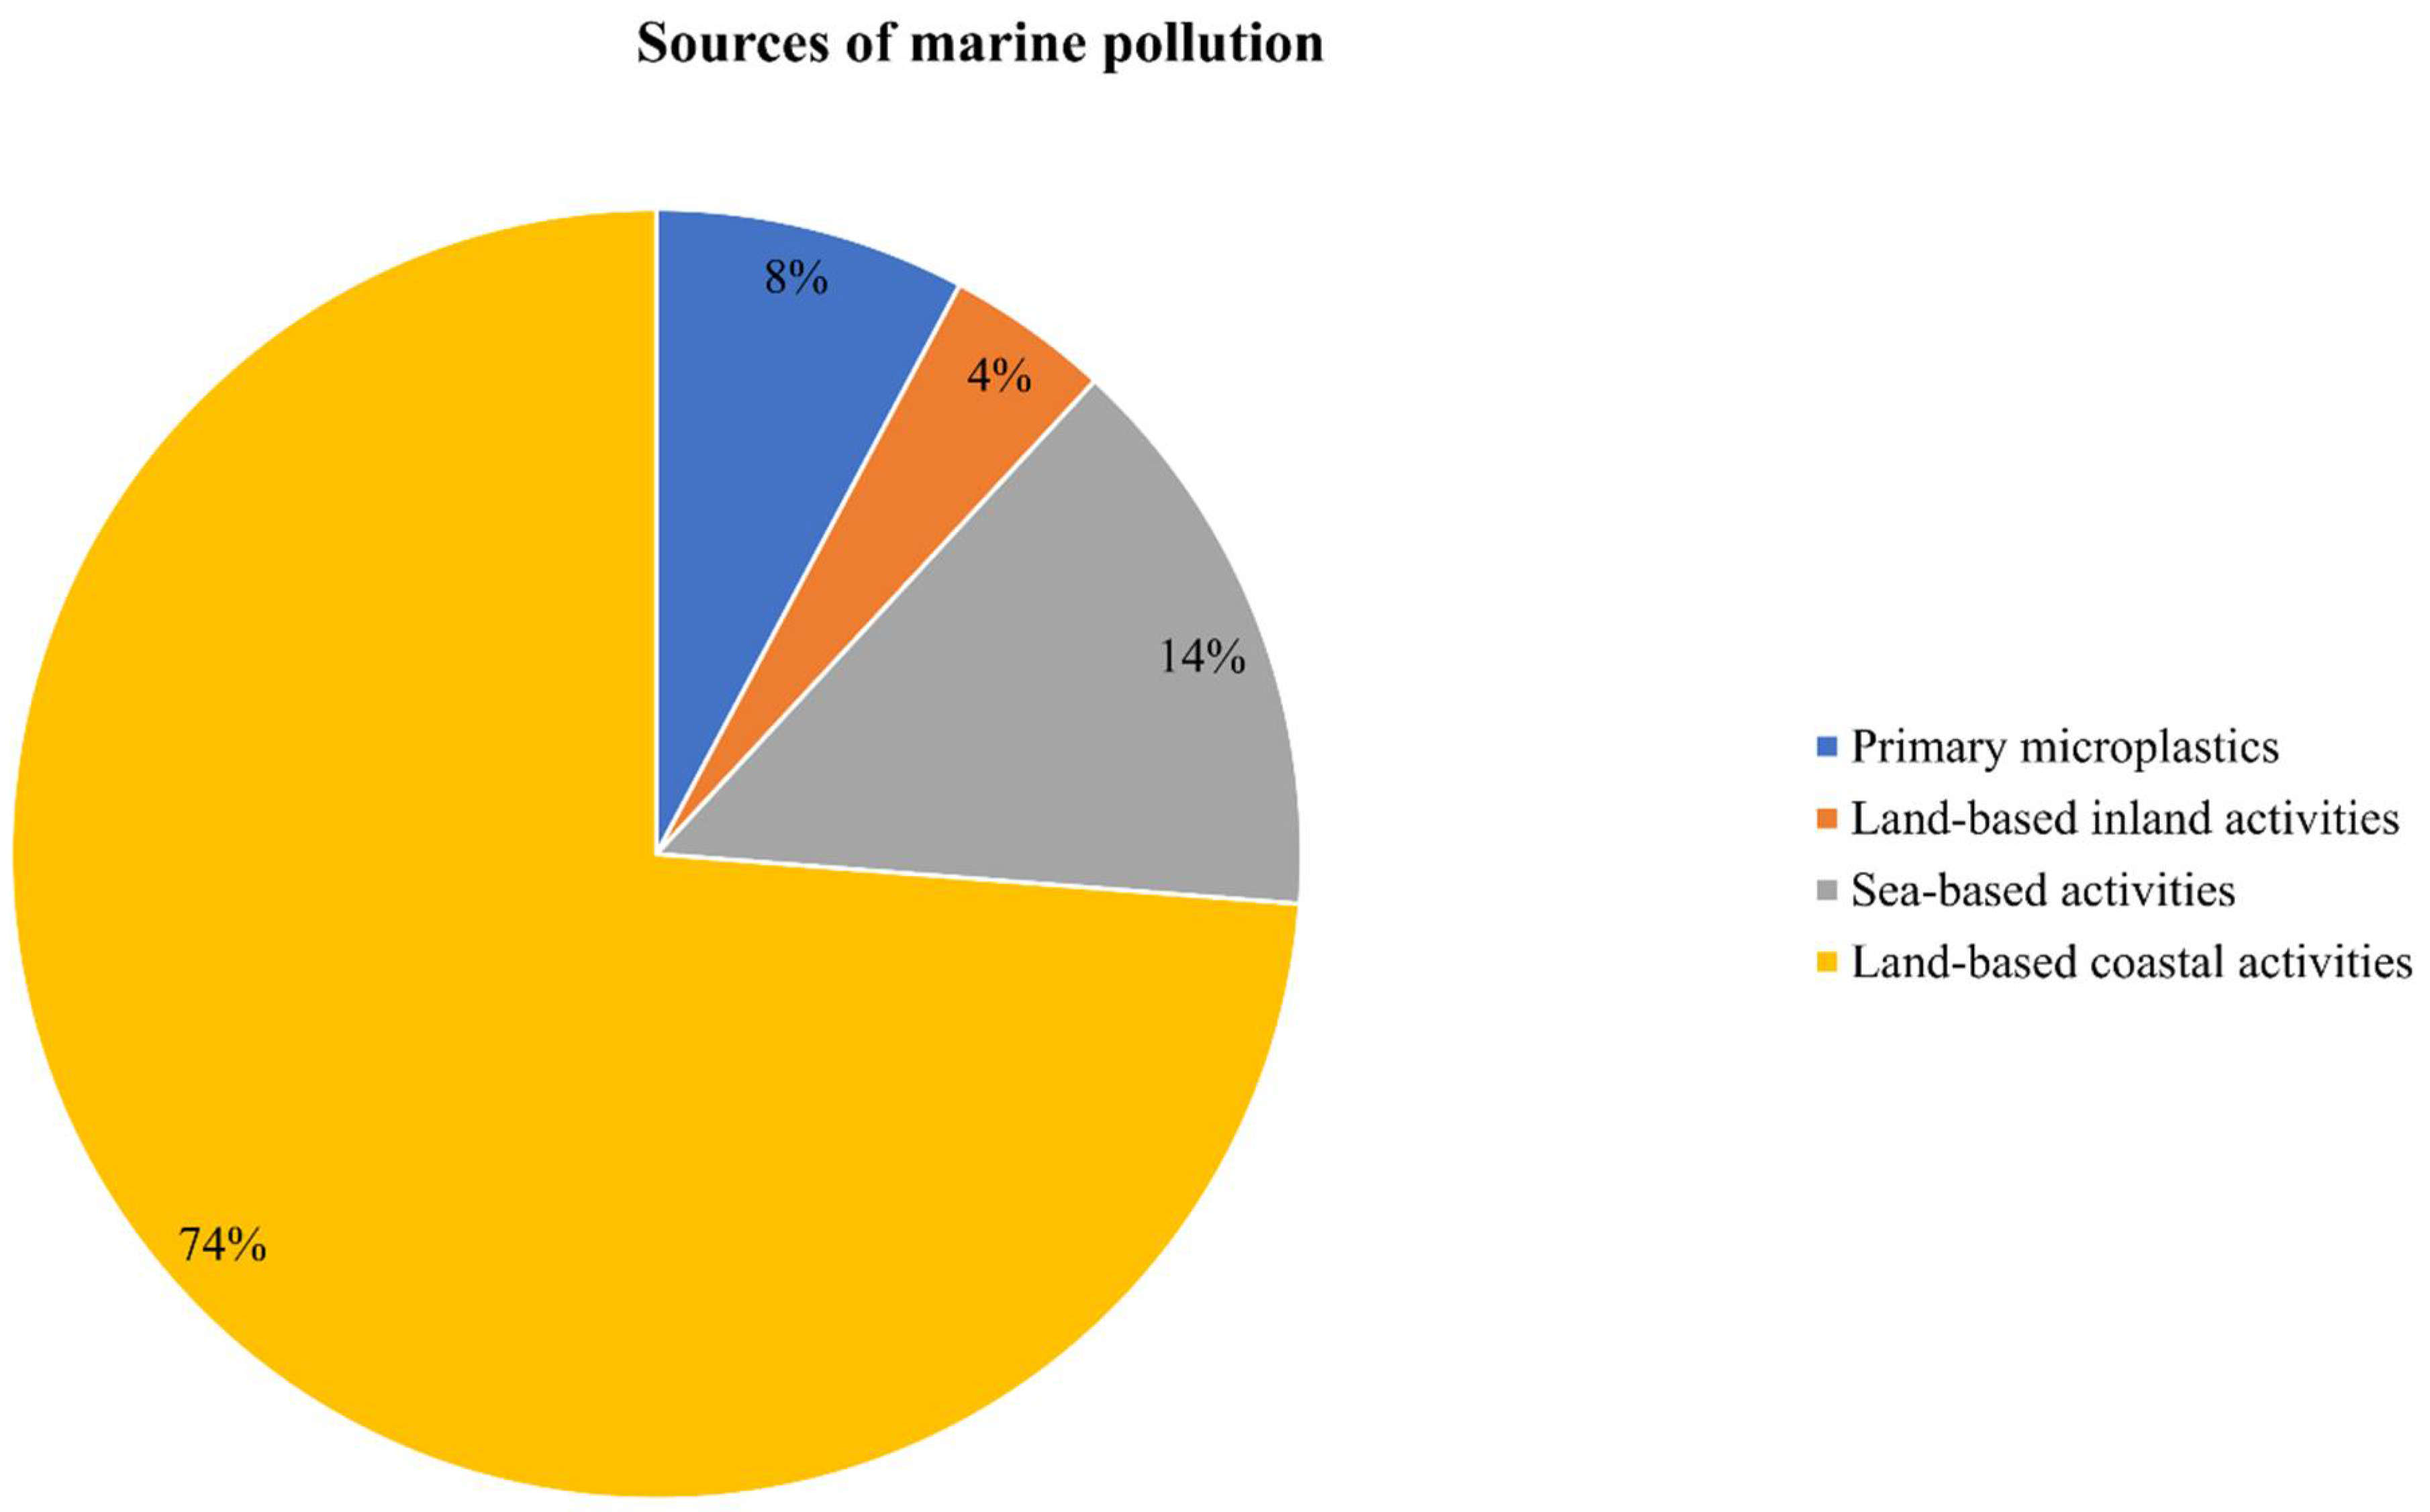
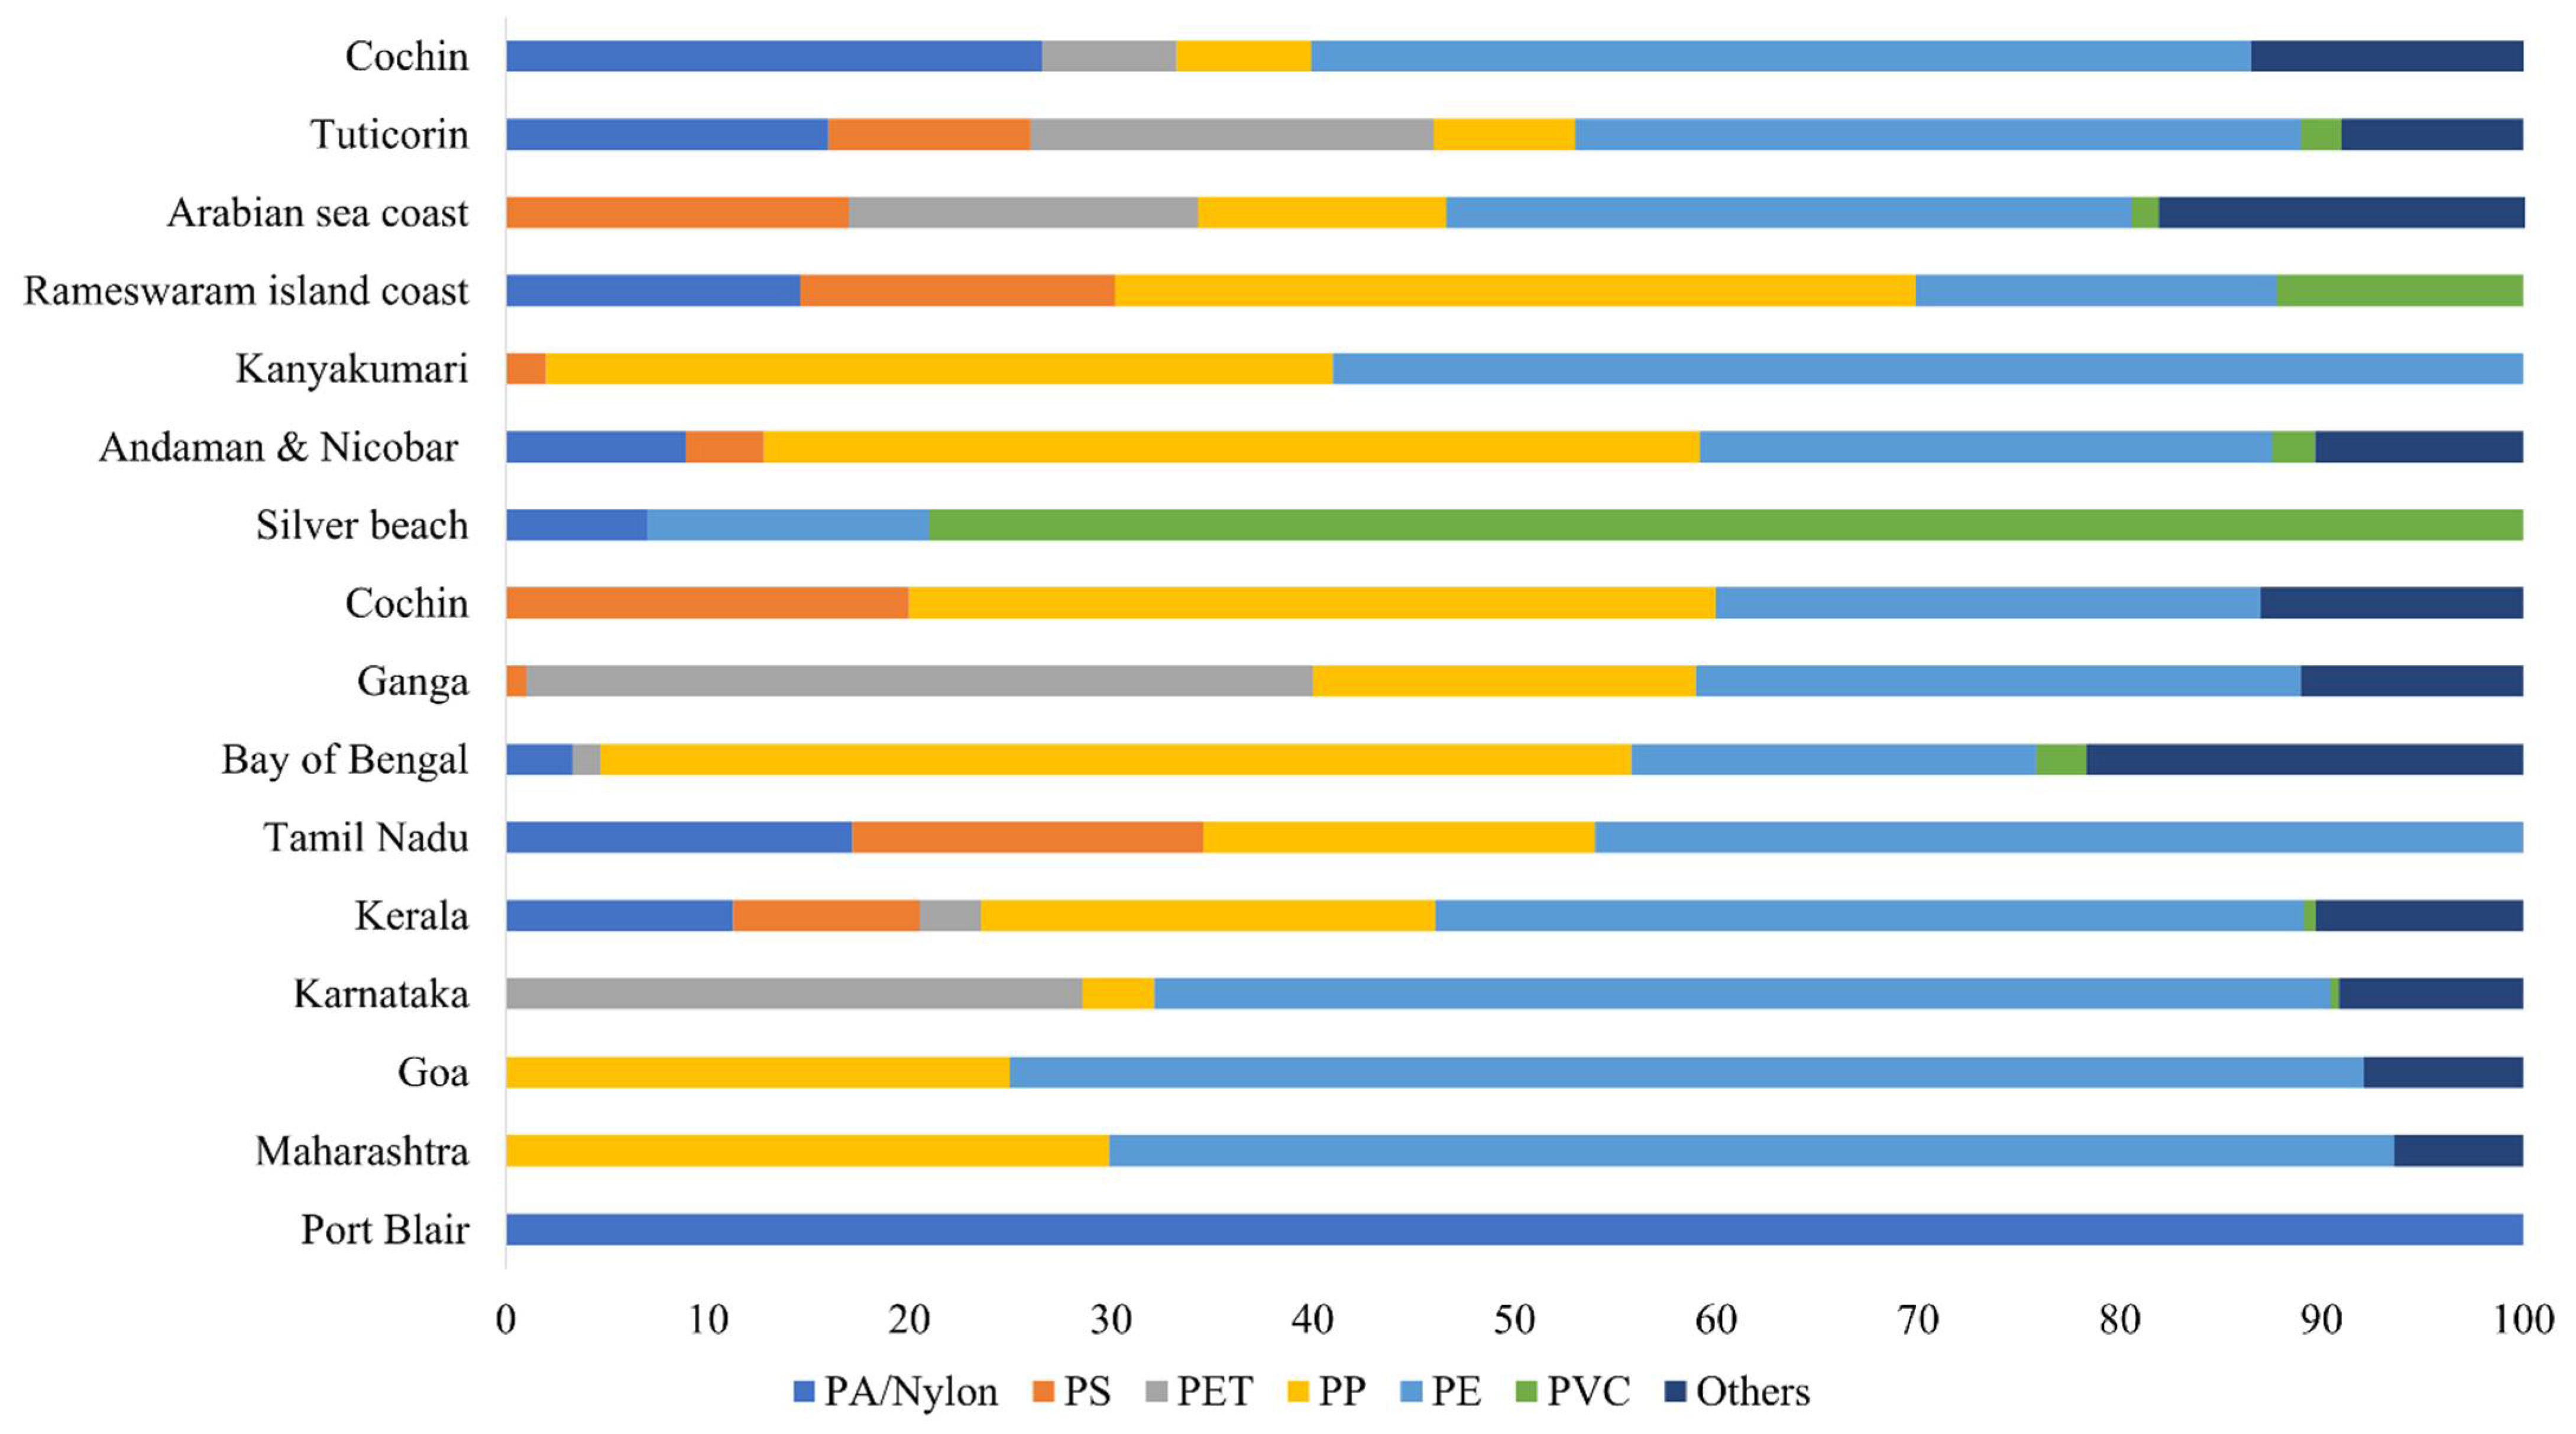
3.5. Aquatic Pollution and Microplastics in India
Microplastics as Pollutants
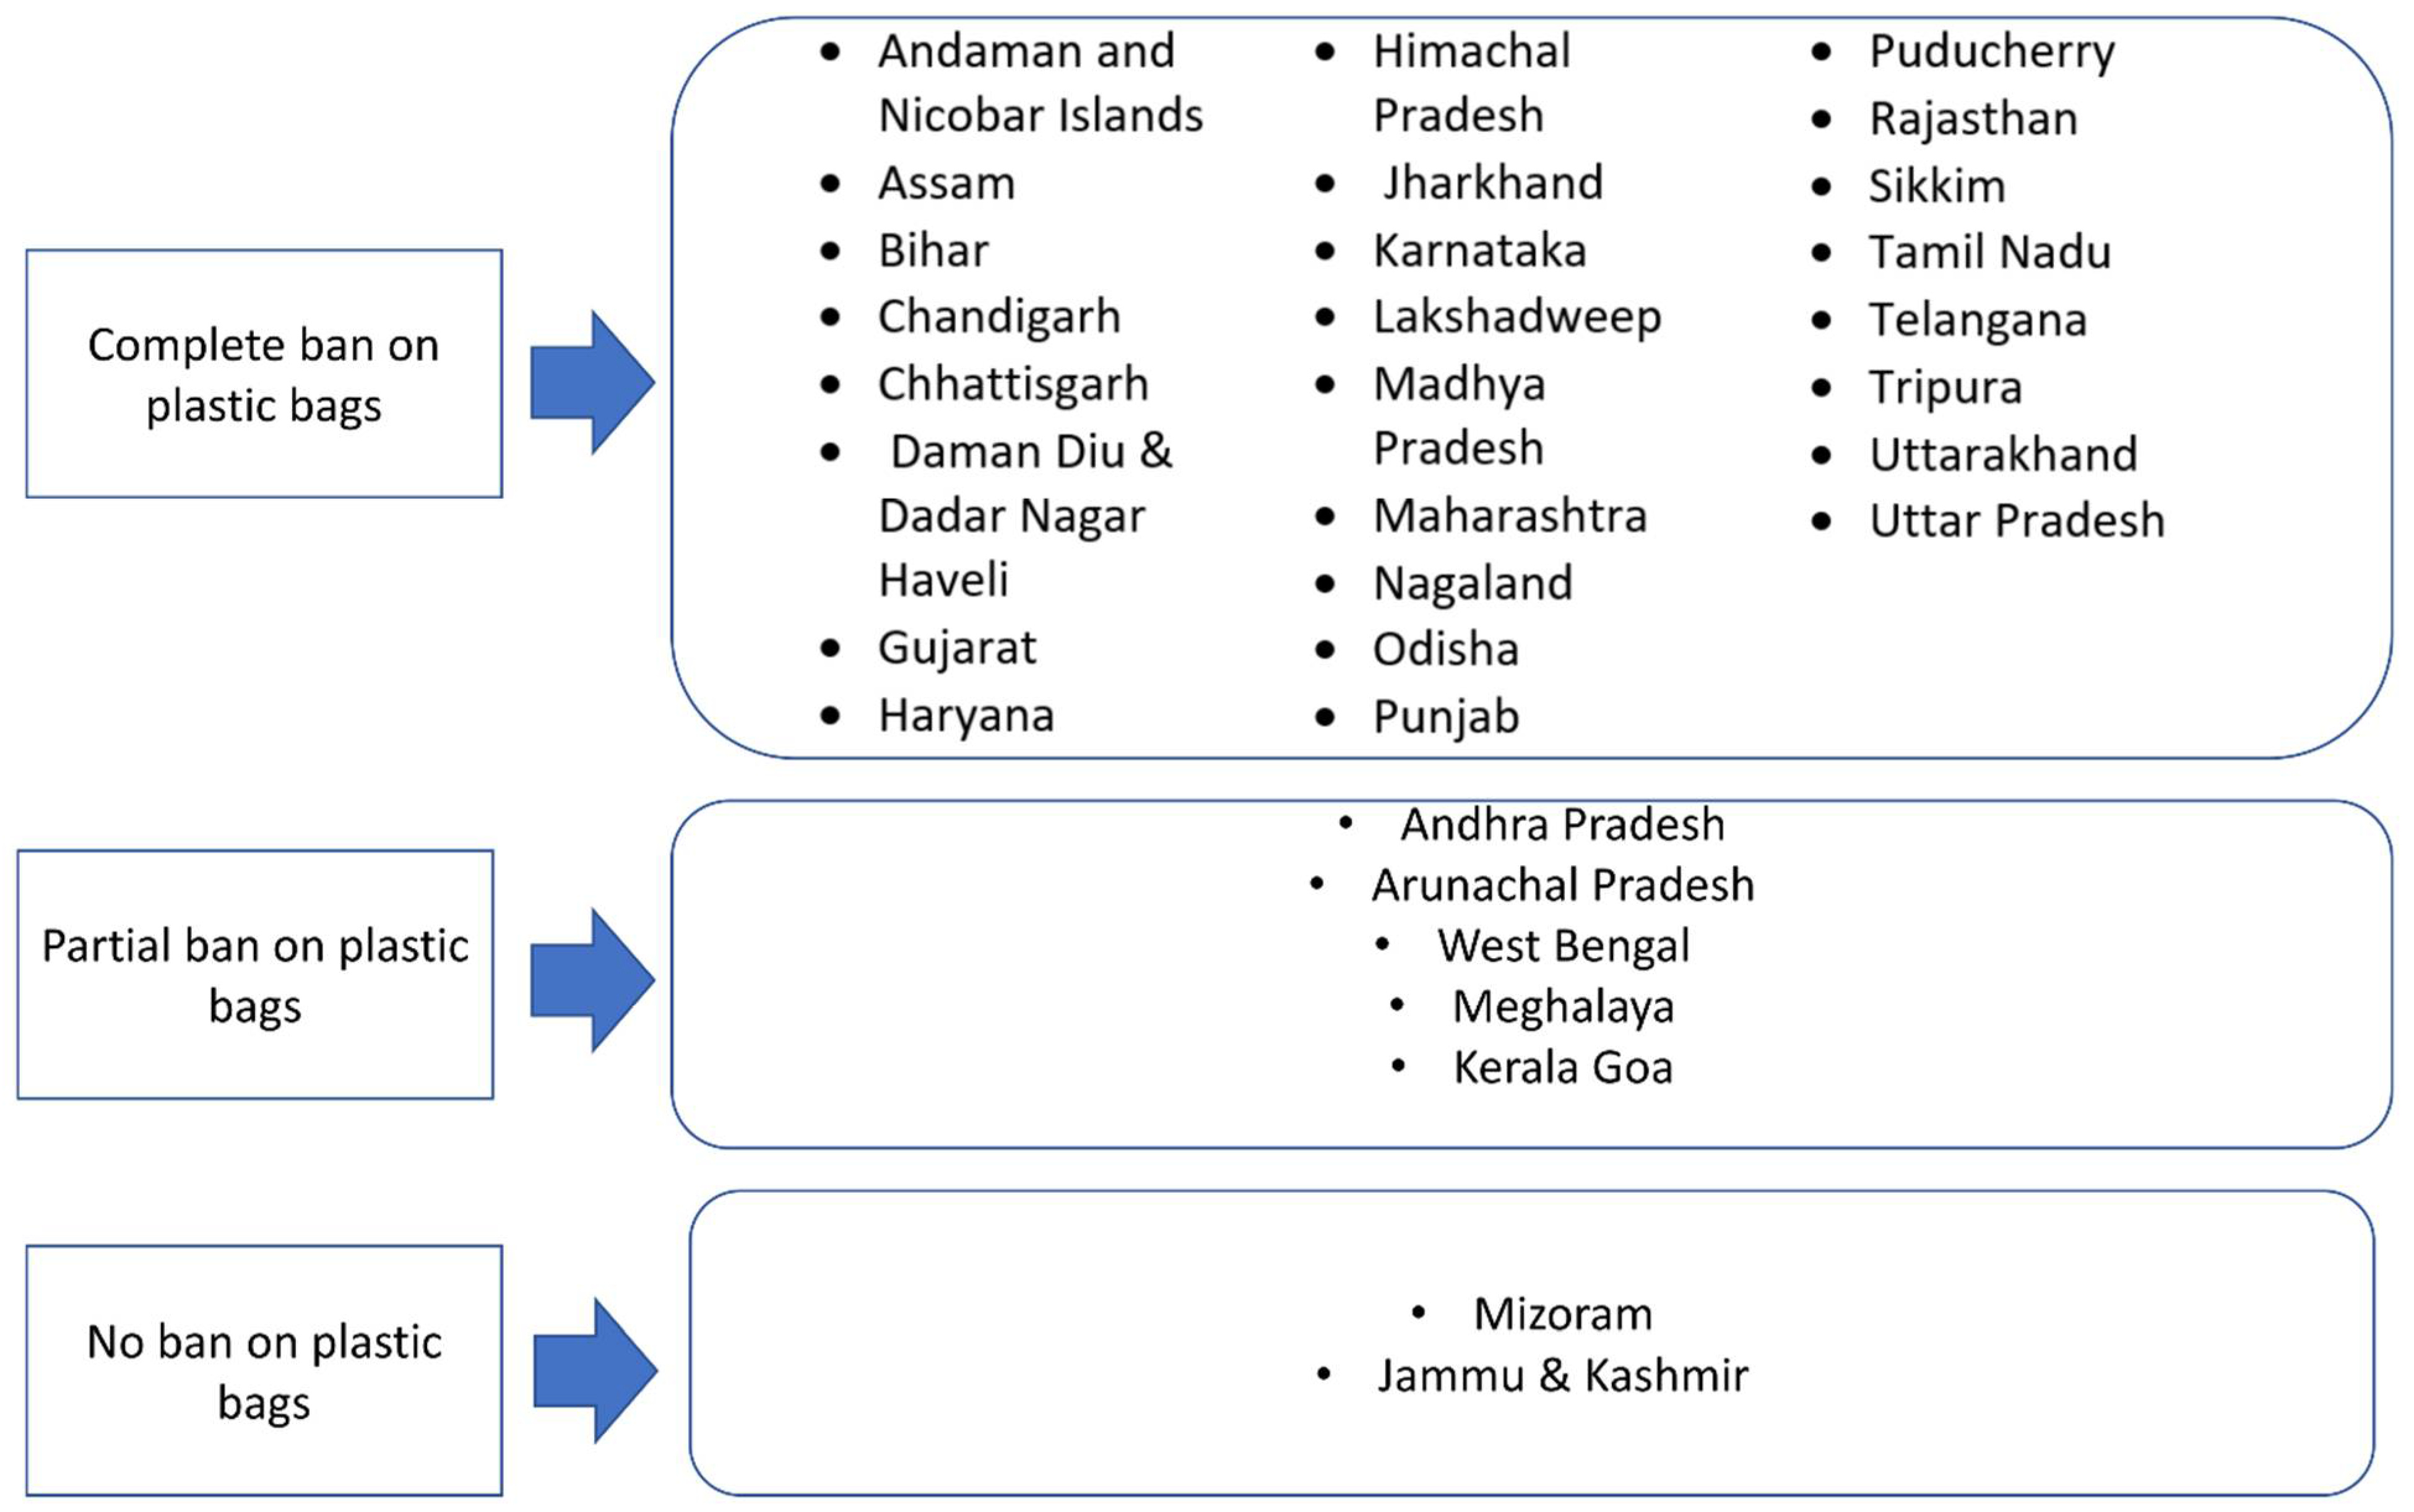
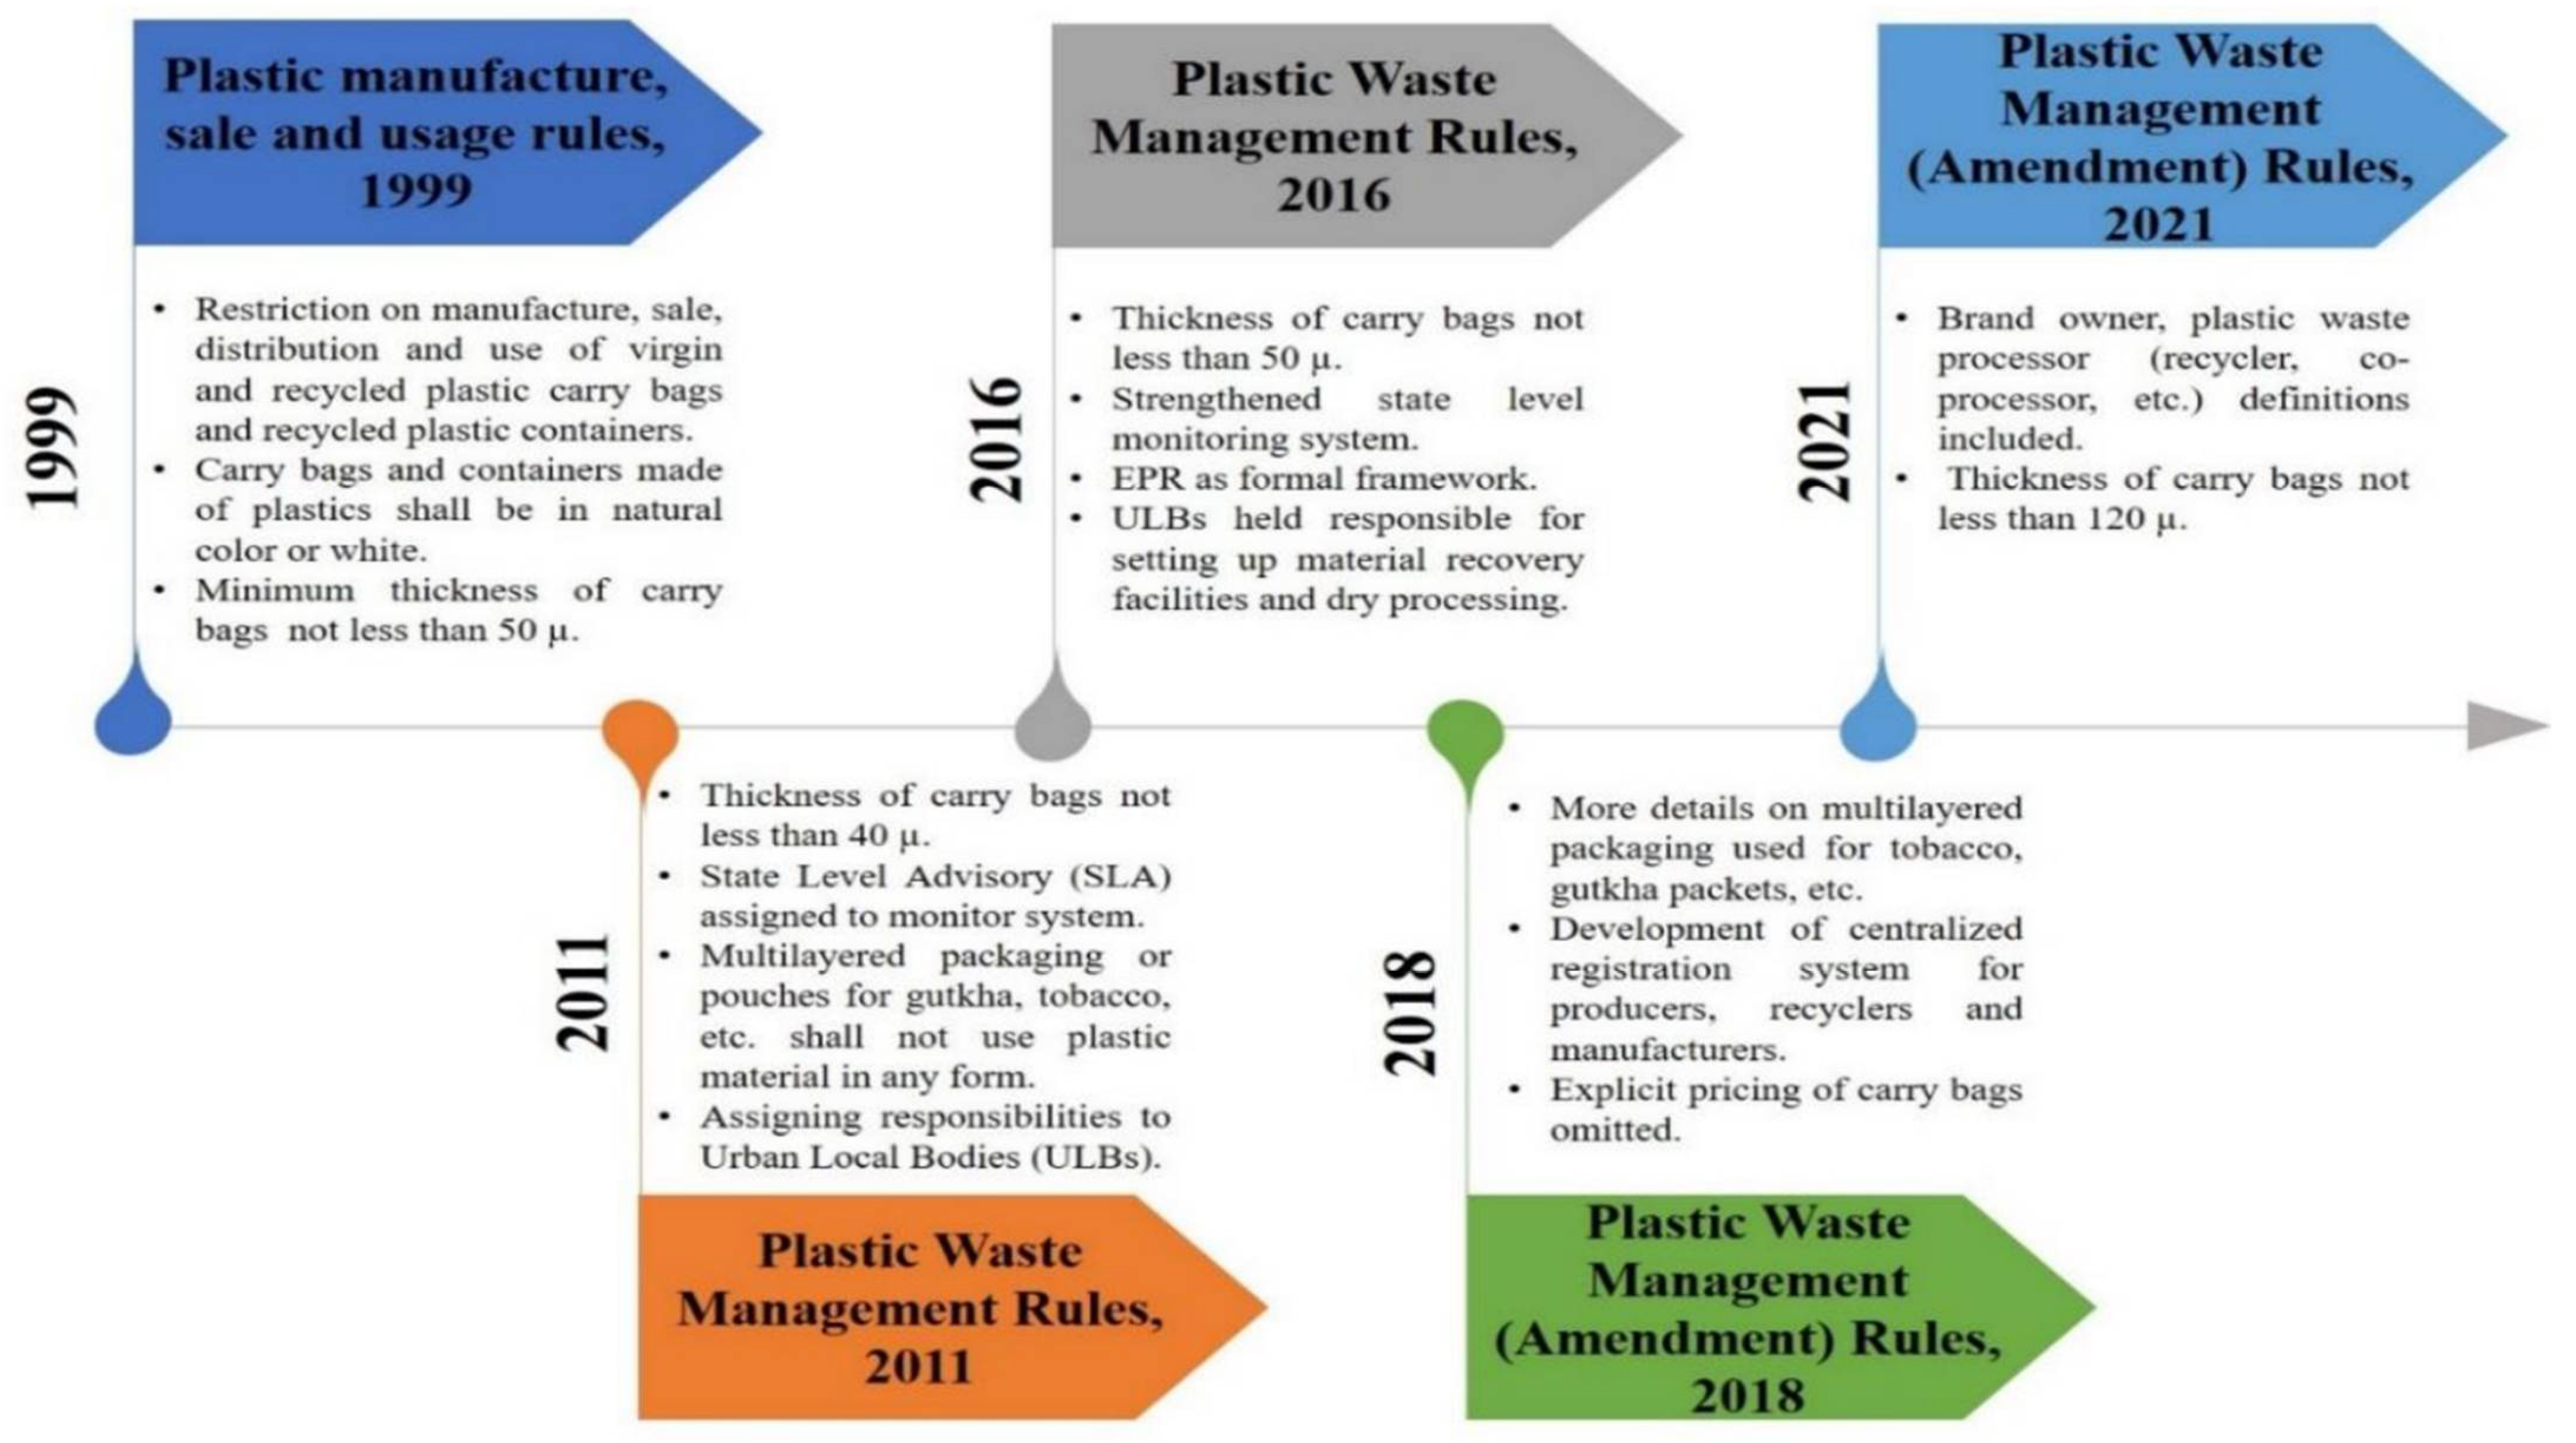
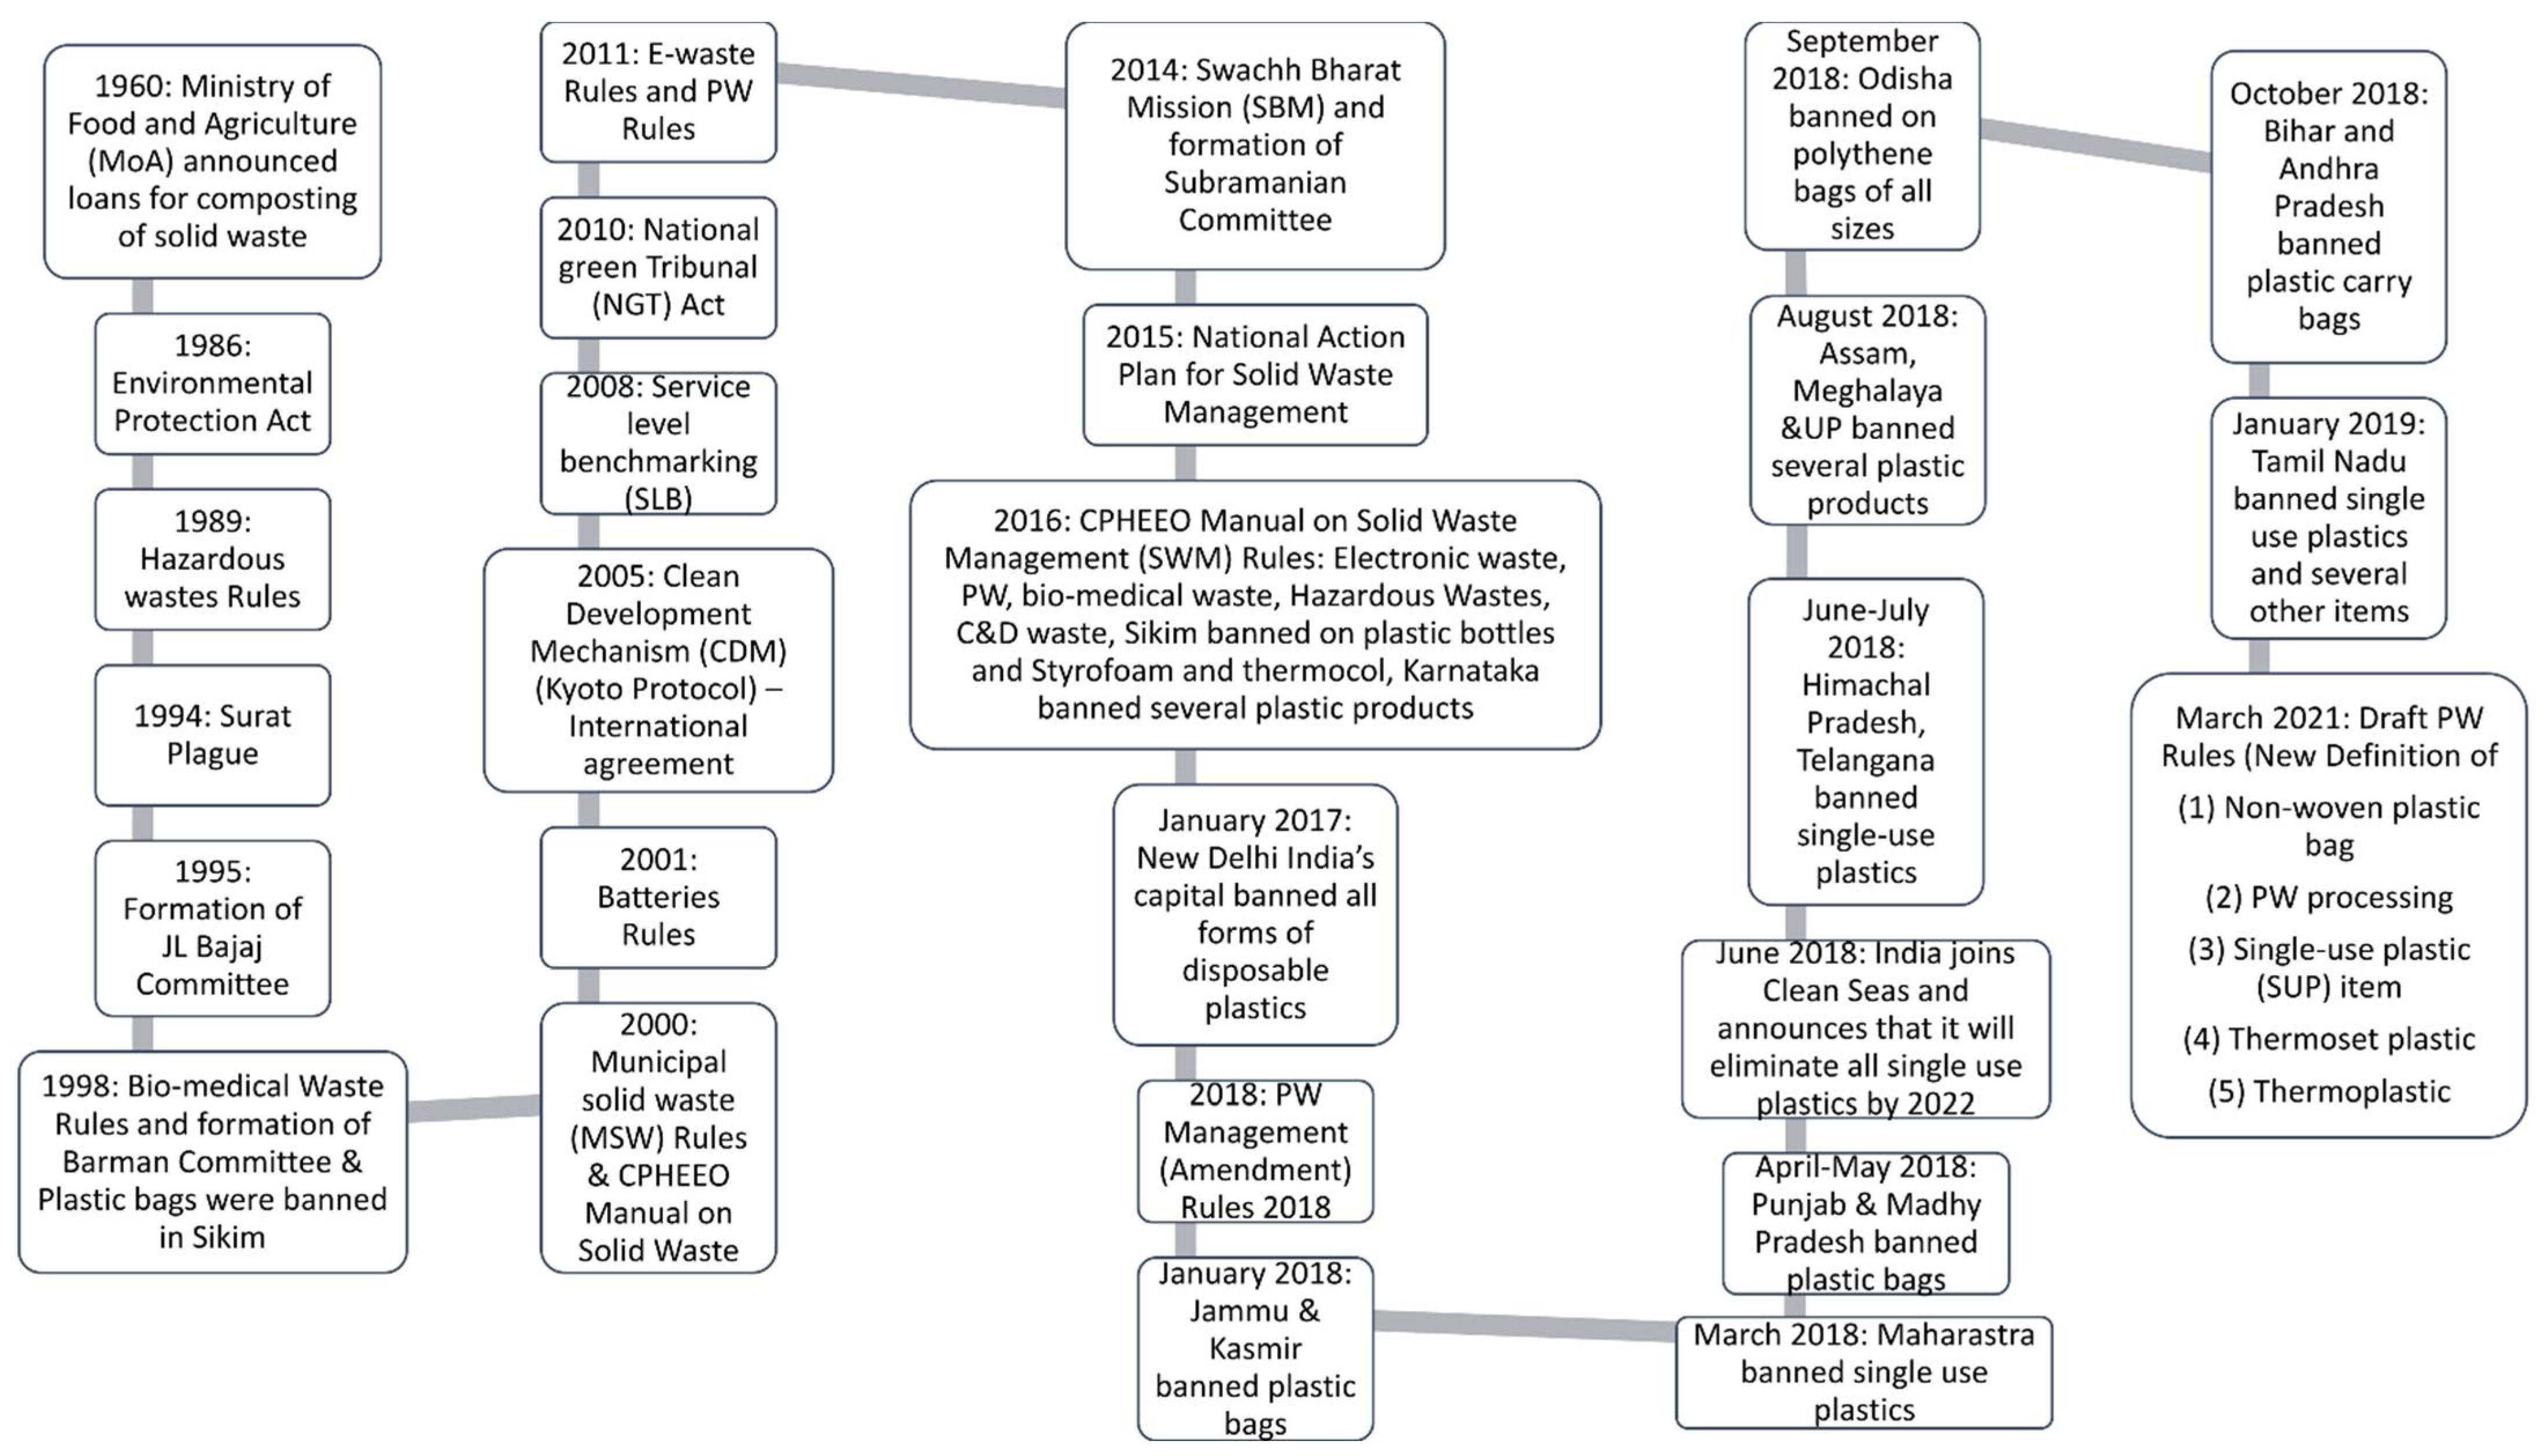
3.6. PW Management Rules in India
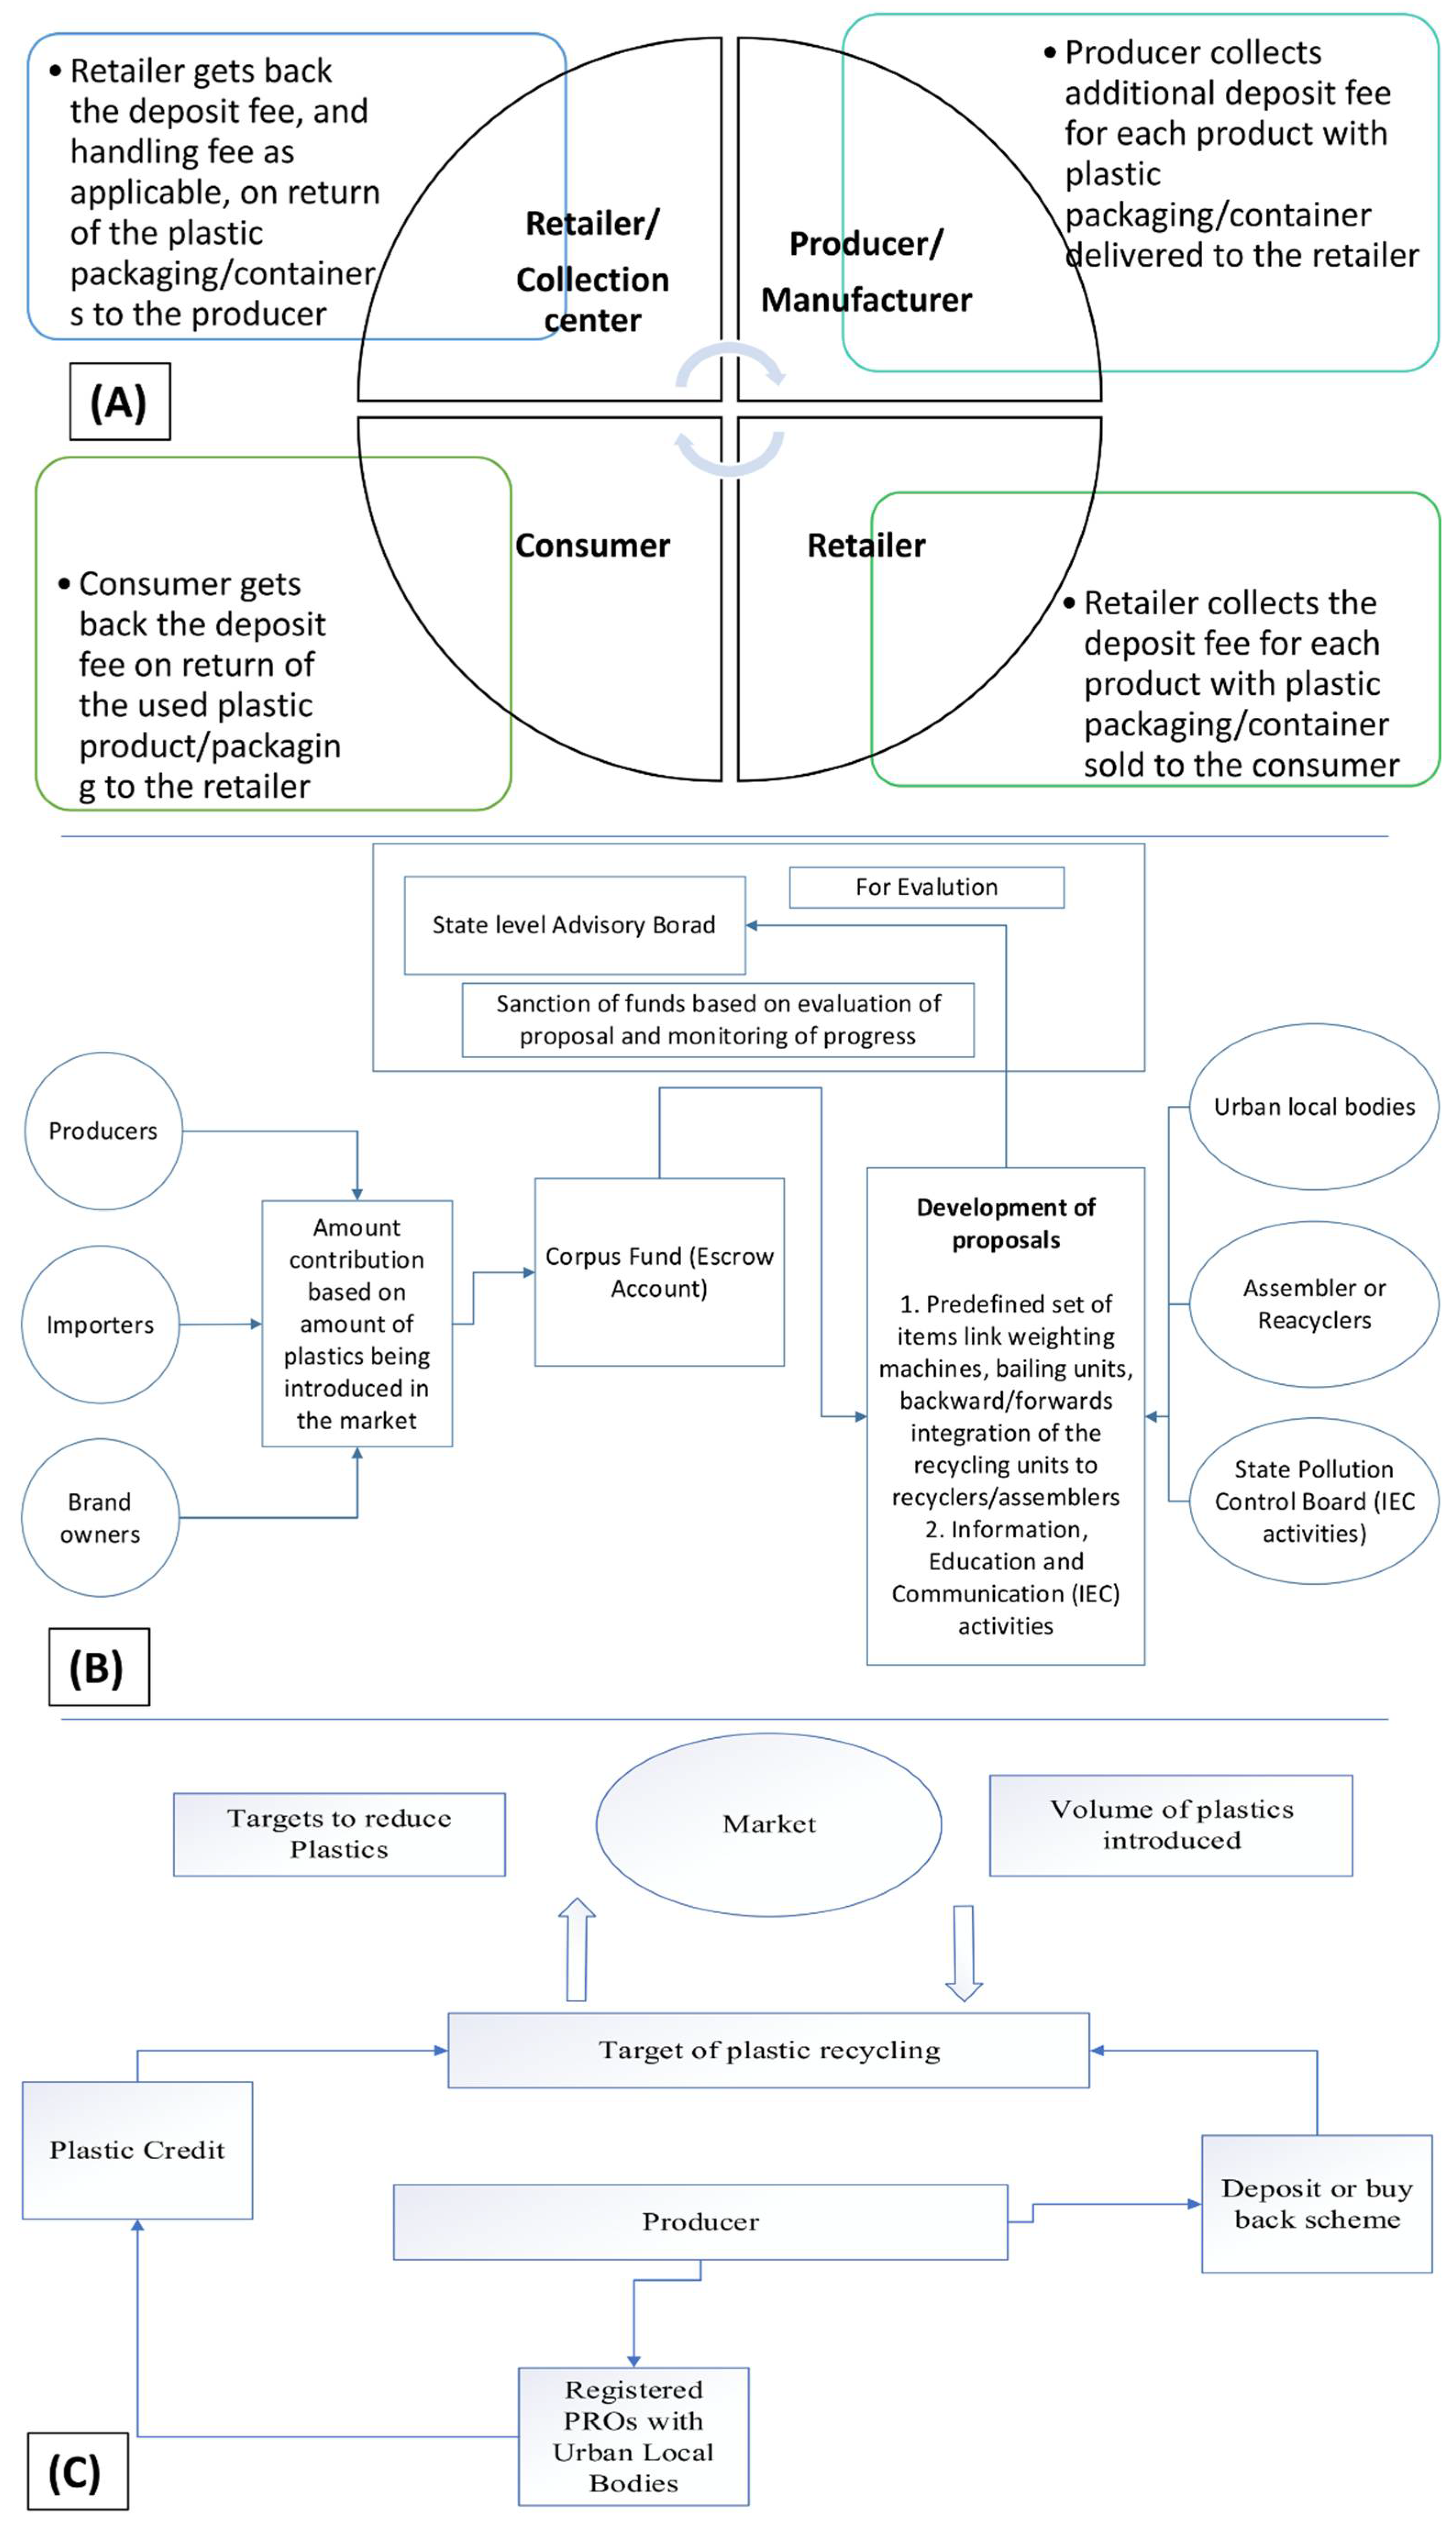
3.7. Extended Producer Responsibility (EPR)
4. Discussion
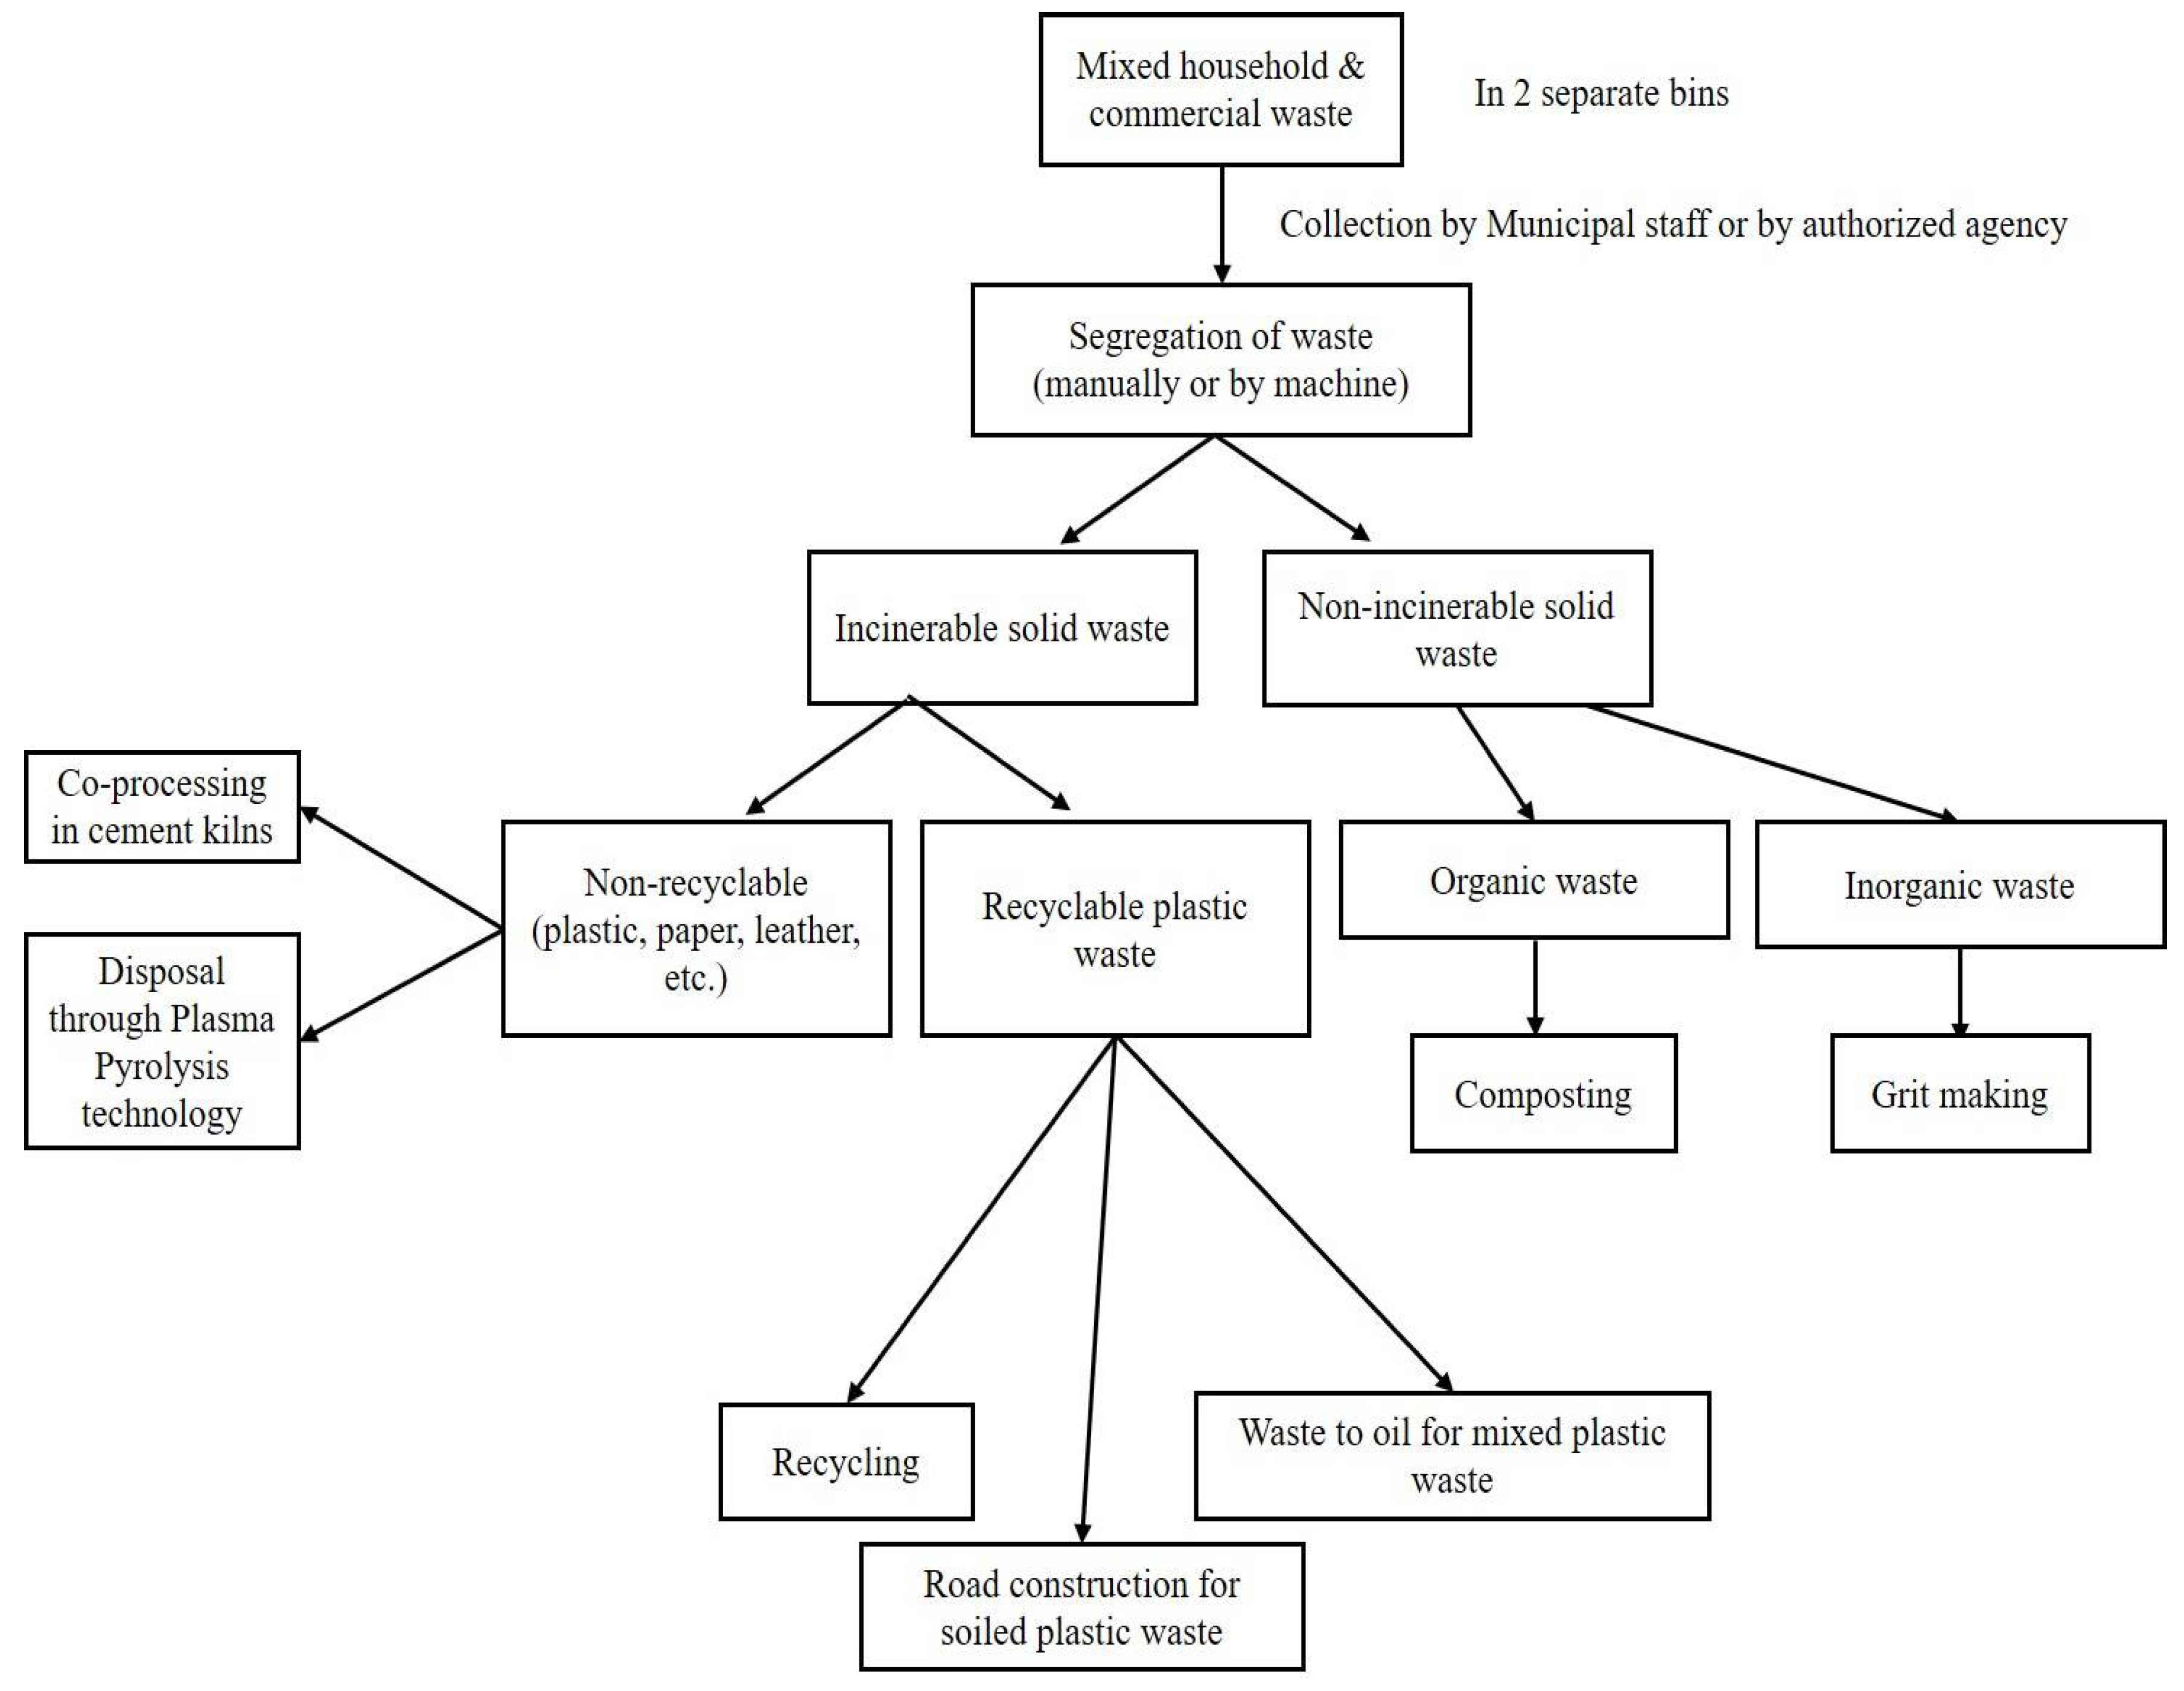
4.1. Effective and Sustainable PW Management Strategies
4.2. Restructuring Reverse Supply Chain
4.3. Source-Specific Waste Recovery
4.4. EPR- and PW-Related Rules
4.5. Microplastic Pollution Mitigation
5. Conclusions and Outlook
Supplementary Materials
Author Contributions
Funding
Institutional Review Board Statement
Informed Consent Statement
Data Availability Statement
Acknowledgments
Conflicts of Interest
References
- Liang, Y.; Tan, Q.; Song, Q.; Li, J. An analysis of the plastic waste trade and management in Asia. Waste Manag. 2021, 119, 242–253. [Google Scholar] [CrossRef] [PubMed]
- TERI. Plastic Waste Management: Turning Challeges into Opportunities. Available online: https://www.teriin.org/sites/default/files/2020-12/plastic-management_0.pdf (accessed on 15 January 2021).
- Geyer, R.; Jambeck, J.R.; Law, K.L. Production, use, and fate of all plastics ever made. Sci. Adv. 2017, 3, e1700782. [Google Scholar] [CrossRef] [PubMed] [Green Version]
- Tiseo, I. Global Plastic Production 1950–2020. Available online: https://0-www-statista-com.brum.beds.ac.uk/statistics/282732/global-production-of-plastics-since-1950/ (accessed on 26 March 2022).
- Tiseo, I. Distribution of Plastic Production Worldwide in 2018, by Type. Available online: https://0-www-statista-com.brum.beds.ac.uk/statistics/968808/distribution-of-global-plastic-production-by-type/ (accessed on 24 March 2021).
- UNEP. Single-Use Plastics: A Roadmap for Sustainability. Available online: https://www.unep.org/resources/report/single-use-plastics-roadmap-sustainability (accessed on 19 August 2021).
- Brooks, A.L.; Wang, S.; Jambeck, J.R. The Chinese import ban and its impact on global plastic waste trade. Sci. Adv. 2018, 4, eaat0131. [Google Scholar] [CrossRef] [PubMed] [Green Version]
- OECD. Plastic Pollution is Growing Relentlessly as Waste Management and Recycling Fall Short, Says OECD. Available online: https://www.oecd.org/environment/plastic-pollution-is-growing-relentlessly-as-waste-management-and-recycling-fall-short.htm#:~:text=Global%20plastic%20waste%20generation%20more,11%25%20from%20clothing%20and%20textiles (accessed on 26 March 2022).
- Benson, N.U.; Bassey, D.E.; Palanisami, T. COVID pollution: Impact of COVID-19 pandemic on global plastic waste footprint. Heliyon 2021, 7, e06343. [Google Scholar] [CrossRef]
- Lebreton, L.; Andrady, A. Future scenarios of global plastic waste generation and disposal. Palgrave Commun. 2019, 5, 6. [Google Scholar] [CrossRef] [Green Version]
- Singh, P.; Sharma, V. Integrated plastic waste management: Environmental and improved health approaches. Procedia Environ. Sci. 2016, 35, 692–700. [Google Scholar] [CrossRef]
- Wang, C.; Zhao, L.; Lim, M.K.; Chen, W.-Q.; Sutherland, J.W. Structure of the global plastic waste trade network and the impact of China’s import Ban. Resour. Conserv. Recycl. 2020, 153, 104591. [Google Scholar] [CrossRef]
- Westerbos, M. How the Sustainable Development Goals Can Help Fight ‘Plastic Soup’. Available online: https://bthechange.com/how-the-sustainable-development-goals-can-help-fight-plastic-soup-3ce746fc1cba (accessed on 30 March 2021).
- Faraca, G.; Astrup, T. Plastic waste from recycling centres: Characterisation and evaluation of plastic recyclability. Waste Manag. 2019, 95, 388–398. [Google Scholar] [CrossRef]
- Eriksen, M.K.; Pivnenko, K.; Olsson, M.E.; Astrup, T.F. Contamination in plastic recycling: Influence of metals on the quality of reprocessed plastic. Waste Manag. 2018, 79, 595–606. [Google Scholar] [CrossRef]
- Kumar, A.; Samadder, S.; Kumar, N.; Singh, C. Estimation of the generation rate of different types of plastic wastes and possible revenue recovery from informal recycling. Waste Manag. 2018, 79, 781–790. [Google Scholar] [CrossRef]
- Balaji, A.B.; Liu, X. Plastics in Circular Economy: A Sustainable Progression. In An Introduction to Circular Economy; Liu, L., Ramakrishna, S., Eds.; Springer: Singapore, 2021; pp. 159–178. [Google Scholar]
- Bhattacharya, R.; Chandrasekhar, K.; Roy, P.; Khan, A. Challenges and Opportunities: Plastic Waste Management in India. Available online: https://archive.nyu.edu/handle/2451/42242 (accessed on 15 January 2021).
- Sheldon, R.A.; Norton, M. Green chemistry and the plastic pollution challenge: Towards a circular economy. Green Chem. 2020, 22, 6310–6322. [Google Scholar] [CrossRef]
- Ellen MacArthur Foundation. The Circular Economy in Detail. Available online: https://archive.ellenmacarthurfoundation.org/explore/the-circular-economy-in-detail (accessed on 19 August 2021).
- Ellen MacArthur Foundation. New Plastic economy—A Circular Economy for Plastic in Which it Never Becomes Waste. Available online: https://www.ellenmacarthurfoundation.org/our-work/activities/new-plastics-economy (accessed on 26 March 2021).
- Boucher, J.; Billard, G. The challenges of measuring plastic pollution. Field Actions Sci. Rep. J. Field Actions 2019, 68–75. [Google Scholar]
- Ellen MacArthur Foundation. Plastics and the Circular Economy. Available online: https://www.ellenmacarthurfoundation.org/explore/plastics-and-the-circular-economy (accessed on 10 March 2021).
- Worldbank. Population—All Countries and Economies. Available online: https://data.worldbank.org/indicator/SP.POP.TOTL (accessed on 26 March 2022).
- Trading Economics. European Union Population. Available online: https://tradingeconomics.com/european-union/population#:~:text=Population%20in%20European%20Union%20is,macro%20models%20and%20analysts%20expectations (accessed on 26 March 2022).
- Rafey, A.; Siddiqui, F.Z. A review of plastic waste management in India—Challenges and opportunities. Int. J. Environ. Anal. Chem. 2021, 1–17. [Google Scholar] [CrossRef]
- Tiseo, I. Annual Production of Plastics in Europe from 1950 to 2020. Available online: https://0-www-statista-com.brum.beds.ac.uk/statistics/987838/plastics-production-volume-in-the-eu-28/#:~:text=Europe%20produced%20roughly%2055%20million,to%20367%20million%20metric%20tons (accessed on 26 March 2022).
- Ian Tiseo. Production Volume of Plastic Products in China from 2012 to First Half of 2021. Available online: https://0-www-statista-com.brum.beds.ac.uk/statistics/1255628/plastic-product-production-in-china/#:~:text=In%202020%2C%20China’s%20total%20production,plastics%20production%20as%20of%202019 (accessed on 26 March 2022).
- Punjab Board of Investment & Trade (PBIT). Plastic Industry of Pakistan: Prospects and Challenges amid Coronavirus Crisis. Available online: https://pbit.punjab.gov.pk/system/files/Plastic%20Industry-Prospects%20and%20Challenges%20amid%20coronavirus%20crisis_Marketing%20Dept_2nd%20Ed-May2020(1).pdf (accessed on 26 March 2022).
- Tiseo, I.U.S. Plastics Industry—Statistics & Facts. Available online: https://0-www-statista-com.brum.beds.ac.uk/topics/7460/plastics-industry-in-the-us/#dossierKeyfigures (accessed on 26 March 2022).
- Alves, B. Brazil: Processed Plastics Production 2010–2019. Available online: https://0-www-statista-com.brum.beds.ac.uk/statistics/486298/processed-plastics-production-in-brazil/#:~:text=The%20production%20of%20processed%20plastics,experienced%20an%20overall%20downward%20trend (accessed on 26 March 2022).
- Babayemi, J.O.; Nnorom, I.C.; Osibanjo, O.; Weber, R. Ensuring sustainability in plastics use in Africa: Consumption, waste generation, and projections. Environ. Sci. Eur. 2019, 31, 60. [Google Scholar] [CrossRef] [Green Version]
- Department of Agriculture Water and Environment. Australian Plastics Flows and Fates Study 2019–20—National Report. Available online: https://www.awe.gov.au/sites/default/files/documents/apff-national-report.docx (accessed on 27 March 2022).
- TERIIN. Fact Sheet on plastic waste in India World Environment Day. Available online: https://www.teriin.org/sites/default/files/files/factsheet.pdf (accessed on 27 March 2022).
- Shreeshan Venkatesh; Kukreti, I. An Indian Consumes 11kg Plastic Every Year and an Average American 109 kg. Available online: https://www.downtoearth.org.in/news/waste/an-indian-consumes-11-kg-plastic-every-year-and-an-average-american-109-kg-60745 (accessed on 27 March 2022).
- Amadei, A.M.; Sanyé-Mengual, E.; Sala, S. Modeling the EU plastic footprint: Exploring data sources and littering potential. Resour. Conserv. Recycl. 2022, 178, 106086. [Google Scholar] [CrossRef]
- Jiang, X.; Wang, T.; Jiang, M.; Xu, M.; Yu, Y.; Guo, B.; Chen, D.; Hu, S.; Jiang, J.; Zhang, Y.; et al. Assessment of Plastic Stocks and Flows in China: 1978–2017. Resour. Conserv. Recycl. 2020, 161, 104969. [Google Scholar] [CrossRef]
- Ahmed, S.I. Problems with Plastic. Available online: https://www.thenews.com.pk/tns/detail/567702-problems-plastic#:~:text=This%20growth%20is%20also%20due,the%20country%20is%206.5%20kg (accessed on 27 March 2022).
- Hundertmark, T.; Prieto, M.; Ryba, A.; Simons, T.J.; Wallach, J. Accelerating Plastic Recovery in the United States; McKinsey Co. Chem: Minato, Tokyo, 2019. [Google Scholar]
- Bluevision. Brazil Performs Well in Plastic Collection, but Poor Recycling. Available online: https://bluevisionbraskem.com/en/intelligence/brazil-performs-well-in-plastic-waste-collection-but-poor-recycling/ (accessed on 27 March 2022).
- WWF. Don’t Let Nature go to Waste—Australia, It’s Time to End Single-Use Plastic. Available online: https://www.wwf.org.au/get-involved/plastics (accessed on 27 March 2022).
- Tiseo, I. Distribution of Plastic Waste Generation in Europe in 2018, by Sector. Available online: https://0-www-statista-com.brum.beds.ac.uk/statistics/986584/distribution-of-plastic-waste-collected-in-europe/ (accessed on 27 March 2022).
- Plastics Europe. Plastics—The Facts 2021. Available online: https://plasticseurope.org/wp-content/uploads/2021/12/Plastics-the-Facts-2021-web-final.pdf (accessed on 27 March 2022).
- Davey, R. Plastic Waste Management in China. Available online: https://www.azom.com/news.aspx?newsID=58319#:~:text=According%20to%20estimates%20from%20the,was%20generated%20in%20the%20country (accessed on 27 March 2022).
- Sun, Y.; Liu, S.; Wang, P.; Jian, X.; Liao, X.; Chen, W.-Q. China’s roadmap to plastic waste management and associated economic costs. J. Environ. Manag. 2022, 309, 114686. [Google Scholar] [CrossRef]
- Khan, M.A.A. 4 Ways Pakistan is Tackling Plastic Waste and Pollution. Available online: https://www.weforum.org/agenda/2021/11/4-ways-pakistan-is-tackling-plastic-waste-and-pollution/ (accessed on 26 March 2022).
- United States Environmental Protection Agency. Plastics: Material-Specific Data. Available online: https://www.epa.gov/facts-and-figures-about-materials-waste-and-recycling/plastics-material-specific-data#:~:text=While%20overall%20the%20amount%20of,plastic%20containers%20is%20more%20significant (accessed on 27 March 2022).
- World Population Review. Plastic Pollution by Country 2022. Available online: https://worldpopulationreview.com/country-rankings/plastic-pollution-by-country (accessed on 27 March 2022).
- Department of Agriculture Water and Environment. National Plastics Plan 2021. Available online: https://www.awe.gov.au/environment/protection/waste/publications/australian-plastics-recycling-survey-report-2017-18 (accessed on 27 March 2022).
- Shrivastav, R. India’s Plastic Waste Situation Wasn’t Created Today. Available online: https://www.downtoearth.org.in/blog/waste/india-s-plastic-waste-situation-wasn-t-created-today-67061#:~:text=Growth%2C%20production%20and%20per%20capita,to%20cosmetics%20and%20consumer%20items (accessed on 27 March 2022).
- European Commission. Communication from the Commission to the European Parliament, The Council, The European Economic and Social Committee and the Committee of the Regions. Available online: https://eur-lex.europa.eu/legal-content/EN/TXT/HTML/?uri=CELEX:52018DC0028&from=PT (accessed on 27 March 2022).
- WWF Pakistan. Tackling Plastic Pollution in Pakistan. Available online: https://www.wwfpak.org/issues/plastic_pollution/ (accessed on 27 March 2022).
- Rutkowski, J.E.; Rutkowski, E.W. Recycling in Brasil: Paper and plastic supply chain. Resources 2017, 6, 43. [Google Scholar] [CrossRef] [Green Version]
- IUCN. Nationalguidance for Plastic Pollution Hotspotting and Shaping Action. Available online: https://www.iucn.org/sites/dev/files/content/documents/south_africa_-_national_guidance_for_plastic_pollution_hotspotting_and_shaping_action.pdf (accessed on 27 March 2022).
- Siddiqui, J.; Pandey, G. A review of plastic waste management strategies. Int. Res. J. Environ. Sci. 2013, 2, 84–88. [Google Scholar]
- Eurostat. EU Recycled 41% of Plastic Packaging Waste in 2019. Available online: https://ec.europa.eu/eurostat/web/products-eurostat-news/-/ddn-20211027-2#:~:text=In%202019%2C%20each%20person%20living,24%25%20(%2B6.7%20kg) (accessed on 27 March 2022).
- Jamal, S. Pakistan to Support Innovative Recycling Solutions to Tackle Plastic Pollution. Available online: https://gulfnews.com/world/asia/pakistan/pakistan-to-support-innovative-recycling-solutions-to-tackle-plastic-pollution-1.77373360 (accessed on 27 March 2022).
- Averda. South Africa Beats Europe in Recycling Rates. Available online: https://www.averda.com/rsa/news/south-africa-beats-europe-recycling-rates#:~:text=Back%20to%20News%20For%20seven,European%20recycling%20rate%20of%2031.1%25 (accessed on 27 March 2022).
- Library of Congress. European Union: Ban on Single-Use Plastics Takes Effect. Available online: https://www.loc.gov/item/global-legal-monitor/2021-07-18/european-union-ban-on-single-use-plastics-takes-effect/#:~:text=Article%20European%20Union%3A%20Ban%20on,for%20which%20alternatives%20are%20available (accessed on 27 March 2022).
- Mo, C. Single-Use Plastics Regulations in the United States: An Overview. Available online: https://www.compliancegate.com/single-use-plastic-regulations-united-states/ (accessed on 27 March 2022).
- Uribe, C.V. Plastics and Packaging Laws in Brazil. Available online: https://cms.law/en/int/expert-guides/plastics-and-packaging-laws/brazil#:~:text=263%2F2018%20has%20been%20raised,for%20packaging%20and%20transportation%20of (accessed on 27 March 2022).
- Carlos Bezerra, J.; Walker, T.R.; Clayton, C.A.; Adam, I. Single-use plastic bag policies in the Southern African development community. Environ. Chall. 2021, 3, 100029. [Google Scholar] [CrossRef]
- Australian Marine Conservation Society. Which Australian States are Banning Single-Use Plastics? Available online: https://www.marineconservation.org.au/which-australian-states-are-banning-single-use-plastics/#:~:text=More%20information,be%20added%20to%20the%20ban (accessed on 27 March 2022).
- India Government Portal. Recycled Plastic Manufacture and Usage Rules. 1999. Available online: http://www.indiaenvironmentportal.org.in/files/file/Recycled%20Plastics%20Manufacture%20and%20Usage%20Rules.%201999.docx (accessed on 31 August 2021).
- CPCB. Annual Report 2012–2013. Available online: https://cpcb.nic.in/displaypdf.php?id=cGxhc3RpY3dhc3RlL0FubnVhbF9SZXBvcnRfMjAxMi0xM19QV00ucGRm (accessed on 29 March 2021).
- CPCB. Annual Report 2015–16. Available online: https://cpcb.nic.in/displaypdf.php?id=cGxhc3RpY3dhc3RlL0FubnVhbF9SZXBvcnRfMjAxNS0xNl9QV00ucGRm (accessed on 29 March 2021).
- CPCB. Annual Report 2017–18. Available online: https://cpcb.nic.in/uploads/plasticwaste/Annual_Report_2017-18_PWM.pdf (accessed on 29 March 2021).
- MoEFCC. Draft Plastic Waste Management (Amendment) Rules 2021. Available online: http://moef.gov.in/wp-content/uploads/2021/03/Draft-Plastic-waste-Notification.pdf (accessed on 31 August 2021).
- CMS. Plastics and Packaging Laws in the European Union. Available online: https://cms.law/en/int/expert-guides/plastics-and-packaging-laws/european-union#:~:text=Regulation%20(EU)%202020%2F2017,effect%20on%201%20January%202021 (accessed on 27 March 2022).
- Mukheed, M.; Alisha, K. Plastic pollution in Pakistan: Environmental and health Implications. J. Pollut. Effects Contr. 2020, 4, 251–258. [Google Scholar]
- Institute, S.H. Science Matters: The Case of Plastics. Available online: https://www.sciencehistory.org/learn/science-matters/case-of-plastics/epa-regulation (accessed on 27 March 2022).
- CMS. Plastics and Packaging Laws in Brazil. Available online: https://cms.law/en/int/expert-guides/plastics-and-packaging-laws/brazil#:~:text=Some%20states%20in%20Brazil%20have,bags%20made%20from%20renewable%20materials (accessed on 27 March 2022).
- CMS. Plastics and Packaging Laws in South Africa. Available online: https://cms.law/en/int/expert-guides/plastics-and-packaging-laws/south-africa#:~:text=There%20is%20no%20specific%20environmental,plastic%20waste%20in%20South%20Africa (accessed on 27 March 2022).
- FICCI. Knowledge Paper on New Horizons for Indian Plastics Processing Industry. Available online: http://ficci.in/spdocument/20512/Kowledge-charu.pdf (accessed on 15 January 2021).
- Plastics Europe. Working Together for a Circular Economy for Plastics. Available online: https://plasticseurope.org/about-us/collaborations/ (accessed on 27 March 2022).
- IBISWorld. Plastic Parts Manufacturing Industry in China—Market Research Report. Available online: https://www.ibisworld.com/china/market-research-reports/plastic-parts-manufacturing-industry/ (accessed on 27 March 2022).
- BizVibe. Everything You Need to Know about Plastics Industry in the US. Available online: https://blog.bizvibe.com/blog/plastics-leather-and-rubber/everything-you-need-to-know-about-plastics-industry-in-the-us (accessed on 27 March 2022).
- Amemiya, M.; Lira, I.; Plumb, D.; Teixeira, T.L. Analysis of the Plastics Cluster Sao Paulo, Brazil. Available online: https://citeseerx.ist.psu.edu/viewdoc/download?doi=10.1.1.568.6572&rep=rep1&type=pdf (accessed on 28 February 2022).
- International Trade Administration. Australian Plastic Industry. Available online: https://www.trade.gov/market-intelligence/australia-plastics-industry (accessed on 27 March 2022).
- Khan, F.; Ahmed, W.; Najmi, A. Understanding consumers’ behavior intentions towards dealing with the plastic waste: Perspective of a developing country. Resour. Conserv. Recycl. 2019, 142, 49–58. [Google Scholar] [CrossRef]
- Aryan, Y.; Yadav, P.; Samadder, S.R. Life Cycle Assessment of the existing and proposed plastic waste management options in India: A case study. J. Clean. Prod. 2019, 211, 1268–1283. [Google Scholar] [CrossRef]
- IIT Kharagpur. Plastic Waste Management. Available online: https://onlinecourses.nptel.ac.in/noc20_ce13/preview (accessed on 21 March 2021).
- FICCI. Knowledge Paper on Plastic Industry for Infrastructure. Available online: http://ficci.in/spdocument/20872/report-Plastic-infrastructure-2017-ficci.pdf (accessed on 15 January 2021).
- OECD. OECD Economic Surveys India. Available online: https://www.oecd.org/economy/economic-survey-india.htm (accessed on 28 January 2021).
- Plastindia Foundation. Report on The Indian Plastics Industry. Available online: https://plastindia.org/pdf/Indian-Plastics-Industry-Report-2018-2.pdf (accessed on 15 January 2021).
- Makwana, A. Indian Polyolefins Overview. Available online: http://eliteconferences.com/pdfs/2019/H_Anand_Makwana_GAIL.pdf (accessed on 11 March 2021).
- KPMG India—FICCI. Media for the masses: The promise unfolds. Indian Media Entertain. Ind. Rep. 2017, 1–294. [Google Scholar]
- Plastindia Foundation. Plastic Industry Status Report. Available online: https://www.plastindia.org/plastic-industry-status-report.php (accessed on 14 March 2021).
- Parashar, N.; Hait, S. Plastics in the time of COVID-19 pandemic: Protector or polluter? Sci. Total Environ. 2021, 759, 144274. [Google Scholar] [CrossRef]
- Banerjee, T.; Srivastava, R.K.; Hung, Y.-T. Chapter 17: Plastics waste management in India: An integrated solid waste management approach. In Handbook of Environment and Waste Management; Hung, Y.-T., Wang, L.K., Shammas, N.K., Eds.; World Scientific: Singapore, 2014; pp. 1029–1060. [Google Scholar]
- FICCI. Potential of Plastics Industry in Northern India with Special Focus on Plasticulture and Food Processing—2014: A Report on Plastic Industry. Available online: http://ficci.in/spdocument/20396/knowledge-paper-ps.pdf (accessed on 29 March 2021).
- FICCI. Indian Plastic Industry: Challenges & Opportunities. Available online: https://www.slideshare.net/TSMG-Chemicals/indian-plastic-industry-challenges-opportunities (accessed on 26 February 2021).
- University of Calgary. Petrochemical. Available online: https://energyeducation.ca/encyclopedia/Petrochemical#:~:text=Petrochemicals%20are%20derived%20from%20hydrocarbons,oil%20and%20natural%20gas%20liquids.&text=One%20major%20petrochemical%20is%20ethylene,most%20important%20plastics%20in%20manufacturing (accessed on 11 March 2021).
- Awoyera, P.O.; Adesina, A. Plastic wastes to construction products: Status, limitations and future perspective. Case Stud. Constr. Mater. 2020, 12, e00330. [Google Scholar] [CrossRef]
- Patil, A.; Patel, A.; Purohit, R. An overview of Polymeric Materials for Automotive Applications. Mater. Today Proc. 2017, 4, 3807–3815. [Google Scholar] [CrossRef]
- McKeen, L. Plastics Used in Medical Devices. Available online: https://www.pentasil.eu/images/Plastics%20Used%20in%20Medical%20Devices.pdf (accessed on 29 March 2021).
- Piedmont Plastics. What is the Best Type of Plastic for Medical Equipment? Available online: https://www.piedmontplastics.com/blog/best-plastics-for-medical-equipment (accessed on 29 March 2021).
- ELMER. What Type of Plastic is Used in The Body of an Led Bulb? Available online: https://elmerindia.com/knowledge/what-type-of-plastic-is-used-in-the-body-of-an-led-bulb-did-it-have-any-special-specification/ (accessed on 29 March 2021).
- Santhosh, S.; Shrivastav, R. Plastic Waste Management: What Can India Learn from Other Countries. Available online: https://www.downtoearth.org.in/blog/waste/plastic-waste-management-what-can-india-learn-from-other-countries-67048 (accessed on 28 January 2021).
- Hindustan Unilever Ltd. Could-Based Digital Governance for Tracibility, Accountability in Waste Supply Chain. Available online: https://www.undp.org/content/dam/india/docs/evaluation-reports/HUL%20Brochure.pdf (accessed on 9 March 2021).
- United Nations Development Programme (UNDP). Plastic Waste Management Programme (2018–2024). Available online: https://www.in.undp.org/content/india/en/home/projects/plastic-waste-management.html#:~:text=Plastic%20Waste%20Management%20Programme%20(2018%2D2024)&text=India%20generates%2015%20million%20tonnes,the%20waste%20pickers%2C%20mostly%20women (accessed on 28 January 2021).
- Sikka, P. Plastic waste management in India. Packag. India 2007, 39, 43. [Google Scholar]
- CPCB. Annual Report: 2011–2012. Available online: https://cpcb.nic.in/displaypdf.php?id=cGxhc3RpY3dhc3RlL0FubnVhbF9SZXBvcnRfMjAxMS0xMl9QV00ucGRm (accessed on 29 March 2021).
- CPCB. Annual Report 2013–2014. Available online: https://cpcb.nic.in/displaypdf.php?id=cGxhc3RpY3dhc3RlL0FubnVhbF9SZXBvcnRfMjAxMy0xNF9QV00ucGRm (accessed on 29 March 2021).
- CPCB. Annual Report 2014–15. Available online: https://cpcb.nic.in/displaypdf.php?id=cGxhc3RpY3dhc3RlL0FubnVhbF9SZXBvcnRfMjAxNC0xNV9QV00ucGRm (accessed on 29 March 2021).
- CPCB. Annual Report 2016–17. Available online: https://cpcb.nic.in/uploads/plasticwaste/Annual_Report_2016-17_PWM.pdf (accessed on 29 March 2021).
- Central Pollution Control Board. Annual Report for the Year 2018–2019 on Implementation of Plastic Waste Management Rules. Available online: https://cpcb.nic.in/uploads/plasticwaste/Annual_Report_2018-19_PWM.pdf (accessed on 12 March 2021).
- Centre for Science and Environment. Managing Plastic Waste in India: Challenges and Agenda. Available online: https://www.cseindia.org/content/downloadreports/10352 (accessed on 12 February 2020).
- Veerasingam, S.; Ranjani, M.; Venkatachalapathy, R.; Bagaev, A.; Mukhanov, V.; Litvinyuk, D.; Verzhevskaia, L.; Guganathan, L.; Vethamony, P. Microplastics in different environmental compartments in India: Analytical methods, distribution, associated contaminants and research needs. TrAC Trends Anal. Chem. 2020, 133, 116071. [Google Scholar] [CrossRef]
- Amrutha, K.; Warrier, A.K. The first report on the source-to-sink characterization of microplastic pollution from a riverine environment in tropical India. Sci. Total Environ. 2020, 739, 140377. [Google Scholar] [CrossRef]
- Carney Almroth, B.; Eggert, H. Marine plastic pollution: Sources, impacts, and policy issues. Rev. Environ. Econ. Policy 2019, 13, 317–326. [Google Scholar] [CrossRef] [Green Version]
- Li, W.C.; Tse, H.F.; Fok, L. Plastic waste in the marine environment: A review of sources, occurrence and effects. Sci. Total Environ. 2016, 566–567, 333–349. [Google Scholar] [CrossRef] [PubMed]
- Al Jitan, S.; Brudecki, G.; Palmisano, G.; Lanotte, M. Photocatalytic activity of neat and polymer-modified bitumen. Appl. Mater. Today 2020, 21, 100795. [Google Scholar] [CrossRef]
- Nelms, S.E.; Duncan, E.M.; Patel, S.; Badola, R.; Bhola, S.; Chakma, S.; Chowdhury, G.W.; Godley, B.J.; Haque, A.B.; Johnson, J.A.; et al. Riverine plastic pollution from fisheries: Insights from the Ganges River system. Sci. Total Environ. 2021, 756, 143305. [Google Scholar] [CrossRef] [PubMed]
- Raha, U.K.; Kumar, B.R.; Sarkar, S.K. Policy Framework for Mitigating Land-based Marine Plastic Pollution in the Gangetic Delta Region of Bay of Bengal—A review. J. Clean. Prod. 2021, 278, 123409. [Google Scholar] [CrossRef]
- Ranjani, M.; Veerasingam, S.; Venkatachalapathy, R.; Mugilarasan, M.; Bagaev, A.; Mukhanov, V.; Vethamony, P. Assessment of potential ecological risk of microplastics in the coastal sediments of India: A meta-analysis. Mar. Pollut. Bull. 2021, 163, 111969. [Google Scholar] [CrossRef]
- Goswami, P.; Vinithkumar, N.V.; Dharani, G. First evidence of microplastics bioaccumulation by marine organisms in the Port Blair Bay, Andaman Islands. Mar. Pollut. Bull. 2020, 155, 111163. [Google Scholar] [CrossRef]
- Tiwari, M.; Rathod, T.D.; Ajmal, P.Y.; Bhangare, R.C.; Sahu, S.K. Distribution and characterization of microplastics in beach sand from three different Indian coastal environments. Mar. Pollut. Bull. 2019, 140, 262–273. [Google Scholar] [CrossRef]
- Anil Pratap Singh; Devi, A.S. Plastic Waste Management: A Review. Available online: http://ijasrm.com/wp-content/uploads/2019/05/IJASRM_V4S5_1488_233_237.pdf (accessed on 28 February 2021).
- Abeysinghe, S.; Gunasekara, C.; Bandara, C.; Nguyen, K.; Dissanayake, R.; Mendis, P. Engineering Performance of Concrete Incorporated with Recycled High-Density Polyethylene (HDPE)-A Systematic Review. Polymers 2021, 13, 1885. [Google Scholar] [CrossRef]
- OECD. Extended Producer Responsibility. Available online: https://www.oecd.org/env/tools-evaluation/extendedproducerresponsibility.htm (accessed on 15 January 2021).
- Ministry of Housing & Urban Affairs (MOHUA). Plastic Waste Management Issues, Solutions & Case Studies. Available online: http://164.100.228.143:8080/sbm/content/writereaddata/SBM%20Plastic%20Waste%20Book.pdf (accessed on 15 January 2021).
- Niaounakis, M. 10—Legislation and Regulatory Framework. In Recycling of Flexible Plastic Packaging; Niaounakis, M., Ed.; William Andrew Publishing: Norwich, NY, USA, 2020; pp. 369–393. [Google Scholar]
- Coszach, P.; Bogaert, J.-C.; Willocq, J. Chemical Recycling of PLA by Hydrolysis. Available online: https://patents.google.com/patent/US8431683B2/en (accessed on 31 March 2021).
- UNDP. Plastic Waste Management Programme: A Partnership. Available online: https://www.undp.org/content/dam/india/docs/human-development/HCCB.pdf (accessed on 9 March 2021).
- Islam, M.T.; Huda, N. Reverse logistics and closed-loop supply chain of Waste Electrical and Electronic Equipment (WEEE)/E-waste: A comprehensive literature review. Resour. Conserv. Recycl. 2018, 137, 48–75. [Google Scholar] [CrossRef]
- Kerdlap, P.; Purnama, A.R.; Low, J.S.C.; Tan, D.Z.L.; Barlow, C.Y.; Ramakrishna, S. Environmental evaluation of distributed versus centralized plastic waste recycling: Integrating life cycle assessment and agent-based modeling. Procedia CIRP 2020, 90, 689–694. [Google Scholar] [CrossRef]
- Sahajwalla, V.; Gaikwad, V. The present and future of e-waste plastics recycling. Curr. Opin. Green Sustain. Chem. 2018, 13, 102–107. [Google Scholar] [CrossRef]
- Hahladakis, J.N.; Iacovidou, E. Closing the loop on plastic packaging materials: What is quality and how does it affect their circularity? Sci. Total Environ. 2018, 630, 1394–1400. [Google Scholar] [CrossRef] [PubMed]
- Turner, A. Black plastics: Linear and circular economies, hazardous additives and marine pollution. Environ. Int. 2018, 117, 308–318. [Google Scholar] [CrossRef] [PubMed]
- UNEP. Marine Litter and Microplastics. Available online: https://undocs.org/UNEP/EA.3/Res.7 (accessed on 28 January 2021).
- Critchell, K.; Bauer-Civiello, A.; Benham, C.; Berry, K.; Eagle, L.; Hamann, M.; Hussey, K.; Ridgway, T. Chapter 34—Plastic Pollution in the Coastal Environment: Current Challenges and Future Solutions. In Coasts and Estuaries; Wolanski, E., Day, J.W., Elliott, M., Ramachandran, R., Eds.; Elsevier: Amsterdam, The Netherlands, 2019; pp. 595–609. [Google Scholar]
- Rai, P.; Mehrotra, S.; Priya, S.; Gnansounou, E.; Sharma, S.K. Recent advances in the sustainable design and applications of biodegradable polymers. Bioresour. Technol. 2021, 325, 124739. [Google Scholar] [CrossRef]
- Bhargava, N.; Sharanagat, V.S.; Mor, R.S.; Kumar, K. Active and intelligent biodegradable packaging films using food and food waste-derived bioactive compounds: A review. Trends Food Sci. Technol. 2020, 105, 385–401. [Google Scholar] [CrossRef]
- Sirohi, R.; Gaur, V.K.; Pandey, A.K.; Sim, S.J.; Kumar, S. Harnessing fruit waste for poly-3-hydroxybutyrate production: A review. Bioresour. Technol. 2021, 326, 124734. [Google Scholar] [CrossRef]
- Tripathi, A.D.; Paul, V.; Agarwal, A.; Sharma, R.; Hashempour-Baltork, F.; Rashidi, L.; Darani, K.K. Production of Polyhydroxyalkanoates Using Dairy Processing Waste—A review. Bioresour. Technol. 2021, 326, 124735. [Google Scholar] [CrossRef]
- Balda, S.; Sharma, A.; Capalash, N.; Sharma, P. Banana fibre: A natural and sustainable bioresource for eco-friendly applications. Clean Technol. Environ. Policy 2021, 23, 1389–1401. [Google Scholar] [CrossRef]
- Prajapati, K.; Nayak, R.; Shukla, A.; Parmar, P.; Goswami, D.; Saraf, M. Polyhydroxyalkanoates: An Exotic Gleam in the Gloomy Tale of Plastics. J. Polym. Environ. 2021, 29, 2013–2032. [Google Scholar] [CrossRef]
- Assad, I.; Bhat, S.U.; Gani, A.; Shah, A. Protein based packaging of plant origin: Fabrication, properties, recent advances and future perspectives. Int. J. Biol. Macromol. 2020, 164, 707–716. [Google Scholar] [CrossRef]
- Sehgal, R.; Gupta, R. Polyhydroxyalkanoate and its efficient production: An eco-friendly approach towards development. 3 Biotech 2020, 10, 549. [Google Scholar] [CrossRef] [PubMed]
- Rawoof, S.A.A.; Kumar, P.S.; Vo, D.-V.N.; Devaraj, K.; Mani, Y.; Devaraj, T.; Subramanian, S. Production of optically pure lactic acid by microbial fermentation: A review. Environ. Chem. Lett. 2020, 19, 539–556. [Google Scholar] [CrossRef]
- Sirohi, R.; Pandey, J.P.; Gaur, V.K.; Gnansounou, E.; Sindhu, R. Critical overview of biomass feedstocks as sustainable substrates for the production of polyhydroxybutyrate (PHB). Bioresour. Technol. 2020, 311, 123536. [Google Scholar] [CrossRef] [PubMed]
- Kumar, M.; Rathour, R.; Singh, R.; Sun, Y.; Pandey, A.; Gnansounou, E.; Lin, K.-Y.A.; Tsang, D.C.; Thakur, I.S. Bacterial polyhydroxyalkanoates: Opportunities, challenges, and prospects. J. Clean. Prod. 2020, 263, 121500. [Google Scholar] [CrossRef]
- Kabir, E.; Kaur, R.; Lee, J.; Kim, K.-H.; Kwon, E.E. Prospects of biopolymer technology as an alternative option for non-degradable plastics and sustainable management of plastic wastes. J. Clean. Prod. 2020, 258, 120536. [Google Scholar] [CrossRef]
- Sabapathy, P.C.; Devaraj, S.; Meixner, K.; Anburajan, P.; Kathirvel, P.; Ravikumar, Y.; Zabed, H.M.; Qi, X. Recent developments in Polyhydroxyalkanoates (PHAs) production–A review. Bioresour. Technol. 2020, 306, 123132. [Google Scholar] [CrossRef]
- Jha, A.; Kumar, A. Biobased technologies for the efficient extraction of biopolymers from waste biomass. Bioprocess Biosyst. Eng. 2019, 42, 1893–1901. [Google Scholar] [CrossRef]
- Kumar, A.; Thakur, A.; Panesar, P.S. Lactic acid and its separation and purification techniques: A review. Rev. Environ. Sci. Bio/Technol. 2019, 18, 823–853. [Google Scholar] [CrossRef]
- Tsang, Y.F.; Kumar, V.; Samadar, P.; Yang, Y.; Lee, J.; Ok, Y.S.; Song, H.; Kim, K.-H.; Kwon, E.E.; Jeon, Y.J. Production of bioplastic through food waste valorization. Environ. Int. 2019, 127, 625–644. [Google Scholar] [CrossRef]
- Al-Battashi, H.S.; Annamalai, N.; Sivakumar, N.; Al-Bahry, S.; Tripathi, B.N.; Nguyen, Q.D.; Gupta, V.K. Lignocellulosic biomass (LCB): A potential alternative biorefinery feedstock for polyhydroxyalkanoates production. Rev. Environ. Sci. Bio/Technol. 2019, 18, 183–205. [Google Scholar] [CrossRef]
- Thakur, S.; Chaudhary, J.; Sharma, B.; Verma, A.; Tamulevicius, S.; Thakur, V.K. Sustainability of bioplastics: Opportunities and challenges. Curr. Opin. Green Sustain. Chem. 2018, 13, 68–75. [Google Scholar] [CrossRef] [Green Version]
- Kavitha, G.; Rengasamy, R.; Inbakandan, D. Polyhydroxybutyrate production from marine source and its application. Int. J. Biol. Macromol. 2018, 111, 102–108. [Google Scholar] [CrossRef] [PubMed]
- Kaur, L.; Khajuria, R.; Parihar, L.; Singh, G.D. Polyhydroxyalkanoates: Biosynthesis to commercial production—A review. J. Microbiol. Biotechnol. Food Sci. 2017, 6, 1098–1106. [Google Scholar] [CrossRef] [Green Version]
- Balaji, S.; Gopi, K.; Muthuvelan, B. A review on production of poly β hydroxybutyrates from cyanobacteria for the production of bio plastics. Algal Res. 2013, 2, 278–285. [Google Scholar] [CrossRef]
- Nampoothiri, K.M.; Nair, N.R.; John, R.P. An overview of the recent developments in polylactide (PLA) research. Bioresour. Technol. 2010, 101, 8493–8501. [Google Scholar] [CrossRef]
- Kalia, V.; Raizada, N.; Sonakya, V. Bioplastics. Available online: http://nopr.niscair.res.in/bitstream/123456789/26582/1/JSIR%2059(6)%20433-445.pdf (accessed on 31 March 2021).
- Bhagwat, G.; Gray, K.; Wilson, S.P.; Muniyasamy, S.; Vincent, S.G.T.; Bush, R.; Palanisami, T. Benchmarking bioplastics: A natural step towards a sustainable future. J. Polym. Environ. 2020, 28, 3055–3075. [Google Scholar] [CrossRef]
- Wasewar, K.L. SeparationofLacticAcid: RecentAdvances. Chem. Biochem. Eng. Q 2005, 19, 159–172. [Google Scholar]
- Mohan, H.T.; Jayanarayanan, K.; Mini, K.J.C.; Materials, B. Recent trends in utilization of plastics waste composites as construction materials. Constr. Build. Mater. 2020, 271, 121520. [Google Scholar] [CrossRef]
- Shyamala, G.; Kumar, K.R.; Olalusi, O.B. Impacts of nonconventional construction materials on concrete strength development: Case studies. SN Appl. Sci. 2020, 2, 1927. [Google Scholar] [CrossRef]
- Goli, V.S.N.S.; Mohammad, A.; Singh, D.N. Application of municipal plastic waste as a manmade neo-construction material: Issues & wayforward. Resour. Conserv. Recycl. 2020, 161, 105008. [Google Scholar]
- Mohanty, A.K.; Vivekanandhan, S.; Pin, J.-M.; Misra, M. Composites from renewable and sustainable resources: Challenges and innovations. Science 2018, 362, 536–542. [Google Scholar] [CrossRef] [PubMed] [Green Version]
- Mohit, H.; Arul Mozhi Selvan, V. A comprehensive review on surface modification, structure interface and bonding mechanism of plant cellulose fiber reinforced polymer based composites. Compos. Interfaces 2018, 25, 629–667. [Google Scholar] [CrossRef]
- Priya, A.; Dutta, K.; Daverey, A. A comprehensive biotechnological and molecular insight into plastic degradation by microbial community. J. Chem. Technol. Biotechnol. 2022, 97, 381–390. [Google Scholar] [CrossRef]
- Purohit, J.; Chattopadhyay, A.; Teli, B. Metagenomic exploration of plastic degrading microbes for biotechnological application. Curr. Genom. 2020, 21, 253–270. [Google Scholar] [CrossRef]
- Anjana, K.; Hinduja, M.; Sujitha, K.; Dharani, G. Review on plastic wastes in marine environment–Biodegradation and biotechnological solutions. Mar. Pollut. Bull. 2020, 150, 110733. [Google Scholar]
- Sharma, M.; Akhter, Y.; Chatterjee, S. A review on remediation of cyanide containing industrial wastes using biological systems with special reference to enzymatic degradation. World J. Microbiol. Biotechnol. 2019, 35, 70. [Google Scholar] [CrossRef]
- Singh, P.; Kumar, R. Critical review of microbial degradation of aromatic compounds and exploring potential aspects of Furfuryl alcohol degradation. J. Polym. Environ. 2019, 27, 901–916. [Google Scholar] [CrossRef] [Green Version]
- Moharir, R.V.; Kumar, S. Challenges associated with plastic waste disposal and allied microbial routes for its effective degradation: A comprehensive review. J. Clean. Prod. 2019, 208, 65–76. [Google Scholar] [CrossRef]
- Sathya, A.; Sivasubramanian, V.; Santhiagu, A.; Sebastian, C.; Sivashankar, R. Production of polyhydroxyalkanoates from renewable sources using bacteria. J. Polym. Environ. 2018, 26, 3995–4012. [Google Scholar] [CrossRef]
- Koshti, R.; Mehta, L.; Samarth, N. Biological recycling of polyethylene terephthalate: A mini-review. J. Polym. Environ. 2018, 26, 3520–3529. [Google Scholar] [CrossRef]
- Thakur, I.S.; Kumar, M.; Varjani, S.J.; Wu, Y.; Gnansounou, E.; Ravindran, S. Sequestration and utilization of carbon dioxide by chemical and biological methods for biofuels and biomaterials by chemoautotrophs: Opportunities and challenges. Bioresour. Technol. 2018, 256, 478–490. [Google Scholar] [CrossRef] [PubMed]
- Zaheer, M.R.; Kuddus, M. PHB (poly-β-hydroxybutyrate) and its enzymatic degradation. Polym. Adv. Technol. 2018, 29, 30–40. [Google Scholar]
- Singh, A.; Singh, A.K. Haloarchaea: Worth exploring for their biotechnological potential. Biotechnol. Lett. 2017, 39, 1793–1800. [Google Scholar] [CrossRef] [PubMed]
- Elsawy, M.A.; Kim, K.-H.; Park, J.-W.; Deep, A. Hydrolytic degradation of polylactic acid (PLA) and its composites. Renew. Sustain. Energy Rev. 2017, 79, 1346–1352. [Google Scholar] [CrossRef]
- Pathak, V.M. Review on the current status of polymer degradation: A microbial approach. Bioresour. Bioprocess. 2017, 4, 15. [Google Scholar] [CrossRef]
- Sen, S.K.; Raut, S. Microbial degradation of low density polyethylene (LDPE): A review. J. Environ. Chem. Eng. 2015, 3, 462–473. [Google Scholar]
- Kale, S.K.; Deshmukh, A.G.; Dudhare, M.S.; Patil, V.B. Microbial degradation of plastic: A review. J. Biochem. Technol. 2015, 6, 952–961. [Google Scholar]
- Mahajan, N.; Gupta, P. New insights into the microbial degradation of polyurethanes. RSC Adv. 2015, 5, 41839–41854. [Google Scholar] [CrossRef]
- Shah, A.A.; Kato, S.; Shintani, N.; Kamini, N.R.; Nakajima-Kambe, T. Microbial degradation of aliphatic and aliphatic-aromatic co-polyesters. Appl. Microbiol. Biotechnol. 2014, 98, 3437–3447. [Google Scholar] [CrossRef]
- Singh, B.; Sharma, N. Mechanistic implications of plastic degradation. Polym. Degrad. Stab. 2008, 93, 561–584. [Google Scholar] [CrossRef]
- Artham, T.; Doble, M. Biodegradation of aliphatic and aromatic polycarbonates. Macromol. Biosci. 2008, 8, 14–24. [Google Scholar] [CrossRef] [PubMed]
- Panda, T.; Gowrishankar, B.S. Production and applications of esterases. Appl. Microbiol. Biotechnol. 2005, 67, 160–169. [Google Scholar] [CrossRef]
- Mohite, A.S.; Rajpurkar, Y.D.; More, A.P. Bridging the gap between rubbers and plastics: A review on thermoplastic polyolefin elastomers. Polym. Bull. 2022, 79, 1309–1343. [Google Scholar] [CrossRef]
- Rajeev, R.; De, S. Thermoplastic elastomers based on waste rubber and plastics. Rubber Chem. Technol. 2004, 77, 569–578. [Google Scholar] [CrossRef]
- Deshwal, G.K.; Alam, T.; Panjagari, N.R.; Bhardwaj, A. Utilization of Cereal Crop Residues, Cereal Milling, Sugarcane and Dairy Processing By-Products for Sustainable Packaging Solutions. J. Polym. Environ. 2021, 29, 2046–2061. [Google Scholar] [CrossRef]
- Selvaraj, V.; Karthika, T.S.; Mansiya, C.; Alagar, M. An over review on recently developed techniques, mechanisms and intermediate involved in the advanced azo dye degradation for industrial applications. J. Mol. Struct. 2020, 1224, 129195. [Google Scholar] [CrossRef]
- Popli, S.; Patel, U.D. Destruction of azo dyes by anaerobic–aerobic sequential biological treatment: A review. Int. J. Environ. Sci. Technol. 2015, 12, 405–420. [Google Scholar] [CrossRef] [Green Version]
- Fadeeva, Z.; Van Berkel, R. Unlocking circular economy for prevention of marine plastic pollution: An exploration of G20 policy and initiatives. J. Environ. Manag. 2021, 277, 111457. [Google Scholar] [CrossRef]
- Nammalwar, P. Plastics pollution in coastal marine environment—A review. EVERYMANS Sci. 2019, 54, 316–320. [Google Scholar]
- Veerasingam, S.; Ranjani, M.; Venkatachalapathy, R.; Bagaev, A.; Mukhanov, V.; Litvinyuk, D.; Mugilarasan, M.; Gurumoorthi, K.; Guganathan, L.; Aboobacker, V.M.; et al. Contributions of Fourier transform infrared spectroscopy in microplastic pollution research: A review. Crit. Rev. Environ. Sci. Technol. 2021, 51, 2681–2743. [Google Scholar] [CrossRef]
- Ajith, N.; Arumugam, S.; Parthasarathy, S.; Manupoori, S.; Janakiraman, S. Global distribution of microplastics and its impact on marine environment—A review. Environ. Sci. Pollut. Res. 2020, 27, 25970–25986. [Google Scholar] [CrossRef]
- Laskar, N.; Kumar, U. Plastics and microplastics: A threat to environment. Environ. Technol. Innov. 2019, 14, 100352. [Google Scholar]
- Rao, B.M. Microplastics in the Aquatic Environment Implications for Post-Harvest Fish Quality. Available online: http://drs.cift.res.in/handle/123456789/4213 (accessed on 31 March 2021).
- Rezania, S.; Park, J.; Din, M.F.M.; Taib, S.M.; Talaiekhozani, A.; Yadav, K.K.; Kamyab, H. Microplastics pollution in different aquatic environments and biota: A review of recent studies. Mar. Pollut. Bull. 2018, 133, 191–208. [Google Scholar] [CrossRef] [PubMed]
- Anbumani, S.; Kakkar, P. Ecotoxicological effects of microplastics on biota: A review. Environ. Sci. Pollut. Res. 2018, 25, 14373–14396. [Google Scholar] [CrossRef]
- Sharma, B.; Jain, P. Deciphering the advances in bioaugmentation of plastic wastes. J. Clean. Prod. 2020, 275, 123241. [Google Scholar] [CrossRef]
- Gopinath, K.P.; Nagarajan, V.M.; Krishnan, A.; Malolan, R. A critical review on the influence of energy, environmental and economic factors on various processes used to handle and recycle plastic wastes: Development of a comprehensive index. J. Clean. Prod. 2020, 274, 123031. [Google Scholar] [CrossRef]
- Maurya, A.; Bhattacharya, A.; Khare, S.K. Enzymatic Remediation of Polyethylene Terephthalate (PET)–Based Polymers for Effective Management of Plastic Wastes: An Overview. Front. Bioeng. Biotechnol. 2020, 8, 1332. [Google Scholar] [CrossRef]
- Dey, A.; Dhumal, C.V.; Sengupta, P.; Kumar, A.; Pramanik, N.K.; Alam, T. Challenges and possible solutions to mitigate the problems of single-use plastics used for packaging food items: A review. J. Food Sci. Technol. 2020, 58, 3251–3269. [Google Scholar] [CrossRef]
- Chohan, J.S.; Boparai, K.S.; Singh, R.; Hashmi, M.S.J. Manufacturing techniques and applications of polymer matrix composites: A brief review. Adv. Mater. Process. Technol. 2020, 1–11. [Google Scholar] [CrossRef]
- Murthy, K.; Shetty, R.J.; Shiva, K. Plastic waste conversion to fuel: A review on pyrolysis process and influence of operating parameters. Energy Sources Part A Recovery Util. Environ. Eff. 2020, 1–21. [Google Scholar] [CrossRef]
- Rajendran, K.M.; Chintala, V.; Sharma, A.; Pal, S.; Pandey, J.K.; Ghodke, P. Review of catalyst materials in achieving the liquid hydrocarbon fuels from municipal mixed plastic waste (MMPW). Mater. Today Commun. 2020, 24, 100982. [Google Scholar] [CrossRef]
- Kasar, P.; Sharma, D.; Ahmaruzzaman, M. Thermal and catalytic decomposition of waste plastics and its co-processing with petroleum residue through pyrolysis process. J. Clean. Prod. 2020, 265, 121639. [Google Scholar] [CrossRef]
- Banu, J.R.; Sharmila, V.G.; Ushani, U.; Amudha, V.; Kumar, G. Impervious and influence in the liquid fuel production from municipal plastic waste through thermo-chemical biomass conversion technologies—A review. Sci. Total. Environ. 2020, 718, 137287. [Google Scholar] [CrossRef] [PubMed]
- Mohanraj, C.; Senthilkumar, T.; Chandrasekar, M. A review on conversion techniques of liquid fuel from waste plastic materials. Int. J. Energy Res. 2017, 41, 1534–1552. [Google Scholar]
- Panda, A.K.; Singh, R.K.; Mishra, D. Thermolysis of waste plastics to liquid fuel: A suitable method for plastic waste management and manufacture of value added products—A world prospective. Renew. Sustain. Energy Rev. 2010, 14, 233–248. [Google Scholar] [CrossRef]
- Pakiya Pradeep, A.; Gowthaman, S. Combustion and emission characteristics of diesel engine fuelled with waste plastic oil—A review. Int. J. Ambient. Energy 2019, 43, 1269–1287. [Google Scholar] [CrossRef]
- Damodharan, D.; Kumar, B.R.; Gopal, K.; De Poures, M.V.; Sethuramasamyraja, B. Utilization of waste plastic oil in diesel engines: A review. Rev. Environ. Sci. Bio/Technol. 2019, 18, 681–697. [Google Scholar] [CrossRef]
- Dwivedi, P.; Mishra, P.; Mondal, M.K.; Srivastava, N. Non-biodegradable polymeric waste pyrolysis for energy recovery. Heliyon 2019, 5, e02198. [Google Scholar] [CrossRef] [Green Version]
- Ragupathi, K.; Mani, I. Durability and lube oil contamination study on diesel engine fueled with various alternative fuels: A review. Energy Sources Part A Recovery Util. Environ. Eff. 2021, 43, 932–943. [Google Scholar] [CrossRef]
- Gomathi, N.; Rupesh, P. Study On the Performance of Plastic Waste Oil in CI Engines: A Review. Res. J. Pharm. Biol. Chem. Sci. 2016, 7, 1689–1696. [Google Scholar]
- Dinika, I.; Verma, D.K.; Balia, R.; Utama, G.L.; Patel, A.R. Potential of cheese whey bioactive proteins and peptides in the development of antimicrobial edible film composite: A review of recent trends. Trends Food Sci. Technol. 2020, 103, 57–67. [Google Scholar] [CrossRef]
- Subramaniam, D.; Murugesan, A.; Avinash, A.; Kumaravel, A. Bio-diesel production and its engine characteristics—An expatiate view. Renew. Sustain. Energy Rev. 2013, 22, 361–370. [Google Scholar] [CrossRef]
- Tiwari, A.; Singh, S.; Nagar, R. Feasibility assessment for partial replacement of fine aggregate to attain cleaner production perspective in concrete: A review. J. Clean. Prod. 2016, 135, 490–507. [Google Scholar] [CrossRef]
- Sharma, R.; Bansal, P.P. Use of different forms of waste plastic in concrete—a review. J. Clean. Prod. 2016, 112, 473–482. [Google Scholar] [CrossRef]
- Siddique, R.; Khatib, J.; Kaur, I. Use of recycled plastic in concrete: A review. Waste Manag. 2008, 28, 1835–1852. [Google Scholar] [CrossRef] [PubMed]
- Srinivasa, P.; Tharanathan, R. Chitin/chitosan—Safe, ecofriendly packaging materials with multiple potential uses. Food Rev. Int. 2007, 23, 53–72. [Google Scholar] [CrossRef]
- Dave, P.N.; Joshi, A.K. Plasma pyrolysis and gasification of plastics waste–a review. NISCAIR Online Period. Repos. 2010, 69, 177–179. [Google Scholar]
- Pant, D.; Singh, R.; Kumar, S. Management of waste poly vinyl chloride (PVC) through chemical modification. NISCAIR Online Period. Repos. 2012, 71, 181–186. [Google Scholar]
- Maharana, T.; Negi, Y.; Mohanty, B. Recycling of polystyrene. Polym.-Plast. Technol. Eng. 2007, 46, 729–736. [Google Scholar] [CrossRef]
- Kumar, S.; Panda, A.K.; Singh, R.K. A review on tertiary recycling of high-density polyethylene to fuel. Resour. Conserv. Recycl. 2011, 55, 893–910. [Google Scholar] [CrossRef]
- Roy, P.K.; Hakkarainen, M.; Varma, I.K.; Albertsson, A.-C. Degradable polyethylene: Fantasy or reality. Environ. Sci. Technol. 2011, 45, 4217–4227. [Google Scholar]
- Khan, M.Z.R.; Srivastava, S.K.; Gupta, M. A state-of-the-art review on particulate wood polymer composites: Processing, properties and applications. Polym. Test. 2020, 89, 106721. [Google Scholar] [CrossRef]
- Abraham, A.; Chakraborty, P. A review on sources and health impacts of bisphenol A. Rev. Environ. Health 2019, 35, 201–210. [Google Scholar] [CrossRef] [PubMed]
- Sinha, A.; Wu, L.; Lu, X.; Chen, J.; Jain, R. Advances in sensing and biosensing of bisphenols: A review. Anal. Chim. Acta 2018, 998, 1–27. [Google Scholar]
- Chouhan, S.; Yadav, S.K.; Prakash, J.; Singh, S.P. Effect of Bisphenol A on human health and its degradation by microorganisms: A review. Ann. Microbiol. 2014, 64, 13–21. [Google Scholar] [CrossRef]
- Husain, Q.; Qayyum, S. Biological and enzymatic treatment of bisphenol A and other endocrine disrupting compounds: A review. Crit. Rev. Biotechnol. 2013, 33, 260–292. [Google Scholar] [CrossRef]
- Priyanka, M.; Dey, S. Ruminal impaction due to plastic materials-An increasing threat to ruminants and its impact on human health in developing countries. Vet. World 2018, 11, 1307. [Google Scholar] [CrossRef] [Green Version]
- Makhijani, K.; Kumar, R.; Sharma, S.K. Biodegradability of blended polymers: A comparison of various properties. Crit. Rev. Environ. Sci. Technol. 2015, 45, 1801–1825. [Google Scholar] [CrossRef]
- Raj, B.; Kumar, J.; Rao, V.V.L.K. Plastic/packaging waste separation from MSW and its conversion and used as value-added products in different applications: An eco-sustainable approach. NISCAIR Online Period. Repos. 2020, 27, 193–208. [Google Scholar]
- Kumar, R.; Singh, R.; Ahuja, I.; Hashmi, M. Processing techniques of polymeric materials and their reinforced composites. Adv. Mater. Process. Technol. 2020, 6, 591–607. [Google Scholar] [CrossRef]
- Sharma, S.S.; Batra, V.S. Production of hydrogen and carbon nanotubes via catalytic thermo-chemical conversion of plastic waste. J. Chem. Technol. Biotechnol. 2020, 95, 11–19. [Google Scholar] [CrossRef]
- Kumar, G.; Ponnusamy, V.K.; Bhosale, R.R.; Shobana, S.; Yoon, J.-J.; Bhatia, S.K.; Banu, J.R.; Kim, S.-H. A review on the conversion of volatile fatty acids to polyhydroxyalkanoates using dark fermentative effluents from hydrogen production. Bioresour. Technol. 2019, 287, 121427. [Google Scholar] [CrossRef] [PubMed]
- Gharde, S.; Kandasubramanian, B. Mechanothermal and chemical recycling methodologies for the Fibre Reinforced Plastic (FRP). Environ. Technol. Innov. 2019, 14, 100311. [Google Scholar] [CrossRef]
- Devasahayam, S.; Raman, R.K.; Chennakesavulu, K.; Bhattacharya, S. Plastics—Villain or Hero? Polymers and Recycled Polymers in Mineral and Metallurgical Processing—A Review. Materials 2019, 12, 655. [Google Scholar] [CrossRef] [Green Version]
- Thakur, S.; Verma, A.; Sharma, B.; Chaudhary, J.; Tamulevicius, S.; Thakur, V.K. Recent developments in recycling of polystyrene based plastics. Curr. Opin. Green Sustain. Chem. 2018, 13, 32–38. [Google Scholar] [CrossRef] [Green Version]
- Mishra, R.K.; Ha, S.K.; Verma, K.; Tiwari, S.K. Recent progress in selected bio-nanomaterials and their engineering applications: An overview. J. Sci. Adv. Mater. Devices 2018, 3, 263–288. [Google Scholar] [CrossRef]
- Bukkarapu, K.R.; Gangadhar, D.S.; Jyothi, Y.; Kanasani, P. Management, conversion, and utilization of waste plastic as a source of sustainable energy to run automotive: A review. Energy Sources Part A Recovery Util. Environ. Eff. 2018, 40, 1681–1692. [Google Scholar] [CrossRef]
- Unnisa, S.A.; Hassanpour, M. Development circumstances of four recycling industries (used motor oil, acidic sludge, plastic wastes and blown bitumen) in the world. Renew. Sustain. Energy Rev. 2017, 72, 605–624. [Google Scholar] [CrossRef]
- UNIDO. Recycling of Plastics in Indian Perspective. Available online: https://www.unido.org/sites/default/files/files/2018-11/Plenary%202%20-%20Plastics%20-%20Mohanty.pdf (accessed on 3 March 2021).
- Ritchie, H.; Roser, M. Plastic Pollution. Available online: https://ourworldindata.org/plastic-pollution (accessed on 31 March 2021).


| Item | India | EU | China | Pakistan | USA | Brazil | South Africa | Australia |
|---|---|---|---|---|---|---|---|---|
| Population (in millions) (according to 2020) | 1380 (Data source: [24]) | 447.32 (Data source: [25]) | 1410.93 (Data source: [24]) | 220.89 (Data source: [24]) | 329.48 (Data source: [24]) | 212.56 (Data source: [24]) | 59.31 (Data source: [24]) | 25.687 (Data source: [24]) |
| Region | Asia | Europe | Asia | Asia | North America | South America | Africa | Oceania |
| Plastic production (in Mt) | 22 Mt per year (according to 2020) [26] | Around 55 Mt (in 2020) [27] | 78 Mt (in 2020) [28] | 0.745 Mt (as of 2020) [29] | 49 Mt (in 2019) [30] | 7.1 Mt (as of 2019) (mainly processed plastics) [31] | 9.0 Mt (between 2009 and 2015) [32] | Approximately 1.4 Mt was processed in local manufacturing industries using either virgin resins (both locally manufactured and imported) or recyclate-based resins [33] |
| Plastic consumption | 20 kg/capita/year (predicted for 2022) [34]. In 2017–18, total of 16.5 Mt was consumed [35] | 84 and 129 kg per capita per year [36]. 112 kg/person (for the period 2010–2019) [36] | 46 kg/capita (as of 2017) and annually, 63 Mt [37] | 6.5 kg/capita [38] | 37 Mt/year [39] | 6.5 Mt (in 2017) [40] | 24.5 kg/capita/year (including local primary production) [32] | Total: 3.4 Mt (as of 2019–20) [33], 130 kg/capita/year [41] |
| Plastic waste generation | 9.4 Mt/year (as of 2019) [26] | 33.48 kg/person (plastic packaging in 2018) [42]. In 2020, more than 29 Mt of plastic post-consumer waste was collected [43] | In 2019, 335.46 Mt (between 2004 and 2019) [44]. In 2019, 26.74 Mt was generated [45] | 3.9 Mt (in 2020) [46] | 35.7 Mt in 2018, which was 12.2 percent of MSW generation. [47] | 11.85 Mt/year [48] | 1.144 Mt [32] | 2.5 Mt/year [49] |
| Source of plastic waste generation (main sectors/products) | Plastic packaging from grocery to food and vegetable products, to cosmetics and consumer items [50] | Packaging, non-packaging household, construction and demolition, electrical and electronic equipment, automobile agriculture [51] | Sectors: packaging, building and construction, automobiles, electronics, agriculture. Materials: PE, PP, PVC, PS, ABS [37] | Plastic bags, pet bottles [52] | Bags, sacks and wraps; other packaging; polyethylene terephthalate (PET) bottles and jars; high-density polyethylene (HDPE) natural bottles; and other containers [47] | high-density polyethylene (HDPE), low-density polyethylene (LDPE), polypropylene (PP), polyethylene terephthalate (PET), and polystyrene (PS) [53] | LDPE, PET, PP, synthetic rubber, polyester, HDPE, PS, PVC [54] | PET, HDPE, PVC, LDPE, PP [33] |
| Plastic waste recycling rate | Between 5% and 25% identified by Siddiqui and Pandey [55] | 41% (in 2019) [56] | 30% [45] | 33% [57] | 8.7% (overall recycling rate) (in 2018). PET bottles and jars recycling rate was 29.1% and HDPE natural bottles was 29.3% [47] | 25.8% [40] | 43.7% (as of 2017) [58] | 13.1% (as of 2019–2020) [33] |
| Regulation around single-use plastics | Banned in 25 states, partially banned in 5 states, and not banned in 2 states. Details are given in Section 3.6 [59,60,61,62] | Certain single-use plastics are banned where alternatives are available. Ban enforced on 2 July 2021 [59] | Ban on non-industrial plastic waste and gradual phasing out of non-degradable plastics [44] | Ban on single-use plastic (polythene) bags [46] | On a federal level, no ban is imposed. A list of states that have full or partial ban can be found in the reference of [60] | Bill No. 263/2018. Ban on plastic bags for packaging and transportation of goods and food and beverage utensils [61] | Banned single-use plastic bags in May 2002 [62] | Varies by states. Single-use plastic straws, drink stirrers, and cutlery are banned in South Australia, which was imposed on 1 March 2021. Tasmania and the Northern Territory have no commitments. Victoria is in the process of passing laws; laws passed in the state of Australian Capital Territory, Queensland, New South Wales and Western Australia [63] |
| Framework/general regulation on plastic waste management | First regulation was enforced in 2011 as plastic waste management rules 2011. Later, amendments were made in 2016, 2018, and 2021. Details are given in Section 3.6 [64,65,66,67,68] | Ban on the export of plastic waste to non-OECD countries as a Regulation (EU) 2020/2017 enforced on 22 December 2020 [69] | In 2018, non-industrial plastic waste import was banned, and in 2020, the gradual phasing out of problematic plastics was called for by the Chinese government [44] | Statutory Regulatory Order is in place for plastic bags in Federal Capital Islamabad and other cities including Lahore and Hunza [70] | Federal Regulations for Extended Producer Responsibility has been drafted by the Environmental Protection Agency [71] | A law related to replacement of plastic bags has been passed in Rio in 2019. Some states prohibit distribution of plastic bags in supermarkets [72] | No specific environmental legislation on plastic waste (except ban on single-use plastics) [73] | In December 2020, Australian Government’s Recycling and Waste Reduction Act 2020 was passed, banning export of plastic waste [49]. |
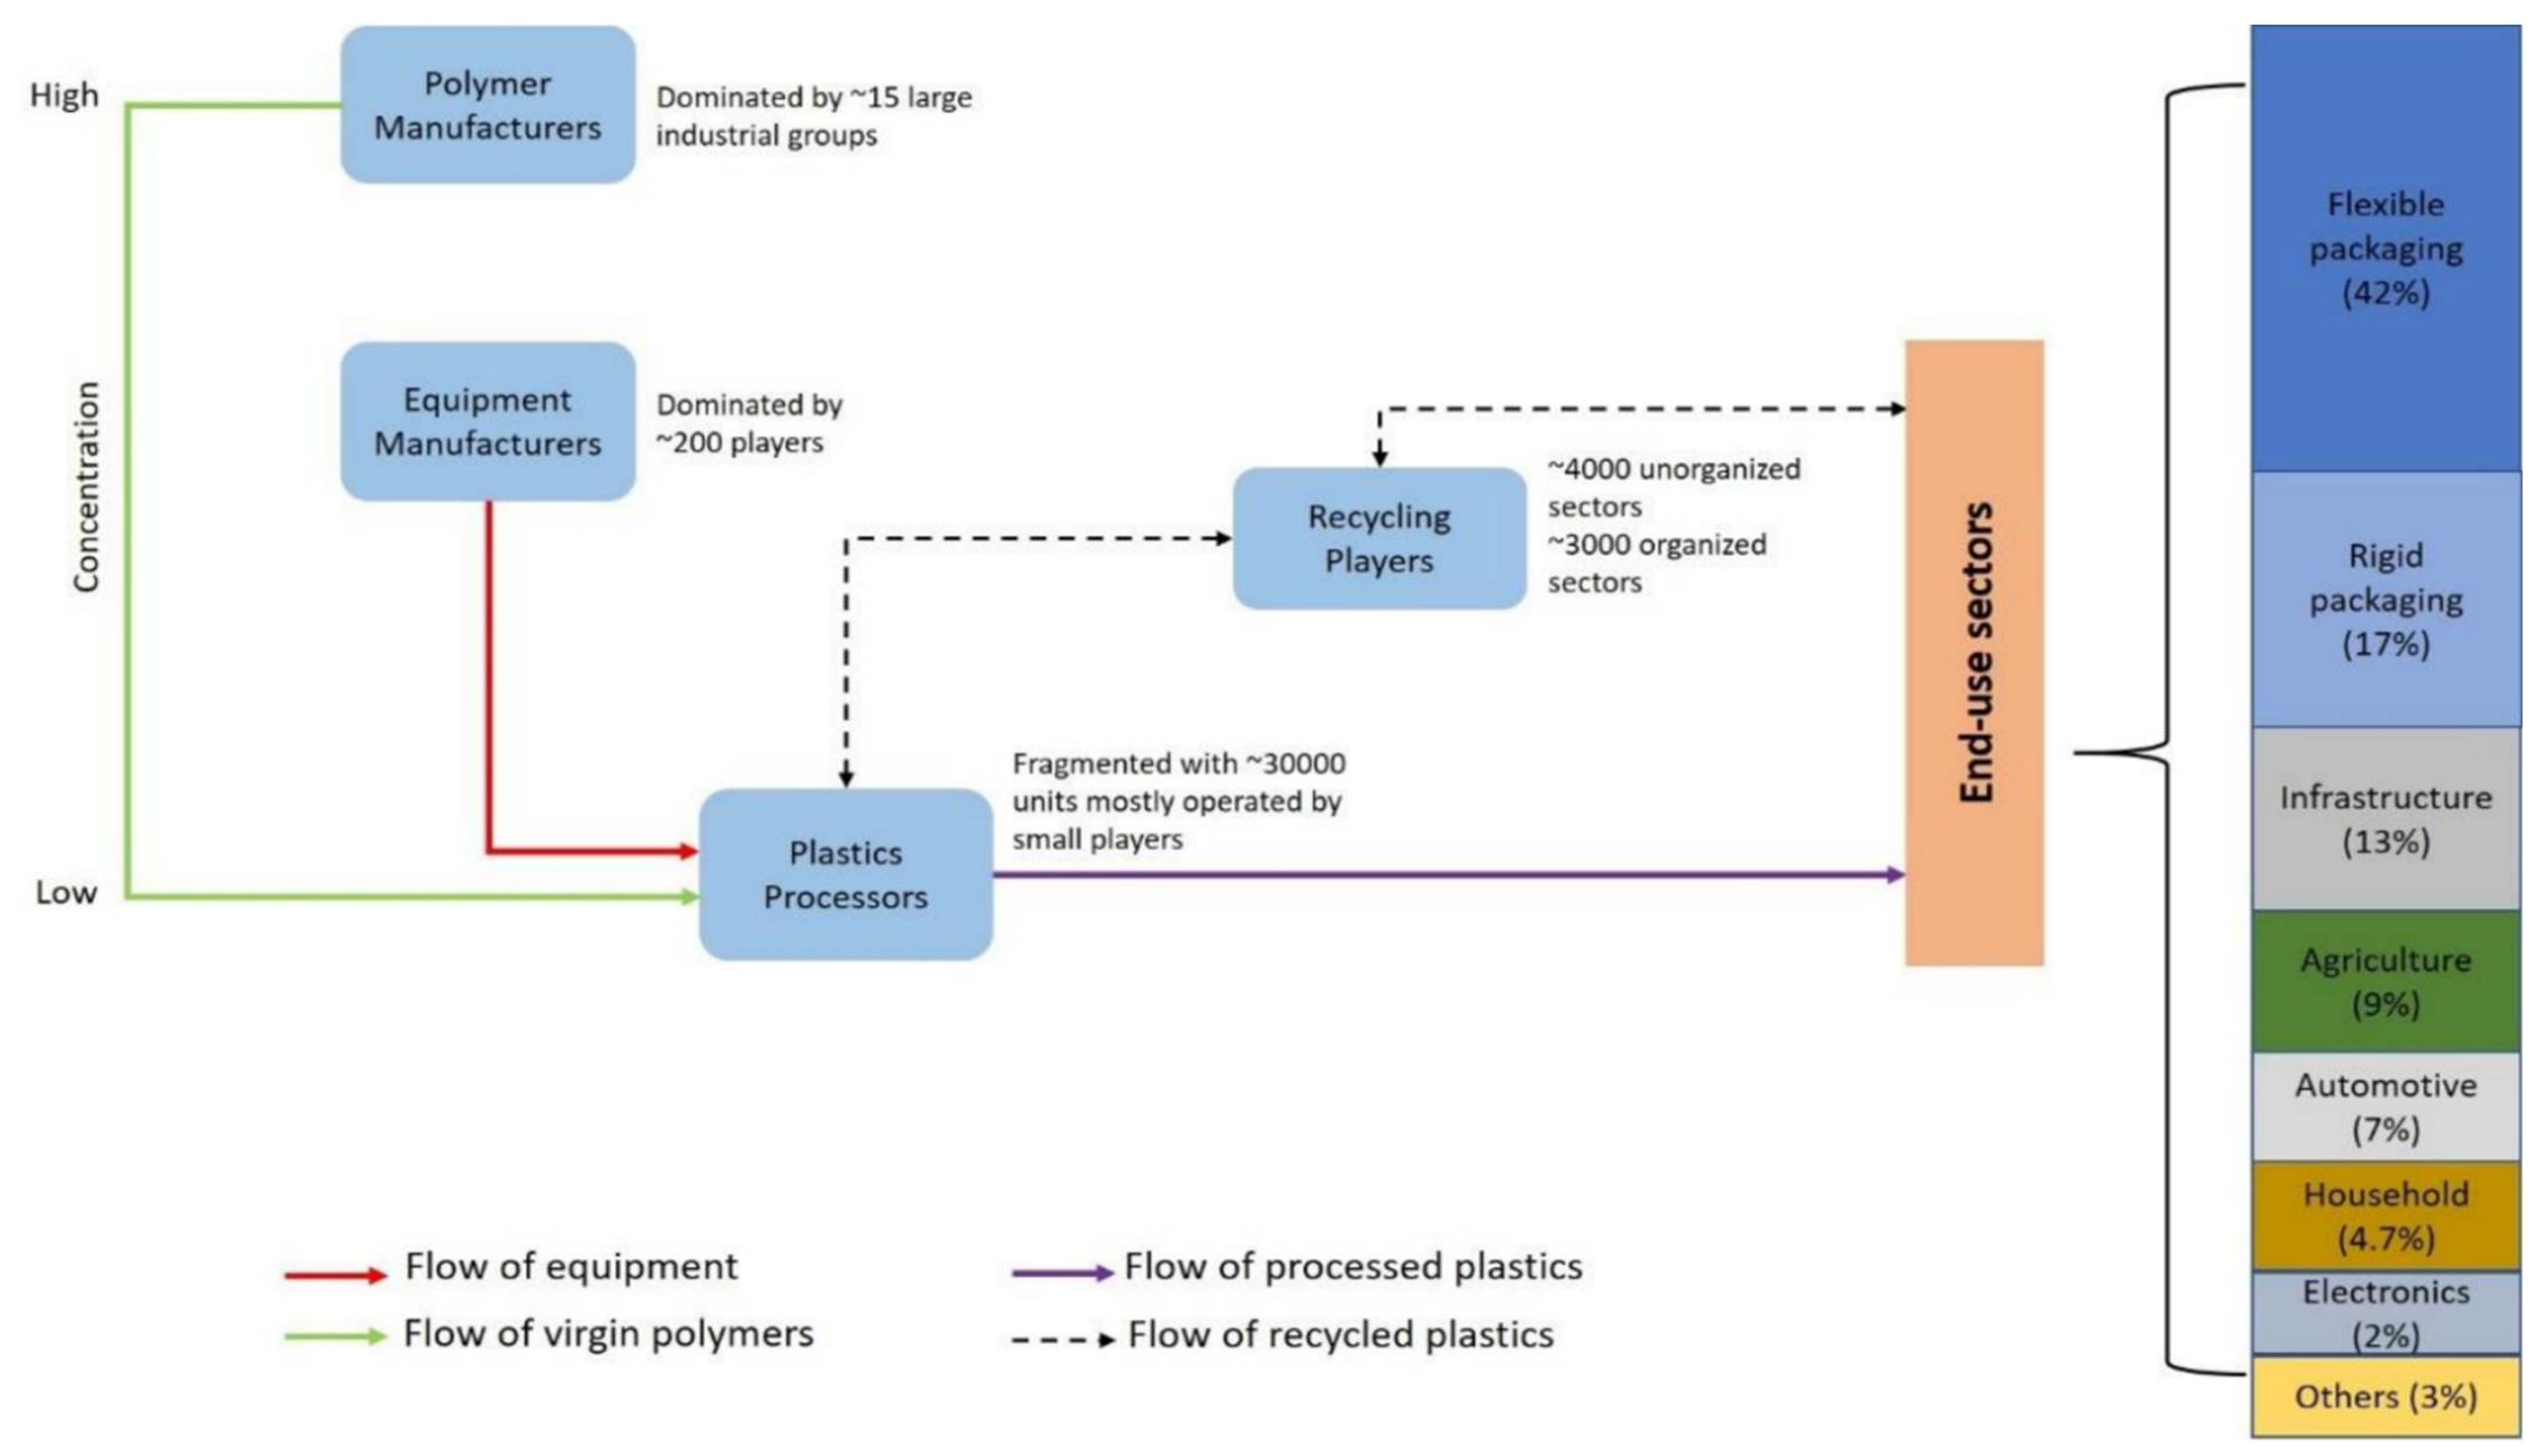
| Industry structure (stakeholders involved including recycling and/or reprocessing sector) (value chain partners) | Polymer manufacturers, equipment manufacturers, plastic processors, recycling players, end-user industries [74] | Plastics producers, technology providers, converters, recyclers, brand owners [75] | Plastic parts manufacturing industry, plastic injection mold manufacturing, plastic component trimming, plastic use sector, recycling and waste management partners [37,76] | Plastic raw material producers/suppliers, plastic processors, equipment and moldmakers, brand owners, recycling and sustainability partners [29] | Plastics manufacturing, plastics suppliers, end-user sectors [39,77] | Plastic cluster (first-generation basic petrochemicals producers, second-generation resin manufacturers, third-generation plastic products manufacturers), end-user industries, informal sector waste collectors, and processing/recycling industry [78] | Mostly import oriented. Plastic conversion plants, plastic end-user sectors [32] | Mostly imported plastics (70% of the products). Majority of companies are wholesale distributors [79] |
Publisher’s Note: MDPI stays neutral with regard to jurisdictional claims in published maps and institutional affiliations. |
© 2022 by the authors. Licensee MDPI, Basel, Switzerland. This article is an open access article distributed under the terms and conditions of the Creative Commons Attribution (CC BY) license (https://creativecommons.org/licenses/by/4.0/).
Share and Cite
Hossain, R.; Islam, M.T.; Shanker, R.; Khan, D.; Locock, K.E.S.; Ghose, A.; Schandl, H.; Dhodapkar, R.; Sahajwalla, V. Plastic Waste Management in India: Challenges, Opportunities, and Roadmap for Circular Economy. Sustainability 2022, 14, 4425. https://0-doi-org.brum.beds.ac.uk/10.3390/su14084425
Hossain R, Islam MT, Shanker R, Khan D, Locock KES, Ghose A, Schandl H, Dhodapkar R, Sahajwalla V. Plastic Waste Management in India: Challenges, Opportunities, and Roadmap for Circular Economy. Sustainability. 2022; 14(8):4425. https://0-doi-org.brum.beds.ac.uk/10.3390/su14084425
Chicago/Turabian StyleHossain, Rumana, Md Tasbirul Islam, Riya Shanker, Debishree Khan, Katherine Elizabeth Sarah Locock, Anirban Ghose, Heinz Schandl, Rita Dhodapkar, and Veena Sahajwalla. 2022. "Plastic Waste Management in India: Challenges, Opportunities, and Roadmap for Circular Economy" Sustainability 14, no. 8: 4425. https://0-doi-org.brum.beds.ac.uk/10.3390/su14084425