
Estimating Carbon Budget from Growth and Management of Urban Street Trees in South Korea


Department of Ecological Landscape Architecture Design, Kangwon National University, Chuncheon 24341, Korea
*
Author to whom correspondence should be addressed.
Sustainability 2022, 14(8), 4439; https://0-doi-org.brum.beds.ac.uk/10.3390/su14084439
Submission received: 12 February 2022
/
Revised: 23 March 2022
/
Accepted: 7 April 2022
/
Published: 8 April 2022
(This article belongs to the Special Issue Urban Forestry and Ecology)
Abstract
:Although street trees take up carbon by vegetation growth, they emit carbon directly or indirectly into the atmosphere due to the need for regular management, such as pruning and, irrigation, etc. This study estimates the annual carbon budget from the growth and management of urban street trees in South Korea and suggests management strategies to minimize the degree of management and annual carbon emissions. Annual carbon emissions from management practices such as pruning, irrigation, pesticide and fungicide application, and fertilization were estimated based on maintenance data, interviews with managers, and actual measurements. Annual carbon emissions from the management of urban street trees were calculated to be 2.4 kg/tree/year. From this total, pruning was the largest contributor at 91%. The average net carbon uptake for each street tree was 5.5 kg/tree/year. The street trees included in this study played an important role in carbon uptake, which was equivalent to 90–550% of the annual carbon emissions from street tree management. Based on these results, suggested management strategies include pruning, irrigation, pesticide and fungicide application, and fertilization. These study results will be useful for designing practical low-carbon landscapes with minimal management and carbon emissions.
1. Introduction
One of the challenges facing our society is to reduce carbon dioxide (CO2) emissions and mitigate climate change. Urbanization and other human activities that release greenhouse gases into the atmosphere are the primary drivers of climate change [1]. CO2 constitutes approximately 60% of the greenhouse gases that cause global warming in the atmosphere, and its increasing concentration is predicted to harm humans and nature by increasing the earth’s temperature by an average of 4–5 °C [2,3]. Recently, COVID-19 led to a 7% decrease in CO2 emissions, but the global average concentration of CO2 (as of 2020) was 413.2 ppm, an increase of 48.6% from the pre-industrial level (278.0 ppm) [4]. In South Korea, the atmospheric CO2 concentration in 2020 was 420.4 ppm, 7.2 ppm higher than the global average [5]. The international community has agreed on various conventions and introduced policies to mitigate the many consequences of climate change which include heat waves, droughts, and floods.
In South Korea, approximately 14% of all carbon emissions come from the transportation sector, 94% of which occurred on roads in 2019 [6]. In response to climate change, urban space researchers are actively seeking alternative land use plans and transportation policies that reduce carbon emissions. In particular, the construction of compact cities, the expansion of bicycle/walkways, and the introduction of electric scooter sharing systems are being discussed as key strategies to reduce the carbon emissions caused by energy consumption [7,8,9,10,11,12]. Meanwhile, interest in urban trees that can directly take up carbon is also growing.
In the process of growing via photosynthesis, urban greenspaces directly sequester and accumulate CO2, and this atmospheric CO2 sequestration continues until the plants are cut or die. Moreover, urban greenspaces moderate urban climates by cooling the air, reducing wind speeds, and providing shade [13,14]. Specifically, street trees connect green areas in networks and reduce concentrations of both direct and indirect carbon emissions from their closest sources [15]. As the role of street trees as carbon reduction sources has become increasingly important, numerous studies [15,16,17,18,19,20,21,22,23,24,25,26,27,28] have investigated the efficacy of this strategy worldwide.
On the other hand, while street trees are a carbon sink, they also either directly or indirectly emit carbon into the atmosphere due to their need for management such as pruning, irrigation, pesticide and fungicide application, and fertilization [29]. Carbon emissions from management practices have the negative consequences of offsetting some of the trees’ carbon uptake [29]. Accordingly, quantifying the energy consumption and carbon emissions of street tree management is necessary to understand the urban street carbon budget and to establish carbon planting and management strategies. However, related research remains limited both domestically and internationally [16,29,30,31,32].
Jo and Cho [16] calculated the annual carbon emissions of pruning Ginkgo biloba trees and Platanus occidentalis found most commonly on streets. Jo [30] quantified energy consumption and carbon emissions caused by plant management depending on land use type in selected cities around South Korea. McPherson and Kendall [31] and McPherson et al. [32] quantified carbon emissions and emission effects by assessing the entire process of management (including irrigation and pruning) in selected green areas around Los Angeles. Recently, Jo [29] calculated the volume of carbon emissions from street tree management, including pruning, irrigation, and pesticide application. As mentioned above, studies on street trees have focused on carbon uptake, so there is limited information relating to the various steps of street tree management, such as pruning, irrigation, pesticide and fungicide application, and fertilization. There is thus a need for follow-up studies to review and verify the small number of existing studies.
Therefore, the first objective of this study is to quantify the annual carbon emissions of street trees from pruning, irrigation, pesticide and fungicide application, and fertilization in South Korea. The second objective is to estimate the carbon budget based on the growth and management of urban street trees in order to suggest management strategies to minimize the degree of management and carbon emissions. The management strategies this study proposes will be useful for designing practical low carbon landscapes with minimal management and carbon emissions. In this study, direct emissions refer to those created through the consumption of fossil fuels (such as by operating equipment for urban street tree management), while indirect emissions refer to those created through fossil fuel consumption during the process of manufacturing fertilizers or fungicides. Annual net carbon uptake refers to the number calculated by subtracting annual carbon emissions from annual carbon uptake.
2. Materials and Methods
2.1. Framework
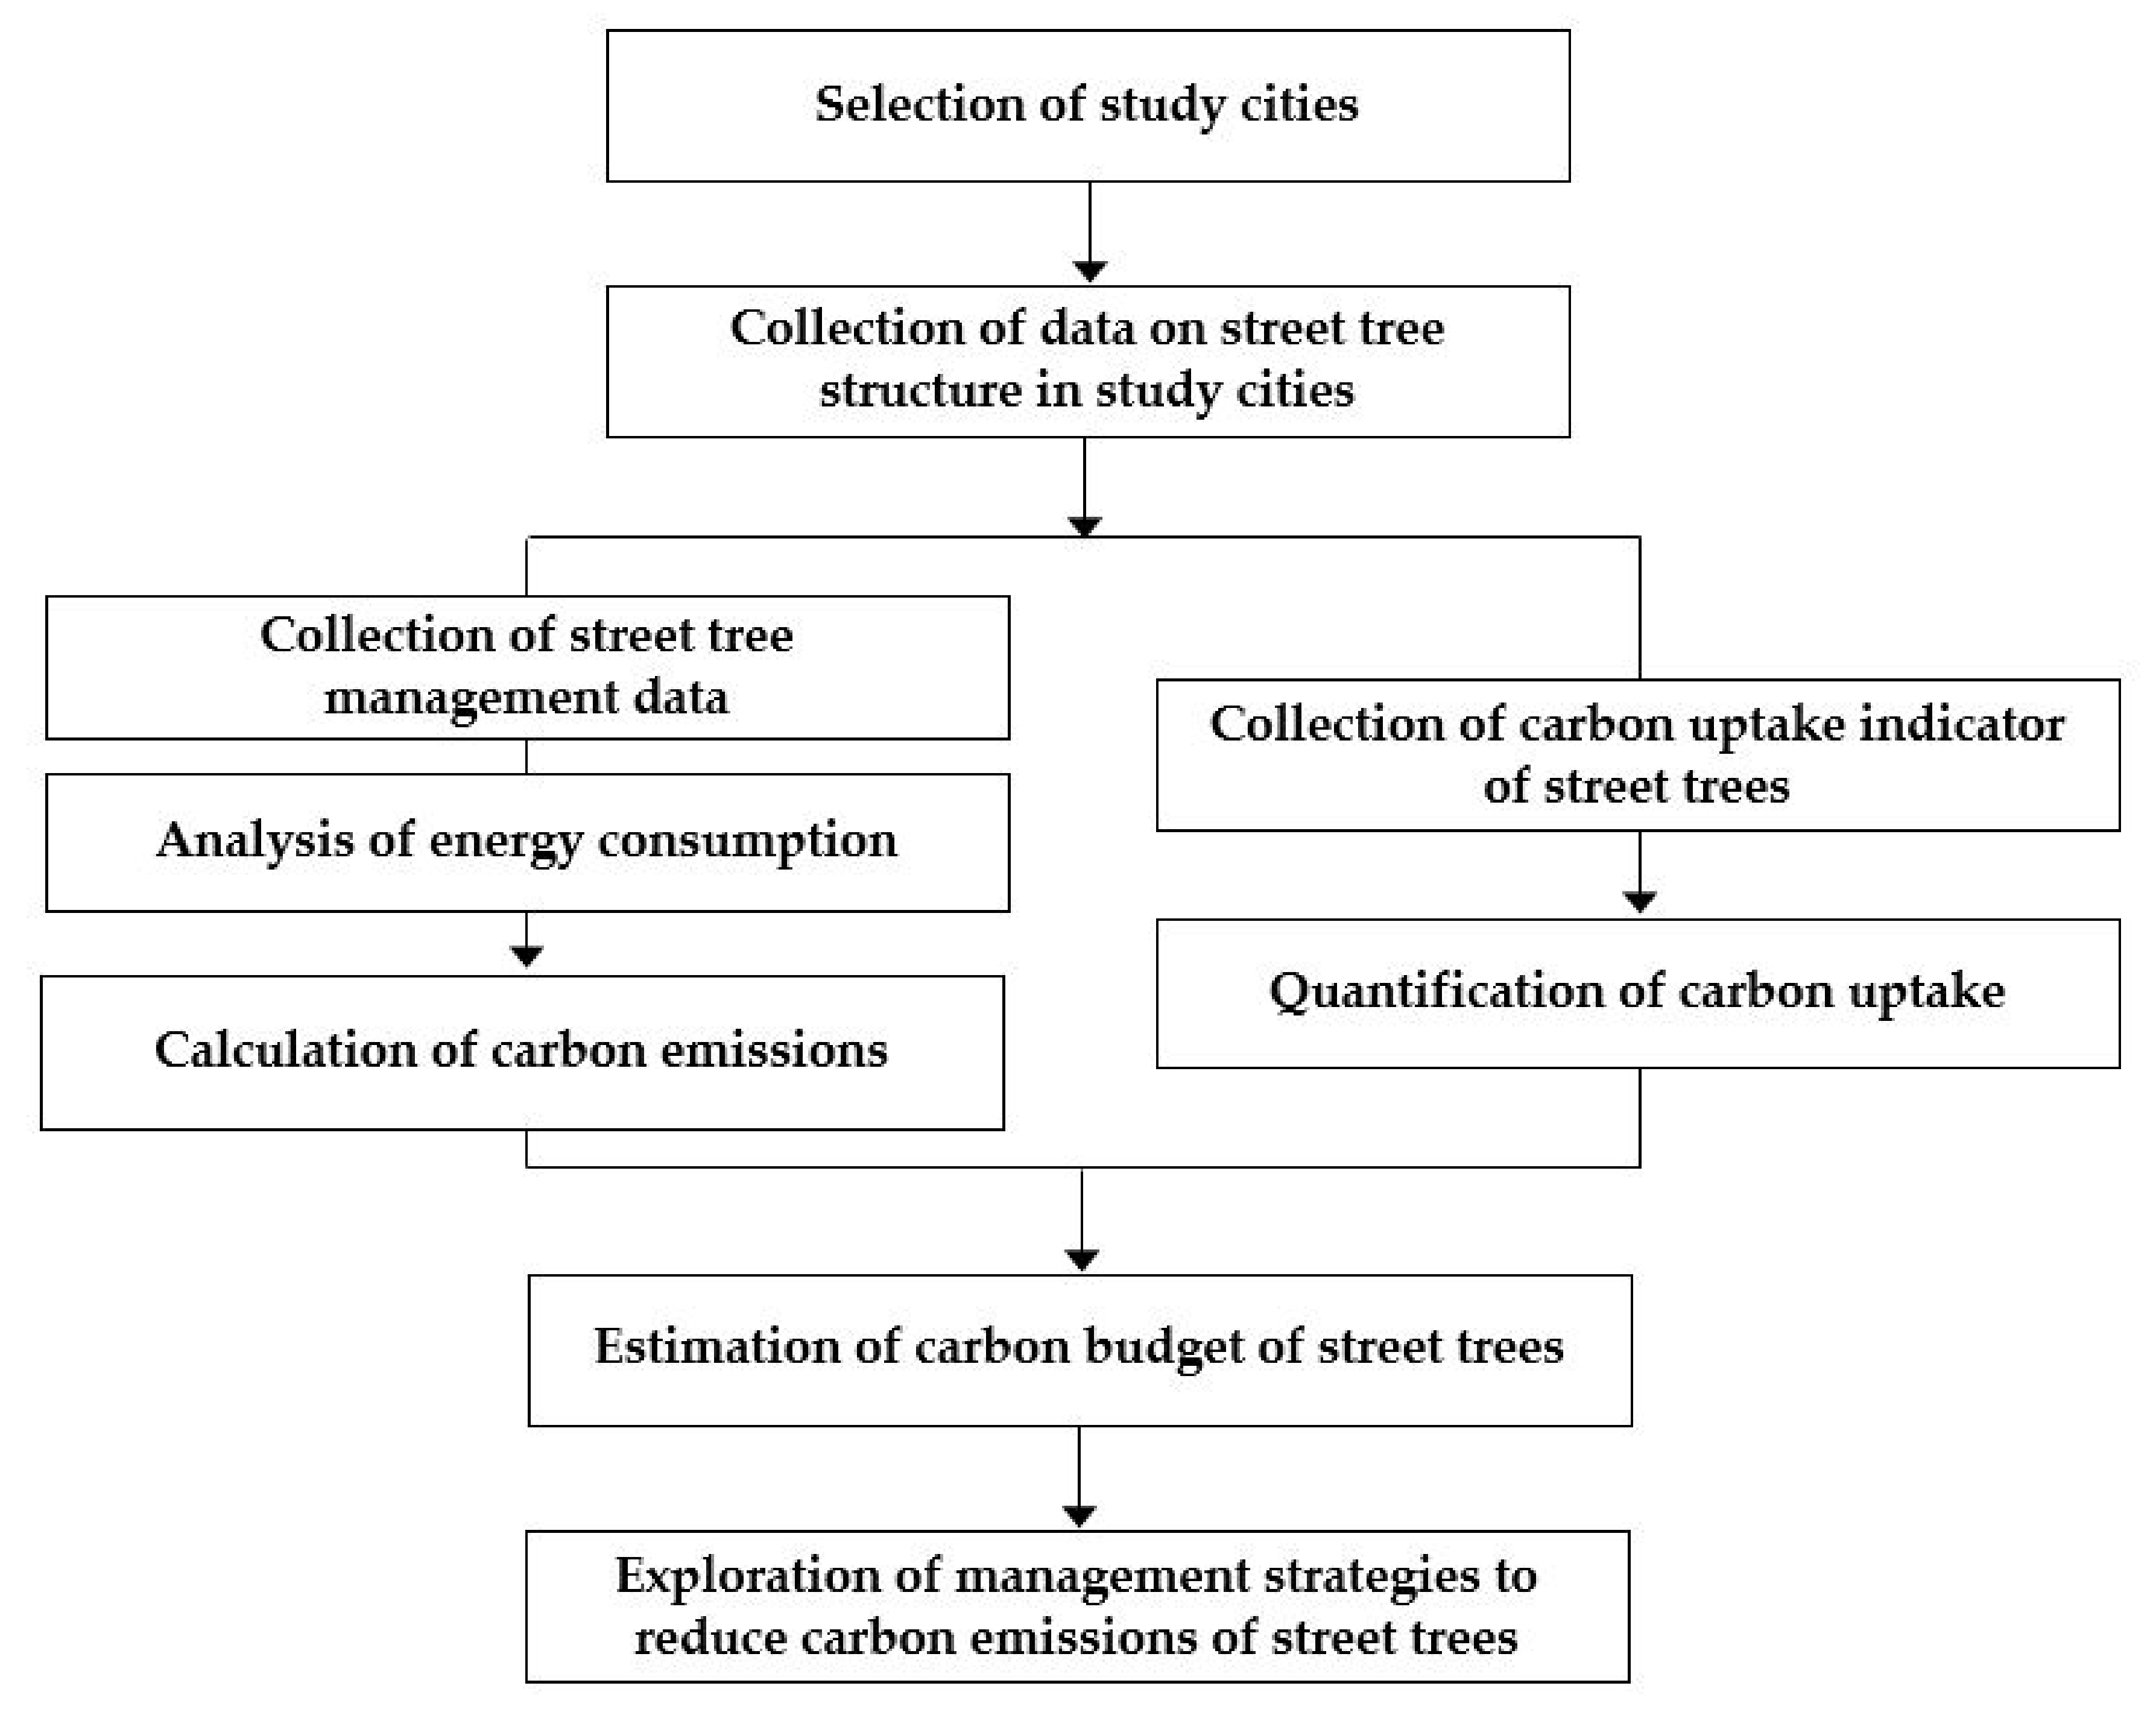
Figure 1 shows the process of this study. The study consists of nine phases: (1) selection of study cities; (2) collection of street tree structure data in study cities; (3) collection of street tree management data; (4) analysis of energy consumption; (5) calculation of carbon emissions; (6) collection of carbon uptake indicator for street trees; (7) quantification of carbon uptake; (8) estimation of carbon budget for street trees; and (9) exploration of management strategies to reduce the carbon emissions generated by street tree management.
This study selected eight cities, including large cities and small-to-medium-sized cities. For carbon emissions, direct and indirect energy consumption due to management, such as pruning, irrigation, pest control, and fertilization, was identified and then applied to the tree structure data in the study cities to calculate the carbon emissions per tree. The street tree structure data were constructed by this research team from a field survey during 2017–2020, and the data included information such as street tree species, populations, diameter, and height by city. Carbon uptake was calculated by identifying the indicator of carbon uptake for street trees by city and applying it to the total number of street trees by city. Based on these results, the net carbon uptake was calculated. In addition, the study suggested management strategies to reduce the carbon emissions from street tree management.
2.2. Selection of Study Cities and Management Practice
For this study, large- and small-to-medium-sized cities in South Korea were selected to estimate the carbon emission volume for the street tree management process. The large cities were Seoul, Daejeon, and Daegu, while the small-to-medium cities were Sejong, Suncheon, Chungju, Jeonju, and Chuncheon (Figure 2). The survey on carbon emissions related to street tree management was conducted focusing on management activities that are performed most frequently every year based on national street tree management data [33,34]. According to the national street tree management data, pest control was the most common among annual management activities, with an average of around 40.2%, followed by irrigation (23.7%), pruning (19.2%), and fertilization (10.8%). However, this study excluded management activities such as soil improvement (0.5%), surgical operation (0.1%), and weeding and winter preparation (5.5%), which took up relatively small proportions of management activities. In 2018–2020, interviews with street tree management managers (Dept. of Green Spaces and Parks) were conducted, maintenance data were collected, and some measurements were taken to observe the tree management status and analyze the energy consumption. For the street tree management survey method, see [29]. The details are outlined below.
2.2.1. Pruning
The focus on pruning concerned frequency, target tree species, the amount of pruning, tools, and energy consumption (e.g., chainsaws and high-place operation cars) (Figure 3). The amount of pruning was measured based on the Ginkgo biloba and Platanus occidentalis, which are large street tree species with a high frequency of planting and concentrated pruning in most study cities. With the cooperation of Daegu and Chuncheon, a total of 80 samples were measured, including 40 Ginkgo biloba and 40 Platanus occidentalis during pruning. The study referred to Jo and Cho [16] for a suitable method to measure the total amount of pruning, which was then calculated by using the street tree pruning waste formula for each city (this was also used for other street tree species).
The energy consumption of high-place operation cars was calculated based on street tree maintenance design reports and pruning work reports from the study cities. That is, the calculation was based on the material cost, including fuel consumption per tree, and the degree of pruning. Information on energy consumption related to chainsaw use was absent in all the study cities. The data were collected through an interview with the on-site manager during pruning.
2.2.2. Irrigation
Irrigation referred to the frequency and amount, tools used, and energy consumption (e.g., sprinkler trucks). The amount of irrigation per tree was calculated through an interview with the manager because it was difficult to measure on site. That is, it was calculated by checking the total irrigation amount and the number of street trees in the relevant section. Energy consumption according to the operation of the sprinkler trucks was calculated based on street tree maintenance design reports for each city in the study.
2.2.3. Pesticide and Fungicide Application
Pesticide and fungicide application information included frequency, target species, amount, tools, and energy consumption (e.g., power sprayers, work vehicles). The amount of pesticide and fungicide used per tree was calculated according to the Pesticide Usage Guidelines [35]. The amount refers to the amount of undiluted solution, not the total amount diluted with water. Energy consumption of power sprayers and work vehicles was calculated based on street tree maintenance design reports and pesticide and fungicide application work reports, and interviews with managers from the study cities.
2.2.4. Fertilization
Fertilization information included frequency, amount and type, tools, and energy consumption (e.g., hoe, shovel). The amount of fertilization used per tree was measured up to 10 g during fertilization. The standard amount was calculated by measuring the diameter at breast height (DBH) and the height of each tree before fertilization. In addition, the types and names of fertilizers commonly used for street trees in the study cities were collected, and the recommended amount used per DBH for each tree was identified for improved accuracy.
2.3. Estimation of Carbon Emissions
The direct carbon emissions according to each management activity were calculated by applying the carbon emission coefficients—0.61 kg C for gasoline and 0.71 kg C per 1 L for diesel consumption [36] (Figure 3). The pruning dry weight of a tree was converted into carbon emissions by multiplying the biomass by 0.5 because the average carbon content of the woody part and leaves of the tree is about 50% of the biomass [37,38]. The indirect carbon emissions from fertilization were based on [39]. For irrigation and pesticide and fungicide application, the average values of the coefficients from international studies were used, as there was no carbon emission coefficient study previously conducted in South Korea [40,41]. That is, the carbon emission coefficients for irrigation, pesticide application, fungicide application, and fertilization were 0.024 kg C/kg, 3.79 kg C/kg, 3.38 kg C/kg, and 0.221 kg C/kg, respectively. The carbon emissions per street tree were adjusted by adding or subtracting the value to reflect the weight of each management activity for each tree type [33,34]. The carbon emission by study cities was calculated by applying the calculated coefficient of carbon emissions per tree to number of street trees by each study city.
2.4. Estimation of Carbon Budget
The carbon budget is a useful indicator for accurately gauging the carbon reduction effect of street trees while accounting for emissions by management; it can be calculated using Equation (1). Annual carbon uptake (CU) was calculated by multiplying the average values of the coefficients of carbon uptake per street tree in each city (CUU) by the number of trees planted in each city (NT) [14,15,42] (Equation (2)). The carbon uptake coefficients were obtained from [14,15,42]. That is, the carbon uptake coefficients for Seoul, Daejeon, Daegu, Sejong, Chuncheon, Chungju, Jeonju, and Suncheon were 10.74, 7.26, 8.23, 3.23, 5.24, 5.41, 12.77, and 9.58 kg/tree/year, respectively. In addition, carbon emissions (CE) from management (including pruning, irrigation, pesticide and fungicide application, and fertilization) were subtracted from carbon uptake to obtain the net carbon uptake.
CB = CU − CE
CB: Carbon Budget, CU: Carbon Uptake, CE: Carbon Emissions
CU = CUU × NT
CUU: Coefficients of Carbon Uptake, NT: Number of Trees
3. Results and Discussion
3.1. Street Trees in Study Cities
As of 2019, there were a total of 8,230,200 street trees in South Korea. Ginkgo biloba was the most common at 36.9%, followed by Prunus jamasakura (23.0%), Cheiranthus retusus (15.1%), Zelkova serrata (8.2%), and Platanus occidentalis (3.7%) [43]. The number of street trees planted by study city was the highest in Seoul (307,346), followed by Daegu (225,978), Daejeon (140,799), Jeonju (64,033), Suncheon (63,455), Chungju (49,593), Chuncheon (25,935), and Sejong (15,418) [44,45,46,47,48,49,50,51] (Figure 4). Commonly planted street trees in the study cities were Ginkgo biloba, Prunus jamasakura, Zelkova serrata, and Chionanthus retusus [44,45,46,47,48,49,50,51].
In most cities (except Sejong), Ginkgo biloba and Platanus occidentalis were planted prior to 2000, and they had now grown into large trees with DBH of 20–60 cm. However, these large street trees are targeted for excessive pruning to protect high-voltage lines and communication lines, or because of complaints that they block the visibility of commercial signage and adjacent buildings. Pruning should be subject to appropriate planting and management, as excessive repeated pruning each year not only spoils the street tree landscape but also has environmental and ecological consequences including effects on carbon uptake.
3.2. Management Practice and Energy Consumption
3.2.1. Pruning
The annual frequency of pruning in the study cities was 1–2 times per year, mostly in the winter (dormant period) and summer (growth period). About 18% of all street trees are pruned every year in South Korea [33,34]. Trees that require annual pruning are Platanus occidentalis and Ginkgo biloba, which in this study were located under most high-voltage power lines in the study cities (except Sejong and Suncheon). Others (e.g., Zelkova serrata, Chionanthus retusus, Prunus jamasakura) were pruned once every 3 to 5 years, unless they were obstructing high-voltage lines, signboards, or adjacent buildings (Table 1). Diesel consumption (including operation of high-place operation cars) per street tree for each pruning was 1.02–3.82 L/tree/time depending on the degree of pruning and the diameter of the trees. Gasoline consumption for chainsaws per tree was 0.12 ± 0.03 L/tree/time for each pruning.
The annual pruning amounts (dry weight) of Ginkgo biloba and Platanus occidentalis were 2.5–23.8 kg/tree/time (DBH range 14.5–59.8 cm) and 11.5–52.1 kg/tree/time (DBH range 22.9–55.8 cm), respectively (Table 1). The crown volume of Platanus occidentalis was approximately 2.9 times larger than that of Ginkgo biloba. The pruning amount of Platanus occidentalis was 3.8 times more than that of Ginkgo biloba. Jo and Cho [16] reported that the annual pruning amounts of Ginkgo biloba and Platanus occidentalis were 11.4 and 34.9 kg/tree/year, respectively. The pruning amounts of Ginkgo biloba and Platanus occidentalis in this study were about 63.5% less. Conversely, for other tree species, each pruning amount was 0.4–8.7 kg/tree/time (DBH range 11.0–60.0 cm). Pruned branches are usually disposed of or recycled as wood chips.
3.2.2. Irrigation
The annual frequency of irrigation in the study cities was 2.8 ± 0.6 times per year (Table 1). Approximately 24% of all street trees are irrigated every year in South Korea [33,34], mainly newly planted trees or trees with poor growth during hot weather and prolonged drought. The amount of irrigation for each street tree was 2.7–5.0 L/tree/time, and depending on the city, the average was 3.8 ± 0.6 L/tree/time. Diesel consumption for running the sprinkler truck was 33.9–63.8 mL/tree/time for each use, with an average of 45.3 ± 7.8 mL/tree/time.
3.2.3. Pesticide and Fungicide Application
The annual frequency of pesticide and fungicide application in the study cities was approximately 2.4 ± 0.4 times from spring to summer (Table 1). Pest control is carried out on approximately 40% of all street trees every year in South Korea [33,34]. The total amounts of pesticides and fungicides deposited per street tree were 8.6 ± 1.7 g/tree/time and 9.1 ± 2.2 g/tree/time, respectively. The amounts of gasoline and diesel consumed per tree by power sprayers were 12.8 ± 0.3 mL/tree/time and 11.4 ± 3.6 mL/tree/time per round for vehicles.
The main target species for pest control were Platanus occidentalis (Stephanitis pyrioides, Hyphantria cunea), Ginkgo biloba (moths and black blight), Prunus jamasakura (aphids, Sternorrhyncha, and brown shot hole), and Pinus densiflora (aphids and mites). The pesticides used most frequently in this study were fenitrothion and diazinon (to prevent moths, mites, and aphids), while the dominant fungicide was mancozeb to prevent intellectual disease and powdery mildew.
3.2.4. Fertilization
The annual frequency of fertilization in the study cities was about once per years (Table 1). Fertilization is carried out on approximately 14% of all street trees every year in South Korea [33,34]. Landscaping solid fertilizers were deposited using a hoe or a shovel instead of energy-consuming electronic tools. The amount of solid fertilizer applied per tree depended on the DBH: 384.0 g/tree/time for 10 cm or less, 528.0 g/tree/time for 11–15 cm, 757.3 g/tree/time for 16–20 cm, and 960.0 g/tree/time for 20 cm or more.
3.3. Carbon Emissions
The total carbon emissions from street tree management were 2378.1 ± 122.5 g/tree/year. Annual carbon emissions from pruning were the highest at 2167.3 ± 122.0 g/tree/year, followed by irrigation (82.0 ± 0.0 g/tree/year), pesticide and fungicide application (76.0 ± 0.0 g/tree/year), and fertilization (52.8 ± 0.5 g/tree/year). Emissions from pruning were highest and accounted for approximately 91% of the total carbon emissions. According to the McPherson et al. [32], the carbon emissions from the use of vehicles and equipment involved in pruning street trees was 0.12–1.10 kg/tree/year, with an average of 0.48 kg/tree/year. This number is similar to the result in the current study (0.53 kg/tree/year).
Jo [17] reported that streets (from different land use types including streets, parks, and public land) had the highest carbon emissions and that pruning accounted for approximately 99.7% of the total carbon emissions. These results suggest that pruning is a major cause of carbon emissions. Direct carbon emissions from fossil fuel consumption including tool operation in street tree management accounted for about 95% of total emissions, while indirect carbon emissions from fossil fuels from the manufacturing process of pesticides and fertilizers accounted for about 5%.
Results by city were as follows: the carbon emissions per street tree were the highest in Daegu (3828.7 g/tree/year), followed by Daejeon (2882.7 g/tree/year), Chungju (2875.5 g/tree/year), Seoul (2850.6 g/tree/year), Jeonju (1978.3 g/tree/year), Chuncheon (1879.4 g/tree/year), and Suncheon (1847.6 g/tree/year). They were the lowest in Sejong (743.0 g/tree/year). In the case of Sejong, as street trees were newly planted in 2012–2013, the planting period was not long, and high-voltage lines were located underground, which resulted in lower carbon emissions from pruning.
3.4. Carbon Budget
Table 2 shows the carbon budget per street tree for each study city. The net carbon uptake (after subtracting management-related emissions from the average carbon uptake per street tree by city) was the highest in Jeonju at 10.8 kg/tree/year, followed by Seoul (7.9 kg/tree/year), Suncheon (7.7 kg/tree/year), Daejeon and Daegu (4.4 kg/tree/year for both), Chuncheon (3.4 kg/tree/year), and Chungju and Sejong (2.5 kg/tree/year for both).
As a result of applying the net carbon uptake unit by city, Seoul (2425.0 t/year) had the highest, followed by Daegu (994.3 t/year), Jeonju (690.9 t/year), Daejeon (616.7 t/year), Suncheon (490.5 t/year), Chungju (125.5 t/year), Chuncheon (87.1 t/year), and Sejong (38.4 t/year) (Table 3). The street trees in this study played an important role in carbon uptake, equivalent to 90–550% of the annual carbon emissions caused by street tree management. It is necessary to devise planting and management strategies to minimize the intensity of management to maximize the annual net carbon uptake of street trees.
3.5. Management Strategies
The results of the study suggest that the first measure to minimize carbon emissions from management activities, including pruning, is to encourage the normal growth of trees by securing sufficient growth space and growth foundation and to select species suitable for the designated growth space. Normal growth can reduce the frequency of fertilization and irrigation while strengthening resistance to pests.
Existing overhead power lines need to be moved underground gradually to secure sufficient growth space and avoid excessive pruning. Inevitable pruning to protect high-voltage cables or to ensure the visibility of signs should be conducted under the supervision of experts or based on a pruning manual to meet the space requirements for crown growth and to maintain original tree shapes. Conversely, preemptive measures to reduce pruning and carbon emissions, including planting small- and medium-sized indigenous street tree species rather than fast-growing tree species in areas with limited growth space, could be taken. McPherson et al. [32] found that reducing the amount of aboveground biomass pruned every 5 years from 20% to 10% reduced pruning emissions by a factor of five. Moreover, Harris et al. [52] showed that trees allowed to grow with regular but minimal pruning are less susceptible to pests and structural defects than trees that are pruned too severely.
Meanwhile, setting planting ground spot elevations lower than adjacent sidewalks can improve the chances of rainwater storage and infiltration and reduce the need for irrigation. Moreover, choosing drought-resistant trees such as Ginkgo biloba, Acer triflorum, Lagerstroemia indica, and Taxus cuspidata can minimize irrigation requirements. McPherson et al. [32] also found that sizable emission reductions are possible through soil and irrigation management, selection of drought-tolerant species, and water harvesting. Irrigation is usually conducted using a sprinkler truck; however, these vehicles emit carbon, as they are used more than 10 times a year in each city. Energy consumption from spray irrigation is about 11 times higher per unit time than that by drip irrigation [53]. Drip irrigation is highly efficient in terms of maintenance, as it results in less water loss compared to spray irrigation. Therefore, the use of drip irrigation methods (such as a water bag) can minimize energy consumption. The use of water bags can reduce the per tree sprinkler use frequency from three times a year to once, and a water bag’s annual carbon emissions are approximately 67% those of a sprinkler.
We can improve trees’ resistance to pests and fungi by promoting their normal growth, and we can minimize carbon emissions generated from pesticide manufacturing by applying biological controls, which refers to using natural predators. Different countries have already mass produced and sold grasshoppers and ladybugs, which are natural enemies of mites and aphids [53], the major culprits in damage to street trees. However, since spraying street trees with large quantities of these natural enemies is impossible, the best method for ensuring pest control is to protect the predators.
Carbon emissions can also be minimized by adding organic matter during planting instead of chemical fertilizers. Indeed, if the trees are deemed to be weak (due to a lack of water and moisture retention), an appropriate volume of organic matter such as unripe compost or wood chips (carbon fixing material) should be provided. In addition, organic matter such as fallen leaves and branches should be left under the trees or recycled (if it is impossible to keep them underneath) instead of removing them to reduce indirect carbon emissions related to fertilizer manufacturing. About 0.06 kg of carbon is indirectly emitted per kg of raw compost produced [54], which is one quarter of the amount of carbon generated during chemical fertilizer manufacturing.
4. Conclusions
The quantification of the energy consumption and carbon emissions from urban tree management is essential to understanding the carbon budgets of street trees and introducing low-carbon planting and management measures. Unfortunately, there are only a handful of related studies in South Korea and the rest of the world. Accordingly, the current study originated from the need to examine and verify these existing results. This study quantified the annual carbon emissions from urban street tree management and estimated the carbon budget to recommend management strategies that can reduce carbon emissions.
The annual total carbon emissions from street tree management of the study cities were on average 2.4 kg/tree/year. The annual carbon emissions from pruning were the highest at 2.2 kg/tree/year and accounted for 91% of the total carbon emissions. Based on the carbon uptake and carbon emissions of street trees for all cities, the average net carbon uptake was 5.5 kg/tree/year. Annual total carbon emissions from street tree management accounted for 18–57% of total carbon uptake. Thus, the street trees in this study played an important role in carbon uptake equivalent to 90–550% of the annual carbon emissions caused by street tree management.
The study then used these findings to propose management measures to maximize the annual net carbon uptake of street trees. First, to minimize carbon emissions from management activities, including pruning, cities should encourage the normal growth of trees by securing sufficient growth space and growth foundation and to select species suitable for the designated growth space. Normal growth can reduce the frequency of fertilization and irrigation while strengthening resistance to pests. Additional Recommended measures include the underground burial of overhead lines, expert supervision and drafting of pruning manuals, minimization of pruning, and selection of small- and medium-sized tree species for pruning. In addition, lowering the spot elevation, planting drought-resistant and fertile tree species, and using drip irrigation methods for irrigation are recommended along with protection of natural predators for pesticide and fungicide application and minimization of chemical fertilizers and recycling of fallen leaves and branches for fertilization.
As there is very little research on carbon emissions from street tree management, the basic unit for carbon emissions for each management activity in the current study can be useful in quantifying the carbon budget of street trees. Furthermore, the proposed management strategies will be useful for designing practical low-carbon landscapes with minimal management and carbon emissions. The results of this study are expected to be useful in diagnosing the carbon cycle of urban trees and establishing and implementing national climate change response policies in line with the carbon-neutral era in the future. The study was conducted in only eight cities in South Korea. In the future, the results should be upgraded through confirmatory research by expanding the number of samples in various cities. Although this study only considered the carbon emissions of management activities after planting, further studies should be carried out to draft an optimal plan for overall management that includes the production, distribution, and planting of street trees.
Author Contributions
Conceptualization, J.-Y.K. and H.-K.J.; methodology, J.-Y.K. and H.-K.J.; Analysis, J.-Y.K.; investigation, J.-Y.K. and H.-K.J.; writing—original draft preparation, J.-Y.K. and H.-K.J.; writing—review and editing, H.-K.J. and J.-Y.K.; visualization, J.-Y.K.; supervision, J.-Y.K. and H.-K.J. All authors have read and agreed to the published version of the manuscript.
Funding
This study was carried out with the support of the “R&D Program for Forest Science Technology (Project No. 2017043B10-1919-BB01)” provided by the Korea Forest Service (Korea Forestry Promotion Institute).
Institutional Review Board Statement
Not applicable.
Informed Consent Statement
Not applicable.
Data Availability Statement
Not applicable.
Acknowledgments
This paper partially summarizes and reconstructs the doctoral dissertation submitted by Jin-Young Kim [42].
Conflicts of Interest
The authors declare no conflict of interest.
References
- NASAGCC (NASA Global Climate Change). Available online: https://climate.nasa.gov/causes (accessed on 10 March 2022).
- KMA (Korea Meteorological Administration). Report of Global Atmosphere Watch 2018. Available online: http://www.climate.go.kr/home/bbs/view.php?code=24&bname=report&vcode=6281&cpage=1&vNum=73&skind=&sword=&category1=&category2= (accessed on 3 March 2022).
- Xu, C.; Kohler, T.A.; Lenton, T.M.; Svenning, J.C.; Scheffer, M. Future of the human climate niche. Proc. Natl. Acad. Sci. USA 2020, 117, 11350–11355. [Google Scholar] [CrossRef] [PubMed]
- NIMS (National Institute of Meteorological Sciences). Report of Global Atmosphere Watch 2020; NIMS: Jeju, Korea, 2021. [Google Scholar]
- KMA (Korea Meteorological Administration). Available online: http://www.climate.go.kr/home/09_monitoring/ghg/co2_global (accessed on 6 October 2021).
- ME (Ministry of Environment). 2019 National Greenhouse Gas Inventory Report of Korea; Greenhouse Gas Inventory & Research Center: Sejong, Korea, 2020. [Google Scholar]
- Yao, Y.; Pan, H.; Cui, X.; Wang, Z. Do compact cities have higher efficiencies of agglomeration economies? A dynamic panel model with compactness indicators. Land Use Policy 2022, 115, 106005. [Google Scholar] [CrossRef]
- Burton, E. The Compact City: Just or just compact? a preliminary analysis. Urban Stud. 2000, 37, 1969–2001. [Google Scholar] [CrossRef]
- Bibri, S.E.; Krogstie, J.; Karrholm, M. Compact city planning and development: Emerging practices and strategies for achieving the goals of sustainability. Dev. Built Environ. 2020, 4, 100021. [Google Scholar] [CrossRef]
- Chen, S.; Yan, X.; Pan, H.; Deal, B. Using big data for last mile performance evaluation: An accessibility-based approach. Travel Behav. Soc. 2021, 25, 153–163. [Google Scholar] [CrossRef]
- Baek, K.H.; Lee, H.S.; Chung, J.H.; Kim, J.H. Electric scooter sharing: How do people value it as a last-mile transportation mode? Transp. Res. D Transp. Environ. 2021, 90, 102642. [Google Scholar] [CrossRef]
- Saumel, I.; Weber, F.; Kowarik, I. Toward livable and healthy urban streets: Roadside vegetation provides ecosystem services where people live and move. Environ. Sci. Policy 2015, 62, 24–33. [Google Scholar] [CrossRef]
- Jo, H.K.; Kim, J.Y.; Park, H.M. Carbon reduction and planning strategies for urban parks in Seoul. Urban For. Urban Green. 2019, 41, 48–54. [Google Scholar] [CrossRef]
- Jo, H.K.; Kim, J.Y.; Park, H.M. Carbon and PM2.5 reduction and design guidelines for street trees in Korea. Sustainability 2020, 122, 414. [Google Scholar] [CrossRef]
- Kim, J.Y.; Jo, H.K.; Park, H.M. Improvement of the planting method to increase the carbon reduction capacity of urban street trees. J. People Plants Environ. 2021, 24, 219–227. [Google Scholar] [CrossRef]
- Jo, H.K.; Cho, D.H. Annual CO2 uptake by urban popular landscape tree species. J. Korean Inst. Landsc. Archit. 1998, 26, 38–53. [Google Scholar]
- Jo, H.K. Carbon uptake and emissions in urban landscape, and the role of urban greenspace for several cities in Kangwon Province. J. Korean Inst. Landsc. Archit. 1999, 73, 39–53. [Google Scholar]
- Jo, H.K.; Ahn, T.W.; Cho, Y.H. Effects of urban greenspace on improving atmospheric environment. J. Korean Inst. Landsc. Archit. 2003, 31, 83–90. [Google Scholar]
- Park, E.J.; Kang, K.Y. Estimation of C storage and annual CO2 uptake by street trees in Gyeonggi-do. Korean J. Environ. Ecol. 2010, 24, 591–600. [Google Scholar]
- Kim, K.T.; Cho, J.W.; Yoo, H.H. Carbon storage estimation of urban area using KOMPSAT-2 imagery. J. Korean Soc. Geospat. Inf. Sci. 2011, 19, 49–54. [Google Scholar]
- Kim, T.J. The species selection and planting guidelines for street tree to reduce road atmospheric carbon dioxide. J. Korean Inst. For. Recreat. 2013, 17, 131–144. [Google Scholar]
- Russo, A.; Escobedo, F.; Timilsina, J.N.; Zerbe, S. Transportation carbon dioxide emission offsets by public urban trees: A case study in Bolzano, Italy. Urban For. Urban Green. 2015, 14, 398–403. [Google Scholar] [CrossRef]
- Park, C.I. A study on carbon dioxide absorption of street tree according to transplantation planting methods for Sorbus alnifolia. J. Environ. Sci. Int. 2015, 24, 253–260. [Google Scholar] [CrossRef]
- Park., M.W. Study on the Estimated Carbon Uptake of the City Street Trees and Increase Carbon Uptake by Improving Species. Master’s Thesis, Hoseo University, Chungnam, Korea, February 2015. [Google Scholar]
- Tang, Y.; Chen, A.; Zhao, S. Carbon storage and sequestration of urban street trees in Beijing, China. Front. Ecol. Evol. 2016, 4, 53. [Google Scholar]
- Jo, H.K.; Kim, J.Y.; Park, H.M. Carbon storage and uptake by street trees in Seoul. J. For. Environ. Sci. 2018, 34, 162–164. [Google Scholar]
- Zhao, Y.; Hu, Q.; LI, H.; Wang, S.; Ai, M. Evaluating carbon sequestration and PM2.5 removal of urban street trees using mobile laser scanning data. Remote Sens. 2018, 10, 1759. [Google Scholar] [CrossRef] [Green Version]
- Jo, H.K. Development of Model and Technology for Establishment, Management and Evaluation of Urban Forests in Living Zone to Improve Carbon Sequestration Sources and Multi-Dimensional Benefits against New Climate Change Regime; Korea Forest Service: Daejeon, Korea, 2020. [Google Scholar]
- Tan, X.; Hirabayashi, S.; Shibata, S. Estimation of ecosystem services provided by street trees in Kyoto, Japan. Forests 2021, 12, 311. [Google Scholar] [CrossRef]
- Jo, H.K. Energy consumption and carbon release from management in urban vegetation. Korean J. Environ. Ecol. 1999, 13, 101–108. [Google Scholar]
- McPherson, E.G.; Kendall, A. A life cycle carbon dioxide inventory of the Million Tree Los Angeles program. Int. J. Life Cycle Assess. 2014, 19, 1653–1665. [Google Scholar] [CrossRef]
- McPherson, E.G.; Kendall, A.; Albers, S. Life cycle assessment of carbon dioxide for different arboricultural practices in Los Angeles, CA. Urban For. Urban Green. 2015, 14, 388–397. [Google Scholar] [CrossRef]
- KFS (Korea Forest Service). 2017 Result of Planting and Management in Street Trees (Institutional Data); KFS: Daejeon, Korea, 2018. [Google Scholar]
- KFS (Korea Forest Service). 2018 Result of Planting and Management in Street Trees (Institutional Data); KFS: Daejeon, Korea, 2019. [Google Scholar]
- KCPA (Korea Crop Protection Association). Available online: https://www.koreacpa.org/ko/use-book/search (accessed on 26 July 2021).
- ME (Ministry of Environment). 2020 National Greenhouse Gas Inventory Report of Korea; ME: Sejong, Korea, 2020. [Google Scholar]
- Chow, P.; Rolfe, G.L. Carbon and hydrogen contents of short rotation biomass of five hardwood species. Wood Fiber Sci. 1989, 21, 30–36. [Google Scholar]
- Song, C.Y.; Chang, K.S.; Park, K.S.; Lee, S.W. Analysis of carbon fixation in natural forests of Quercus mongolica and Quercus variabilis. J. Korean For. Soc. 1997, 86, 35–45. [Google Scholar]
- Lee, J.S.; Kim, K.Y.; Jeong, H.C.; Choi, E.J.; Lee, S.Y.; Heo, J.H.; Jeong, S.C. Estimation of carbon emission coefficients for fertilizer in Korea. In Proceedings of the 2018 KSCC International Conference, Jeju, Korea, 18 June 2018; KSCC: Seoul, Korea, 2018; p. 90. [Google Scholar]
- Pitt, G.D. Conservation of embodied energy through landscape design. In Energy-Conserving Site Design, 1st ed.; McPherson, E.G., Ed.; ASLA: Washington, DC, USA, 1984; pp. 215–229. [Google Scholar]
- Lal, R. Carbon emission from farm operations. Environ. Int. 2004, 30, 981–990. [Google Scholar] [CrossRef]
- Kim, J.Y. Service of Net Carbon Uptake by Urban Street Trees and Guidelines of Planting and Management. Ph.D. Thesis, Kangwon National University, Chuncheon, Korea, 2021. [Google Scholar]
- KFS (Korea Forest Service). Available online: https://www.forest.go.kr/kfsweb/cop/bbs/selectBoardArticle.do?nttId=3145952&bbsId=BBSMSTR_1069&pageIndex=1&pageUnit=10&searchtitle=title&searchcont=&searchkey=&searchwriter=&searchdept=&searchWrd=%ea%b0%80%eb%a1%9c%ec%88%98&ctgryLrcls=&ctgryMdcls=&ctgrySmcls=&ntcStartDt=&ntcEndDt=&orgId=&mn=NKFS_01_01&component= (accessed on 6 October 2021).
- Seoul. Street Tree Status Data. Available online: https://data.seoul.go.kr/dataList/367/S/2/datasetView.do (accessed on 20 July 2020).
- Daejeon. Street Tree Status Data. Available online: https://www.donggu.go.kr/dg/kor/contents/251 (accessed on 7 June 2020).
- Daegu. Street Tree Status Data. Available online: https://www.daegu.go.kr/env/index.do?menu_id=00001248 (accessed on 7 June 2020).
- Sejong. Street Tree Status Data. Available online: https://www.data.go.kr/data/15068333/fileData.do (accessed on 7 June 2020).
- Chuncheon. Street Tree Status Data. Available online: https://cityhall.chuncheon.go.kr/index.chuncheon?menuCd=DOM_000000537003002000 (accessed on 8 June 2020).
- Chungju. Street Tree Status Data. Available online: https://www.open.go.kr/rqestMlrd/rqestDtls/reqstDocList.do (accessed on 14 October 2020).
- Jeonju. Street Tree Status Data. Available online: https://www.jeonju.go.kr/index.9is?contentUid=9be517a74f8dee91014f9206ea9410a1 (accessed on 8 June 2020).
- Suncheon. Street Tree Status Data. Available online: http://main.suncheon.go.kr/synap/skin/doc.html?fn=2020070909524779690.pdf&rs=/synap/result/202204 (accessed on 14 October 2020).
- Harris, R.W.; Clark, J.R.; Matheny, N.P. Arboriculture: Integrated Management of Landscape Trees, Shrubs, and Vines. Prentice Plan; Los Angeles Department of Water and Power: Los Angeles, CA, USA, 2003; p. 182. [Google Scholar]
- Jo, H.K.; Park, S.M.; Kim, J.Y.; Park, H.M. Carbon uptake and emissions of apple orchards as a production-type greenspace. J. Korean Inst. Landsc. Archit. 2014, 42, 64–72. [Google Scholar] [CrossRef] [Green Version]
- NAS (National Institute of Agricultural Sciences). Assessment of Carbon Basic Unit and DB Development with Agro-Material; NAS: Wanju, Korea, 2017. [Google Scholar]
Figure 1.
Systematic study flowchart.

Figure 2.
Location of study cities and landscape of street.

Figure 3.
Methods of obtaining street tree data and estimating carbon emissions. 1 I: Interviews, M: Maintenance data, A: Actual measurements. 2 References [36,37,38,39,40,41].

Figure 4.
The number of street tree species in study cities.


Table 1.
Frequency and energy consumption by street tree management in study cities.
| Section | Frequency (Times/Year) | Amount (Tree/Time) | Energy Consumption (Tree/Time) | |
|---|---|---|---|---|
| Gasoline | Diesel | |||
| Pruning | 1.9 ± 0.2 | 2.5–23.8 kg 1 11.5–52.1 kg 2 0.4–8.7 kg 3 | 0.12 ± 0.03 L | 1.02–3.82 L |
| Irrigation | 2.8 ± 0.6 | 3.8 ± 0.6 L | - | 45.3 ± 7.8 mL |
| Pesticide/Fungicide application | 2.4 ± 0.4 | 8.6 ± 1.7 g 9.1 ± 2.2 g | 12.8 ± 0.3 mL | 11.4 ± 3.6 mL |
| Fertilization | 1.0 ± 0.0 | 384.0–960.0 g 4 | - | - |
1 Ginkgo biloba (DBH range: 14.5–59.8 cm). 2 Platanus occidentalis (DBH range: 22.9–55.8 cm). 3 Other tree species (DBH range: 11.0–60.0 cm). 4 DBH range: ≤10.0 cm to ≥20.0 cm.
Table 2.
Carbon budgets per tree in study cities.
| City | Mean DBH (cm) 1 | Carbon (kg/Tree/Year) | Net Carbon Uptake (kg/Tree/Year) | |
|---|---|---|---|---|
| Uptake 1 | Emission | |||
| Seoul | 21.7 | 10.74 | 2.85 ± 0.45 | 7.89 |
| Daejeon | 20.1 | 7.26 | 2.88 ± 0.28 | 4.38 |
| Daegu | 21.5 | 8.23 | 3.83 ± 0.39 | 4.40 |
| Sejong | 10.6 | 3.23 | 0.74 ± 0.02 | 2.49 |
| Chuncheon | 20.7 | 5.24 | 1.88 ± 0.40 | 3.36 |
| Chungju | 18.4 | 5.41 | 2.88 ± 0.40 | 2.53 |
| Jeonju | 23.9 | 12.77 | 1.98 ± 0.21 | 10.79 |
| Suncheon | 21.1 | 9.58 | 1.85 ± 0.15 | 7.73 |
| Mean | 19.6 | 7.89 | 2.38 ± 0.12 | 5.51 |
Table 3.
Total carbon budgets in study cities.
| City | Carbon (t/Tree/Year) | Net Carbon Uptake (C = A − B, t/Tree/Year) | Reduction Effect (C/B %) | |
|---|---|---|---|---|
| Uptake (A) | Emission (B) | |||
| Seoul | 3300.9 | 875.9 | 2425.0 | 280 |
| Daejeon | 1022.2 | 405.5 | 616.7 | 150 |
| Daegu | 1859.8 | 865.5 | 994.3 | 120 |
| Sejong | 49.8 | 11.4 | 38.4 | 340 |
| Chuncheon | 135.9 | 48.8 | 87.1 | 180 |
| Chungju | 268.3 | 142.8 | 125.5 | 90 |
| Jeonju | 817.7 | 126.8 | 690.9 | 550 |
| Suncheon | 607.9 | 117.4 | 490.5 | 420 |
Publisher’s Note: MDPI stays neutral with regard to jurisdictional claims in published maps and institutional affiliations. |
© 2022 by the authors. Licensee MDPI, Basel, Switzerland. This article is an open access article distributed under the terms and conditions of the Creative Commons Attribution (CC BY) license (https://creativecommons.org/licenses/by/4.0/).
Share and Cite
MDPI and ACS Style
Kim, J.-Y.; Jo, H.-K. Estimating Carbon Budget from Growth and Management of Urban Street Trees in South Korea. Sustainability 2022, 14, 4439. https://0-doi-org.brum.beds.ac.uk/10.3390/su14084439
AMA Style
Kim J-Y, Jo H-K. Estimating Carbon Budget from Growth and Management of Urban Street Trees in South Korea. Sustainability. 2022; 14(8):4439. https://0-doi-org.brum.beds.ac.uk/10.3390/su14084439
Chicago/Turabian StyleKim, Jin-Young, and Hyun-Kil Jo. 2022. "Estimating Carbon Budget from Growth and Management of Urban Street Trees in South Korea" Sustainability 14, no. 8: 4439. https://0-doi-org.brum.beds.ac.uk/10.3390/su14084439
Note that from the first issue of 2016, this journal uses article numbers instead of page numbers. See further details here.