Article

Effects of Heat Stress across the Rural-Urban Interface on Phenotypic Trait Expressions of Dairy Cattle in a Tropical Savanna Region

1
Institute of Animal Breeding and Genetics, University of Gießen, Ludwigstraße 21 b, 35390 Gießen, Germany
2
Animal Husbandry in the Tropics and Subtropics, University of Kassel and Georg-August-Universität Göttingen, Steinstr. 19, 37213 Witzenhausen, Germany
3
National Institute of Animal Nutrition and Physiology (NIANP), Hosur Rd, Chennakeshava Nagar, Adugodi, Bengaluru 560030, Karnataka, India
*
Author to whom correspondence should be addressed.
Sustainability 2022, 14(8), 4590; https://0-doi-org.brum.beds.ac.uk/10.3390/su14084590
Submission received: 2 March 2022 / Revised: 28 March 2022 / Accepted: 9 April 2022 / Published: 12 April 2022

Abstract

:
Among all livestock systems in tropical regions, the dairy sector is facing huge challenges to sustain productivity under the rapidly changing climatic conditions. To date, there is a lack of knowledge on the combined effects of climate, season, and farm location on trait responses in different cattle breeds. Consequently, this study presents a novel approach to assess the impact of several climatic and geographical factors on production traits, energy efficiency indicators, and hygiene traits in dairy cattle reared across the rural–urban interface in the tropical savanna region of Bengaluru, a rising megacity in southern India. In total, 96 cattle were selected across Bengaluru’s rural–urban interface, reflecting a broad variety of social-ecological systems. The traits considered included test day milk yield (MY), body condition score (BCS), body weight (BW), hock assessment score (HAS), udder hygiene score (UHS), and upper leg hygiene score (ULHS). Apart from cow-related factors such as breed, lactation stage, lactation number, and milking frequency, the environmental classification variables of season, farm location (as expressed by survey stratification index, SSI), and temperature humidity index (THI) significantly affected most of the traits, with indication for breed-by-environment interactions. In particular, season significantly influenced production and hygiene traits. Furthermore, an evident breed variation was observed in the seasonal influence on BW, wherein exotic cows had a higher BW than crossbreds during the summer season. The distinct trend of SSI in its influence on most of the traits indicates that cows housed in urban areas had better trait expression than those in rural areas, thereby revealing a predominant role of management. The THI had a significant effect on MY, BCS, and HAS, and THI = 75 was identified as heat stress threshold. The results indicate the importance of considering ecological, social, and climatic factors simultaneously in order to improve primary and functional breed-specific traits of dairy cattle reared in challenging environments.

1. Introduction

Globally, the livestock sector plays a significant role by economically supporting poor and marginal farmers [1]. At the same time, because of the exponentially rising human population there is an increasing demand for livestock products due to increasing incomes and urbanization, which has changed the dietary habits of humans towards a preference for animal protein sources [2]. Currently, the dairy sector supports nearly 150 million households across the world [3]. An evident rise in world milk production during the past three decades, from 522 million tons (MT) in 1987 to 843 MT in 2018, highlights the increasing demand for milk and milk products [3].
The dairy sector, however, faces major challenges in tackling rising market demands amidst rapidly changing climatic conditions. There are several factors which influence milk production, especially animal genetics, nutrition, management, and the environment [4,5]. In particular, heat stress is currently emerging as a major concern. Heat stress has detrimental effects on milk quality and milk quantity [6], ultimately influencing farm economy. In the United States, heat stress caused an annual economic loss in the dairy industry ranging between USD 1.69 and 2.36 billion [7]. The world’s largest milk producer, India, faces a huge threat due to heat stress, with an estimated reduction of milk production in Indian dairy cows by alarming 0.73 million liters in 2020 [8].
Several available indices combine different climatic parameters to determine heat stress in livestock. Among these, the temperature humidity index (THI) is often used to assess livestock productivity responses to heat stress [9]. However, the calculation of the most appropriate THI depends on the respective agro-ecological zone [10]. Livestock in different agro-ecological zones have specific heat stress thresholds, and alterations of genetic parameters and breeding values beyond the thresholds have been observed. Regarding breed-specific effects, Gantner et al. [11] observed improved heat stress resistance mechanisms in Simmental cattle when compared to Holstein dairy cattle. Generally, high-producing animals are more susceptible to heat stress than low producers [12].
Heat stress adversely affects the productive and reproductive performance of cows, implying effects on energy requirements and the physiology of adaptive mechanisms. Reductions in growth and milk yield, altered milk composition, irregular reproductive cycles, and increased disease occurrence are the most prominent effects of heat stress on dairy cattle [6,13,14]. Apart from THI and genetic effects, urbanization is another factor influencing dairy production in developing countries [15]. Differences in dairy management practices have been observed across the rural–urban interface, ultimately influencing production [16]. The combined effects of urbanization and heat stress may be a crucial factor when evaluating primary and functional traits of dairy cattle in countries in tropical regions.
Therefore, conducting a comprehensive study on the impact of heat stress on dairy cattle and their production across the rural–urban interface of an Asian megacity may provide novel insights into the adaptability of cattle to concomitant environmental stressors. Consequently, the aim of the present study was to infer the effects of heat stress, season, and cattle genetics across the rural–urban interface of Bengaluru, India, on primary and functional dairy cattle traits.

2. Materials and Methods

2.1. Study Location and Climate

The study was conducted in the emerging megacity of Bengaluru, which is located in the State of Karnataka in southern India, centering on 12.97° northern latitude and 77.59° eastern longitude, 920 m above sea level. Bengaluru experiences tropical savanna climatic conditions with distinct humid and dry seasons. These can be categorized as the summer season, which includes the dry months of March, April, and May (henceforth called “summer”) with an average ambient temperature (Ta) of 28.44 °C and an average humidity (Ha) of 57.71%), followed by the monsoon season from June to October (“rainy”; Ta: 25.67 °C; Ha: 77.56%) and the winter season from November to February (“winter”; Ta: 24.03 °C; Ha: 64.24%).

2.2. Study Design and Farm Selection

For the multi-criteria assessment of dairy production systems across the rural–urban interface of Bengaluru, a total of 35 farms were randomly sampled across 17 villages located along the city’s rural–urban interface [17]. This interface is represented by two transect lines, called the northern and southern transect, and defined as a common space for interdisciplinary research [18]. Along the rural–urban interface, a survey stratification index (SSI) developed by Hoffmann et al. [18] distinguished three areas based on distance to the city centre and built-up area, namely “urban” (SSI < 0.3), “peri-urban” or “transition” (SSI: 0.3–0.5), and “rural” (SSI > 0.5).

2.3. Animals and Management

A total of 96 cattle including heifers and lactating and dry cows were selected from 35 farms located across the rural–urban interface. The selected cattle were classified into two genetic groups, defined as exotic and crossbred cattle. The exotic cattle consisted of Holstein Friesian and Jersey breeds, while the crossbred cattle group consisted of Holstein and Jersey crosses with native cattle breeds. The animals were reared at their respective farms. Green forage was the major dietary component of dairy cattle across all farms. However, the green forage proportions varied across the rural–urban interface and across seasons. During the dry seasons, offer of dry forages compensated the shortage of green fodder [17]. Additionally, concentrate feeding and allowing animals to graze in public pastureland were complemented by feeding crop residues and organic household or market wastes [17].

2.4. Phenotypic Trait Recording

In order to assess the seasonal influence on dairy production traits, the farms were visited three times between June 2017 and April 2018 in four-monthly intervals covering all three seasons. Phenotypic cow trait records included test-day milk yield (MY, in litres), body condition score (BCS), body weight (BW, in kg), hock assessment score (HAS), udder hygiene score (UHS), and upper leg hygiene score (ULHS). All traits were recorded once during each season. The BCS of each cow was scored from 1 (thin) to 5 (obese) as defined by Ferguson et al. [19]. The body weight of the cattle was calculated using the regression equation established by Grund [20] as mentioned below, which takes into account the animals’ heart girth, age, BCS, breed, status (if milking or dry), and pregnancy status:
BW = exp ( 7.35492 + ( 2.55408 × ln ( HG ) ) + ( 0.04043 × ln ( age ) ) + ( β 1 × BCS ) + ( β 2 × status ) + ( β 3 × breed ) + ( 0.024741 × pregnant ) + 0.08317 )
where HG is the heart girth of the cattle measured in cm, age is recorded in months, β1 is the linear regression coefficient for body condition score (BCS), β2 is the regression coefficient for the status of the cow (milking or dry), β3 is the regression coefficient for breed (exotic, crossbred), and the pregnancy variable represents the pregnancy status of the cow (1 if the cow is pregnant and 0 if not).
The UHS and ULHS hygiene scores were assessed according to Schreiner and Ruegg [21] and ranged from 1 (completely clean) to 4 (completely covered with manure). The HAS was scored according to Lombard et al. [22], with 1 (hock without hair loss or swelling), 2 (hair loss on the hock but no swelling), and 3 (hair loss on the hock with swelling). All these phenotypic traits were recorded by the same trained expert throughout the study in order to avoid any human error, especially while scoring the hygiene and conformation traits.

2.5. Temperature Humidity Index (THI)

The temperature and humidity on the farms were recorded in hourly intervals using VOLTCRAFT DL-121TH USB data loggers. The average daily temperature and humidity were calculated based on hourly meteorological records. Afterwards, the temperature humidity index (THI), which is a widely used index for assessing the impact of heat stress on trait expression in livestock [9], was calculated according to the National Research Council (NRC) [23] equation as follows:
THI = ( 1.8 × T + 32 ) ( 0.55 0.0055 × RH ) × ( 1.8 × T 26 )
where T is air temperature in degrees Celsius and RH is relative humidity as a percentage.
To assess the impact of THI on the phenotypic traits, two THI intervals were considered. THI_0, the test day THI, was used for the MY, HAS, UHS, and ULHS traits, while THI_1-7, recorded throughout the seven days prior to the test day and averaged afterwards per week, was considered for the BCS and BW traits.
The descriptive statistics for THI (THI_0, THI_1-7) and for all the phenotypic traits recorded throughout the study period are provided in Table 1.

2.6. Statistical Analysis

The data were analysed using SAS University Edition (SAS/STAT®, SAS Institute Inc., Cary, NC, USA), and applying the MIXED procedure to infer fixed and random effects via mixed model equations. Model 1 was defined to assess the impact of environmental and genetic factors as well as of interactions on phenotypic trait expression. The effect of THI considered in this equation was THI_0 for MY, HAS, UHS, and ULHS. Regarding BCS and BW, THI_1-7 was considered. Model 1 was
Y ijklmnopq = μ + LS i + L j + MF k + F ( SSI ) l + SSI m + THI n + B × S o + A p + e ijklmnopq
where Yijklmnopq is the observation for MY, BCS, BW, HAS, UHS, and ULHS recorded on the ijklmnopq-th animal, µ is the overall mean effect, LSi is the fixed effect for the i-th lactation stage class (i = <3 months, 3–9 months, >9 months), Lj is the fixed effect for the j-th lactation number (j = 1, 2, 3, 4, 5, >5), MFk is the fixed effect for the k-th daily milking frequency class when analysing MY (k = 1, 2), F(SSI)l is the fixed effect for the lth farm within SSI cluster (l = twenty farms in rural, ten farms in transition, and five farms in urban areas), SSIm is the fixed effect for the m-th SSI class (m = rural, transition, urban), THIn is the fixed effect for the nth THI_0 for MY, HAS, UHS, ULHS, and THI_1-7 for BCS and BW, respectively (n = <70, 70–71, 72–73, 74–75, >75), BxSo is the fixed effect for the o-th interaction between breed and season, Ap is the random animal effect for three repeated measurements of the p-th animal, and eijklmnopq is the random residual effect.
In addition to classification model 1, regressions on THI were evaluated for MY by applying model 2 as follows:
Y ijklmnopqrs = μ + LS i + L j + MF k + F ( SSI ) l + SSI m + THI ( B ) n + THI 2 ( B ) o + B p + S q + A r + e ijklmnopqrs
where Yijklmnopqrs is the observation for MY of the ijklmnopqrs-th animal, µ is the overall mean effect, LSi is the fixed effect for the i-th lactation stage class (i = <3 months, 3–9 months, >9 months), Lj is the fixed effect for the j-th lactation number (j = 1, 2, 3, 4, 5, >5), MFk is the fixed effect for the k-th daily milking frequency class (k =1, 2), F(SSI)l is the fixed effect for the l-th farm–SSI cluster (l = twenty farms in rural, ten farms in transition, and five farms in urban areas), SSIm is the fixed effect for the m-th SSI class (m = rural, transition, urban), THI(B)n is the linear regression on THI nested within breed, THI²(B)o is a quadratic regression on THI nested within breed, Bp is the fixed effect for the p-th breed (p = exotic, crossbred), Sq is the fixed effect for the q-th season (q = rainy, winter, summer), Ar is the random animal effect for three repeated measurements of the r-th animal, and eijklmnopqrs is the random residual effect.
For all levels within fixed effects from models 1 and 2, least square means were computed.
To study the robustness and performance of exotic and crossbred cows under hot climatic conditions, the lactation persistency was compared between cows exposed to heat stress and cows without heat stress. The threshold THI level for MY and BCS traits was set using the PROC RSREG procedure in SAS with some modifications. As the PROC RSREG procedure cannot consider class effects, we first ran model 2 without including THI and breed effects. The respective outputs are corrected records (residuals), which were used to run the PROC RSREG separately for each breed considering only the THI covariate (THI_0 for MY, and THI_1-7 for BCS). Based on the results obtained from this analysis, the threshold of THI = 75 was set for portioning the dataset into two groups. Within the two THI group datasets, THI ≤ 75 and THI > 75, regressions of days in milk (DIM) on MY and BCS were performed. The lactation persistency was expressed via linear regression on DIM by applying model 3:
Y ijklmnop = μ + L i + MF j + SSI k + S l + B m + dim ( B ) n + F o + e ijklmnop
where Yijklmnop is the observation for MY and BCS of the ijklmnop-th animal, µ is the overall mean effect, Li is the fixed effect for the i-th lactation number (i = 1, 2, 3, 4, 5, >5), MFj is the fixed effect for the j-th daily milking frequency class when analysing only the trait MY (j = 1, 2), SSIk is the fixed effect for the k-th SSI class (k = rural, transition, urban), Sl is the fixed effect for the l-th season (l = rainy, winter, summer), Bm is the fixed effect for the m-th breed (m = exotic or crossbred), dim(B)n is the fixed regression on the n-th days in milk nested within breed (recorded across 365 days), Fo is the random effect of the o-th farm, and eijklmnop is the random residual effect.

3. Results

With regard to model 1, test day MY was significantly (p < 0.05) influenced by all effects. THI had a significant effect (p < 0.05) only on MY (THI_0), BCS (THI_1-7) and HAS (THI_0). The THI effect was not significant (p > 0.05) for BW (THI_1-7), UHS (THI_0) and ULHS (THI_0). Lactation stage (p < 0.01), lactation number (p < 0.01), farm nested within SSI (p < 0.01), and SSI (p < 0.05) all had a significant effect on BCS and BW. The breed–season interaction was not significant on BCS and on BW (p > 0.05). In addition to THI (p < 0.05), farm nested within SSI had a significant effect (p < 0.05) on HAS. UHS was significantly affected by lactation stage (p < 0.05), farm nested within SSI (p < 0.01), SSI (p < 0.05), and breed x season interaction (p < 0.05). The only significant effects on ULHS were the combined farm–SSI effect (p < 0.01) and SSI (p < 0.01). Table 2 presents the results of the test of significance for the fixed effects on the phenotypic traits obtained using model 1.

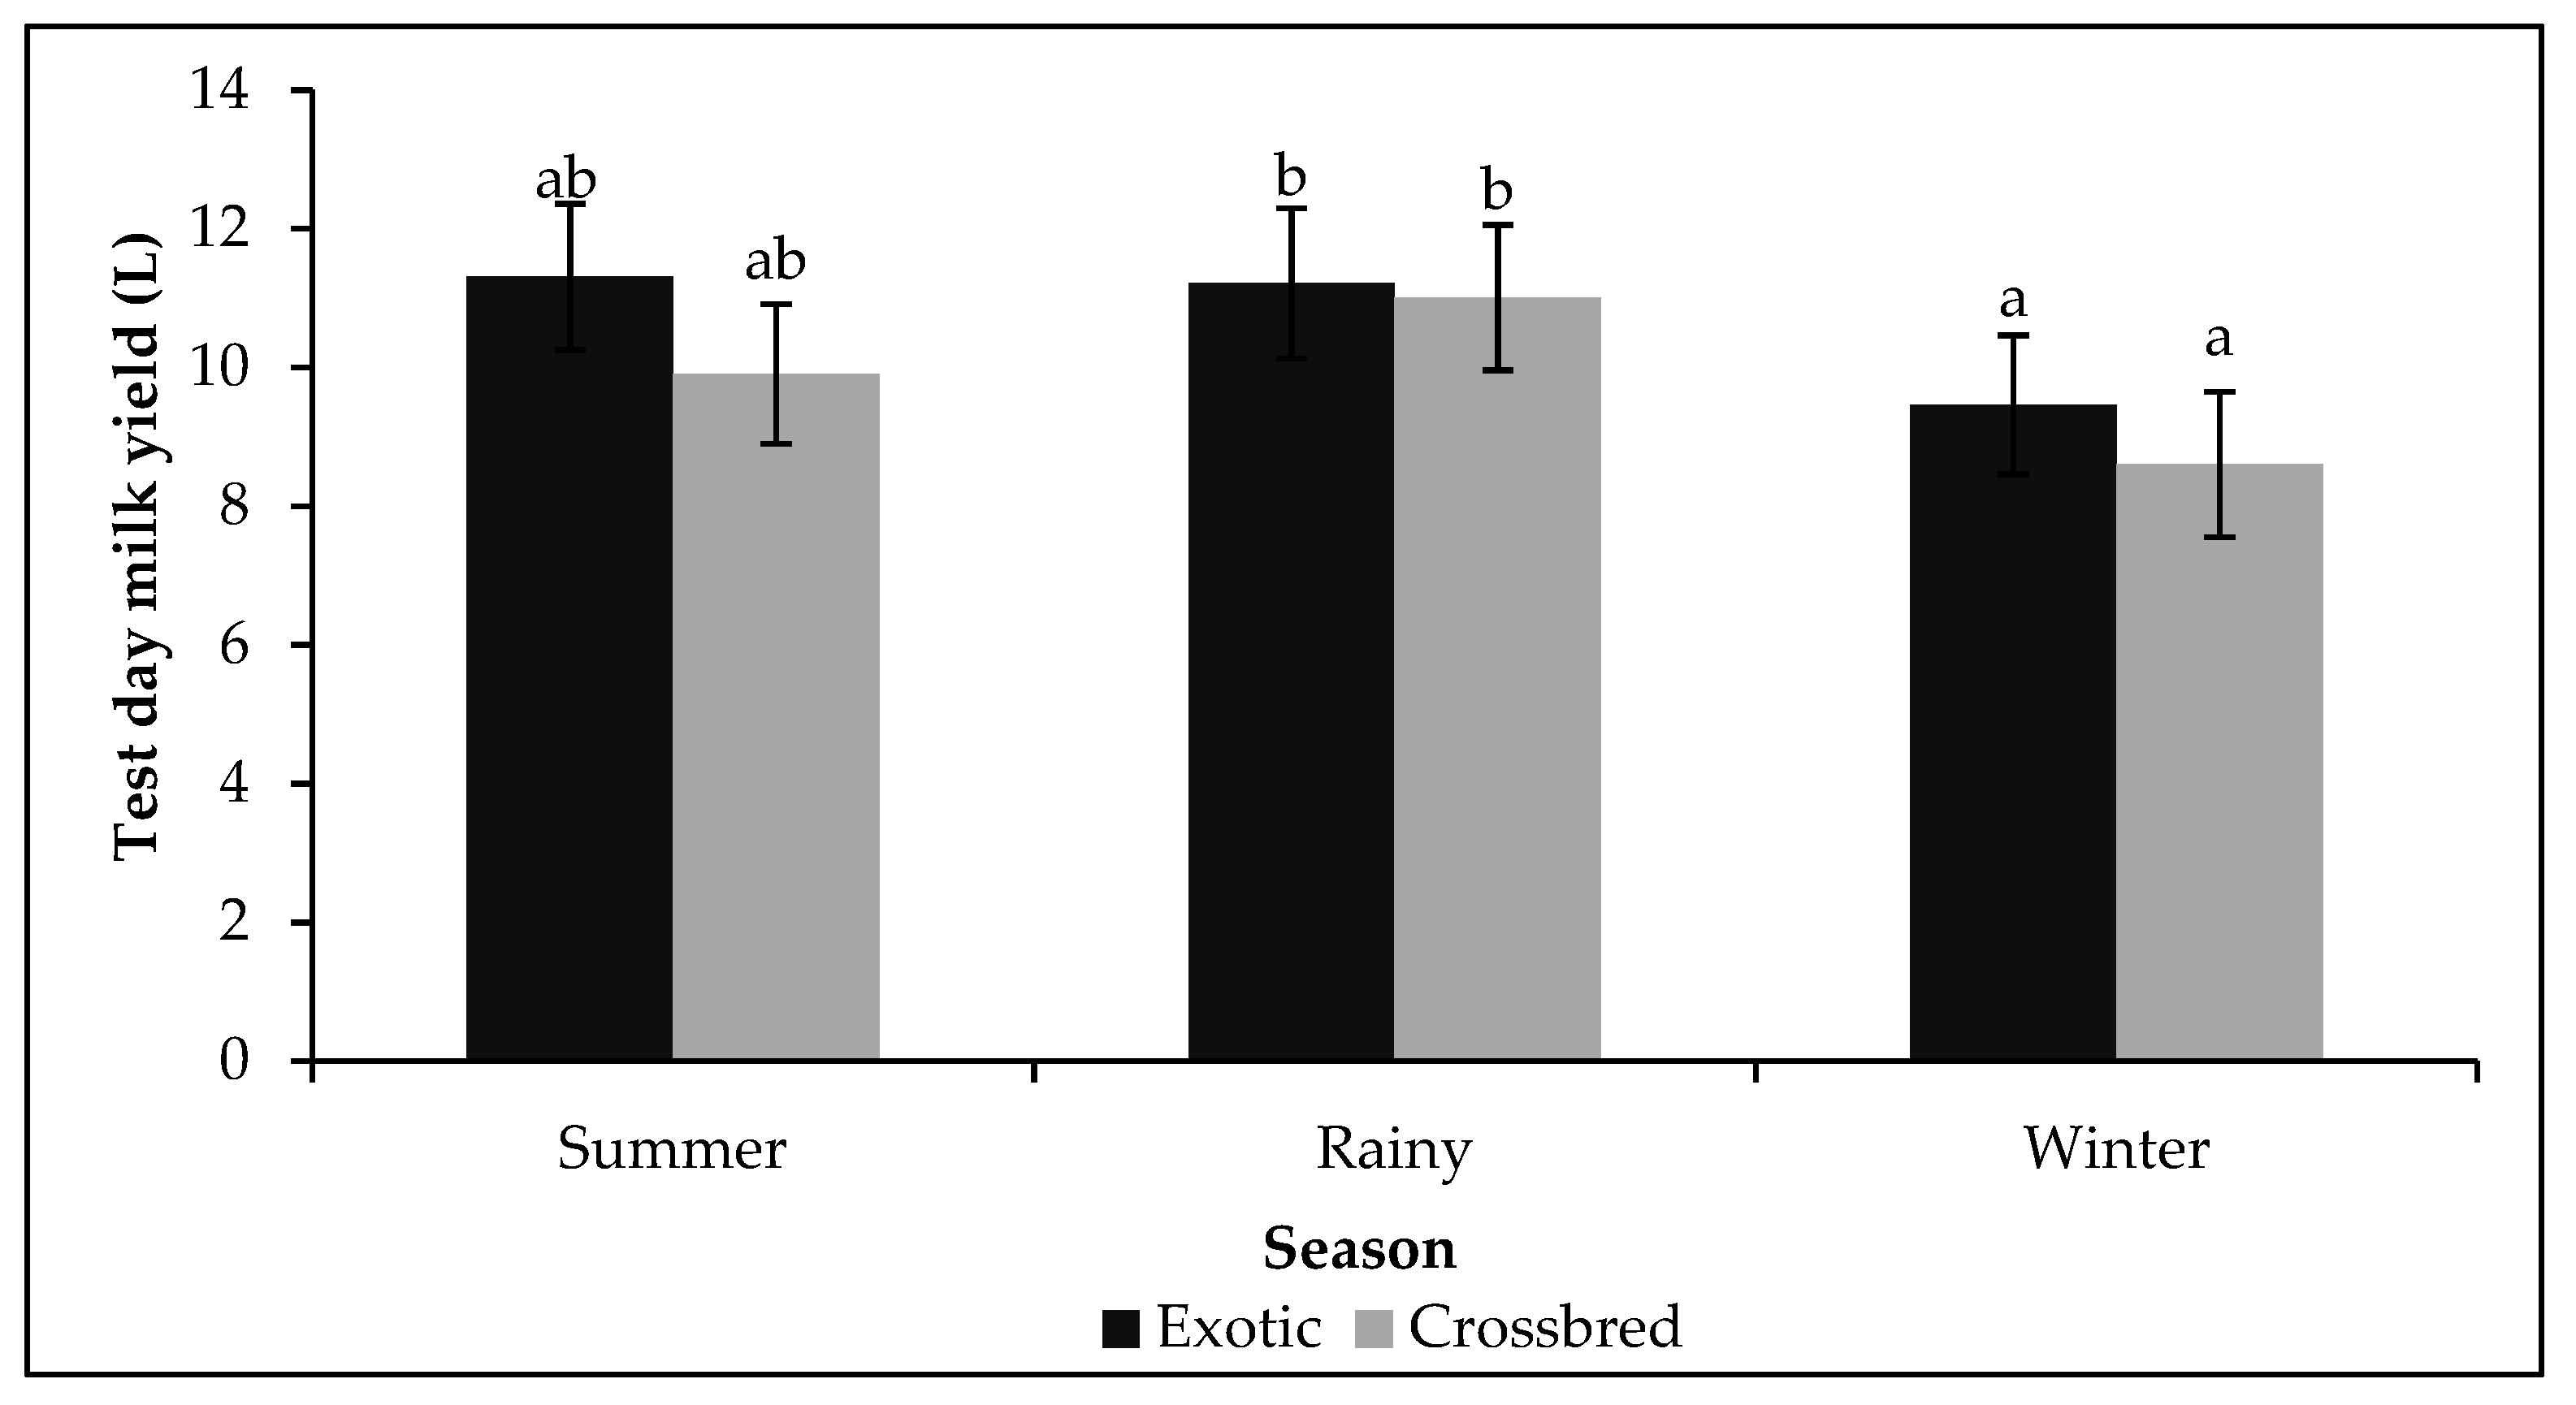
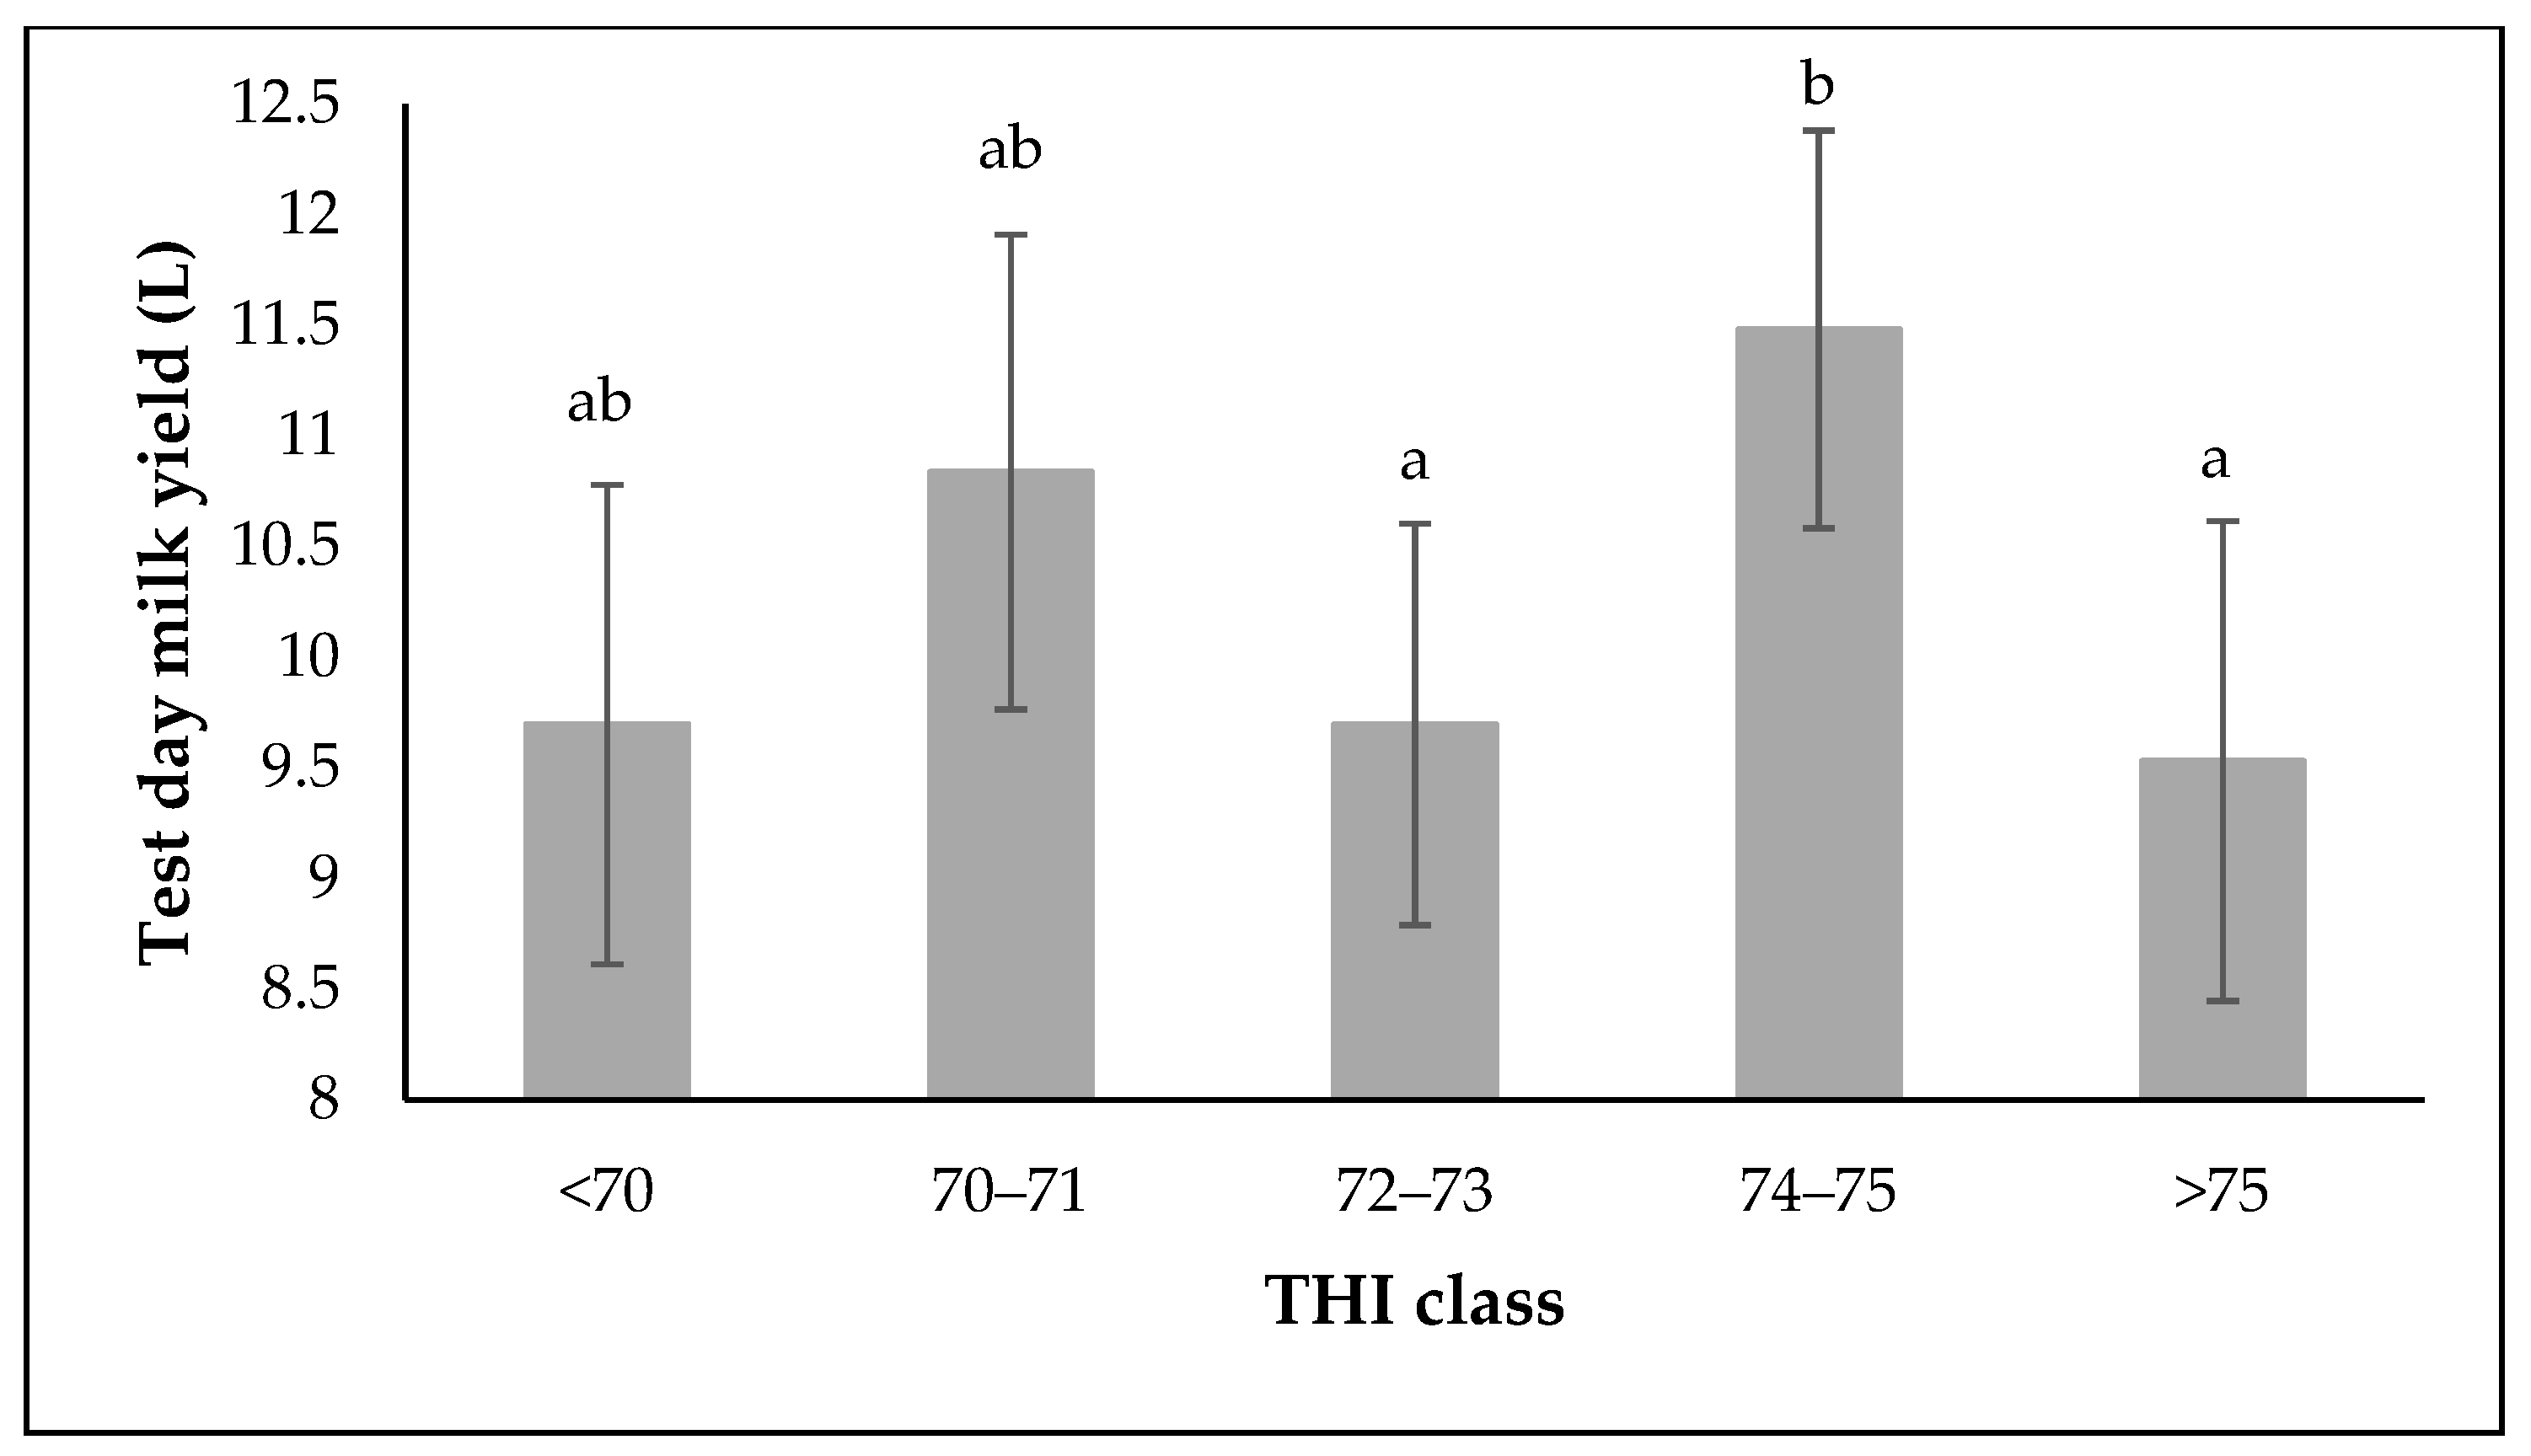
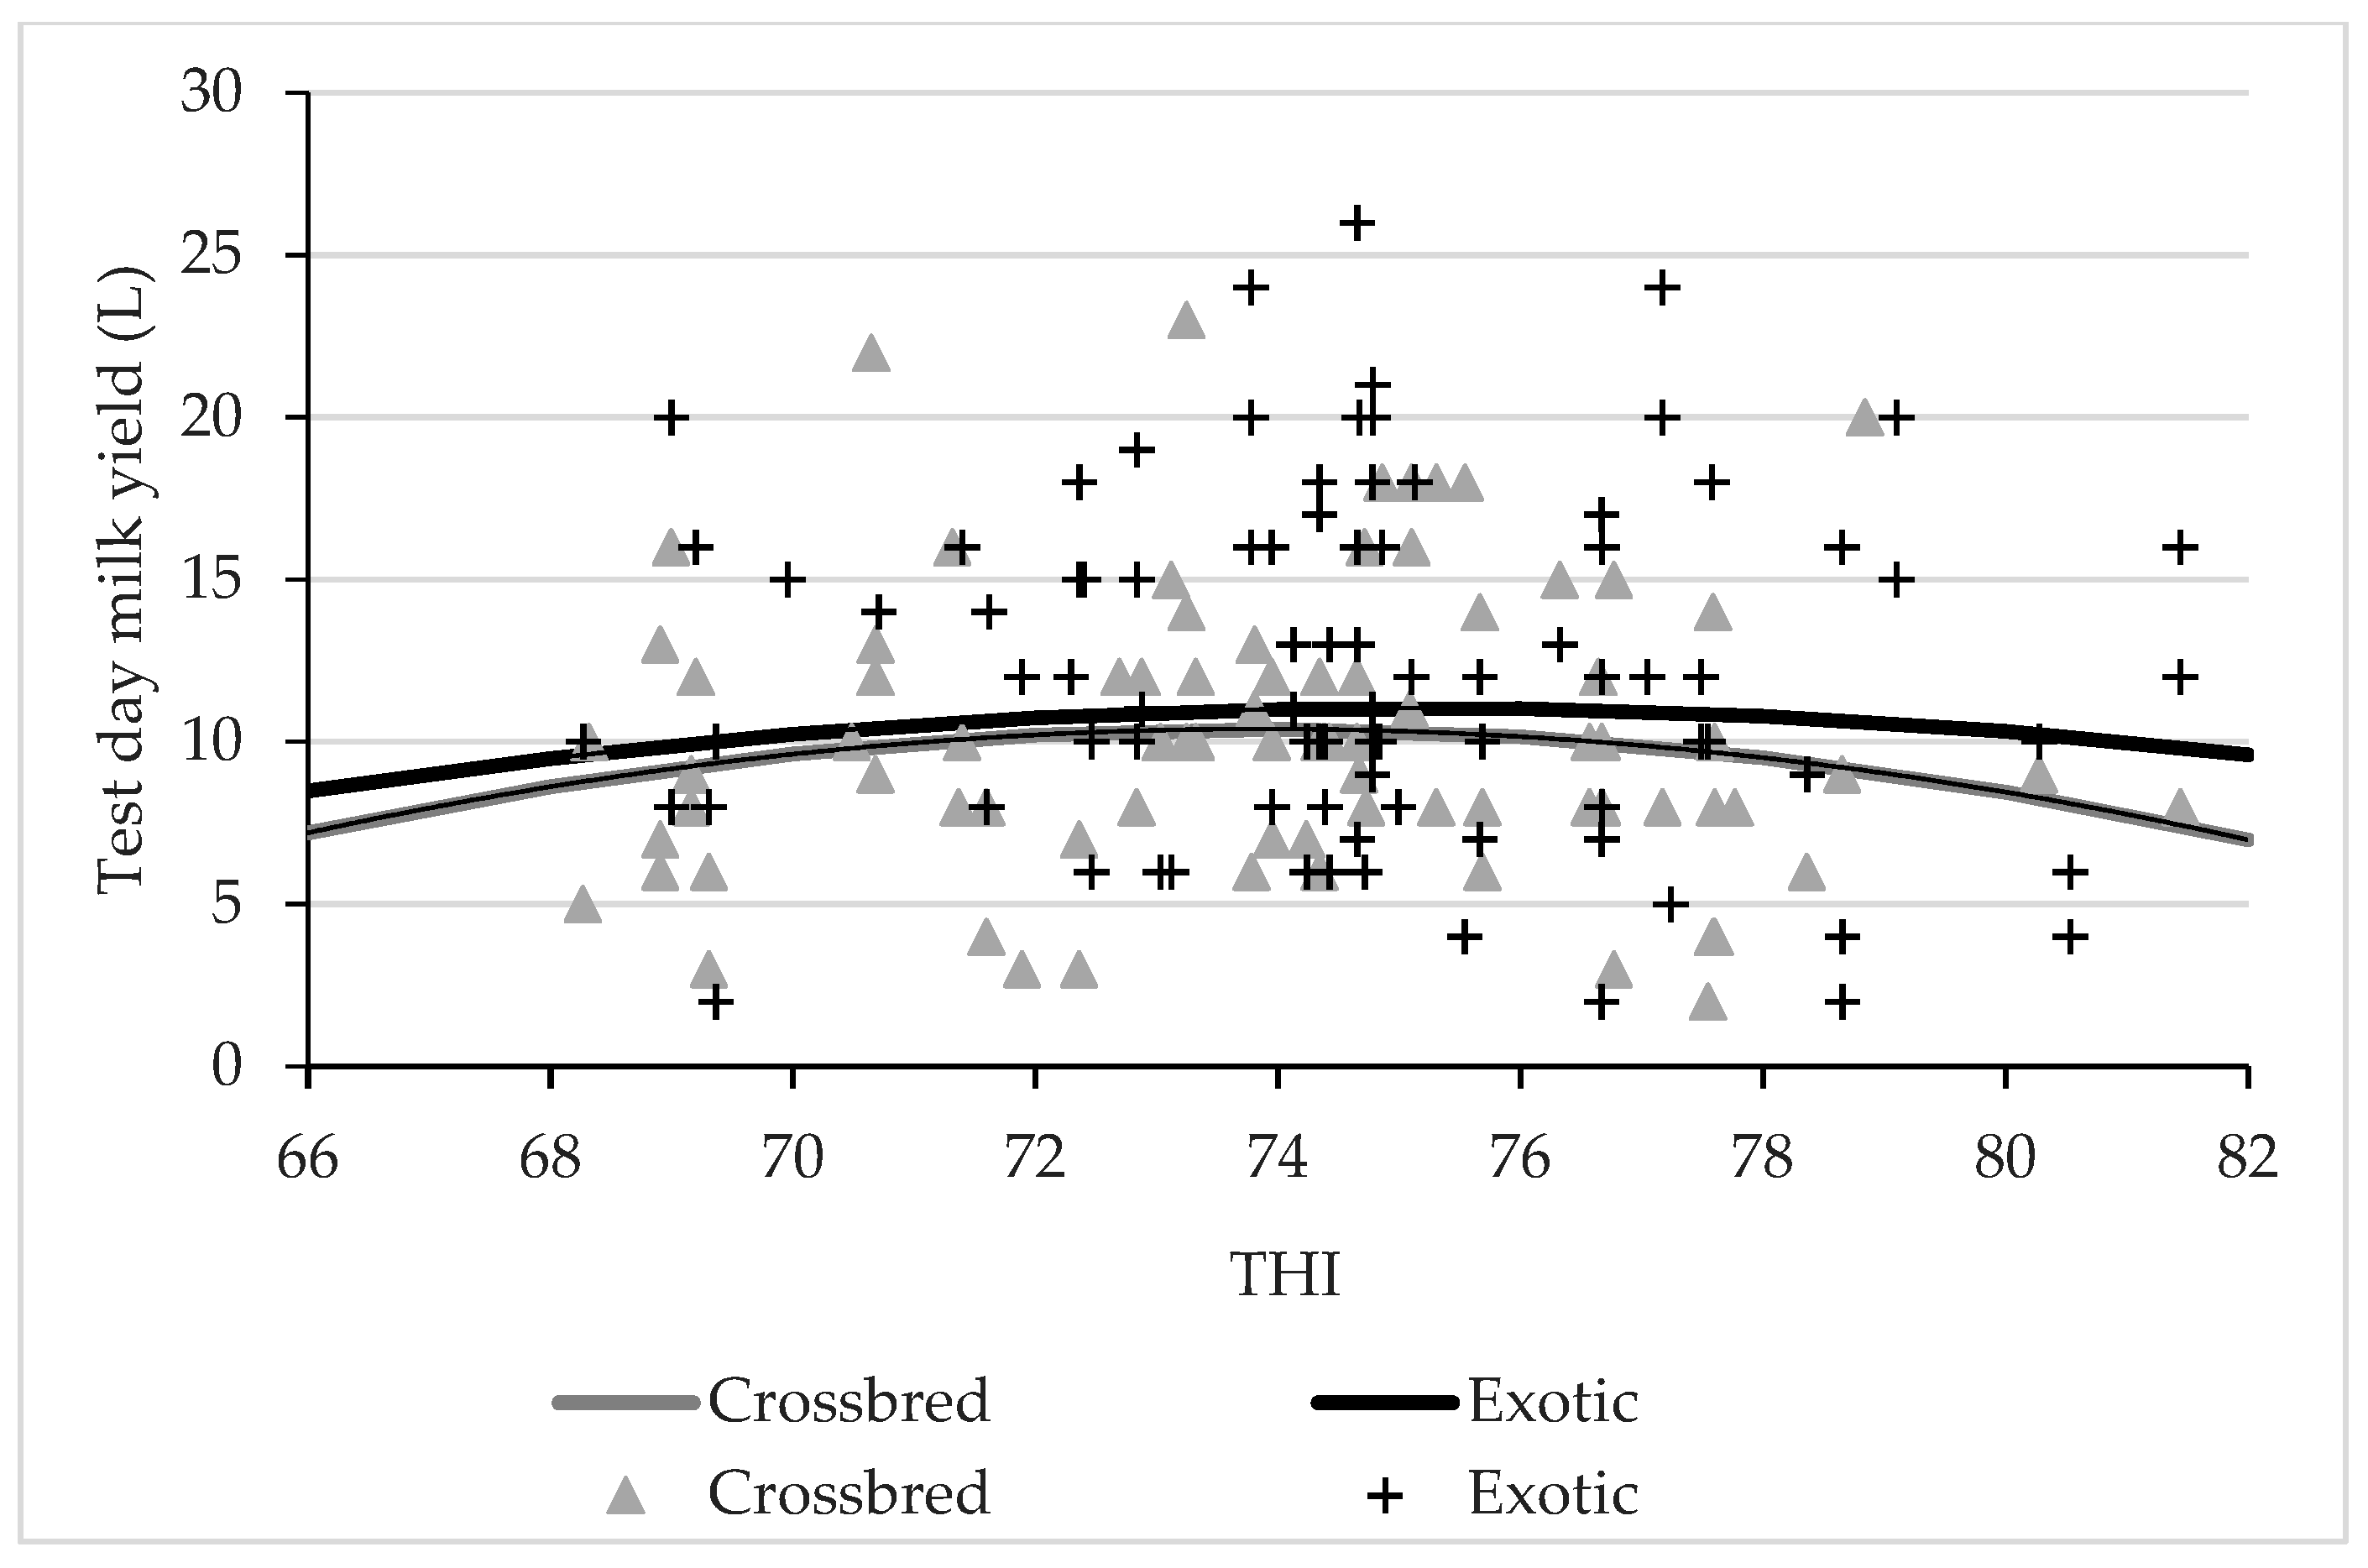
3.1. Effect of Season, SSI, and THI on MY of Exotic and Crossbred Dairy Cattle

Least square means for MY within seasons and dairy cow breeds are displayed in Figure 1 (model 1). The test day MY of the exotic breeds significantly differed between rainy (11.21 ± 1.08 L/day) and winter season (9.46 ± 1.00 L/day). Similarly, a significant difference in MY was observed between rainy (11.01 ± 1.05 L/day) and winter (8.59 ± 1.05 L/day) season in crossbred dairy cows. Differences in least square means for MY between exotic and crossbred cattle were not significant within the same season.
Least square means for MY across the rural–urban interface as defined by SSI are shown in Figure 2. Test day MY was significantly lower in the rural (8.84 ± 0.79 L/day) than in the transition (10.33 ± 0.90 L/day) and urban (11.58 ± 1.28 L/day) areas. The difference in test day MY between the transition and urban area was not significant.
Least square means for MY across THI classes are shown in Figure 3. Test day MY was significantly higher at THI 74–75 (11.48 ± 0.90 L), while the MY was lowest in the extreme THI class of >75 (9.53 ± 1.08 L). Test day MY exhibited an M-shaped pattern of response across the THI classes. An initial increase and decline in milk yield from THI classes 1 (<70) to THI 3 (72–73) was observed, followed by a significant rise in milk yield at THI 74–75 that ultimately led to a significant decline at THI > 75 (Figure 3).
The quadratic regression curves analyzed with model 2 for test day MY by THI are depicted in Figure 4 for both crossbred (y = −0.0516x2 + 7.6221x − 271.12) and exotic cattle (y = −0.0305x2 + 4.5888x − 161.35). In agreement with the results for THI class effects (model 1), MY was lowest at the extreme ends of the THI scale. The MY by THI pattern was very similar for both crossbred and exotic cows. Nevertheless, the MY of exotic cattle (10.71 ± 0.89 L) was higher than the MY of crossbred cows (9.89 ± 0.86 L) across the THI range. Table A1 presents the results of the test of significance, R2, and RSME for the regression analysis studying MY responses on THI from model 2.

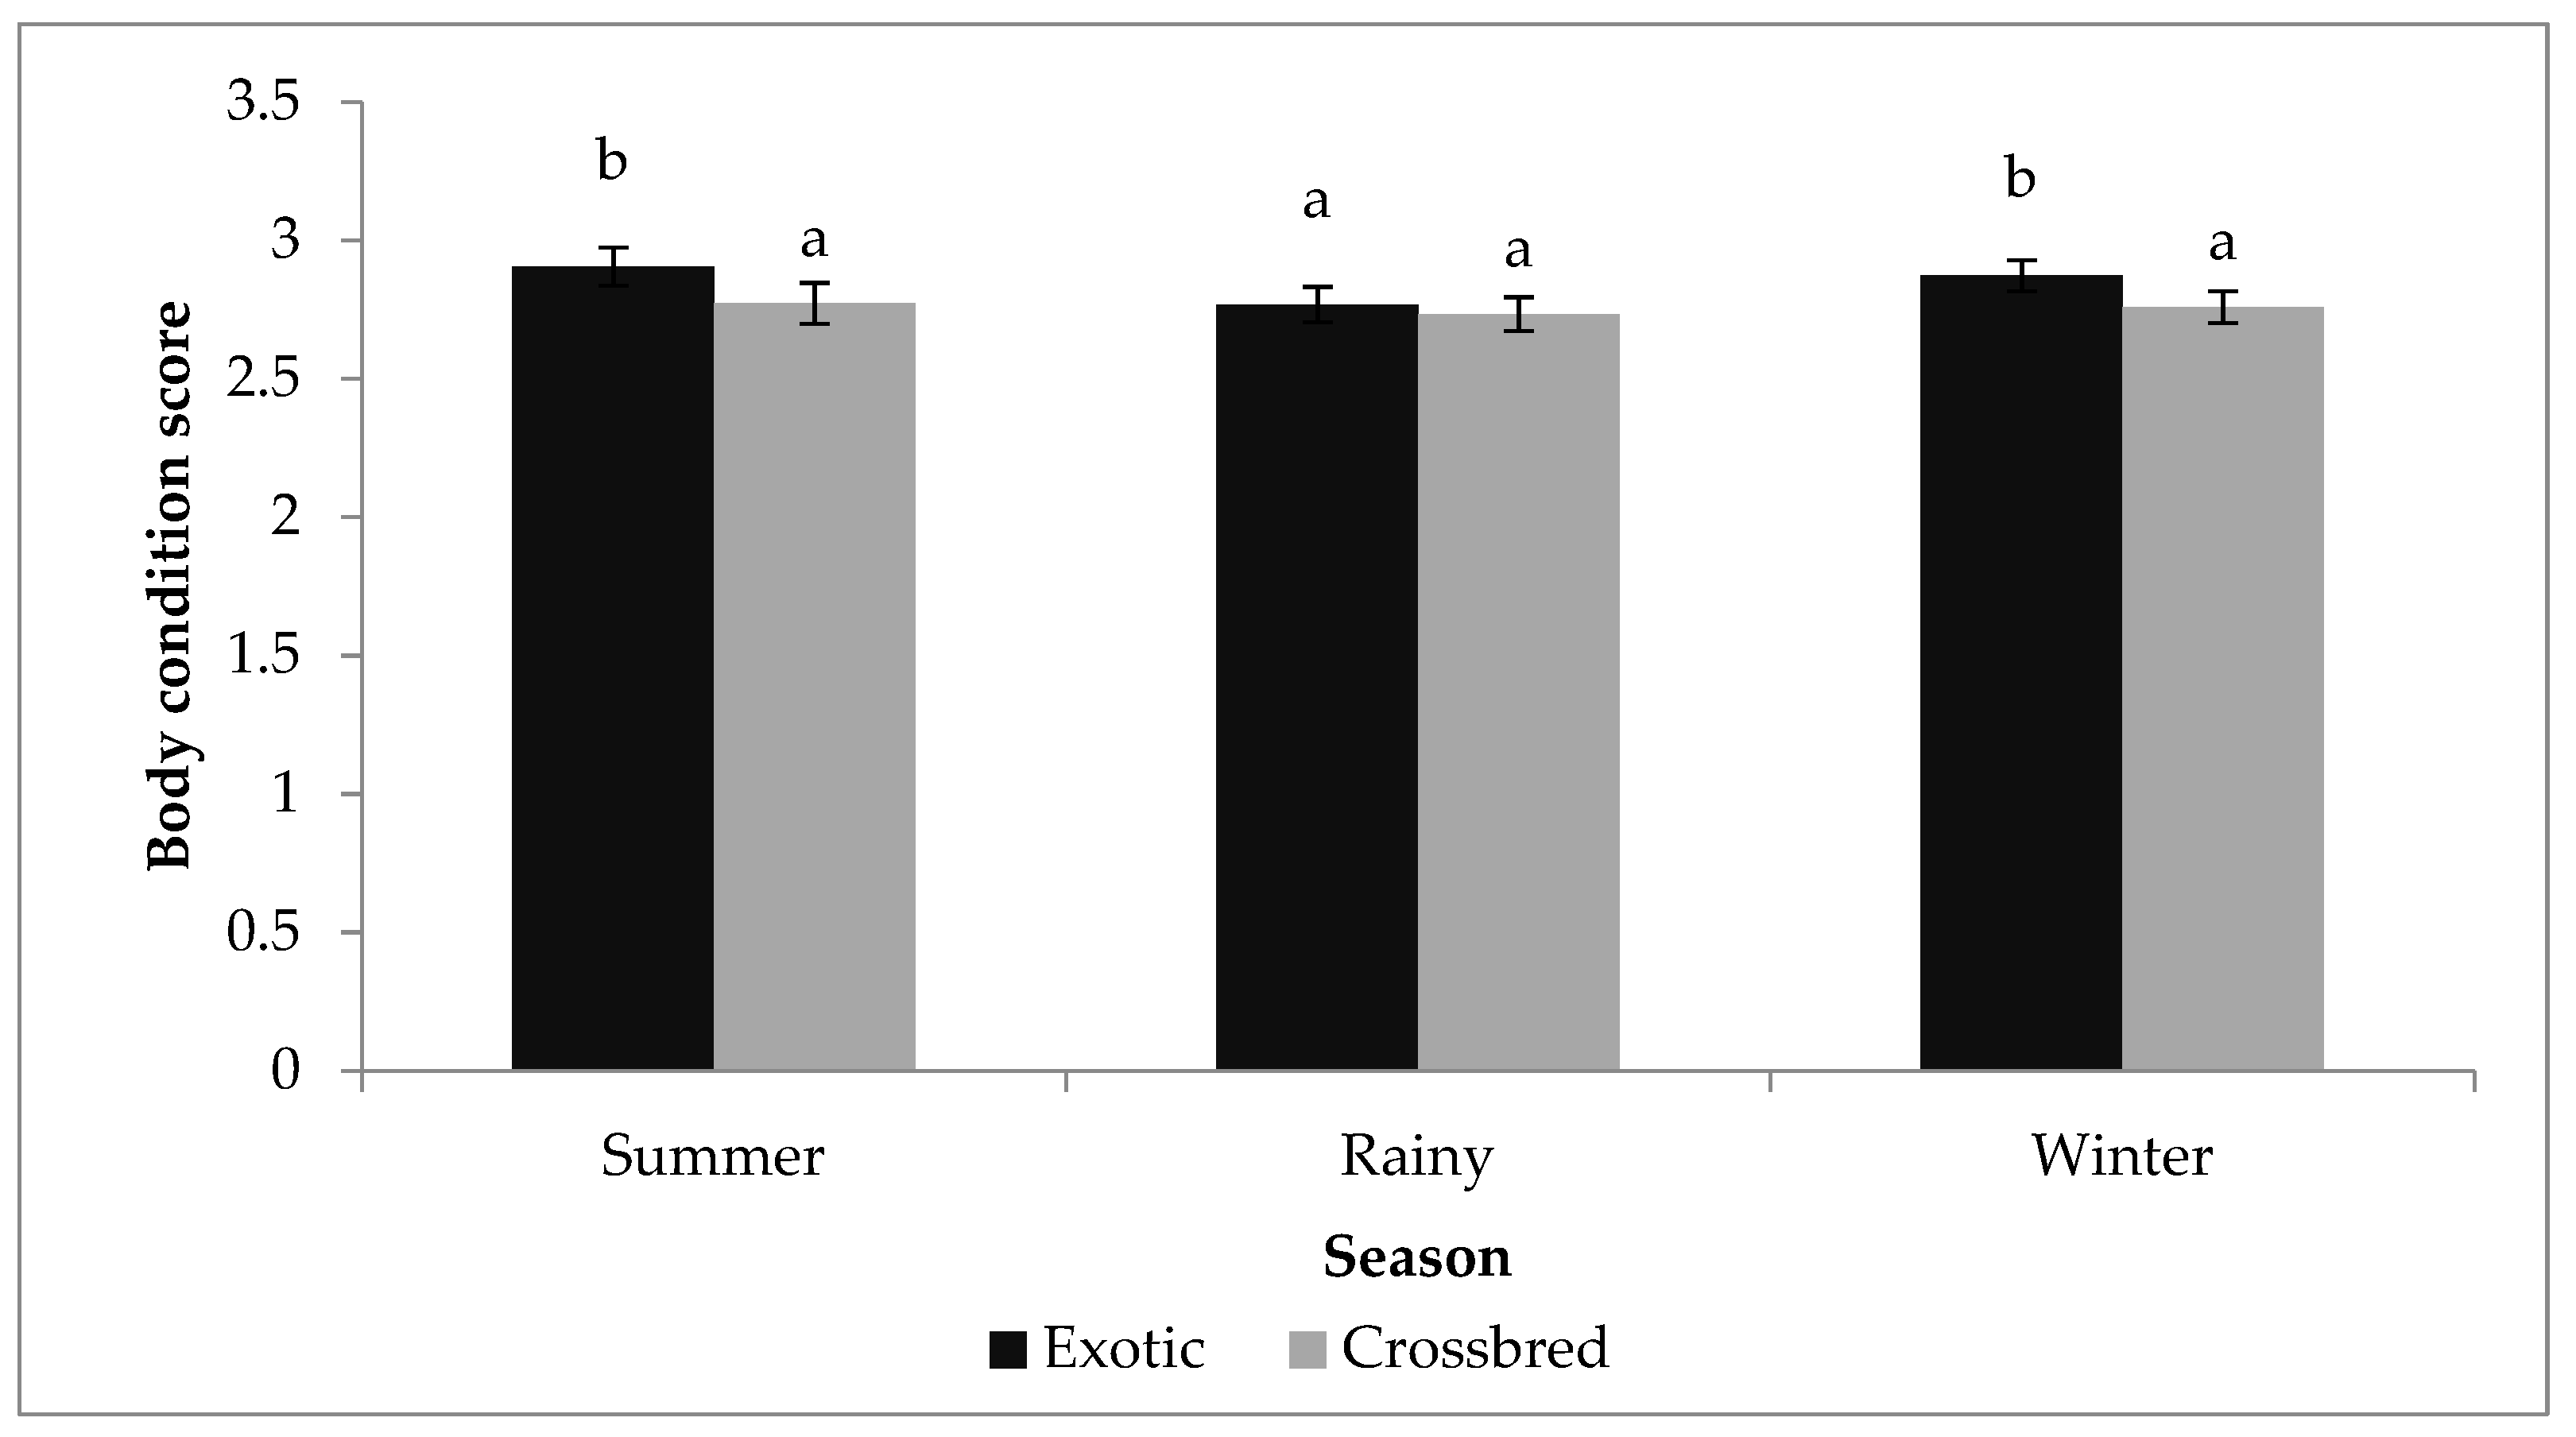
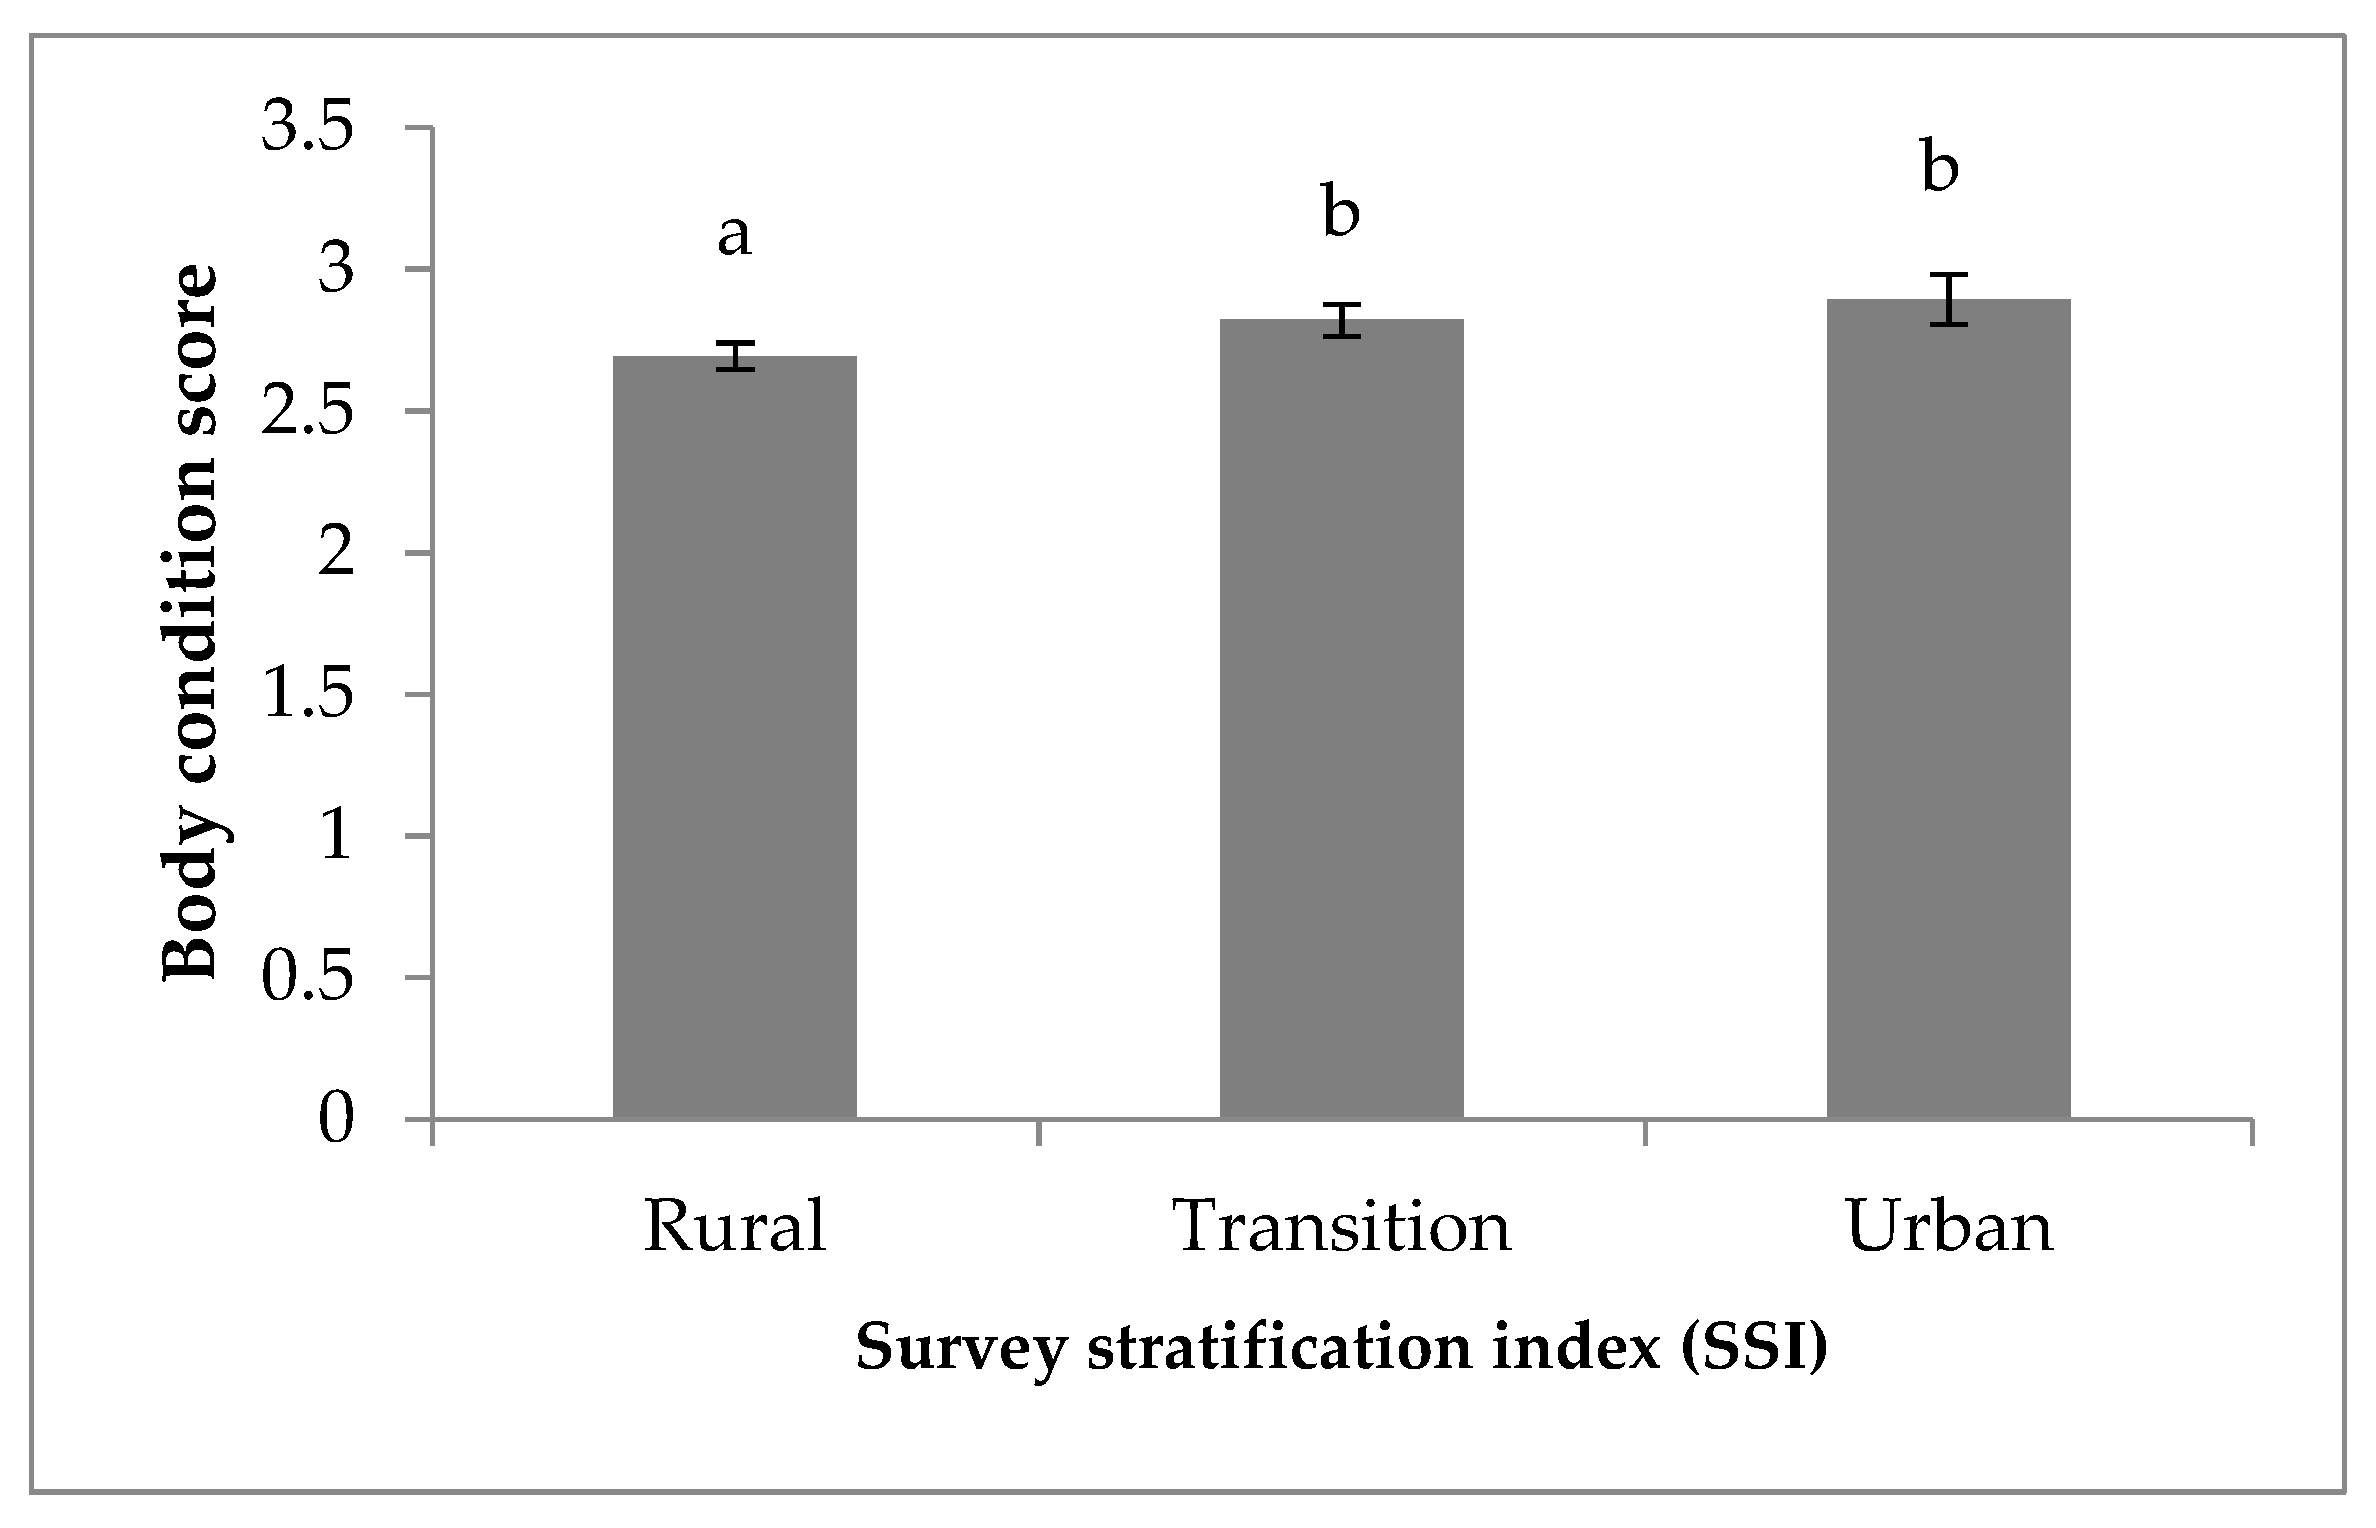
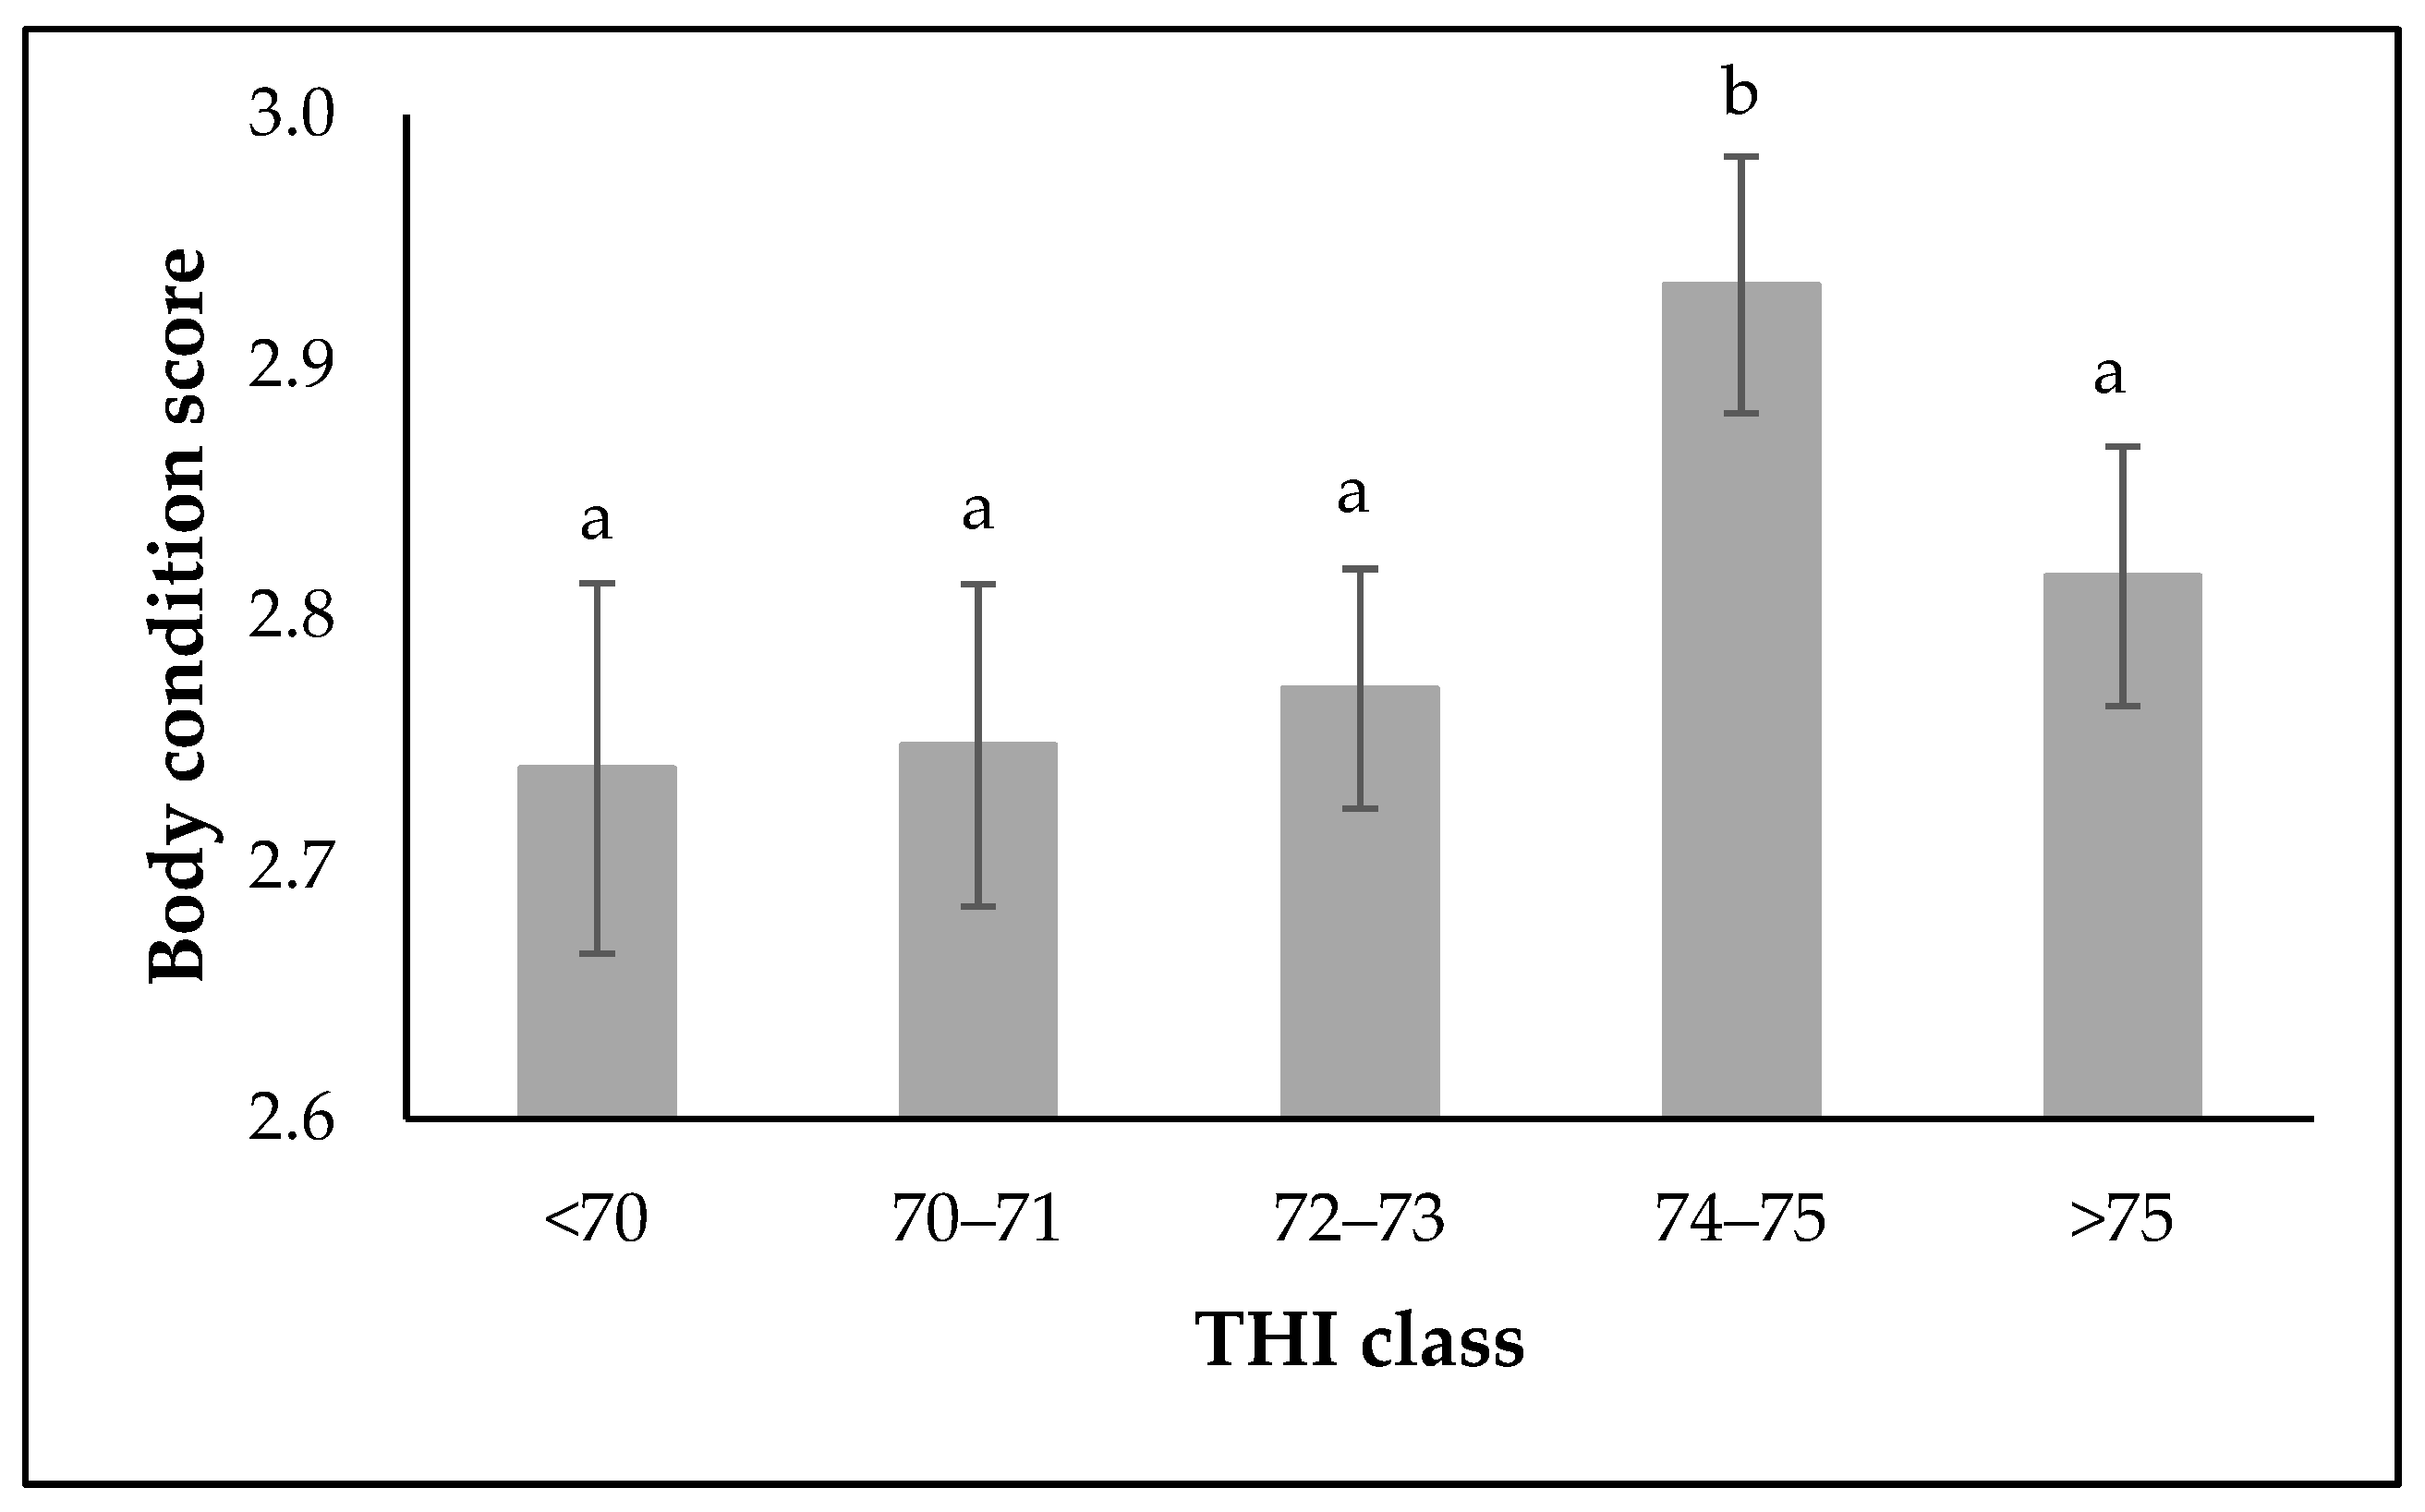
3.2. Effect of Season, SSI, and THI on BCS in Exotic and Crossbred Dairy Cattle

The breed-by-season interaction on BCS was not significant (p > 0.05), although minor seasonal effects on BCS were observed in exotic cattle (Figure 5). The least square mean for BCS was significantly (p < 0.05) lower in exotic cattle during the rainy season (2.77 ± 0.06) compared to the summer (2.91 ± 0.07) and winter (2.87 ± 0.06) season. In crossbred dairy cows, there was no significant effect of season on BCS. The BCS did not differ significantly (p > 0.05) between exotic and crossbred cows across the seasons.
The SSI significantly (p < 0.05) affected BCS across the rural–urban interface (Figure 6). The least square mean for BCS was significantly higher (p < 0.05) for cows located in the urban (2.89 ± 0.09) and transition areas (2.82 ± 0.05) compared to cows in rural areas (2.69 ± 0.05).
Least square means for BCS across THI classes are shown in Figure 7. The BCS recorded at THI class 4 (THI = 74–75) was significantly different from all other classes. A significant increase in BCS was observed at THI 74–75 (2.93 ± 0.05), followed by a significant decline to 2.82 ± 0.05 at THI > 75.

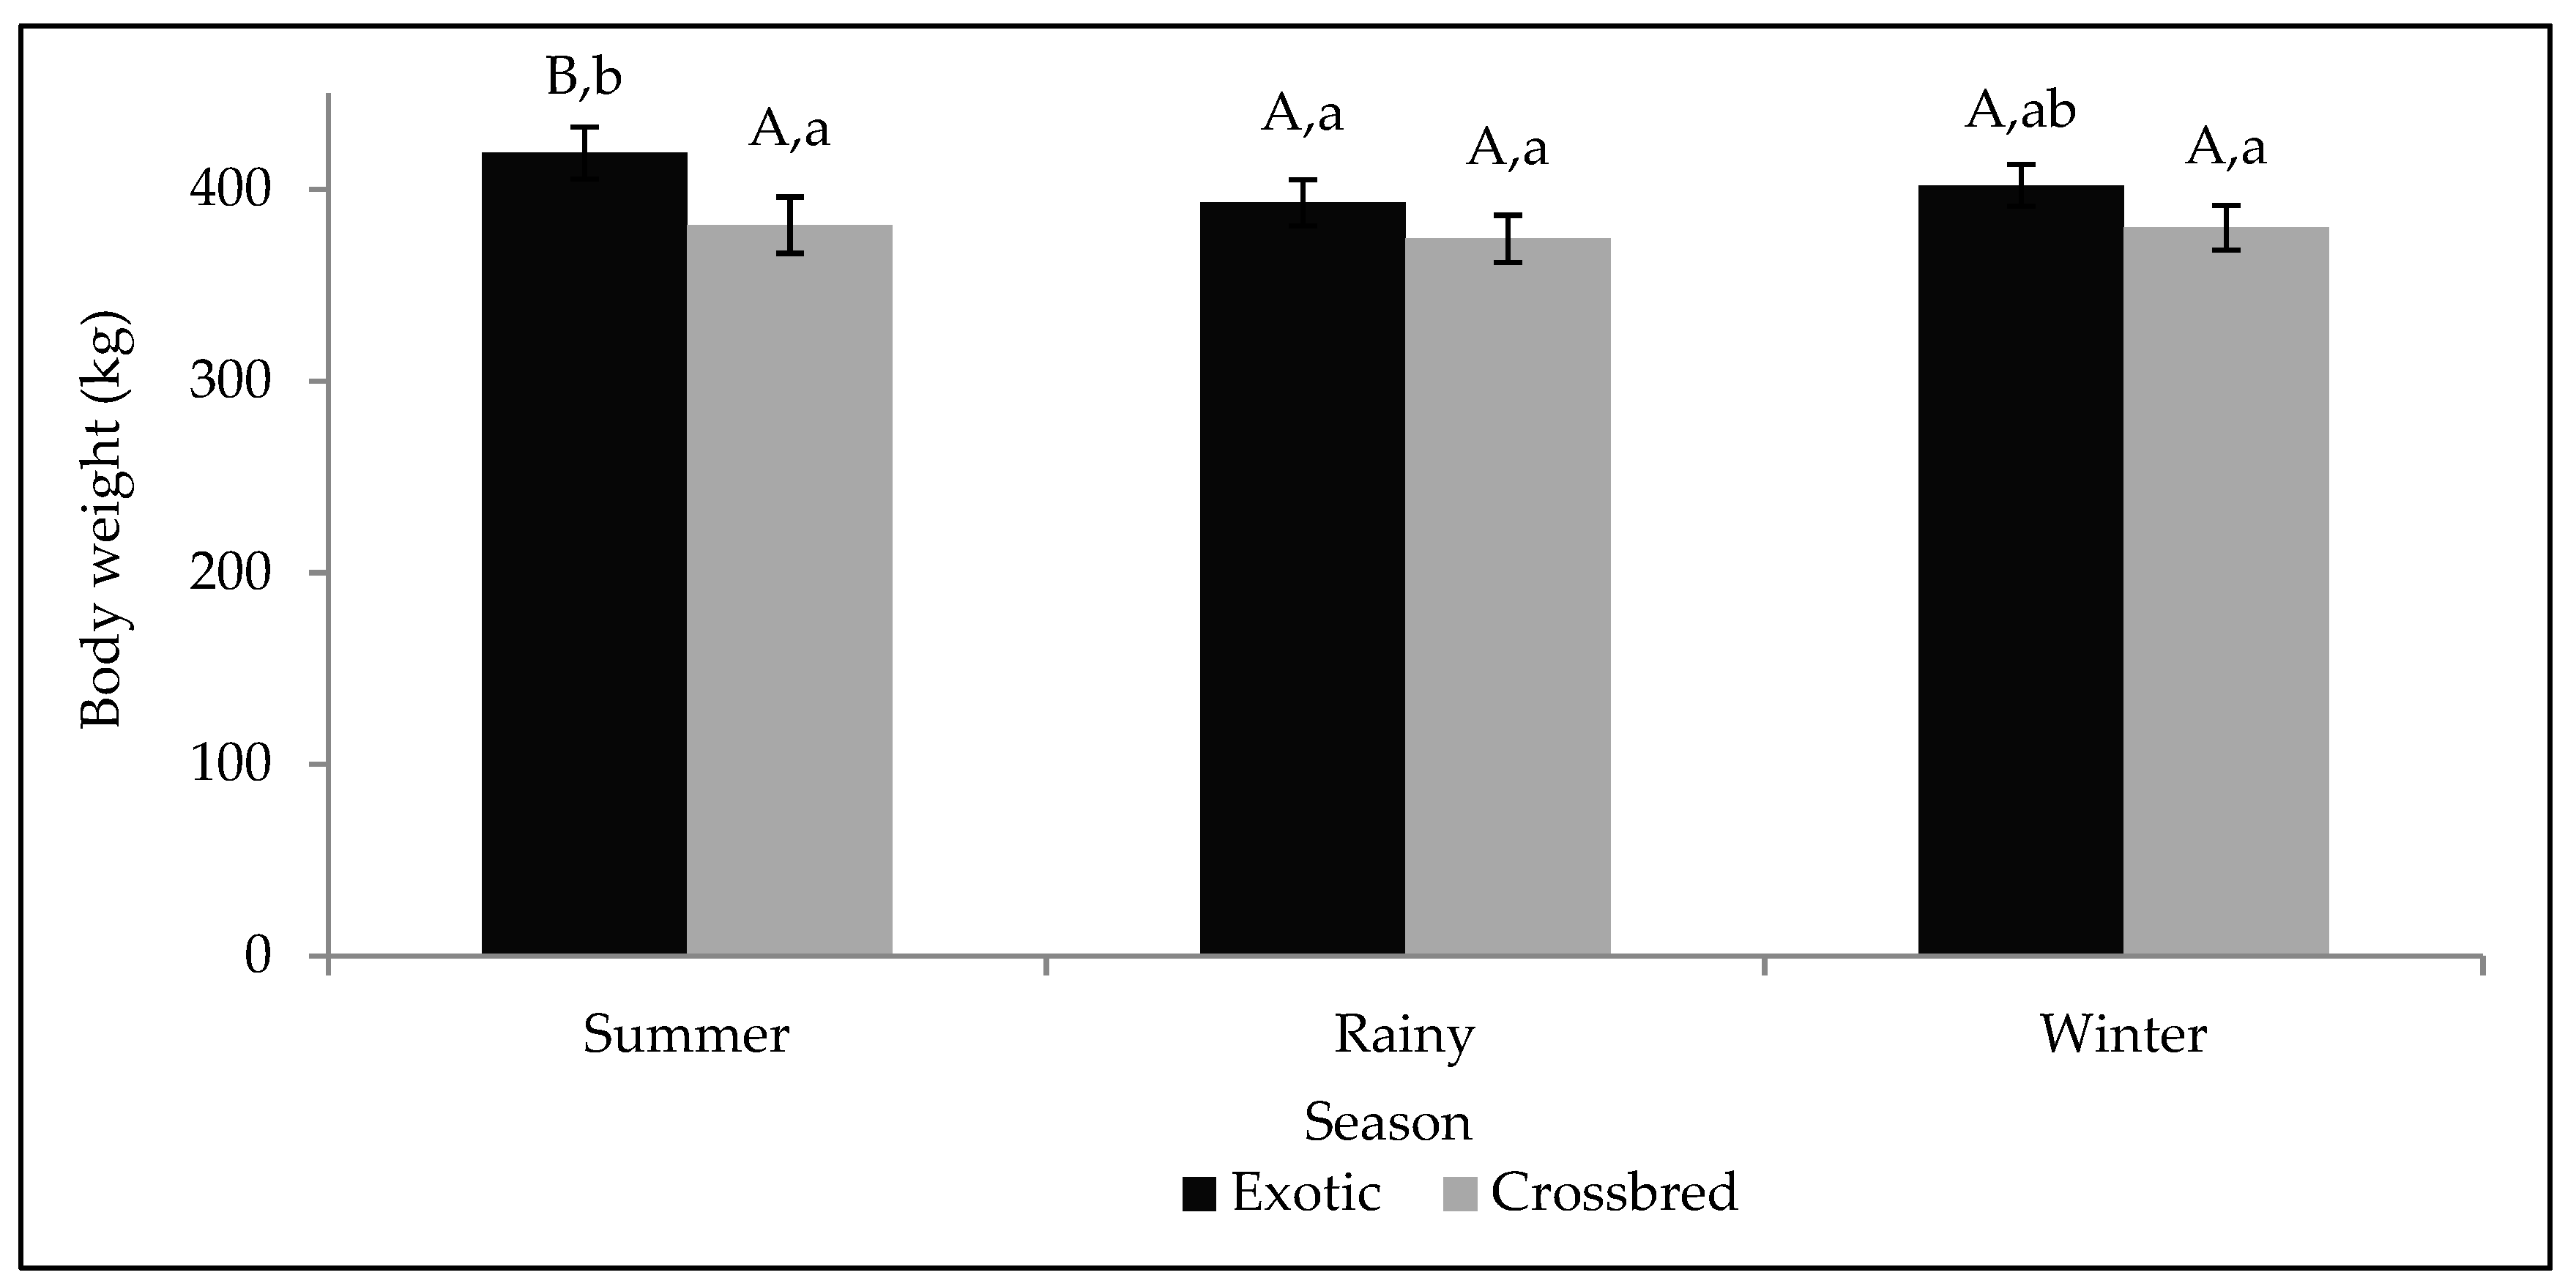
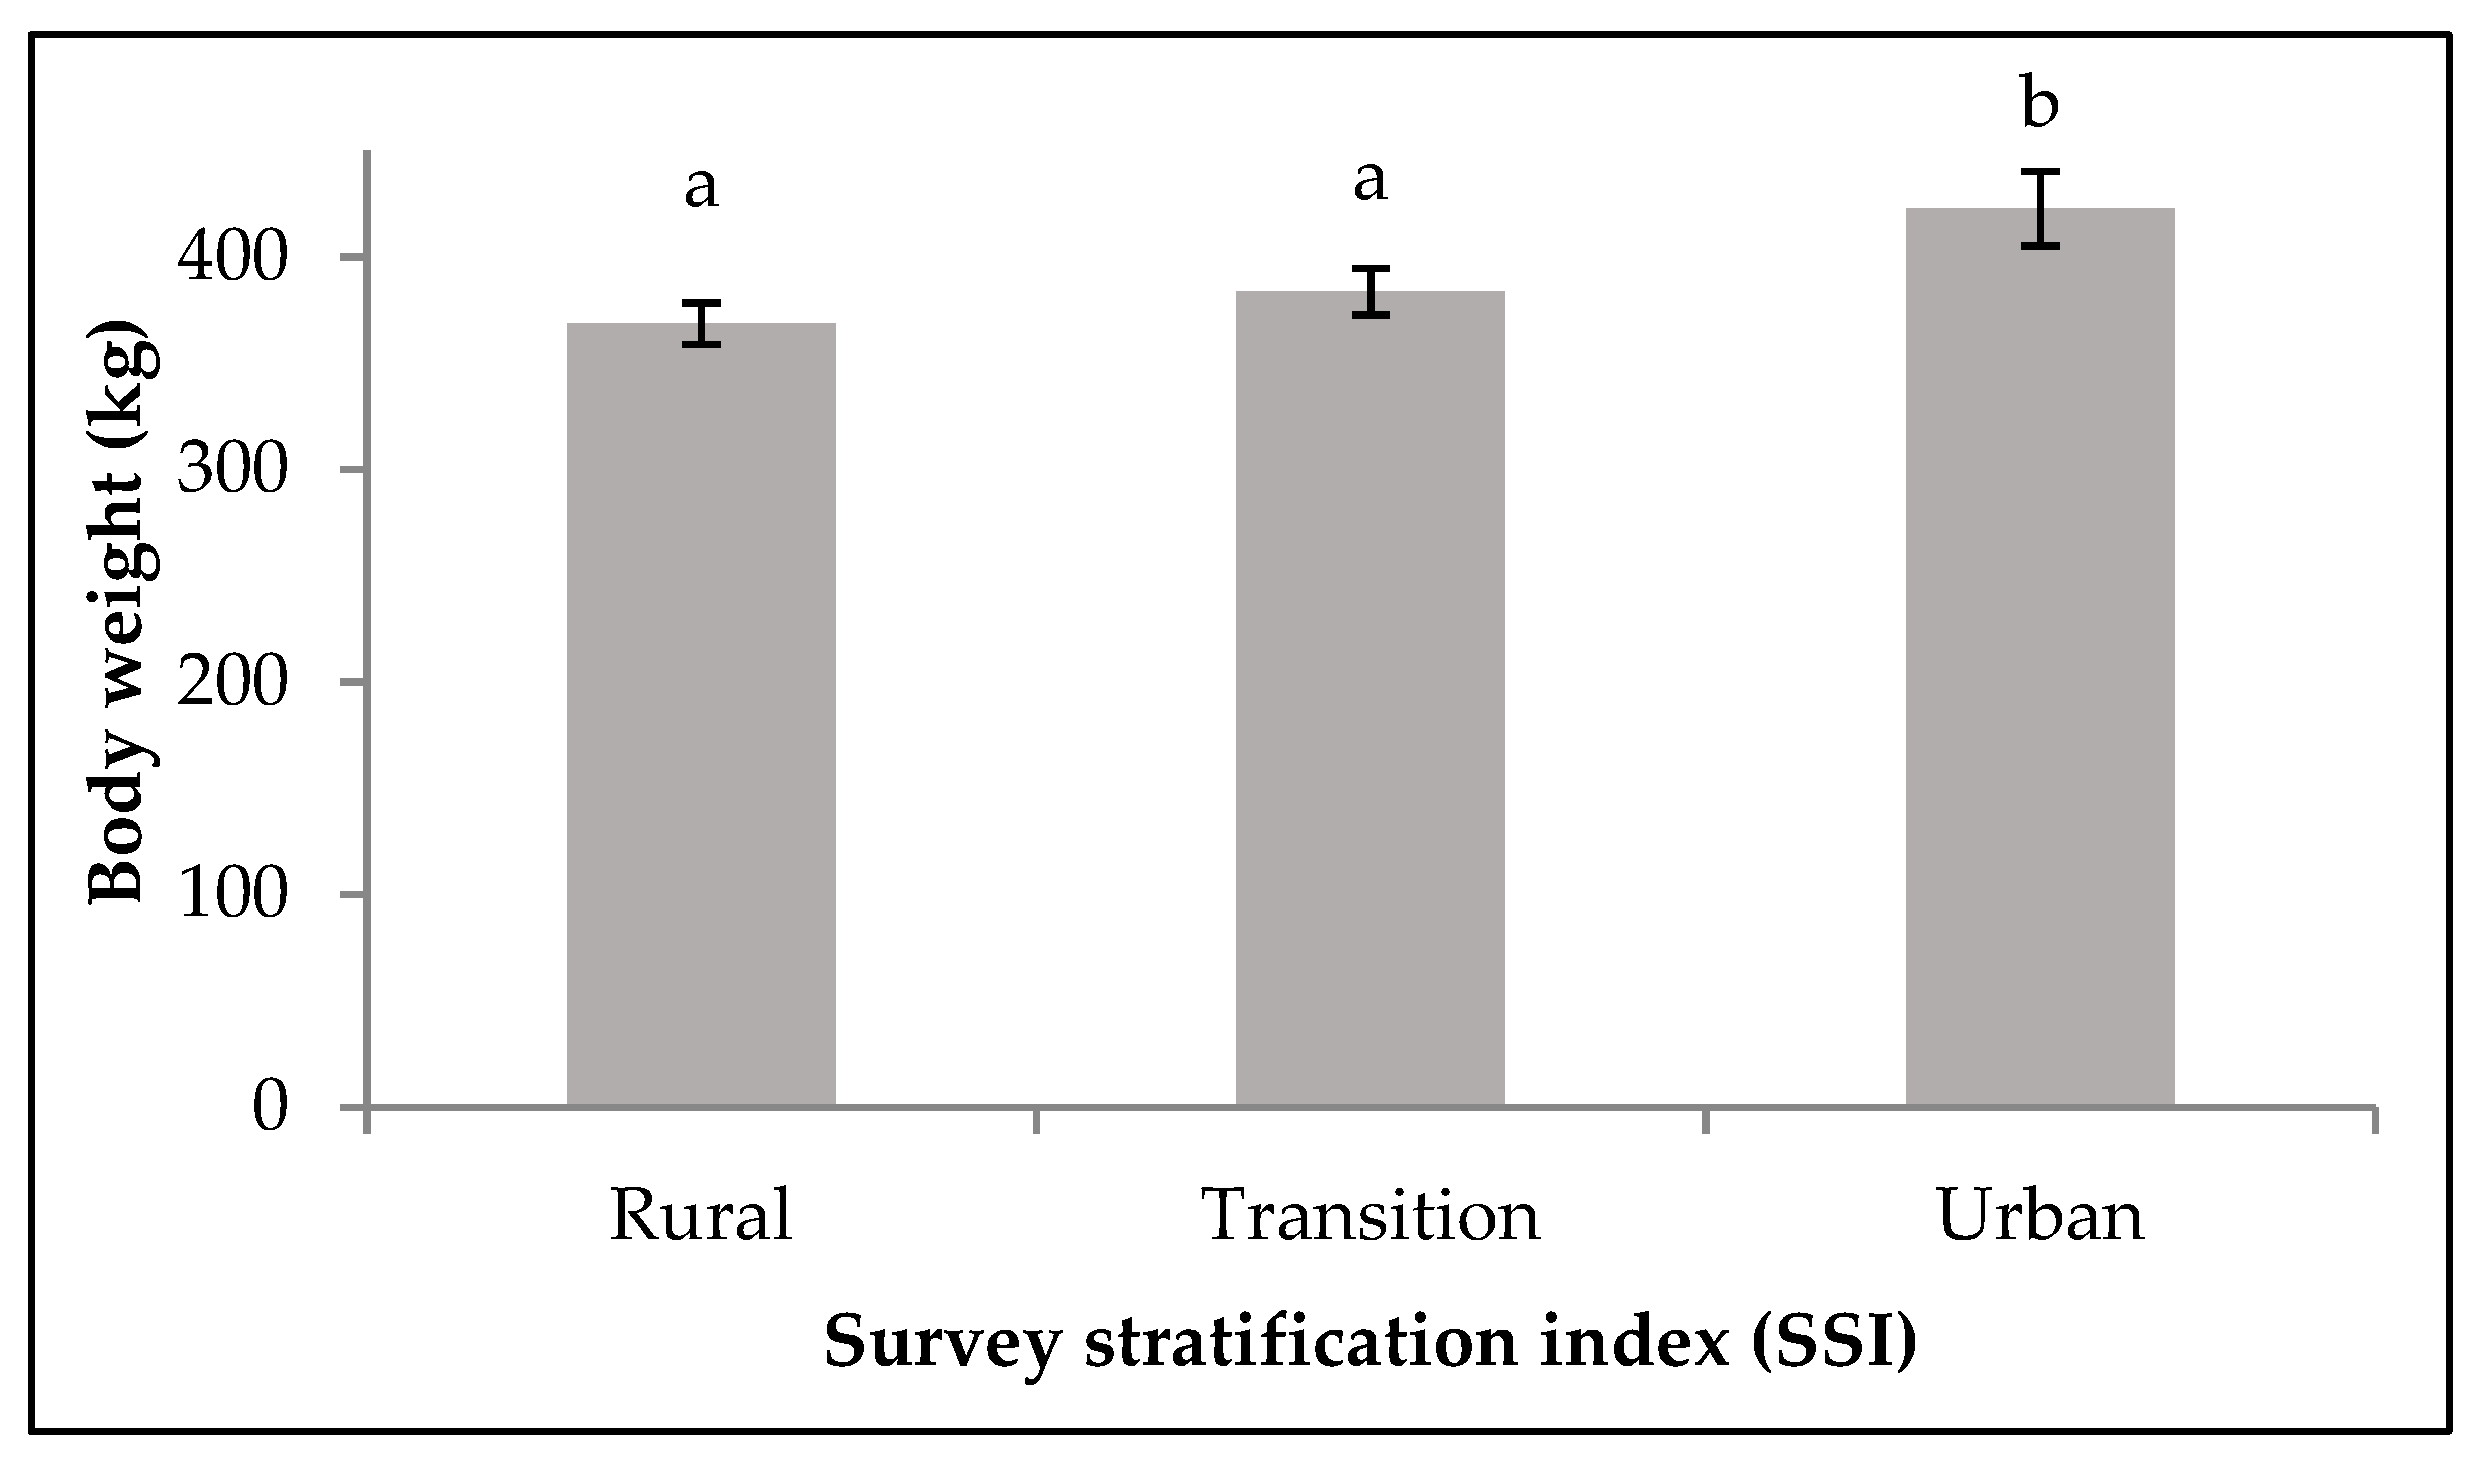
3.3. Effect of Season, SSI, and THI on BW in Exotic and Crossbred Dairy Cattle

Least square means for BW in the summer, rainy, and winter seasons are shown in Figure 8. The BW of exotic cattle significantly (p < 0.05) differed between the summer (419.04 ± 13.49 kg) and the rainy season (393.04 ± 12.06 kg). The least square mean for BW of exotic cattle in the winter season was 402.00 ± 10.82 kg, and was not significantly different from BW in the summer or rainy season. In contrast, the season effect was not significant (p > 0.05) in crossbred cattle. Regarding breed comparisons within seasons, least square means for BW of exotic and crossbred cattle differed significantly (p < 0.05) only during the summer season, with significantly lower BW in crossbred (318.35 ± 14.70 kg) than in exotic cattle (419.04 ± 13.49 kg). In the rainy and winter season, differences in least squares means for BW between exotic and crossbred cattle were not significant (p > 0.05).
Least square means for BW across the rural–urban interface as defined by SSI are shown in Figure 9. BW was significantly higher (p < 0.05) in urban (422.6 ± 17.37 kg) than in rural (368.7 ± 9.7 kg) and transition areas (383.58 ± 10.88 kg). The differences in BW between rural and transition areas were not significant (p > 0.05). The THI classes had no significant effect on BW in dairy cows.

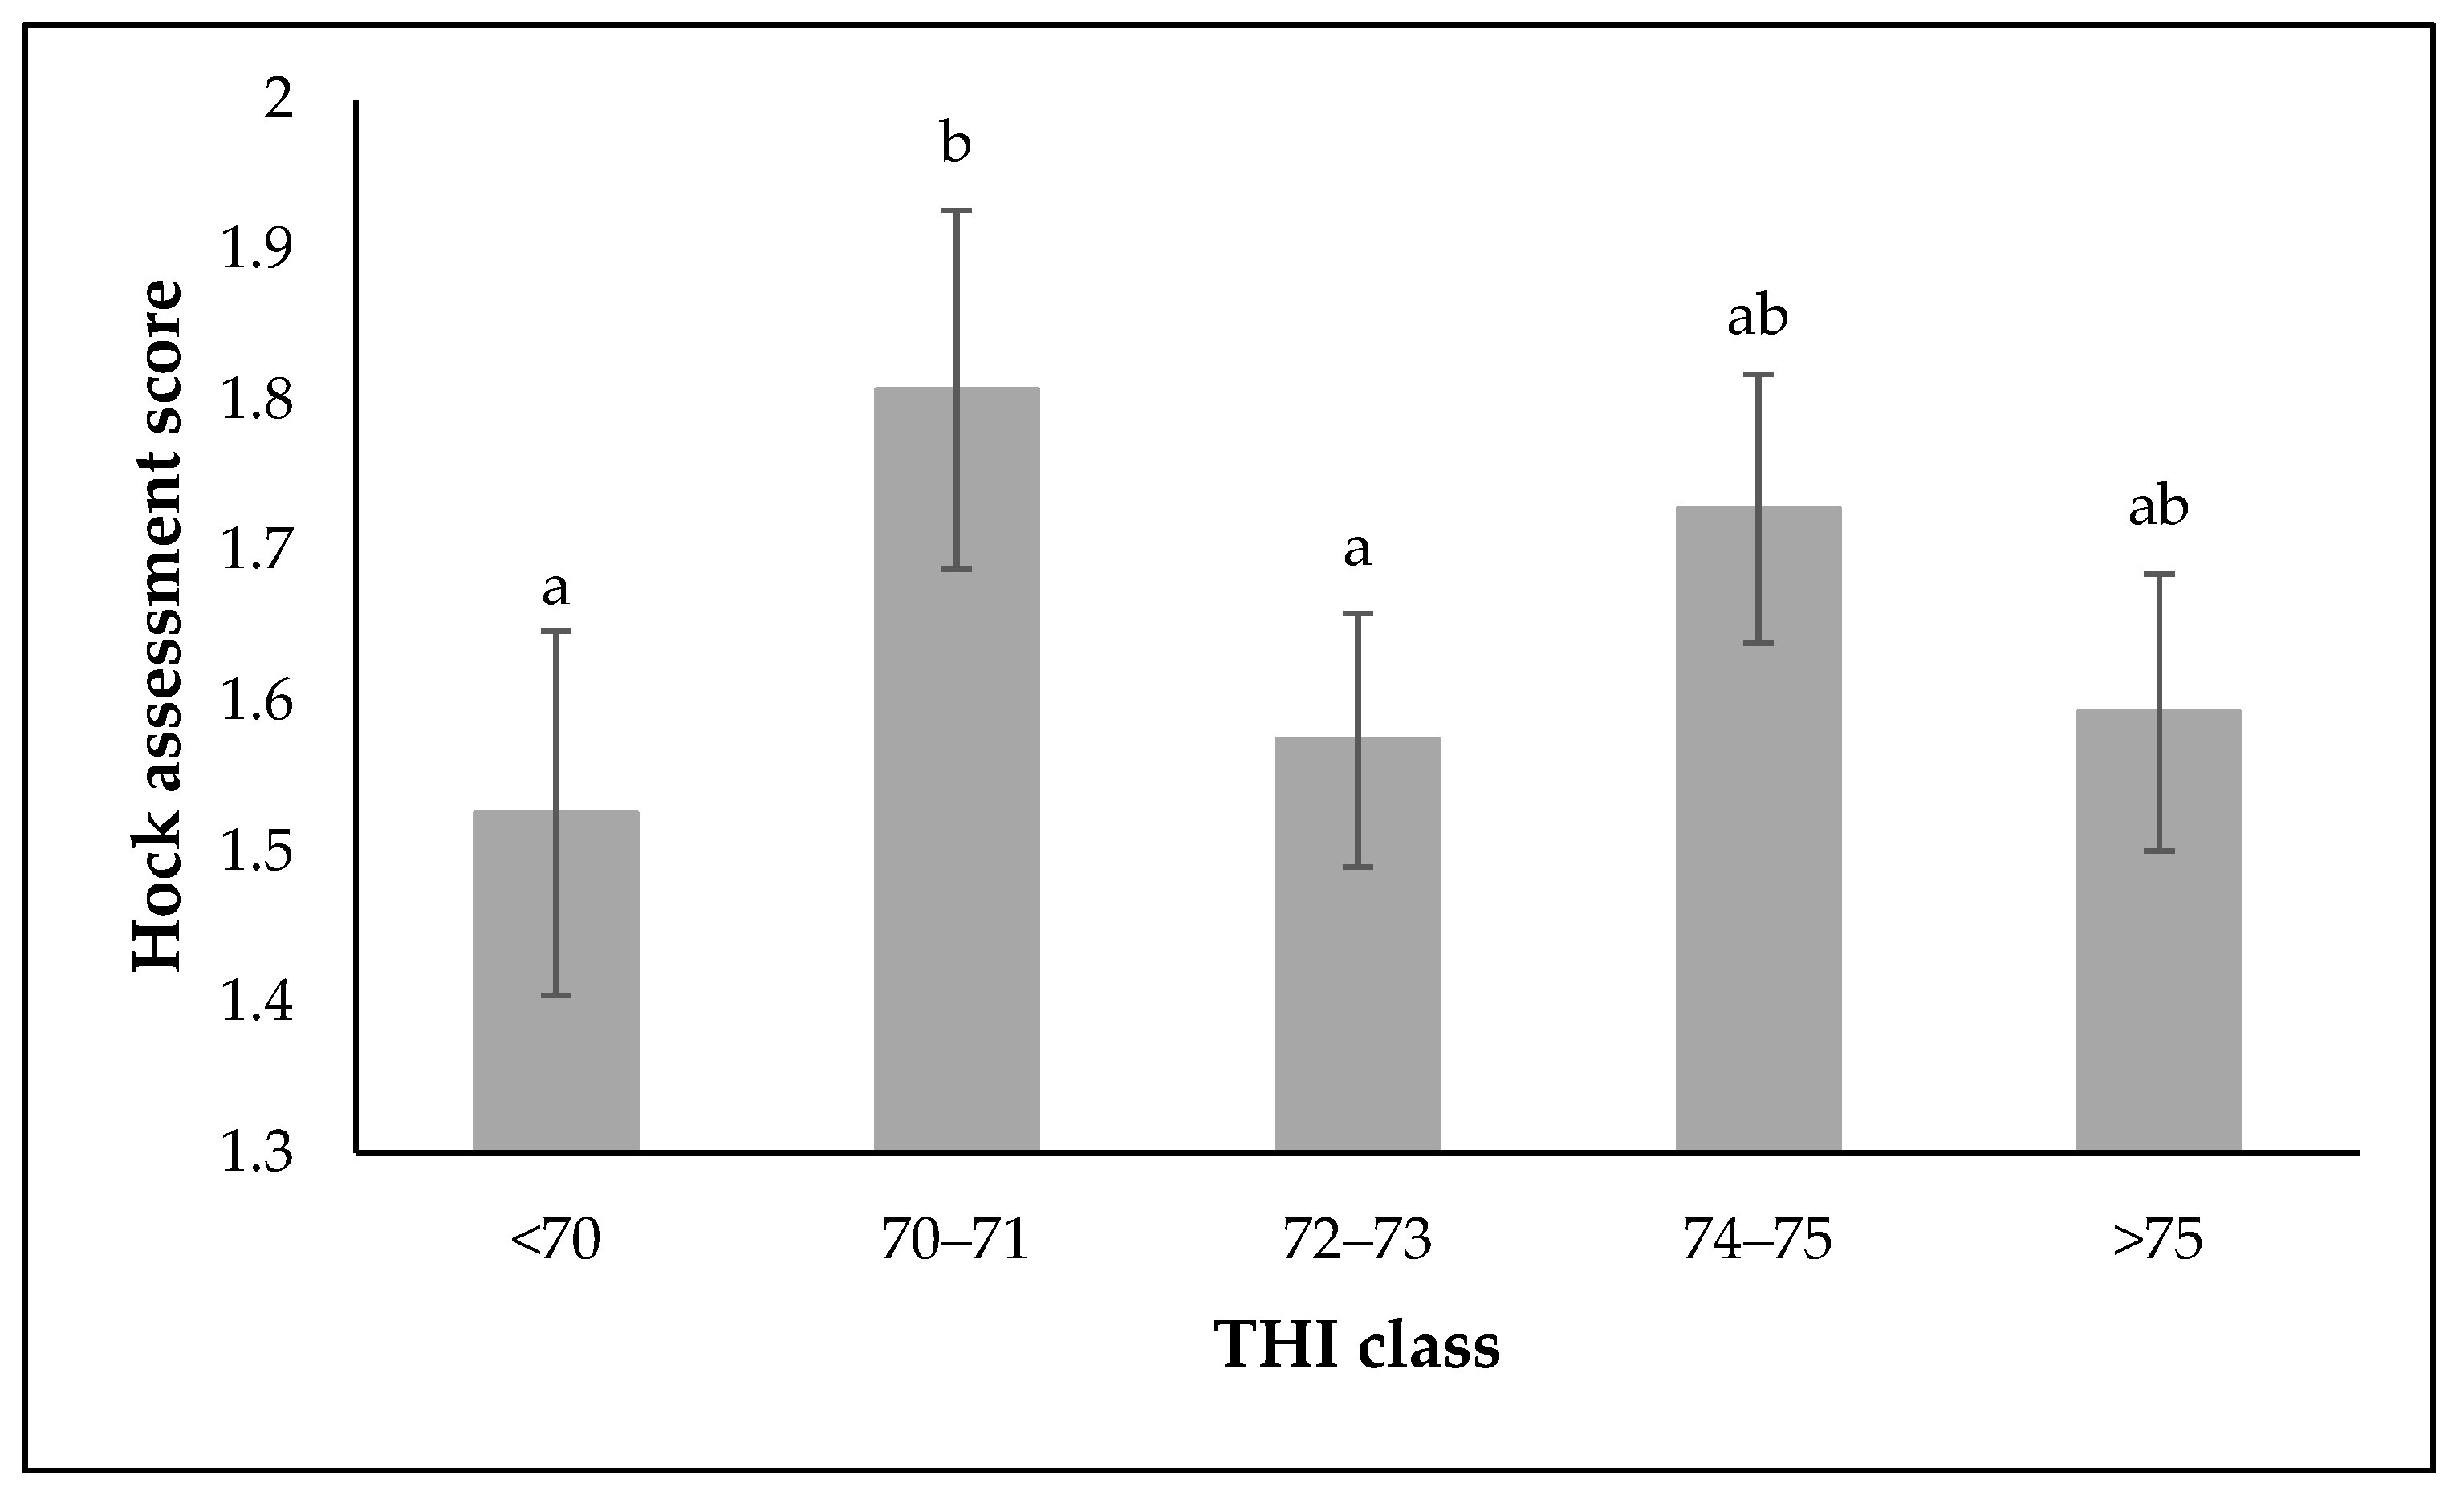
3.4. Effect of Season, SSI, and THI on HAS in Exotic and Crossbred Dairy Cattle

The breed-by-season effect on HAS was not significant (p > 0.05). Least square means for HAS across seasons in exotic and crossbred dairy cows are shown in Table A1. In addition, the SSI was not significant for HAS (Table A2), while the THI effect on HAS was significant (p < 0.05). Least square means for HAS across THI classes are shown in Figure 10. The HAS recorded at THI class 2 (HAS: 1.81 ± 0.12; THI = 70–71) was significantly different from THI classes 1 (HAS: 1.53 ± 0.12; THI < 70) and 3 (HAS: 1.57 ± 0.08; THI = 72–73), while the remaining THI class differences were not statistically significant. HAS in dependency of THI followed an M-shaped pattern (Figure 10), as already observed for milk yield.

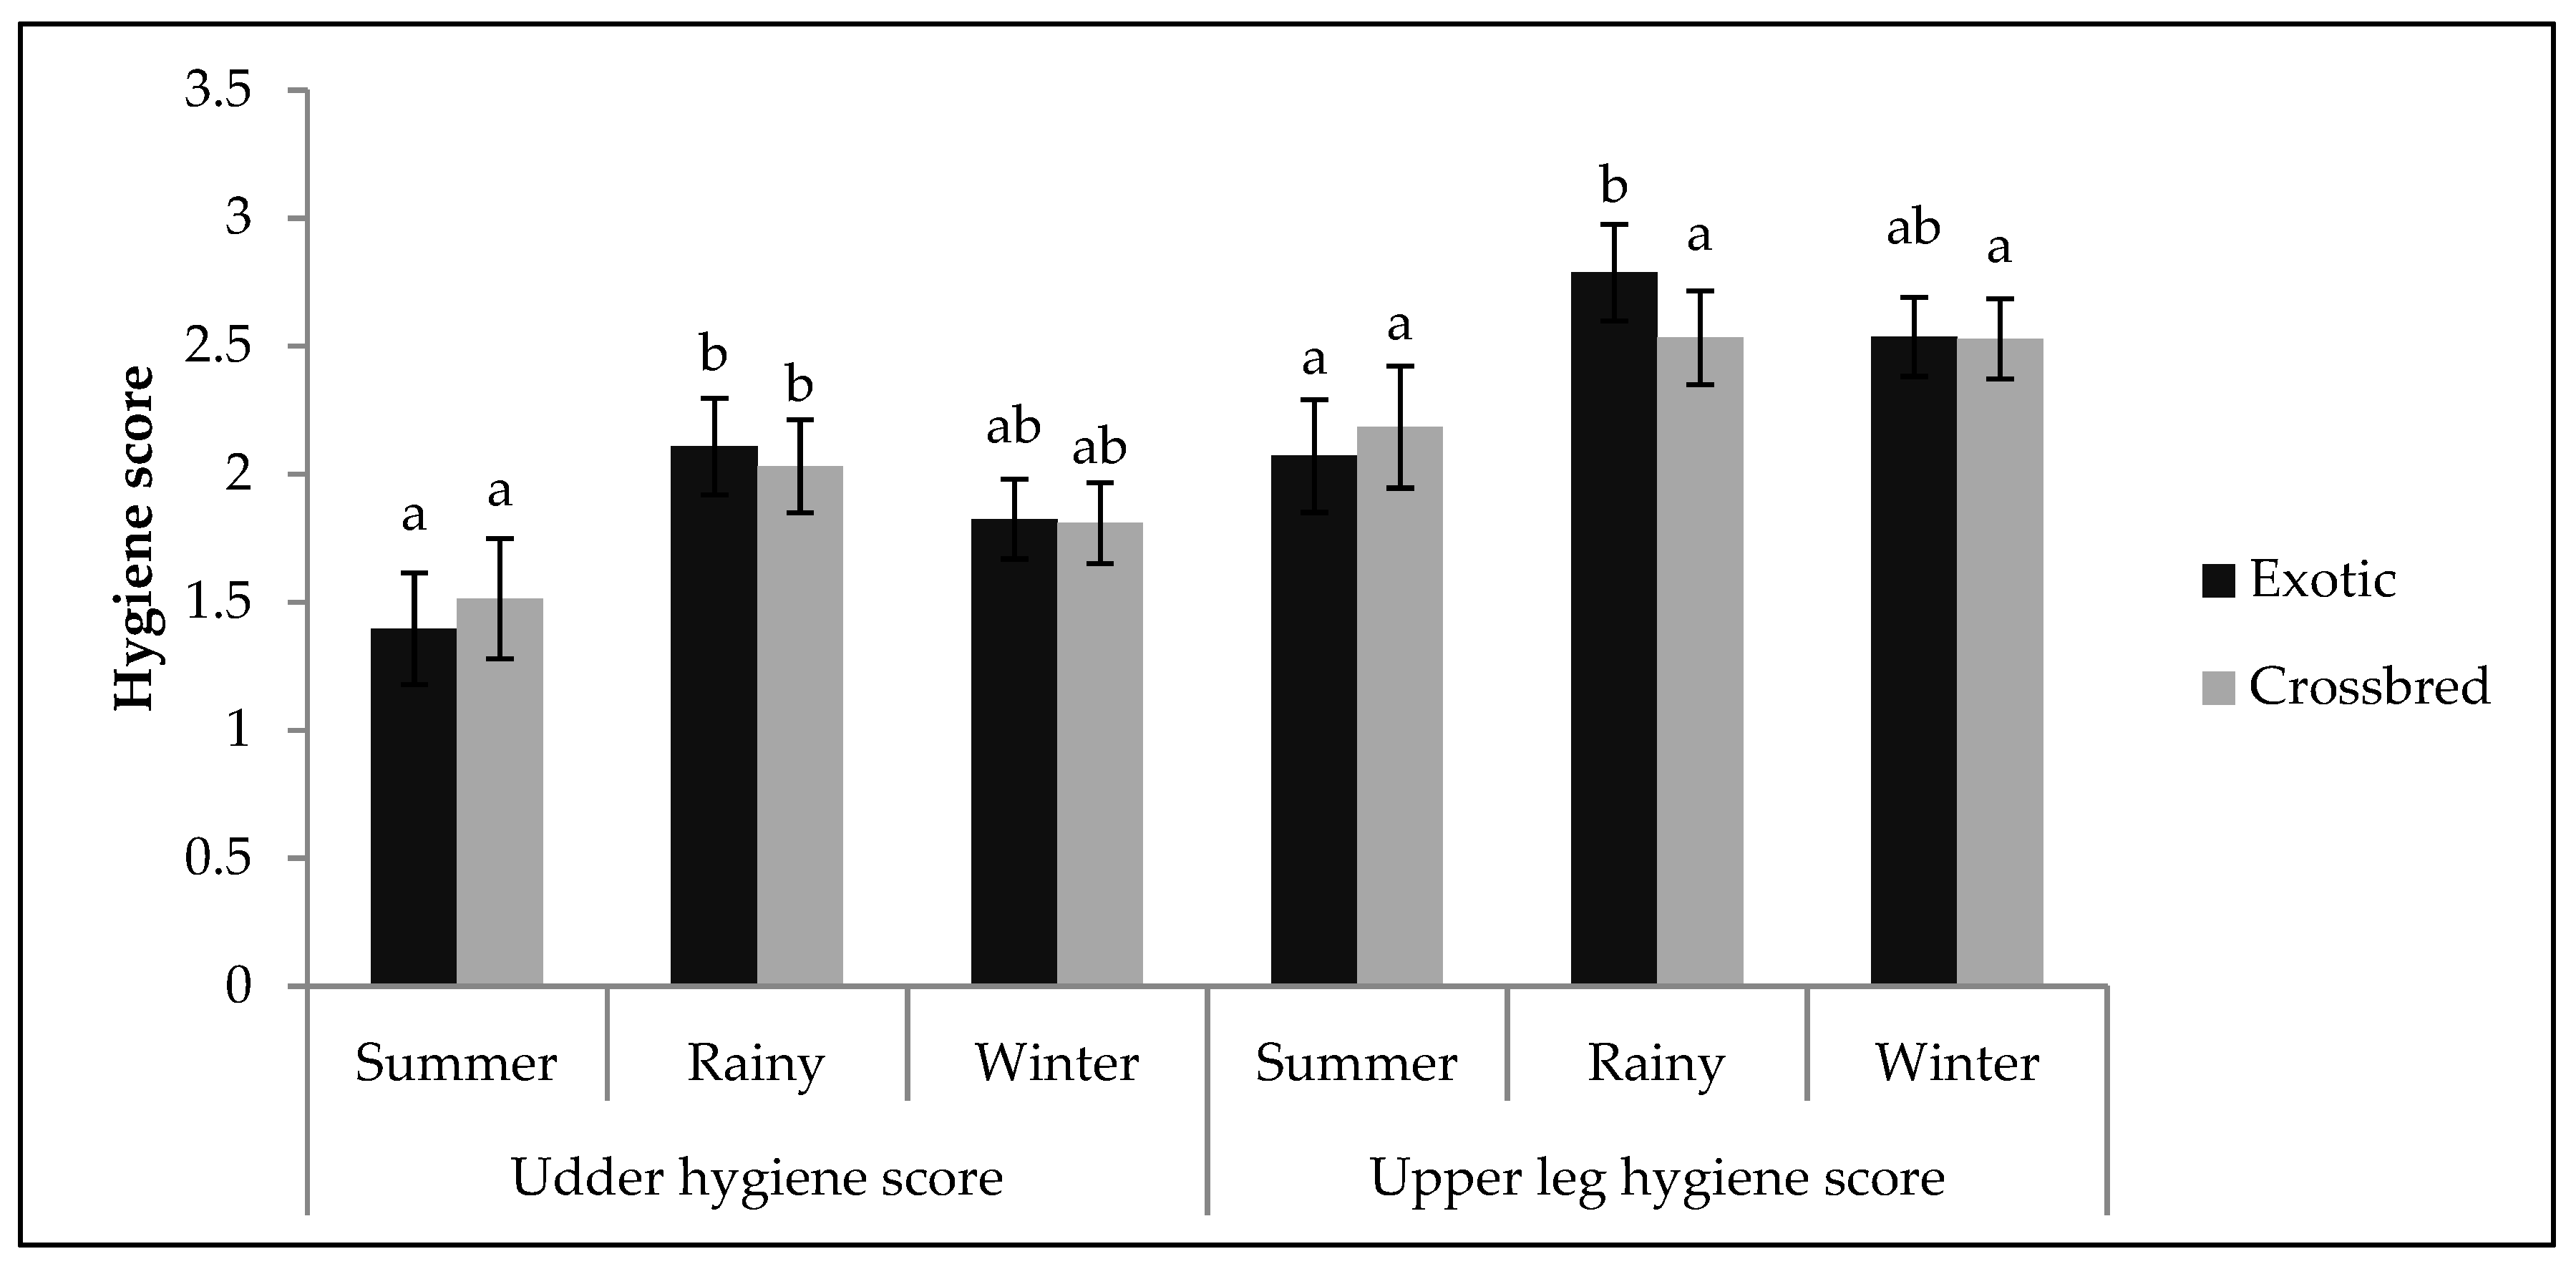
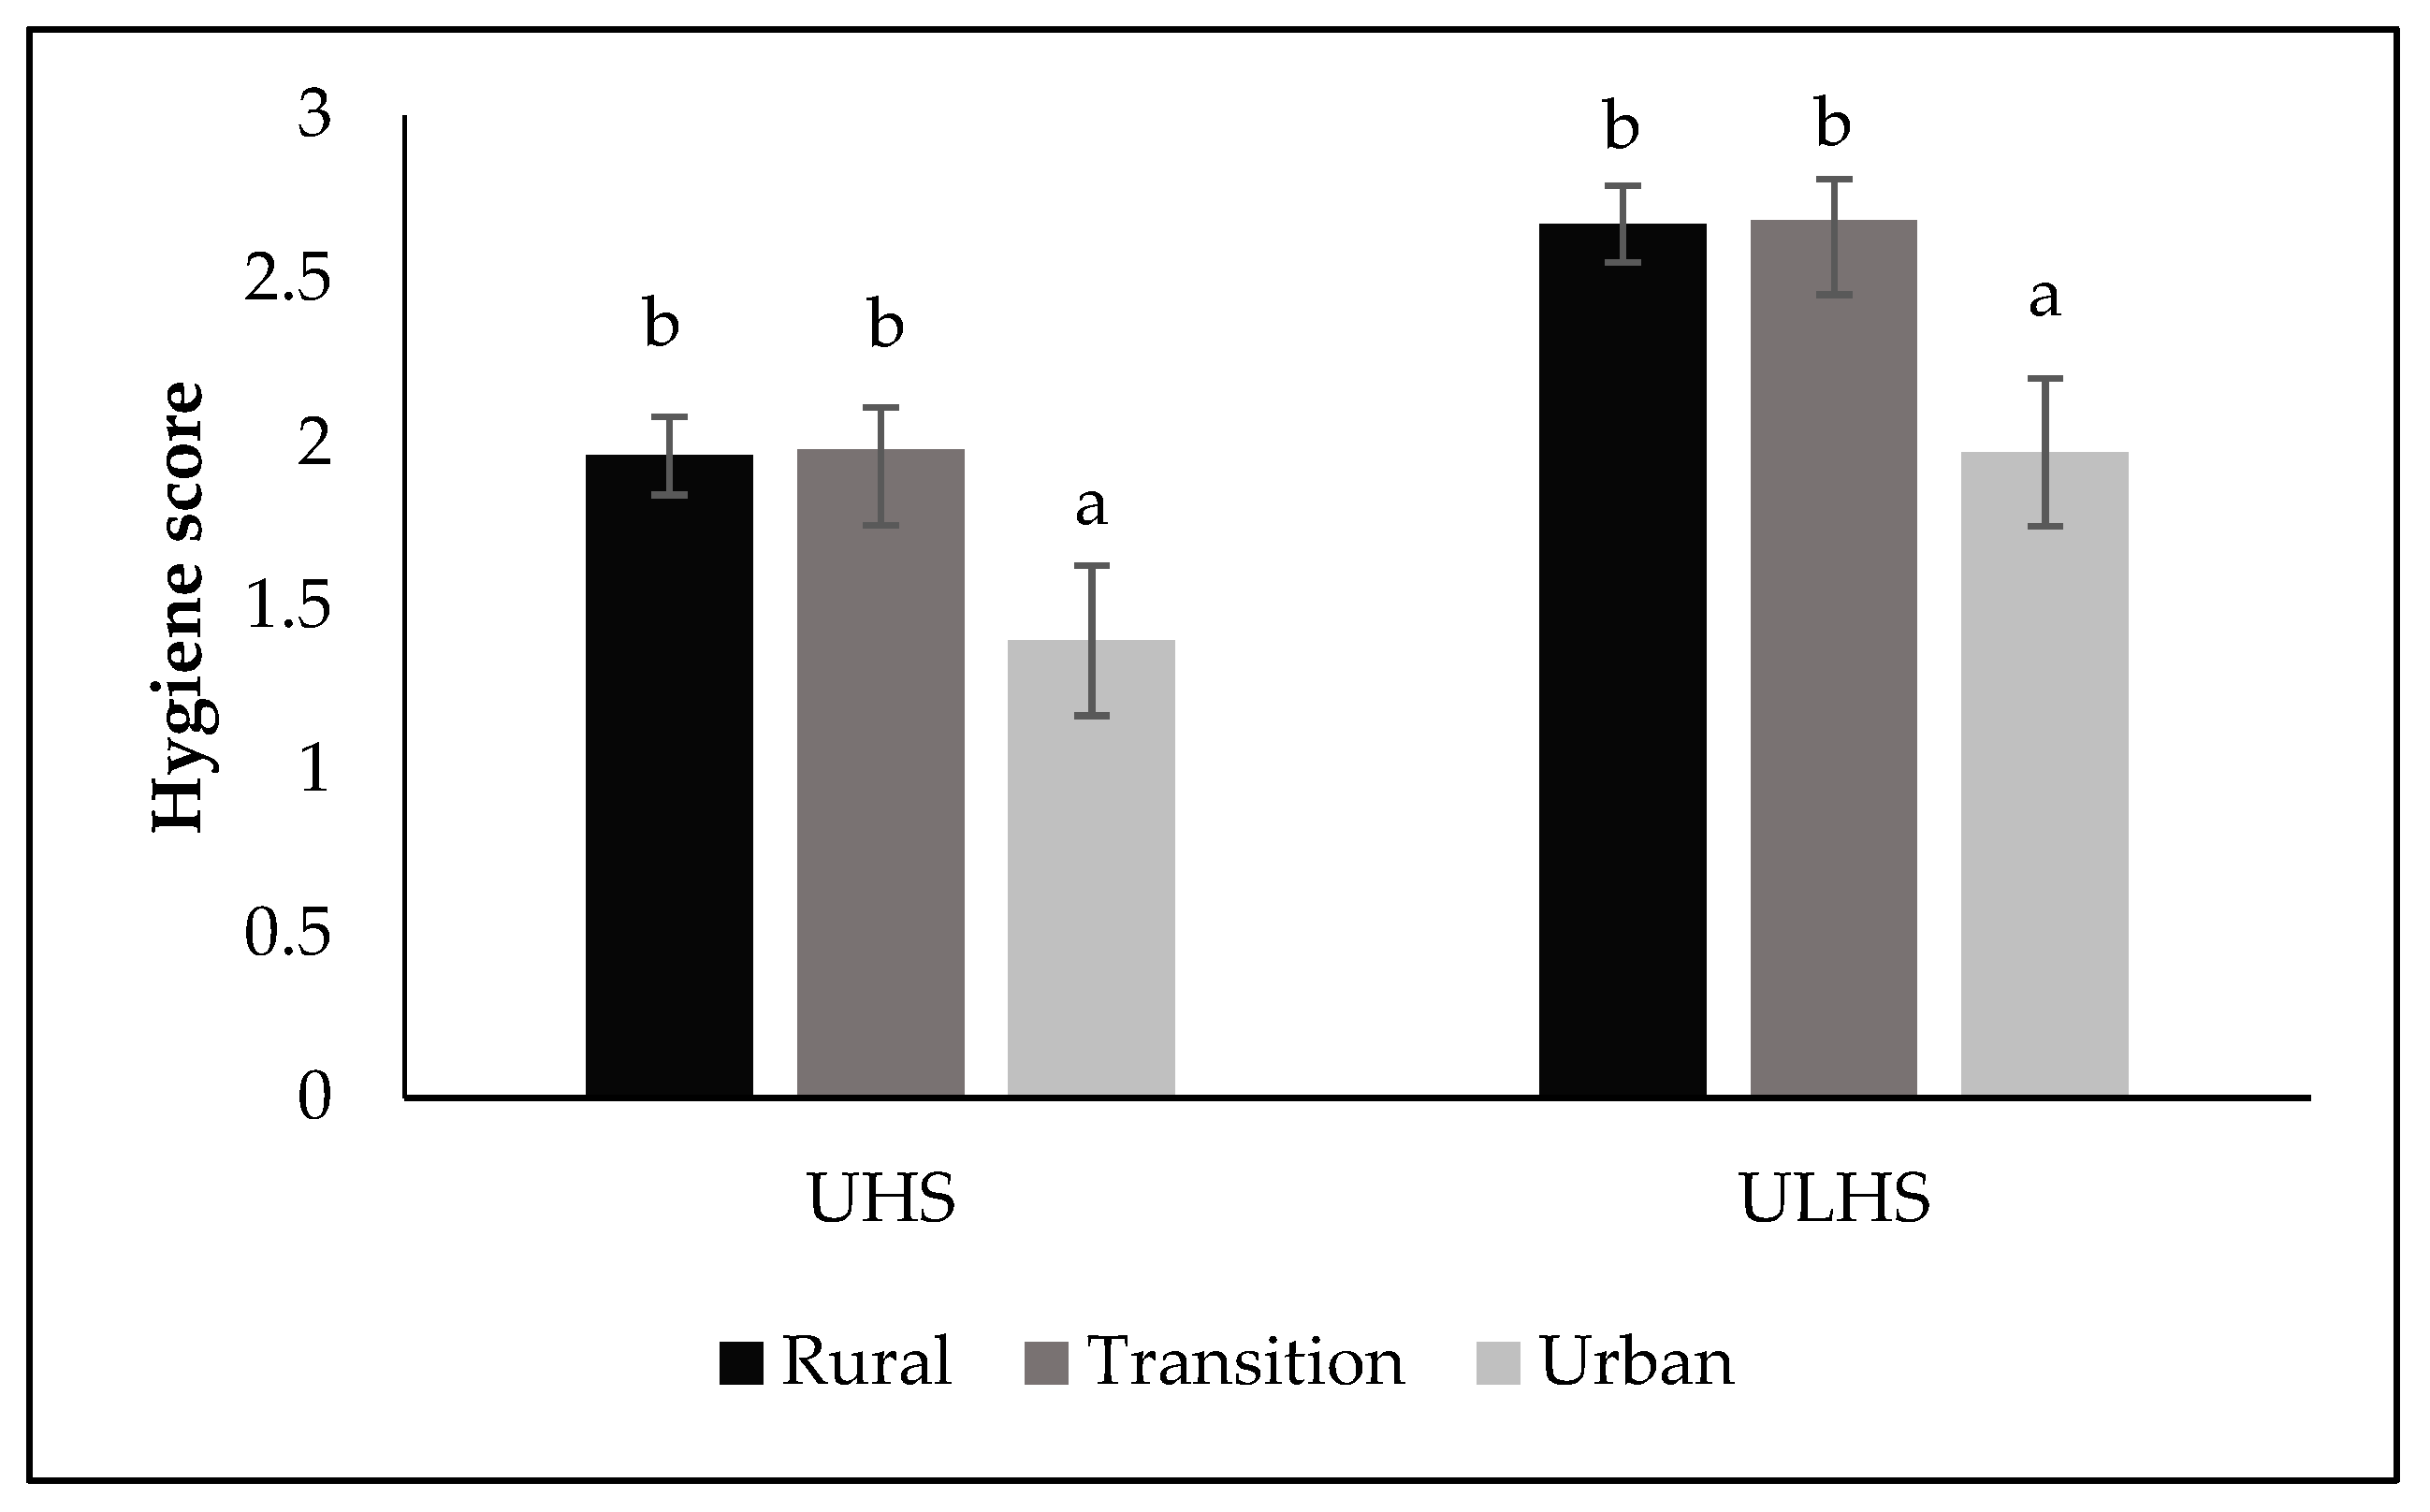
3.5. Effect of Season, SSI, and THI on UHS and ULHS in Exotic and Crossbred Dairy Cattle

Least square means for seasonal effects on test day UHS and ULHS in exotic and crossbred cows are shown in Figure 11. The UHS for exotic cattle significantly (p < 0.01) differed only between the summer (1.40 ± 0.22) and rainy season (2.11 ± 0.19). Similarly, crossbred cattle had a significantly better UHS during the summer season (1.51 ± 0.23) when compared to the rainy season (2.03 ± 0.18). Differences in least square means for UHS between the two breeds were not significant within any season (p > 0.05).
The ULHS in exotic cattle significantly differed (p < 0.05) across seasons. Exotic cattle had a significantly better upper leg hygiene score during summer (2.07 ± 0.22) when compared to the rainy (2.79 ± 0.19) and winter (2.54 ± 0.15) seasons. In crossbred cattle, the seasonal effect on ULHS was not significant (p > 0.05). Additionally, differences in least square means for ULHS between the two breeds within season were not significant (p > 0.05).
Least square means for UHS and ULHS across the rural–urban interface are shown in Figure 12. Cattle housed in the urban area had significantly (p < 0.05) better hygiene scores of 1.40 ± 0.23 (UHS) and 1.97 ± 0.23 (ULHS) when compared to cows from the rural (1.96 ± 0.12 (UHS) and 2.67 ± 0.12 (ULHS)) and transition (1.98 ± 0.13 (UHS) and 2.68 ± 0.13 (ULHS)) areas. The differences of least squares means for UHS and ULHS across THI classes were not significant (p > 0.05).

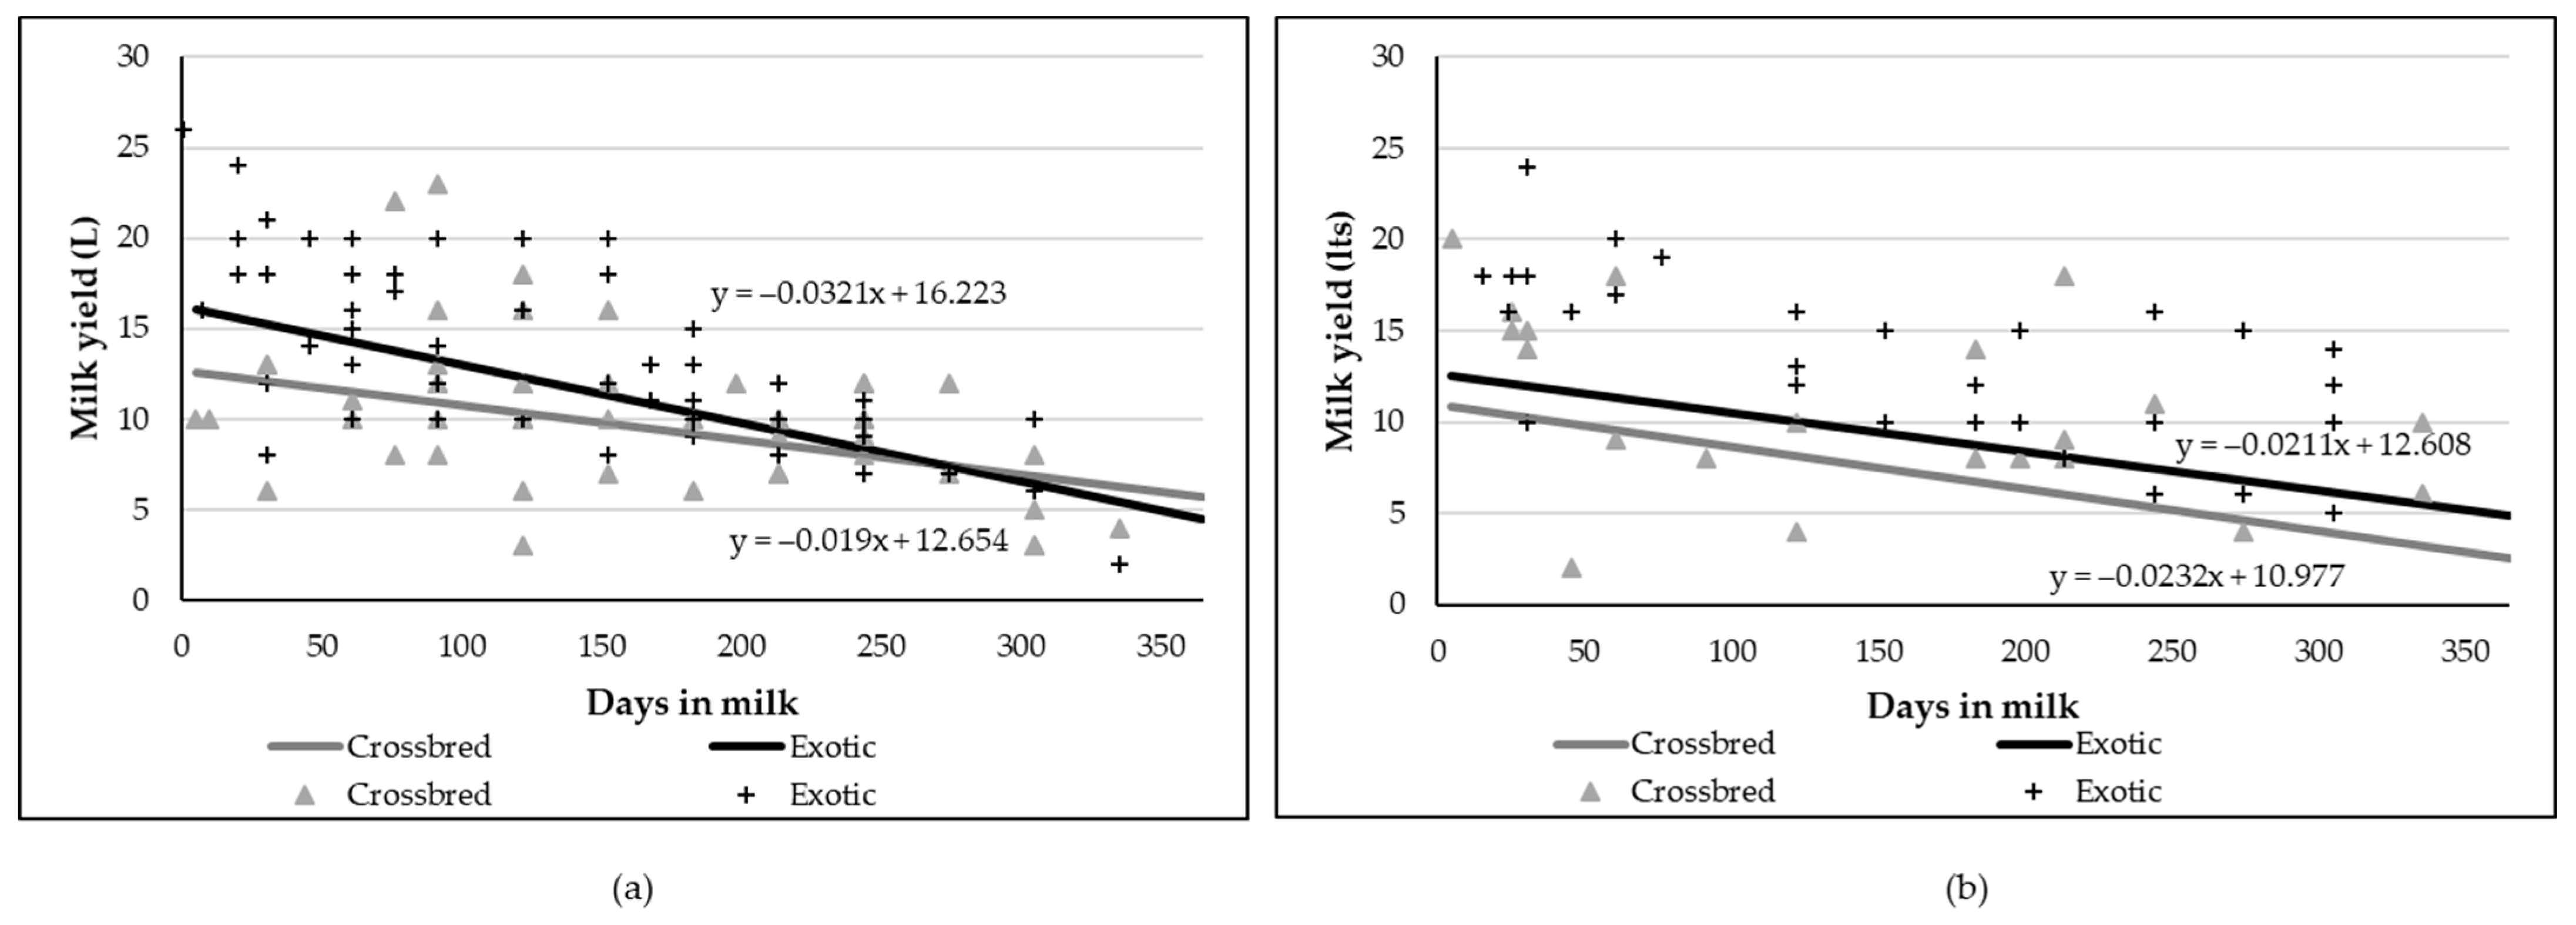
3.6. Regressions of MY and BCS on Days in Milk in THI Subgroups

The detailed regression analysis using the PROC RSREG procedure revealed thresholds of THI = 75 for exotic and THI = 74 for crossbred cattle for MY (THI_0). The thresholds for BCS (THI_1-7) were THI = 75 (exotic) and THI = 76 (crossbred). Therefore, THI = 75 was set for portioning the dataset into these two groups: “THI ≤ 75” and “THI > 75”. The results from the regression analysis for MY of cows using model 3 are shown in Figure 13. The effect of DIM nested within breed was highly significant for MY (Table A3). The regression curves for both datasets THI ≤ 75 and THI > 75 display a very similar pattern, i.e., a progressive decline in MY with increasing DIM. In both climate datasets for almost all DIM, the least square means for MY of exotic cows were higher than for crossbred cows. However, in the dataset “THI ≤ 75”, the decline in MY in the course of lactation was stronger for exotic than for crossbred cows (a regression coefficient of −0.032 L vs. −0.019 L, respectively). The moderate decline observed in crossbred cows indicates improved lactation persistency.
The results of the regression analysis for the BCS of cows allocated to either THI ≤ 75 or THI > 75 (using model 3) are shown in Figure 14. The effect of DIM nested within breed was significant (p < 0.05; Table A3) for cows under heat stress (THI > 75). Interestingly, in comparison to the almost constant regression lines for the dataset “THI ≤ 75”, the two breeds exhibited contrasting trends of BCS with increasing DIM under heat stress (THI > 75). The BCS of exotic cattle increased with progressing DIM, while it declined for crossbred cows.

4. Discussion

This study focused on a novel approach to infer the effects of season, urbanization, and THI on primary and functional traits in two dairy cattle breeds reared in the rising megacity of Bengaluru in Southern India. Results obtained from this study contribute to a deeper understanding of climate and climate-related effects as well as of urbanization and their interactions on primary and functional trait responses. The comparison of exotic and crossbred cattle in this regard provides deeper insights into genotype-by-location and genotype-by-climate interactions, respectively.
Several of the tested effects significantly affected responses of dairy cow productivity traits. In contrast, only limited environmental impact was identified for hygiene traits that reflect cow wellbeing. Regarding breed effects, MY did not differ significantly between the exotic and crossbred cows within seasons. The significant difference in MY between the rainy and winter season was very similar in both exotic and crossbred cattle. Several researchers have reported significant seasonal effects on MY for dairy cattle kept in tropical environments [24,25,26]. Nateghi et al. [27] identified seasonal variation in MY and milk composition, predominantly due to feeding differences. They observed that the nutritional value of milk as well as the total solids and microbial quality were higher in summer compared to winter. This was attributed to the quality of green forage fed to the cattle. A study by Singh et al. [28] revealed a significant seasonal influence of climate and feed quality on milk production in indigenous and crossbred cattle located in India. These authors favored crossbreeding for milk production under Indian environmental conditions, confirming the results of the present study, where the performance of crossbred cattle is competitive with the performance of exotic cattle. Thus, selection and breeding strategies are important tools with regard to sustainable productivity improvements under the challenging production conditions of India.
Dairy cattle breeding programs in India are primarily focused on increasing milk production. In this regard, the National Action Plan has formulated a key goal of increasing national milk production from 163.7 million metric tons (MMT) in 2016–2017 to 254.55 MMT in 2021–2022 [29]. In this context, official breeding policies in India define the optimum level of exotic genes in crossbred cattle in a range from 50% to 75% [30]. However, such crossbreeding approaches to enhance milk yield are associated with risk of energy deficiency, especially during the early lactation period [31]. BCS and BW are phenotypically and genetically correlated [32], implying that cows which are genetically superior for milk production tend to have lower BCS and BW. In the present study, BCS varied significantly across seasons only in exotic, not in crossbred cows. Such a result underlines the genetic potential of crossbred animals to cope with heterogeneous environmental impacts while maintaining their body reserves [33]. Likewise, the influence of season on BW was not significant in crossbred cattle, while it differed significantly in exotic cows. These breed-specific differences with regard to BCS and BW indicate increased mobilization of body fat reserves in exotic cattle to maintain milk production. Mao et al. [34] reported such breed-specific associations between variations in BCS and body fat mobilization whereby the utilization of body reserves is an adaptive mechanism to cope with energy deficiency during early lactation.
In addition, cow welfare as indicated by hygiene scores plays a crucial role with regard to overall productivity. Vice versa, hygiene scores reflect the herd management level [6,35]. Both the UHS and ULHS hygiene scores displayed lower values (i.e., improved hygiene) during the summer season. There were no significant differences between breeds for hygiene scores within seasons, indicating the importance of non-genetic effects. The dry farm environment might explain the lower scores for UHS and ULHS in summer. In Italy, Zucali et al. [36] reported similar seasonal effects on UHS and ULHS. Dirtier cows were observed during the cold and wet seasons than in the dry season, when it was difficult to keep the barn floor clean and dry [36].
The farm location, as depicted by SSI, had a significant effect on all traits except for HAS. For the production trait, MY, the energy efficiency indicators BCS and BW, and the hygiene traits UHS and ULHS, more favorable values were identified for cattle housed in urban areas. Similar results with regard to production traits, energy efficiency, and health indicator traits were reported by Pinto et al. [37], who focused on alternative modeling strategies without considering THI effects. These authors [37] identified the literacy of farmers and the intensity of cattle rearing as crucial factors influencing productivity and hygiene scores across the SSI. In a study by Khadayata and Aggarwal [38] evaluating milk producers in the peri-urban area of Vadodara, Gujarat, India, it was observed that higher socioeconomic status of farmers combined with higher education levels positively contributed to improved hygiene practices in dairy farming. Thus, in analogy with the results from the present study, urbanization, along with improvements in associated social-ecological factors (commercial orientation, efficiency, education, etc. [37]) is proposed to improve productivity and welfare traits, as indicated by hygiene scores in the present study.
The temperature humidity index has been used worldwide, especially in North America and in Europe, to assess the impact of heat stress on trait responses in livestock species. In this regard, several THI equations based on data from public weather stations have been developed. In the current study, the THI was calculated using the equation proposed by the NRC [23]. Trait responses in dependency of THI were used to demarcate different “zones” indicating comfort, mild stress, or alarming heat stress for the animal [39,40]. In the current study, the test day THI_0 as well as the average weekly THI_1-7 (measured throughout seven days prior to the test day) significantly affected MY, BCS, and HAS. In the present study, a THI of 75 was detected as an obvious heat stress threshold for MY and BCS, which can be used in ongoing genetic or genomic evaluations for heat tolerance in such regions and climates.
The M-shaped MY pattern in response to THI_0 is a unique finding in the current study. From smallholder dairy farms in Tanzania, Ekine-Dzivenu et al. [41] reported a W-shaped MY pattern across the THI scale. Nevertheless, in their study they identified THI close to 76 as the heat stress threshold. Likewise, in another study conducted in Holstein cows kept across three European regions MY exhibited an inverted U-shaped response pattern to THI with a pronounced identified heat stress threshold at THI 73 [42]. Such patterns of MY response on THI reflect the impact of heat stress on milk production as well as the mechanisms of adaptation to environmental stressors. Ekine-Dzivenu et al. [41] observed a plateauing of milk yield depression beyond THI 76, which was explained by possible acclimatization of animals to the prevailing heat stress situation. The M-shaped MY pattern observed in the current study reflects the dynamics of cow responses to dynamic climatic alteration prevalent in the harsh and challenging environment of the Bengaluru region. The THI range from 72–75 was detected as most favorable for cows kept in this tropical region because of the maximum MY. The regression curves obtained from model 2 support the results from the THI class modeling approach, i.e., a similar decline in milk yield for both exotic and crossbred cows beyond a THI of 75. These results stimulated the study of lactation persistency for both genotypes below and above the heat stress threshold of THI 75.
Additionally, the BCS energy efficiency indicator is a very valuable trait for assessing the effects of heat stress in dairy cows. By analogy to MY, BCS significantly declined beyond a THI of 75. In this context, the obvious differences between exotic and crossbred cattle in the response of MY and BCS to THI alterations were very interesting. In particular, lactation persistency was better in crossbred than in exotic cows, and regression curve patterns for BCS at THI ≤ 75 were more favorable in the crossbred cow group.
The increased variability, especially in BCS, among the breeds when subjected to environmental stressors beyond their comfort zone might be due to genetic effects and production level differences. Mbuthia et al. [43] reported pronounced differences in lactation curve patterns between crossbreeds and exotic breeds. Nevertheless, in their study genetic effects were confounded with production system characteristics. With regard to genotype-by-environment interactions, high-yielding exotic cows may fail to express their full genetic potential when kept under heat stress conditions [42]. It is well known that cattle alter their energy metabolism in challenging environments in order to maintain homeostasis. However, changes in physiology and metabolism imply effects on performance traits such as daily milk production [43]. Such physiological causalities explain the breed-specific BCS responses on THI alterations. However, the opposite trends in BCS responses in exotic and crossbred cattle might reflect particular management, feeding, or housing conditions confounded with genetics. For example, Loker et al. [44] reported a specific feeding impact during lactation depending on the animals’ genetic background. General factors for impaired lactation persistency of exotic cows in tropical countries are related to housing and feeding deficiencies [45], hampering the full expression of their genetic potential. Quite stable milk yield during lactation was observed in Ankole x Friesian crossbred cows when diets were supplemented with improved feed components [45]. In summary, heat waves and thermal management are major challenges across all farm animal species, and improvements in thermotolerance should focus on nutritional management and vitagene regulation, as indicated for the poultry industry [46].

5. Conclusions

Dairy farming in India faces many challenges, one of them being heat stress effects and another the rapid urbanization of city neighborhoods. The present study demonstrated seasonal effects on primary and functional traits of exotic and crossbred dairy cattle in Bengaluru across areas with different levels of urbanization. The study identified a THI value of 75 to be the heat stress threshold for both milk yield and BCS. When exposed to heat stress, milk yield persistency was better in crossbred than in exotic cows. In exotic cattle, an increasing BCS ensured a milk yield persistency similar to that of crossbred cows, which might be associated with high feed energy intake. Most of the traits examined exhibited stronger seasonal alteration in exotic as compared to crossbreed cows. The quite stable trait responses indicate better potential of crossbred cows to cope with the heterogeneous and challenging environmental conditions in Bengaluru, which should be considered when advising farmers on improvement strategies.

Author Contributions

Conceptualization and methodology, S.K.; data collection, A.P. and M.R.; data curation and investigation, S.M.V.; software, K.B. and S.M.V.; validation, S.K., K.B. and T.Y.; writing—original draft preparation, S.M.V.; writing—review and editing, S.K., K.B., A.P., T.Y., M.R., V.S., R.B. and E.S. All authors have read and agreed to the published version of the manuscript.

Funding

This research was funded by the German Research Foundation (DFG) through grant numbers KO 3520/5-1 and SCHL 587/6-1 as part of the DFG Research Unit FOR2432/1 “Social-Ecological Systems in the Indian Rural-Urban Interface: Functions, Scales, and Dynamics of Transition”.

Institutional Review Board Statement

As this study completely relied on non-invasive assessments of animal traits, and all direct handling of the animals (milking, tape-measurements of heart girth) were routinely carried out by the farmers, the study was considered as including no critical issues by the ICAR National Institute of Animal Nutrition and Physiology in Bengaluru, which is collaborating closely with local farmers through research and extensions services.

Informed Consent Statement

Informed oral consent to take non-invasive measurements on their animals was obtained from all farmers involved in the study.

Data Availability Statement

The anonymized data set that forms the basis of this article is available through the institutional repository at the University of Göttingen. For scientific purposes, access will be provided upon written request to the corresponding author.

Acknowledgments

The authors sincerely acknowledge the patience and cooperation of the dairy farmers involved in the fieldwork. We thank the Indian partners at the ICAR-National Institute of Animal Nutrition and Physiology (ICAR-NIANP) for providing logistical and scientific support. We thank the German Research Foundation (DFG), and the Indian Department of Biotechnology (DBT) for their financial support to this Indo-German research collaboration.

Conflicts of Interest

The authors declare no conflict of interest. The funders had no role in the design of the study; in the collection, analyses, or interpretation of data; in the writing of the manuscript, or in the decision to publish the results.

Appendix A

Table A1. Test of significance (global F-Test) with p-values for the respective effects and coefficients for R2 and RSME from the quadratic regression analysis of test day milk yield (MY) by THI (model 2).
Parameter or EffectCoefficient/p-Value
R20.88
RSME2.42
Lactation stage0.00
Lactation number0.01
Milking frequency0.00
Farm (SSI)0.00
SSI0.58
THI(breed)0.12
THI2(breed)0.12
Season0.02
Table A2. Least square means with standard errors for SSI and breed–season effect for hock assessment score (HAS).
FactorSSIBreed-Season
RuralTransitionUrbanCB x SummerCB x RainyCB x WinterE x SummerE x RainyE x Winter
Mean1.62 a1.52 a1.79 a1.74 a1.81 a1.75 a1.53 a1.58 a1.48 a
SE0.080.090.160.130.110.100.120.110.10
Means with same superscript within a factor are similar and do not differ significantly (p > 0.05). SSI: Survey Stratification Index; CB: Crossbred cows; E: Exotic cows.
Table A3. Test of significance (global F-Test) with p-values for the respective effects and coefficients for R2 and RSME from the linear regression analyses of milk yield and body condition score by portioning the dataset in two parts, “THI ≤ 75” and “THI > 75” (model 3).
EffectMilk YieldBody Condition Score
THI ≤ 75THI > 75THI ≤ 75THI > 75
R20.810.890.650.74
RSME2.592.370.230.22
Lactation number0.090.340.050.02
Milking frequency0.060.01--
SSI0.490.640.480.76
Season0.120.010.870.73
DIM (breed)0.000.000.540.06
Breed0.010.370.380.44

References

  1. Herrero, M.; Grace, D.; Njuki, J.; Johnson, N.; Enahoro, D.; Silvestri, S.; Rufino, M.C. The roles of livestock in developing countries. Animal 2013, 7, 3–18. [Google Scholar] [CrossRef] [Green Version]
  2. Thornton, P.K. Livestock production: Recent trends, future prospects. Philos. Trans. R. Soc. B Biol. Sci. 2010, 365, 2853–2867. [Google Scholar] [CrossRef] [Green Version]
  3. Faye, B.; Konuspayeva, G. The sustainability challenge to the dairy sector—The growing importance of non-cattle milk production worldwide. Int. Dairy J. 2012, 24, 50–56. [Google Scholar] [CrossRef]
  4. Kolver, E.S.; Roche, J.R.; de Veth, M.J.; Thorne, P.L.; Napper, A.R. Total mixed rations versus pasture diets: Evidence for a genotype x diet on the concentration of amino acid- derived volatiles in milk. Proc. N. Z. Soc. Anim. Prod. 2002, 62, 246–251. [Google Scholar]
  5. König, S.; Dietl, G.; Raeder, I.; Swalve, H.H. Genetic relationships for dairy performance between large-scale and small-scale farm conditions. J. Dairy Sci. 2005, 88, 4087–4096. [Google Scholar] [CrossRef]
  6. Sejian, V.; Bhatta, R.; Gaughan, J.B.; Dunshea, F.R.; Lacetera, N. Adaptation of animals to heat stress. Animals 2018, 12, s431–s444. [Google Scholar] [CrossRef] [Green Version]
  7. St-Pierre, N.R.; Cobanov, B.; Schnitkey, G. Economic losses from heat stress by US livestock industries. J. Dairy Sci. 2003, 86, E52–E77. [Google Scholar] [CrossRef] [Green Version]
  8. Upadhyay, R.C.; Mohini, M.; Kansal, V.K.; Singh, S.V.; Ashutosh, A.; Sirohi, S.K.; Kumar, S. Final Report of the Network Project on Climate Change; National Dairy Research Institute: Karnal, India, 2007. [Google Scholar]
  9. Lallo, C.H.; Cohen, J.; Rankine, D.; Taylor, M.; Cambell, J.; Stephenson, T. Characterizing heat stress on livestock using the temperature humidity index (THI)—Prospects for a warmer Caribbean. Reg. Environ. Chang. 2018, 18, 2329–2340. [Google Scholar] [CrossRef] [Green Version]
  10. Bohmanova, J.; Misztal, I.; Cole, J.B. Temperature-humidity indices as indicators of milk production losses due to heat stress. J. Dairy Sci. 2007, 90, 1947–1956. [Google Scholar] [CrossRef]
  11. Gantner, V.; Bobic, T.; Gregic, M.; Gantner, R.; Kuterovac, K.; Potocnik, K. The differences in heat stress resistance due to dairy cattle breed. Mljekarstvo 2017, 67, 112–122. [Google Scholar] [CrossRef] [Green Version]
  12. Gantner, V.; Bobic, T.; Gantner, R.; Gregic, M.; Kuterovac, K.; Novakovic, J.; Potocnik, K. Differences in response to heat stress due to production level and breed of dairy cows. Int. J. Biometeorol. 2017, 61, 1675–1685. [Google Scholar] [CrossRef]
  13. Nanas, I.; Chouzouris, T.M.; Dovolou, E.; Dadouli, K.; Stamperna, K.; Kateri, I.; Barbagianni, M.; Amiridis, G.S. Early embryo losses, progesterone and pregnancy associated glycoproteins levels during summer heat stress in dairy cows. J. Therm. Biol. 2021, 98, 102951. [Google Scholar] [CrossRef]
  14. Bertocchi, L.; Vitali, A.; Lacetera, N.; Nardone, A.; Varisco, G.; Bernabucci, U. Seasonal variations in the composition of Holstein cow’s milk and temperature-humidity index relationship. Animals 2014, 8, 667. [Google Scholar] [CrossRef] [Green Version]
  15. Kishore, A.; Birthal, P.S.; Joshi, P.K.; Shah, T.; Saini, A. Patterns and drivers of dairy development in India: Insights from analysis of household and district-level data. Agric. Econ. Res. Rev. 2016, 29, 1–14. [Google Scholar] [CrossRef] [Green Version]
  16. Sreelakshmi, A. Management Practices among Dairy Farmers: An Economic Study Along Rural-Urban Interface of Bengaluru North. Ph.D. Thesis, University of Agricultural Sciences GKVK, Bangalore, India, 2019. [Google Scholar]
  17. Reichenbach, M.; Pinto, A.; König, S.; Bhatta, R.; Schlecht, E. Dairy production in an urbanizing environment—Typology and linkages in the megacity of Bengaluru, India. PLoS ONE 2021, 16, e0255791. [Google Scholar] [CrossRef]
  18. Hoffmann, E.M.; Jose, M.; Nölke, N.; Möckel, T. Construction and use of a simple index 430 of urbanisation in the rural–urban interface of Bangalore, India. Sustainability 2017, 9, 2146. [Google Scholar] [CrossRef] [Green Version]
  19. Ferguson, J.D.; Galligan, D.T.; Thomsen, N. Principal descriptors of body condition score in Holstein cows. J. Dairy Sci. 1994, 77, 2695–2703. [Google Scholar] [CrossRef]
  20. Grund, J.N. Biometric Characteristics of Dairy Cattle in Karnataka. Master’s Thesis, Department for Agricultural Sciences, Georg-August-Universität, Göttingen, Germany, 2018. [Google Scholar]
  21. Schreiner, D.A.; Ruegg, P.L. Effects of tail docking on milk quality and cow cleanliness. J. Dairy Sci. 2002, 85, 2503–2511. [Google Scholar] [CrossRef]
  22. Lombard, J.E.; Tucker, C.B.; von Keyserlingk, M.A.G.; Kopral, C.A.; Weary, D.M. Associations between cow hygiene, hock injuries, and free stall usage on US dairy farms. J. Dairy Sci. 2010, 93, 4668–4676. [Google Scholar] [CrossRef]
  23. National Research Council (NRC). A Guide to Environmental Research on Animals; National Academic Science: Washington, DC, USA, 1971. [Google Scholar]
  24. Utresa, A.R.; Robles, R.C.C.; Rodriguez, J.R.G.; Murillo, V.E.N.; Lagunes, J.L. Effects of breed, calving season and parity on milk yield, body weight and efficiency of dairy cows under subtropical conditions. Int. J. Anim. Vet. Adv. 2013, 5, 226–232. [Google Scholar]
  25. Wondifraw, Z.; Thombre, B.M.; Bainwad, D.V. Effect of non genetic factors on milk production of Holstein Friesian x Deoni crossbred cows. Int. J. Livest. Prod. 2013, 4, 106–112. [Google Scholar] [CrossRef]
  26. Sahu, J.; Bhonsle, D.; Mishra, S.; Khune, V.N.; Dutta, G.K.; Chaturvedani, A.K. Effect of season on milk composition traits and test day milk yield of Kosali cows. Bull. Environ. Pharmacol. Life Sci. 2018, 7, 143–145. [Google Scholar]
  27. Nateghi, L.; Yousefi, M.; Zamani, E.; Gholamian, M.; Mohammadzadeh, M. The effect of different seasons on the milk quality. Eur. J. Exp. Biol. 2014, 4, 550–552. [Google Scholar]
  28. Singh, V.P.; Dubey, M.; Chaubey, A.K. Seasonal influence on milk production performance in different breeds of dairy cows. Environ. Ecol. 2015, 33, 371–374. [Google Scholar]
  29. Ministry of Agriculture and Farmers’ Welfare. National Action Plan for Dairy Development; Vision 2020; Government of India: New Delhi, India, 2018.
  30. Sreenivas, D. Breeding policy strategies for genetic improvement of cattle and buffaloes in India. Vet. World 2013, 6, 455–460. [Google Scholar] [CrossRef]
  31. Knob, D.A.; Thaler Neto, A.; Schweizer, H.; Weigand, A.C.; Kappes, R.; Scholz, A.M. Energy balance indicators during the transition period and early lactation of purebred Holstein and Simmental cows and their crosses. Animals 2021, 11, 309. [Google Scholar] [CrossRef]
  32. Buckley, F.; O’Sullivan, K.; Mee, J.F.; Evans, R.D.; Dillon, P. Relationships among milk yield, body condition, cow weight, and reproduction in spring-calved Holstein-Friesians. J. Dairy Sci. 2003, 86, 2308–2319. [Google Scholar] [CrossRef]
  33. Madhusoodan, A.P.; Sejian, V.; Rashamol, V.P.; Savitha, S.T.; Bagath, M.; Krishnan, G.; Bhatta, R. Resilient capacity of cattle to environmental challenges—An updated review. J. Anim. Behav. Biometeorol. 2020, 7, 104–118. [Google Scholar]
  34. Mao, I.L.; Sloniewski, K.; Madsen, P.; Jensen, J. Changes in body condition score and in its genetic variation during lactation. Livest. Prod. Sci. 2004, 89, 55–65. [Google Scholar] [CrossRef]
  35. Atasever, S.; Erdem, H. Relationship between hygienic aspects and milk production characteristics of Holstein cows. J. Appl. Anim. Res. 2009, 35, 185–188. [Google Scholar] [CrossRef] [Green Version]
  36. Zucali, M.; Bava, L.; Tamburini, A.; Brasca, M.; Vanoni, L.; Sandrucci, A. Effects of season, milking routine and cow cleanliness on bacterial and somatic cell counts of bulk tank milk. J. Dairy Res. 2011, 78, 436–441. [Google Scholar] [CrossRef] [PubMed]
  37. Pinto, A.; Yin, T.; Reichenbach, M.; Bhatta, R.; Schlecht, E.; König, S. Phenotypic dairy cattle trait expressions in dependency of social-ecological characteristics along rural–urban gradients. Sustainability 2020, 12, 9021. [Google Scholar] [CrossRef]
  38. Khadayata, V.; Aggarwal, D. Knowledge, attitude, and practice about hygiene among livestock keepers in peri-urban area of Vadodara district, Gujarat. Indian J. Community Med. 2020, 45, S16–S20. [Google Scholar] [CrossRef]
  39. Brügemann, K.; Gernand, E.; König von Borstel, U.; König, S. Defining and evaluating heat stress thresholds in different dairy cow production systems. Arch. Anim. Breed. 2012, 55, 13–24. [Google Scholar] [CrossRef]
  40. Habeeb, A.A.; Gad, A.E.; EL-Tarabany, A.A.; Atta, M.A.A. Negative effects of heat stress on growth and milk production of farm animals. J. Anim. Husb. Dairy Sci. 2018, 2, 1–12. [Google Scholar]
  41. Ekine-Dzivenu, C.C.; Mrode, R.; Oyieng, E.; Komwihangilo, D.; Lyatuu, E.; Msuta, G.; Ojango, J.M.; Okeyo, A.M. Evaluating the impact of heat stress as measured by temperature-humidity index (THI) on test-day milk yield of small holder dairy cattle in a sub-Sahara African climate. Livest. Sci. 2020, 242, 104314. [Google Scholar] [CrossRef]
  42. Carabano, M.J.; Logar, B.; Bormann, J.; Minet, J.; Vanrobays, M.L.; Diaz, C.; Tychon, B.; Gengler, N.; Hammami, H. Modeling heat stress under different environmental conditions. J. Dairy Sci. 2016, 99, 3798–3814. [Google Scholar] [CrossRef] [Green Version]
  43. Mbuthia, J.M.; Mayer, M.; Reinsch, N. Modeling heat stress effects on dairy cattle milk production in a tropical environment using test-day records and random regression models. Animal 2021, 15, 100222. [Google Scholar] [CrossRef]
  44. Loker, S.; Bastin, C.; Miglior, F.; Sewalem, A.; Schaeffer, L.R.; Jamrozik, J.; Ali, A.; Osborne, V. Genetic and environmental relationships between body condition score and milk production traits in Canadian Holsteins. J. Dairy Sci. 2012, 95, 410–419. [Google Scholar] [CrossRef] [Green Version]
  45. Kibwana, D.K.; Makumyaviri, A.M.; Hornick, J.L. Effect of improved feeding and housing, Friesian blood level and parity on milk production of Ankole x Friesian cows. Pak. Vet. J. 2015, 35, 76–80. [Google Scholar]
  46. Madkour, M.; Salman, F.M.; El-Wardany, I.; Abdel-Fattah, S.A.; Alagawany, M.; Hashem, N.M.; Abdelnour, S.A.; El-Kholy, M.S.; Dhama, K. Mitigating the detrimental effects of heat stress in poultry through thermal conditioning and nutritional manipulation. J. Therm. Biol. 2021, 103, 103169. [Google Scholar] [CrossRef] [PubMed]
Figure 1. Least square means with corresponding standard errors for test day milk yield (MY) of exotic and crossbred cattle in different seasons. Least square means with different superscript differ significantly (p < 0.05). Significant differences (p < 0.05) within each breed group between seasons are denoted as a,b. Differences within each season group between the breeds were not statistically significant (p > 0.05) and therefore are not shown in the figure.
Sustainability 14 04590 g001
Figure 2. Least square means with corresponding standard errors for test day milk yield (MY) in rural, transition, and urban areas of Bengaluru. Least square means with different superscripts differ significantly (p < 0.05).
Sustainability 14 04590 g002
Figure 3. Least square means with corresponding standard errors for test day milk yield (MY) across temperature humidity index (THI) classes. Least square means with different superscript differ significantly (p < 0.05).
Sustainability 14 04590 g003
Figure 4. Regression curve and raw data points for milk yield (MY) by THI for exotic and crossbred cows.
Sustainability 14 04590 g004
Figure 5. Least square means with corresponding standard errors for body condition score (BCS) of exotic and crossbred cattle for different seasons. Least square means with different superscript differ significantly (p < 0.05). Significances within each breed group across seasons are denoted as a,b. Differences within each season group between the breeds were not statistically significant (p > 0.05) and therefore are not shown in the figure.
Sustainability 14 04590 g005
Figure 6. Least square means with corresponding standard errors for body condition score (BCS) in rural, transition, and urban areas of Bengaluru. Least square means with different superscripts differ significantly (p < 0.05).
Sustainability 14 04590 g006
Figure 7. Least square means with corresponding standard errors for body condition score (BCS) across THI classes. Least square means with different superscript differ significantly (p < 0.05).
Sustainability 14 04590 g007
Figure 8. Least square means with corresponding standard errors for body weight (BW) of exotic and crossbred cattle for different seasons. Least square means with different superscript differ significantly (p < 0.05). Significant differences (p < 0.05) within each season group between the breeds are denoted as A,B, while significant differences (p < 0.05) within each breed group across different seasons are denoted as a,b.
Sustainability 14 04590 g008
Figure 9. Least square means with corresponding standard errors for body weight (BW) in rural, urban, and transition areas of Bengaluru. Least square means with different superscript differ significantly (p < 0.05).
Sustainability 14 04590 g009
Figure 10. Least square means with corresponding standard errors for hock assessment score (HAS) across the THI classes. Least square means with different superscript differ significantly (p < 0.05).
Sustainability 14 04590 g010
Figure 11. Least square means with corresponding standard errors for udder hygiene score and upper leg hygiene score for different seasons. Least square means with different superscript differ significantly (p < 0.05). Significant differences (p < 0.05) within each breed group between seasons are denoted as a,b. Difference within each season group between the breeds was not statistically significant (p > 0.05) and therefore is not shown in the figure.
Sustainability 14 04590 g011
Figure 12. Least square means with corresponding standard errors for udder hygiene score (UHS) and upper leg hygiene score (ULHS) in rural, urban, and transition areas of Bengaluru. Least square means with different superscript differ significantly (p < 0.05).
Sustainability 14 04590 g012
Figure 13. Regression lines (including equations) and raw data points for test day milk yield (MY) by days in milk in exotic and crossbred cattle in groups (a) THI ≤ 75 and (b) THI > 75.
Sustainability 14 04590 g013
Figure 14. Regression lines (including equations) and raw data points for BCS by days in milk of exotic and crossbred cattle in case of (a) THI ≤ 75 or (b) THI > 75.
Sustainability 14 04590 g014
Table 1. Descriptive statistics of test day THI (THI_0), weekly THI (recorded throughout seven days prior to test day; THI_1-7), test day milk yield (MY), body condition score (BCS), body weight (BW), hock assessment score (HAS), udder hygiene score (UHS), and upper leg hygiene score (ULHS).
VariableMeanStd DevMinimumMaximum
THI_074.183.2065.5781.44
THI_1-774.143.0166.2481.01
MY (L/day)11.204.922.0026.00
BCS2.820.322.253.75
BW (kg)385.5167.06231.66569.08
HAS1.520.531.003.00
UHS1.931.011.004.00
ULHS2.711.031.004.00
Table 2. Test of significance (global F-Test) for the effects on test day milk yield, body condition score, body weight, hock assessment score, udder hygiene score, and upper leg hygiene score.
EffectMilk YieldBody Condition ScoreBody WeightHock Assessment ScoreUdder Hygiene ScoreUpper Leg Hygiene Score
Lactation stage<0.01<0.010.010.550.040.12
Lactation number<0.01<0.01<0.010.390.080.09
Milking frequency<0.01-----
Farm (SSI)<0.01<0.01<0.010.03<0.01<0.01
SSI<0.010.040.020.280.050.01
THI_0 #0.04--0.040.650.87
THI_1-7 *-<0.010.46---
Breed x season0.020.070.080.300.030.08
# test day THI for milk yield, hock assessment score, udder hygiene score, and upper leg hygiene score; * average THI recorded throughout seven days prior to test day for the body condition score and body weight traits.
Publisher’s Note: MDPI stays neutral with regard to jurisdictional claims in published maps and institutional affiliations.

