
Predicting Possible New Links to Future Global Plastic Waste Trade Networks


1
School of Economics and Management, Yan’an University, Yan’an 716000, China
2
Business School, Changshu Institute of Technology, Changshu 215500, China
3
School of Maritime Economics and Management, Dalian Maritime University, Dalian 116026, China
4
Yangtze River Delta Circular Economy and Technology Institute, Jiaxing 314001, China
*
Author to whom correspondence should be addressed.
Sustainability 2022, 14(8), 4692; https://0-doi-org.brum.beds.ac.uk/10.3390/su14084692
Submission received: 19 March 2022
/
Revised: 7 April 2022
/
Accepted: 7 April 2022
/
Published: 14 April 2022
(This article belongs to the Topic Solid Waste Management)
Abstract
:China’s waste plastic ban has sparked a discussion about how the global plastic waste trade (GPWT) will develop in the future. To answer this question, this article uses the link forecasting and QAP method to predict and analyze the possible development trend of the GPWT in the future. The research results show that GPWT has certain stability and sustainability; although plastic waste trade has narrowed under the ban, it still has the potential trend of reconnecting the same type of links. Specifically, from a regional perspective, the future trade of new plastic waste trade will be dominated by cross-regional trade. Plastic waste may continue to flow to countries in the Asian–Pacific, Middle East, and African regions, while European countries will strengthen the internal recycling and processing of plastic waste. From the perspective of the national income level, the establishment of the new relationship will show an evolutionary trend in which high-income countries are dominated and the scale of trade between non-high-income countries expands. In addition, the differences in the level of economic development, liner transport connectivity, and the proportion of mismanagement of plastic waste among countries has a positive effect on the establishment of a new relationship in the GPWT, while tariff rates have an inhibitory effect. In general, the GPWT will still exist in the future, which requires the international community to guide the GPWT to promote the recycling and reuse of plastic waste in a real sense and adjust the unreasonable trade model.
1. Introduction
From 1992 to 2016, 45% of the world’s plastic waste was exported to China, with such a large volume of plastic waste imports resulting in the “displacement” of huge amounts of plastic waste after China’s ban, which is estimated to reach 111 million metric tons in 2030 [1]. This triggered the transfer of the global plastic recycling system, and global plastic recycling fell into a panic [2]. While many countries have recognized the recycling and utilization of domestic plastic waste streams, they do not yet have sufficient industrial infrastructure and capacity [1]. After the ban, a large number of plastic waste exports were transferred to other Asian countries such as Indonesia, Vietnam, Malaysia and Philippines [3], and Turkey has also become a new plastic waste recycling market in some European countries [4]. This prompted such countries to adopt import control measures to reduce the import of plastic waste. Although some scholars have pointed out that the import ban in developing countries would force developed countries to establish new plastic treatment facilities [5], but until now the plastic waste trade is still profitable for traders [6]. On the one hand, local enterprises in some countries are more inclined to import low-cost plastic waste than to invest in domestic waste recycling systems [7]. On the other hand, compared with domestic processing, developed countries have found that exporting plastics is a more cost-effective approach [5]. In particular, some scholars have recently pointed out that after China’s ban, the rapid inflow of plastic waste has overwhelmed Turkey’s waste management, and waste pollution in Turkey and its Mediterranean coast has continued to increase [8]. Malaysia [9], Thailand [10] and other countries are also in the same predicament. Under the goal of public governance policy, the pursuit of profit by capital has prompted the continuation of the plastic waste trade. These “displaced” plastic wastes pose a challenge to global plastic waste governance, because most countries in the world lack the ability to sustainably manage excessive imports of plastic waste [11], and the risk of plastic waste being illegally dumped into the ocean and freshwater is increasing [2].
Affected by the ban, the “displaced” plastic waste has triggered discussions on the global issue of how the GPWT will develop in the future. What are the potential links to the plastic waste trade? What is the distribution law of these potential links? What are the influencing factors behind the generation of potential links? The exploration of such issues has both an important theoretical and practical significance. Link prediction is a method to predict possible new links in the future based on the current network snapshot [12]. Due to its ability to dig out the potential information and evolution trends of complex networks [13,14], it has been widely used in many fields [15,16,17]. Therefore, this article attempts to use the link prediction method to forecast the potential links of the GPWT, and deconstruct the distribution law of potential links from multiple angles and the generation influencing factors, to conduct in-depth exploration and discussion on the trend of establishing new plastic waste trade relations. This will not only answer the important question of how the GPWT will develop in the future, but also help to understand the nature of the relationship building in the GPWTN and the underlying laws of its operation, and provide new ideas for potential solutions to the GPWT, promote the smooth progress of the global plastic waste management task.
Compared with previous studies, the main contributions of this article are: (1) Using the local naïve Bayes - Resource Allocation (LNB-RA) algorithm to predict the potential trade relations of GPWT. By comparing six prediction algorithms, it is found that the LNB-RA algorithm fits well with the topological characteristics and structure of the global plastic waste trade network (GPWTN), and can more accurately predict the potential links of this network. (2) Deconstructing the potential links of plastic waste trade from multiple perspectives from the perspective of geographic region and income level. Previous studies have confirmed that link prediction methods help to mine network information [18], but the discussion of hidden rules of network potential links are relatively simple, this article will provide new ideas for the empirical research of future link prediction. In addition, the GPWT has strong regional and economic differences; multi-perspective analysis helps to deepen the understanding of the potential links of plastic waste trade. (3) Using Quadratic Assignment Problem (QAP) technology to explain the factors affecting the formation of potential links in the plastic waste trade. Since the link prediction model mainly predicts possible links in the future based on the physical topology of nodes in the network, the prediction result is affected by a mixture of many factors, which makes it difficult to identify the inherent driving force for the formation of potential links. This article uses QAP technology for the first time to analyze the influencing factors of the potential link generation of the plastic waste trade. (4) Finally, this research enriches the related research on link prediction, and provides a new perspective for global cooperation on plastic waste management.
This article is organized as follows: Section 2 reviews and summarizes previous related research. Section 3 presents the data source and processing method, the specific implementation steps of link prediction, and the analysis method of potential links. Section 4 selects the optimal algorithm of this article, tests the ability of this algorithm to predict future links, then analyzes the distribution of potential links, and uses the QAP model to analyze the influencing factors of potential link generation. Section 5 includes conclusions, policy recommendations, and research limitations and future research prospects.
2. Literature Review
2.1. Global Plastic Waste Trade
The current research on GPWT is mainly concentrated on the structure and evolution of the GPWTN [5,19,20,21], the impact of the plastic waste trade on the environment [8,22,23], and the driving factors of the plastic waste trade [24,25]. Especially after China promulgated the ban on plastics, related research on the plastic waste trade has increased rapidly.
In terms of research on the structure and evolution trend of the plastic waste trade network, Wang et al. (2020) analyzed the temporal and spatial evolution of the GPWTN. The results show that Asia has now become the world’s largest import region, while North America and Europe are the main sources of plastic waste [5]. Pacini et al. (2021) conducted a network survey on GPWT and found that the European Union and North American countries play a key role in the GPWTN and have close ties with some Asian countries [19]. Li et al. (2021) used a cascading failure model to quantify the process of plastic waste trade collapse due to the Chinese ban and found that the GPWT would collapse after the ban starting from China’s trading partners, and lead to a global overload of plastic waste [26]. In terms of research on the impact of plastic waste trade on the environment, Liu et al. (2021) explored whether the reuse and recycling of the GPWT has a positive impact on environmental benefits. The results show that the GPWT may help reduce potential greenhouse gas emissions and other environmental benefits, but at this stage, the GPWT distribution is flawed and its structure should be adjusted [22]. Wen et al. (2021) used the Life Cycle Assessment method to quantify the environmental impact of changes in plastic waste flow patterns and treatment methods after the implementation of the Chinese ban. The results show that the ban has significantly improved environmental indicators in the short term, but at the same time, it has caused global warming [23]. Ren et al. (2020) evaluated the environmental impact of China’s ban through scenario simulation and life cycle methods, and the results showed that the ban may impose adverse environmental impacts on plastic waste, which would be contrary to the original intention of the ban to protect the ecological environment and human health [27]. In terms of research on the drivers of the plastic waste trade, Barnes (2019) applied an explanatory type of theory in terms of the plastic waste trade, and believed that “out of sight, out of mind” is the main reason why developed countries export huge amounts of plastic waste to developing countries, and the supervision or control of plastic waste in developed economies should be strengthened [24]. Kellenberg (2015) reviewed the waste trade and identified differences in national environmental policies, taxes, disposal fees, and transportation costs as important determinants of the development of the trade [25].
The evolution of the GPWTN is complicated, and most of the existing studies on the plastic waste trade network have analyzed the past evolutionary trends of the network by calculating several indicators, but the nature of the construction of trade relations between countries and the trend of possible new trade relations to be established in the future need to be further explored. Especially after China and other Asian countries passed bans to restrict imports, the market has begun to fall into chaos and is in an extremely unstable state [28]. The surge in imports of plastic waste faced by some countries has brought huge challenges to the waste management of these countries. The question of the trend of establishing new plastic waste trade relations needs to be answered urgently.
2.2. Link Prediction
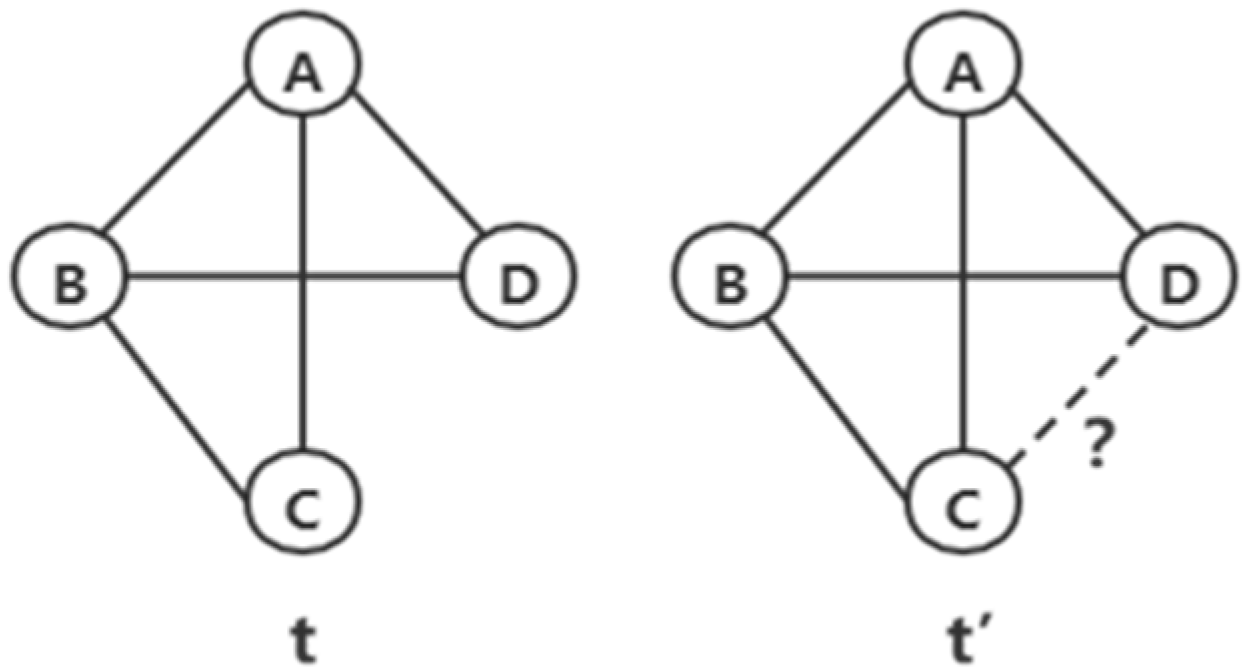
Link prediction is a research method based on data mining; the research ideas and methods have mainly evolved from the Markov chain and machine learning [29]. Since social networks usually present a complex and dynamic evolution state, as time goes by, the nodes in the network will change their association mode under the influence of certain driving forces, which promotes the birth of link prediction. In 2007, when Liben-Nowell and Kleinberg studied the problem of establishing new relationships between members over time in social networks, they first generalized it as a link prediction problem [12], and link prediction has gradually become one of the main research methods in social networks. Among them, the application of link prediction in the network mainly includes the prediction of unknown links and future links [30]. The prediction of future links is specifically shown in Figure 1, that is, through a snapshot of the network structure at time t, it can predict which new links will be added to the network at time t’ in the future compared with the network at time t [12].
As an emerging research method, the previous link prediction research mainly focused on the improvement of current algorithms and the innovation of new algorithms, that is, which algorithm can better predict the potential links of real relationships. With the development of link prediction research, some scholars gradually apply link prediction to real networks, such as social networks [31], scientist coauthor networks [15], protein networks [32], transportation networks [17], and criminal networks [16]. The structure, scale, and characteristics of the above networks are different, but through continuous attempts, scholars have found that applying the link prediction method to the above networks not only obtains relatively ideal prediction results, but also helps to dig out the potential information of the network. For example, researchers proposed a link prediction algorithm suitable for the yeast protein–protein interaction (PPI) network, and found that the biological relevance of links in the yeast PPI network reconstructed by this algorithm is significantly higher than that of the original network [32]. Through the successful application of the algorithm, it was discovered that yeast proteins with high-order topological similarity are more likely to interact, which is an important potential information.
With the expansion of link prediction practice, the current relatively novel research tends to apply this method to the global trade network, mainly based on the relationship between countries in the trade network, to predict the potential trade relations that may develop into actual trade relations in the future. This groundbreaking research began when Guan et al. (2016) predicted the potential global crude oil trade relationship based on the common neighbor (CN) algorithm. In addition to predicting potential links, it was also discovered that the number of mutual trading partners is one of the motivations for the establishment of new global crude oil trade relations [18]. Later, some scholars gradually applied link prediction to bauxite trade [33], cobalt ore trade [34], lithium carbonate trade [35]. Among them, Liu and Dong (2019) found 17 pairs of potential bauxite trade links using the link prediction method from the perspective of the topological relationship of the trade network of countries and provided suggestions for ensuring national bauxite safety [33]. Liu et al. (2020) cited this method in the cobalt ore trade and predicted 13 possible future cobalt ore trade relationships, which have helped relevant countries find more new trading partners [34]. Zhang et al. (2021) applied the link prediction method to the prediction of potential trade links of lithium carbonate trade and found three trade rules for lithium carbonate trade, which are of great importance to strengthen the supply security of lithium carbonate resources in international trade significance [35].
The above scholars have used different trade networks to verify the accuracy and effectiveness of link prediction methods applied to the prediction and mining of potential trade relations. Relying on its powerful ability to analyze the evolution of the network, the link prediction method has attracted much attention from academia [36]. Although some scholars have applied the link prediction model to the prediction of potential trade relations, the discussion on the prediction results is relatively simple, and no further research has been conducted on the distribution law of predicted potential trade relations and the influencing factors.
3. Data Description, Link Prediction and Potential Link Analysis Methods
3.1. Data Source and Processing
This article uses the “Waste, parings and scrap, of plastics” trade data in the UN Comtrade database as an indicator to measure the plastic waste trade between countries (regions). The HS code is 3915, and the data selection period is: 2010–2019.
For the difference value problem in mirroring statistics, this article draws on the data processing method of Liu and Dong (2019) [33], and the larger number is used as the basis for link prediction, to reduce the result error caused by the missing data as much as possible. In mirror statistics, there are often discrepancies in trade data reports between importing and exporting countries. There are many reasons for this situation, such as differences in national statistical methods, time differences between imports and exports, and so on. In addition, due to the sensitivity of the plastic waste trade, the possibility of corruption, tax evasion, fear of criticism of importers and exporters, and moral trials all increase the possibility of statistical discrepancies [25,37,38]. For example, in 2019, when China was set as the reporting country and other countries were partner countries, China imported plastic waste from five countries. However, when China is set as a partner country, the database shows that a total of 57 countries have exported plastic waste to China.
3.2. Link Prediction Algorithm Selection
At this stage, similarity algorithms based on common neighbors have been used by some scholars in the prediction of relationships in real networks. The algorithm assumes that the more common neighbors there are between nodes in the network, the greater the probability of being connected to each other, and it has been proven effective in previous empirical studies [12,18]. Commonly used algorithms include: Common neighbor algorithms (CN), Adamic–Adar algorithms (AA), resource allocation algorithms (RA). In addition, with the development of link prediction, scholars have introduced role functions into link prediction and derived a link prediction model integrating the naïve Bayes method. Compared with previous methods, this method highlights the different roles of different common neighbor nodes in the prediction. Its algorithms include: LNB-CN, LNB-AA, LNB-RA (LNB is short for local naïve Bayes). Therefore, we choose the above six algorithms as the basic algorithm of this article, and select the best algorithm that conforms to the potential link law of the GPWT. The variables used to deal with each data unit are shown in Table 1.
The principles of the six algorithms are as follows:
3.2.1. Similarity Algorithm Based on Common Neighbor
(1) Common neighbor algorithm (CN) [39]. The algorithm considers that the similarity between nodes is proportional to the number of common neighbors of two nodes. The possibility of the existence of a potential relationship between two nodes increases as the similarity between nodes increases. The similarity between nodes can be calculated by equation (1):
(2) Adamic–Adar algorithm (AA) [40]. In addition to the CN algorithm, AA takes into account the impact of the difference in the degree of common neighbor on the similarity between nodes, and the common neighbor with a small degree value contributes more to the similarity of two nodes. The specific formula is shown in (2):
(3) Resource allocation algorithm (RA) [41]. The principle of the algorithm is basically the same as the AA algorithm. It assumes that each medium has a unit of resources and distributes it evenly to its neighbors, that is, the common neighbor is regarded as a communication medium between two trading countries, but the degree of punishment for the scattered resources of the common neighbor is higher than that of the AA algorithm.
3.2.2. Local Naïve Bayes Models
The algorithm believes that due to the different importance of the node itself in the network, the effect on the link is also different. Based on this idea, Liu et al. (2011) [42] introduced a role function in the LNB model, which highlights the difference in the effect of different common neighbors on the similarity between nodes in the prediction. LNB-CN, LNB-AA, and LNB-RA are LNB Models based on CN, AA, and RA, respectively. The formulas are as follows (Due to space limitations, the specific symbolic explanation of the local naïve Bayes model are as follows: Liu Z, Zhang QM, Lü L, et al. Link prediction in complex networks: A local naïve Bayes model [J]. EPL (Europhysics Letters), 2011, 96(4): 48007):
Obviously, when the role difference of common neighbor nodes is not considered, LNB-CN, LNB-AA, and LNB-RA will all return to the original CN, AA, and RA.
3.3. Link Prediction Steps of the GPWTN
The plastic waste trade network link prediction used in this article is mainly divided into three parts, including the best algorithm selection for link prediction, the prediction accuracy test, and the global plastic waste trade potential link prediction. The specific method is as follows:
3.3.1. Selection of the Best Algorithm for Link Prediction
Different algorithms have different predictive capabilities for potential trade relationships in the GPWTN. It is necessary to compare the accuracy of different algorithms to find an algorithm that can better predict the potential trade relationships of the GPWTN. The specific steps are as follows:
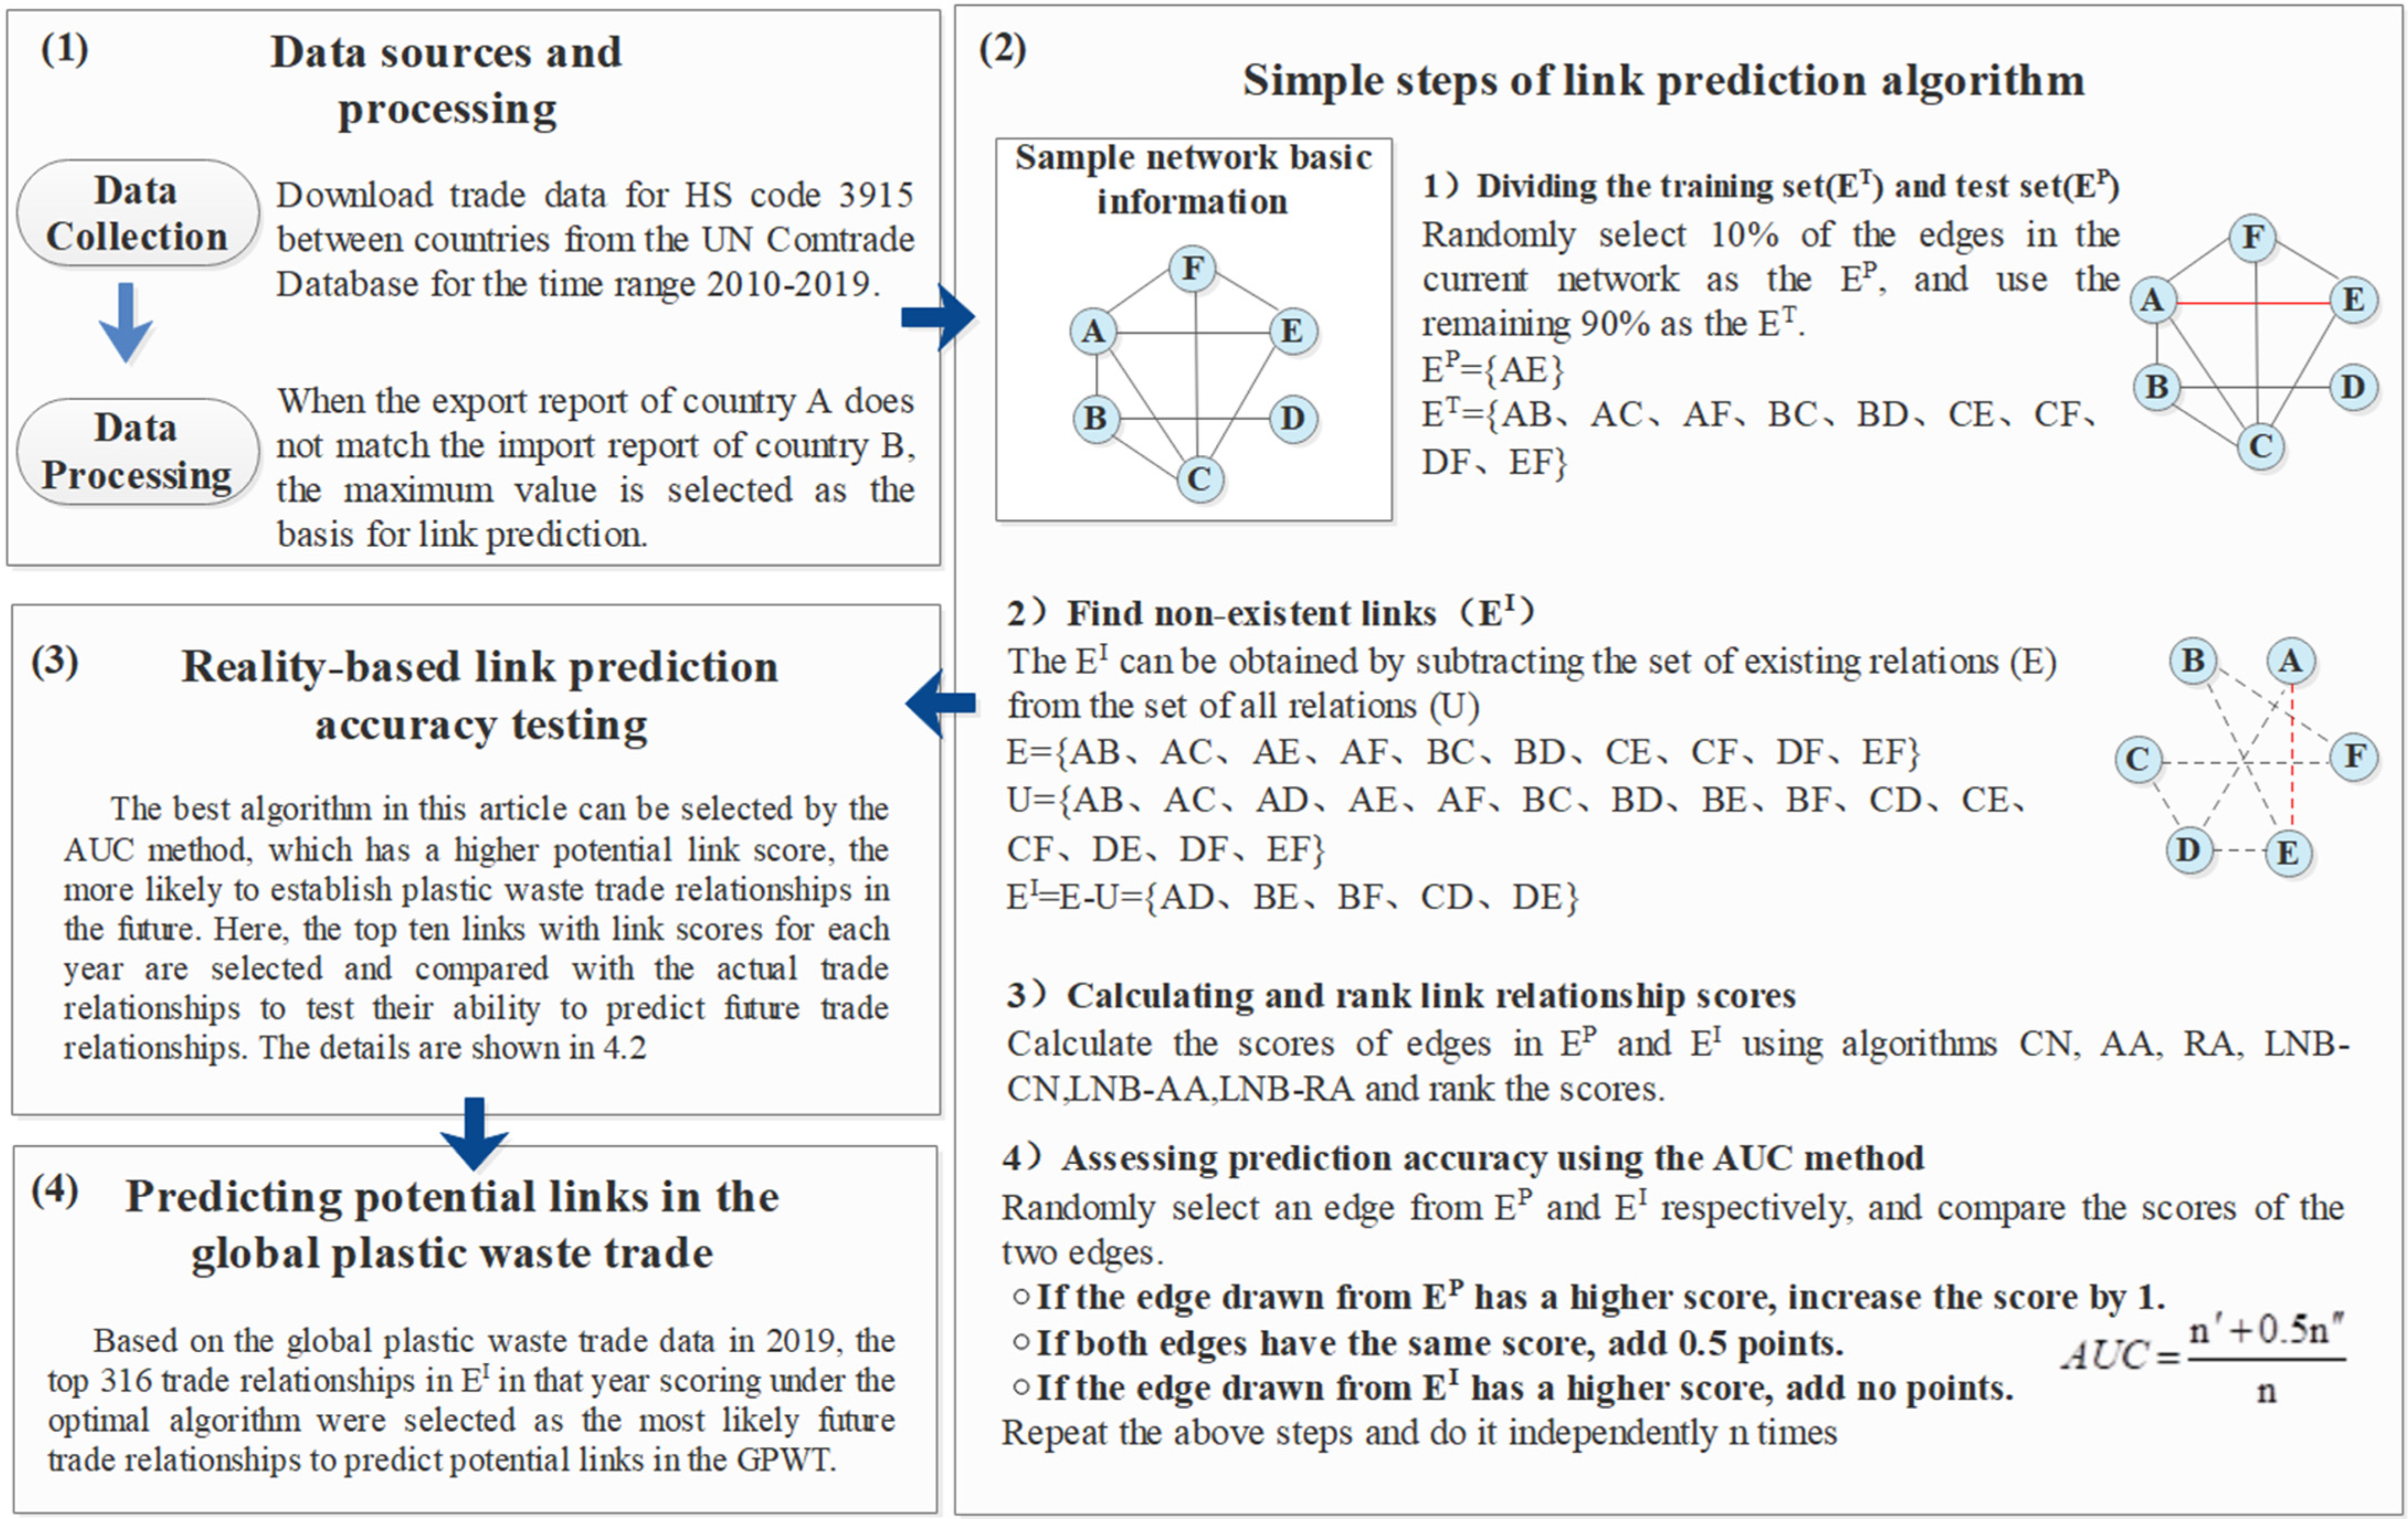
(1) The current link (E) of GPWTN is randomly divided into two parts, including training set (ET) and test set (EP), as shown in formulas (7) and (8); (2) Calculate the link relationship set that does not exist in the current network, which can be obtained by subtracting the existing relationship set (E) from the total relationship set (U). Among them, U can be obtained by formula (9), and the set of non-existent link relations (EI) can be calculated by (10); (3) The six selected algorithms are used to calculate all the links in EP and EI to obtain the score of each transaction relationship; (4) The area under an ROC (receiver operating characteristics) curve (AUC) evaluation method is used to evaluate the prediction accuracy of the 6 algorithms in 10 years, and the closer the AUC score of the algorithm is to 1, the stronger the ability of the algorithm to predict the potential links of the GPWTN (Due to the randomness of each evaluation, it will lead to errors in the final calculated AUC calculation value. Therefore, we independently calculate the AUC score of the algorithm 10 times, and finally take the average value as the AUC score of the algorithm in the current year to reduce the occurrence of such errors), and selected as the optimal algorithm in this paper.
The specific methods of the AUC evaluation method are as follows: (a) Randomly extract an edge from EP and EI, respectively; (b) Compare the scores of the two edges. If the edge scores drawn from EP are higher, add 1 point; If the two sides selected from EP and EI have the same scores, add 0.5 points; If the edges drawn from EI have higher scores, no points are added; (c) Repeat the above steps (1) and (2), and do it independently n times, and use n’ to indicate the number of times the EP edge score is higher than EI, and n″ means that the scores of the two have an equal number of times. In fact, AUC can be understood as the probability that randomly selecting an edge in EP has a higher number of scores than randomly selecting an edge in EI. Obviously, if the scores of all edges in EP and EI are randomly generated, then AUC ≈ 0.5 when n is large enough, so the degree to which AUC is greater than 0.5 measures how accurate the algorithm is than the randomly selected method. The AUC calculation formula is shown in (11) [43].
3.3.2. Link Prediction Accuracy Test
The best algorithm of this article can be selected through Section 3.3.1, but the predictive ability of this algorithm on the potential links in the real network of plastic waste trade remains to be tested. Arrange the potential link (EI) integrals calculated by the optimal algorithm in descending order, among which potential links with higher rankings are more likely to establish trade relations in the future. Then, select the top 10 potential trade links each year, and compare these links with actual trade data to test whether the predicted potential links will actually occur in the future. The prediction accuracy test is carried out on the potential links of the GPWT from 2010 to 2019, and a total of 100 tests are carried out.
3.3.3. Prediction of Potential Links to Global Plastic Waste Trade
Through the above analysis, we can determine which algorithm can better discover possible new trade links in the future. Using the selected optimal algorithm, based on the GPWT data in 2019 (a total of 3155 trade links), predict the potential links of the GPWT, and select the links with the top 316 points (10%) as the most likely potential links in the future.
UNCTAD uses a new database to track the life cycle of plastics, including plastic waste, and the results show that the actual plastic trade was nearly 40% higher than previous estimates [44]. In addition, despite the violent impact of the ban, from 2018 to 2019, the GPWT still established 937 new trade relations (accounting for 25.74% of the number of trade links in 2018) (obtained by collating the database of the UNCTAD). At the same time, in order to ensure the accuracy of the forecast, this article believes that it is reasonable to assume that the new GPWT link will increase by 10% based on 2019.
Data processing and GPWT link prediction in simple steps are shown in Figure 2.
3.4. Analysis of Potential Links and Influencing Factors of GPWT
3.4.1. The Law of Potential Links in the GPWT
Although the link prediction model provides new analysis methods and perspectives for exploring the formation of new relationships in GPWT, the actual trade relationship is affected by geographic area, income, and development level [5,45]. To explore the laws of GPWT relations, this article further analyzes the potential link laws from the following two aspects: (a) The regional distribution of potential links of plastic waste trade (The country regional classification comes from the International Telecommunication Union); (b) Level distribution of potential link income from plastic waste trade (The income level classification standard comes from the World Bank). Based on the above classification, this article forecasts and discusses the future development trend of the GPWT.
3.4.2. Analysis of Influencing Factors of Potential Links of GPWT
After analyzing the distribution rules of potential links in GPWT, although there is a certain understanding of the rules of potential link generation, it is still necessary to conduct a more in-depth discussion on the influencing factors of potential link generation. The QAP model is based on the replacement of the element values in the matrix. It measures the regression or correlation between the two matrix data by comparing the corresponding grid values in two (or more) square matrices, and performs non-parametric tests on the results at the same time [46,47].
The traditional gravity model of trade believes that the flow of trade between countries mainly depends on the geographic distance and economic scale of the two countries [48]. Secondly, the plastic waste trade mainly relies on sea transportation, and the connectivity of liner transportation will affect the cost and transportation convenience of the plastic waste trade. Tariff rate is the main manifestation of a country’s trade openness and also an important factor affecting the establishment of trade relations [49,50]. In addition, from the perspective of the characteristics of the GPWT, scholars have found that developed countries usually transfer plastic waste to areas where plastic waste is poorly managed [24]. From the perspective of supply and demand, plastic waste as a production resource will be exported by countries that produce large amounts of plastic waste, and imported by countries that are relatively scarce in this resource, because the cost of importing plastic waste is lower than the cost of raw plastic. Therefore, this article takes the share of plastic inadequately managed and the annual output of plastic waste as the explained variables.
In summary, this article chooses the economic development level difference matrix, the national capital geographic distance difference matrix, the liner shipping connectivity index difference matrix, the tariff rate difference matrix, the share of plastic inadequately managed difference matrix, and the plastic waste generation difference matrix as the six factors to explain the potential link matrix of plastic waste trade. The specific model is shown in Formula (12):
The specific variables and their explanations are shown in Table 2.
4. Results
4.1. Comparison of Algorithm Results
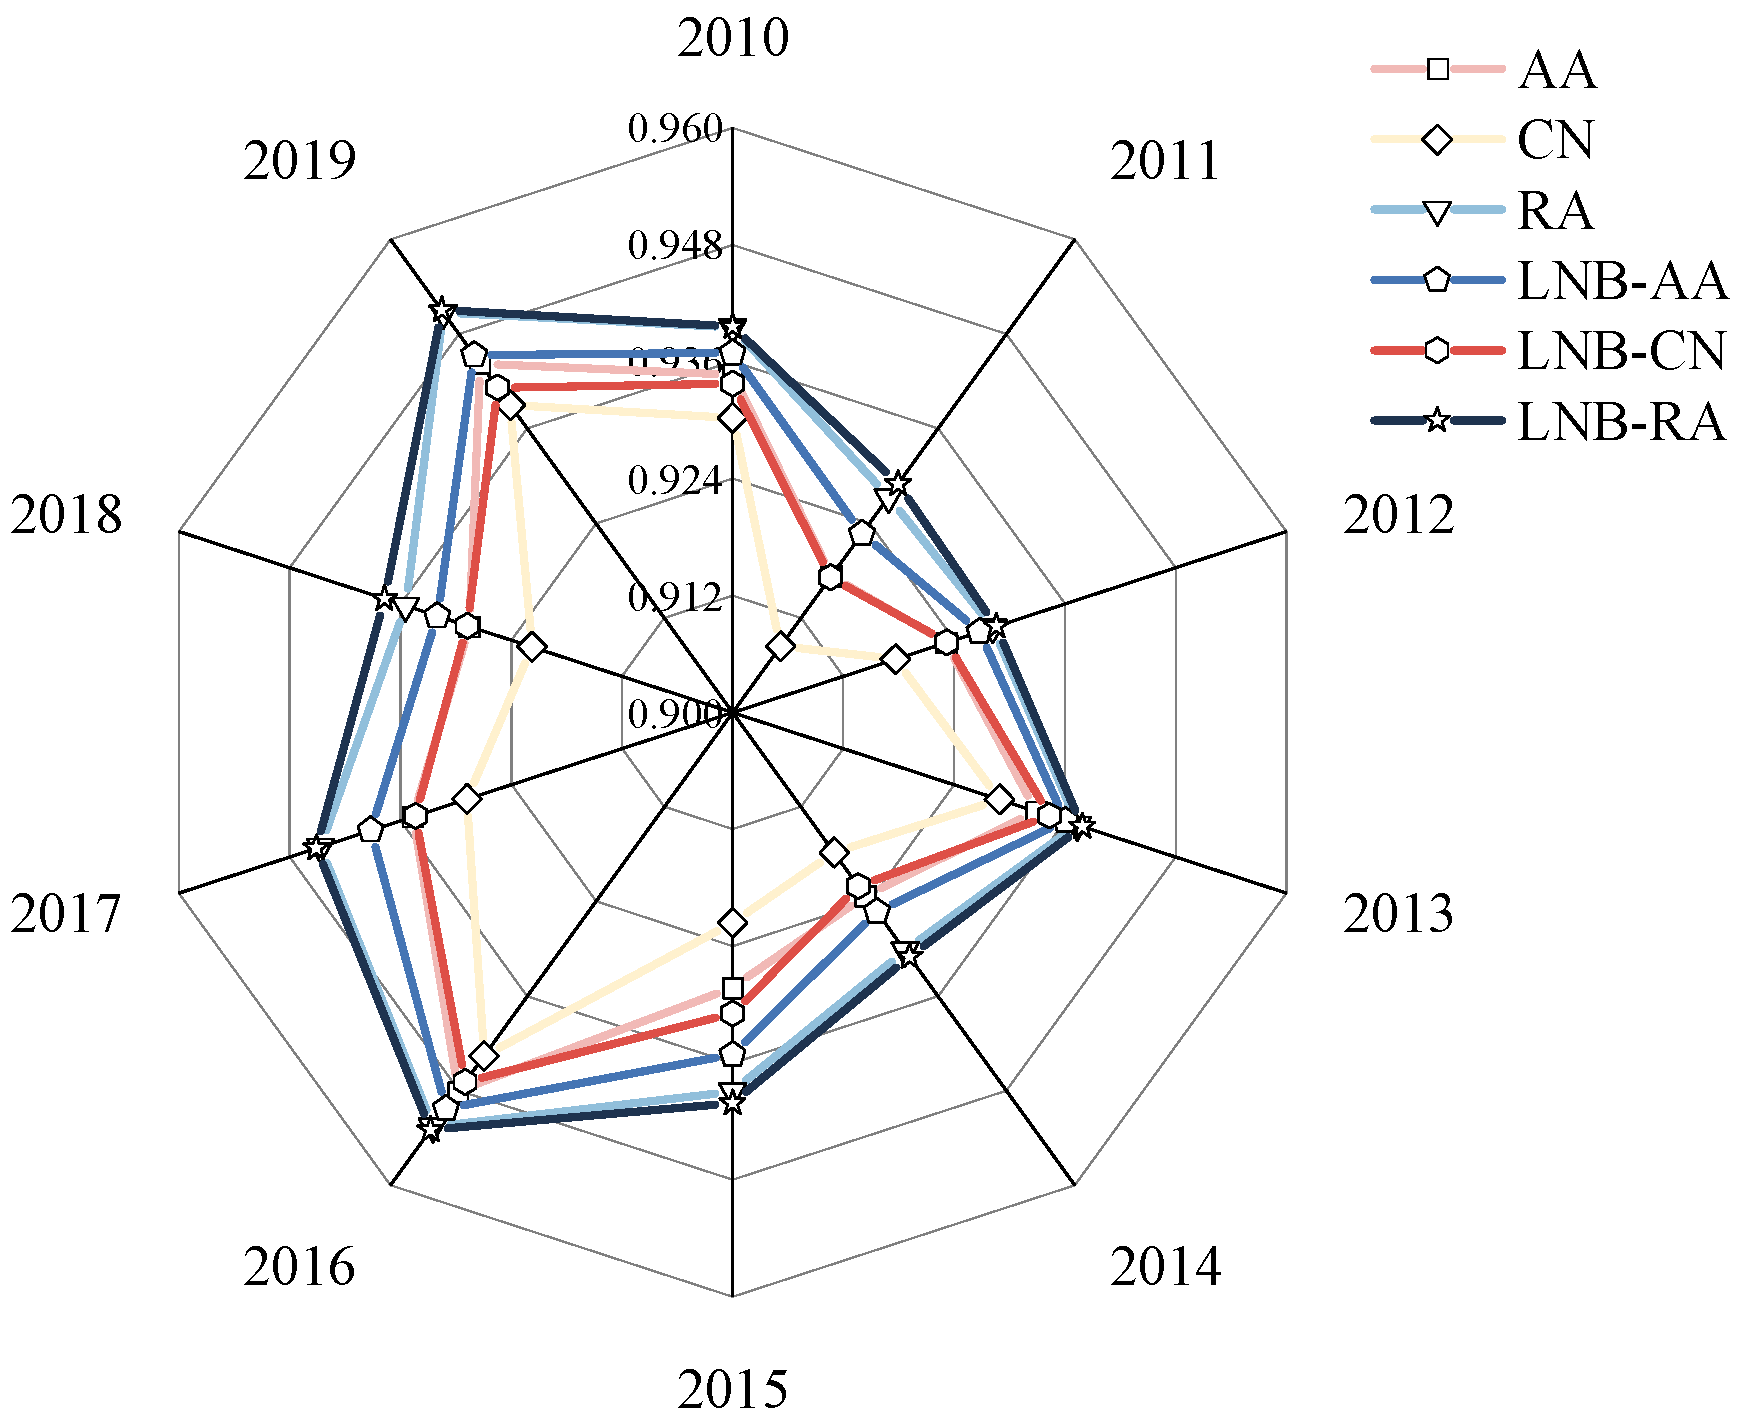
The AUC calculation results of the six algorithms are shown in Figure 3:
Analyzing the data in Figure 3 (see Appendix A for specific data), we can get: Among the six algorithms, the LNB-RA algorithm performed the best in the 10-year prediction test, and the AUC value of the algorithm is the closest to 1. It is the optimal algorithm relations between the two countries. However, the higher the degree value of a common partner, the weaker the influence of this common partner on the establishment of a new relationship. In the LNB-RA algorithm rules, the more partners of nodes, the more serious the loss of resources in the transfer of node resources. In addition, different node characteristics have different effects on the formation of new links in the network. For example, compared with “silent” nodes, “active” nodes will have more influence on the establishment of new links.
4.2. Compare Predicted Potential Trade Relations with Actual Trade Relations
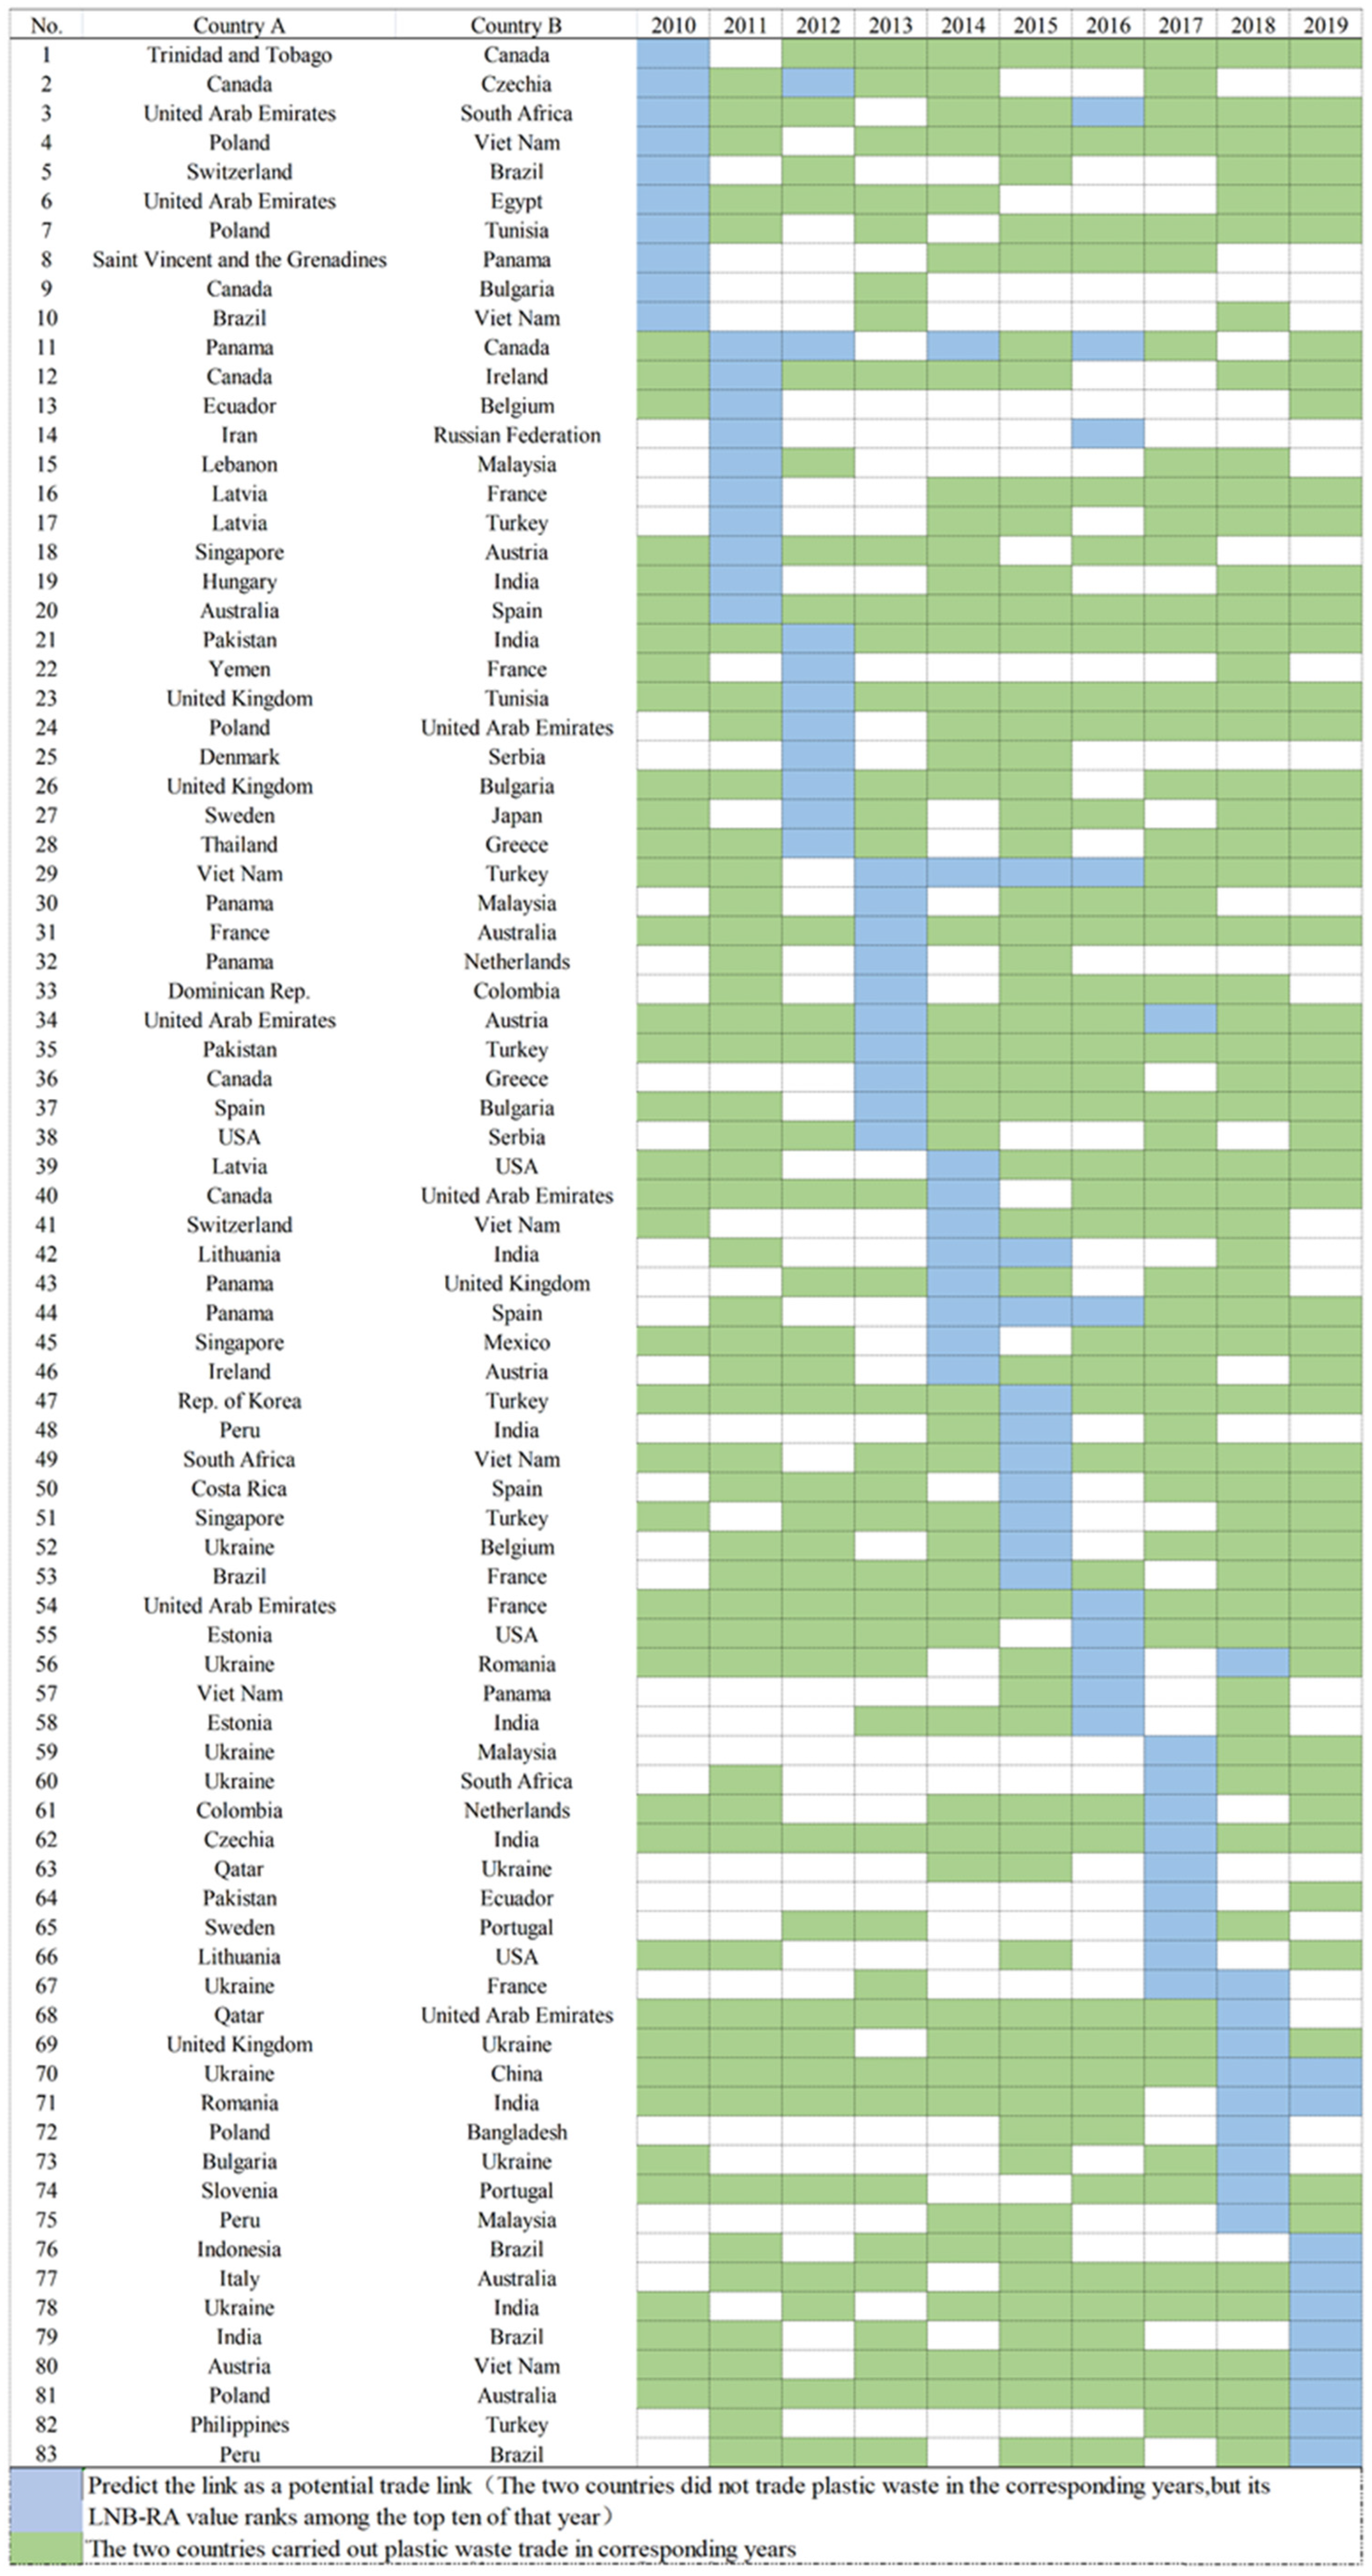
To further evaluate the prediction of potential trade relationships by the LNB-RA algorithm in the actual plastic waste trade, this article selects the top 10 potential trade country pairs in the algorithm’s score for each year from 2010 to 2019, and observes whether the potential trade country pairs have established trade relationships after being predicted. The result is shown in Figure 4:
As shown in Figure 4, taking the No.1 potential links Trinidad and Tobago Republic-Canada as an example, the LNB-RA algorithm predicted in 2010 that the two countries might have trade relations in the future, and the two countries successfully established trade relations in 2012, and the prediction is effective. On the contrary, as shown in No.14 in Figure 4, the two countries were predicted in 2011 and 2016 that there may be trade relations in the future. However, in the following period, the pair did not trade in plastic waste, so the forecast is defined as invalid.
Analyzing the data in Figure 4, we can see that 80 out of 100 predictions (80%) are successful, and 66 (80.72%) of the 83 pairs of countries predicted have trade links after the prediction. Among the 80 successful predictions of country pairs, 45 (56.25%) predictions have established plastic waste trade relations within 1 year, and 29 (36.25%) have traded in the second and third years, with only 6 (7.5%) predicting that trade relations would take longer than 3 years to establish. Among the links that failed to predict, only the No.14 potential link of Iran–Russia did not establish a trade relationship for several years after the prediction, while the other links predicted to be unsuccessful are located after 2017, and these links still have a high probability of establishing a real trade relationship in the near future. Combined with the above data, the prediction success rate of the top 10 potential links is higher than 80% every year, which verifies that the LNB-RA algorithm is effective and accurate in predicting the potential relationship of the GPWT.
4.3. Explore Link Distribution Rules for Potential Transactions
4.3.1. Regional Distribution of Potential Links to Plastic Waste Trade
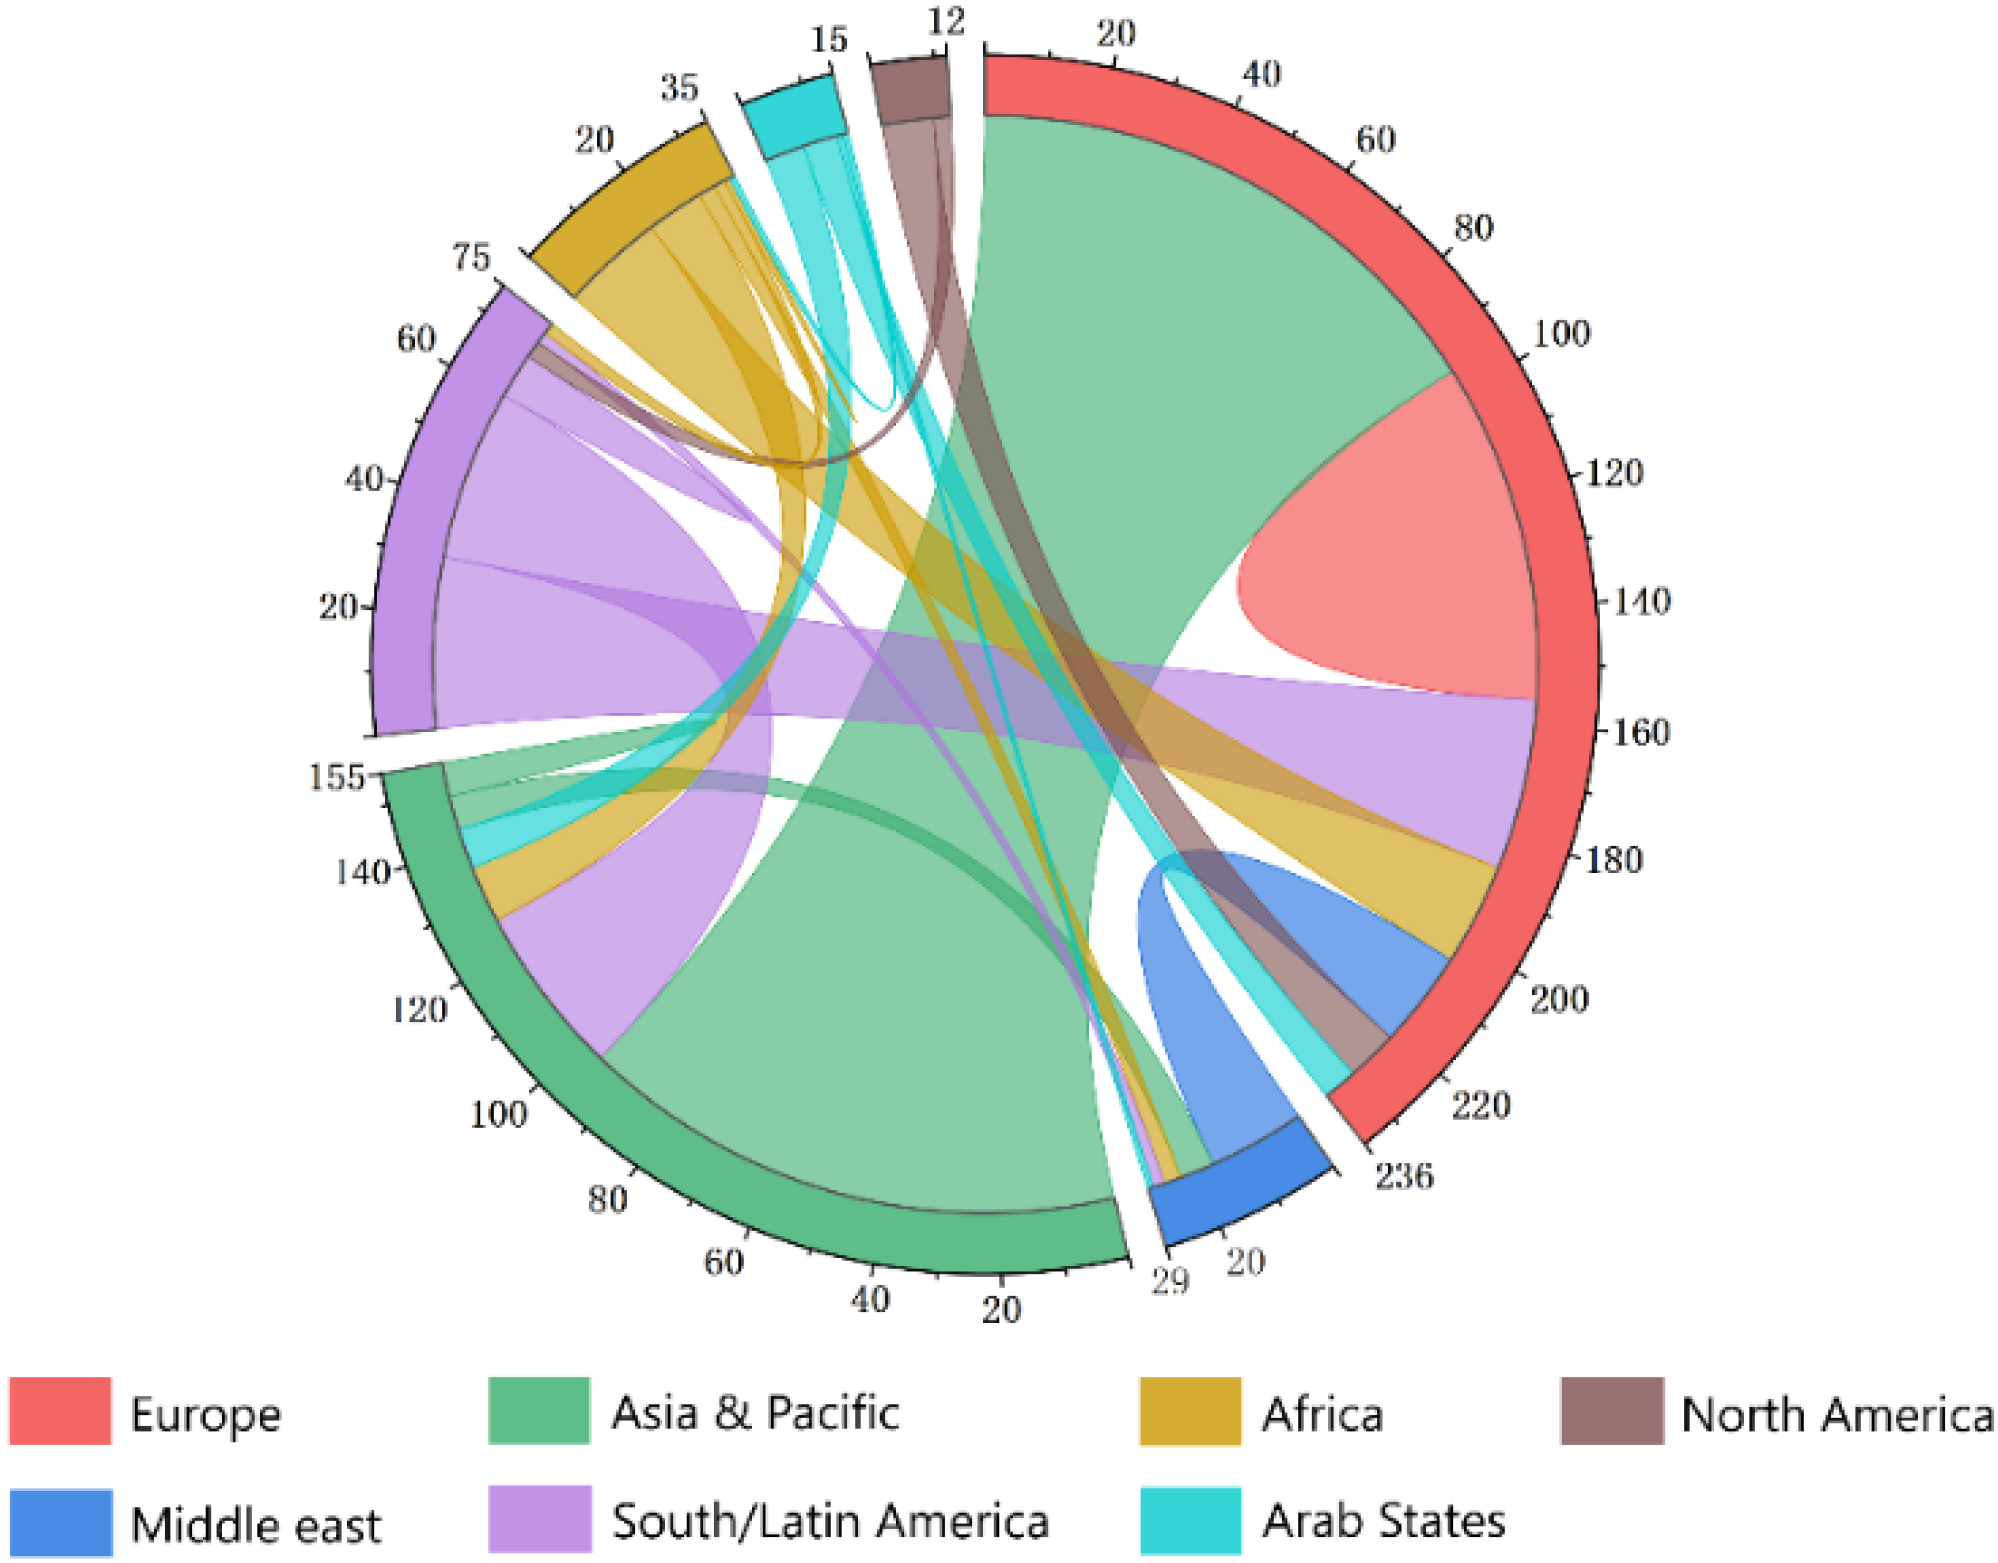
From the perspective of regional distribution (Figure 5), potential trade relations mainly include the following categories: Europe–Asia–Pacific (30.38%), Europe–Europe (18.99%), South America and Latin America–Europe (9.49), South America and Latin America-Asia–Pacific (9.49%), Europe–Africa (5.7%) and Europe–Middle East (5.38%), the remaining types of potential trade relations are less. Among them, the potential trade relations related to Europe are the most (74.68%), the Asia–Pacific region (30.38%) ranks second, and the other regions are South/Latin America (23.73%), Africa (11.8%), the Middle East (9.17%), Arab States (4.75%), and South America (3.8%) regions.
The reasons for the above potential links are as follows: (1) Europe is one of the leading sources of global plastic waste exports [5]. After China’s ban, EU countries quickly shifted the export of plastic waste to other Asian countries [52,53]. At the same time, the number of reports about illegal transactions in the EU also increased sharply; countries such as Vietnam, Malaysia, and Laos have become destinations for legal and illegal waste from Europe [54]. The above reasons promote the possibility of establishing new trade relations in Europe, and there are more potential trade relations with countries in the Asia–Pacific region. (2) In 2020, the European Commission passed new rules, which completely prohibit the EU from exporting plastic waste to non-OECD countries, the rules will take effect on 1 January 2021 [55], which will greatly promote EU countries to treat plastic waste internally. The regional trade community formed within Europe has eased the impact of China’s import ban to a certain extent. In the future, plastic transactions in European countries will gradually deepen. (3) European and Asia–Pacific countries have always been important trading partners of South American and Latin American countries. The GPWT has a certain inertia, we predict that some new plastic waste trade relationships will be established in European, Asia–Pacific, and South and Latin American countries in the future. In addition, some scholars pointed out that after Asian countries have closed their borders to import plastic waste, these wastes may be transferred to Africa [56], and our prediction results show the same, there are a considerable number of potential trade relations between European and Asia–Pacific countries and African countries.
In summary, from the perspective of regional distribution, the future of the plastic waste trade will be dominated by European countries, among which European countries will strengthen the internal recycling and processing of plastic waste. In addition, the establishment of new relationships will focus on cross-regional trade. At the same time, plastic waste will continue to flow to countries in the Asia–Pacific region, Africa, the Middle East, and other regions.
4.3.2. Income Level Distribution of Potential Links to Plastic Waste Trade
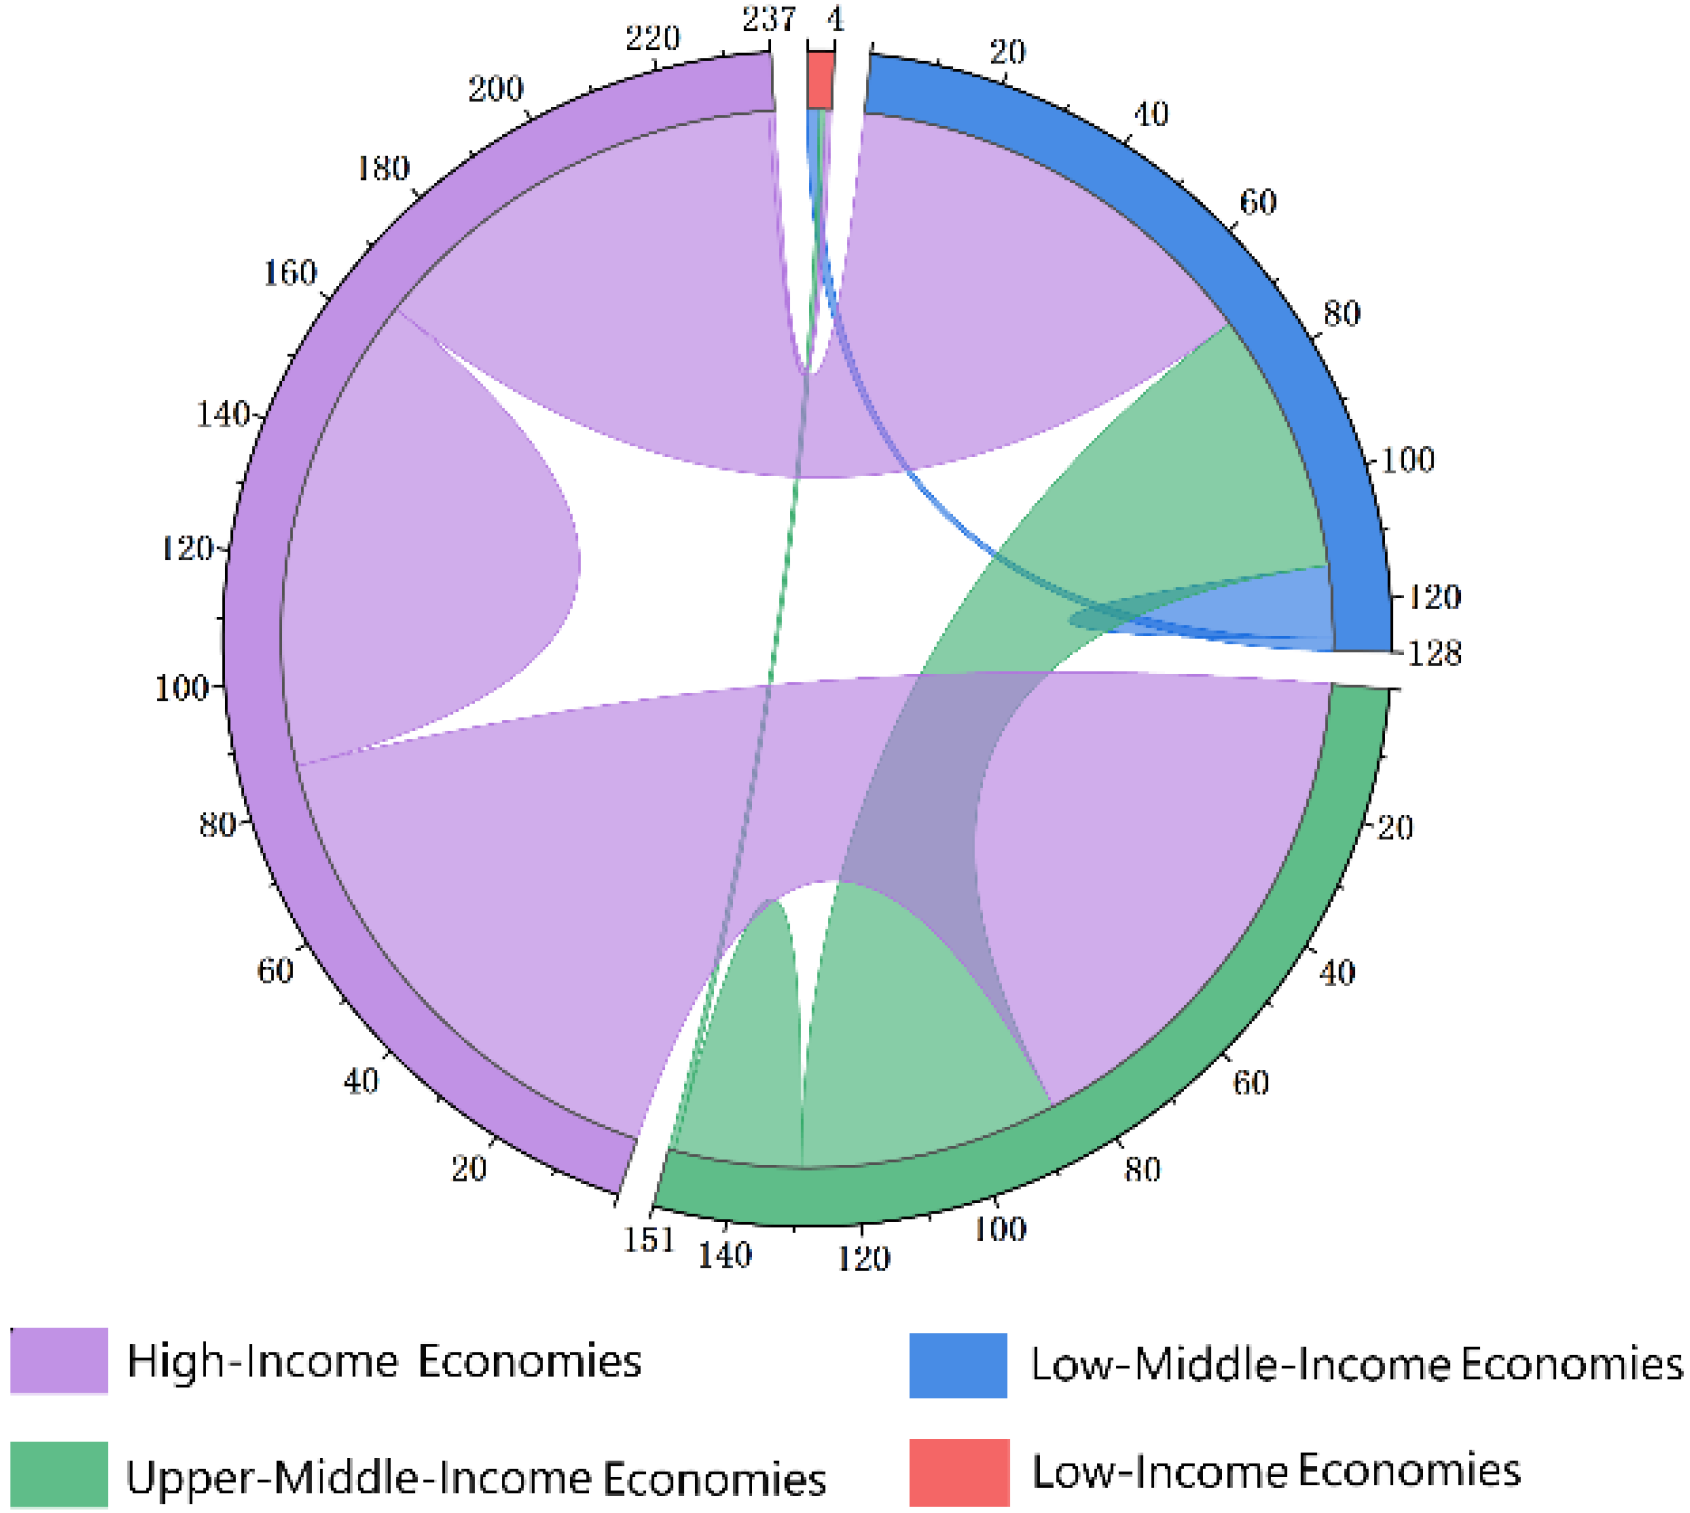
In addition, this research applies the countries’ income levels to analyze the potential links of the plastic waste trade. The results are shown in Figure 6 and the following results are obtained: (1) HICs are more motivated to establish new trade links, and trade links between HICs will increase in the future, but trade links with NHICs will expand at a faster rate (HICs stands for High-Income Economies, NHICs stands for countries other than High-Income Economies, including Upper–Middle-Income Economies, Low–Middle-Income Economies, and Low-Income Economies); (2) In the future, plastic waste links between NHICs will maintain a slow growth trend. The reasons for the above results are: (1) Affected by the implementation of the Basel Convention Plastic Waste Amendments and plastic waste bans in Asian countries, it is increasingly difficult for HICs to export waste to previous destinations (China, Indonesia, Malaysia, etc.). This will promote the establishment of recycling facilities in the country and improve its waste processing and recycling capabilities. However, due to the reliance of some developed countries on waste exports, the recovery capacity cannot be greatly improved in a short period, prompting some HICs to export plastic waste to HICs (such as the United States, etc.) with strong waste disposal capabilities and find new low-value plastic waste recipient countries (NHICs), while NHICs with low levels of environmental supervision tend to be its first choice. In addition, the existence of the form of re-export trade allows HICs with tariff advantages to use this form of trade to have plastic waste trade with other HICs. Take Latvia as an example, although the country produces almost no plastic waste, and its imported plastic waste imports far exceed its processing capacity, Latvia is still a transit port for other economies to export plastic waste to China and other Asian countries [2]. (2) With the economic growth of NHICs, the scale of urban middle-class consumers in these countries is also expanding, and plastic waste generated by consumption has become an important part of the resource recycling chain. Some middle- and high-income countries (such as Malaysia, Turkey, etc.) and low- and middle-income countries (such as India, Vietnam, etc.) regard some waste as resources, which promotes the growth of plastic waste trade among NHICs, for example, most large e-waste comes from non-OECD countries [57], and the scale of plastic waste trade among NHICs will expand in the future.
In general, from the perspective of the distribution of national income levels, the potential links of plastic waste trade are dominated by HICs, and plastic waste trade between NHICs is slowly expanding. In the future, there will still be ecologically unequal exchange relations between HICs and NHICs. The HICs environment benefits from trade with NHICs, and some NHICs have to bear the burden of environmental degradation. In addition, with the continuous improvement of waste supply chains among NHICs, it will promote NHICs to trade plastic waste with each other.
4.4. QAP Results Analysis
4.4.1. QAP Correlation Analysis
QAP correlation analysis is based on the permutation of element values in the matrix. By comparing the corresponding lattice values in two (or more) squares, the correlation coefficient between two (or more) matrices is obtained, and the correlation coefficient is tested by parameter. Table 3 shows the correlation coefficients between various influencing factors and the potential link network of plastic waste trade. and indicate the probability that the correlation coefficient obtained by random replacement is greater than or less, respectively, than the actual value. It can be observed from Table 3 that the correlation coefficients of , , and all pass the significance level test, indicating that these four variables are significantly affect the establishment of new relationships in the plastic waste trade. Among them, the correlation of , , and is positive, indicating that they are positively correlated with the establishment of the new plastic waste trade relationship, and these factors are conducive to the new trade relationship establishment. The correlation coefficient of is negative, indicating that the difference in tariff rates may inhibit the establishment of new relationships in the plastic trade network. The correlation coefficient of and is positive but not significant, indicating that the distance between countries and the plastic waste annual output difference matrix is not prominent. There may be two reasons for this, on the one hand, Asia is the main importing country, Europe and North America are the largest source countries of plastic waste [5], and the geographical distance is relatively long. Therefore, the trans-regional nature of the plastic waste trade causes the geographical distance to not have a significant impact on potential links to plastic waste trade. On the other hand, geographical proximity is becoming less and less important for the plastic waste trade at this stage [58]. In addition, it does not mean that countries such as India and Turkey, who produce huge amounts of plastic waste every year, will export to countries that produce less plastic waste. This may be the main reason why the correlation between and is not significant.
Further QAP correlation analysis was performed on the four variables that are significantly related to the potential link matrix of plastic waste trade. From Table 4, it can be seen that except and , , and are irrelevant, while the other variables are all significantly correlated. It shows that these four factors may have overlapping effects on , and the QAP method can better deal with the “multicollinearity” problem between these influencing factors.
4.4.2. QAP Regression Analysis
Using UCINET software to perform QAP regression analysis on four variables significantly related to the potential link relationship matrix of plastic waste, and the number of random replacements was set to 5000. The specific regression results are shown in Table 5. The regression coefficient of is significantly positive, indicating that the expansion of the difference in the level of economic development will increase the possibility of establishing a new plastic waste trade relationship. is significantly positive at the 1% level, indicating that differences in shipping levels contribute to the production of potential links in the plastic waste trade. is negatively correlated with , and passed the 5% statistical significance test. It shows that the greater the difference in tariff rates between the two countries, the less conducive to the establishment of new plastic waste trade relations, that is, the level of tariffs inhibits the creation of new links in the plastic waste trade. The final factor is significantly positive at the 10% level, indicating that the widening gap in the level of plastic inadequately managed has a positive impact on the establishment of a new relationship in the plastic waste trade.
5. Discussion
(1) Plastic waste trade has a certain degree of stability and sustainability
Although the trade relations between some countries will disappear due to the bans of various countries, there is still a potential trend of generating new links of the same type (by comparing Figure 5 and Figure 6 with Figure A1 and Figure A2 in Appendix B, we can see that the distribution of potential links in the plastic waste trade is roughly the same as the real distribution of plastic waste trade in 2019. Affected by the ban, some trade relations will disappear, but there is a potential trend of generating links of the same type as the original network, which also makes the plastic waste trade have a certain degree of stability and continuity). Compared with 2018, in 2019, 102 export trades from Europe to the Asia–Pacific region no longer exist, but 81 new export links have also emerged. Take the United Kingdom as an example. In 2018, the United Kingdom exported a total of USD1.52 million of plastic waste to Cambodia, Bangladesh, and Turkmenistan. Although the United Kingdom no longer exports plastic waste to these countries in 2019, it has established new trade relations with other regions or countries in the Asia–Pacific region (including Taiwan–China, Brunei, Laos, and six other regions), and exported a total of USD7.85 million of plastic waste to them (Obtained by collating data in the database of the UNCTAD).
The same is true for the impact of international conventions, even if the Basel Convention Plastic Waste Amendment incorporates plastic waste into a legally binding framework to make plastic waste trade more transparent and easier to supervise. The conventions also try to reduce the plastic waste trade from HICs to NHICs. However, they will still allow HICs to transport plastic waste that is difficult to recycle to NHICs [59]. After the amendment was formally implemented, the European Union, the United Kingdom, Japan, and Canada initially reduced their plastic waste exports to non-OECD countries in January 2021, but subsequent exports have been steadily increasing [60]. The prediction results and practice show that international or national conventions or bans can only show a certain degree of restraint, and it is difficult to truly eliminate the plastic waste trade, and the plastic waste trade will still exist, driven by a variety of factors.
(2) New plastic waste trade relations will be established in the future
Of the 316 plastic waste trade relationships that are most likely to occur in the future (Figure 5 and Figure 6), we found that from a regional perspective, the potential trade relations of plastic waste are mainly cross-regional, and plastic waste may continue to be exported to Asia–Pacific, Middle East, Africa, and other regions with weaker plastic waste supervision, which has been predicted many times. Among them, India, Indonesia, Pakistan, Vietnam in the Asia–Pacific, the United Arab Emirates in the Middle East, and South Africa and Nigeria in Africa have been predicted more often. In addition, European countries will also increase the plastic waste trade and waste treatment in the region. However, one thing that should be paid attention to is that the share of plastic inadequately managed in Ukraine is as high as 49% [51]. Due to the ban, Ukraine’s imports of plastic waste in 2019 increased by 12.9% year-on-year, and 78% of plastic waste imports came from countries in other European regions. According to our forecast, Ukraine will establish new trade relations with eight European countries including France (NO.13), Portugal (NO.40), and Switzerland (NO.66) in the future. Although Ukraine’s imports of plastic waste will drop sharply in 2020, it is still necessary to be vigilant to avoid excessive imports of plastic waste from imposing a burden on domestic waste management.
From an economic perspective, the potential links of plastic waste trade are dominated by HICs, and contain a large number of potential trade relations between HICs and NHICs. This reflects that the unequal relationship at an economic level eventually leads to the unequal exchange relationship on an ecological level, and it will continue, which is consistent with the research conclusions of Barnes (2019) [24]. At the same time, the plastic waste trade between NHICs will also expand in the future. For example, from the forecast, Brazil may establish new plastic waste trade relations with nine NHICs, including Indonesia (NO. 1), India (NO. 5), and Peru (NO. 10) in the future.
(3) Factors influencing the establishment of new relationship of plastic waste trade
By testing six factors, we finally found the difference in economic level between countries (), difference in liner shipping connectivity index (), and difference in share of plastic inadequately managed () have a positive impact on the establishment of new plastic waste trade relations, while the difference in tariff levels () has a negative impact on it.
The economic level difference and potential trade relationship have been discussed in Section 4.3.2. This is mainly due to the market mechanism and the inequality of economic development that drives low-income countries (LICs) to receive plastic waste from countries with higher economic development levels. In the end, HICs increased the recycling rate of plastic waste, and LICs received capital and production resources, but in practice they also brought plastic waste pollution.
The results of the difference matrix of liner transportation connectivity are contrary to traditional beliefs. Scholars generally agree that liner transportation connectivity is a key determinant of bilateral trade [61]. Lower liner transportation connectivity will increase trade costs [62]. Obviously, this does not apply to the plastic waste trade. In the future, it is still a favorable option for HICs to ship plastic waste to NHICs with low liner transportation connectivity. Transportation convenience and transportation costs have weaker restrictions on the establishment of new relationships in the plastic waste trade.
In addition, from the results, the plastic waste trade has the potential to establish new trade relations between two countries with large differences in share of plastic inadequately managed. In reality, after China’s ban, a large amount of plastic waste flows to Malaysia, Thailand, Indonesia, and other regions. After the strengthening of control in these countries, plastic waste begins to flow to other areas with weak environmental regulations, such as Africa, which is also the only region where imports have increased in 2019. It can be seen that under the pressure of the cost of plastic waste treatment, there will still be countries with high waste management levels in the future choosing to transport plastic waste overseas in order to increase the recycling rate. Countries with low levels of waste management often do not have sound domestic environmental regulations and become the preferred destination. If the characteristics of the new relationship established by the plastic waste trade continue and is not regulated, it will have a huge impact on the environment and ecology of areas with high levels of poor waste management.
Finally, the current import tariffs on plastic waste in various countries are generally very low (5–6% on average) [19]. Judging from the QAP inspection results, raising the tariff level has a depressing effect on the establishment of a new relationship in the plastic waste trade. On the one hand, countries can curb plastic waste imports by raising tariffs. On the other hand, for countries that want to continue to import large amounts of plastic waste to meet domestic production needs, they can also consider formulating reasonable import taxes specifically for domestic solid waste infrastructure.
6. Results
The existing research seldom pays attention to the future trend of the GPWT. In order to fill this gap, this article uses link prediction methods and QAP technology to predict the new relationships that may be established in the future plastic waste trade, and deconstruct the implicit information of the forecast results from multiple angles to answer the global question of the future development trend of the plastic waste trade. This is conducive to the governance of the global plastic waste problem, deepens the understanding of the plastic waste trade, and enlightens the settlement of plastic waste trade disputes.
The main findings are as follows: First of all, the plastic waste trade has a certain degree of stability and continuity. Although some links will disappear under the influence of national plastic waste bans and international conventions, there is still a potential trend of reconnection of the same type of links. Secondly, from the perspective of regional distribution, in addition to more potential links between European countries, other potential links are mainly cross-regional, and are mainly dominated by the European region. From the perspective of economic level distribution, although HICs will increase trade in plastic waste in the future, HICs and NHICs still have a high potential for establishing new trade relations. At the same time, NHICs will also expand the scale of trade in the future. This is mainly determined by the flow direction of the plastic supply value chain, the transfer direction of the plastic industry chain, and the inherent laws of the geo-economy. Finally, new plastic waste trade relationships are easier to establish between countries with wide differences in economic development, liner shipping connectivity index, and share of plastic inadequately managed. The greater the difference in tariff rates between the two countries, the less likely it is to establish new trade relations.
Global plastic waste pollution is a global governance issue, it should not satisfy the interests of some countries in the world while sacrificing the environmental needs of other countries. The current trade model has prompted NHICs to receive a large amount of low-quality plastic waste [22], and has had an incalculable impact on the environment and health [24]—this is also the main reason for the controversy in the plastic waste trade. However, the plastic waste trade should not be completely denied. The GPWT not only contributes to the recycling of resources and reduces global carbon dioxide emissions [22], it can also create new jobs for importing countries (recycling and restoration industries) [63]. In the future, the plastic waste trade will still exist. This requires the international community to guide the plastic waste trade in a true sense to promote the recycling and reuse of plastic waste on a global scale, adjust unreasonable trade patterns, and seek reasonable and sustainable development.
Based on the above conclusions, we put forward the following suggestions from three aspects:
First of all, the potential trade relationship of plastic waste has obvious cross-regional characteristics, which puts forward higher requirements for the traceability and transparency of future plastic waste trade. At present, the customs codes for plastic waste trade are only divided into four categories. In order to better track and control, the customs codes for plastic waste trade need to be classified in more detail, such as difficult-to-recycle and easy-to-recycle plastics, and distinguish between primary plastics and secondary plastics. By improving the classification of customs codes, countries can adjust their import and export policies according to their needs. They can also prohibit the domestic export of plastic waste categories that have been restricted abroad, strengthen customs supervision of waste, and avoid dumping or causing plastic waste abroad.
Second, the new plastic waste trade is easier to establish among countries with large differences in economic levels or share of plastic that is inadequately managed, this is mainly driven by the interests of countries and waste management needs. In order to adjust the unreasonable trade model and achieve source governance, the international community can consider starting with the producer responsibility system, including enterprises in the management of plastic waste, and encouraging enterprises to improve the durability and repeatability of products, thereby increasing the recycling rate and quality of recycling, and reducing the burden of waste management in various countries. Companies can also choose to entrust the responsibility of product recycling to third-party companies through payment, so as to promote the concentration of the plastic recycling industry chain, and enhance the ability of the industry to bargain upstream and downstream, and avoid inefficient competition. In addition, HICs can also provide NHICs with financial support, technical support, and international investment in waste management through international cooperation to improve the level of waste management in NHICs.
Finally, the regulatory role of tariffs can be brought into full play. By improving the classification of customs codes, countries can adjust tariffs on different types of plastic waste, such as lower tariffs on plastic waste with high recycling value, and higher tariffs on plastic waste with low quality or low secondary market value. To achieve the goal of reducing imports of low-value and mixed plastic waste, importing countries can also set up special funds based on import taxes for the construction and improvement of domestic waste management infrastructure.
Compared with other focuses on the impact of the ban on the plastic waste trade [5], this article re-examines the plastic waste trade from the perspective of relationship establishment. Our research conclusions show that bans and conventions can only curb the plastic waste trade to a certain extent—they have a certain degree of stability and continuity. After the impact of the ban, they still have the potential to continue to develop on the original trajectory. However, this research still has the following shortcomings:
On the one hand, the establishment of a new relationship in the GPWT is affected by many factors. The QAP model only affects some of the key factors on the potential link generation of the global plastic waste trade, and ignores the impact of factors such as disposal costs, environmental regulatory differences, political systems, and other factors. In particular, major sudden changes such as China’s waste ban, COVID-19, and the resultant soaring shipping costs could have a major influence on the network.
Although, the applied LNB-RA link prediction algorithm can better identify the contribution of different neighbors of the node through the role function, and mine the potential information of the GPWTN to a certain extent based on the network topology. However, there are still problems such as the limited prediction accuracy of the algorithm and the inability to fully explore the network growth mechanism and laws. In the future, a more accurate link prediction algorithm for the characteristics of the plastic waste trade will be designed for further research.
Author Contributions
Conceptualization, C.Z. and X.Q.; methodology, X.Q.; software, X.Q. and F.D.; validation, C.Z., X.Q. and J.W.; formal analysis, X.Q.; investigation, X.S. and X.Q.; resources, F.D.; data curation, X.S.; writing—original draft preparation, C.Z. and X.Q.; writing—review and editing, C.Z., J.W. and X.Q.; visualization, F.D.; supervision, X.S. All authors have read and agreed to the published version of the manuscript.
Funding
This research was funded by the National Natural Science Foundation of China (Grant No. 71901042).
Institutional Review Board Statement
Not applicable.
Informed Consent Statement
The study did not involve humans.
Data Availability Statement
The data used by the Institute are available at: United Nations Comtrade database (https://comtrade.un.org/data (accessed on 2 August 2021)), CEPII database (http://www.cepii.fr/CEPII/en/bdd_modele/presentation.asp?id=8 (accessed on 13 August 2021)), World Bank database (https://data.worldbank.org/indicator/IS.SHP.GCNW.XQ (accessed on 26 August 2021)), country-by-country breakdown data (https://www.itu.int/en/ITU-D/Statistics/Pages/definitions/regions.aspx (accessed on 26 August 2021)), Income level classification data (https://datahelpdesk.worldbank.org/knowledgebase/articles/906519-world-bank-country-and-lending-groups (accessed on 10 September 2021)). Specific data on 316 predicted potential plastic waste relationships can be contacted by corresponding authors.
Conflicts of Interest
The authors declare no conflict of interest.
Appendix A

Table A1.
Detailed data on AUC scores of the six algorithms from 2010 to 2019.
| AA | CN | RA | LNB-AA | LNB-CN | LNB-RA | |
|---|---|---|---|---|---|---|
| 2010 | 0.93464753 | 0.93024762 | 0.93952483 | 0.93689173 | 0.93373438 | 0.93962076 * |
| 2011 | 0.91726725 | 0.90838786 | 0.92732450 | 0.92266061 | 0.9171163 | 0.92898721 * |
| 2012 | 0.92310008 | 0.91764500 | 0.92817891 | 0.92674672 | 0.92320047 | 0.92859235 * |
| 2013 | 0.93286064 | 0.92892028 | 0.93736615 | 0.93607227 | 0.93433373 | 0.93790823 * |
| 2014 | 0.92328822 | 0.91779595 | 0.93024315 | 0.92528108 | 0.92203896 | 0.93100684 * |
| 2015 | 0.92820568 | 0.92158313 | 0.93892326 | 0.93515318 | 0.93093173 | 0.94010856 * |
| 2016 | 0.94807629 | 0.94362581 | 0.95258923 | 0.95028257 | 0.94691775 | 0.95298022 * |
| 2017 | 0.93464307 | 0.92877974 | 0.94467950 | 0.93923408 | 0.93439098 | 0.94512418 * |
| 2018 | 0.92851873 | 0.92174970 | 0.93544839 | 0.93203152 | 0.92877007 | 0.93773497 * |
| 2019 | 0.94431142 | 0.93901621 | 0.95073616 | 0.94534354 | 0.94122917 | 0.95103435 * |
Notes: * represent the significance levels of 10%.
Appendix B
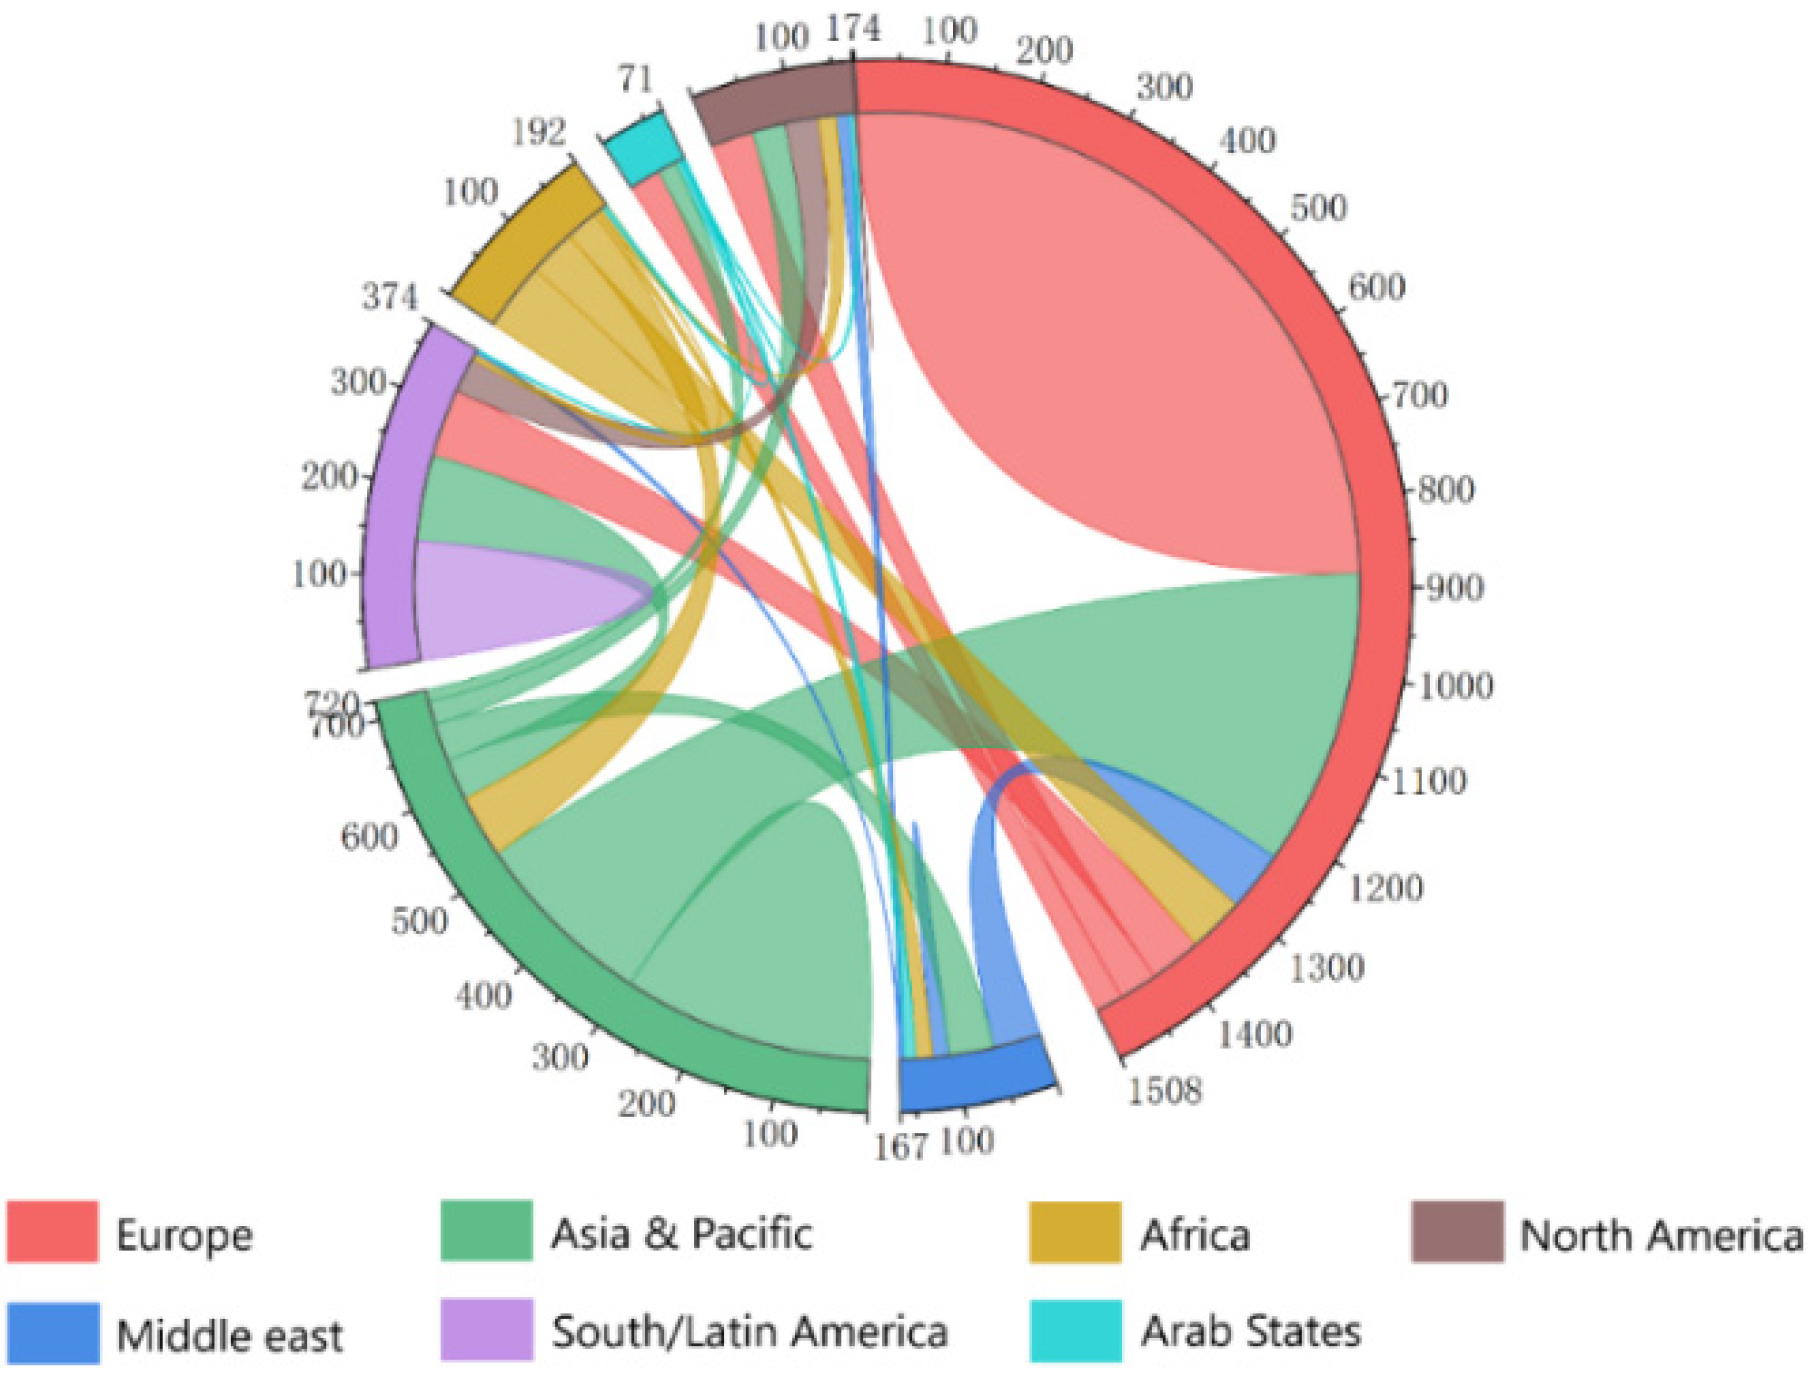
Figure A1.
Regional distribution map of GPWT in 2019.

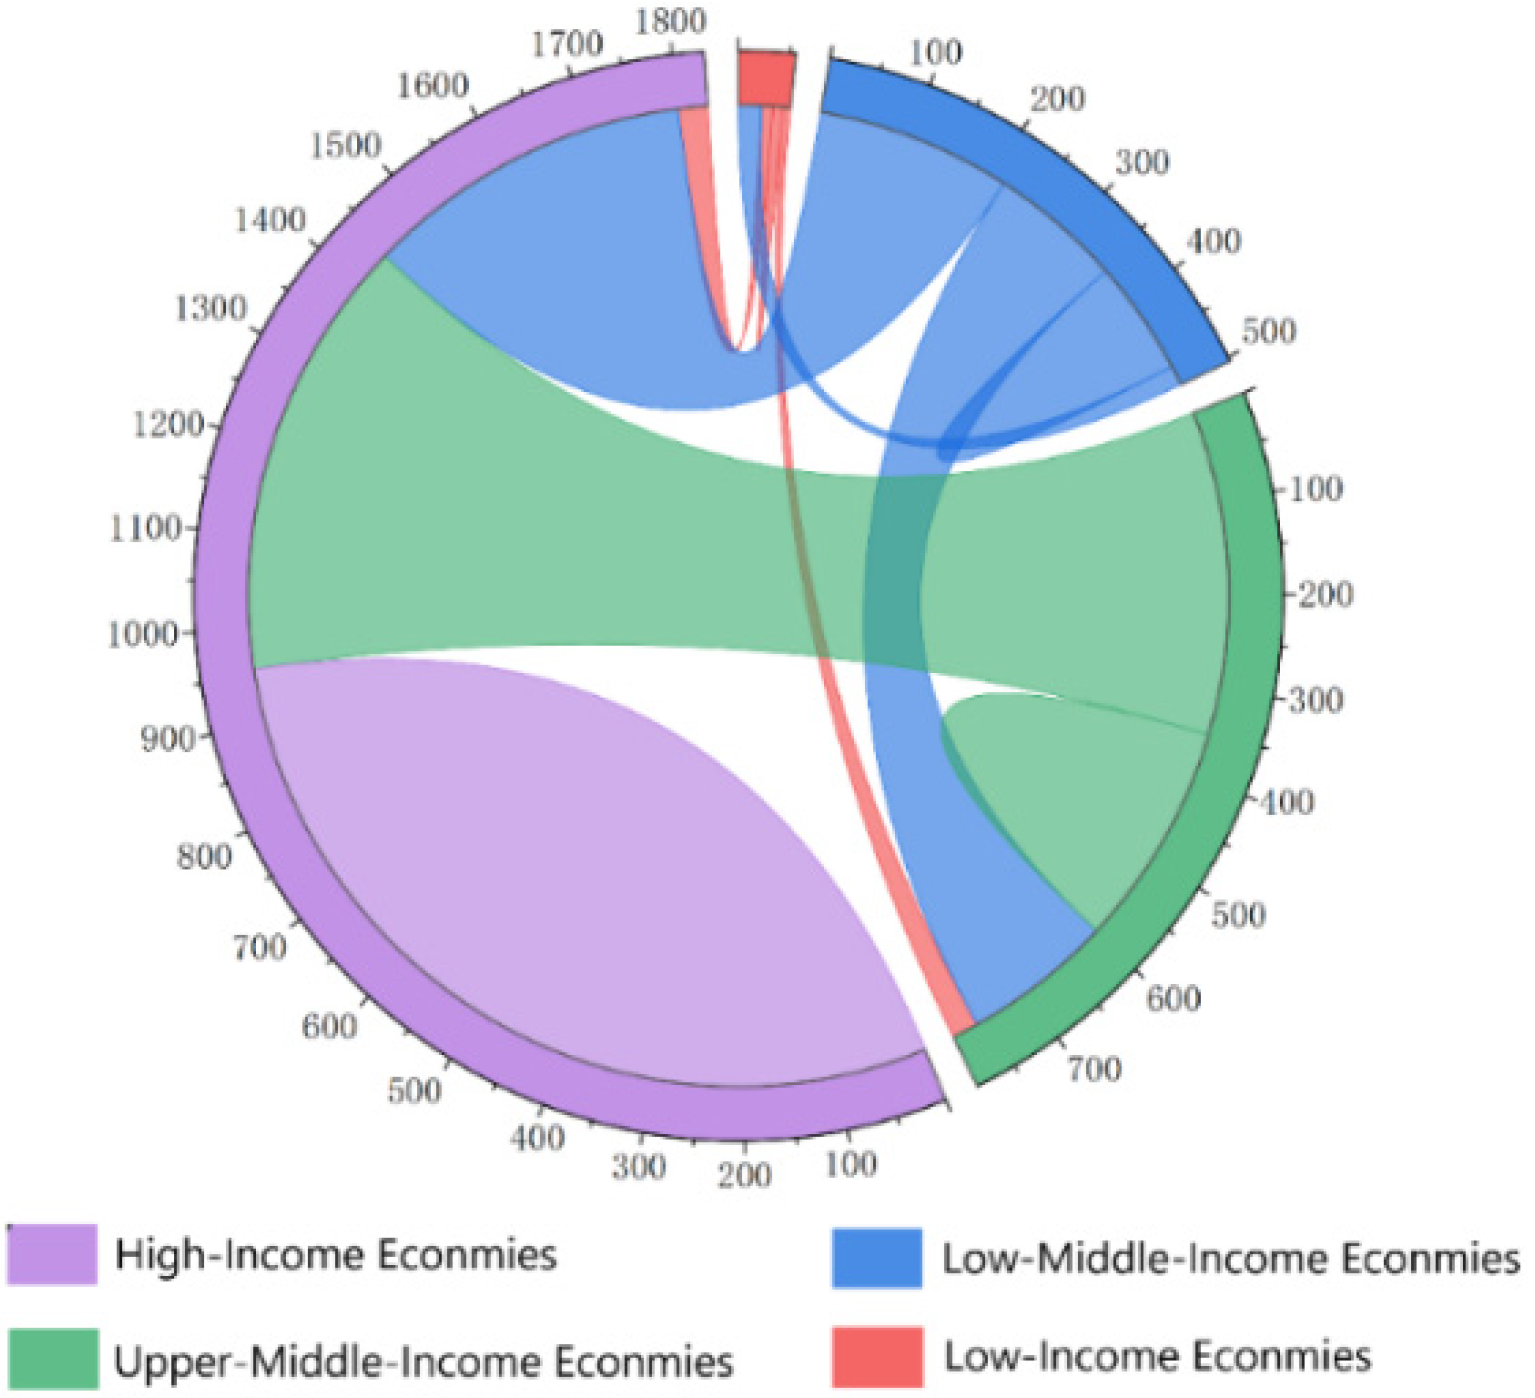
Figure A2.
Distribution of GPWT income levels in 2019.

References
- Brooks, A.L.; Wang, S.; Jambeck, J.R. The Chinese import ban and its impact on global plastic waste trade. Sci. Adv. 2018, 4, eaat0131. [Google Scholar] [CrossRef] [Green Version]
- Huang, Q.; Chen, G.; Wang, Y.; Chen, S.; Xu, L.; Wang, R. Modelling the global impact of China’s ban on plastic waste imports. Resour. Conserv. Recycl. 2020, 154, 104607. [Google Scholar] [CrossRef]
- Wang, W.; Themelis, N.J.; Sun, K.; Bourtsalas, A.C.; Huang, Q.; Zhang, Y.; Wu, Z. Current influence of China’s ban on plastic waste imports. Waste Dispos. Sustain. Energy 2019, 1, 67–78. [Google Scholar] [CrossRef] [Green Version]
- Liu, Z.; Adams, M.; Walker, T.R. Are exports of recyclables from developed to developing countries waste pollution transfer or part of the global circular economy? Resour. Conserv. Recycl. 2018, 136, 22–23. [Google Scholar] [CrossRef]
- Wang, C.; Zhao, L.; Lim, M.K.; Chen, W.-Q.; Sutherland, J.W. Structure of the global plastic waste trade network and the impact of China’s import Ban. Resour. Conserv. Recycl. 2020, 153, 104591. [Google Scholar] [CrossRef]
- Naayem, N. The Inherent Problem with the Global Plastic Waste Trade. Available online: https://rethinkplasticalliance.eu/news/the-inherent-problem-with-the-global-plastic-waste-trade (accessed on 21 November 2021).
- Dell, J. 157,000 Shipping Containers of U.S. Plastic Waste Exported to Countries with Poor Waste Management in 2018. Available online: https://www.plasticpollutioncoalition.org/blog/2019/3/6/157000-shipping-containers-of-us-plastic-waste-exported-to-countries-with-poor-waste-management-in-2018 (accessed on 22 November 2021).
- Gündoğdu, S.; Walker, T.R. Why Turkey should not import plastic waste pollution from developed countries? Mar. Pollut. Bull. 2021, 171, 112772. [Google Scholar] [CrossRef]
- Chen, H.L.; Nath, T.K.; Chong, S.; Foo, V.; Gibbins, C.; Lechner, A.M. The plastic waste problem in Malaysia: Management, recycling and disposal of local and global plastic waste. SN Appl. Sci. 2021, 3, 1–15. [Google Scholar] [CrossRef]
- Sasaki, S. The effects on Thailand of China’s import restrictions on waste: Measures and challenges related to the international recycling of waste plastic and e-waste. J. Mater. Cycles Waste Manag. 2021, 23, 77–83. [Google Scholar] [CrossRef]
- Dauvergne, P. Why is the global governance of plastic failing the oceans? Glob. Environ. Change 2018, 51, 22–31. [Google Scholar] [CrossRef]
- Liben-Nowell, D.; Kleinberg, J. The link-prediction problem for social networks. J. Am. Soc. Inf. Sci. Technol. 2007, 58, 1019–1031. [Google Scholar] [CrossRef] [Green Version]
- Shu-Xin, L.; Xin-Sheng, J.; Cai-Xia, L.; Hong, G. A complex network evolution model for network growth promoted by information transmission. Acta Phys. Sin. 2014, 63, 158902. [Google Scholar] [CrossRef]
- Dai, C.; Chen, L.; Li, B.; Li, Y. Link prediction in multi-relational networks based on relational similarity. Inf. Sci. 2017, 394, 198–216. [Google Scholar] [CrossRef]
- Pavlov, M.; Ichise, R. Finding experts by link prediction in co-authorship networks. FEWS 2007, 290, 42–55. [Google Scholar] [CrossRef]
- Assouli, N.; Benahmed, K.; Gasbaoui, B. How to predict crime—Informatics-inspired approach from link prediction. Phys. A Stat. Mech. Appl. 2021, 570, 125795. [Google Scholar] [CrossRef]
- Terekhov, I.; Evans, A.; Gollnick, V. Forecasting a Global Air Passenger Demand Network Using Weighted Similarity-Based Algorithms. In Complex Networks VII; Springer: Cham, Switzerland, 2016; pp. 335–347. [Google Scholar]
- Guan, Q.; An, H.; Gao, X.; Huang, S.; Li, H. Estimating potential trade links in the international crude oil trade: A link prediction approach. Energy 2016, 102, 406–415. [Google Scholar] [CrossRef]
- Pacini, H.; Shi, G.; Sanches-Pereira, A.; Filho, A.C.D.S. Network analysis of international trade in plastic scrap. Sustain. Prod. Consum. 2021, 27, 203–216. [Google Scholar] [CrossRef]
- Zhao, C.; Liu, M.; Du, H.; Gong, Y. The Evolutionary Trend and Impact of Global Plastic Waste Trade Network. Sustainability 2021, 13, 3662. [Google Scholar] [CrossRef]
- Shi, J.; Zhang, C.; Chen, W.-Q. The expansion and shrinkage of the international trade network of plastic wastes affected by China’s waste management policies. Sustain. Prod. Consum. 2021, 25, 187–197. [Google Scholar] [CrossRef]
- Liu, Z.; Liu, W.; Walker, T.R.; Adams, M.; Zhao, J. How does the global plastic waste trade contribute to environmental benefits: Implication for reductions of greenhouse gas emissions? J. Environ. Manag. 2021, 287, 112283. [Google Scholar] [CrossRef]
- Wen, Z.; Xie, Y.; Chen, M.; Dinga, C.D. China’s plastic import ban increases prospects of environmental impact mitigation of plastic waste trade flow worldwide. Nat. Commun. 2021, 12, 1–9. [Google Scholar] [CrossRef]
- Barnes, S.J. Out of sight, out of mind: Plastic waste exports, psychological distance and consumer plastic purchasing. Glob. Environ. Change 2019, 58, 1–9. [Google Scholar] [CrossRef]
- Kellenberg, D. The Economics of the International Trade of Waste. Annu. Rev. Resour. Econ. 2015, 7, 109–125. [Google Scholar] [CrossRef] [Green Version]
- Li, C.; Wang, L.; Zhao, J.; Deng, L.; Yu, S.; Shi, Z.; Wang, Z. The collapse of global plastic waste trade: Structural change, cascading failure process and potential solutions. J. Clean. Prod. 2021, 314, 127935. [Google Scholar] [CrossRef]
- Ren, Y.; Shi, L.; Bardow, A.; Geyer, R.; Suh, S. Life-cycle environmental implications of China’s ban on post-consumer plastics import. Resour. Conserv. Recycl. 2020, 156, 104699. [Google Scholar] [CrossRef]
- Cassing, J.H.; Van Long, N. Trade in trash: A political economy approach. Eur. J. Political Econ. 2021, 67, 101982. [Google Scholar] [CrossRef]
- Lu, L. Link prediction on complex networks. J. Univ. Electron. Sci. Technol. China 2010, 39, 651–661. (In Chinese) [Google Scholar]
- Wang, P.; Xu, B.; Wu, Y.; Zhou, X. Link prediction in social networks: The state-of-the-art. Sci. China Inf. Sci. 2014, 58, 1–38. [Google Scholar] [CrossRef] [Green Version]
- He, Y.-L.; Liu, J.N.; Hu, Y.-X.; Wang, X.-Z. OWA operator based link prediction ensemble for social network. Expert Syst. Appl. 2015, 42, 21–50. [Google Scholar] [CrossRef]
- Lei, C.; Ruan, J. A novel link prediction algorithm for reconstructing protein–protein interaction networks by topological similarity. Bioinformatics 2013, 29, 355–364. [Google Scholar] [CrossRef] [Green Version]
- Liu, S.; Dong, Z. Who will trade bauxite with whom? Finding potential links through link prediction. Resour. Policy 2019, 63, 101417. [Google Scholar] [CrossRef]
- Liu, S.; Dong, Z.; Ding, C.; Wang, T.; Zhang, Y. Do you need cobalt ore? Estimating potential trade relations through link prediction. Resour. Policy 2020, 66, 101632. [Google Scholar] [CrossRef]
- Zhang, Y.; Dong, Z.; Liu, S.; Jiang, P.; Zhang, C.; Ding, C. Forecast of International Trade of Lithium Carbonate Products in Importing Countries and Small-Scale Exporting Countries. Sustainability 2021, 13, 1251. [Google Scholar] [CrossRef]
- Yao, L.; Wang, L.; Pan, L.; Yao, K. Link Prediction Based on Common-Neighbors for Dynamic Social Network. Procedia Comput. Sci. 2016, 83, 82–89. [Google Scholar] [CrossRef] [Green Version]
- Soskolne, C. International transport of hazardous waste: Legal and illegal trade in the context of professional ethics. Glob. Bioeth. 2014, 14, 3–9. [Google Scholar] [CrossRef] [Green Version]
- Singh, J.B.; Lakhan, V.C. Business ethics and the international trade in hazardous wastes. J. Bus. Ethic. 1989, 8, 889–899. [Google Scholar] [CrossRef]
- Newman, M.E.J. Clustering and preferential attachment in growing networks. Phys. Rev. E 2001, 64, 025102. [Google Scholar] [CrossRef] [Green Version]
- Adamic, L.A.; Adar, E. Friends and neighbors on the web. Soc. Netw. 2003, 25, 211–230. [Google Scholar] [CrossRef] [Green Version]
- Zhou, T.; Lü, L.; Zhang, Y.-C. Predicting missing links via local information. Eur. Phys. J. B 2009, 71, 623–630. [Google Scholar] [CrossRef] [Green Version]
- Liu, Z.; Zhang, Q.-M.; Lü, L.; Zhou, T. Link prediction in complex networks: A local naïve Bayes model. EPL Eur. Lett. 2011, 96, 48007. [Google Scholar] [CrossRef] [Green Version]
- Fawcett, T. An Introduction to ROC analysis. Pattern Recogn. Lett. 2006, 27, 861–874. [Google Scholar] [CrossRef]
- UNCTAD. Global Plastic Trade 40% Bigger Than Previously Thought, Study Finds. Available online: https://unctad.org/news/global-plastic-trade-40-bigger-previously-thought-study-finds (accessed on 28 November 2021).
- Lebreton, L.; Andrady, A. Future scenarios of global plastic waste generation and disposal. Palgrave Commun. 2019, 5, 6. [Google Scholar] [CrossRef] [Green Version]
- Simpson, W. QAP: The Quadratic Assignment Procedure. In Proceedings of the North American STATA Users’ Group Meeting, Boston, MA, USA, 12–13 March 2001; pp. 12–13. [Google Scholar]
- Xia, X.; Zhou, Y. Performance Analysis of ACO on the Quadratic Assignment Problem. Chin. J. Electron. 2018, 27, 26–34. [Google Scholar] [CrossRef]
- De Benedictis, L.; Taglioni, D. The Gravity Model in International Trade. In The Trade Impact of European Union Preferential Policies; Springer: Berlin/Heildeberg, Germany, 2011; pp. 55–89. [Google Scholar]
- Yamarik, S.; Ghosh, S. A Sensitivity Analysis of the Gravity Model. Int. Trade J. 2005, 19, 83–126. [Google Scholar] [CrossRef]
- Okubo, T. The border effect in the Japanese market: A Gravity Model analysis. J. Jpn. Int. Econ. 2004, 18, 1–11. [Google Scholar] [CrossRef] [Green Version]
- Jambeck, J.R.; Geyer, R.; Wilcox, C.; Siegler, T.R.; Perryman, M.; Andrady, A.; Narayan, R.; Law, K.L. Plastic waste inputs from land into the ocean. Science 2015, 347, 768–771. [Google Scholar] [CrossRef] [PubMed]
- European Environment Agency. The Plastic Waste Trade in the Circular Economy. Available online: https://www.eea.europa.eu/publications/the-plastic-waste-trade-in (accessed on 28 November 2021).
- Zero Waste Europe. Changing Trends in Plastic Waste Trade: Plastic Waste Shipments Report. Available online: https://www.zerowasteeurope.eu (accessed on 29 November 2021).
- Dermatas, D.; Georganti, A. Plastic waste trafficking: An ever-growing environmental crime that needs to be tackled. Waste Manag. Res. 2020, 38, 1187–1188. [Google Scholar] [CrossRef]
- Directorate-General for Environment. Plastic Waste Shipments: New EU Rules on Importing and Exporting Plastic Waste. Available online: https://ec.europa.eu/environment/news/plastic-waste-shipments-new-eu-rules-importing-and-exporting-plastic-waste-2020-12-22_en (accessed on 29 November 2021).
- Babayemi, J.O.; Nnorom, I.C.; Osibanjo, O.; Weber, R. How Can the Plastic Waste Crises Be Solved in Africa? Available online: https://0-blogs-biomedcentral-com.brum.beds.ac.uk/on-society/2019/11/01/how-can-the-plastic-waste-crises-be-solved-in-africa (accessed on 30 November 2021).
- Gregson, N.; Crang, M. From Waste to Resource: The Trade in Wastes and Global Recycling Economies. Annu. Rev. Environ. Resour. 2015, 40, 151–176. [Google Scholar] [CrossRef] [Green Version]
- Xu, W.; Chen, W.-Q.; Jiang, D.; Zhang, C.; Ma, Z.; Ren, Y.; Shi, L. Evolution of the global polyethylene waste trade system. Ecosyst. Health Sustain. 2020, 6, 1–16. [Google Scholar] [CrossRef] [Green Version]
- Khan, S.A. Clearly Hazardous, Obscurely Regulated: Lessons from the Basel Convention on Waste Trade. AJIL Unbound 2020, 114, 200–205. [Google Scholar] [CrossRef]
- Champions of Environmental Health & Justice. European Union Export Data. Available online: https://www.ban.org/plastic-waste-project-hub/trade-data/eu-export-data (accessed on 27 November 2021).
- Fugazza, M.; Hoffmann, J. Liner shipping connectivity as determinant of trade. J. Shipp. Trade 2017, 2, 1. [Google Scholar] [CrossRef] [Green Version]
- Hoffmann, J.; Saeed, N.; Sødal, S. Liner shipping bilateral connectivity and its impact on South Africa’s bilateral trade flows. Marit. Econ. Logist. 2019, 22, 473–499. [Google Scholar] [CrossRef]
- Kettunen, M.; Gionfra, S.; Monteville, M. EU Circular Economy and Trade: Improving Policy Coherence for Sustainable Development. Available online: https://ieep.eu/uploads/articles/attachments/5ff0fcab-0726-4251-937b-aa91ba01a34e/EU%20trade,%20CE%20and%20sustainable%20development%20(IEEP%202019)%20FINAL.pdf?v=63773601091 (accessed on 29 November 2021).
Figure 1.
Example diagram of future link prediction under link prediction.

Figure 2.
Example diagram of data processing and link prediction steps.

Figure 3.
Evaluation of six algorithms from 2010 to 2019.

Figure 4.
Countries with potential plastic waste trade links; notes: The second column (Country A) and the third column (Country B) represent the top 10 potential trading country pairs in the LNB-RA algorithm for each year’s link score. If at least one green populate appears after the blue populates in a row, the potential link should be predicted effectively. On the contrary, it is an invalid prediction.

Figure 5.
Regional distribution map of potential links to plastic waste trade (Based on the top 316 potential links in the 2019 points ranking, and according to the national and regional classification standards of the International Telecommunication Union for drawing).
Figure 5.
Regional distribution map of potential links to plastic waste trade (Based on the top 316 potential links in the 2019 points ranking, and according to the national and regional classification standards of the International Telecommunication Union for drawing).

Figure 6.
Distribution of income levels in countries with potential links to plastic waste trade (Based on the top 316 potential links in the 2019 points ranking, and according to the national and regional classification standards of the International Telecommunication Union for drawing).
Figure 6.
Distribution of income levels in countries with potential links to plastic waste trade (Based on the top 316 potential links in the 2019 points ranking, and according to the national and regional classification standards of the International Telecommunication Union for drawing).

Table 1.
Variables involved in the six algorithms.
| Variable | Description |
|---|---|
| x | Country Node x. |
| y | Country Node y. |
| Γ(i) | The node connected to node i. |
| Kz | Number of countries with which country z has direct trade relations, i.e., the degree value of z |
| s | ‘s’ is a constant and represents the ratio of nonexistent edges to existing edges. |
| Rz | Role function for node z. |
Table 2.
Explanatory variables and descriptions.
| Variable Name | Variable Meaning | Calculation Method and Description | Data Sources |
|---|---|---|---|
| Gross domestic product (purchasing power parity) | Matrix of economic development level difference between i and j countries/USD | CEPII | |
| Geographical distance between countries | Geographic distance difference matrix between i and j national capitals/km | CEPII | |
| Liner Shipping Connectivity Index | Difference matrix of liner transportation connectivity index between i and j countries | The World Bank | |
| Tariff Rate | Matrix of difference in tariff rates between countries i and j | The World Bank | |
| Share of plastic inadequately managed | The difference matrix of the level of poor waste management in countries i and j | Jambeck et al., 2015 [51] | |
| Plastic waste generation | Difference matrix of annual plastic waste generation between countries i and j | Jambeck et al., 2015 [51] |
Table 3.
QAP correlation analysis between potential link matrix of plastic waste trade and six influencing factors; notes: *, **, and *** represent the significance levels of 10%, 5%, and 1%, respectively.
Table 3.
QAP correlation analysis between potential link matrix of plastic waste trade and six influencing factors; notes: *, **, and *** represent the significance levels of 10%, 5%, and 1%, respectively.
| Variable | Correlation Coefficient | ||
|---|---|---|---|
| 0.097 * | 0.091 | 0.909 | |
| 0.005 | 0.412 | 0.588 | |
| 0.061 *** | 0.001 | 0.999 | |
| −0.041 ** | 0.967 | 0.033 | |
| 0.030 * | 0.071 | 0.929 | |
| 0.031 | 0.129 | 0.871 |
Table 4.
QAP correlation analysis results of explanatory variables; notes: * and *** represent the significance levels of 10% and 1%, respectively.
Table 4.
QAP correlation analysis results of explanatory variables; notes: * and *** represent the significance levels of 10% and 1%, respectively.
| 1.000 *** | ||||
| 0.472 *** | 1.000 *** | |||
| 0.035 | −0.070 * | 1.000 *** | ||
| 0.078 * | 0.002 | 0.234 *** | 1.000 *** |
Table 5.
QAP regression results of potential link matrix of plastic waste trade; notes: *, **, and *** represent the significance levels of 10%, 5%, and 1%, respectively.
Table 5.
QAP regression results of potential link matrix of plastic waste trade; notes: *, **, and *** represent the significance levels of 10%, 5%, and 1%, respectively.
| Variable | Standardized Regression Coefficient | ||
|---|---|---|---|
| 0.036778 * | 0.091 | 0.909 | |
| 0.060861 *** | 0.002 | 0.998 | |
| −0.04095 ** | 0.966 | 0.034 | |
| 0.029900 * | 0.074 | 0.927 |
Publisher’s Note: MDPI stays neutral with regard to jurisdictional claims in published maps and institutional affiliations. |
© 2022 by the authors. Licensee MDPI, Basel, Switzerland. This article is an open access article distributed under the terms and conditions of the Creative Commons Attribution (CC BY) license (https://creativecommons.org/licenses/by/4.0/).
Share and Cite
MDPI and ACS Style
Zhao, C.; Qi, X.; Wang, J.; Du, F.; Shi, X. Predicting Possible New Links to Future Global Plastic Waste Trade Networks. Sustainability 2022, 14, 4692. https://0-doi-org.brum.beds.ac.uk/10.3390/su14084692
AMA Style
Zhao C, Qi X, Wang J, Du F, Shi X. Predicting Possible New Links to Future Global Plastic Waste Trade Networks. Sustainability. 2022; 14(8):4692. https://0-doi-org.brum.beds.ac.uk/10.3390/su14084692
Chicago/Turabian StyleZhao, Changping, Xinli Qi, Jin Wang, Fengyang Du, and Xiaolan Shi. 2022. "Predicting Possible New Links to Future Global Plastic Waste Trade Networks" Sustainability 14, no. 8: 4692. https://0-doi-org.brum.beds.ac.uk/10.3390/su14084692
Note that from the first issue of 2016, this journal uses article numbers instead of page numbers. See further details here.