
Do Knowledge Economy Indicators Affect Economic Growth? Evidence from Developing Countries


1
School of Economics, Wuhan University of Technology, Luoshi Road 122, Wuhan 430070, China
2
Department of Economic, Faculty of Commerce, Benha University, Benha 13511, Egypt
*
Author to whom correspondence should be addressed.
Sustainability 2022, 14(8), 4774; https://0-doi-org.brum.beds.ac.uk/10.3390/su14084774
Submission received: 20 February 2022
/
Revised: 30 March 2022
/
Accepted: 8 April 2022
/
Published: 15 April 2022
(This article belongs to the Special Issue Contemporary Issues in Applied Economics and Sustainability)
Abstract
:The competitiveness of national economies is increasingly dependent on their ability to produce and use knowledge, as knowledge, education, and innovation are the main indicators of economic growth in a globalizing world. Many countries have adopted policies related to the production of knowledge and its transformation into wealth that stimulates the growth and competitiveness of their economies. Through our study, we measured some knowledge economy (KE) variables for a sample of 20 developing countries. During the period (1996–2020), using panel data, the estimate was made using three models: the cumulative regression model, the fixed-effects model, and the random-effects model. The results of the statistical tests indicated that the fixed-effects model is the appropriate model, and that the estimates of the proposed model parameters do not contradict the assumptions of economic theory, nor do they contradict the practical reality. In addition, the results showed that 93% one of the changes that occur in economic growth in the developing countries under study is due to the dependence on the knowledge economy. It became clear through the study that the use of cross-sectional time-series models increases the accuracy of statistical forecasting, because it considers the information with a time dimension in the time series, as well as the cross-sectional dimension in different units. Our study found a positive impact on economic growth of the internet and mobile phone users, control of corruption, political stability, foreign direct investment, and the total value of international trade. Additionally, spending on education, patents for residents, and trade openness had a negative impact on economic growth. Accordingly, the knowledge economy in developing countries contributed greatly to their economic growth and had a prominent role in maintaining high rates of growth for decades. Our study contributes by expanding the scope of developing countries in deciding to focus on the important indicators in the knowledge economy (KE), so that they can increase the added value of their economic growth.
1. Introduction
Considering the new global changes and the accompanying spread of the phenomenon of globalization, a new economy has evolved that leads society towards progress and sophistication, moving from the idea of survival of the fittest to the idea of survival of the fastest. Thus, knowledge and information technology replace capital and become considered a key and an essential engine for economic growth. On top of that, over the past few decades, scientific and technological progress and the great spread of information and communication technologies have contributed to a major change in the structure of economic life, and knowledge has become the main factor in production after work and capital, and knowledge has played the main role in creating value added. Therefore, the knowledge economy has changed the basic parameters of people’s social life, and in a short period, it has achieved success that humanity had not previously achieved and reshaped the tendencies of individuals; whereas food, clothing, and shelter were once people’s highest aspirations, now they are looking forward to a better quality of life. Modern means of communication have emerged, such as smartphones, the Internet, and social media through various applications; transportation has developed, becoming more rapid and comfortable; remote shopping, remote study, and telemedicine have also appeared. The reliance on robots and machines have greatly increased, while the life expectancy of people has increased, deaths have decreased, distances have decreased, and new technologies have appeared that will completely change the face of the earth, such as artificial intelligence, 3D printing, genetics, big data, etc., and this will cause a great revolution, which will be faster and larger than previous revolutions [1,2,3].
Online interconnection and the constant exchange of information between different systems have created vast amounts of data available for analysis. Additionally, this “big data” is constantly increasing in size and needs sophisticated tools, called data analytics, to try to produce relevant information. With the rapid development of information technologies, such as cloud computing, mobile Internet and the Internet of Things, and the enhancement of IT applications, all types of data are quickly created and aggregated in different ways. Big data is seen as a game-changing tool capable of revolutionizing the way countries work in many industries, and therefore this will certainly affect economic science as one of the social sciences highly sensitive to any changes in the surrounding environment; therefore, policy makers in the country should expect these changes to result from technological development, which necessitate new standards and methods for data collection and analysis.
All countries, especially developing countries, are facing unprecedented opportunities and challenges, according to the nature and advantages of big data; therefore, ways must be explored to deal with the challenges of big data, which represents a growing market estimated at USD 67 billion by 2021, with analytics data programs being the market leader. More than 98% of the information stored around the world is electronic, and the business community has accepted this new type of information because it may be useful. The traditional methods of data analysis are no longer useful, and thus new and advanced tools are needed, and data analysis programs provide these tools [4]. Additionally, investing in big data can support and enhance the ability of investors to make decisions by improving the quality of the data that is obtained [5]. Since the advent of the term big data, researchers have not agreed on its definition. Some see big data as large-volume, high-speed, and diversified information assets that require innovative forms of information processing in order to support decision making [6,7]. Some have defined it as data that cannot be stored or analyzed by traditional hardware and software [8]. Some see it as data sets whose size exceeds the ability of typical database programs to capture, store, manage, and analyze [9]. As defined by the International Organization for Standardization (ISO), big data is “a set or sets of data that have properties such as size, speed, variance, variance, validity of the data, etc. that cannot be efficiently processed using current and traditional technology to benefit from.” Smeda sees huge amounts of data at a high speed, complex and ever-changing, requiring advanced technologies that enable information capture, storage, distribution, management, and analysis [10]. Therefore, researchers can conclude that big data is a huge amount of complex data that is characterized by high levels of diversity, magnitude, and speed. It may be in the form of notes, regular numbers, letters, words, analog signs, pictures, percentages, shapes, engineering, or symbols. It may be in the form of a visual or audio clip, and it is recorded, and therefore its storage media differs from the usual, and it can only be benefited from after being processed by high-tech information systems capable of converting these different types of data into useful information that can be used in making decisions.
Just as the transformation occurred in the inclinations and habits of individuals, it also occurred in the priority of production, resulting in the generation of companies of a new character, which are at the forefront of the economic scene, such as companies in the technical and service sectors such as Microsoft, Apple, Amazon, Alphabet, Facebook, Ali baba). Moreover, giant companies have retreated in industries such as automotive, oil and gas, and others. From this transformation, physical capital has shrunk dramatically and has been replaced by human capital; these two sectors (physical and human) differ in terms of the number of workers, the area of factories, and the machines that are used for production. This change leads us to the fact that the era of scarcity and dependence on natural materials and energy is over. There is no room for scarcity in this economy. Knowledge, creativity, and innovation are constantly evolving, because they are related to the human element, which increases with experience over time, thanks to education and training [11]. The relationship between spending on education and economic growth has received clear attention in the economic literature, translated into several applied studies that tried to examine the relationship between them, and these studies included many developed and developing countries, but there was no clear pattern on the empirical results of these studies; there is a group of studies which found evidence that there is a strong positive relationship between the rates of spending on education at various levels (intermediate, secondary, and higher) and the rates of economic growth achieved in most countries, especially countries that have given more financial allocation to this sector. Moreover, there is a causality that extends from spending on education towards the economic, and one of these studies is the Schaltz study, which aimed to establish the impact of education on economic growth in the United States of America, by raising the efficiency and productivity of the workforce. Additionally, studies (R. M. Solow, and ٗAbiodun, found the importance of the (remaining) factors, other than capital and labor factors, in increasing production and achieving economic development. Education, knowledge, technological progress, and scientific research represent the largest part of them. Through his study on the economics of agricultural production, which he conducted on the American economy, he concluded that the productivity of the individual per hour doubled, and he concluded that the remaining factors have a significant role in increasing production [12,13].
The Denison study, which was conducted on the American economy with the aim of measuring the contribution of education to economic growth, also concluded that education contributes about 15% to economic growth. Hicks also discussed the possibility of a positive relationship between the two variables. The study confirmed that the countries that achieved the highest economic growth rates have had the highest rates of enrollment in education, such as South Korea [14].
There are also other studies that confirmed the existence of a negative relationship between the two variables. We find Jeffrey Kouton’s study aimed at analyzing the relationship between spending on education and economic growth in Côte d’Ivoire during the period from 1970 to 2015. The study used the auto regressive distributed lag (ARDL) method to study the relationship between spending on education and economic growth in the short and long term. It concluded that there is a long-term negative impact of government education expenditure on economic growth during the study period, and there is a positive impact of government education expenditure on economic growth in the short term [15]. The authors believe that spending on education may have a negative impact, especially in developing countries, because these countries still need a strong infrastructure for education, especially in light of the fourth industrial revolution that depends on human power and not material capital; therefore, they need more spending on education until it comes to fruition, which is also the case in most developing countries, especially a group of the study sample that cannot specialize in the proper distribution of spending on education.
On the other hand, the size of the knowledge economy has witnessed a clear growth in recent times, and even though there are some difficulties in estimating the size of these sectors, most studies have estimated that size using the percentage of the knowledge economy sectors’ contribution to the GDP. According to United Nations estimates, knowledge economies contribute at least 7 percent of global GDP and grow at least 10 percent annually [16].
Thus, the knowledge economy works to achieve a high level of social and economic development and competitiveness, and it has been shown that a successful transition to a knowledge economy usually involves such elements as long-term investments in education, the development of innovation capacity, the modernization of information infrastructure, and the existence of an economic environment conducive to market transactions. In fact, organizations and companies are gaining value from intellectual assets, rather than physical and knowledge goods. For all this, the general view of knowledge has changed, and it has become a commodity and an end that demands for itself [17]. Therefore, the world is dealing with knowledge industries whose products are ideas, data its raw materials and the human mind its tool, to the extent that knowledge has become the main component of the contemporary economic and social system. From this point of view, humanity is now on the threshold of a new era in which innovation injection procedures and the convergence of high technology play a key role in accelerating the movement of knowledge, pumping, and spreading it through the waves of globalization. In this context, the concepts of the digital economy and e-commerce have emerged, in which knowledge is the core and the main driving force. Moreover, we seek, through this study, to prove the positive role of the knowledge economy in economic growth, and that knowledge is the basis of the great development taking place in the world now, and that it is the main factor in sustaining economic growth in the long run. In doing so, we seek to prove that the progress achieved by developing countries and the high rates of growth witnessed during previous periods are primarily due to the knowledge economy. Indeed, theoretically, it has been shown that knowledge has a significant role in improving productivity and increasing economic growth, Studies on this topic have shown that the knowledge economy has a significant impact on the economic growth of countries. Therefore, in our study here, we will apply this to developing countries and try to answer the following problem:
To what extent does the knowledge economy contribute to the economic growth of the developing countries selected for the study?
The purpose of the current research is to analyze the knowledge economy indicators that influence economic growth in the context of developing economies. From the main objective, a set of sub-goals stem, namely:
- Highlighting the components of the knowledge economy;
- Shedding light on the theory of modern growth in the knowledge economy;
- Presentation and analysis of the most prominent effects of the knowledge economy on local production.
The selection of the group of developing countries in this study was not a random choice but was based on several reasons, including the solution to the problem of low economic growth in them, through the process of collecting the necessary information and data related to this problem, analyzing it, and extracting accurate results from it. This may lead to extracting a solution to this problem, through the indicators of the knowledge economy. In addition, the application of the knowledge economy is a new issue, so it is worth the effort that the authors make in preparing the different stages of research. In addition, among the reasons for choosing the research topic is the authors’ personal preference for knowledge and skills acquisition in the aspect of the impact of the knowledge economy on growth, with a focus on the economy of a developing country. This is in addition to the fact that the selected country group was based on several knowledge economy indicators that qualified it to be a promising example for countries on their way to economic growth.
The originality of the current research comes from the fact that the permanent controversy of the quest to increase the rate of economic growth, and the policies stimulating it, and the need to search for everything new that supports it are among the most important things in recent years. Especially in light of the increasing “digital divide” and knowledge gap between developed and developing countries, as well as the emergence and clarity of more characteristics and advantages related to the knowledge economy, which impact in different ways between different countries, the knowledge economy is one of the most important challenges facing growth in developing countries. As for the economies of developing countries, we find that they suffer from a decline in economic growth rates compared to other developed countries, coupled with high rates of population growth and unemployment rates as well as an increase in the possibilities of a decline in the relative status of the knowledge economy in some developing countries in the wake of the various economic and political crises faced by those countries. Like the coronavirus crisis, this can be attributed to the lack of a reliable technological infrastructure in times of crisis.
The study is also an attempt to contribute to the debate about the knowledge economy and its role in achieving economic growth in developing countries, as most of the applied studies in this field focus on developed countries, in addition to their interest in various aspects of the knowledge economy of only one of the countries. Most of these studies are based on evaluating the relative conditions of the knowledge economy in the countries under study, without addressing the quantitative measurement. In addition, the current research context is developing economies, as the knowledge economy is not well developed in most of those countries. The added value of the current research also comes from a better understanding of the state of the knowledge economy, in the context of developing economies. Existing literature on the knowledge economy and its impact on economic growth in developing economies is extremely scarce and such exploration is required.
This paper consists of five sections. The current section is Section 1. Section 2 provides the theoretical basis for the knowledge economy, the concept of KE, characteristics of the KE, measuring the KE, difficulties of measuring the KE, the role of knowledge in economic growth the future of the KE, and finally, the role of the KE in the developing countries under study. Section 3 presents the research models and hypotheses proposed based on the theoretical background. Section 4 provides the analysis methods to verify the hypotheses, and results of empirical analysis. Section 5 discusses the research results, and points out the theoretical and practical contributions, research limitations, and prospects of this research.
2. Theoretical Background
2.1. Related Research
Many previous studies were conducted to clarify the relationship between the knowledge economy and economic growth. In addition, they differed according to the study sample, the study period and the type of indicators used; however, most of them showed the positive role of the knowledge economy in economic growth. This part reviews the most important studies of the relationship between the knowledge economy and economic growth. The following studies dealt with an analysis or measurement of the effect of the cognitive economy as a whole and then dealt with their different aspects: A study conducted by Irena Paličková) sought to find the relationship between the knowledge economy and economic growth, and the economic level of countries. What does the gross product per capita in current dollars measure? Therefore, those countries were divided into four sections: high income is more than USD 12,276, the highest middle income is in the range USD 12.275–3976, the lowest median income is in the range USD 3.975–1006, and the low income is less than 1005 dollars. The study found that there is a strong relationship between the economic level of the country and each indicator of the knowledge economy. However, in varying degrees, the innovation index had the highest correlation, then information and communication technology, then the institutional system, and finally the economic relationship was positive in groups of high-income and lower-middle-income countries, while in other countries the relationship was negative [18]. The Crisculio & Martin study included an attempt to analyze the conditions of the knowledge economy in China during the period 1990–2000 using a set of indicators issued by the Organization for Economic Cooperation and Development (OECD database). Moreover, it concluded the significant role of the aspects of the knowledge economy in influencing high economic growth, represented by education and foreign trade, especially in high-tech goods, as well as the rapid increase in spending on research and development, which exceeded 1.5 percent of GDP after 2005 [19]. In terms of organizational performance, the researcher utilized the questionnaire as a tool for data collection, and the study concluded that there is a significant impact of the knowledge generation process on improving performance, so that the percentage of improvement in performance can reach 40% [20].
The study by Ghoneim, A. & Mandour, D. aimed to analyze the performance of the Egyptian economy as a knowledge economy, compared to the countries of the Middle East and North Africa MENA, to determine the strengths and weaknesses in this area during the period 2000–2007 [21].
Additionally, the study by Nour, S, SOM relied on a comparative descriptive approach to analyze the availability of the components of the knowledge economy in the Arab region and the development of the KEI knowledge index for the period 1995–2012. In addition, the study reached the conclusion that the availability of the components of the knowledge economy in the Arab countries coincides with the existence of a knowledge gap compared to other countries around the world, where there is weak and slow progress in the knowledge index in these countries. The study by Mehrara, M. & Rezaei, A. headed in the same direction by analyzing the conditions of the knowledge economy in Iran, which compared a group of 21 countries in the Arab region using the World Bank index of the knowledge economy during the period 2000–2012. Moreover, the study showed an improvement in Iran’s competitiveness during the period, but the Kingdom of Saudi Arabia was able to achieve more noticeable progress in the region [22,23]. In addition, we find a study by Kasim entitled “The relationship between knowledge management practices and job performance in the Malaysian government departments”. The study aimed to show the important role of knowledge management practices in improving the performance and efficiency of public sector institutions, and how government job performance can be improved through the application of knowledge management. All managers were working in the (28) Malaysian ministries, where a regular random sample of 500 was taken from the complex study. The study found several results, the most important of which is the existence of a positive relationship between knowledge management practices and job performance efficiency in the Malaysian public sector institutions. The study came out with a number of recommendations, the most important of which is the need for senior management to understand the factors and elements that contribute to the effectiveness of job performance and to provide the necessary resources to influence knowledge management practices in organizations [24]. The Utz, A. study also aimed at examining the conditions of the knowledge economy in Tanzania and its role in accelerating productivity and competitiveness using the assessment methodology developed by the World Bank Knowledge Assessment Methodology (KAM). In Naser, M. & Lawrey, R., the same trend was analyzed by examining the conditions of the knowledge economy in the ASEAN bloc in 2010, and the authors concluded that it is one of the regions most characterized by the characteristics of the new economy in terms of high growth rates and low inflation rates, but the knowledge economy differs among ASEAN countries in terms of the degree of acquisition production and use of knowledge [25,26].
In the same context, the study by Barro & Lee clarified the positive impact of human capital on output by updating data on the average number of years of study in 146 countries worldwide, during the time period 1950–2010, using random-effects and fixed-effects models. In addition, the study by Amin, M. & Matto, A. measured the impact of human capital represented in education, by using the index of the number of students enrolled in university education, on various economic activities in 14 states in India, for the period 1980–2000, using the generalized method of moments (GMM); the authors verified that the positive impact of skilled labor on output in the service sector was higher than in the industrial and agricultural sectors, and they attributed this to the fact that the service sector is dense with skilled labor [27,28].
In his study, Weber, A. focused on analyzing the role of education as one of the pillars of the knowledge economy in the Arab Gulf states and North Africa, explaining the disparity between indicators of interest in education and skills in these countries, and showing that the Arab Gulf states have been able to achieve more clear progress than North African countries that still face many challenges, especially with regard to the illiteracy rate, the rate of enrollment in educational stages and brain drain [29]. Meanwhile, the study by Manjinder Kaur and Lakhwinder Singh attempted to find an explanation for the relationship between the knowledge economy and economic growth for 42 developing countries, as well as studying the impact of knowledge on economic growth. For the period from 2000 to 2012, the results of the slope line equation showed that the education, research, and development index had a positive impact on economic growth in these economies. As for the KEI index, it had a positive effect, but it was weak, as indicated by the coefficient of determination R2; this means that economic growth is also determined by many other factors in addition to the investment in knowledge. It also shows the regression function coefficients for the different groups of economies, which were divided into three sections based on GDP per capita, namely, low-income, middle-income, and high-income economies, and the author found that there is a negative relationship between GDP per capita and KEI.
The reason for this is the low quality of educational institutions, the lack of investment in research and development, and the low level of human capital in these economies. Thus, investment in the knowledge economy cannot achieve economic growth unless the basic institutions are developed to comply with the knowledge economy. As for middle-income economies, there is a positive relationship, but not at the required level, as these economies have not developed enough to reach the desired goal. As for the higher-income economies, they also have a negative relationship, as the accumulation of knowledge in these economies reaches a certain extent that leads to the promotion of economic growth, but then its impact on economic growth begins to decline [30]. As for the study by Hoh Yan Chun, Kelly Lee Jia Xin, and Lau Hooi Chin, it examined the relationship between the knowledge economy and the economic growth of 55 countries consisting of 12 countries in Western Europe, 2 countries from the Atlantic Ocean region, 6 countries from East Asia, 2 countries from South Asia, 15 countries from Europe and Central Asia, 6 countries from Latin America, 5 countries from the Middle East, and the Group of Seven countries. For the period from 2000 to 2012, a set of indicators were used for the knowledge economy, which are human capital, government effectiveness, Internet users, mobile phone users, government spending on education, and patent applications. The study concluded that all knowledge indicators have a significant impact on the economic growth of the Group of Seven countries, and when comparing the developed and developing countries, the developed countries were impacted the greatest by on all indicators, and for Asian and Non-Asian countries, the incentives index and the education index had the greatest impact in Non-Asian countries, and innovation and information technology indicators had the greatest impact in the growth of Asian countries [31].
As for the second aspect, related to information and communication technology, a study by Mahboub, A and Salman, M. measured the impact of growth in ICT on economic performance through its impact on market competitiveness, using data on 107 countries, including developed and developing countries, during the period 1995–2004. Using two-stage least squares (2SLS) regression analysis, the authors concluded that the increase in ICT services positively affects the overall performance of the economy by depending on the degree of improvement in the overall competitiveness in the markets. On the contrary, in the study by Hassan, M., there is a negative and moral impact of ICT on economic growth in 95 countries, including 8 countries in North Africa and the Middle East, during the period 1980–2001, using generalized least squares (GLS). This was confirmed by the Nour, S,SOM study, which analyzed both the potential positive and negative effects of the spread of ICT on economic development in Arab countries [32,33,34].
Regarding the innovation aspect, the OECD study found a positive impact of research and development (R&D) on productivity at the level of government, private and foreign spending in 16 OECD countries, during the period 1980–1998, based on the Cobb–Douglas production function using the error correction model (ECM). This was confirmed by a Holtan, C. study, which included an analysis of the impact of knowledge-based capital (KBC) on innovation, based on research and development and investment in intangible capital as well as high-tech material goods, namely, high-technology tangible capital and IT capital, in the US economy, during the period 1990–2011. In addition, the study indicated that about half of the growth in output per worker is due to the transition to a knowledge economy [35,36,37].
The current study differs from previous studies in that it focuses on the economy of a group of developing countries using time series data and not on the economy of a single country, as is the case in other studies. This is what makes it different from studies such as Crisculio & Martin, Song, and Kasim and Utz, A. It also differs in that it is a standard study to know the impact of the knowledge economy on growth, while many other studies relied on the analytical approach and only focused on the conditions of the knowledge economy in developing countries, and the efforts made to support it on the part of governments, and this is what makes it different from the Ghoneim, A. and Mandour, D. study. Additionally, unlike most other studies, the current study deals with all the different aspects of the knowledge economy), namely, ICT, innovation, human capital, and economic and institutional systems, without focusing on just one aspect. This is what makes it different from studies such as Weber, A., Amin, M. & Matto, A., and Barro & Lee, which focused only on the role of human capital, the study of the Organization for Economic Cooperation and Development, which focused only on innovation, and the Hassan M. study, which focused only on the role of ICT.
2.2. The Concept and Measuring of the Knowledge Economy (KE)
The term knowledge economy first appeared in Peter Druker’s research in 1968, in his book The Age of the Gap. However, this idea was created before that, and in 1962, Fritz Machlup mentioned a term close to it, “knowledge industries”. Nevertheless, the signs of this economy were old; however, it was not known in its present form. The interest in the knowledge economy increased after the World Bank adopted the basic standards to access it based on four basic indicators: education, research and development, the information system, and legal systems and legislation. Thus, a knowledge-based economy is an economy in which the processes of generating and investing knowledge play a fundamental and sustainable role in creating the wealth of nations and increasing the efficiency of all economic sectors [38]. According to Maamari-Al. & Balushi-Al, the knowledge economy is an educational system designed to enable individuals to acquire knowledge, share knowledge, and generate knowledge and use it to improve the quality of human life [39].
It also defines the knowledge economy according to the Organization for Economic Cooperation and Development (OECD) definition, which is an economy that depends directly on the production, distribution and use of knowledge and information. Houghton & Sheehan believe that the knowledge economy stems from two forces: The first comes from the high density or intensity of knowledge in economic activities, which are driven by the integration of information technology, and the increase in the pace of technological development, relying on the human element, which is uses invention and innovation in the production process to achieve added value and achieve economic growth. The second comes from the globalization of the economy and making it a global economy [40]. In addition, the knowledge economy is related to the economics of knowledge itself, from the production and industry of knowledge by investing in education, research and development, and from the preparation and training of experts and workers on the one hand, and the return resulting from this investment on the other. In addition, the knowledge economy relates to modern technology, from means of communication such as computers, the Internet, telephone, etc. in the economic fabric, to applications such as diagnosing diseases and performing remote surgical operations, holding teleconferences, as well as production and marketing. All these factors make the economy based on knowledge [41,42,43]. The European Bank for Reconstruction and Development defines it as a new concept of economic development, where innovation and access to information are the engine of productivity growth. Additionally, the new trends of the Internet of Things and digital are key elements of the transition towards a knowledge economy, so setting the basic pillars that support the development of the knowledge economy is a matter essential for long-term competitiveness [44].
Whereas Hulten showed that knowledge-related capital is an important source of economic growth in many developed countries, and it is positively related to the average per capita income [36], in Kenton, the knowledge economy is defined as a system based on intellectual capital with a large part of its economic value consisting of intangible assets such as the value of labor knowledge. Zakshevskii et al. indicated that modern societies are facing a great challenge represented in their ability to reach the stage of the knowledge society, The progress and development of any society have become dependent on its ability to invest knowledge effectively, and this is achieved through the investment of education to apply scientific cognitive theories [45]. It was also defined as an economy in which the main components of economic growth depend on intellectual capabilities and not on material inputs and natural resources Gupte. Cavusoglu defined a knowledge-based economy as “an economy capable of producing, disseminating, and using knowledge where knowledge is a major factor in growth, wealth creation and employment. Human capital is the engine of creativity, innovation, and generation of new ideas, relying on information and communication technology.
From the previous definitions, the knowledge economy is a new economic approach that relies on knowledge, technology, information, and communication to create new added value in society. It is also clear from the above that the knowledge economy depends on investing in intangible knowledge and intellectual assets more than on tangible physical assets, and information and communication technology is the infrastructure of the knowledge economy owing to its ability to create new added value that helps achieve a competitive advantage [46,47].
To know the status of countries in the knowledge economy, the World Bank has created a tool to help client countries, called the Knowledge Assessment Methodology (KAM). This tool allows us to know the strengths and weaknesses of any country by comparing itself with the member countries or any other country, and this methodology is based on the four pillars of the knowledge economy, which are: education, research and development, information technology and communication, economic incentives and institutional systems; a set of indicators which fall under these pillars are calculated on the basis of the average performance of any country [48]. Figure 1 shows the indicators of the knowledge economy [30].
From the previous figure, an analysis of the results of these indicators can be performed. There are six cases, according to the methodology of the World Bank, and they are as follows: General Indicator: It includes both the knowledge index and the knowledge economy index: Knowledge Index = (Information and Communication Technology Index + Research and Development Index + Education Index). Knowledge Economy Index = (Knowledge Index + Economic Incentives and Institutional Systems Index). Basic Scorecard: It contains 14 basic indicators, as each of the foundations of the knowledge economy has three indicators in addition to the knowledge indicator (KI), which gives the basic average of the performance of the three indicators (education, research and development, information, and communication technology), as well as the knowledge economy index (KEI), which measures the performance of all major indicators. Custom scorecard: It contains all the detailed indicators consisting of 109 indicators, which determine the integration of countries into the knowledge economy. Overtime comparison: It shows the development of countries from 1995 to the most recent year available. Cross-country comparison: It allows the use of graphs to compare the indicators of knowledge, the knowledge economy, and the contribution of each of them in determining the general readiness for knowledge. World map: In this scale, the names of countries are found in different colors, each color reflecting the performance of this country and its contribution to determining the general readiness for knowledge and the knowledge economy. Through the map of the countries of the world, which is coded with six colors, each color reflects the status of these countries and their readiness for the knowledge economy from 1995 to the most recent year available, with zero indicating the lowest level and ten being the highest.
2.3. Characteristics of the Knowledge Economy
The knowledge economy has several characteristics that make it different from the old economy, which can be summarized in the following points:
- In relation to the ancient economy, which is the study of the relative scarcity of economic resources; this is the exact opposite of the new economy, which is known as abundance. This is because the constituent elements of this economy, which are knowledge and information, do not run out with use, but rather grow, in contrast to the factors of production that formed the centerpiece of the ancient economy. Hence, the knowledge economy, considering digital technology, is an economy of abundance because knowledge is not consumed, that is, it is not depleted, but rather self-reproduces by consumption, by transferring it to the other, and thanks to digital technology, the marginal cost of any subsequent copy over the initial copy is high and gradually diminishes until the yield is closer to zero. This is what creates abundance in production, so that the principle of abundance becomes the most prominent feature of the knowledge economy [49].
- The knowledge economy is governed by the law of increasing returns. That is, the higher the proportion of inputs, the higher the proportion of outputs, because one of the characteristics of knowledge is that it is cumulative. Knowledge gives us a vision forward to discover new knowledge. For example, the invention of the microscope was the reason for the discovery of small organisms, which in turn led to the knowledge of how diseases (infections) are transmitted, etc.
- The knowledge economy is characterized by a state of uncertainty and high risk, as there is difficulty in valuing intangible assets, and their value declines at a rate due to the obsolescence of other knowledge [50].
- Human capital is the main element in knowledge-based economies, as it is responsible for the production of knowledge, which has become the most important commodity in society. Whereas the old economy depended on muscular effort and relied on the machine with little knowledge, which sufficed to operate these machines, the new economy has now become almost entirely dependent on intellectual effort.
Overall, the value of knowledge and its pricing depend on the environment in which it is used, as the information and knowledge itself differ for different people, while the same person varies with time, and the resources used in the new economy are very few, and in return, they achieve an added value many times that which the industrial economy achieves, especially since its material outputs sometimes almost disappear, and they are limited to intangible knowledge inputs. The features of the development of the “knowledge economy” can be analyzed, as shown in Figure 2 [52,53].
On the other hand, the largest success in the formation of the knowledge economy was achieved by developed countries, which increased disproportions in development of the global economic system—instead of their expected leveling. Intensity of innovational development of economic systems, which took the path of the formation of the knowledge economy, was not sufficiently strong to ensure the overcoming of the global crisis. This aggravated the problem of the search for new vectors of breakthrough innovational growth of the modern global economic system, which developed in the conditions of the knowledge economy.
2.4. Difficulties of Measuring the Knowledge Economy
There are several difficulties in measuring these indicators, related to building the indicator in terms of data availability, or in terms of its accuracy and the level of confidence in its existence. There are also difficulties related to the index calculation methodology. These difficulties are summarized in the following points: (1) Information is affected by political dimensions and country relations. (2) Cosmetic surgeries are performed by some countries for indicators of knowledge before disclosing them. (3) There is the possibility of some indicators not being available about the countries for which the indicator is indicated. (4) There is a difference in capabilities between countries, which sometimes makes the comparison process difficult. (5) The issue of intellectual property that may prevent real disclosure of some indicators, especially those related to research and technology.
2.5. The Role of Knowledge in Economic Growth
Since ancient times, knowledge has contributed to increasing economic growth, and man has been able, thanks to successive innovations, to progress in all fields. In the field of agriculture, agricultural production has increased many times, after improvements in agricultural machinery, such as plows, seeding and threshing machines, and irrigation tools. It developed further after the invention of the steam engine by Bolton and White, for which he obtained a patent in 1969. Inventions followed the industrial revolution, which caused a major boom in production of all kinds, especially after the development of the first steam turbine by Charles Barsowitz, for which he obtained a patent in 1884, which played a role in all developments that occurred after that. In the field of energy, electric power was generated by Edisov and Simtz in the 19th century, as well as the invention of movable type printing in the fifteenth century, which subsequently contributed to the popularity of books. In the modern era, technological progress has seen an increase unparalleled in human history. Modern engines, transportation tools and machines, various energy sources, means of communication, the Internet, and others have appeared. All of this has contributed significantly to increasing production and improving the standard of living of people.
- Solow Model: In the model developed by Solow in 1956, he used the production function consisting of labor and capital and concluded that there are two factors that determine the change in production, the saving rate, and the population rate, and that the first helps progress and the second leads to poverty. He showed that this model in the long run, when the economy is in equilibrium, the average per capita income does not grow and remains constant, and for this to happen, the concept of technological progress was introduced into the production function. It was concluded that the growth rate of income in the long-run is equal to the growth rate of technical progress because it changes over time. However, these results were subject to many doubts, because of which the new theory of growth appeared, and technological progress was used as an internal variable [40].
- Romer Model 1986: In this model, Romer considers technological progress as an internal variable, and the accumulation of knowledge is the first basis in the long run, because knowledge will grow without limits, even if the volume of other inputs remains constant [55]. Romer’s most important contribution is the division of economic goods into things and ideas. Things are the raw materials of nature from nature (such as minerals, silicon, carbon atoms, oxygen, etc.). As for ideas, they are the instructions by which we use these things, so they are transformed into computer chips, telephones, antibiotics, etc.. Hence, new ideas are the new way to organize raw materials in more economically beneficial ways, whenever better ways are discovered to use the limited materials available to us, or in another measure, sustainable economic growth occurs. The number of raw materials in nature is relatively finite, but the number of ways in which these raw materials are organized is unlimited. Economic growth occurs because we discover new ideas.
- Lucas model 1988: This model relies on human capital as an important factor for economic growth, as it focuses on the way an individual allocates his time on various activities in the current period and how it affects his productivity in future periods. It is the introduction of human capital into the model, to show how levels of human capital affect current production and how the current allocation of time affects human capital accumulation, depending on an individual’s goals. In this model, human capital will take the place of technological progress in the Solo model [56]. According to Lucas’ model, to generate self-growth, it is sufficient for the marginal wills of human capital, allocated to training, to be constant, and if they are increasing, significant growth will occur.
- Model Aghion Et Howitt: Aghion Et Howitt‘s growth models are related to Schumpeter’s idea of creative destruction, in which growth occurs in their view of qualitative improvements in goods resulting from the activity of researchers, which in turn results from competition between research firms that generate innovations. Whereas each innovation consists of a new intermediate good that can be used to produce the final product more efficiently than before, research firms are motivated by the possibility of a monopoly advantage, which can be obtained when a patent is filed. However, those rents in turn will be destroyed by the next innovation, which will disrupt the current medium, and so on each time [57].
On the other hand, informatics today represents a distinct and very important role in the economy, whether at the local, regional, or international level, after traditional economic thought remained based on the concept of providing natural resources and their ability to enhance production as an engine. The global economy is one of the pillars of economic development, especially after the emergence of the industrial revolution, but the rapid technological progress, especially in the field of information and communication programming techniques that led to the shortening of time and distances, in turn helped in the growth and development of the importance of the concept of information, i.e., the knowledge economy, in light of the development of the situation. The economy has become characterized by complete transparency on the one hand, and overlapping and complexity on the other hand; in other words, this has led to the emergence of new economic resources besides traditional resources, which is what is called informatics. The following are the channels through which the components of the knowledge economy affect economic growth, as shown in Figure 3.
The previous figure shows the channels through which it affects the driving force of the knowledge economy and through which it affects economic growth, namely, the globalization channel, as markets and products become more global. In addition to this, there is the growth of the information and knowledge revolution, which has become high density in the production process, with about more than 70% of workers in advanced economies being information workers, in addition to the computer networks and the Internet channel, which made the world one village. As a result, the need to continuously develop goods and services has increased, and they are being bought and sold through electronic networks. This necessitates being familiar with the applications of new technology, as it depends on meeting the economic demand. These forces have contributed to the expansion of international production through the third channel, which is the liberalization of policies and the erosion of borders between countries, which paved the way for all kinds of foreign direct investment and various capital arrangements. Combined with rapid technological change and low transportation and communication costs, it has made it more economical to integrate geographically dispersed operations and move products across the world in search of efficiency. Finally, the channel of increased competition forced companies to find new ways to increase their efficiency, including the use of new markets and the relocation of certain production activities to reduce costs.
2.6. The Future of the Knowledge Economy
On the horizon, there are other features of a revolution that will be the largest and fastest in human history. Among the milestones of this revolution are artificial intelligence technology, robotics, the Internet of things, genetics, 3D printing, quantum computer, nanotechnology, biotechnology, self-driving cars, data, energy storage, and mega, virtual currencies. These technologies have led to the production of a huge amount of new data, thanks to algorithms based on machine learning and big data, and their employment of a huge number of digital sensors in industrial equipment, vehicles, and production systems around the world, and has also facilitated the innovation process, and made significant changes in productivity and growth. The amount of data increases annually by 40%, and it is expected that knowledge will double every 11 h. These developments will bring about a fundamental change in production methods and the economic system, and in this paper we consider some of these new technologies and how they will affect the economy. For example, artificial intelligence is a source that is important for innovation, and which brings great profits to organizations and people [58]. The revenues of the artificial intelligence industry in 2019 amounted to about USD 2.45 billion, and it is expected that it will grow rapidly to reach about USD 60 billion by 2025. Artificial intelligence techniques will contribute to a major shift in production and productivity levels, as some estimates show that 45% of economic gains by 2030 will come from product development and stimulating demand levels, and global output levels are expected to reach USD 15.7 trillion in 2030. That is an increase of 14% over the current level, as shown in Figure 4 [59].
In addition, one of the new technologies is the Internet of things. The Internet of things is an advanced concept of the Internet, such that all things in our lives can connect to the Internet or to each other to send and receive data to perform specific functions through a network. It consists of sensors, actuators and independent objects that interact with each other directly, having technical communication devices that are connected and embedded in the same entities, or can be installed in an environment object to be monitored; these devices are RFID wireless radio chip readers, sensors and actuators, embedded computers as well as mobile phones. Kaivo-Oja, J. et al. explored the Internet of Things and big data with the waves of technology [61,62]. The Qin study indicated that libraries have been greatly affected by rapid developments in information technologies, communications, computing, social media, smart phones and others, which posed challenges in their appearance and libraries benefited from them in their activities. These technologies were the basis for the applications of the Internet of Things, after the increasing reliance on modern wireless communication technologies in libraries, such as radio frequency technologies, sensors and mobile phones, which through modern knowledge systems can interact with each other [63]. The Sobinska and Rot’s study focused on the possibilities that are provided by the Internet of Things to improve the tasks associated with data generation, processing and transmission, in order to serve decision making that libraries can benefit from in improving their capabilities to work under changing conditions created by recent digital developments [64,65,66]. Also important new technology is 3D printing: 3D printing is a manufacturing method in which materials, such as plastic or metal, are deposited on each other in layers to form a three-dimensional object, by means of computer programs. This method differs from traditional molding in several ways, including not wasting raw materials, making complex objects, and speeding up production. 3D printing has been used primarily in engineering to create engineering models. It has proven successful, as 3D printers have been able to make shapes and models such as those made traditionally. It can also be used in many medical fields, such as for printing human organs. Moreover, it has even been used in manufacturing microscopic structures and precision devices, in a programmable, easy, and flexible way. There are many 3D-printable materials such as elastomers, solid and liquid metals, hydrogels, glass, and liquid crystal polymers [67,68]. Hence, 3D printing can create physical objects of geometric representation by adding successive materials [69]. Currently, 3D printing is primarily used for artificial production, for example, a heart pump [70], jewelry sets, 3D-printed corneas, the PGA rocket engine, the Amsterdam steel bridge, and other products related to the aviation industry as well as the food industry [71,72,73,74].
3. Research Model and Research Hypotheses
3.1. Research Model
The standard study tests the impact of the knowledge economy on economic growth, for a sample of 20 developing countries (Algeria, Argentina, Brazil, Bulgaria, Chile, China, Egypt, Hungary, Indonesia, Iran, Mexico, Morocco, Peru, Philippines, Poland, Romania, Sri Lanka, Thailand, Tunisia, and Turkey) for the period from 1996 to 2020, by taking per capita GDP as a dependent variable that expresses economic growth, and a set of indicators related to the knowledge economy as independent variables as in the following table, using panel models and EViews 9. This sample was selected on the basis of the availability of data for the study variables. The report on the global economic situation and its prospects for the year 2020 issued by the United Nations was relied upon. According to this report, countries are classified into developing countries, transitional countries, and developed countries.
3.1.1. Importance of Panel Models
Estimating according to these data has important advantages and gives more accurate results, because it takes into account the information with the time dimension in the time series as well as the cross-sectional dimension in the different units of efficiency and activity in econometrics, and therefore it is of great importance, which we summarize in the following points [75]:
- This type of data allows the researcher to study the differences and differences in behavior between individuals, so that the multiplier dimension enjoyed by the panel data can be translated as a multiplier dimension of the available information more than cross-sectional or temporal data;
- Panel data is distinguished from others by a greater number of degrees of freedom as well as better efficiency, and this positively affects the accuracy of the estimators;
- The use of panel data will allow us to mitigate the problem of polylinearity;
- The ability to identify some economic phenomena such as technical progress and economies of scale, and thus address the problem of the inability to divide economies of scale and technical progress in the analysis of production functions, is important.
Longitudinal data gives better efficiency and an increase in degrees of freedom, as well as less linear multiplicity between variables, and more informational content. If cross-sectional or temporal data from time periods are used, the T model of cross-sectional observations measured in N let us have longitudinal data defined by the following formula [76,77]:
where the following are defined:
- i = 1, 2, … N denotes single units.
- t = 1, 2, … T expresses the periods of time.
- Yit is a vertical vector representing the dependent variable.
- Xit it is an array (NT × K) representing the independent variables.
- B (K × 1) is a vertical vector of the parameters to be estimated where the model assumes that there are a number of K parameters in Xit below the constant limit
- it is the random error term of the unit i and the period t.
Through the previous presentation, it is possible to review the pros and cons of using the panel data, as shown in Table 1.
3.1.2. Basic Models of Static Panel Analysis
The aggregate regression model (PME) is one of the simplest panel data models, as this model neglects the effect of the time dimension, while the fixed-effects model aims to use it to know the behavior of each set of cross-sectional data, the behavior of each country for example, and for the purpose of estimating the parameters of this, the random-effects model is suitable for estimating if there is a defect in the conditions of the individual effects model, as it takes into account the changes that may occur to individuals as well as time, and to estimate the random-effects model, the generalized least squares (GLS) method is used.
This model is considered one of the simplest models of longitudinal data, in which all coefficients are fixed for all time periods (ignoring any effect of time). By rewriting the model in the equation below, we obtain the aggregate regression model with the following formula:
- J = 1, 2, 3… n, t = 1, 2, 3… N
where: E(εit) = 0 and σ = (εit)var. The ordinary least squares method is used to estimate the model parameters in the above equation by the size of observations (N*T).
Fixed-effects model (FEM): The use of the fixed-effects model takes into account the change in the slope and the section from one unit to another for the views of the cross section within the studied sample; thus, it will be assumed that the parameters change in a fixed manner, and on this basis they have been called the fixed-effects models, so they represent both the individual and temporal dimension of the panel model, and thus we can estimate the model by comparing individuals against time.
In the fixed-effects model, the goal is to know the behavior of each cross-sectional data set separately by making the cutoff parameter β0 vary from one group to another, while keeping the slope coefficients βj constant for each cross-sectional data set (that is, we will deal with the case of heterogeneity in the variance between groups), and accordingly the fixed-effects model is in the following form:
- J = 1, 2, 3… n, t = 1, 2, 3… N
where E(εit) = 0 and σ = (εit)var. The term fixed effects means that the parameter β0 for each cross-sectional data set does not change during time, but rather the change is only in the cross-sectional data sets for the purpose of estimating the parameters of the model in the above equation, allowing the parameter β0 to change between the cross-sections. Usually, dummy variables are used as much as 1-N in order to avoid multiplicity and complete linearity. Then, the ordinary least squares method is used. The fixed-effects model is called the least squares model for dummy variables. After adding the dummy variables D in the above equation, the final form of the model becomes as follows:
J = 1, 2, 3… n, t = 1, 2, 3… N
Random-effects model (REM): The model with the random effect is represented in the fact that the constant changes randomly, and if the random effect is found in both the individual factor and the time, we call this model a model with a compound error µ; The appropriate estimation method in this type of model is the generalized least squares (GLS) method, or by a method linking the “interpersonal” estimation (between) to the estimation within, which takes the following form [78]:
J = 1, 2, 3… n, t = 1, 2, 3… N
3.1.3. Methods for Choosing the Appropriate Model
The aggregate regression model (PME) is considered one of the simplest panel data models, as this model neglects the effect of the time dimension, while the fixed-effects model aims to be used to know the behavior of each set of cross-sectional data (the behavior of each country). For the purpose of estimating the parameters of this model, dummy variables of 1-N are usually used in order to avoid the case of perfect polylinearity, and then the ordinary least squares method is used. The random-effects model is appropriate for estimation in the event of a defect in the model conditions.
The fixed-effects model is used, and to estimate the random-effects model, the generalized least squares (GLS) method is used.
To determine the appropriate model for the static panel data, we will present two methods: the first is the method of choosing between the cumulative regression model and the fixed-effects model, and the second is the method of choosing between the fixed-effects model and the random-effects model.
The first method: to choose the appropriate estimation method for the study data, the process is usually started by checking the presence of those unobserved effects, or through the study periods in order to apply the panel estimation methods (FEM and REM), and here the model is tested with a cross section for each country against a model with a common secant: the null hypothesis is the homogeneity hypothesis (common secant) (H0: μ1 = μN… =μ2). For time effects (H0: γ1 = γ2… = γT), the null hypothesis is tested using a probability (F) according to the following formula:
where K is the number of estimated parameters, RFEM represents the coefficient of determination when using the fixed-effects model, and RPM represents the coefficient of determination when using the aggregative model where we compare the result of the above formula with F (N − 1, NT − N − K). If the calculated F value is greater or equal to the value tabularity, then the fixed-effects model is the appropriate model.
The second method: We use the Hausman Test to choose between the fixed- and random-effects methods based on the null hypothesis that all estimation coefficients through random effect have the same efficiency as those that were estimated through fixed effect. Rejecting the null hypothesis makes the estimation coefficients by random effect more accurate. This does not mean that the estimation coefficients resulting from the fixed-effects model are ineffective. The model’s assumptions are as follows:
H0.
The random-effects model is the appropriate model (there is no autocorrelation between variables).
H1.
The fixed-effects model is the appropriate model (there is an autocorrelation between variables).
The Hausman test is expressed by the following relationship: [76,79,80,81]:
where
where the variance and covariance matrix of the regression parameters b are obtained from LSDV, except the constant, and the variance and covariance matrix of the random-effects model Bˆ are obtained without the constant; therefore, under the null hypothesis, the best model is a model with a random effect, which means that the individual effect is not linked to other variables; in the opposite case, the best model is a model with a fixed effect.
In our study, we use three models for panel chains: pooled regression model, fixed-effects model and random-effects model; then, we try to find the appropriate model. The general formula of the model will be as follows:
where the following are defined:
LNGDP = β0 + β1TIC + β2tf + β3INTE + β4EDUC + β5R&D + β6CC + β7SP + β8OC + β9FDI + β10TVI + ꜫ1
- t: Time represents the value of the variable in a year t
- β0β1β2β3: Represent the parameters of the model
- TIC: Number of mobile phone users (per 100 people)
- TF: Number of fixed telephone users (per 100 people)
- INTE: Internet users per 100 people
- EDUC: Expenditure on education (in US dollars)
- R&D: Patent applications for residents
- CC: Control of corruption
- SP: Political stability
- OC: Trade openness ((exports + imports)/gross domestic product)
- FDI: Foreign direct investment (% of GDP)
- TVI: Total value of international trade
- ꜫ: Represents the random variable or error term
The study relied on the use of cross-sectional time-series models (panel data) because of their increase in prediction accuracy, and it considers the effect of the time change and the effect of changing the difference between vocabularies. The aggregate regression model, fixed- and random-effects models, and cross-sectional time-series models are estimated; the appropriate model is selected, the suitability of the model is examined, and the results of the appropriate model estimate are analyzed.
3.2. Based on the Research Hypotheses of Knowledge Indicators
The model literature review shows that research on the means for countries to advance and increase their economic growth depends on the knowledge economy, especially in times of crisis, especially what has been proven by the recent COVID-19 pandemic and the extent to which countries, especially developing countries, need various electronic means to facilitate their electronic commerce and the continuity of their electronic commerce and the continuity of education in it. This is achieved in the presence of advanced technology, provided by the various means of knowledge, and with a focus on analyzing the following: the number of mobile phone users (per 100 people), the number of fixed phone users (per 100 people), Internet users per 100 people, spending on education (in US dollars), patent applications for residents, control of corruption, political stability, trade openness (exports + imports)/GDP, foreign direct investment (% of GDP), and total value of international trade. Accordingly, the hypotheses of the study tend to be as follows:
3.3. Research Hypothesis
The model of the current study depends on a set of hypotheses that explain the impact of the knowledge economy indicators represented in (The Number of mobile phone users, number of fixed telephone users, Internet users positively, Expenditure on education positively, Patent applications for residents, control of corruption, Political stability, Trade openness, Foreign direct investment, and total value of international trade) on the economic growth of the group of developing countries selected in the study sample, The following are those hypotheses.
Hypothesis 1 (H1).
The Number of mobile phone users positively affects GNP per capita.
Hypothesis 2 (H2).
The number of fixed telephone users positively affects the per capita GDP.
Hypothesis 3 (H3).
Internet users positively affect per capita GNP.
Hypothesis 4 (H4).
Expenditure on education positively affects the per capita GNP.
Hypothesis 5 (H5).
Patent applications for residents positively affect the per capita GNP.
Hypothesis 6 (H6).
The control of corruption positively affects the per capita share of the gross national product.
Hypothesis 7 (H7).
Political stability positively affects the per capita GNP.
Hypothesis 8 (H8).
Trade openness ((exports + imports)/gross domestic product) positively affects the per capita GNP.
Hypothesis 9 (H9).
Foreign direct investment positively affects the per capita gross national product.
Hypothesis 10 (H10).
The total value of international trade positively affects the per capita gross national product.
The following table (Table 2) shows descriptions of the study variables.
4. Results and Discussion
4.1. The Role of the KE in the Developing Countries under Study
It is certain that the knowledge and technological revolution and the tremendous development in information and communication technologies that the world is witnessing in recent times have greatly contributed to improving the standard of living and creating a better environment for work and competition. Therefore, that knowledge, technology, and innovation have become the most important factors of production in the economies of developed countries, and in contrast to the economy. Based on production, where knowledge plays a lesser role, and where growth is driven by traditional factors of production, qualified and highly skilled human resources are the most valuable assets in the new knowledge-based economy, where the relative contribution of knowledge-based industries increases, often represented in medium- and high-tech industries, and in financial, banking and business services. Whereas economic growth in these countries has become driven by their knowledge and technological production, by looking at developing countries and their continuous efforts to search for economic diversification mechanisms, especially in light of the economic crises the world is witnessing, the trend towards an economy considered a knowledge economy is one of the most important bets for these countries to achieve economic development and reduce the gap between them and the developed countries.
Based on the discussion focusing on determining the knowledge economy indicators which affect economic growth, this paper attempts to resolve this discussion using three different methodologies. Experimental methodologies differ in their statistical capabilities depending on the adaptation variables included in the models, and therefore the use of different methods is useful in comparing results. Below is a description of each of these experimental methods. Statistics for minimum, maximum, and standard deviations of the endogenous variables, TIC, TF, INT, EDUC, R&D, CC, SP, OC, FDI, and, TVI over the period (1996–2020), are presented in Table 3.
From the previous table (Table 1), we conclude the following:
- The minimum value of the GDP over all the sample is 6.14, while the maximum is 9.73, with average = 8.34 and standard deviation = 0.80.
- The minimum value of the TIC over all the sample is 0.012, while the maximum is 192.21, with average = 70.23 and standard deviation = 51.15.
- The minimum value of the TF over all the sample is 1.39, while the maximum is 38.82, with average = 16.04 and standard deviation = 9.37. The minimum value of the INTE over all the samples is 1.25 × 10⁻⁵, while the maximum is 33.80, with average = 6.09 and standard deviation = 7.78.
- The minimum value of the EDUC over all the samples is 3.33 × 10⁸, while the maximum is 2.55 × 10¹¹, with average = 1.84 × 10¹⁰ and standard deviation = 3.46 × 10¹⁰.
- The minimum value of the R&D overall the sample is 22.00, while the maximum is 1393815, with average = 23634.78 and standard deviation = 145778.4.
- The minimum value of the CC over all the sample is 2.00, while the maximum is 17.00, with average = 11.38 and standard deviation = 3.54.
- The minimum value of the SP over all the sample is 2.65, while the maximum is 91.49, with average = 35.70 and standard deviation = 21.49.
- The minimum value of the OC over all the samples is 15.64, while the maximum is 168.24, with average 67.44 and standard deviation = 31.60.
- The minimum value of the FDI overall the sample is −42.72, while the maximum is 97.34, with average = 1.15 and standard deviation = 6.80.
- The minimum value of the TVI over all the sample is 3.43 × 10¹¹, while the maximum is 2.59 × 10¹², with average = 1.35 × 10¹¹ and standard deviation = 3.43 × 10¹¹.
The following figure below (Figure 5) shows the spread of 20 developing countries. The horizontal axis represents the average per capita GDP from the period (1996–2020), which expresses economic growth, while the vertical axis shows the knowledge indicator used in our study. It is clear from the figure that the points are distributed regularly in exponential form, and through the regression line, with the equation shown in the figure, it is clear that there is a strong relationship between the knowledge economy indicator and the average per capita GDP. This is confirmed by the value of the coefficient of determination estimated at 76%, which is a very significant value, meaning that 76% of changes in the average per capita GDP in developing countries is explained by the global knowledge index. It is also noted that the trend of this relationship is positive, meaning that countries with high values in the global knowledge index have a high level of per capita GDP, and vice versa.
In the beginning, a matrix of simple correlation coefficients was calculated between each pair of study variables, as shown in Table 4.
The following is evident through the matrix of correlation coefficients between the study variables:
- There is a significant positive direct correlation between economic growth (LNGDP) with number of mobile phone users (TIC), number of fixed telephone users (TF), Internet users (INTE), and control of corruption (CC), where the correlation coefficients obtained between the dependent variable and these independent variables amounted to 0.67, 0.52, 0.72, and 0.58, respectively.
- There is a positive, non-significant correlation between economic growth (LNGDP) and expenditure on education (EDUC), patent applications for residents (R&D), political stability (SP), trade openness ((exports + imports)/gross domestic product) (OC), foreign direct investment (FDI), and total value of international trade (TVI). The correlation coefficients obtained between the dependent variable and these independent variables were 0.33, 0.12, 0.40, 0.15, 0.17, and 0.19, respectively.
Variance equality tests evaluate the null hypothesis that the variances in all G subgroups are equal against the alternative that at least one subgroup has a different variance.
F-test. This test statistic is reported only for tests with two subgroups (G = 2). First, compute the variance for each subgroup and denote the subgroup with the larger variance as L and the subgroup with the smaller variance as S. Then, the F-statistic is given by [82,83]:
where is the variance in subgroup . This F-statistic has an F-distribution with − 1) numerator degrees of freedom and − 1) denominator degrees of freedom under the null hypothesis of equal variance and independent normal samples.
Bartlett test. This test compares the logarithm of the weighted average variance with the weighted sum of the logarithms of the variances. Under the joint null hypothesis that the subgroup variances are equal and that the sample is normally distributed, the test statistic is approximately distributed as X2 with G = 1 degrees of freedom. However, note that the joint hypothesis implies that this test is sensitive to departures from normality. EViews reports the adjusted Bartlett statistic.
Levene test. This test is based on an analysis of variance (ANOVA) of the absolute difference from the mean. The F-statistic for the Levene test has an approximate F-distribution with numerator degrees of freedom and denominator degrees of freedom under the null hypothesis of equal variances in each subgroup.
Brown–Forsythe (modified Levene) test. This is a modification of the Levene test, in which we replace the absolute mean difference with the absolute median difference. The Brown–Forsythe test appears to be superior to Levene in terms of robustness and power. The following is a test for equal differences between the series in Table 5 and Table 6.
Test for Equality of Variances Between Series
Sample: 1996, 2020
Included observations: 500
To ensure that there is no problem of multicollinearity relationships between the independent variables, the variance inflation factor was calculated for the independent variables, as shown in Table 7.
Thus, a variance inflation factor test is used to ensure that there is no collinearity between the independent variables and to test the allowed variance for each of the variables of the estimated model, ensuring that the variance inflation factor does not exceed the value (VIF < 10). Table 3 shows that the test value did not exceed 10, which indicates that the absence of linear collinearity between the independent variables (price) of the estimated model for the indicators of the knowledge economy in the group of developing countries under study. We find that TIC = 4.26 < 10, TF = 1.38 < 10, INTE = 2.87 < 10, EDUC = 5.291 < 10, R&D = 6.29 < 10, CC = 3.54 < 10, SP = 1.56 < 10, OC = 1.73 < 10, FDI = 1.10 < 10, and finally the independent variable TVI = 9.68 < 10.
Hence, it is evident from the table that the values of the VIF variance inflation coefficients decreased for all independent variables, as none of the values of VIF exceeded 10, which confirms that there is no problem of multiple linear relationships.
4.1.1. Measurement Model
Although the results of Table 8 indicate that the fixed effects are more suitable for cross-sectional data across countries, due to the higher coefficient of determination (0.93) than the random (0.85) and aggregate regression model (0.76), it is preferable to continue the analysis and use the Hausman test to compare between the fixed-effects model and the random-effects model.
A. Results of the pooled regression model (PRM):
The above-estimated model shows the significance of the variable coefficient (TIC) at the significant level of 0.05. This is because the test probabilistic value of the TIC coefficient of 0.000 is less than 0.05. Therefore, we reject the null hypothesis and accept the alternative hypothesis that states that there is a significant effect of the variable number of mobile phone users.
We also conclude the significance of the variable coefficient (TF) below the level of significance (0.05), because the test probability value (TF), which is 0.000, is less than 0.05. Therefore, we reject the null hypothesis and accept the alternative that states that there is a significant effect of the number of fixed telephone users on economic growth. We also conclude the significance of Internet users (INTE), expenditure on education (EDUC), patent applications for residents (R&D), control of corruption (CC), and political stability (OC), because the probability value of all the variables—INTE (0.000), EDUC (0.000), R&D (0.0018), CC (0.0004), SP (0.0000), and OC (0.0001)—is less than 0.05. Therefore, we reject the null hypothesis and we accept the alternative, which states that there is a significant effect of the previous variables and economic growth.
We also conclude that the coefficient of the two variables, foreign direct investment (FDI) and total value of international trade (TVI), is not significant below the significant level of 0.05, because the probabilistic value of the coefficient (FDI), which is 0.2381, is greater than 0.05, and the probability value of the factor (TVI), which is greater than 0.3494, is greater than 0.05. Therefore, we accept the null hypothesis, which states that there is no significant effect of two variables (FDI, TVI) on economic growth.
We also note the significance of the calculated F value below the level of significance (0.05), because its probabilistic value has reached 0.000, which is less than (0.05), and this means that the estimated model as a whole is significant, and the value of the coefficient of determination R2 reached 76%, which means that the estimated model as a whole is significant. The independent variables explain 76% of the changes in economic growth, while the remaining 24% are due to factors found within the random error.
B. Fixed-Effects Model (FEM):
It is evident from the model estimated above (Table 3) that the significance of the variable coefficient (TIC) is below the level of significance of 0.05, because the probability value of the factor TIC of 0.0000 is less than (0.05), so we accept the null hypothesis that states that there is a significant effect of the variable number of mobile phone users in economic growth.
We also conclude that the coefficient of the variables number of fixed telephone users (TF) and expenditure on education (EDUC) (in US dollars) and foreign direct investment (FDI) is not significant under the level of significance of 0.05, because the probabilistic values of the test coefficient for TF, EDUC, and FDI, which are 0.7371, 0.7525, and 0.1988, respectively, are greater than 0.05, so we accept the null hypothesis, which states that there is no significant effect of the previous variables on GDP per capita.
On the other hand, we find the significance of Internet users (INTE), patent applications for residents (R&D), control of corruption (CC), political stability (SP), trade openness (OC), and the total value of international trade (TVI) to be under a significant level of 05.0, because the values of the test probability of the coefficient for INTE, R&D, CC, SP, OC, and TVI, which are 0.0000, 0.0372, 0.0000, 0.0000, 0.0000, and 0.0000, respectively, are less than 0.05, so we accept the null hypothesis, which states that there is a significant effect of the previous variables on the rate of economic growth.
We also note the significance of the calculated F value below the level of significance (0.05), because the probability value for it has reached 000.0, which is less than 0.05, and which means that the estimated model as a whole is significant. In addition, the value of the coefficient of determination R2 reached 93%, which means that the estimated model as a whole is significant. The independent variables explain 93% of the changes in economic growth, while the remaining 7% are due to factors found within the random error.
C. Random-Effects Model (REM):
It is clear from the model estimated above in Table 3 that the significance of the coefficient of the variables number of mobile phone users (TIC), Internet users (INTE), control of corruption (CC), political stability (SP), and the total value of international trade (TVI) are under the level of significance of 0.05, because the probabilistic values of the factors TIC, INTE, CC, and TVI, which are 0.0000, 0.0000, 0.0000, 0.0000, 0.0000, and 0.0000, respectively, are greater than 0.05, so we accept the null hypothesis, which states that there is no significant effect of the previous variables on economic growth.
We also conclude that the coefficient of variables number of fixed telephone users (TF), expenditure on education (EDUC), patent applications for residents (R&D), and foreign direct investment (FDI) is not significant under the level of significance of 05.0, because the probabilistic values of the test coefficient for TF, EDUC, R&D, and FDI, which are 0.0678, 0.8361, 0.0507, and 0.1844, respectively, are greater than 0.05, so we accept the null hypothesis, which states that there is no significant effect of the previous variables in GDP per capita.
We also note the significance of the calculated F value is below the level of significance (0.05), because its probabilistic value has reached 000.0, which is less than 0.05, and this means that the estimated model as a whole is significant; in addition, the value of the coefficient of determination R2 reached 0.84, which means that the estimated model as a whole is significant. The independent variables explain 84% of the changes in economic growth, while the remaining 16%) are due to factors found within the random error.
4.1.2. Selection of the Appropriate Model
For differentiation between study models, we perform two types of tests: the first are Lagrange Multiplier Tests, to verify if the study model is an appropriate synthesis model, or if it is a fixed- or randomized-effects model; if the synthesis model is inappropriate, we conduct a second test, a Hausman Test, which differentiates between the fixed-effects and random-effects models.
Lagrange Multiplier Tests
Lagrange Multiplier Tests are based on two hypotheses: H0 (the aggregate regression model is appropriate), and H1 (the fixed-effects or random-effects model is appropriate).
From the Table 9, we note that the test value is 1989.298, with a probability equal to 0.0000, which is less than 5%, which means rejecting the null hypothesis H0, and accepting the alternative hypothesis H1, whichever fixed or random-effects model is appropriate.
Hausman Test
The Hausman Test makes a comparison between the fixed-effects model and the random-effects model, based on two main hypotheses, the null hypothesis H0 (the random-effects model is appropriate), and the alternative hypothesis H1 (the fixed-effects model is appropriate).
Through Table 10 we note that the probability corresponding to the Hausman test is 0.0047, which is less than 5%, from which we accept the alternative hypothesis H1 and reject the null hypothesis H0. When observing the fixed-effects model, it transpires that the model is significant and that the explanatory power of the model is high through the value of the coefficient of determination R2.
That is, the appropriate model for our study is the fixed-effects model, as shown in Table 11.
It is clear from the model estimated above, in Table 11, that the value of the fixed limit C of the model is significant below the level of significance (0.05), because the t-test probability value for the fixed limit of 0.0000 is less than the level of significance (0.05)—that is, we reject the null hypothesis, which states that there is no significant fixed term, and we accept the alternative hypothesis that states the significance of the limit is fixed.
From the previous table (Table 11), we note that the probability corresponding to Fisher’s statistic is equal to 0.000000, which is less than 5%, and the model is significant. In addition, the coefficient of determination R2 is estimated by 0.936837, that is, the independent variables explain the dependent variable with 0.94%, and the rest are explained by other variables that were not included in the model, as the probability corresponding to Fisher’s statistic for variables shows that it is less than 5%, meaning that all variables are significant, except for TF, EDUC, and FDI. The variables number of fixed telephone users (per 100 people), expenditure on education (in US dollars), and foreign direct investment (% of GDP) are is not significant. In addition, the model can be written as follows:
Graphic Representation of Current and Estimated Values
From Figure 6, we notice a match between the current and estimated values, which indicates the existence of stability in the model.
Fixed Effects of Countries
From the country fixed-effects Table 13, we note that only China, Indonesia, Mexico, Morocco, Philippines, Sri Lanka, and Turkey have a negative effect, ranging between 2.94 × 10⁻¹⁴ for China and 0.454377 for Turkey. As for the rest of the variables, they have a positive effect, ranging between 0.003616, which belonged to Iran, and 7.011929, which belonged to Algeria.
5. Discussion
This study aimed to measure the impact of the knowledge economy (number of mobile phone users, number of fixed telephone users, Internet users, expenditure on education, patent applications for residents, control of corruption, political stability, trade openness (exports + imports), foreign direct investment, and total value of international trade) on economic growth in 20 developing countries, for the period 1996–2020. Using the economic measurement of the panel data, the study concluded that the economic growth of the countries under study is linked to a positive relationship with some knowledge indicators, which are the number of mobile phone users, the number of fixed telephone users, expenditure on education, the control of corruption, political stability, foreign direct investment, and the total value of international trade. This is in line with economic theory, which is the result recorded for the improvement of knowledge economy indicators and its impact on raising economic growth rates.
While some knowledge economy indicators (expenditure on education, patent applications for residents, trade openness ((exports + imports)/gross domestic product)) have an inverse relationship with economic growth rates, this result contradicts the economic theory, and the study hypotheses can be verified.
Moreover, we found that the following hypotheses were proven correct: H1, H2, H3, H6, H7, H9, and H10.
Hypothesis 1 (H1). The number of mobile phone users positively affects GNP per capita. Hypothesis 2 (H2). The number of fixed telephone users positively affects the per capita GDP. Hypothesis 3 (H3). Internet users positively affect per capita GNP. Hypothesis 6 (H6). The control of corruption positively affects the per capita share of the gross national product. Hypothesis 7 (H7). Political stability positively affects the per capita GNP. Hypothesis 9 (H9). Foreign direct investment positively affects the per capita gross national product. Hypothesis 10 (H10). The total value of international trade positively affects the per capita gross national product.
Proving the validity of this hypothesis, there is a positive relationship between the number of mobile phone users and economic growth, where the increase of one unit of the number of mobile phone users leads to an increase in growth by 0.0045 units. p < 05%, p = (0.000) Perhaps the most important characteristic of developing countries in this field is the increase in the number of mobile phone users, especially at the time of the spread of crises (e.g., the COVID-19 pandemic). The mobile phone is now the most widely used device in the world, and the companies that produce this device are now the leaders in the world economy, which reflects the position of this technology in global markets, and those developing countries, such as China, have the largest share of it. This result is consistent with the following studies: Irena Paličková, Mehrara, M. & Rezaei, A., Hoh Yan Chun, Mahboub, A Salman, M., Holtan, C., and Madesen, J. B.; however, it contrasts with the results of the following studies: Nour, S, S, OM, Hassan, M., Nour, S, SOM, and Jeffrey Kouton. Meanwhile, in our study, we found that the following hypotheses were incorrect: H4, H5, and H8.
The following hypotheses are not validated: Hypothesis 4 (H4). Expenditure on education positively affects the per capita GNP.; Hypothesis 5 (H5). Patent applications for residents, affect positively the per capita GNP.; Hypothesis 8 (H8). Trade openness ((exports + imports)/gross domestic product) positively affects the per capita GNP. The results of the studies are inconsistent with the following: Crisculio & Martin, Barro & Lee, Amin, M. & Matto, A., and Manjinder Kaur and Lakhwinder Singh.
6. Conclusions
The model we obtained (Equation (8)) shows the following results:
- There is a positive relationship between the number of mobile phone users and economic growth, where the increase of one unit of the number of mobile phone users leads to an increase in growth by 0.0045 units. Perhaps the most important characteristic of developing countries in this field is the increase in the number of mobile phone users, especially at the time of the spread of crises (e.g., the COVID-19 pandemic). The mobile phone is now the most widely used device in the world, and the companies that produce this device are now the leaders in the world economy, such as Apple, Samsung, Huawei, and others. This reflects the position of this technology in global markets, and those developing countries, such as China, have the largest share of it.
- Additionally, there is a positive relationship between the number of fixed telephone users and economic growth, where the increase of one unit of the number of fixed telephone users leads to an increase in growth by 0.00084 units. This indicator, over time, witnessed a decline due to the monopoly of the mobile phone during daily transactions, whether in work or social life. There is also a positive relationship between the percentage of Internet users and economic growth, where the increase in Internet users by one unit leads to a rise in growth by 0.01825 units, and this is due to the role that the use of the Internet plays in economic, financial, and commercial transactions. The time and distances have been shortened and thus the cost has been reduced. Meanwhile, there is a negative relationship between spending on education and economic growth, where an increase of one unit of spending on education leads to a decline in economic growth by 3.28 × 10⁻¹³ alone. Perhaps the most important characteristic of developing countries is their strong need for more spending and their interest in education, and of course to have strong education, it is vital to spend to provide the appropriate atmosphere for that by building schools, universities, and infrastructure, and providing all the requirements and equipment as well as good framing. The decline in economic growth here is explained because the fruits of education come in the long term, not in the short term.
There is a negative relationship between patent applications for residents and economic growth, where an increase in patents by a unit leads to a decrease in growth by 4.29 × 10−07 units, which is the opposite of what economic theory says. This can be explained by Schumpeter’s idea, which he called creative destruction, wherein any new invention cancels another invention. This new technology can monopolize the market for a period, until a new product is invented, during which time the institution can be affected. On the one hand, some inventions are not used in the current period, but rather take time until they have these needs in the market, so their impact will be in the long run. Some of them never see the light of day and are destroyed by newer technology, especially with the great acceleration in the world, and the intense competition between companies, which has a negative impact. There is a positive relationship between the control of corruption index and economic growth: increasing the anti-corruption index by one unit leads to an increase in economic growth by 0.051. This relationship proves the extent to which these countries rely on establishing principles of governance and combating corruption.
It is known that among the classification of developing countries is their appropriate climate for investment, and that in many developing countries, corruption was the reason for hindering progress, for example, Egypt. There is a positive relationship between the indicator of political stability and economic growth, where an increase of one unit of the political stability index leads to an increase in economic growth by 0.0052 units, and this is an important factor that explains the importance of political stability in economic progress and growth.
There is a negative relationship between trade openness and economic growth, where the increase in trade openness by one unit leads to a decline in economic growth by 0.00513 units, and this is an indication that developing countries are still in need of more openness to the outside, so that those developing countries can provide the appropriate climate for investment and trade, and thus exchange new technologies between countries and increase the per capita share of local produce. This is a result contrary to the economic theory, but it is a possible result, considering that the liberalization of global trade and the openness of the world’s economies to each other is a trend that is difficult to stand against, and such openness has risks for small economies with few resources, and therefore the liberalization may not bring the expected results from it. Therefore, the study recommends that economic decision makers in developing countries set policies that stimulate the development of production and increase its efficiency to the extent that it can compete with goods coming from other countries, with interest in the export of knowledge-based goods.
There is the existence of a positive relationship between foreign direct investment and economic growth, where an increase of one unit of foreign investment leads to an increase in economic growth by 0.00190 units, and foreign direct investment helps to transfer technology, and this is what the developing countries have benefited from in supporting their economies. Finally, there is a positive relationship between the value of total international trade and economic growth: increasing international trade by one unit contributes to raising economic growth by 7.88 × 10⁻¹³, as international trade plays a major role in developing economies and contributes significantly to GDP.
After conducting the standard study using panel models for a sample of 20 developing countries, the results indicated that the knowledge economy has a significant positive impact on economic growth represented by the per capita GDP. All indicators used in the study had a positive impact, except for the education indicator, which had a weak negative impact, and it is known that these countries still need more interest in education and keenness to establish a good education system, and to invest in human capital, to be the actual engine of their own economic growth. In addition, research and development represented by patents and the trade openness index had a negative impact. The most influential variables were the foreign direct investment, the value of total international trade, the percentage of Internet users, the number of mobile phone users and the value of the total international trade, and this reflects the great role of these indicators in bringing technology, benefiting from foreign capital, as well as providing the appropriate environment for investment, which is shown by the anti-corruption indicator. Corruption also had an impact on economic growth. In addition to all this, the equally important indicator is information and communication technology, which is the economic artery of every country; this indicator played a major role in the economy in the recent period, due to the transformation of the social and economic lifestyle with the knowledge economy. Sales in service sectors increased, and the largest international companies evolved in this sector, such as Amazon, and in sectors related to technology, such as Microsoft, Apple, and Samsung. In general, the indicators of the knowledge economy contributed positively to the increase in the per capita GDP, and thus played a major role in the achievement of developing countries in maintaining high growth rates during the past decades.
Through this study, we can say that it is time for reforms in developing countries, to emerge from the prison of focusing on traditional economic policies toward the vastness of built structural policies. The reforms should be based on recent trends in the field of economy and development, with a focus on high sectors. The added value, and perhaps the most important of these sectors, is the knowledge economy sector.
Moreover, based on the results that were reached during our study, we can offer some recommendations that officials can take into account when setting economic policies in the country, whether it is a fiscal policy or monetary policy. Investors (old—new) can also benefit from the results of that study by relying on investment in knowledge-based industries instead of traditional industries, focusing on human capital through training, and providing the necessary capabilities for workers to raise their skills. In addition, through the results of that study, researchers interested in this field can learn more about the strengths and weaknesses of the knowledge economy indicators by going deeper into the upcoming studies. Thus, the following recommendations can be made:
- Encouraging creativity and innovation among individuals, especially the working group;
- Creating the right environment for scientists and innovators to stop the brain drain;
- Raising the level of spending on the fields of education and scientific research;
- Updating educational programs with the requirements of the times and instilling a love of science and knowledge in young people;
- Stimulating investment in the fields of technology and modern technologies.
Finally, as with any research, this contribution comes with some limitations. First, given the method of data collection chosen, most developing countries imply a lack of data and a fallacy in that data. This might be considered a limitation of the study. Secondly, most developing countries are still importing technology from developed countries that may not suit their environment, and this leads to not reaping the fruits of knowledge expected to be obtained.
Hence, our study showed that the economic problem today is based on the abundance of information and not the traditional scarce resources, because the knowledge economy has become the decisive element in all aspects of economic activity, and knowledge has become the basis for any economic or social growth, and through that, the world has shifted from research and collision in order to sources scarce resources to search and clash in order to control as much knowledge sources as possible.
Future research should look at how to direct economic resources towards knowledge industries in a manner equivalent to the volume of resources directed towards investments in the sectors of construction, tourism, sports, and entertainment, and the need to search for ways to support scientific research and researchers in the field of knowledge technologies, thereby increasing the volume of spending on scientific research so that it constitutes a good percentage of gross national product, which has a positive impact on the country’s national economy.
Author Contributions
Methodology, M.M.A.M.; formal analysis, M.M.A.M.; writing—original draft preparation, G.N.; writing—review and editing, P.L. All authors have read and agreed to the published version of the manuscript.
Funding
This research received no external funding.
Institutional Review Board Statement
Not applicable.
Informed Consent Statement
Not applicable.
Data Availability Statement
The statistics of the World Bank (WDI) were relied on, while the data on foreign direct investment were obtained from the data of UNCTAD. These data can be found here: https://databank.worldbank.org/source/world-development-indicators (accessed on 11 January 2022).
Conflicts of Interest
The authors declare no conflict of interest.
References
- Powell, W.W.; Snellman, K.J.A.R.S. The knowledge economy. Annu. Rev. Sociol. 2004, 30, 199–220. [Google Scholar] [CrossRef] [Green Version]
- Hadad, S. Knowledge economy: Characteristics and dimensions. Manag. Dyn. Knowl. Econ. 2017, 5, 203–225. [Google Scholar] [CrossRef] [Green Version]
- Marti, J.M.V.; Cabrita, M.D.R. Entrepreneurial Excellence in the Knowledge Economy: Intellectual Capital Benchmarking Systems; Palgrave Macmillan: London, UK, 2012. [Google Scholar]
- Hackius, N.; Petersen, M. Blockchain in logistics and supply chain: Trick or treat? In Digitalization in Supply Chain Management and Logistics: Smart and Digital Solutions for an Industry 4.0 Environment. In Proceedings of the Hamburg International Conference of Logistics (HICL), Hamburg, Germany 12–13 October 2017; Epubli GmbH: Berlin, Germany, 2017; Volume 23. [Google Scholar]
- Hilbert, M. Big data for development: A review of promises and challenges. Dev. Policy Rev. 2016, 34, 135–174. [Google Scholar] [CrossRef] [Green Version]
- Philipp, H.; Mohamed, Z.; Niels, F.; Andy, N. Capturing value from big data–a taxonomy of data-driven business models used by start-up firms. Int. J. Oper. Prod. Manag. 2016, 36, 1382–1406. [Google Scholar]
- Brown-Liburd, H.; Vasarhelyi, M.A. Big Data and audit evidence. J. Emerg. Technol. Account. 2015, 12, 1–16. [Google Scholar] [CrossRef]
- Coyne, E.M.; Coyne, J.G.; Walker, K.B. Big Data information governance by accountants. Int. J. Account. Inf. Manag. 2018, 26, 153–170. [Google Scholar] [CrossRef] [Green Version]
- Olga, M.; Ian, F.; Ian, G.; Andy, V. Making sense of Big Data—Can it transform operations management? Int. J. Oper. Prod. Manag. 2017, 37, 37–55. [Google Scholar]
- Smeda, J. Benefits, Business Considerations and Risks of Big Data; Stellenbosch University: Stellenbosch, South Africa, 2015. [Google Scholar]
- Braunerhjelm, P. Entrepreneurship, Innovation and Economic Growth-past experience. In Current Knowledge and Policy Implications; CESIS, KTH Royal Institute of Technology: Stockholm, Sweden, 2010; p. 224. [Google Scholar]
- Lawal, N.A. Education and economic growth: The Nigerian experience. J. Emerg. Trends Econ. Manag. Sci. 2011, 2, 225–231. [Google Scholar]
- Solow, R.M. Technical change and the aggregate production function. Rev. Econ. Stat. 1957, 39, 312–320. [Google Scholar] [CrossRef] [Green Version]
- Denison, E. Trends in American Economic Growth; Brookings Institution Press: Washington, DC, USA, 2011. [Google Scholar]
- Kouton, J. Education expenditure and economic growth: Some empirical evidence from Côte d’Ivoire. J. Econ. Sustain. Dev. 2018, 9, 22–34. [Google Scholar]
- Connell, D.; Mina, A.; Probert, J. The ‘soft company’business model of high-tech growth. Acad. Manag. Proc. 2015, 2015, 12784. [Google Scholar] [CrossRef]
- Burgin, M. Theory of Knowledge: Structures and Processes; World Scientific: Singapore, 2016; Volume 5. [Google Scholar]
- Paličková, I.J.W. Influence of the knowledge economy on the economic growth and economic level of the countries. World 2014, 2, 26. [Google Scholar] [CrossRef]
- Criscuolo, C.; Martin, R. An Emerging Knowledge-Based Economy in China? Indicators from OECD Databases; OECD Publishing: Paris, France, 2004. [Google Scholar]
- Song, J.H. The key to organizational performance improvement: A perspective of organizational knowledge creation. Perform. Improv. Q. 2008, 21, 87–102. [Google Scholar] [CrossRef]
- Ghoneim, A.M.D. Egypt as a Knowledge Economy with Special Emphasis on the Role of Youth Research Paper Series; No. 28; Faculty of Economics and Political Science, Cairo University: Cairo, Egypt, 2008. [Google Scholar]
- Nour, S.S.O.M. Overview of knowledge economy in the Arab region. J. Knowl. Econ. 2015, 6, 870–904. [Google Scholar] [CrossRef] [Green Version]
- Mehrara, M.; Rezaei, A. Knowledge Economy Index (KEI) in Iran and comparison with other countries of region: The vision 1404 document. Int. J. Appl. 2015, 3, 1–7. [Google Scholar]
- Suzana, R.; Kasim, R. The Relationship of Knowledge Management Practices, Competencies and the Organizational Performance of Government Departments in 2010. Available online: http://citeseerx.ist.psu.edu/viewdoc/summary?doi=10.1.1.193.5249 (accessed on 19 February 2022).
- Utz, A. Fostering Innovation, Productivity, and Technological Change. 2006. Available online: http://citeseerx.ist.psu.edu/viewdoc/download?doi=10.1.1.517.9338&rep=rep1&type=pdf (accessed on 19 February 2022).
- Afzal, M.N.I.; Lawrey, R. Investigating World Bank knowledge assessment methodology (KAM) using data envelopment analysis (DEA): A study in the ASEAN region. Res. J. Sci. IT Manag. 2012, 1, 33–38. [Google Scholar]
- Amin, M.; Mattoo, A. Human Capital and the Changing Structure of the Indian Economy; World Bank: Washington, DC, USA, 2008. [Google Scholar]
- Barro, R.J.; Lee, J.-W. A New Data Set of Educational Attainment in the World, 1950–2010. J. Dev. Econ. 2013, 104, 184–198. [Google Scholar] [CrossRef]
- Weber, A.S. The role of education in knowledge economies in developing countries. Procedia-Soc. Behav. Sci. 2011, 15, 2589–2594. [Google Scholar] [CrossRef]
- Kaur, M.; Singh, L. Knowledge in the economic growth of developing economies. Afr. J. Sci. Technol. Innov. Dev. 2016, 8, 205–212. [Google Scholar] [CrossRef]
- Tew, J.H.; Lee, K.J.X.; Lau, H.C.; Hoh, Y.C.; Woon, S.P. Linkage between the Role of Knowledge and Economic Growth: A Panel Data Analysis. Ph.D. Thesis, Universiti Tunku Abdul Rahman Kampar Campus, Kampar, Malaysia, 2017. [Google Scholar]
- Salman, D.M.; Mahboub, A. ICT, Market Contestability and Economic Performance: Lessons from ERF Countries. 2007, Economic Research Forum. Available online: http://repository.msa.edu.eg/xmlui/handle/123456789/3292 (accessed on 19 February 2022).
- Hassan, M.K. FDI, information technology and economic growth in the MENA region. In Proceedings of the Economic Research Forum 10th Annual Conference, Marrakesh, Morocco, 16–18 December 2003; Citeseer: State College, PA, USA, 2014. [Google Scholar]
- Nour, S.S.O. ICT Opportunities and Challenges for Development in the Arab World; WIDER Discussion Paper: Helsinki, Finland, 2002. [Google Scholar]
- Guellec, D.; De La Potterie, B.V.P. R&D and productivity growth: Panel data analysis of 16 OECD countries. OECD Econ. Stud. 2002, 2001, 103–126. [Google Scholar]
- Hulten, C. Stimulating Economic Growth through Knowledge-Based Investment; OECD Publishing: Paris, France, 2013. [Google Scholar]
- Ang, J.B.; Madsen, J.B. Can second-generation endogenous growth models explain the productivity trends and knowledge production in the Asian miracle economies? Rev. Econ. Stat. 2011, 93, 1360–1373. [Google Scholar] [CrossRef] [Green Version]
- Davenport, T.H.; Beck, J.C. The attention economy. Ubiquity 2001, 2001, 1-es. [Google Scholar] [CrossRef]
- Jalila, A.-B.; Saif, A.-M. The Inclusion of Knowledge Economy Concepts in the Omani Social Studies Textbooks. Int. J. Educ. Res. Rev. 2020, 5, 274–286. [Google Scholar]
- Sheehan, P.; Houghton, J.W. A Primer on the Knowledge Economy; Centre for Strategic Economic Studies: Washington, DC, USA, 2000. [Google Scholar]
- Junaid, M.R. The Integration of Knowledge Resources and Logistic Resilience for Effective Disaster Management. Organ. Theory Rev. 2018, 2, 17–31. [Google Scholar] [CrossRef]
- Hogan, T. An Overview of the Knowledge Economy, with a Focus on Arizona. A report from the Productivity and Prosperity Project (P3). 2011. Available online: http://citeseerx.ist.psu.edu/viewdoc/summary (accessed on 19 February 2022).
- Brinkley, I. Defining the Knowledge Economy; The Work Foundation: London, UK, 2006; Volume 19. [Google Scholar]
- Foiadelli, F.; Anton, P.; Dvorak, P. Introducing the EBRD Knowledge Economy Index; European Bank for Reconstruction and Development: London, UK, 2019. [Google Scholar]
- Zakshevskii, V.G.; Merenkova, I.N.; Novikova, I.I.; Kusmagambetova, E.S.; Gavrilova, Z.V.; Parkhomov, E.A. Cognitive Modeling of the Diversified Rural Economy Development in the Context of Digitalization. In Proceedings of the Russian Conference on Digital Economy and Knowledge Management (RuDEcK 2020), Voronezh, Russia, 27–29 February 2020; Atlantis Press: Paris, France, 2020. [Google Scholar]
- Gupte, T. The Pursuit of Innovation: An Analysis of International Competitive Advantage in a Globalized Knowledge Economy. Bachelor’s Thesis, Claremont McKenna College, Claremont, CA, USA, 2018. [Google Scholar]
- Cavusoglu, B. Knowledge economy and north cyprus. Procedia Econ. Financ. 2016, 39, 720–724. [Google Scholar] [CrossRef] [Green Version]
- Chen, D.H.; Dahlman, C.J. The Knowledge Economy, the KAM Methodology and World Bank Operations; Chen, D.H., Dahlman, C.J., Eds.; World Bank Institute Working Paper; World Bank: Washington, DC, USA, 2005. [Google Scholar]
- Atkinson, R.D.; Andes, S.M. The 2008 State New Economy Index: Benchmarking Economic Transformation in the States. 2008. Available online: https://papers.ssrn.com/sol3/papers.cfm?abstract_id=1323828 (accessed on 19 February 2022).
- Robitaille, J.-P.; Lemelin, P.; Larivière, V. Les Familles de Brevets Triadiques: Méthode et Résultats. Compendium D’indicateurs de L’activité Scientifique et Technologique au Québec. 2009, pp. 85–99. Available online: https://papyrus.bib.umontreal.ca/xmlui/bitstream/handle/1866/23166/ost_dans_compendium2009.pdf?sequence=1 (accessed on 19 February 2022).
- Tchamyou, V.S. The role of knowledge economy in African business. J. Knowl. Econ. 2017, 8, 1189–1228. [Google Scholar] [CrossRef]
- Bogoviz, A.V. Industry 4.0 as a new vector of Growth and Development of Knowledge Economy. In Industry 4.0: Industrial Revolution of the 21st Century; Springer: Berlin/Heidelberg, Germany, 2019; pp. 85–91. [Google Scholar]
- Kolesnichenko, E.A.; Radyukova, Y.Y.; Pakhomov, N.N. The role and importance of knowledge economy as a platform for formation of industry 4.0. In Industry 4.0: Industrial Revolution of the 21st Century; Springer: Berlin/Heidelberg, Germany, 2019; pp. 73–82. [Google Scholar]
- Popkova, E.G.; Ragulina, Y.V.; Bogoviz, A.V. Industry 4.0: Industrial Revolution of the 21st Century; Springer: Berlin/Heidelberg, Germany, 2019; Volume 169. [Google Scholar]
- Romer, P.M. Increasing returns and long-run growth. J. Political Econ. 1986, 94, 1002–1037. [Google Scholar] [CrossRef] [Green Version]
- Lucas, R. Economic Development with Unlimited Supplies of Labour. Manch. Sch. Stud. 1988, 22, 3–42. [Google Scholar]
- Aghion, P.; Howitt, P. A Model of Growth through Creative Destruction; National Bureau of Economic Research: Cambridge, MA, USA, 1990. [Google Scholar]
- Huang, M.-H.; Rust, R.T. Artificial intelligence in service. J. Serv. Res. 2018, 21, 155–172. [Google Scholar] [CrossRef]
- Copeland, B.J.; Proudfoot, D. Artificial Intelligence: History, Foundations, and Philosophical Issues, in Philosophy of Psychology and Cognitive Science; Elsevier: Amsterdam, The Netherlands, 2007; pp. 429–482. [Google Scholar]
- PwC. Sizing the Prize PwC’s Global Artificial Intelligence,: Exploiting the AI Revolution What is the Real Value of AI for Your Business and How Can You Capitalize? 2017. Available online: https://www.pwc.com/gx/en/issues/data-and-analytics/publications/artificial-intelligence-study.html (accessed on 19 February 2022).
- Kaivo-Oja, J.; Petri, V.; Harri, J.; Jari, S. The effects of the internet of things and big data to organizations and their knowledge management practices. In International Conference on Knowledge Management in Organizations; Springer: Berlin/Heidelberg, Germany, 2015. [Google Scholar]
- Haller, S. The things in the Internet of Things. Poster at the (IoT 2010). Tokyo Jpn. Novemb. 2010, 5, 26–30. [Google Scholar]
- Qin, J. The Research of the Library Services Based on Internet of Things. In Proceedings of the 4th International Symposium on Social Science, Dalian, China, 12–13 May 2018; Atlantis Press: Paris, France, 2018. [Google Scholar]
- Rot, A.; Sobinska, M. The Potential of the Internet of Things in Knowledge Management System. FedCSIS (Position Papers). 2018. Available online: https://annals-csis.org/Volume_15/drp/pdf/position.pdf#page=75 (accessed on 19 February 2022).
- Bhatia, A.; Yusuf, Z.; Ritter, D.; Hunke, N. Who will win the IoT platform wars? BCG Perspectives. 2017. Available online: https://www.bcg.com/publications/2017/technology-industries-technology-digital-who-will-win-the-iot-platform-wars (accessed on 19 February 2022).
- Szewczyk, P. Impact of the Internet of Things on the economy and society. Zesz. Naukowe. Organ. I Zarządzanie/Politech. Śląska 2016, 93, 461–470. [Google Scholar]
- Schubert, C.; Van Langeveld, M.C.; Donoso, L.A. Innovations in 3D printing: A 3D overview from optics to organs. Br. J. Ophthalmol. 2014, 98, 159–161. [Google Scholar] [CrossRef] [PubMed]
- Shen, Z.; Chen, F.; Zhu, X.; Yong, K.T.; Gu, G. Stimuli-responsive functional materials for soft robotics. J. Mater. Chem. B 2020, 8, 8972–8991. [Google Scholar] [CrossRef] [PubMed]
- Shahrubudin, N.; Koshy, P.; Alipal, J.; Kadir, M.H.A.; Lee, T.C. Challenges of 3D printing technology for manufacturing biomedical products: A case study of Malaysian manufacturing firms. Heliyon 2020, 6, e03734. [Google Scholar] [CrossRef] [PubMed]
- Frame, J.; Lopez, N.; Curet, O.; Engeberg, E.D. Thrust force characterization of free-swimming soft robotic jellyfish. Bioinspiration Biomim. 2018, 13, 64001. [Google Scholar] [CrossRef] [PubMed]
- Pasricha, A.; Greeninger, R. Exploration of 3D printing to create zero-waste sustainable fashion notions and jewelry. Fash. Text. 2018, 5, 1–18. [Google Scholar] [CrossRef]
- Rahman, M.A.; Islam, M.Z.; Gibbon, L.; Ulven, C.A.; La Scala, J.J. 3D printing of continuous carbon fiber reinforced thermoset composites using UV curable resin. Polym. Compos. 2021, 42, 5859–5868. [Google Scholar] [CrossRef]
- Singh, B.; Kumar, R.; Chohan, J.S. Polymer matrix composites in 3D printing: A state of art review. Mater. Today Proc. 2020, 33, 1562–1567. [Google Scholar] [CrossRef]
- El Mogy, T.; Rabea, D. An overview of 3D printing technology effect on improving solar photovoltaic systems efficiency of renewable energy. Proc. Int. Acad. Ecol. Environ. Sci. 2021, 11, 52–67. [Google Scholar]
- Greene, W. Alternative Panel Data Estimators for Stochastic Frontier Models; Working paper; Stern School of Business, New York University: New York, NY, USA, 2002. [Google Scholar]
- Baltagi, B.H.; Baltagi, B.H. Econometric Analysis of Panel Data; Springer: Berlin/Heidelberg, Germany, 2008; Volume 4. [Google Scholar]
- Hsiao, C. Analysis of Panel Data; Cambridge University Press: Cambridge, UK, 2014. [Google Scholar]
- Pillai, V.N. Panel Data Analysis with Stata Part 1 Fixed Effects and Random Effects Models. MPRA Paper. 2016, p. 76869. Available online: https://www.researchgate.net/profile/Reza-Radmehr-2/post/Brant-test-for-ordered-logit-with-panel-data/attachment/5c9c5a16cfe4a729949964a7/AS%3A741297686056960%401553750549991/download/LSDV.pdf (accessed on 19 February 2022).
- Hausman, J.A.; Taylor, W.E. Panel data and unobservable individual effects. Econometrica. J. Econom. Soc. 1981, 49, 1377–1398. [Google Scholar] [CrossRef] [Green Version]
- Wooldridge, J.M. Econometric Analysis of Cross Section and Panel Data; MIT Press: Cambridge, MA, USA, 2010. [Google Scholar]
- Baltagi, B.H.; Bresson, G.; Pirotte, A. Fixed effects, random effects or Hausman–Taylor? A pretest estimator. Econ. Lett. 2003, 79, 361–369. [Google Scholar] [CrossRef]
- Conover, W.J.; Johnson, M.E.; Johnson, M.M. A comparative study of tests for homogeneity of variances, with applications to the outer continental shelf bidding data. Technometrics 1981, 23, 351–361. [Google Scholar] [CrossRef]
- Conover, W.J.; Guerrero-Serrano, A.J.; Tercero-Gómez, V.G. An update on ‘a comparative study of tests for homogeneity of variance’. J. Stat. Comput. Simul. 2018, 88, 1454–1469. [Google Scholar] [CrossRef]
Figure 1.
Knowledge economy indicators (KEI).

Figure 2.
Features of the development of the knowledge economy. Source: Kolesnichenko, Elena A., Yana Y. Radyukova, and Nikolai N. Pakhomov. “The role and importance of knowledge economy as a platform for formation of industry 4.0.” Industry 4.0: Industrial Revolution of the 21st Century. Springer, Cham, 2019. p. 79 [54].

Figure 3.
Channels of impact of the knowledge economy on economic growth. Source: Prepared by the authors based on previous studies.
Figure 3.
Channels of impact of the knowledge economy on economic growth. Source: Prepared by the authors based on previous studies.

Figure 4.
The expected economic gains from artificial intelligence techniques. Source: PWC Global. “Sizing the prize PwC’s Global Artificial Intelligence Study: Exploiting the AI Revolution What is the real value of AI for your business and how can you capitalize?” [60].
Figure 4.
The expected economic gains from artificial intelligence techniques. Source: PWC Global. “Sizing the prize PwC’s Global Artificial Intelligence Study: Exploiting the AI Revolution What is the real value of AI for your business and how can you capitalize?” [60].

Figure 5.
The relationship between the global knowledge index and per capita GDP.

Figure 6.
Graphic representation of current and estimated values. Source: Prepared by researchers based on EViews 9 outputs.
Figure 6.
Graphic representation of current and estimated values. Source: Prepared by researchers based on EViews 9 outputs.

Figure 7.
The results of the normal distribution test for the dependent variable using the Jarque–Bera test. Source: Prepared by researchers based on EViews 9 outputs.
Figure 7.
The results of the normal distribution test for the dependent variable using the Jarque–Bera test. Source: Prepared by researchers based on EViews 9 outputs.


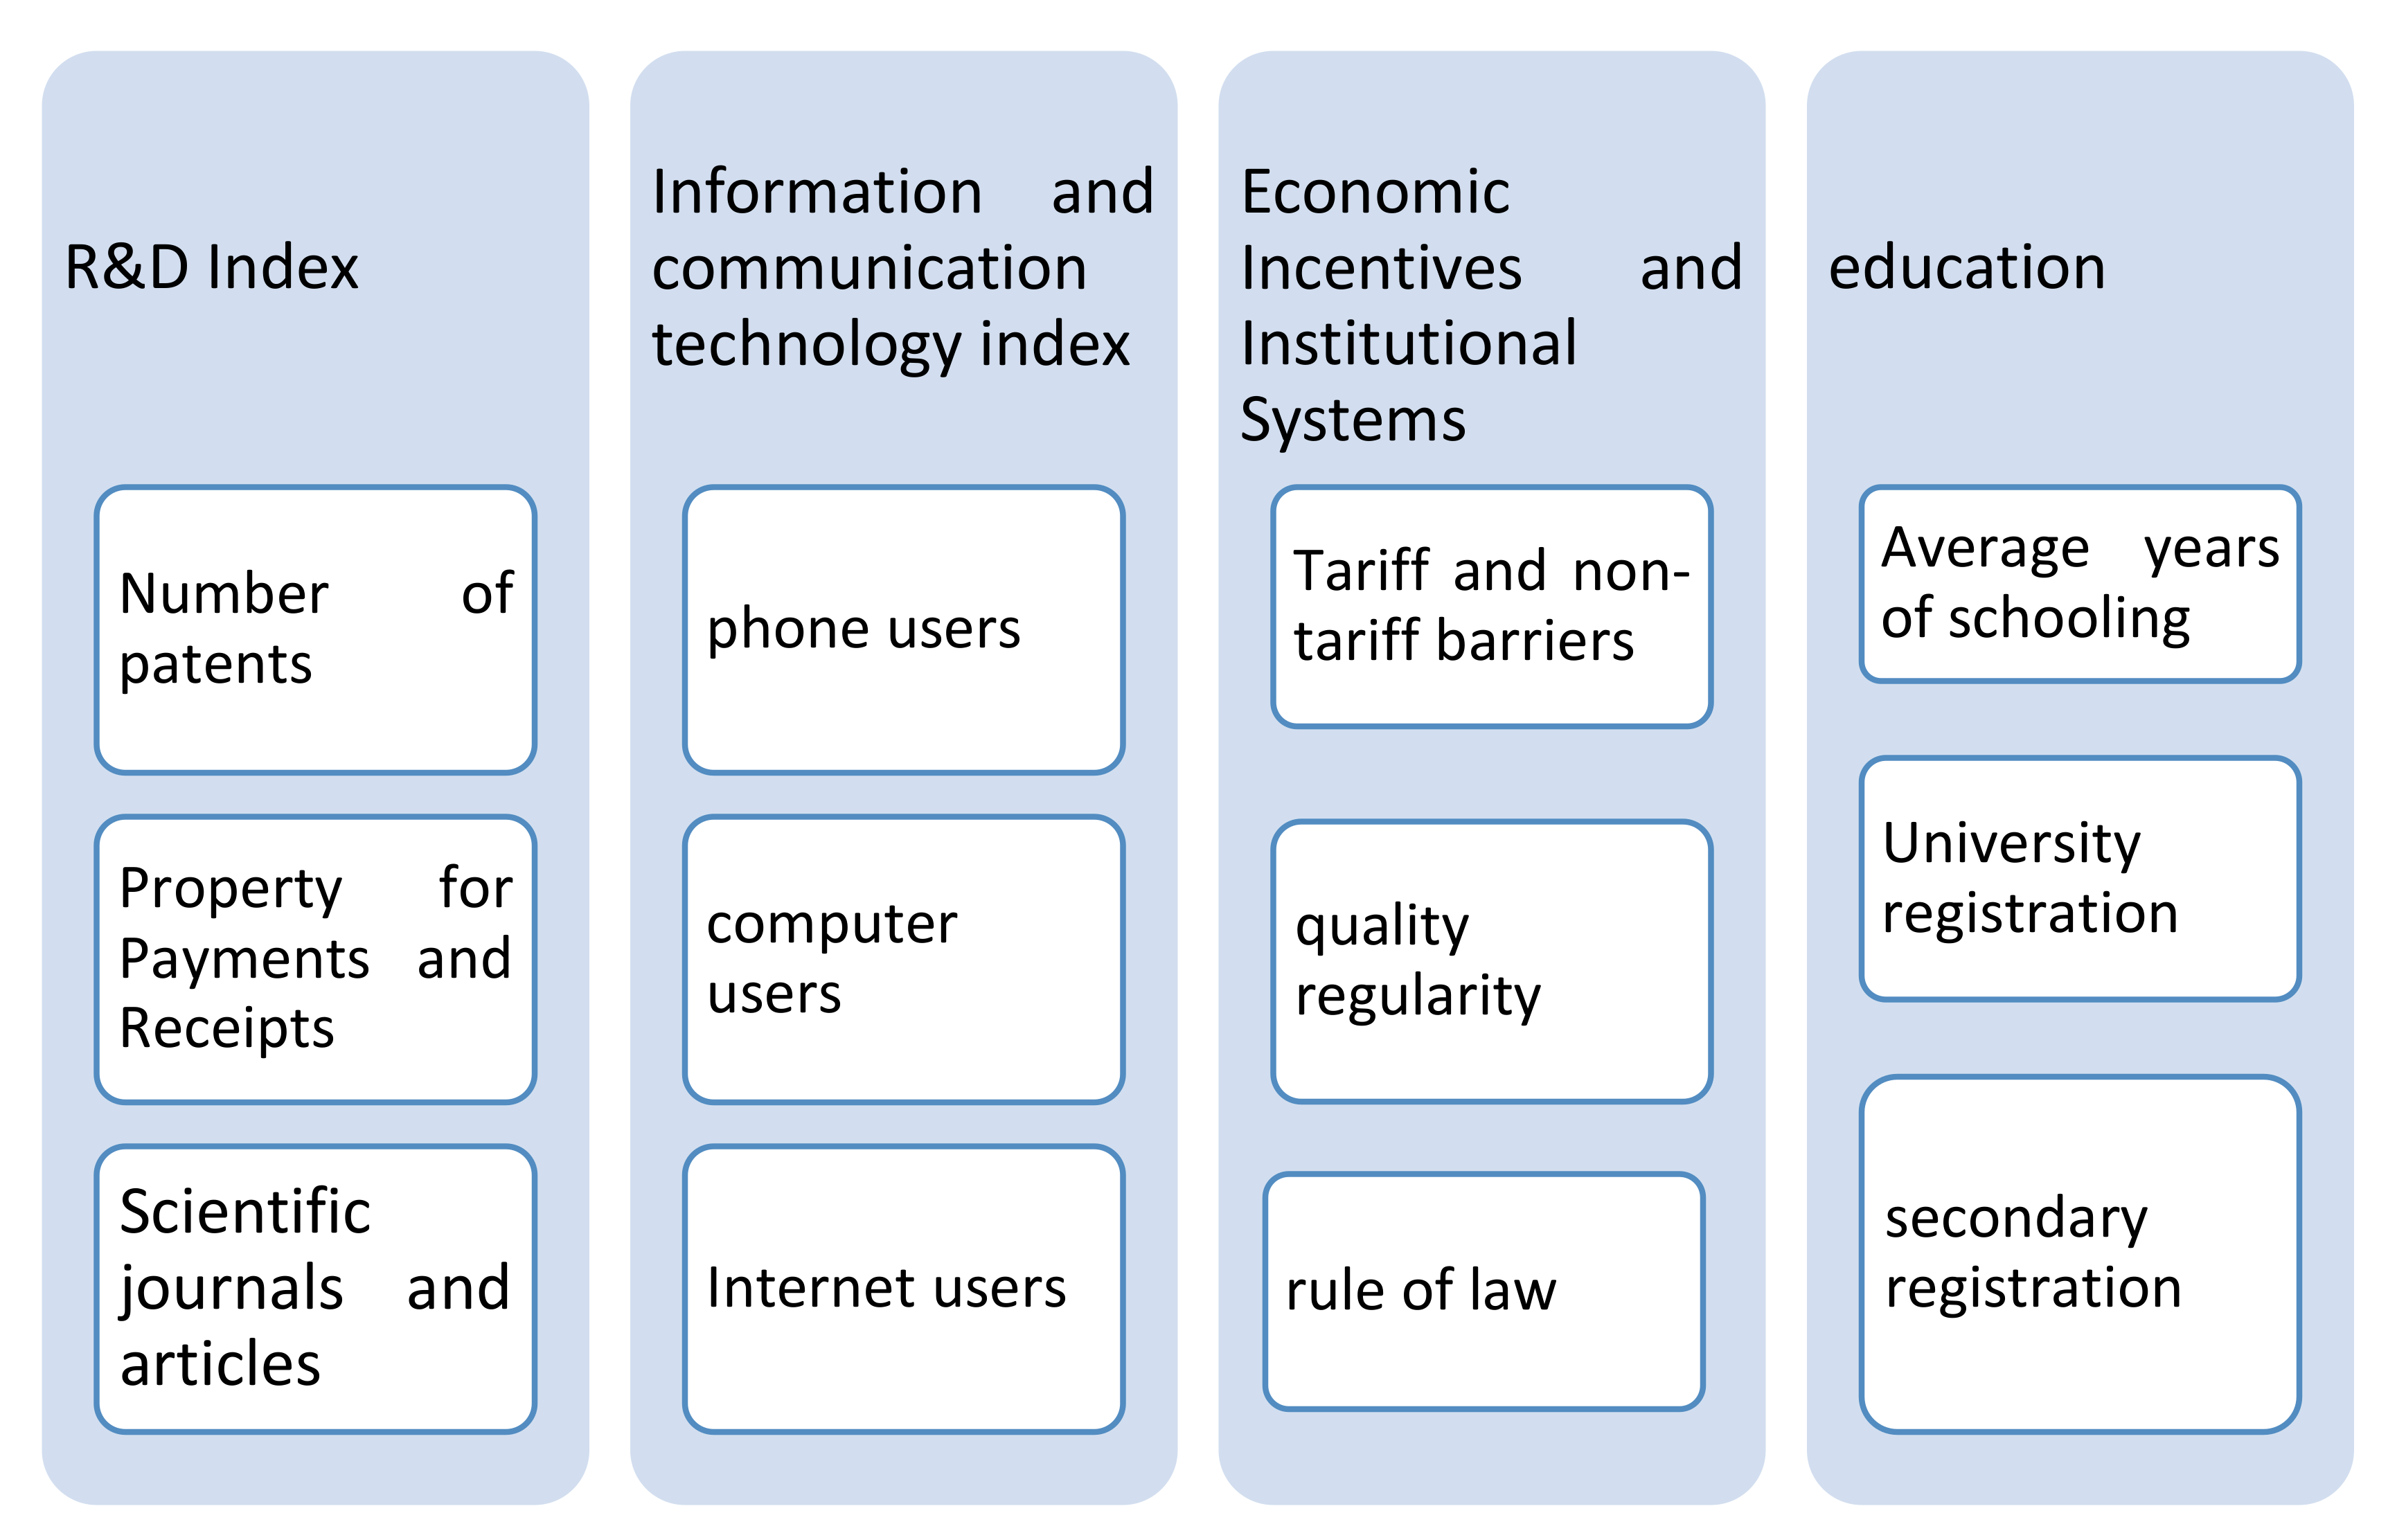
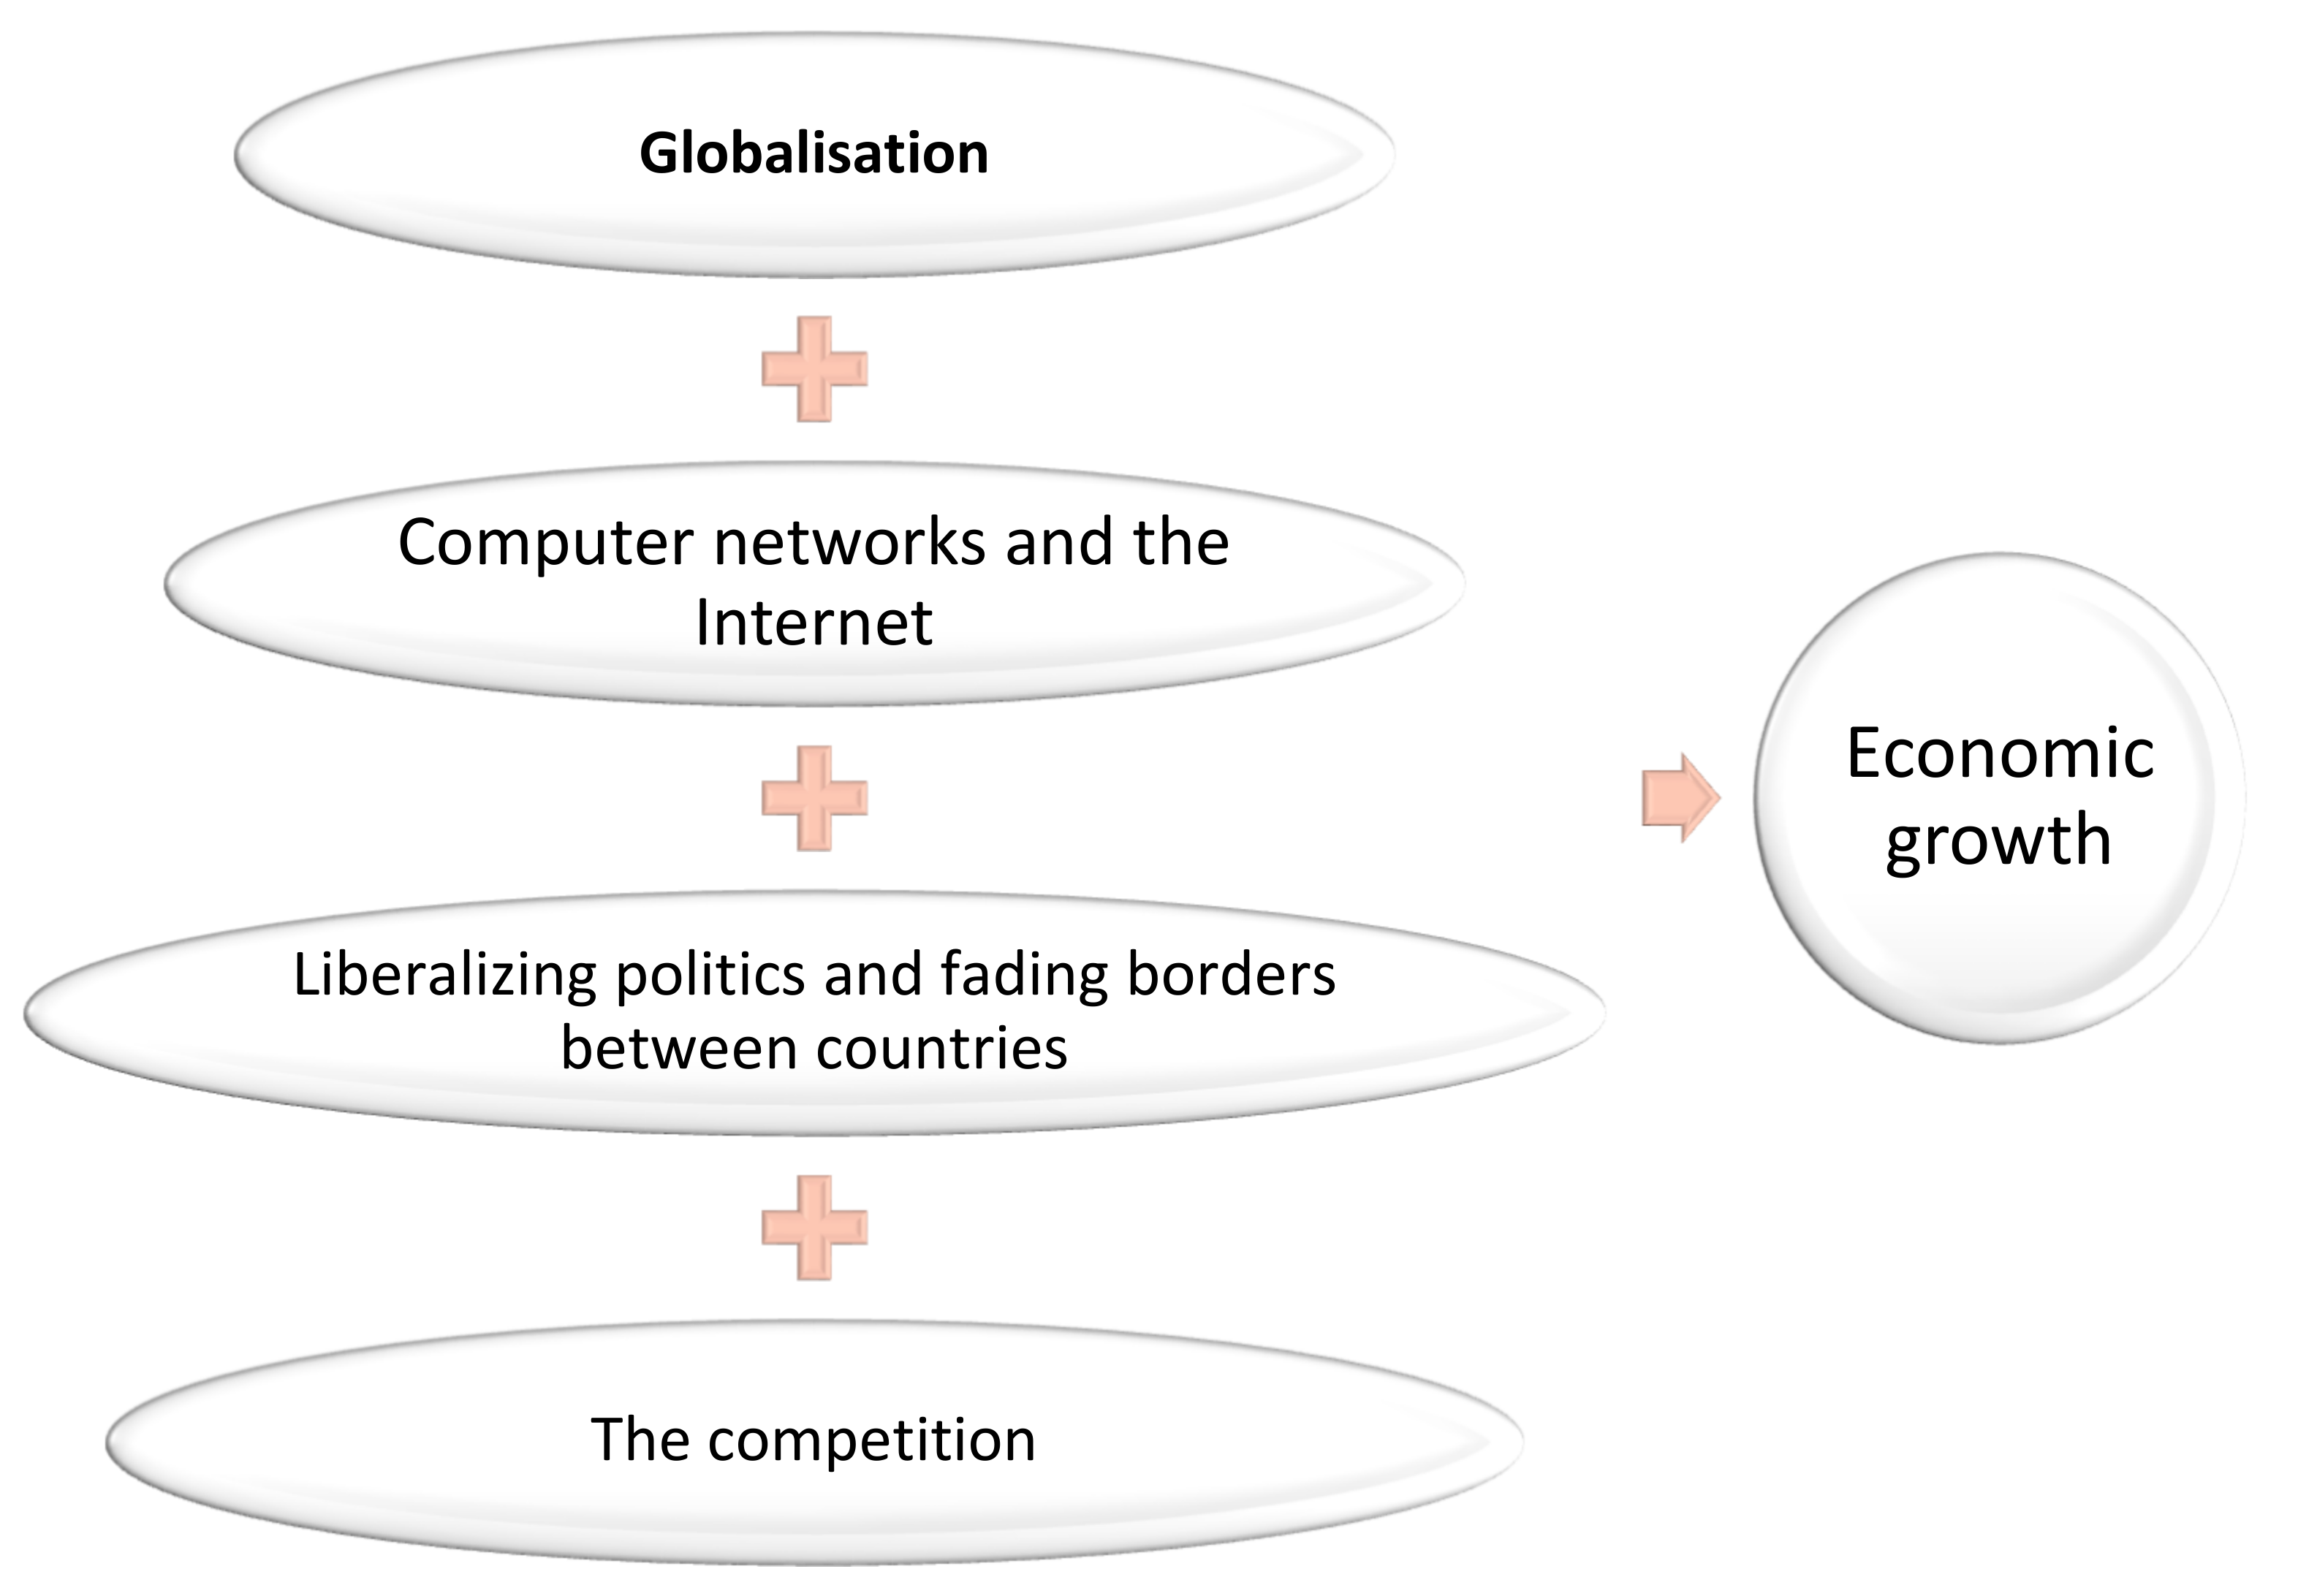
Table 1.
Pros and cons of using the panel data.
| Positives | Negatives |
|---|---|
|
|
|
|
|
|
| |
| |
|
Source: Prepared by the authors based on previous studies.
Table 2.
Description of the study variables.
| Variables | Interpretation of Variables |
|---|---|
| LNGDP | GDP per capita (at current US dollar prices) |
| TIC | Number of mobile phone users (per 100 people) |
| TF | Number of fixed telephone users (per 100 people) |
| INTE | Internet users per 100 people |
| EDUC | Expenditure on education (in US dollars) |
| R&D | Patent applications for residents |
| CC | Control of corruption |
| SP | Political stability |
| OC | Trade openness ((exports + imports)/gross domestic product) |
| FDI | Foreign direct investment (% of GDP) |
| TVI | Total value of international trade |
Data sources: The statistics of the World Bank (WDI) were relied on, while the data on foreign direct investment were obtained from the data of UNCTAD.
Table 3.
Summary statistics of innovation variables, TIC, TF, INTE, EDUC, R&D, CC, SP, OC, FDI, TVI, and LNGDP.
Table 3.
Summary statistics of innovation variables, TIC, TF, INTE, EDUC, R&D, CC, SP, OC, FDI, TVI, and LNGDP.
| Indices | LNGDP | TIC | TF | INTE | EDUC | R&D | CC | SP | OC | FDI | TVI |
|---|---|---|---|---|---|---|---|---|---|---|---|
| Mean | 8.340875 | 70.23456 | 16.04101 | 6.085567 | 1.84 × 10¹⁰ | 23,634.78 | 11.37827 | 35.70098 | 67.44349 | 1.151713 | 1.35 × 10¹¹ |
| Median | 8.341961 | 80.19977 | 14.58786 | 2.501567 | 6.15 × 10⁹ | 534.0000 | 12.00000 | 32.16080 | 59.31582 | 0.291274 | 4.96 × 10¹⁰ |
| Maximum | 9.725157 | 192.2145 | 38.81773 | 33.80113 | 2.55 × 10¹¹ | 139,3815 | 17.00000 | 91.48936 | 168.2428 | 97.34762 | 2.59 × 10¹² |
| Minimum | 6.139773 | 0.011586 | 1.388605 | 1.25 × 10⁻⁵ | 3.33 × 10⁸ | 22.00000 | 2.000000 | 2.645503 | 15.63559 | −42.71673 | 3.13 × 10⁹ |
| Std.Dev. | 0.795114 | 51.14502 | 9.370713 | 7.780055 | 3.46 × 10¹⁰ | 145,778.4 | 3.539776 | 21.48950 | 31.59532 | 6.801784 | 3.43 × 10¹¹ |
| Skewness | −0.244721 | −0.016458 | 0.540622 | 1.432313 | 4.029757 | 7.517971 | −0.455273 | 0.475341 | 1.061734 | 8.366911 | 5.411967 |
| Kurtosis | 2.193319 | 1.654648 | 2.397029 | 4.378241 | 21.60376 | 60.94229 | 1.965151 | 2.240534 | 3.874142 | 108.4396 | 33.46196 |
| Jarque-Bera | 18.43637 | 37.50394 | 31.73892 | 209.2708 | 8512.277 | 74,206.00 | 39.34599 | 30.66041 | 109.2001 | 236,023.8 | 21,642.04 |
| Probability | 0.000099 | 0.000000 | 0.000000 | 0.000000 | 0.000000 | 0.000000 | 0.000000 | 0.000000 | 0.000000 | 0.000000 | 0.000000 |
| Sum | 4145.415 | 34,906.58 | 7972.380 | 3024.527 | 9.12 × 10¹² | 11,746,487 | 5655.000 | 17,743.39 | 33,519.41 | 572.4016 | 6.73 × 10¹³ |
| SumSq.Dev. | 313.5743 | 1,297,443 | 43,553.89 | 30,022.51 | 5.94 × 10²³ | 1.05 × 10¹³ | 6214.885 | 229,052.2 | 495,139.2 | 22,947.07 | 5.85 × 1025 |
| Observations | 500 | 500 | 500 | 500 | 500 | 500 | 500 | 500 | 500 | 500 | 500 |
Source: Prepared by the author based on EViews 9 outputs.
Table 4.
Matrix of correlation between study variables.
| Variable | LNGDP | TIC | TF | INTE | EDUC | R_D | CC | SP | OC | FDI | TVI |
|---|---|---|---|---|---|---|---|---|---|---|---|
| LNGDP | 1 | ||||||||||
| TIC | 0.67 | 1 | |||||||||
| TF | 0.52 | 0.15 | 1 | ||||||||
| INTE | 0.72 | 0.68 | 0.31 | 1 | |||||||
| EDUC | 0.33 | 0.20 | 0.088 | 0.37 | 1 | ||||||
| R&D | 0.12 | 0.078 | 0.0090 | 0.32 | 0.79 | 1 | |||||
| CC | 0.58 | 0.82 | 0.083 | 0.53 | 0.25 | 0.055 | 1 | ||||
| SP | 0.40 | 0.066 | 0.47 | 0.30 | −0.057 | −0.027 | −0.059 | 1 | |||
| OC | 0.15 | 0.23 | 0.15 | 0.34 | −0.29 | −0.131 | 0.17 | 0.32 | 1 | ||
| FDI | 0.17 | 0.10 | 0.143 | 0.21 | −0.016 | −0.002 | 0.059 | 0.166 | 0.24 | 1 | |
| TVI | 0.19 | 0.13 | 0.062 | 0.35 | 0.86 | 0.91 | 0.167 | −0.054 | −0.13 | 0.01 | 1 |
Source. Authors’ computations using E-View Version 9.0.
Table 5.
Test for equality of variances between series.
| Method | df | Value | Probability |
|---|---|---|---|
| Bartlett | 9 | 175095.1 | 0.0000 |
| Levene | (9, 4987) | 108.1080 | 0.0000 |
| Brown–Forsythe | (9, 4987) | 56.69224 | 0.0000 |
Source. Authors’ computations using E-View Version 9.0.
Table 6.
Category statistics.
| Mean Abs. | Mean Abs. | |||
|---|---|---|---|---|
| Variable | Count | Std. Dev. | Mean Diff. | Median Diff. |
| LNGDP | 500 | 0.792814 | 0.660569 | 0.660560 |
| TIC | 500 | 51.06431 | 45.83906 | 45.31824 |
| TF | 500 | 9.343591 | 7.815809 | 7.762982 |
| INTE | 500 | 7.763583 | 6.199492 | 5.602230 |
| EDUC | 500 | 3.45 × 10¹⁰ | 1.89 × 10¹⁰ | 1.53 × 10¹⁰ |
| R_D | 497 | 145778.4 | 42519.15 | 23417.41 |
| CC | 500 | 3.537827 | 3.116560 | 3.032000 |
| SP | 500 | 21.43747 | 18.17058 | 17.93893 |
| OC | 500 | 31.52767 | 24.53983 | 23.55689 |
| TVI | 500 | 3.42 × 10¹¹ | 1.46 × 10¹¹ | 1.14 × 10¹¹ |
| All | 4997 | 1.16 × 10¹¹ | 1.65 × 10¹⁰ | 1.29 × 10¹⁰ |
| Bartlett weighted standard deviation: 1.09 × 10¹¹ | ||||
Source: Prepared by the authors based on EViews 9 outputs.
Table 7.
Variance inflation coefficient values (VIF).
| Variable | TIC | TF | INTE | EDUC | R&D | CC | SP | OC | FDI | TVI |
|---|---|---|---|---|---|---|---|---|---|---|
| VIF | 4.26251 | 1.37619 | 2.87187 | 5.29095 | 6.76466 | 3.54109 | 1.55845 | 1.72611 | 1.09769 | 9.67663 |
Source: Prepared by the authors based on EViews 9 outputs.
Table 8.
Model estimation by cumulative regression, fixed effects, and random effects.
| Dependent Variable: LNGDP (Per Capita GDP) | |||
|---|---|---|---|
| Period: (1996–2020), Number of Panel Views: 497 | |||
| Explanatory Variables | Aggregate Regression Model (PRM) | Fixed-Effects Model (FEM) | Random-Effects Model (REM) |
| TIC | 0.004035 (0.0000) | 0.004458 (0.0000) | 0.004413 (0.0000) |
| TF | 0.022180 (0.0000) | 0.000842 (0.7371) | 0.004335 (0.0678) |
| INTE | 0.034424 (0.0000) | 0.018249 (0.0000) | 0.020021 (0.0000) |
| EDUC | 6.16 × 10⁻¹² (0.0000) | −3.28 × 10⁻¹³ (0.7525) | 2.11 × 10⁻¹³ (0.8361) |
| R&D | −9.91 × 10−07 (0.0018) | −4.29 × 10−07 (0.0372) | −3.96 × 10−07 (0.0507) |
| CC | 0.033482 (0.0004) | 0.050686 (0.0000) | 0.048199 (0.0000) |
| SP | 0.007571 (0.0000) | 0.005173 (0.0000) | 0.005948 (0.0000) |
| OC | −0.002991 (0.0001) | −0.005129 (0.0000) | −0.004500 (0.0000) |
| FDI | 0.003213 (0.2381) | 0.001901 (0.1988) | 0.001962 (0.1844) |
| TVI | −1.50 × 10⁻¹³ (0.3494) | 7.88 × 10⁻¹³ (0.0000) | 6.79 × 10⁻¹³ (0.0000) |
| R-squared | 0.760221 | 0.936837 | 0.850547 |
| Adjusted R-squared | 0.755288 | 0.932770 | 0.847472 |
| F-statistic | 154.0869 | 230.3899 | 276.5857 |
| Prob(F-statistic) | 0.000000 | 0.000000 | 0.000000 |
Table 9.
Lagrange Multiplier Tests.
| Lagrange Multiplier Tests for Random Effects | |||
|---|---|---|---|
| Cross-Section | Time | Both | |
| Breusch-Pagan | 1988.824 | 0.474255 | 1989.298 |
| (0.0000) | (0.4910) | (0.0000) | |
Source: Prepared by the authors based on EViews 9 outputs.
Table 10.
Hausman Test.
| Correlated Random Effects—Hausman Test | |||
|---|---|---|---|
| Test Summary | Chi-Sq. Statistic | Chi-Sq. d.f. | Prob. |
| Period random | 25.391195 | 10 | 0.0047 |
Table 11.
Fixed-effects model.
| Fixed-Effects Model (FEM) | ||
|---|---|---|
| Variable | Coefficient | Prob. |
| TIC | 0.004458 | (0.0000) |
| TF | 0.000842 | (0.7371) |
| INTE | 0.018249 | (0.0000) |
| EDUC | −3.28 × 10⁻¹³ | (0.7525) |
| R&D | −4.29 × 10−07 | (0.0372) |
| CC | 0.050686 | (0.0000) |
| SP | 0.005173 | (0.0000) |
| OC | −0.005129 | (0.0000) |
| FDI | 0.001901 | (0.1988) |
| TVI | 7.88 × 10⁻¹³ | (0.0000) |
| C | 7.395045 | (0.0000) |
| R-squared | 0.936837 | |
| Adjusted R-squared | 0.932770 | |
| F-statistic | 230.3899 | |
| Prob(F-statistic) | 0.000000 | |
Table 12.
The results of the normal distribution test for the dependent variable using the Jarque–Bera test.
Table 12.
The results of the normal distribution test for the dependent variable using the Jarque–Bera test.
| Jarque–Bera | Probability |
|---|---|
| 0.77162 | 0.679900 |
Table 13.
The results of fixed effects of countries.
| Country | Effect | Country | Effect | Country | Effect | Country | Effect | ||||
|---|---|---|---|---|---|---|---|---|---|---|---|
| 1 | Algeria | 7.011929 | 6 | China | −1.23 × 10⁻⁶ | 11 | Mexico | −2.94 × 10⁻¹⁴ | 16 | Romania | 0.107154 |
| 2 | Argentina | 0.004170 | 7 | Egypt | 0.031199 | 12 | Morocco | −0.296618 | 17 | Sri Lanka | −0.020692 |
| 3 | Brazil | 0.021957 | 8 | Hungary | 0.007512 | 13 | Peru | 0.338827 | 18 | Thailand | 0.232467 |
| 4 | Bulgaria | 0.034605 | 9 | Indonesia | −0.003197 | 14 | Philippines | −0.070077 | 19 | Tunisia | 0.078507 |
| 5 | Chile | 6.02 × 10⁻¹² | 10 | Iran | 0.003616 | 15 | Poland | 0.013477 | 20 | Turkey | −0.454377 |
Source: Prepared by researchers based on EViews 9 outputs.
Publisher’s Note: MDPI stays neutral with regard to jurisdictional claims in published maps and institutional affiliations. |
© 2022 by the authors. Licensee MDPI, Basel, Switzerland. This article is an open access article distributed under the terms and conditions of the Creative Commons Attribution (CC BY) license (https://creativecommons.org/licenses/by/4.0/).
Share and Cite
MDPI and ACS Style
Mohamed, M.M.A.; Liu, P.; Nie, G. Do Knowledge Economy Indicators Affect Economic Growth? Evidence from Developing Countries. Sustainability 2022, 14, 4774. https://0-doi-org.brum.beds.ac.uk/10.3390/su14084774
AMA Style
Mohamed MMA, Liu P, Nie G. Do Knowledge Economy Indicators Affect Economic Growth? Evidence from Developing Countries. Sustainability. 2022; 14(8):4774. https://0-doi-org.brum.beds.ac.uk/10.3390/su14084774
Chicago/Turabian StyleMohamed, Maha Mohamed Alsebai, Pingfeng Liu, and Guihua Nie. 2022. "Do Knowledge Economy Indicators Affect Economic Growth? Evidence from Developing Countries" Sustainability 14, no. 8: 4774. https://0-doi-org.brum.beds.ac.uk/10.3390/su14084774
Note that from the first issue of 2016, this journal uses article numbers instead of page numbers. See further details here.