
A Global Assessment: Can Renewable Energy Replace Fossil Fuels by 2050?


1
Department of Animal and Range Sciences, New Mexico State University, Las Cruces, NM 88003, USA
2
New Mexico Water Resources Research Institute, New Mexico State University, Las Cruces, NM 88003, USA
3
Department of Lands Management and Environment, Prince Al-Hasan Bin Talal Faculty for Natural Resources and Environment, The Hashemite University, Zarqa 13133, Jordan
4
Department of Fish, Wildlife and Conservation Ecology, New Mexico State University, Las Cruces, NM 88003, USA
*
Author to whom correspondence should be addressed.
Sustainability 2022, 14(8), 4792; https://0-doi-org.brum.beds.ac.uk/10.3390/su14084792
Submission received: 26 February 2022
/
Revised: 31 March 2022
/
Accepted: 8 April 2022
/
Published: 16 April 2022
(This article belongs to the Special Issue Renewable Energy and Sustainable Economy Transition)
Abstract
:Our study evaluated the effectiveness of using eight pathways in combination for a complete to transition from fossil fuels to renewable energy by 2050. These pathways included renewable energy development; improving energy efficiency; increasing energy conservation; carbon taxes; more equitable balancing of human wellbeing and per capita energy use; cap and trade systems; carbon capture, utilization, and storage; and nuclear power development. We used the annual ‘British Petroleum statistical review of world energy 2021’ report as our primary database. Globally, fossil fuels, renewable (primarily hydro, wind and solar), nuclear energy accounted for 83%, 12.6%, and 6.3% of the total energy consumption in 2020. To achieve zero fossil fuel use by 2050, we found that renewable energy production will need to be increased by up to 6-fold or 8-fold if energy demand is held constant at, or increased 50% from, the 2020 energy demand level. Constraining 2050 world energy demand to a 25% increase over the 2020 level, improves the probability of achieving independence from fossil fuels. Improvements in energy efficiency need to accelerate beyond the current rate of ~1.5% per year. Aggressive application of energy conservation policies involving land use and taxation could potentially reduce world energy use by 10% or more by 2050. Our meta-analysis shows that the minimum level of per capita energy consumption that would allow 8 billion people to have a ‘Decent Living Standard’ is on average ~70 GJ per capita per year, which is 93% of the 2020 global average. Developed countries in temperate climates with high vehicle-dependency needed ~120 GJ per capita year−1, whereas equatorial countries with low vehicle-dependency needed 30 GJ per capita year−1. Our meta-analyses indicated replacement of fossil fuels with renewable energy by 2050 may be possible but will require aggressive application of all eight pathways, major lifestyle changes in developed countries, and close cooperation among all countries.
1. Introduction
Climate change is now considered the major threat to the future of humanity by leading scientists [1,2,3,4]. Globally, the 10 hottest years on record have occurred since 2004 with the five hottest years in the 2015–2020 period [5]. Although 2020 was the second hottest year on record worldwide, for Europe it exceeded the previous high in 2018. Since 1980, extreme climatological events involving temperatures, droughts, and forest fires have quadrupled, whereas meteorological events such as extreme storms have doubled [6,7]. In the United States (US) more than twice as many billion-dollar disasters occurred in the 2010–2019 decade compared with the 2000–2009 decade [5]. In 2020, an all-time high of 22 weather and climate disasters exceeding a loss of one billion dollars occurred in the US shattering the previous record of 16 for 2011 and 2017 [5].
So far, the global temperature increase compared with pre-industrial times (before 1850) has been near 1.2 °C with 1.1 °C since 1900 [1,8]. Of deep concern is that the increase in temperature is accelerating and is projected to be at the 1.5 °C level within 15 to 20 years if emissions of greenhouse gases (GHG’s) are not drastically reduced [1,8]. Even with the 2015 International Paris Agreement to reduce GHG emissions, global temperatures have continued to increase due to the world’s increased use of fossil fuels and deforestation [1,8,9]. With continued reliance on fossil fuels as the primary energy source, a 3 °C or more temperature increase is predicted by the end of this century [1,10]. In October of 2018, the United Nation’s International Panel on Climate Change (IPCC) put the world on notice that exceeding a 1.5 °C temperature increase will be catastrophic with consequences of unprecedented flooding, drought, rising sea level, heat waves and famine [1,2]. The biggest concern is that a tipping point or threshold may soon be crossed because of accelerated climatic warming and instability imperiling a large portion of the human population [3,4,7,10,11,12].
In October of 2018, the IPCC [2] warned that CO2 emissions must be reduced 45% over 2010 levels by 2030 and reach net zero by 2050 to contain the global temperature increase to 1.5 °C. Various benefits of limiting temperature increase to 1.5 °C as opposed to 2 °C under the 2015 Paris Agreement were given. Very importantly, limiting global temperature increase to 1.5 °C would provide human societies and ecosystems more time to adapt to the process of climate change. Selection of approaches for achieving this objective has yet to be identified. Some experts have proposed rapid and widespread changes in the world economy involving energy use, land use, transport, industry, agriculture, and construction [13,14,15]. Because these changes would be very disruptive to the heavily globalized world economy, a less drastic approach focusing on development of renewable energy (primarily wind and solar) and enhancements in energy efficiency (decoupling) has been emphasized since the 2015 Paris Agreement by the primary CO2 emitters (i.e., China, the United States, the European Union, Japan, Russia, India, Brazil) [16,17].
A common concern is that persistent growth in the human population requires an ever increasing consumption of energy and other natural resources nullifying gains made from efficiency improvements in resource use and expansion of renewable energy production [13,18]. Another major concern, beyond CO2 emissions, is that the fossil fuels on which the world still depends on for over 80% of its energy needs are finite and will be critically depleted within 50 years at current use levels [9,13,19].
Our foremost goal in this conceptual analysis and review paper is to evaluate the effectiveness of the present global approach to climate stabilization (post 2015 Paris Agreement) in terms of reducing GHG emissions and containing temperature increase to 1.5 °C (e.g., see [17]). In order to evaluate the potential of renewable energy to replace fossil fuels by 2050, we developed and modeled nine scenarios involving three different levels of energy demand and three different levels of renewable energy development. The BP ‘Statistical Review of World Energy (2021)’ annual report was used as our database [9]. We focus on the replacement of fossil fuels with renewable energy sources because this is considered to be the most practical single pathway to climate stabilization when physical, financial, political, and environmental factors are all considered [1,9,15,16,17]. In 2020, fossil fuels, renewable sources, and nuclear power accounted for about 83.1%, 12.6%, and 4.3% of world energy use, respectively [1,8,9]. Within the renewable category hydropower dominated (6.86%), followed by wind (2.90%), solar (1.54%), and other renewables (1.26%). Bioenergy (~0.55%) and geothermal (~0.13%) energy are primary components of the other renewables category. Wind and solar energy are considered to have the most potential for rapid, large-scale expansion but at some point, they will probably be constrained by metal ore and land availability [15,16,17]. Although hydroelectric, biofuels, geothermal, and tidal are important renewable energy sources, at present their expansion potential is low due to factors involving either their restricted geographic distribution, large land requirements, lack of availability of undeveloped sites, and/or unsolved technical issues related to their implementation [15,16,17].
Our secondary objective involved the assessment of the roles and capabilities of seven other pathways to achieve net-zero GHG emissions from fossil fuel use when used in combination with renewable energy sources. These seven pathways included energy efficiency improvements (decoupling); energy conservation measures; carbon taxes; more equitable balancing of human well-being and per capita energy use; cap and trade systems; carbon capture, utilization, and storage (CCUS); and nuclear power development. It is generally recognized by energy authorities that some combination of these pathway in conjunction with renewable energy will be needed to achieve net-zero CO2 emissions [9,15,17]. However, actual quantitative evaluations on how they might be applied have been lacking.
Our third objective was to derive fair per capita energy use values for developing and developed countries. Human happiness and well-being are related to per capita energy use. The average minimum per capita level of energy use needed for a materially ‘Decent Living Standard’ for different world regions is derived. This meta-analysis establishes some guidelines on what might be fair, realistic per capita energy use targets for individual countries under conditions of a restricted global energy supply that the world is increasingly confronting. Therefore, it is a critical consideration in developing policies by individual countries that will be equitable, fair and result in high global cooperation in the transition away from fossil fuels.
Our fourth objective is to provide an overview of the role fossil fuels have played in enabling the unprecedented human population increase, improvement in living conditions, increase in human longevity, and technological advances since 1850 when they became widely adopted as the primary energy source. Conversely, we point out the role fossil fuels have played in environmental decline over the last 50 years focusing on climate change. We emphasize the fossil fuels (coal, oil, natural gas) are finite in quantity, nonrenewable and will be severely depleted within 50 years. We consider in some detail six basic reasons why replacing fossil fuels with renewable energy resources over the next 30 years will be a tremendous challenge with an uncertain outcome. We consider this review very important because the range of issues and challenges we discuss relating to replacement of fossil fuels with renewable energy sources are generally not well understood by political leaders, educators and the public at large [15,17].
In terms of organization, we begin the body of our paper with a review of how the use of fossil fuels have impacted the human population and its quality of life. Next, we consider the two major challenges with a fossil fuel-based economy: depletion and climate change. Then, we begin answering the question: Can renewable energy meet world energy demand in 2050? We first focus on how much expansion will be needed in primary renewable energy sources (hydro, wind, solar) and nuclear power using BP data [9]. The results from our modelling exercise are presented in tabular form and discussed. A discussion is given of six reasons why the transition to renewable energy will be difficult and uncertain. We identify and discuss seven additional pathways that can be used in combination with renewable energy development to achieve net zero carbon dioxide emissions. The issue of what level of annual per capita energy use is needed for a ‘Decent Living Standard’ in different world regions is explored. In our conclusion we provide a perspective on feasibility of achieving a complete and equitable conversion to zero emissions by 2050 through implementation of the combination of eight pathways discussed in our paper.
The meta-analysis uniquely articulates on the potential renewable energy solutions to address the climate change problem in a way that can be easily understood by policy makers, scientists, educators and concerned citizens alike. Our paper emphasizes and shows a combination of eight pathways will be needed to attain net-zero carbon dioxide emissions from fossil fuels. Successful use of these pathways will necessitate major lifestyle changes and taxation policies whose purpose must be well understood to garner necessary public support. Our paper is among the few that address the challenge of a more constrained energy supply coupled to rising energy demand in the context of social equity. It provides guidelines on per capita energy use for a ‘Decent Living Standard’ for different world regions which should be helpful in policy decisions. Although our focus is on renewable energy, we recognize that biological and geoengineering solutions may also play critical roles in managing the problem of climate change.
2. Methods and Data
The data used in this analysis included recent estimates of global energy resources and use, and socioeconomic and climate change indicators. Data on human population and demography were obtained from the UN [20,21] and Worldometer databases [22]. Socioeconomic data that include per capita energy consumption was obtained from the BP Statistical Review of World Energy 2021 [9,23], Our World in Data-Energy Use per Person [24]. Data on Gross Domestic Product (GDP) per capita were obtained from the UN GDP per capita reports for 2021 in US dollars [25]. Data on human development and happiness were obtained from the UN Human Development Report 2019 [26] and World Happiness Report 2019 [27], respectively.
Data on world reserve of crude oil, natural gas, and coal were obtained from BP [9]. Global CO2 concentration and emission was obtained from the WMO and USGCRP [8,12] and IPCC [1]. World energy use data were obtained from the IEA, BP [9,28] and EIA 2019 which also include data on energy use from fossil fuels. World energy consumption projections and demand scenarios were obtained from EIA 2019, IEA, and BP [9,28,29].
To evaluate the potential of renewable energy to replace fossil fuels by 2050, we developed nine scenarios involving three different levels of energy demand and three different levels of renewable energy development. We used the BP ‘Statistical Review of World Energy (2021)’ annual report as our data base [9]. Our demand scenarios for 2050 were world energy demand held constant at the 2020 level (556.6 EJ), demand at 1.25 times the 2020 level (695.4 EJ), and demand at 1.5 times the 2020 level (834.9 EJ) as projected by the IEA [18]. Our supply scenarios involved annual renewable energy increase at 1x, 3x and 6x the 2020 level (2.69 EJ) multiplied by 30 years plus the current production of renewable energy (31.71 EJ). For the six scenarios involving either a 3x or 6x renewable energy increase, we also assumed nuclear power realistically could be doubled and hydro energy expanded by 31% over 2020 levels.
where Renewable refers to the different renewable energy production scenarios; y refers to the number of years until 2050; scenarios of average production with current production of 2.89 EJ as of 2020, and 3 times of current production of 8.67 EJ and 6 times of current production of 17.34 EJ; global energy consumption based on 2020 estimates of 31.7 EJ.
where Nuclear refers to energy scenario of doubling of current average production of 2020 and Hydropower scenario of an increased production by 31%.
Renewable = y × average production scenario + global energy consumption of 2020
Nuclear = (23.98 EJ, 2020 consumption) × 100% increase = 48.0 EJ
Hydropower = 2020 average production of 38.16 EJ × 31% increase = 50.0 EJ
3. Results and Discussion
3.1. Human Population, Energy, and Fossil Fuels
An unprecedented growth (nearly 8-fold increase) has occurred in the world human population since 1800 [18,20,21,22] (Figure 1). In a historical context, the world first reached one billion people around 1804, two billion in 1927, three billion in 1960, four billion in 1974, five billion in 1987, six billion in 1999, seven billion in 2011 and almost eight billion presently [21,22,30,31]. The rate of increase in world population peaked at 2.1% in the late 1960’s and has slowly fallen to the 1.05% present level [22]. The United Nations [21] projects the human population will reach ten billion by 2057 with near twelve billion by 2100. These projections assume adequate food and natural resources (energy, water, minerals) along with favorable climatic conditions which may not hold [3,4,18,32].
The unprecedented increase in human population since 1800 is closely linked to expanded use of fossil fuel as a major source of energy to meet human needs. This dependency can be explained by mechanical inventions involving fossil fuels as an energy source beginning with the steam engine that resulted in major increases in food production, development of manufacturing, and cheaper, more rapid transportation [33,34,35,36] (Figure 1). The first switch to fossil fuels began around 1750 when the steam engine powered by coal was developed [33,34,35,36]. Previously humans depended on renewable energy sources of wood, wind, waterfalls, dams, human labor, and draft animals to meet basic needs [35,36].
Due to their potency, ease of handling, and ease of transport, fossil fuels are overwhelmingly superior to renewable energy sources in terms of powering machines and provision of heat [33,34,35,36]. Oil is the most potent of the fossil fuels followed by natural gas and coal. The development of electricity from coal-fired plants in the late 1800’s and of the internal combustion engine powered by gasoline from refined oil in the early 1900’s were the key factors contributing to the rapid increase in human population during the twentieth century [33,34,35,36]. In the 1920’s automobiles, tractors, airplanes, electric stoves, gas heating, washing machines, refrigerators, and electrical lighting all powered by fossil fuels became widely available in North America and western Europe [33,35,36]. Later in the 1950’s, several other countries started to adopt fossil-fuel-based economies. Since the 1990’s China with 1.44 billion people and most recently India with 1.38 billion have been aggressively pursuing the fossil fuel dependent lifestyle of North America and Europe [37,38,39,40,41]. Since 1820 global per capita use of energy has quadrupled [23,42]. The per capita use of energy by the US is currently about 3.8 times the world average [9,19,43]. This is twice that of Europe, about three times that of China, 11 times that of India, and 15 to 25 times that of most Africans countries based on BP [9] data.
However, there have been major adverse environmental consequences from the increased dependency on fossil foils as energy sources that include climate change, resource depletion, species extinction, forest destruction, soil degradation, water pollution, and urban sprawl [3,4,18,32]. Reversing these consequences and avoiding negative feedback impacts are the major challenges now confronting humanity.
3.2. Two Major Challenges with a Fossil Fuel-Based Economy: Depletion and Climate Change
A critical problem in modern civilization is its dependence on fossil fuels which are finite in quantity and rapidly alter the earth’s climate when burned at a scale needed to support 7.8 billion people [13,15,34,48]. Although there are compelling reasons to switch from fossil fuels to alternative energy sources, the actual transition is proving to be difficult, expensive, complicated, and uncertain. The interactions of population increase, fossil fuel depletion and climate change have been understood since the 1950’s but little has been done to prevent the combined economic and environmental crisis the world now confronts because of these interactions [15,34]. This section considers the two main challenges: fossil fuel depletion and climate change, and their solutions in detail.
3.2.1. Fossil Fuel Depletion Impacts on Global Economy—A Coupled System
Fossil fuels are a finite, non-renewable natural resource unlike renewable energy resources such as wind, solar, biomass, geothermal and hydro- power [13,15,34]. Although the process of fossil fuel creation by natural forces took millions of years, reserves stored in the earth’s surface will be exhausted within a 300-year period (1750 to 2050) at the current use rate. There is a concern that fossil fuel depletion by the 2030’s will adversely impact the global economy and political stability [13,37,38,44,45,46,47]. There is a strong data-based viewpoint that oil depletion ranks with climate change as an impending catastrophic problem [13,34,38,44,46,48,49,50]. Rather than absolute scarcity, the major concern is the depletion of the oil that can be extracted at an affordable cost [13,34,38,49,50]. Without an affordable replacement for oil, the world will likely be forced into a rapid but economically painful transition to renewable energy sources.
Based on the BP [9] data, the proven reserves of oil, natural gas, and coal are adequate to meet current world consumption needs for roughly 50, 50, and 132 years, respectively [19]. However, these figures depend on assumptions regarding many factors such as demand, new discoveries, extraction technologies, environmental regulations, and renewable energy efficiency development that will undoubtedly be modified as the future unfolds. Great uncertainty exists regarding the supplies and development of unconventional shale oil and gas [13,34,38,44,46,49,50]. Since 2008, US shale production has accounted for about 80% of the 10 MBD (Million Barrels per Day) of new supply needed to satisfy global oil consumption now near 100 MBD [9]. However, due to lack of profitability, many oil shale operators in the US have been forced into bankruptcy since 2019 and those surviving are being forced by investors to curb investment in supply expansion [13]. This constraint on supply coupled with economic recovery from the 2020 COVID-19 pandemic is now causing oil prices to rapidly rise.
3.2.2. Fossil Fuel Use and Climate Change
Climate change commonly refers to a change in average current weather conditions in relation to what has been normal in the past [12]. Variation in natural factors such as solar radiation, biotic processes and volcanic eruptions can cause climatic change. However, the climatic change currently in progress, commonly referred to as ‘global warming’, is caused primarily by human activities involving burning of fossil fuels and the modification of natural landscapes mostly through deforestation [7,12,49]. Both fossil fuel combustion and deforestation release ‘greenhouse gases’ (GHG’s) that change the radiation and energy balance of the Earth causing increased heat to be absorbed in the Earth’s lower atmosphere as opposed to radiating into outer space. The principal gas causing this ‘greenhouse effect’ is CO2 although methane (CH4), nitrous oxide, ozone, water vapor and various miscellaneous gases are also involved.
Global warming began when (1850’s) industry initiated using significant quantities of coal [12,49,50]. In 1860, the global atmospheric CO2 concentration was near 280 ppm but had increased to 317 ppm and 400 ppm by 1960 and 2015, respectively [8,12]. In 2021, the atmospheric CO2 concentration reached 419 ppm, a 50% increase over the 1850 level [8]. Current atmospheric CO2 is estimated to be the highest in the last 800,000 years [1,8]. Changes in CO2 have always preceded temperature changes [8,51]. Depending on the scenario of fossil fuel use, CO2 levels by 2100 are projected to be in the range of 541 to 970 ppm (29 to 132% increase over the present level [1,10,11,52]). It is projected this will result in a global temperature increase of 2 to 5 °C over the 1850 level.
Until the industrial revolution, nearly all carbon emissions were natural and offset by carbon sinks (vegetation and the ocean). Currently about one half of carbon emissions are absorbed by vegetation and the ocean [8,12,51]. The other half are accumulating in the atmosphere and warming the planet. This excess CO2 will remain in the atmosphere for hundreds of years even if the anthropogenic emissions stop [8,12,49,51]. Therefore, temperature increases in the past and future are considered to be permanent from a practical standpoint unless technological or ecological solutions can be developed to sequester carbon from the atmosphere back into the earth’s crust and vegetation [1,10,11,49].
Evidence of global warming based on long-term climatic indicators records show a roughly 1.1 °C temperature increase has occurred since 1900 [8,11,51,53]. About 70% of this warming has occurred since 1970 [53]. Over the last 40 years the average temperature increase per decade has been almost 0.20 °C. Of great significance is that the rate of global warming has been increasing [1,8,11,12,51]. As corroboration, 17 of the last 18 years have been the hottest on record and the years of 2014, 2015, and 2016 were characterized by successive new temperature highs [8]. If this rate of increase continues, the 1.5 °C threshold which puts the world at risk of catastrophe, will be reached by the early 2040’s. Estimates for temperature increase over the next 79 years of this century range from 2 to 5 C depending on the level of anthropogenic greenhouse gas emissions used in the models [1,7,11,12,52]. There is great concern that a threshold could be exceeded within this range causing accelerated climate warming and resulting in most parts of the world to quickly become uninhabitable [10,52].
During the last 30 years, documented global warming responses include widespread melting of snow and land ice, sea level rise, increased heat content of the ocean, increased humidity, and earlier timing of spring events such as flowering [1,8,12,51]. Since 2000, increasing frequency and severity of hurricanes, tornadoes, heat waves and floods have accompanied the upward trend in the earth’s average surface temperature [5,7,8,12].
3.3. Can Renewable Energy Meet World Energy Demand in 2050?
In spite of the momentum of the recent increases in renewable energy (mainly wind and solar), fossil fuels still account for over 80% of world energy use. Since 1971, world energy use has increased 2.6 fold [28]. Fossil fuels accounted for 88% of world energy use in 1971, 86% in 2015 when the Paris Agreement was signed, and 83% in 2020 [9,28,29] (Table 1). In 2020, petroleum accounted for 31%, coal 27% and natural gas 25% of world energy use [9] (Table 1). The remaining 17% comprised 7% hydropower, 6% renewables, and 4% nuclear power. More precisely, renewable energy (primarily wind and solar) accounted for 5.7% of total energy consumption in 2020 compared with 3.3% in 2015 (Table 1). Wind and solar accounted for 2.90% and 1.54%, respectively, of world energy consumption in 2020 for a total of 4.44%.
World energy demand increased an average of 1.8% per year during the 2009-2019 period but decreased by 4.3% in 2020 due to the COVID-19 pandemic [9] (Table 1 and Table 2). Although it dropped 5.5% in 2020, world average per capita energy use increased 0.7% per year on average during the 2009–2019 period [9] (Table 2). World population growth was 1.05% in 2020 versus a 10-year average of 1.1% ([20], Table 2).
By 2050, world energy consumption is projected to be 50% above 2018 levels (576 EJ-2018 vs. 864 EJ-2050) [17,29]. However, there is growing uncertainty regarding whether this demand can be met without catastrophic impacts on the climate. A summary of the evaluation of the potential of renewable energy to replace fossil fuels by 2050 based on the nine different scenarios considered in this analysis (as described in Section 2) is shown in Table 3.
Our modelling exercise indicates that even with a 6-fold increase in renewable energy, a doubling of nuclear power, and a 31% increase in hydro power, there will still be a 22% dependency on fossil fuels in 2050 if world energy demand increases by 50% (Table 3). However, if energy demand increases by 25%, the dependency on fossil fuels is reduced to 6.5%. Carbon capture, utilization, and storage (CCUS) could probably be used to neutralize CO2 emissions from 10 to 20% use of fossil fuels. Our scenario analyses summarized in Table 3 show the importance of constraining total energy demand as well as accelerating renewable energy development in achieving the goal of zero CO2 emissions from fossil fuel combustion by 2050.
We note that in 2019, before the COVID-19 pandemic disrupted the world economy lowering energy consumption, renewable energy development accounted for only 42% of new demand [24]. By 2023 it is likely world energy demand will be above 2019 levels and again increasing at near 1.8% per year (10–11 EJ). Just to compensate for this expected new demand, renewable energy development will need to be more than tripled over the 2020 level (2.89 EJ). This further points to the importance of including a maximum energy consumption goal as part of the path to achieving zero 2050 CO2 emissions.
In order to attain zero fossil fuel use by 2050, renewable energy development will have to increase about 6 fold over the present level (2.89 Ej × 30 years × 6 = 520.2 EJ) if demand is static at the 2020 level (556.6 EJ) and by over 8 fold (2.89 Ej × 30 years × 8 = 693.6 EJ) if demand increases by 50% (834.9 EJ) (Table 1, 3-Data source: [9]). During the 2009–2019, period, world renewable energy increased about 13.4% per year on average with a 10% increase in 2020 [10]. At a growth rate of 13% per year, about 10, 15 and 17 years would be required to achieve 3-, 6- and 8-fold increases in annual renewable energy production, respectively. Achieving a 6-fold increase in the present level of renewable energy (primarily wind and solar, development will be challenging and uncertain for reasons we will now discuss. Cost of uranium, availability of water for cooling, and geopolitical issues are major factors that limit nuclear power development [15,54,55,56]. Lack of remaining suitable dam sites and environmental concerns limit hydro energy development [15,54,57]. Both wind and solar energy development at some point will be limited by metal ore depletion and land availability [13,15]. Land availability also constrains the expansion of biofuels [13,15].
3.4. Reasons Why Transition to Renewable Energy Will Be Difficult
Six important reasons/challenges why modern society cannot easily transition from fossil fuels to renewable energy include energy density, intermittency, location, transportation bottlenecks, environmental impacts, and land availability are discussed in a number of papers [13,15,33,34,48,54,58,59,60,61]. Here, we conceptually summarize and update these challenges.
3.4.1. Energy Density (Potency)
Fossil fuels are superior to other energy sources because they yield high amounts of energy per unit weight or volume (density), and they are easily transported. Petroleum is considered the ultimate energy source for running most of our machines [13,33,34,48,61]. One barrel of oil contains about 10.5 years of human labor equivalence [62]. Natural gas has about 86% of the potency of oil, whereas that of high-grade coal is near 66%. Dry wood in contrast has 35% of oil’s potency and is much bulkier. For transportation involving airplanes, buses, heavy trucks, and ships, the gasoline and diesel derived from oil is decisively superior to all other fuel sources in terms of power per unit volume, ease of handling, storage, and cost [13,33,48,61]. Oil cannot be readily replaced with electricity for use in long range transportation and hauling that is a critical part of today’s globalized world [13,33,34,48,61].
3.4.2. Intermittency
Abundant fossil fuels have allowed engineers to develop low-cost electricity production systems using readily available, easily controlled fossil fuel energy inputs that are reliable and steady [33,61]. Because the occurrence and velocity of wind is erratic and sunshine is diurnal and affected by cloud cover, there is an intermittency challenge when transitioning to wind and solar power [15,33,54,59]. Even slight disruptions of the power supply can have major consequences on electrical grids. To some extent, the intermittency challenge can be overcome by storage using batteries and by combining wind and solar power into complementary systems [15,57,61]. Battery storage technology is rapidly improving which can reduce intermittency issue of solar and wind energy. However, battery storage of wind and solar power is still very expensive and may be limited by elements such as lithium [39,61].
3.4.3. Location
Sunlight, wind, biomass, and hydropower are more available in some locations than others. Large urban areas with the highest electricity needs are typically long distances from abundant renewable energy sources [15,54]. Therefore, lengthy transmission lines are needed that are costly, incur energy losses, and can have adverse environmental impacts. Long distance transport can marginalize the utility of biomass energy because it has a low energy output relative to input investment. To minimize this challenge, electricity production could be shifted from large-scale centralized sites to smaller local and regional sites [15]. Over time, to some extent, population centers could be shifted to more efficiently use renewable energy resources.
3.4.4. Transportation Bottlenecks
Nearly all transportation in developed countries is now powered by gasoline and diesel derived from oil. Oil is well suited for transportation because it is energy dense, portable, and easily shipped by pipeline and tanker [15,33,48,61,63]. Although oil has become much more expensive in the last 20 years, it still is relatively cheap compared with the cost of alternative energy sources. In the US, transportation accounts for about 28% of energy use with 95% being powered by oil [64]. Throughout the world nearly all developing countries are implementing transportation systems heavily based on oil as in the US and Europe [13,48,63]. World demand for oil, now at 100 million barrels per day, has been increasing at over 1% per year [9,65] but expected to average 0.6% per year over the next 30 years [29]. In order to solve the two problems of oil depletion and rising fossil fuel emissions, changing to electricity and biomass to power transportation are viewed as the primary solutions. However, various energy authorities consider these changes to be an enormous, if not an unsurmountable challenge [13,15,33,34,48,54,61,63].
Changing to electric vehicles involves one major challenge and several lesser challenges. Although battery technology is rapidly improving, even the best theoretical batteries have very low energy density compared with petroleum-based fuels [13,15,48,55,66]. The use of light vehicles to move people can be overcome but for large heavy vehicles (trucks, tractors, cargo ships), the batteries needed are too heavy to be practical. Two other important challenges associated with electrification of transportation involve the increased demand for electricity and the stress this demand will put on local power grids. Roughly complete conversion to electrical vehicles for US passenger travel would increase electricity demand by 29% [67]. This switch would reduce CO2 emissions by 6 to 7% [67]. We refer the reader to Friedemann [13,48] for discussion of the challenges that large scale conversion to electric cars would create for power grids. Heinberg [66] provides a detailed discussion of the potential for electric cars to replace gasoline/diesel-powered cars over the next 30 years.
Biofuels made from agricultural crops, vegetation residues from forest and rangelands, and algae may seem to be a solution for powering trucks, ships, and aircraft but they have several drawbacks. The challenges of conversion to biofuels for transportation include cost, scalability, energy profitability and environmental tradeoffs [13,15,33,41,48,54]. Basically, the amount of energy returned from production of most biofuels relative to energy inputs is too low for profitability [15,34]. Diversion of land from food production and loss of biodiversity are two other serious drawbacks to large-scale use of biofuels to power transportation [15]. Another challenge is that retrofitting trucks, airplanes, and ships to burn biofuel is costly. Therefore, replacing oil as a fuel source with biofuels for transportation on a large scale is presently infeasible. There was some hope that biofuel derived from algae could eventually become a practical airplane fuel but it now appears to be infeasible due to challenges of growing, collecting, and drying it along with capital needs.
3.4.5. Environmental Impacts
Wind, solar and biofuels all have serious adverse environmental impacts especially when scaled up to provide most of the world’s energy needs [34,40,42,55,60,61,62]. Wind turbines require high amounts of iron and copper necessitating more mining, they impair esthetic values on natural landscapes, they can be harmful to birds, and people living near them complain about the noise and loss of sleep [59,60,67]. Solar power developments require large amounts of metals such as aluminum, copper and lanthanides that could become prohibitively costly due to depletion if they are the primary power providers at national and global levels [13,15,39,48,61]. They also will impair grazing, wildlife and esthetic values over vast rangeland landscapes if they are used as major power sources for electrical grids [61]. Biofuels, in addition to causing a large reduction in cropland for food production, would contribute to soil erosion, soil nutrient depletion (especially phosphorus), and wildlife habitat loss if their production was expanded to a level that replaced fossil fuels as a primary world energy source [15,39,41,54,67,68].
3.4.6. Land Availability
Land availability can be another major challenge with wind and solar power as replacements for fossil fuels. A recent review and meta-analysis of the spatial requirements of different renewable and non-renewable energy sources indicated that wind power requires about 370 times more land to generate a megawatt of power than natural gas [69]. For solar power, the land ratio per power unit drops to 140 times that of natural gas [69]. In contrast nuclear power required only three times as much land as natural gas per unit power generation. In the Princeton University net-zero America studies summarized by Merrill [70], roughly 1000 times more land was needed to generate a gigawatt of electricity from wind compared with nuclear power. It was estimated that a four-fold increase in area devoted to energy production will be needed if wind and solar energy are selected as key components in replacing fossil fuels to meet the goal of zero CO2 emissions by 2050. This would involve an energy footprint on about 16% of the land area of the contiguous US. Another recent estimate indicates that it would take over one third of the continental US land area to meet present day electricity demand with sole use of wind and solar farms [71,72]. This is 5 to 10 times more land than previously thought. Regardless of which estimate proves to be more reliable, it is clear that conversion to renewable energy heavily based on wind and solar energy will involve a major increase (tripling to quintupling) in the global energy footprint.
In the US, one of the most difficult challenges will be siting and building power transmission lines [70]. Under all the fossil fuel replacement scenarios, the permitting and building of power transmission lines was identified as a serious hurdle. If wind and solar power are emphasized as opposed to nuclear power and natural gas with carbon capture, the need for transmission line capacity would likely more than triple. Merrill [70] and others [55] concluded that if the US decides to attain a carbon-free economy by 2050 using the least amount of land, it will need to build hundreds of nuclear plants and natural gas plants with carbon capture systems instead of heavily focusing on wind and solar energy.
3.5. Potential Pathways for Net-Zero Emissions
We note that there are many pathways to net-zero emissions involving different proportions of renewable energy sources, nuclear power, and fossil fuels with carbon capture [13,17,55,70]. The selection process, which is just beginning, will probably be altered several times due to practical reasons, changing costs of materials, and evolving technology such as that involving hydrogen as an energy source and improvement in battery capability to store energy.
3.5.1. Improving Energy Efficiency through Taxation (Decoupling)
Reducing the amount of energy wastage in lighting, building heating and cooling, use of appliances, and operation of electronic products is referred to as energy efficiency improvement. Conversion to electric cars falls into the energy efficiency improvement category. The amount of energy needed to generate a global unit of gross domestic product (GDP) has fallen on average about 1.5% per year since 2000 [73]. This is substantially below the 4.0% the IEA [73] considered necessary to meet 2050 climate stability goals [17]. In 2020, the annual reduction in energy intensity was only 0.8% [73]. Potentially, energy efficiency improvements could reduce per capita electricity use in developed countries by 50% or more over the next 30 years [41,73,74]. Even though major improvements have occurred in energy efficiency over the past 30 years, the total US energy use has risen about 30% due to an increased number of households with more appliances and electronic products [75]. The primary tool to curb this demand can be through imposing higher energy consumption taxes [54,74]. These taxes could be used to maintain highway infrastructure, improve the electrical grid, and develop mass transit such as light rail [54,60]. To avoid an overall tax increase, these consumption taxes could be offset by lowered income taxes [74]. Although consumption taxes have been effective incentives for energy conservation and efficiency in several European nations, they are generally unpopular in most countries including the US.
3.5.2. Energy Conservation and Carbon Taxes
Energy conservation policies typically involve land use and taxation policies that impact urban expansion, housing, and transportation. Through taxes on fossil fuels, toll roads, restrictions on motorized vehicle use, and land use/building regulations people are incentivized to live in compact, high-density communities where various transportation needs can be met by walking or mass transit as opposed to long commutes by car. Not only are fossil fuel emissions reduced, but other benefits include slowing fossil fuel depletion, reducing urban sprawl and habitat fragmentation, and reduction in congestion and air pollution in cities. If aggressively applied, they potentially could reduce global fossil fuel use (especially oil) by 20 to 30% within 30 years [15,60,76,77,78,79,80]. Energy conservation practices are widely applied in Europe which has about one half the per capita energy use of the US [9]. The US is slowly trending towards higher energy conservation (e.g., mass transit, multi-level apartments, inner city revitalization, toll roads, and expanded use of railroad) but remains near the top in terms of per capita energy use [9,43,76,80].
Of great concern is that many developing countries are following the US model involving heavy use of cars and trucks in terms of transportation and allowing large scale sprawl of low-density buildings and roads into agricultural lands [13,41,48,78,81]. Even though the use of oil has stabilized in Europe, the US, and Japan, it is rapidly increasing in China, India, Brazil and several other developing countries [9,82].
Taxes on fossil fuels based on their carbon content are referred to as carbon taxes. These taxes are considered to be one of the most effective ways to reduce carbon emissions but they are unpopular because they directly or indirectly increase the cost of goods, food, services and nearly all our activities [54,83]. They can be major incentives for energy conservation and efficiency that reduces total energy use, but this depends on both population growth and use of more fossil fuel-powered machines. The EU countries in general have high gasoline taxes which have been an important factor in reducing both per capita gasoline use and carbon emissions. Although carbon taxes are unpopular with the public, we believe major tax increases will eventually occur on fossil fuel consumption in the US and globally to meet triple objectives of climate stabilization, fossil fuel conservation and deficit reduction. We note California in recent years has successfully placed higher taxes on gasoline.
3.5.3. More Equitable Balancing of Human Wellbeing and Per Capita Energy Use
Human population size in conjunction with per capita energy use are the two primary factors governing global energy demand, and hence, climate change. Therefore, we consider assessing and managing the effects of human population growth on energy consumption with emphasis on human wellbeing and environmental sustainability to be key components of policies to combat global warming and natural resource exhaustion. [3,4,84]. Although Africa and the Middle East are the highest population growth regions (Table 4), the primary GHG emitters, the United States, China, and India, all have increasing human populations [20]. We note the US has high per capita use of fossil fuels, whereas India has a rapidly increasing fossil fuel use per capita [9].
In this section we will explore what a reasonable (and achievable) level of per capita energy use results in a materially adequate lifestyle and a reasonably happy life commonly referred to as a ‘Decent Standard of Living’ (DLS) [85]. Analysis of lifestyle can provide insight into adjustments affluent countries such as the US will need to make in order for a just, enforceable global agreement to occur on eventual ending of fossil fuel use and limiting GHG emissions. We believe our analysis will be helpful in deriving an energy budget for the world and allocating fossil fuel use by country until the goal of net-zero emissions from fossil fuel use is achieved.
The two primary annual evaluations of comparative human wellbeing among countries are those based on the UN Human Development Report and the UN World Happiness Report [26,27]. The UN Human Development Index (HDI), first published in 1990 for 189 countries, incorporates three dimensions of human development which are (1) lifespan, (2) education, and (3) a decent living standard. Various indicators are used to quantify each dimension of the HDI [26]. It is the most widely used measure of human development. The UN World Happiness Report, which has been published annually since 2016 for 150 countries, is broader and more subjective than the HDI. Variables used to calculate the Happiness Score for each country are (1) real GDP per capita, (2) social support, (3) healthy life expectancy, (4) freedom to make life choices, (5) generosity, and (6) perception of corruption [28]. Although there are also other wellbeing indices such as the Genuine Progress Indicator and the Happy Planet Index, our study used on the UN HDI, Happiness score, and the Composite Measure of Wellbeing [86,87]. We are primarily concerned with how per capita energy consumption relates to having a DLS and reasonable level of life satisfaction. It is well established that per capita GDP is a primary factor in DLS and that per capita GDP is strongly correlated with per capita energy consumption [34] (Figure 2).
Figure 2.
Country level Gross Domestic Product (GDP) per capita (1000 USD) (Adapted from ref. [46]) (y-axis—left panel column), energy consumption per capita (GJ) (Adapted from ref. [88]) (y-axis—right panel column) with the estimated 70 GJ for a reasonable per capita consumption (dash line), composite measure of human wellbeing index (dimensionless) Adapted from ref. [86,87]) (x-axis), and human population (Adapted from ref. [44]) (colored scale bar). The name of select countries is included. The data were grouped and averaged into six decades from 1960s–2010s.

In order to provide a clear depiction of how per capita energy consumption relates to human wellbeing, we have selected five countries for each of five categories of per capita energy use which are as follows: (1) over 200 GJ per capita, (2) 100 to 199 GJ per capita, (3) 51 to 99 GJ per capita, (4) 26 to 50 GJ per capita, and (5) less than 26 GJ per capita (Table 5). The data used in Table 5 are for 2019 before the impact of the COVID-19 pandemic.
Our meta-analysis indicates that generally vehicle-dependent countries in temperate regions need on average about 120 GJ per capita for a DLS (Table 5) which is 60% above the world average (75 GJ). Conversely developing equatorial countries with low vehicle-dependency need at least 30 GJ per capita for a DLS, which is 40% of the world average. Roughly, two billion people (25% of the world population) located mostly in central Africa and southcentral Asia do not have a DLS based on these criteria. Our findings are partly derived from and consistent with Kirstra et al. [85] that among countries the per capita energy requirement to support the same basic DLS level varies by roughly a factor of four. This is because of differences in climate, urbanization, diets and transport infrastructure [85].
Transport is the primary indirect factor and housing is the primary direct factor that drive per capita energy needs for an adequate DLS [85,89]. Basic services such as clean water supply, sanitation, electricity access and education require relatively low per capita energy compared with needs for transport. Basic service needs can be met with from 9–40 GJ depending on country [85,89]. Nations based on public transport (rail and buses) have 50% or less of the per capita energy consumption of those heavily based on passenger vehicles. As an example, the developed, generally vehicle-dependent 38 Organization for Economic Co-operation and Development (OECD) countries had an average per capita energy consumption in 2019 of 173 GJ compared with 55 GJ for the developing non-OECD countries [9]. The OECD, which accounts for 17% of the world’s population and 39% of world energy use, includes nearly all EU countries, the US, Canada, Australia, Japan, and Israel. The OECD HDI scores (0.904 average), and per capita GDP ($45,000 average) are much higher than world averages (HDI 0.742, per capita GDP $11,339) (Table 5).
Our analysis supports the recommendation of Kirstra et al., [89] that developing countries should encourage investments in public transit and discourage policies that favor widespread use of passenger vehicles. Countries that depend heavily on passenger vehicles for transit have per capita energy consumption levels two to six-fold higher than those oriented towards mass transit based on our analysis of BP [9] data. Both impending climate change and fossil fuel depletion necessitate major changes in global transit. Nearly complete conversion to electric vehicles will be necessary over the next 20 years. Even in affluent, developed countries it is probable people will have to rely much more on mass transit due to rising costs for energy, vehicles, and infrastructure maintenance and replacement.
Distinguishing energy needed for a DLS from energy used for affluence in countries will be an important part of establishing policies and tax systems that are equitable and fair at national and international levels. Constraining energy demand will heavily depend on willingness and capability of the affluent countries to lower their high annual per capita energy use (over 120 GJ) and the extent of population growth in several countries (Table 4 and Table 5). Based on Table 5, it appears that for a materially adequate, happy life (UN Happiness Score above 5), a per capita GDP of $5000, a per capita annual energy use of 40 GJ, and a UN HDI of at least 0.7 are needed in equatorial countries with low vehicle dependency. For temperate countries with low to moderate vehicle dependency a per capita annual GDP of $10,000, an annual per capita energy use of 100 GJ, and a UN HDI of 0.8 appears to be the minimums needed for happiness based on China, Brazil, Turkey, Mexico and South Africa (Table 5). On this basis, a world average annual per capita energy use of ~70 GJ (Figure 2) would roughly meet the minimum requirement for a decent living standard. This is 7% below the world average of 75 GJ [9]. We recognize convincing the affluent countries to voluntarily use less per capita energy so that developing countries can achieve a DLS will not be easy. More research is needed on this issue.
3.5.4. Cap and-Trade Systems
Cap and trade systems have been a more popular means to reduce GHG pollution. Under this approach, the government limits the amount of a specific pollutant (the cap) that an industrial sector can emit. Each company is given an allowance it cannot exceed. Under this system, companies capable of cheaply limiting their emissions below their allocation can sell permits for their unused allowance to other companies with less capability to limit emissions. This system was adopted by the European Union (EU) in 2003 and has been effective in lowering EU carbon emissions.
3.5.5. Carbon Capture, Utilization, and Storage
Carbon capture, utilization, and storage (CCUS) involves capturing CO2 from large point sources (coal burning plants primarily) and safely storing it or converting it into usable products. CCUS is an important emissions reduction technology that can be broadly applied across energy systems and will probably play a critical role in the transition to a zero-emissions world economy [55,90]. It has important applications in industries involved in production of cement, steel, chemicals, and hydrogen where options to fossils fuels are prohibitively expensive or presently do not exist [90]. CCUS can be retrofitted to fossil fuel (coal, natural gas) powered plants used for electricity generation which account for around 25% of present emissions [90].
Although it requires roughly 25 to 40% more additional energy to run a CCUS coal power plant, potentially 90% of the CO2 emissions can be captured [90,91,92]. Initial estimates of cost increases to consumers per watt-hour for coal electricity with CCUS compared with regular coal electricity ranged from 20 to 90% [15,90,91,92,93]. However, these costs can potentially be reduced over time through improved technology [90,91]. Presently the use of CCUS in coal-fired power plants increases the cost of electricity to consumers 50 to 100% depending on various factors such as the methods used, the geological structure, the transport distance to suitable storage sites, and the scale of the power plant involved [15,91]. There are projects in the development stage evaluating the potential to capture carbon as a feed stock for chemicals, synthesized natural gas, and algae cultivation [90,91]. Examples of industrial scale CCUS projects in the U.S. and other parts of the world are provided by [91], and IEA [90]. Critics of CCUS for power stations argue that its practical large scale-development and economic effectiveness are unproven, it involves dangerous waste materials that cannot be easily and safely stored, it has a 25 to 40% energy penalty that increases the need for fossil fuel burning, it has no effect on the carbon emissions involved in mining and transport of the fossil fuels, and it diverts investment from other climate mitigation solutions such as renewable energy development and afforestation [15,41,93]. Nevertheless, CCUS is one of the primary tools in climate change mitigation [55,90,91,92].
3.5.6. Nuclear Power Development
Prior to the March 2011 Fukushima nuclear disaster in Japan, nuclear fission power was widely considered a primary solution to fossil fuel depletion and global warming. It can potentially provide tremendous quantities of energy with very little atmospheric pollution and relatively low use of land [54,55,59,76]. Since 2011, global generation of nuclear power has been in a slight downward trend that may be reversing [9,64]. Over 150 nuclear reactors are planned for the future which would increase nuclear power output by about 50%. Besides almost no atmospheric pollution, nuclear power has advantages of no intermittency problem unlike wind and solar, it is generally cheaper than wind and solar, it is not as materials intensive as wind and solar, and it requires much less land than wind, solar or biomass per kwh (kilowatt hour) produced [54,55,56,59]. Compared with wind power, nuclear power land requirements per kwh are only about 2–3% and compared with solar power of about 12–13% [71,94]. Corn ethanol production is the most land-intensive of all energy alternatives requiring about 100 times more land per kwh produced than nuclear power [71,94]. By some estimates nuclear power, if aggressively developed, could meet 50% of all global energy needs within 10 years and nearly all greenhouse gas targets within 30 years [95,96]. Part of this strategy would involve using nuclear power to make synfuels from CO2 and hydrogen to be used as fuels in airplanes and trucks [55]. There is much optimism that the effectiveness of nuclear power could be greatly increased through breeder reactors which can consume most of the spent fuel left as waste from conventional reactors [59,76].
Although nuclear power has potential as a partial fossil fuel replacement in climate mitigation, it has important drawbacks that involve supplies and cost of uranium, high plant construction costs, long time requirements for plant construction, high water requirements for cooling purposes, hazardous waste disposal problems, terrorist sabotage vulnerability, and major concerns over human health and safety [41,56,70]. Thus, nuclear power is not viable for many parts of the world because annual water surpluses must be available for cooling [56]. Another problem is that under continuing global warming water sources needed for nuclear plant cooling are becoming less reliable due to more droughts and altered river flows [97]. This necessitates periodic shutdown of some nuclear plants. France, which derives 77% of its electricity from nuclear power, is now experiencing this problem [97]. We note there have been recent improvements in nuclear plant safety [55,76]. When comparing its potential use, it seems unlikely nuclear power will play the primary or decisive role in climate change mitigation, but it can be an important part of the solution.
4. Conclusions
The main objective of this analysis was to assess the capability of renewable energy sources to globally replace fossil fuels by 2050. Climate change, which is recognized as the biggest threat to humanity, is a systemic problem that is tightly linked to global human population growth and increased per capita use of energy derived from fossil fuels. Scientific evidence directly links the use of fossil fuels to increased emissions of greenhouse gases that quickly and irreversibly change world climate resulting in global warming.
Fossil fuels in 2020 accounted for 83% of world energy consumption compared with 86% in 2015 when the Paris Climate Agreement to limit CO2 emissions was signed. Renewable energy (primarily wind and solar) accounted for 5.7% of total energy consumption in 2020 compared with 3.3% in 2015. Hydroelectricity and nuclear energy showed little change accounting for about 7 and 4%, respectively, in both years. Our analysis showed that in order to attain zero fossil fuel use by 2050, the annual rate of increase in renewable energy production will have to expand 6-fold if energy demand is held constant at the 2020 level and 8-fold if energy demand increases 50% due to increased population and per capita consumption. Added renewable energy is not yet replacing fossil fuels because of growth in energy demand due to increases in population and per capita consumption. It only met 42% of increased energy demand in 2019. In 2020 world energy demand declined 4.3% due to the COVID-19 pandemic but growth in new demand is expected to resume by 2023.
Under a scenario of a 25% increase in world energy demand, a 6-fold increase in renewable energy, a doubling of nuclear power, a 31% increase in hydropower and limited use (6.5%) of fossil fuels with carbon capture and storage (CCUS), we determined that renewable energy could replace conventional use of fossils fuels by 2050. The biggest uncertainties in this scenario are whether renewable energy can be increased 6-fold and whether demand increase over the 2020 level can be constrained to 25%. In order to meet a 50% energy demand increase, nuclear power and fossil fuel use with CCUS would have to be greatly expanded.
We explored what minimum level of per capita energy consumption would allow 8 billion people to have a ‘Decent Living Standard’ (DLS). Our meta-analysis indicates a global average annual per capita energy consumption of ~70 GJ met these criteria, which is 93% of the current world average (75 GJ). For a DLS in developed countries in temperate climates with high vehicle dependency about four times more energy (120 GJ/year) is needed as in equatorial countries with little vehicle dependency (30 GJ/year).
Our review and study identified six major challenges related to transitioning from fossil fuel to renewable energy that include energy density, intermittency, location, transportation bottlenecks, environmental impacts, and land availability. It further examined how a combination of eight pathways could lead to net-zero emissions from fossil fuels. These pathways include renewable energy development; incentives for increased energy efficiency (decoupling); energy conservation incentives; carbon taxes; more equitable balancing of human wellbeing and per capita energy use; cap and trade systems; carbon capture, storage, and utilization (CCUS); and nuclear power development. Restricting the use of fossil fuels through carbon taxes and cap and trade policies are the primary policy tools to lower their use. However, their implementation is likely to slow or halt economic growth and cause a financial crisis. Therefore, we suggest they be implemented gradually and moderately. Aggressive application of energy conservation policies involving land use and taxation could potentially reduce global energy consumption by 10% or more over the next 30 years. In summary our analyses indicate it is theoretically possible to achieve UN climate stabilization goals by 2050 if energy demand is constrained to 25% or less above the present level, renewable energy sources are developed at 6 to 8 times the present rate, energy efficiency and conservation measures are much more aggressively applied, nuclear power is expanded by 30% or more, developed countries (especially the US) reduce their per capita energy use by 40% or more, and carbon capture, utilization and storage methodologies are widely applied. We readily acknowledge achieving these goals in practice will depend on some technological breakthroughs and a high level of international cooperation that are both uncertain and may not be possible. The primary assumptions in our analyses are that wind and solar energy development will not be constrained by availability of land and metal ores. We recognize these assumptions may not hold. In this context we consider aggressive development of adaption as well as mitigation measures highly prudent.
Author Contributions
Conceptualization, J.L.H. and H.M.E.G.; methodology, J.L.H., H.M.E.G. and M.N.S.; software, M.N.S.; validation, J.L.H., H.M.E.G. and M.N.S.; formal analysis, H.M.E.G. and M.N.S.; investigation, J.L.H., H.M.E.G., R.V. and M.N.S.; resources, J.L.H., H.M.E.G. and M.N.S.; data curation, J.L.H. and M.N.S.; writing—original draft preparation, J.L.H.; writing—review and editing, J.L.H. and R.V.; visualization, H.M.E.G. and M.N.S.; supervision, J.L.H.; funding acquisition, H.M.E.G. All authors have read and agreed to the published version of the manuscript.
Funding
Please add: This research was partially funded by the National Science Foundation (NSF), awards #1739835 and#IIA-1301346, and New Mexico State University.
Institutional Review Board Statement
Not applicable.
Informed Consent Statement
Not applicable.
Data Availability Statement
The data used in this study are openly available in as described in the Methods and Data section.
Acknowledgments
The authors would like to thank three anonymous reviewers for providing valuable comments that helped in strengthening the manuscript.
Conflicts of Interest
The authors declare no conflict of interest. The funders had no role in the design of the study; in the collection, analyses, or interpretation of data; in the writing of the manuscript, or in the decision to publish the results. Any opinions, findings, and conclusions or recommendations expressed in this material are those of the author(s) and do not necessarily reflect the views of the National Science Foundation.
References
- Masson-Delmotte, V.; Zhai, P.; Pirani, A.; Connors, S.L.; Péan, C.; Berger, S.; Caud, N.; Chen, Y.; Goldfarb, L.; Gomis, M.I.; et al. (Eds.) IPCC Climate Change 2021: The Physical Science Basis. Contribution of Working Group I to the Sixth Assessment Report of the Intergovernmental Panel on Climate Change; Cambridge University Press: Cambridge, UK, 2021; in press. [Google Scholar]
- IPCC. Global Warming of 1.5 °C; International Panel on Climate Change: Geneva, Switzerland, 2018. [Google Scholar]
- Ripple, W.J.; Wolf, C.; Newsome, T.W.; Gregg, J.W.; Lenton, M.; Barnard, P.; Moomaw, W.R. World scientists warning of climate emergency 2021. BioScience 2021, 71, 894–898. [Google Scholar] [CrossRef]
- Ripple, W.J.; Wolf, C.; Newsome, T.M.; Galetti, M.; Alamgir, M.; Crist, E.; Mahmoud, M.I.; Laurance, W.F. World scientists’ warning to humanity: A second notice. BioScience 2017, 67, 1026–1028. [Google Scholar] [CrossRef]
- NOAA National Centers for Environmental Information. State of the Climate: Global Climate Report for Annual 2021. Published online January 2022, retrieved on 14 April 2022. Available online: https://www.ncdc.noaa.gov/sotc/global/202113 (accessed on 1 November 2021).
- Hov, Ø.; Cubasch, U.; Fischer, E.; Höppe, P.; Iversen, T.; Gunnar Kvamstø, N.; Kundzewicz, W.; Rezacova, D.; Rios, D.; Duarte Santos, F.; et al. Extreme Weather Events in Europe: Preparing for Climate Change Adaptation; Norwegian Meteorological Institute: Oslo, Norway, 2013. [Google Scholar]
- Reidmiller, D.R.; Avery, C.W.; Easterling, D.R.; Kunkel, K.E.; Lewis, K.L.; Maycock, T.K.; Stewart, B.C. Impacts, Risks, and Adaptation in the United States: Fourth National Climate Assessment, Volume II; NOAA: Washington, DC, USA, 2017. [Google Scholar] [CrossRef]
- WMO Statement on the State of the Climate 2020: Impacting Indicators 2021; WMO: Geneva, Switzerland, 2020; 51p.
- Dale, S. BP Statistical Review of World Energy 2021, 70th ed.; BP Plc: London, UK, 2021; Available online: https://www.bp.com/en/global/corporate/energy-economics/statistical-review-of-world-energy.html (accessed on 1 December 2021).
- Steffen, W.; Rockstrom, J.; Richardson, K.; Lenton, T.M.; Folke, C.; Lievermsna, D.; Summerhayes, C.P.; Barnosky, A.D.; Cornell, S.E.; Crucifix, M.; et al. Trajectories of the earth system in the Anthropocene. Proc. Natl. Acad. Sci. USA 2018, 115, 8252–8259. [Google Scholar] [CrossRef] [PubMed] [Green Version]
- Hansen, J.; Sato, M.; Kharecha, P.; Schuckmann, K.; Beerling, D.J.; Cao, J.; Marcott, S.; Mason-Delmotte, V.; Prather, M.J.; Rohling, E.J.; et al. Young people’s burden: Requirement of negative CO2 emissions. Earth Syst. Dynam. 2017, 8, 577–616. [Google Scholar] [CrossRef] [Green Version]
- Wuebbles, D.J.; Fahey, D.W.; Hibbard, K.A.; Dokken, D.J.; Stewart, B.C.; Maycock, T.K. (Eds.) USGCRP, 2017: Climate Science Special Report: Fourth National Climate Assessment, Volume I; U.S. Global Change Research Program: Washington, DC, USA, 2017; 470p. [Google Scholar] [CrossRef] [Green Version]
- Friedemann, A.J. Life after Fossil Fuels: A Reality Check on Alternative Energy; Springer International Publishing: London, UK, 2021. [Google Scholar]
- Hawken, P. (Ed.) Drawdown: The Most Comprehensive Plan Ever Proposed to Reverse Global Warming; Penguin Books: New York, NY, USA, 2017. [Google Scholar]
- Heinberg, R.; Fridley, D. Our Renewable Future; Heinberg, R., Lerch, D., Eds.; Island Press: Washington, DC, USA, 2016. [Google Scholar]
- Hickel, J.; Kallis, G. Is green growth possible? New Polit. Econ. 2019, 25, 469–486. [Google Scholar] [CrossRef]
- IEA. Net Zero by 2050: A Roadmap for the Global Energy Sector; International Energy Agency: Paris, France, 2021. [Google Scholar]
- Ryerson, W.N. Population: The Multiplier of Everything Else; Heinberg, R., Lerch, D., Eds.; The Post Carbon Reader Series: Population; Post Carbon Institute: Santa Rosa, CA, USA, 2010. [Google Scholar]
- Ritchie, H.; Roser, M.; Rosado, P. Fossil Fuels. Our World in Data 2021. Available online: https://ourworldindata.org/fossil-fuels (accessed on 1 December 2021).
- United Nations. World population prospects: 2021 upgrade. In United Nations Population Division; United Nations: New York, NY, USA, 2021; p. 7. [Google Scholar]
- United Nations. World Population Prospects 2019 Highlights (ST/ESA/SER.A/423); United Nations: New York, NY, USA, 2019; p. 39. [Google Scholar]
- Worldometer. World Population 2021. Available online: https://www.worldometers.info/world-population/ (accessed on 31 October 2021).
- BP Statistical Review of World Energy 2020. 2020. Available online: https://www.bp.com/content/dam/bp/business-sites/en/global/corporate/pdfs/energy-economics/statistical-review/bp-stats-review-2020-full-report.pdf (accessed on 1 December 2021).
- Our World in Data Our World in Data—Energy Use per Person 2019. Available online: https://ourworldindata.org (accessed on 4 February 2022).
- United Nation United Nation—Per Capita GDP at Current Prices—US Dollars. Available online: https://data.un.org/Data.aspx?d=SNAAMA&f=grID%3A101%3BcurrID%3AUSD%3BpcFlag%3A1 (accessed on 4 February 2022).
- UNDP. Human Development Report 2019. Beyond Income, beyond Averages, beyond Today: Inequalities in Human Development in the 21st Century. New York; UNDP: New York, NY, USA, 2019; Available online: http://hdr.undp.org/en/content/human-development-report-2019 (accessed on 1 December 2021).
- Helliwell, J.; Layard, R.; Sachs, J. World Happiness Report 2019. Sustainable Development Solutions Network. 2019. Available online: https://worldhappiness.report/ed/2019/ (accessed on 1 December 2021).
- IEA. World Energy Balances: Statistics Report; International Energy Agency: Paris, France, 2020; p. 227. [Google Scholar]
- Energy Information Administration. International Energy Outlook 2019 with Projections to 2050 (IEO2019) 2019. Available online: https://www.eia.gov/outlooks/ieo/pdf/ieo2019.pdf (accessed on 1 November 2021).
- Munz, R.; Reiterer, A. Overcrowded World? Global Population and International Migration; Haus Publishing: London, UK, 2007. [Google Scholar]
- United Nations. The world at six billion: Introduction. In United Nations Population Division; United Nations: New York, NY, USA, 1999; p. 11. [Google Scholar]
- Population, Agriculture, and Biodiversity: Problems and Prospects; Gustafson, J.P.; Raven, P.H.; Ehrlich, P.R. (Eds.) University of Missouri Press: Columbia, MO, USA, 2020. [Google Scholar]
- Epstein, A. The Moral Case for Fossil Fuels; Portfolio/Penguin: New York, NY, USA, 2014. [Google Scholar]
- Hall, C.A.S.; Klitgaard, K. Energy and the Wealth of Nations, 2nd ed.; Springer International Publishing: New York, NY, USA, 2018. [Google Scholar]
- Heinberg, R. The Party’s Over, 2nd ed.; New Society Publishers: Gabriola Island, BC, Canada, 2005. [Google Scholar]
- Nye, D.E. Consuming Power: A Social History of American Energies; The MIT Press: Cambridge, MA, USA, 1998. [Google Scholar]
- Ahmed, N.M. Failing States, Collapsing Systems: Biophysical Triggers of Political Violence; Springer: New York, NY, USA, 2017. [Google Scholar]
- Auzanneau, M. Oil, Power, and War; Chelsea Green Publishing: White River Junction, VT, USA, 2018. [Google Scholar]
- Bardi, U. Extracted; Chelsea Green Publishing: White River Junction, VT, USA, 2013. [Google Scholar]
- Heinberg, R. The End of Growth; New Society Publishers: Gabriola Island, BC, Canada, 2011. [Google Scholar]
- Randers, J. 2052: A Global Forecast for the Next Forty Years; Chelsea Green Publishing: White River Junction, Vermont, 2012. [Google Scholar]
- Tverberg, G. World Energy Consumption Since 1820 in Charts. Financial Sense. 2021. Available online: https://ourfiniteworld.com/2012/03/12/world-energy-consumption-since-1820-in-charts/ (accessed on 1 November 2021).
- The World Bank. Energy Use (kg of Oil Equivalent Per Capita). 2014. Available online: https://data.worldbank.org/indicator/EG.USE.PCAP.KG.OE (accessed on 1 November 2021).
- Gapminder Population|Gapminder. Available online: https://www.gapminder.org/data/documentation/gd003/ (accessed on 22 February 2022).
- Our World in Data 2021 Atmospheric CO₂ Concentration. Available online: https://ourworldindata.org/grapher/co2-concentration-long-term (accessed on 23 February 2022).
- World Bank GDP Per Capita (Current US$)—World|Data. Available online: https://data.worldbank.org/indicator/NY.GDP.PCAP.CD?name_desc=true&locations=1W (accessed on 23 February 2022).
- Our World in Data 2021 Average Temperature Anomaly. Available online: https://ourworldindata.org/grapher/temperature-anomaly (accessed on 23 February 2022).
- Friedemann, A.J. When Trucks Stop Running: Energy and the Future of Transportation; Springer Briefs in Energy: New York, NY, USA, 2016. [Google Scholar]
- IPCC Climate Change 2014: Synthesis Report. In Fifth Assessment; International Panel on Climate Change: Geneva, Switzerland, 2014; p. 151.
- IPCC Climate Change 2007: Synthesis Report. In Fourth Assessment; International National Panel on Climate Change: Geneva, Switzerland, 2007; p. 104.
- WMO. WMO Statement on the State of the Climate in 2017; World Meteorological Organization: Geneva, Switzerland, 2018. [Google Scholar]
- Xu, Y. Well 2 C: Mitigation strategies for avoiding dangerous to catastrophic climate changes. Proc. Natl. Acad. Sci. USA 2017, 114, 10315–10323. [Google Scholar] [CrossRef] [PubMed] [Green Version]
- NASA Global Temperature: Latest Annual Average Anomaly 2017. Global Climate Change: Vital Signs of the Planet 2018. Available online: https://climate.nasa.gov/vital-signs/global-temperature/ (accessed on 1 December 2021).
- Abraham, S. Lights Out. St; Martin’s Press: New York, NY, USA, 2010. [Google Scholar]
- Gates, B. How to Avoid a Climate Disaster: The Solutions We Have and the Breakthroughs We Need; Alfred A. Knopf: New York, NY, USA, 2021. [Google Scholar]
- Holechek, J.L. Global trends in population, energy use, and climate: Implications for policy development, rangeland management, and rangeland users. Rangel. J. 2013, 35, 117–129. [Google Scholar] [CrossRef]
- Brown, L. The Great Transition: Shifting from Fossil Fuels to Solar and Wind Energy; W. W. Norton & Company, Inc.: New York, NY, USA, 2015. [Google Scholar]
- Hughes, D. Drill, Baby, Drill; Post Carbon Institute: Santa Rosa, CA, USA, 2013; p. 166. [Google Scholar]
- Bryce, R. Power Hungry; Public Affairs Books: New York, NY, USA, 2010; p. 394. [Google Scholar]
- Holechek, J.L.; Sawalhah, M.N.; Cibils, A. Renewable energy, energy conservation and US rangelands. Rangelands 2015, 37, 217–225. [Google Scholar] [CrossRef]
- Gauthier, P. The Limits of Renewable Energy and the Case for Degrowth. 2018. Available online: https://www.resilience.org/stories/2018-11-21/the-limits-of-renewable-energy-and-the-case-for-degrowth/ (accessed on 1 November 2021).
- Hagens, N.J.; White, D.J. GDP, Jobs and Fossil Largesse. 2017. Available online: https://www.resilience.org/stories/2017-11-30/gdp-jobs-and-fossil-largesse/ (accessed on 1 November 2021).
- Rubin, J. The End of Growth; Random House Canada: Toronto, ON, Canada, 2012; ISBN 0-307-36091-1. [Google Scholar]
- U.S. Energy Information Administration. International Energy Outlook 2017; United States Energy Information Administration Report; U.S. Energy Information Administration: Washington, DC, USA, 2017; Volume DOA/EIA-0484, p. 76. [Google Scholar]
- Blanchard, R. The World Oil Supply Is Infinite: I Know that Because I Believe It. 2018. Available online: https://www.resilience.org/stories/2018-03-12/the-world-oil-supply-is-infinite-i-know-that-because-i-believe-it/ (accessed on 1 November 2021).
- Heinberg, R. Electric Cars to the Rescue? 2018. Available online: https://www.resilience.org/stories/2018-06-18/electric-cars-to-the-rescue/ (accessed on 1 November 2021).
- Leeb, S.L. Red Alert; Business Plus: New York, NY, USA, 2011. [Google Scholar]
- Leeb, S.L. Game Over; Business Plus: New York, NY, USA, 2009. [Google Scholar]
- Van Zalk, P.; Behrens, P. The spatial extent of renewable and non-renewable power generation: A review and meta-analysis of power densities and their application in the US. Energy Policy 2018, 123, 83–91. [Google Scholar] [CrossRef]
- Merrill, D. The U.S. Will Need a Lot of Land for a Zero-Carbon Economy; Bloomberg: New York, NY, USA, 2021. [Google Scholar]
- Miller, L.; Keith, D.W. Corriegendum: Observation-based solar and wind capacity factors and power densities (2018 Environ. Res. Lett. 13 104008). Environ. Res. Lett. 2019, 14. [Google Scholar] [CrossRef]
- Miller, L.M.; Keith, D.W. Observation-based solar and wind capacity factors and power densities. Env. Res. Lett. 2018, 13, 104008. [Google Scholar] [CrossRef] [Green Version]
- IEA. Energy efficiency 2020: Energy efficiency progress, already lagging, faces further setbacks from COVID-19 pandemic. In International Energy Agency; IEA: Paris, France, 2021. [Google Scholar]
- Naam, R. The Infinite Resource; University Press of New England: Lebanon, NH, USA, 2013. [Google Scholar]
- Energy Information Administration. U.S. electricity generation by type 1949–2016. In Electric Power Annual 2017; U.S. Department of Energy: Washington, DC, USA, 2018. [Google Scholar]
- Gallagher, L. The End of the Suburbs: Where the American Dream is Moving; Portfolio/Penguin: New York, NY, USA, 2013. [Google Scholar]
- Holechek, J.L.; Geli, H.M.; Cibils, A.F.; Sawalhah, M.N. Climate change, rangelands, and sustainability of ranching in the Western United States. Sustainability 2020, 12, 4942. [Google Scholar] [CrossRef]
- Kunstler, J.K. Too Much Magic: Wishful Thinking, Technology, and the Fate of the Nation; Grove Press: New York, NY, USA, 2012. [Google Scholar]
- Steiner, C. $20 Per Gallon; Grand Central Publishing: New York, NY, USA, 2009. [Google Scholar]
- Council, N.R. Driving the Built Environment: The Effects of Compact Development on Motorized Travel, Energy Use, and CO2 Emissions; National Academic Press: Washington, DC, USA, 2009; p. 286. [Google Scholar]
- Aleklett, K. Peeking at Peak Oil; Springer: New York, NY, USA, 2012. [Google Scholar]
- NationMaster. Oil Consumption: Countries Compared 2018. Available online: https://www.nationmaster.com/country-info/stats/Energy/Oil/Consumption/Per-capita (accessed on 1 November 2021).
- Romm, J. Climate Change: What Everyone Needs to Know, 2nd ed.; Oxford University Press: Oxford, UK, 2018; p. 1328. [Google Scholar]
- Wynes, S.; Nicholas, K.A. The climate mitigation gap: Education and government recommendations miss the most effective individual actions. Environ. Res. Lett. 2017, 12, 074024. [Google Scholar] [CrossRef] [Green Version]
- Kirstra, J.S.; Mastrucci, A.; Min, J.; Riahi, K.; Rao, N.D. Decent living gaps and energy needs around the world. Environ. Res. Lett. 2021, 16, 095006. [Google Scholar] [CrossRef]
- Rijpma, A. What Can’t Money Buy? Wellbeing and GDP Since 1820; Utrecht University, Centre for Global Economic History: Utrecht, The Netherlands, 2016; p. 33. [Google Scholar]
- Rijpma, A. Composite Measure of Wellbeing. 2017. Available online: https://clio-infra.eu/Indicators/CompositeMeasureofWellbeing.html (accessed on 1 December 2021).
- Our World in Data 2021 Primary Energy Consumption. Available online: https://ourworldindata.org/grapher/primary-energy-cons (accessed on 23 February 2022).
- Oswald, Y.; Owen, A.; Steinberger, J.K. Large inquality in international and intranational energy footprints between income groups across consumption categories. Nat. Energy 2020, 5, 231–239. [Google Scholar] [CrossRef]
- IEA. Is Carbon Capture too Expensive? IEA: Paris, France, 2021. [Google Scholar]
- Herzog, H.J. Carbon Capture; The MIT Press: Cambridge, MA, USA, 2018. [Google Scholar]
- IPCC. IPCC Special Report on Carbon Capture and Storage; Cambridge University Press: Cambridge, UK, 2005. [Google Scholar]
- Heinberg, R. Blackout: Coal, Climate and the Last Energy Crisis; Clairview Books: Forest Row, UK, 2009. [Google Scholar]
- McDonald, R.R.; Fargione, J.; Kiesecker, J.; Miller, W.M.; Powell, J. Energy sprawl or energy efficiency: Climate policy impacts on natural habitat for United States of America. PLoS ONE 2009, 4, e6802. [Google Scholar] [CrossRef] [PubMed] [Green Version]
- Brook, B.W. Could nuclear fission energy, etc., solve the greenhouse problem? Energy Policy 2012, 42, 4–8. [Google Scholar] [CrossRef]
- Qvsit, S.H.; Brook, B.W. Potential for worldwide displacement of fossil fuel electricity in three decades based on extrapolation of regional deployment data. PLoS ONE 2015, 10, e0124074. [Google Scholar] [CrossRef] [PubMed]
- Urban, F.; Mitchell, T. Climate Change, Disasters, and Electricity Generation; Institute of Development Studies: Brighton, UK, 2011; Volume 8, p. 35. [Google Scholar]
Figure 1.
Timeseries of global human population growth since 1800s (billions) (Adapted from ref. [44]), atmospheric CO2 concentration since 1820 (ppm) (Adapted from ref. [45]), Gross Domestic Product (GDP) per capita since 1960 (USD) (Adapted from ref. [46]), and median temperature anomaly since 1850 (°C) (Adapted from ref. [47]).


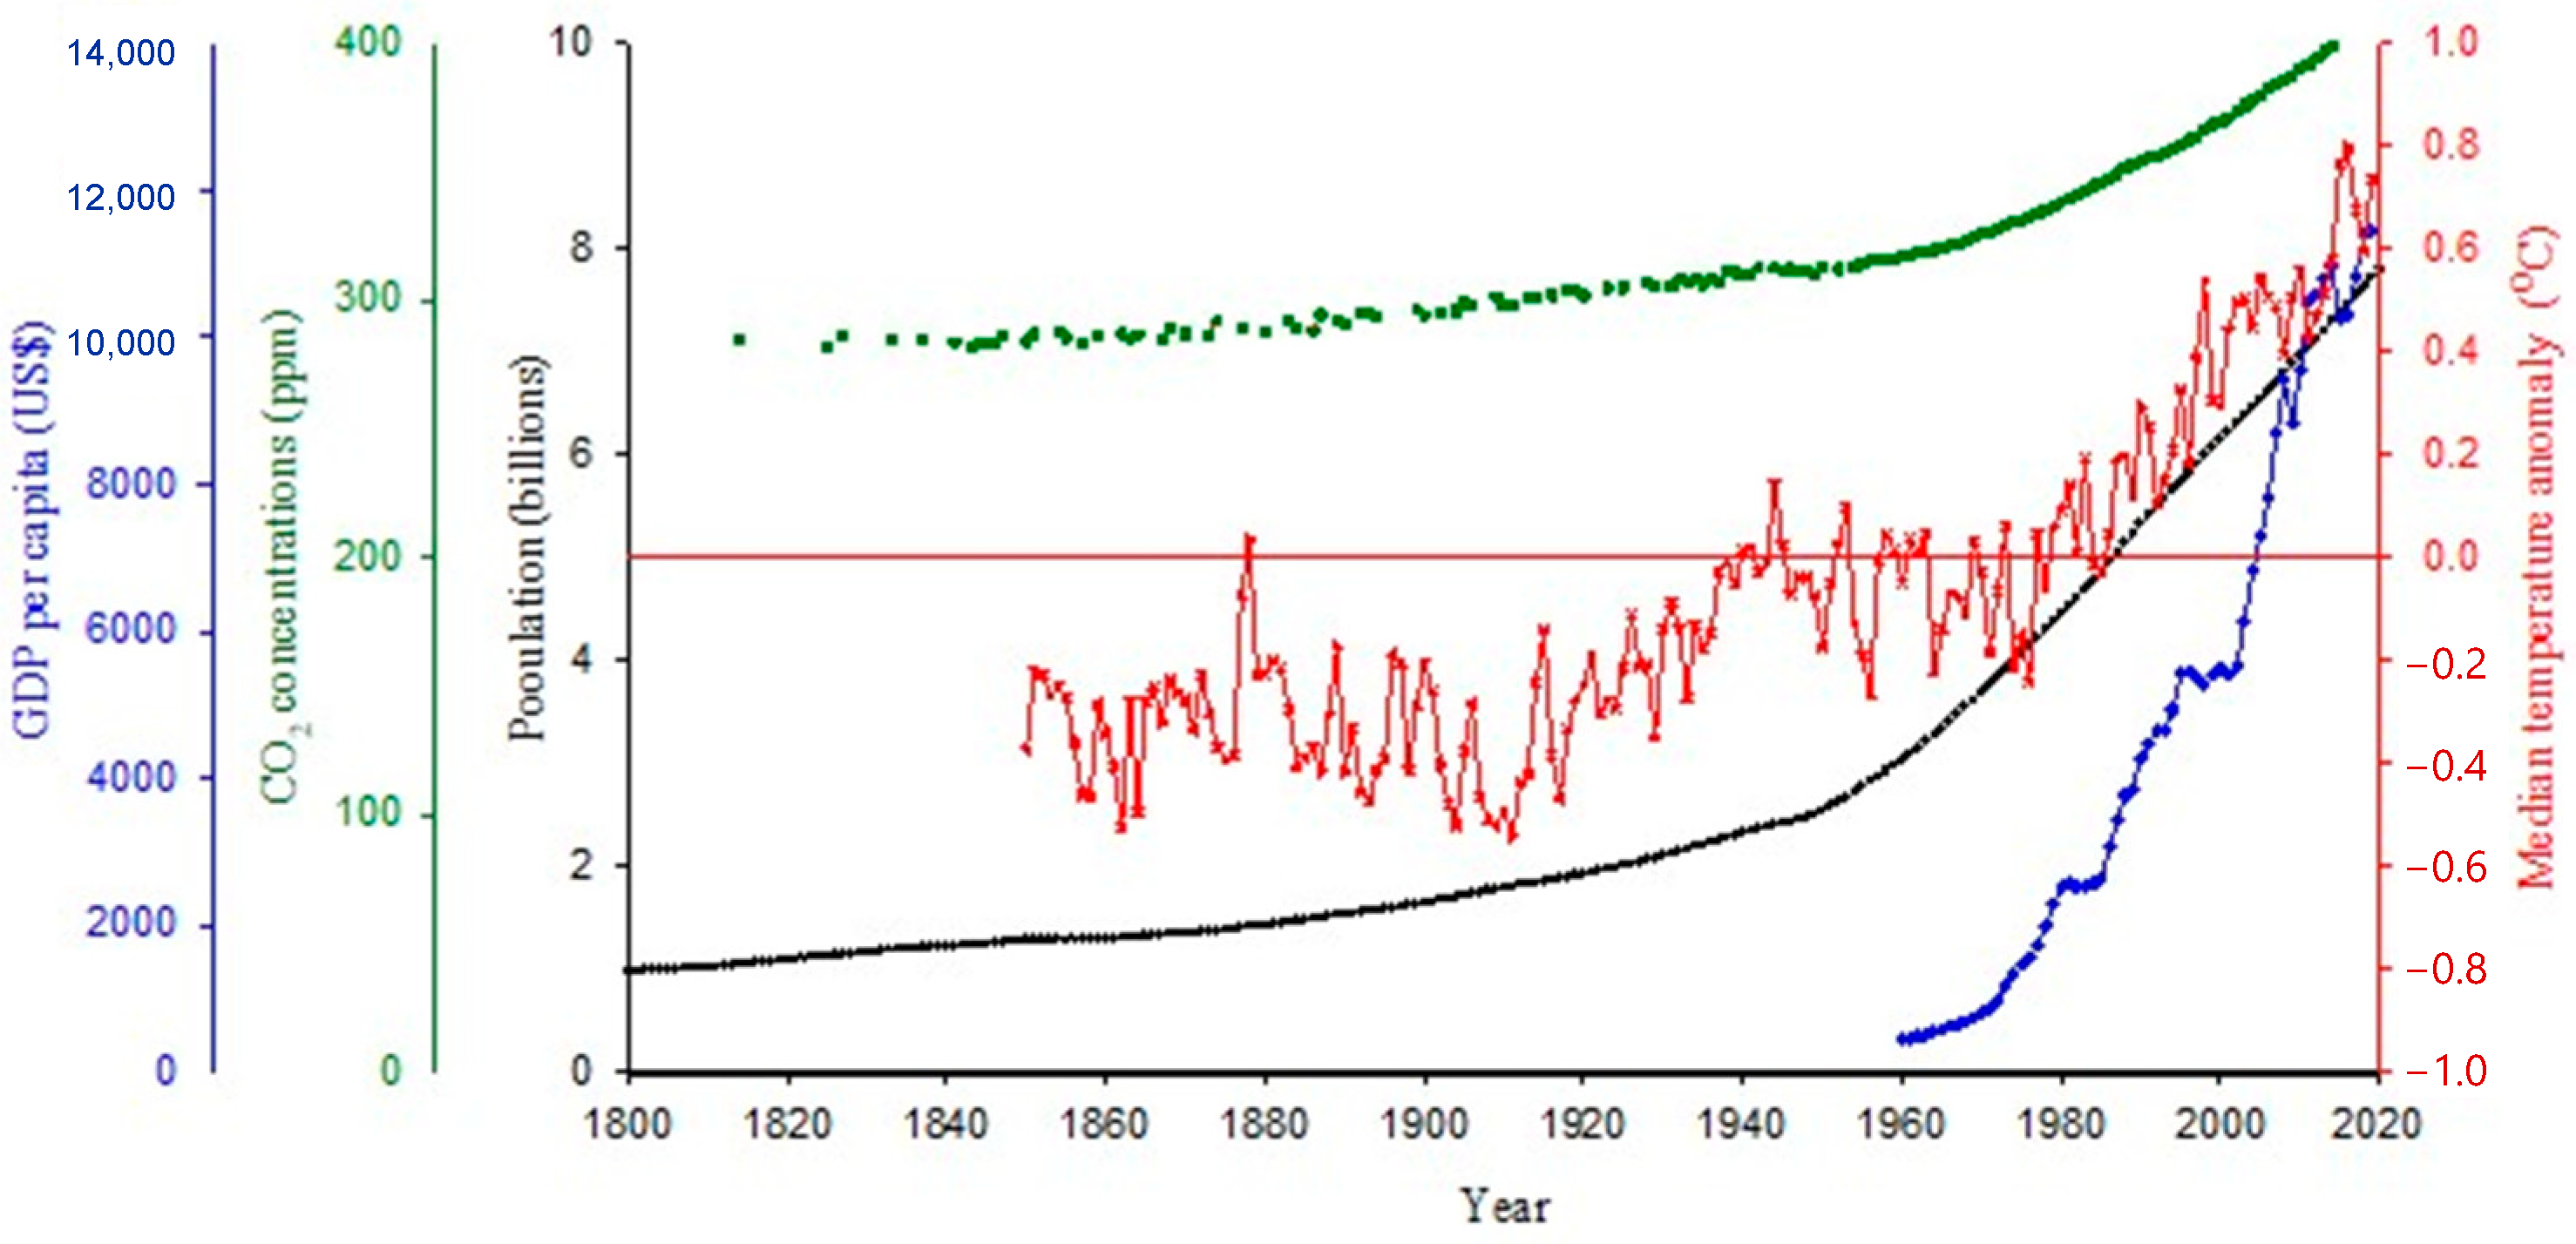
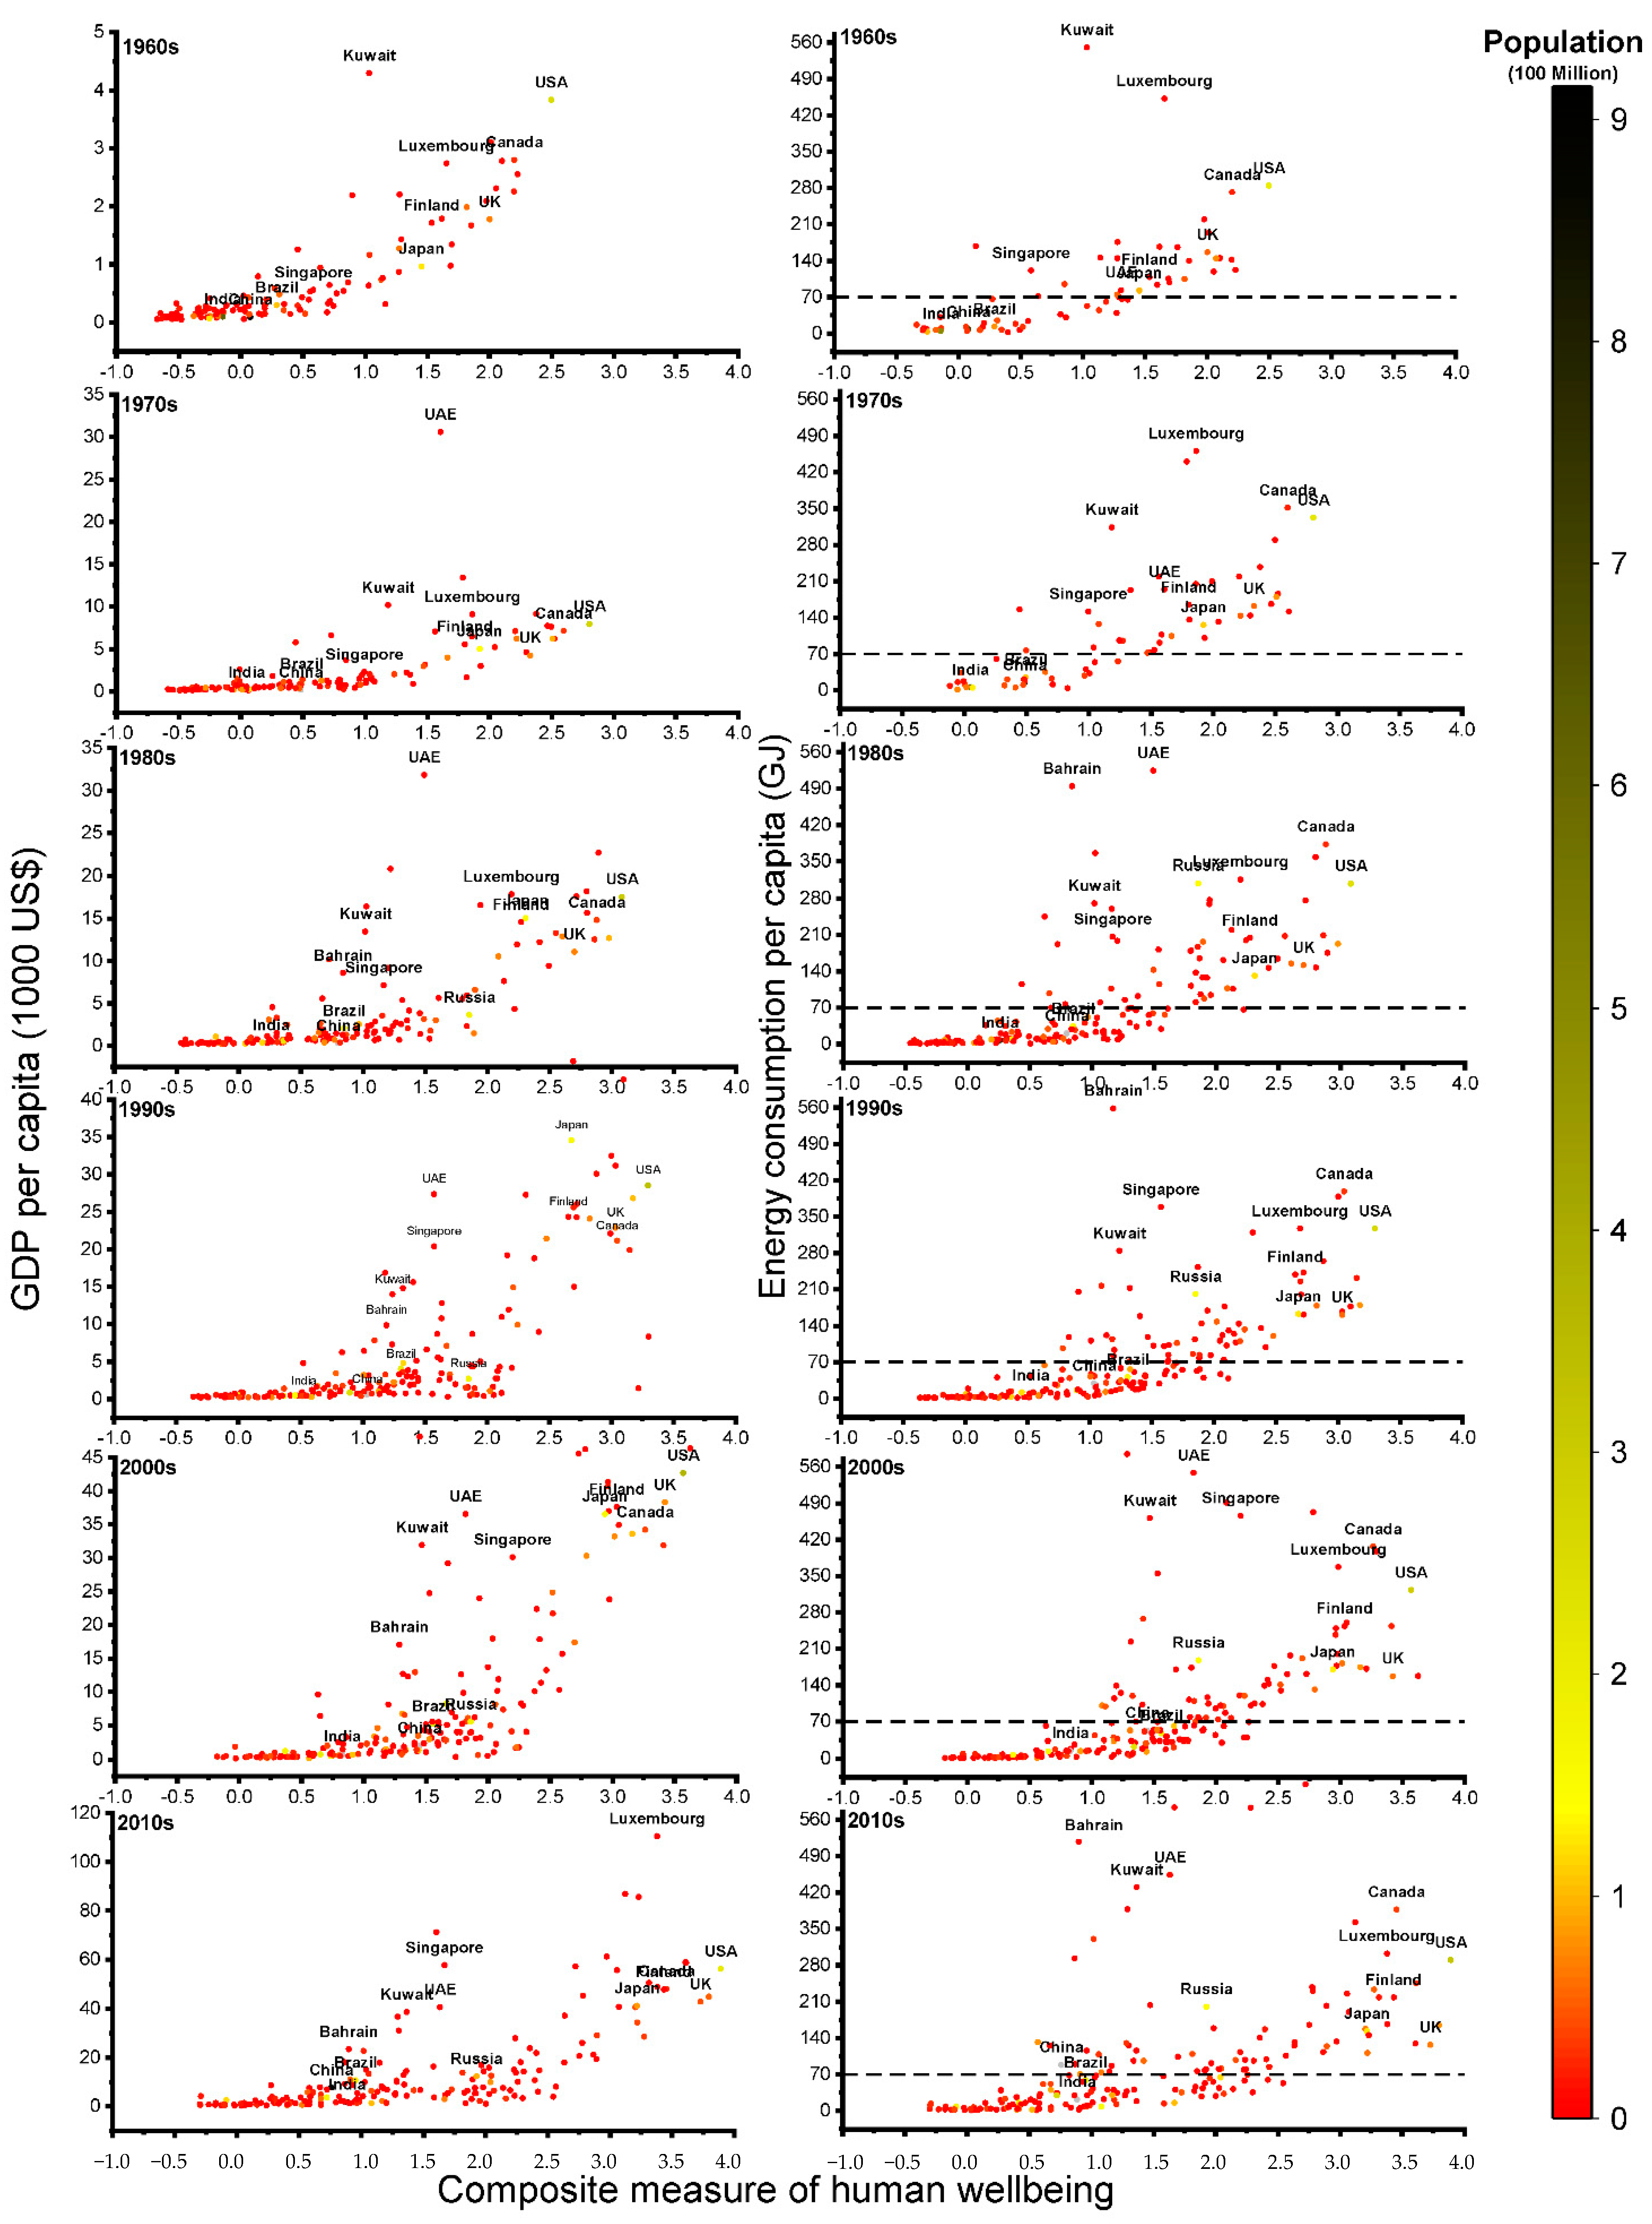
Table 1.
Primary energy consumption by fuel type for 2015, 2019 and 2020. Data source: BP statistical review of world energy (2021).
Table 1.
Primary energy consumption by fuel type for 2015, 2019 and 2020. Data source: BP statistical review of world energy (2021).
| Fuel Type | Primary Energy Consumption | |||||
|---|---|---|---|---|---|---|
| 2015 | 2019 | 2020 | ||||
| Exajoules | % | Exajoules | % | Exajoules | % | |
| Fossil fuels | ||||||
| Oil | 183.63 | 33.7 | 191.89 | 33.0 | 173.73 | 31.2 |
| Natural Gas | 125.22 | 23.0 | 140.54 | 24.2 | 137.62 | 24.7 |
| Coal | 158.64 | 29.1 | 157.64 | 27.1 | 151.42 | 27.2 |
| Sub-total | 467.49 | 85.9 | 490.07 | 84.3 | 462.77 | 83.1 |
| Non-Fossil fuels | ||||||
| Nuclear | 23.46 | 4.3 | 24.93 | 4.3 | 23.98 | 4.3 |
| Hydro | 35.38 | 6.5 | 37.69 | 6.5 | 38.16 | 6.9 |
| Renewables | 18.1 | 3.3 | 28.82 | 5.0 | 31.71 | 5.7 |
| Sub-total | 76.94 | 14.1 | 91.44 | 15.7 | 93.85 | 16.9 |
| Total all fuel types | 544.43 | 581.51 | 556.62 | |||
Table 2.
World energy consumption, carbon dioxide emission, gross domestic product and population for selected years between 2000–2020. Data source: BP statistical review of world energy (2021).
Table 2.
World energy consumption, carbon dioxide emission, gross domestic product and population for selected years between 2000–2020. Data source: BP statistical review of world energy (2021).
| World Energy Consumption Categories, CO2 Emission, and Population | 2000 | 2010 | 2015 | 2019 | 2020 |
|---|---|---|---|---|---|
| World energy consumption (Exajoules) | 424 | 505 | 544 | 582 | 557 |
| World energy consumption per capita (Gigajoule) | 69.0 | 72.6 | 73.7 | 75.5 | 71.5 |
| World fossil fuel consumption (Exajoules) | 329.0 | 425.0 | 468.0 | 490.0 | 463.0 |
| World CO2 emissions (Million Tons) | 25,120 | 31,291 | 33,206 | 34,357 | 32,284 |
| World CO2 emissions per capita (Tons) | 4.09 | 4.50 | 4.50 | 4.45 | 4.1 |
| World gross domestic product (Trillions of USD) | 33.55 | 66.14 | 72.23 | 87.61 | 84.71 |
| World gross domestic product per capita (USD) | 5488 | 9556 | 10251 | 11417 | 10962 |
| World Population (Billions) | 6.143 | 6.957 | 7.380 | 7.713 | 7.795 |
Table 3.
Nine different scenarios of renewable, nuclear, hydro, and fossil fuel energy consumption in 2050 for the 2020 base level (556.6 Exajoules). Data source: BP statistical review of world energy (2021).
Table 3.
Nine different scenarios of renewable, nuclear, hydro, and fossil fuel energy consumption in 2050 for the 2020 base level (556.6 Exajoules). Data source: BP statistical review of world energy (2021).
| Scenario | Base | Base | Base | |||
|---|---|---|---|---|---|---|
| Exajoules | % | Exajoules | % | Exajoules | % | |
| Renewable (1Xincrease) 1 | 118.4 | 21.3 | 118.4 | 17.0 | 118.4 | 14.2 |
| Nuclear | 24.0 | 4.3 | 24.0 | 3.5 | 24.0 | 2.9 |
| Hydro | 38.2 | 6.9 | 38.2 | 5.5 | 38.2 | 4.6 |
| Fossil fuels | 376.0 | 67.6 | 514.8 | 74.0 | 654.3 | 78.4 |
| Total | 556.6 | 695.4 | 834.9 | |||
| Renewable (3Xincrease) 2 | 291.8 | 52.4 | 291.8 | 42.0 | 291.8 | 35.0 |
| Nuclear (2X) 4 | 48.0 | 8.6 | 48.0 | 6.9 | 48.0 | 5.7 |
| Hydro (1.31X) 5 | 50.0 | 9.0 | 50.0 | 7.2 | 50.0 | 6.0 |
| Fossil fuels | 166.9 | 30.0 | 305.6 | 43.9 | 445.2 | 53.3 |
| Total | 556.6 | 695.4 | 834.9 | |||
| Renewable (6Xincrease) 3 | 551.9 | 84.9 | 551.9 | 79.4 | 551.9 | 66.1 |
| Nuclear (2X) 4 | 48.0 | 7.4 | 48.0 | 6.9 | 48.0 | 5.7 |
| Hydro (1.31X) 5 | 50.0 | 7.7 | 50.0 | 7.2 | 50.0 | 6.0 |
| Fossil fuels | 0.0 | 0.0 | 45.5 | 6.5 | 185.0 | 22.2 |
| Total | 649.9 | 695.4 | 834.9 | |||
1 Renewable = 30 years (2.89 EJ, 1Xincrease in 2020) + 31.7 EJ (2020 consumption) = 118.4 EJ Equation (1). 2 Renewable = 30 years (8.67 EJ, 3Xincrease in 2020) + 31.7 EJ (2020 consumption) = 291.8 EJ Equation (1). 3 Renewable = 30 years (17.34 EJ, 6Xincrease in 2020) + 31.7 EJ (2020 consumption) = 551.9 EJ Equation (1). 4 Nuclear = (23.98 EJ, 2020 consumption) 2 = 48.0 EJ Equation (2), 5 Hydro = (38.16 EJ, 2020 consumption) 1.31 = 50.0 EJ Equation (3).
Table 4.
World population characteristics for selected countries and regions for 2020. Data source: United Nations world population prospects (2021).
Table 4.
World population characteristics for selected countries and regions for 2020. Data source: United Nations world population prospects (2021).
| Region/Country | Population (Millions) | Yearly Change (%) | World Shares (%) |
|---|---|---|---|
| Asia | 4641.1 | 0.86 | 59.5 |
| China | 1439.3 | 0.39 | 18.5 |
| India | 1380.0 | 0.99 | 17.7 |
| Japan | 126.5 | 0.3 | 1.6 |
| Africa | 1340.6 | 2.49 | 17.2 |
| Nigeria | 206.1 | 2.58 | 2.6 |
| Ethiopia | 115.0 | 2.57 | 1.5 |
| Egypt | 102.3 | 1.94 | 1.3 |
| Europe | 747.6 | 0.06 | 9.6 |
| Germany | 83.8 | 0.32 | 1.1 |
| United Kingdom | 67.9 | 0.53 | 0.9 |
| France | 65.3 | 0.22 | 0.8 |
| Latin America and the Caribbean | 654.0 | 0.9 | 8.4 |
| Brazil | 212.6 | 0.72 | 2.7 |
| Mexico | 128.9 | 1.06 | 1.6 |
| Colombia | 50.9 | 1.08 | 0.6 |
| Northern America | 368.9 | 0.62 | 4.7 |
| Canada | 37.7 | 0.89 | 0.5 |
| United States of America | 331.0 | 0.59 | 4.2 |
| Oceania | 42.7 | 1.31 | 0.5 |
| Australia | 25.5 | 1.18 | 0.3 |
| New Zealand | 4.8 | 0.82 | 0.06 |
| World | 7794.8 | 1.05 | 100.0 |
Table 5.
Energy consumption per capita, nominal gross domestic product (GDP) per capita, Human Development Index (HDI) and Happiness Score, and the Composite Measure of Wellbeing for 5 selected countries and regions.
Table 5.
Energy consumption per capita, nominal gross domestic product (GDP) per capita, Human Development Index (HDI) and Happiness Score, and the Composite Measure of Wellbeing for 5 selected countries and regions.
| Country | Level of Energy Consumption Per Capita 1 (GJ/Capita) | GDP Per Capita 2 (USD) | Human Development Index 3 | Happiness Score 4 | Composite Measure of Wellbeing 5 |
|---|---|---|---|---|---|
| Over 200 GJ/capita | |||||
| Australia | 233 | 54,763 | 0.944 | 7.223 | 3.144 |
| Canada | 386 | 46,550 | 0.929 | 7.232 | 2.995 |
| Finland | 203 | 48,678 | 0.938 | 7.809 | 1.488 |
| Russia | 205 | 11,606 | 0.824 | 5.546 | 0.880 |
| United States | 288 | 65,134 | 0.926 | 6.940 | 2.754 |
| Average | 263 | 45,346 | 0.912 | 6.950 | 2.252 |
| 100–199 GJ/capita | |||||
| Germany | 156 | 46,232 | 0.947 | 7.076 | 2.545 |
| Israel | 132 | 46,376 | 0.919 | 7.129 | 0.658 |
| Japan | 145 | 40,063 | 0.919 | 5.871 | 0.862 |
| Switzerland | 137 | 85,135 | 0.955 | 7.560 | 2.756 |
| United Kingdom | 114 | 41,855 | 0.932 | 7.165 | 2.463 |
| Average | 137 | 51,932 | 0.934 | 6.960 | 1.857 |
| 51–99 GJ/capita | |||||
| Brazil | 59 | 8755 | 0.765 | 6.376 | −0.218 |
| China | 99 | 10,004 | 0.761 | 5.124 | −0.451 |
| Mexico | 59 | 9849 | 0.779 | 6.465 | −0.217 |
| South Africa | 89 | 6001 | 0.709 | 4.814 | 0.343 |
| Turkey | 78 | 9127 | 0.820 | 5.132 | −0.298 |
| Average | 77 | 8747 | 0.767 | 5.582 | −0.168 |
| 26–50 GJ/capita | |||||
| Colombia | 38 | 6432 | 0.767 | 6.163 | −0.098 |
| Costa Rica | 43 | 12,238 | 0.810 | 7.121 | 0.265 |
| Egypt | 38 | 3161 | 0.707 | 4.151 | −0.392 |
| Indonesia | 32 | 4136 | 0.718 | 5.286 | −0.717 |
| Vietnam | 43 | 2715 | 0.704 | 5.353 | −0.008 |
| Average | 39 | 5737 | 0.741 | 5.615 | −0.190 |
| Less than 26 GJ/capita | |||||
| Bangladesh | 10 | 1846 | 0.632 | 4.833 | −0.483 |
| Ethiopia | 3 | 828 | 0.485 | 4.186 | −0.192 |
| India | 25 | 2116 | 0.645 | 3.573 | −0.581 |
| Nigeria | 10 | 2361 | 0.539 | 4.724 | −0.614 |
| Tanzania | 5 | 1084 | 0.529 | 3.476 | −0.445 |
| Average | 11 | 1647 | 0.566 | 4.158 | −−0.463 |
| World Average | 75 | 11,339 | 0.742 | 5.534 | 0.304 |
1 Data source: BP statistical review of world energy (2021); Our world in Data, Energy use per person 2019. 2 Data source: United Nations, GDP per capita in US dollars 2019. 3 Data source: United Nations, Human development report, 2020. 4 Data source: United Nations, World happiness report, 2020. 5 Data source: Projected for the 2010s decade from Rijpma [86,87].
Publisher’s Note: MDPI stays neutral with regard to jurisdictional claims in published maps and institutional affiliations. |
© 2022 by the authors. Licensee MDPI, Basel, Switzerland. This article is an open access article distributed under the terms and conditions of the Creative Commons Attribution (CC BY) license (https://creativecommons.org/licenses/by/4.0/).
Share and Cite
MDPI and ACS Style
Holechek, J.L.; Geli, H.M.E.; Sawalhah, M.N.; Valdez, R. A Global Assessment: Can Renewable Energy Replace Fossil Fuels by 2050? Sustainability 2022, 14, 4792. https://0-doi-org.brum.beds.ac.uk/10.3390/su14084792
AMA Style
Holechek JL, Geli HME, Sawalhah MN, Valdez R. A Global Assessment: Can Renewable Energy Replace Fossil Fuels by 2050? Sustainability. 2022; 14(8):4792. https://0-doi-org.brum.beds.ac.uk/10.3390/su14084792
Chicago/Turabian StyleHolechek, Jerry L., Hatim M. E. Geli, Mohammed N. Sawalhah, and Raul Valdez. 2022. "A Global Assessment: Can Renewable Energy Replace Fossil Fuels by 2050?" Sustainability 14, no. 8: 4792. https://0-doi-org.brum.beds.ac.uk/10.3390/su14084792
Note that from the first issue of 2016, this journal uses article numbers instead of page numbers. See further details here.