1. Introduction
Investments in urban railway transit have proven to bring significant economic and environmental contributions to cities around the world [
1], such as, for example, greater savings in travel times, an increase in the ridership of public transportation, a reduction in car ownership, as well as an overall reduction in CO
2 emissions per passenger-kilometer. A massive investment program on the railway infrastructure has recently been launched in Italy by the national infrastructure manager, i.e., Rete Ferroviaria Italiana (RFI). The strategic program [
2] includes not only investments for new railway corridors, but also for upgrading the existing infrastructure and above all, for revamping many medium/large stations scattered across the national territory.
In this regard, RFI strategy aims at transforming existing railways stations as intermodal nodes and multiservice hubs by upgrading their mobility role defined by the relationship with the urban environment and the multi-modal mobility chain. Well-integrated and strategically located within the urban ecosystem, railway stations are in fact capable of positively influencing larger redevelopment processes of urban districts as active components of strategic urban re-organization and re-generation interventions. With respect to this investment framework, RFI’s program has identified the first set of 600 top-priority stations, among 2200 across the national territory, due to be refurbished by 2026.
The general objective of RFI is to provide the railway stations with efficient and updated architectural standards to make them more accessible and comfortable for all travelers by improving safety, security, and efficiency levels and, as a result, the overall attractiveness of the stations.
The key objectives set by this ambitious program will be met through the reconfiguration of both internal and external spaces, aimed at: (i) improving livability within the stations’ premises; (ii) increasing decorum and the quality of all spaces, including the public realm, through a well-calibrated provision of the greenery, new urban services, retail offerings and functions; (iii) introducing intelligence in the infrastructural assets through the provision of smart solutions; and (iv) promoting multi-modal accessibility and inter-modality by encouraging active and shared modes of transportation.
Thus, the interventions of the program may include—and are not limited to—the provision/restyling of overpasses/underpasses, canopies, ramps, elevators, escalators, tactile paths, lighting, pavements etc.; the integration/renewal of audio/video information, communication, and surveillance systems; the introduction of cycle paths, bicycle parking stations, taxi stands, short/long term car parks, public transportation shelters, and other transportation-related facilities.
The current legislation in Italy provides that these interventions must be subjected to an ex ante assessment [
3]. Although the Cost-Benefit Analysis (CBA) represents the main methodology for assessing public investments, not only in Italy, but also in all of Europe [
4], when it is not possible to justifiably measure the benefits in monetary terms, a Cost-Effectiveness Analysis (CEA) is generally required.
The guidelines for the assessment of investments in the public works of the Italian Ministry of Infrastructure and Transportation provide that the use of one technique over the others also depends on the type and amount of the investment. For asset renewal interventions (e.g., extraordinary maintenance, recovery, and restructuring), a CEA is required. However, some of these interventions may have an impact on different dimensions. This is the case, for example, of a new urban pedestrian overpass, which may not only improve safety and accessibility, but also the architectural quality of the station. Thus, the need to find a way to identify the most effective interventions to be prioritized in the function of several dimensions of effectiveness emerged.
In this research, a specific method—based on CEA—is proposed to explore and identify a multi-dimensional set of key performance indicators (KPIs) for prioritizing investments, using a large set of data from different sources: information either owned or periodically collected by the infrastructure manager, data from specific surveys, and data from external sources.
The paper is organized as follows. In
Section 2, a review of the literature on CEA is proposed, focusing on the theoretical background of multi-dimensional CEA and on its application for the assessment of investments in railways stations.
Section 3 describes the proposed methodology and the estimation process for each of the identified assessment dimensions (i.e., accessibility, equity and social aspects, safety and security, environmental sustainability, and architectural quality).
Section 4 presents an application to a case study representing the typical configuration of a medium-sized Italian railway station. Finally, in
Section 5, conclusions are drawn, and research perspectives are addressed.
2. Literature Review
The potential impacts of transportation projects, policies, or programs can be evaluated by different approaches. Among the most consolidated techniques used in transportation practice are the CBA and the CEA. Browne and Ryan [
5] highlighted that these approaches have strengths and weaknesses in terms of: (i) their utility to policymakers; (ii) transparency and ease of application; (iii) data availability; and (iv) the level of subjectivity and degree of qualitative assessment.
CBA is a systematic method for estimating direct and indirect private and social costs and benefits associated with a policy action. This method involves the extraction from the set of predicted impacts those for which monetary values can be obtained or estimated. In order to determine the extent to which the benefits of a project exceed its costs, the Net Present Value (NPV) is calculated as the algebraic sum of the positive and negative values, discounted with respect to a base year, of its impacts. If this sum is positive, then it is possible to adopt the alternative that yields the maximum net value, subject to the constraint of financial feasibility. The challenge in CBA is in determining the monetary values, since many of the impacts cannot be quantified directly from prices in the market, but are rather inferred by the analyst. For instance, improvements in the accessibility of the railway station and in the safety perceived by travelers, although quantifiable in physical units, cannot easily be assigned monetary values. In summary, although theoretically very attractive, the practical application of the CBA is limited by a series of technical complexities for attributing realistic monetary values to all potential impacts [
6,
7]. Furthermore, the non-monetizable impacts that may be significant in the selection of an alternative cannot be integrated into a cost-benefit framework [
8].
On the other hand, CEA is an economic evaluation technique that compares the relative cost and outcomes of different course of actions in order to assure efficient use of investment resources. The effectiveness of a measure can be defined in terms of the degree to which expected objectives are achieved [
5]. It is typically adopted for small projects where there is only one type of cost considered as relevant (investment cost), and where benefits are difficult to value or quantify in monetary terms [
9,
10,
11]. Then, it is preferable to calculate the investment cost per unit of outcomes (i.e., the physical quantity of effects), e.g., euro spent per accidents avoided, making it possible to compare different design alternatives and eventually, to rank the investments based on the Cost-Effectiveness Index. Thus, the main advantage of using CEA instead of CBA is that there is no need to assign monetary values to the impacts of alternatives, since physical dimensions for measurements are used when defining effectiveness levels. Moreover, the CEA can integrate potential impacts that would not be integrated into a CBA. Conversely, the main drawback of using CEA is that it only finds the cheapest way to achieve the goal of effectiveness and cannot inform whether the achievement of the goal is worth the cost [
5]. However, since CEA is based on an estimation of the intervention impacts in relation to its main objectives, it presents the advantage of producing easy to understand findings that focus on the main relevant issues for key stakeholders (including policy makers and decision makers). Furthermore, if the analysis is based on specific links between inputs and outputs that are relatively well established, CEA can facilitate the description of the actual functioning of the interventions. This can be useful for the refining of existing policies or improving the effectiveness of future interventions. For these reasons, CEA is recognized as a lean technique, and its use is particularly recommended when economic appraisal through the implementation of a different analysis tool would be too expensive in terms of time, monetary costs, and resources.
Currently, CEA is very popular in areas such as health and education, but it is also becoming more widely used in the transportation sector for assessing policies, technologies, and infrastructural interventions. In transportation practice, CEA is traditionally adopted to inform the decision makers about what set of options to implement when faced with resource constraints (budget) and to contribute to a more informed debate on resource allocation priorities, providing general information on the relative costs and outcomes of different technologies or policies [
12]. Furthermore, CEA can be used for an ex ante assessment (thus the “forecasted” effectiveness is estimated) or an ex post assessment (hence the “actual” effectiveness is measured); its application in both of the assessment phases is desirable in order to ensure that the expected impacts and effects actually occur and to refine the interventions in question [
5].
Transportation research has primarily focused on applying the CEA to a single outcome, for example, to study transportation measures and projects aimed at mitigating CO
2 emissions [
13,
14], to determine the costs and effectiveness of noise reduction measures for railways [
15], to assess investments in terms of transportation equity [
16], and to prioritize spending on traffic safety [
17]. However, there are also studies that have taken into consideration several outcomes of a different nature; accordingly, the analysis tool is generally referred as weighted-CEA [
18] or, as in this article, multi-dimensional CEA. This is the case, for instance, of Jaeger and Egelkraut [
19], who analyzed whether different levels of use and types of biofuels is a cost-effective measure to mitigate climate change in a setting of multiple objectives, or the case of Pansing et al. [
20], who evaluated several Travel Demand Management (TDM) strategies and Transportation Control Measure (TCM) projects with reference to dissimilar outcomes, such as pollutant emissions (HC/ROGS, NOx, CO, PM10) and travel mode impacts (in terms of vehicle-trips and vehicle-kilometers traveled).
Nevertheless, to the best of our knowledge, no research was found in the literature in which a CEA was applied for the assessment of infrastructural interventions for the revamping of railway stations. This study, therefore, aims to fill the existing research gap on the use of a multi-dimensional CEA to prioritize infrastructural interventions considering, at the same time, the investment costs and the effectiveness of such interventions in pursuing multiple strategic objectives, not only from the perspective of the infrastructure manager, but also of other stakeholders, such as travelers, citizens, and local authorities.
3. Materials and Methods
The proposed methodology, based on CEA, works on a series of subsequent steps, which can be re-iterated by proposing different intervention alternatives and/or improvement solutions, in order to meet the strategic goals by progressively acting on both the cost reduction and increased effectiveness of the interventions.
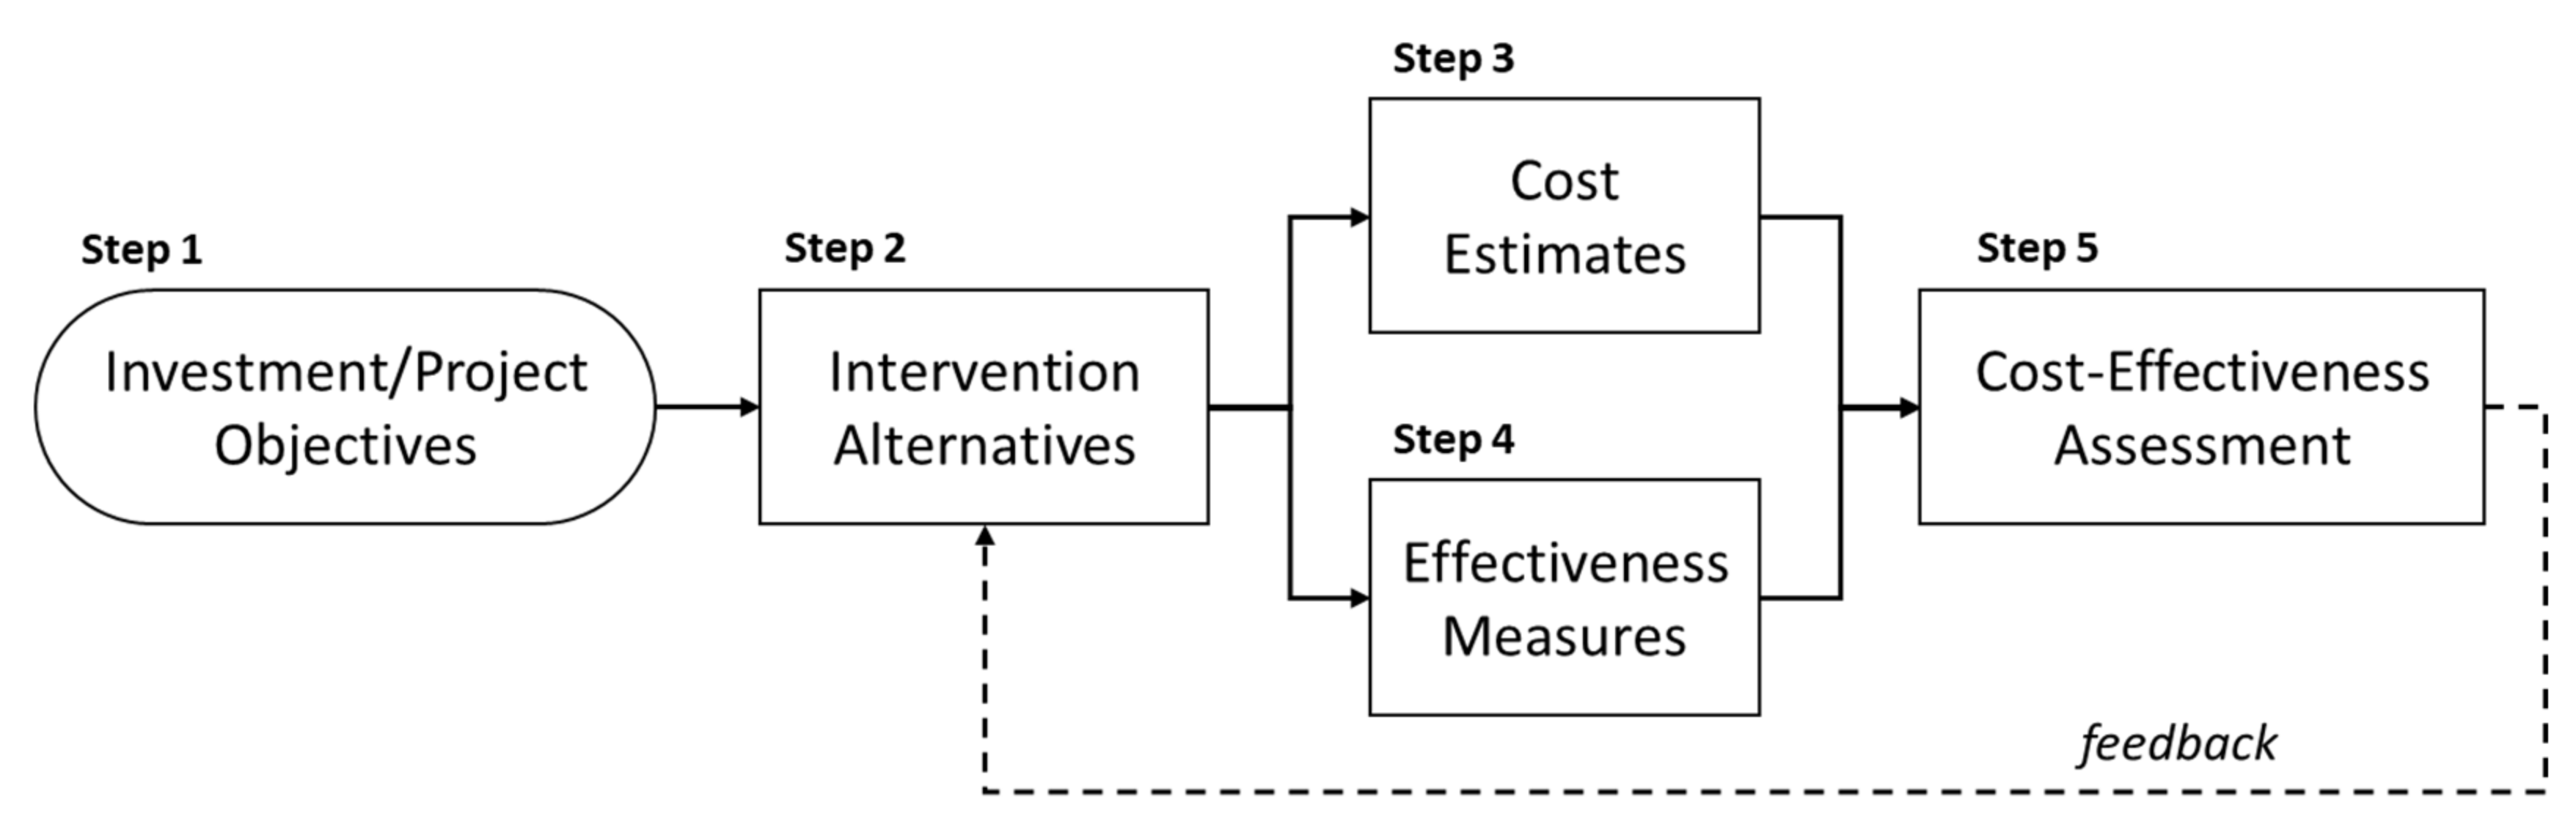
The process, as shown in the flow chart in
Figure 1, begins with the identification of the objectives of the project. This step consists of the clear definition of the principles and goals at the foundation of the investment.
Step 2 consists of the definition of the intervention alternatives, which is usually a subset of the project or additional design proposals. By intervention alternatives, one could mean both the individual design elements and a combination of design elements, i.e., what will henceforth be called a “scenario”.
Steps 3 and 4 are both built upon the alternative definition and are interlinked, since each scenario is defined by a set of interventions with their respective impact (effectiveness) and investment (cost). On the one hand, the cost estimates are the added-up costs of all the resources involved; since it is expressed in monetary value, only direct resources that have a well-defined monetary value are included, whereas less tangible costs are not usually considered. On the other hand, the effectiveness measures are assessed by empirical approaches, based on the collection of primary data and quantitative analyses, by modeling the implementation of the interventions.
Finally, the ratio between cost and effectiveness (Step 5), i.e., the Cost-Effectiveness Index (CEI), enables the comparison of the alternatives and their assessment with respect to investment strategies, using three main applications:
- (i)
Identify the alternative that, for a given effectiveness level, minimizes the actual value of costs, or, alternatively, maximizes the effectiveness level for a given cost;
- (ii)
Provide a basis for prioritizing investments (or decisions), by comparing the relative costs and effects of each option;
- (iii)
Identify if there is room for improvement by rethinking some aspects of the technical solutions.
The process between Step 2 and Step 5 can be further reiterated in view of identifying the best design solutions according to the overall investment/project objectives: for example, by improving design elements with the integration of innovative mobility solutions [
21] that could bring a greater marginal effectiveness compared to the costs of intervention.
Further details of the methodological approach are discussed in the following paragraphs.
3.1. Objectives Identification
A railway station is a complex environment where any structural intervention may affect many of the characteristics of the existing layout. Each design modification may have impacts that go beyond the element per se, setting off changes in several dimensions. A decision maker or a designer therefore may want to consider several strategic objectives, even conflicting ones, in order to keep the impacts of each design element under control in a multi-dimensional framework.
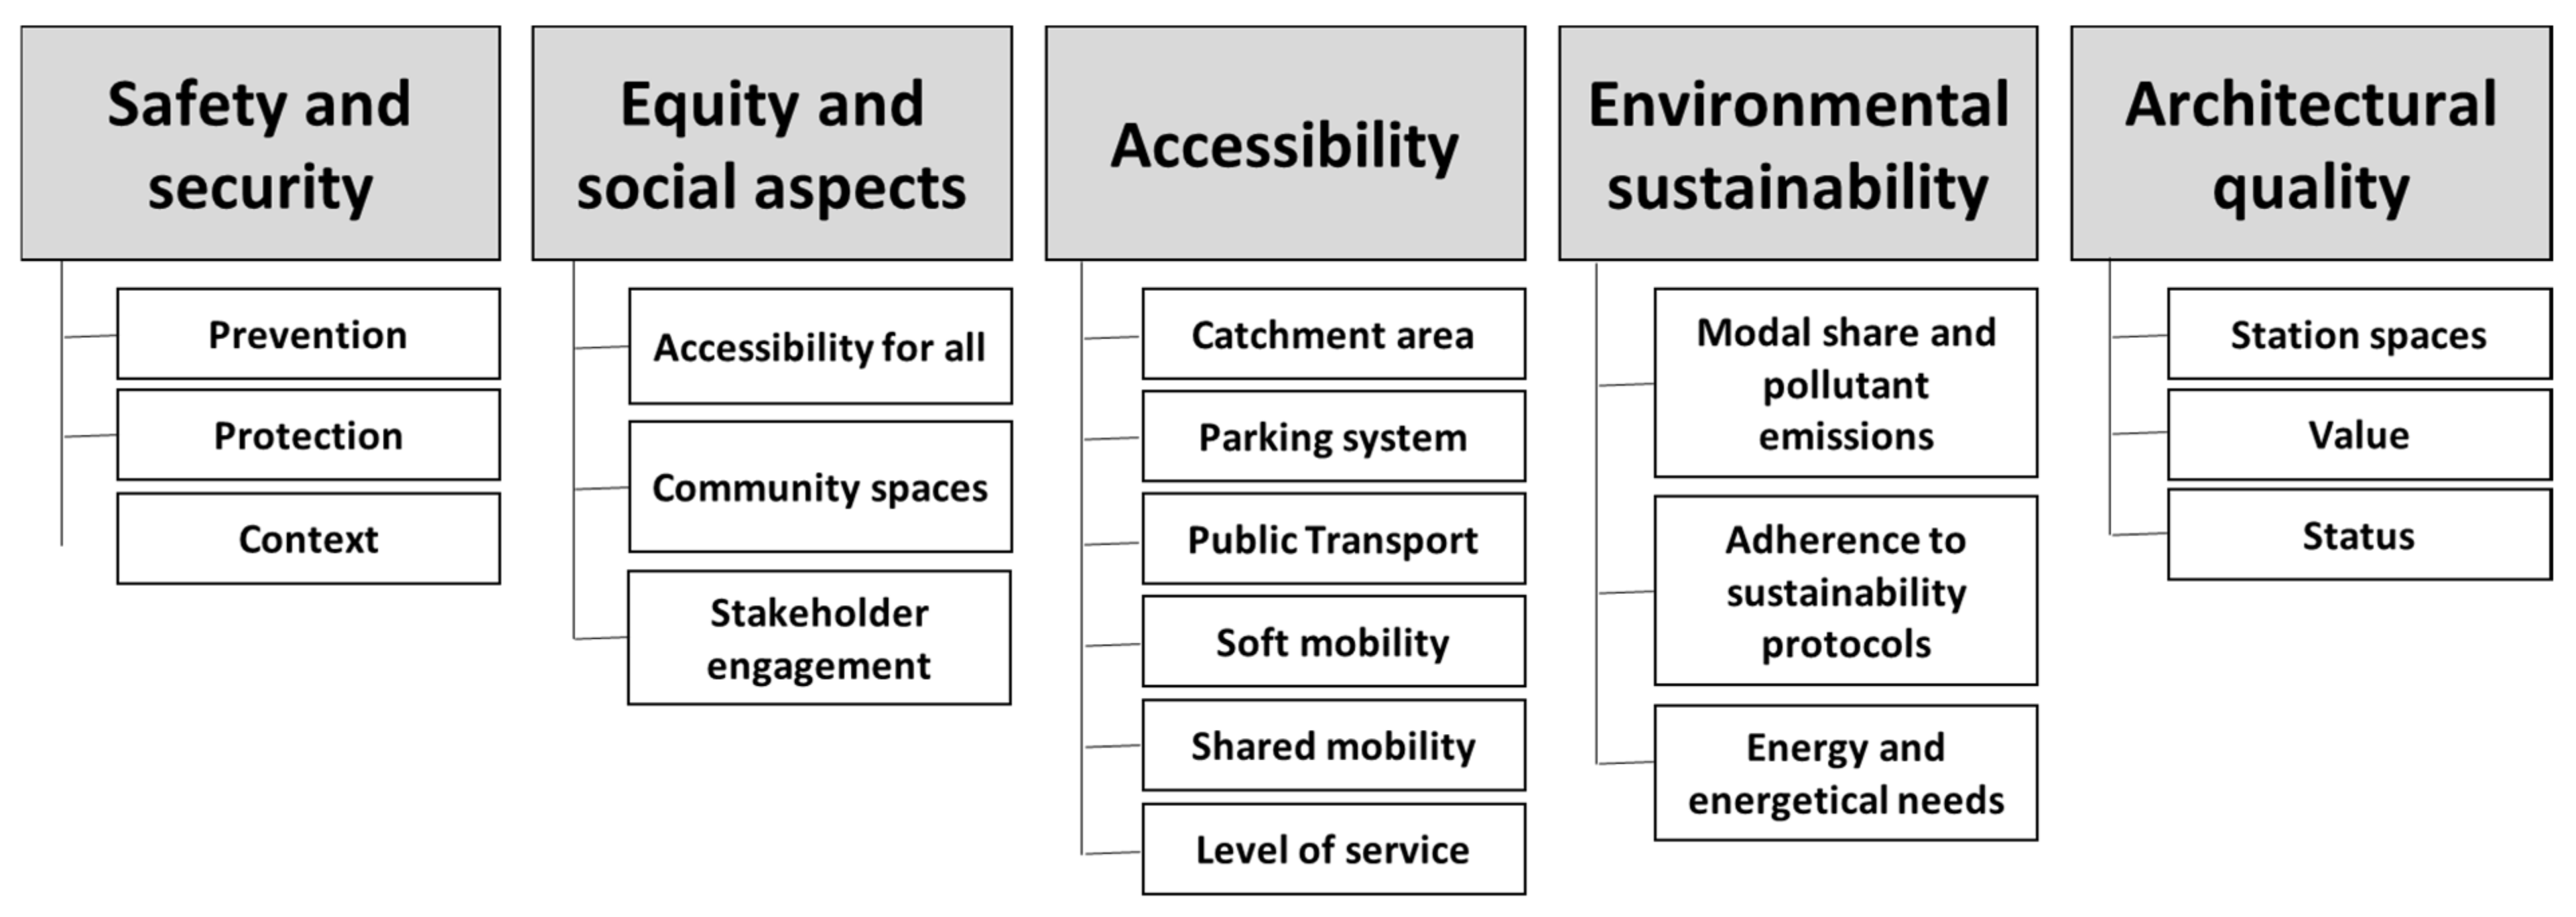
As part of this research, the following five objectives are chosen, and an indicator is associated with each of them: safety and security (SS); equity and social aspects (Eq); accessibility (Acc); environmental sustainability (ES); and architectural quality (AQ). The methodology can certainly be extended to further evaluation dimensions without generalization problems. As shown in
Figure 2, these macro-categories are further divided into sub-indicators for a better conceptualization of the wider impacts. Finally, the sub-indicators are broken down into key performance indicators (KPIs), that are used to determine the impact of each design element, i.e., measure of effectiveness, with respect to each assessing dimension.
3.2. Alternatives Definition
The definition of the intervention alternatives is performed by identifying which design elements contribute to the creation of a scenario. As can be seen in
Table 1, a design element can be considered in more than one alternative scenario.
At this stage, it is also advisable to identify the impacts that each design element can have on each indicator, so that in the subsequent phase of measuring effectiveness, it is certain that no effect is overlooked. In fact, given the multi-dimensional nature of the analysis, there is not a one-to-one correspondence between the design elements and the KPIs, and some effects may not be noticeable at first glance. This can be accomplished using the so-called element-factor evaluation matrix (see
Table 2). In this way, it is possible to define, on the one hand, the total costs of a scenario given by the sum of the several cost items that make up the scenario, and on the other hand, to determine the total impact, since the KPIs are activated in calculating the effectiveness of a scenario.
3.3. Cost Estimation
The proposed methodology can be applied to various phases of a single project, from the concept design level to a detailed or construction stage. A renovation project usually includes interventions that may encompass aesthetic upgrades (e.g., materials and lighting systems), structural elements (e.g., new overpasses and spaces), and operational improvements (e.g., repositioned public transportation stops).
Each project element is identified and associated with the correspondent economic cost given by the project estimate, usually produced by the design author. The cost of each design element is later summed up to get the overall alternative investment cost.
3.4. Effectiveness Measurement
As already stated, the KPIs are part of the effectiveness evaluation method for the scenarios. The method by which the KPIs are measured varies according to the nature of the factor, but four categories of methods can be identified: geographic information system (GIS) elaborations, to assess the wide area effects, such as extensions of the catchment areas; layout analyses, to evaluate station building and services, for example in terms of visibility and integration; surveys and behavioral models, to measure site-specific phenomena, such as an increase in perceived safety and security by travelers; and evaluation scales and charts, to define scoring systems for non-quantifiable elements, as for instance, the stakeholder engagement.
Since the focus of this research is to introduce the methodology in general terms, the method for measuring the effectiveness of each KPI is not explained in detail because this is beyond the scope of this paper. For the sake of brevity, only a few examples that are part of the technical specification [
22] drawn up by the national infrastructure manager, i.e., RFI, are reported.
For instance, the KPI “train waiting area”, relating to the safety and security indicator, is calculated by means of a function that grows logarithmically according to the width of the waiting platform. Once the actual width of the platform is calculated, it is normalized with respect to a minimum value (which expresses the minimum width required by law to comply with safety regulations) and a maximum value (beyond which a further increase in the width of the platform is not perceived as a further increase in safety, and therefore in the effectiveness of the KPI). In this way, a normalized measure of effectiveness is obtained that varies in a range between 0 (minimum effectiveness) and 1 (maximum effectiveness). Another illustrative method is the one used to measure the effectiveness of the KPI “cycling isochronal accessibility”, relating to the accessibility indicator: through GIS processing, the number of residents who are located, at most, 15 min by bicycle from the railway station is calculated, and then this value is normalized with respect to a maximum value that represents the overall potential of residents living within the municipal boundaries.
In principle it could be possible to identify an acceptable level of the indicator and compute the standardize value in the adopted range 0–1, but this should be done exogenously and is out of the scope of the CEA, which instead aims at comparing different solutions.
The KPIs considered for each sub-indicator are reported below, pointing out that the extension of this methodology to the case of more or different KPIs is entirely feasible. Note once again that, as the KPIs are obtained through different methods, the heterogenous outputs must be normalized.
3.4.1. Safety and Security
The design of a new station layout is carried out by law in compliance with a series of safety standards, thus the safety and security indicator here is aimed rather at assessing the travelers’ risk perception, i.e., how much the users feel protected in the railway station environment (see
Table 3). Several authors have shown that a gap exists between actual and perceived risk, with particular reference to safety-related and security-related issues [
23,
24]. The definition of perceived safety and security is centered around two typologies of factors: (i) external environmental factors (e.g., build environment elements, presence of control measures, and other conditions such as lighting, crowding, weather, etc.); and (ii) individual subjective factors (e.g., socio-economic characteristics, travel behaviors, and personal attitudes).
Since these factors are site-specific and not directly measurable, behavioral models [
25] can be estimated on the basis of data collected through Revealed Preference and Stated Preference (RP/SP) surveys, so that the effectiveness of a design element can be subsequently derived.
3.4.2. Equity and Social Aspects
The equity and social aspects indicator includes all the social impacts of the railway station environment with respect to the proposed design (see
Table 4). This category encompasses what is usually defined as social sustainability, namely: (i) the accessibility for all (i.e., the availability of the infrastructure for every potential user); (ii) the presence of collective spaces for a community purpose (e.g., local associations and coworking spaces); and (iii) the stakeholder engagement in the project development.
In this case, evaluation scales and charts can be used to assess the effectiveness value. These act like an inventory of possible elements that can be present or absent in the evaluated alternatives. In detail, several type of evaluation charts can be adopted:
Incremental—The value of each analyzed aspect is added (if verified), so the final value is the sum of the single elements;
Exclusive—The presence of a given element mutually excludes the others;
Conditioned incremental—The analyzed aspects add their value (if verified) only if the previous aspects are also verified;
Dummy—A condition that can be verified or not, so the value can be 0 or 1;
Mixed—Both the previous typologies in a single factor.
The resulting measures of the effectiveness are then linearly normalized in the 0–1 range.
3.4.3. Accessibility
The accessibility indicator includes all the KPIs linked to (see
Table 5): (i) the catchment area by means of different transportation modes; (ii) the parking provision; (iii) the public transportation systems; (iv) the soft mobility systems; (v) the shared mobility services; and (vi) the building station dimensioning.
The assessment of the KPIs is performed through GIS and Computer-Aided Design (CAD) software, and other quantitative planning/design tools. Since this set of KPIs is based on quantitative values, the limit value is defined to normalize each analysis output. Conceptually, this value represents the best possible scenario, so it acts as the upper bound to limit the outputs to the range of 0–1, and it is calculated specifically for each KPI. There are four typologies of limit values:
Catchment area—the number of residents and working population in the isochronal catchment are compared to a hypothetical catchment;
Parking/services capacity—the assessed value is compared to the theoretical requirement calculated from the forecasted transportation demand and the users’ travel behavior;
Parking/services location—the designed location is compared with an optimal distance that is 360 m (5 min by foot) for the long-term services and 144 m (2 min by foot) for the short-term services;
Level of service (LoS)—the limit value is equivalent to Level of Service C [
26,
27].
3.4.4. Environmental Sustainability
The environmental sustainability KPIs are used to assess the environmental impacts of the railway station layout (see
Table 6). Note that the present CEA methodology can be performed in different design phases. Depending on the level of detail of the design (concept design, final project), not all the KPIs can be included, since some of them (e.g., the “energy and energetical needs” sub-indicator) require the definition of materials and technical building solutions. Like the accessibility macro-indicator, the evaluation of the factors is based on a quantitative analysis, only with the exception of the “adherence to LEED (Leadership in Energy and Environmental Design)/Envision protocols” sub-indicator, which is a dummy variable.
3.4.5. Architectural Quality
The architectural quality indicator encompasses the station layout intended as the architectural object, analyzing the space layout and the functions (see
Table 7). The first set of KPIs are estimated using the Space Syntax approach [
28] to assess a quantitative value of the visibility and integration of the circulation areas. The rest of the KPIs are focused on the surface dedicated to the station’s services and to the presence of elevators.
As mentioned for the “environmental sustainability” macro-indicator, not all the KPIs can be assessed in the concept design stage; hence, the hedonic value of the building and the conservation status may not be included.
3.5. Cost-Effectiveness Assessment
Once the cost estimates and effectiveness measures have been obtained, the calculation of the Cost-Effectiveness Index (
CEI) is carried out in the last step of the proposed methodology. In the literature, this index is referred to as the simple ratio between cost and effectiveness of the intervention alternative:
Note that in this study, the intervention alternatives are represented by different project scenarios; therefore, the cost of the alternatives is given by the sum of the hypothetical costs of the design elements that make up a scenario. Similarly, the effectiveness of a scenario is given by the contribution that the individual design elements make, but it should also be noted that the effectiveness refers to heterogeneous indicators; hence, a multi-level weighting system is introduced. Furthermore, the effectiveness of a scenario (
TO BE) is compared with the current state (
AS IS) and therefore, expressed as a difference. Therefore, by indicating with
the project scenario, with
the
i-th design element of the scenario, and with
the
j-th indicator considered in the analysis, it is possible to calculate the
CEI of the scenario
as:
where
is the local weight of the indicator
. Note that the indicators and the underlaying
KPIs hierarchy can be weighted separately to orient the analysis outcomes toward strategic planning decisions or to encompass site-specific characteristics by following the general objective of the intervention. The effectiveness of an indicator
in a scenario
is therefore given by:
where
is the local weight of the
l-th
KPI belonging to sub-indicator
, and
is the local weight of the
k-th sub-indicator belonging to indicator
.
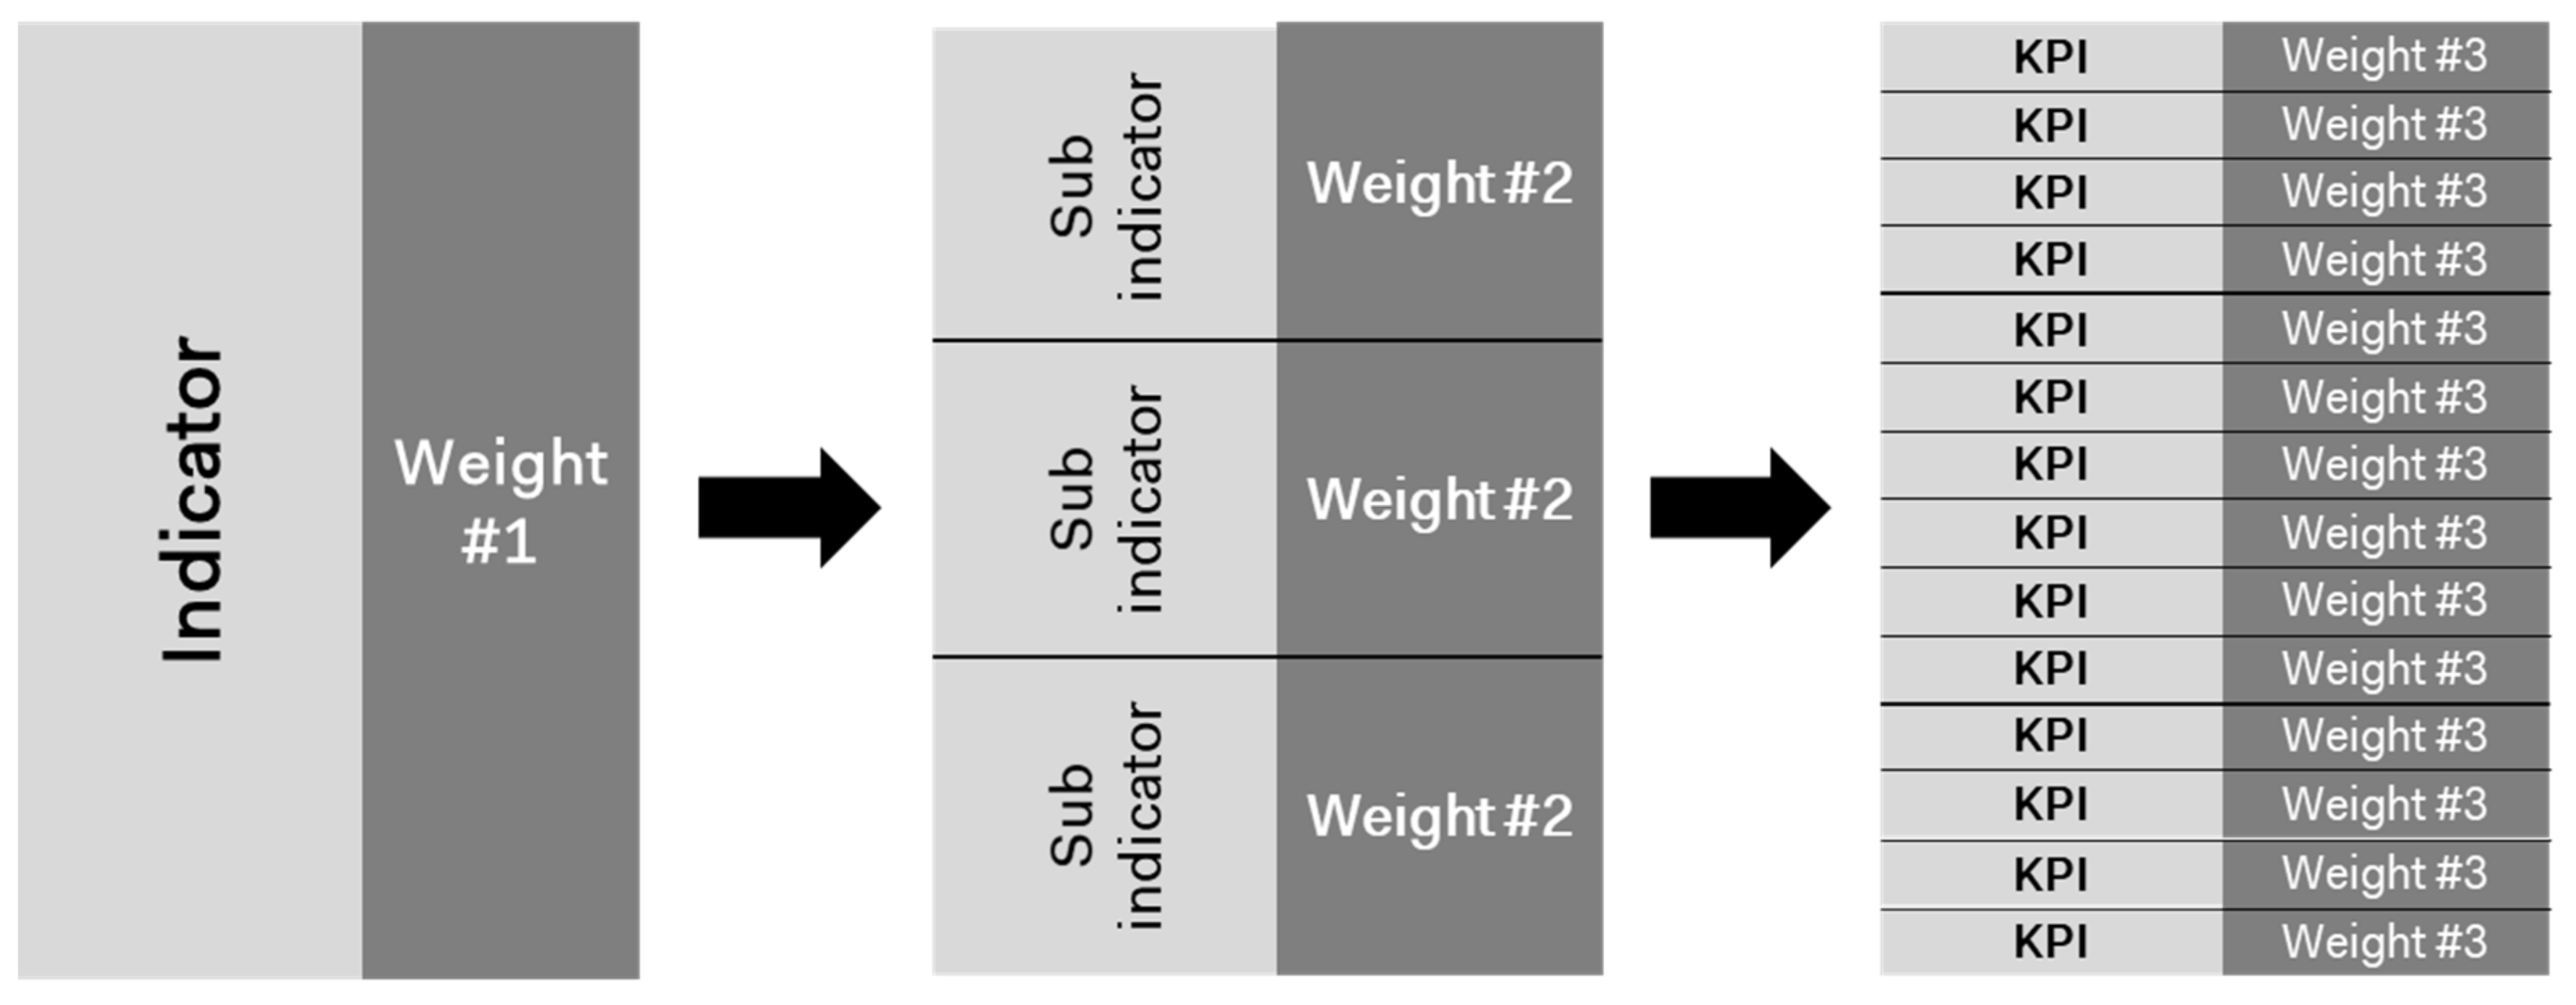
Generally speaking, on the one hand, the weighting system allows the rewarding of the macro-decision, e.g., the sustainability over the accessibility, to act as a key strategic interpretative base in line with the general goals of the interventions. On the other hand, the weighting system can be applied to the KPIs’ level to calibrate the analysis, also including users’ desiderata gathered through surveys or the municipality’s stated planning goals (see
Figure 3).
4. Application
The proposed methodology is applied to the case of a railway station in a medium-sized Italian city. The station is located at the border of the historical city center, with entrance only on one side, and characterized by poorly accessible parking facilities, unsafe pedestrian outdoor pathways, and services to travelers (e.g., ticket office, cafeteria, newspaper shops, etc.) concentrated in one main hall. The revamping project of both the indoor and outdoor station spaces, financed both by the infrastructure manager and the municipality, aims at reconnecting the urban fabric around the station by creating a multimodal hub and a pedestrian public space in front of the building. Many of the proposed interventions are based on design standards of modern railway stations, such as platform renovation and PRM (i.e., Passengers with Reduced Mobility) accessibility strategies. In order to work effectively from the accessibility and cost perspectives, several cost-impacting elements are also considered, such as a new overpass and a secondary station access with additional parking facilities and public system stops. To further test the methodology, a scenario with a city-wide infrastructure element is introduced, with the addition of a Bus Rapid Transit (BRT) line to the station multimodal system.
The proposed design elements can be summed up in three main categories (see
Figure 4): (i) building renovation interventions, such as the overpass and new passenger facilities; (ii) multimodal hub interventions, such as the parking facilities and the public transportation improvements; (iii) public space interventions, such as the pedestrianization of the square.
4.1. Methodology Application
The aforementioned design elements are heterogenous and their effects are not limited to an increase in accessibility or in architectural quality, but they encompass a wide set of aspects, which also include an improvement in safety perceived by travelers and greater social and environmental sustainability. These include interventions under the charge of the station manager (i.e., those related to the building and the indoor spaces) and of the public administration (i.e., those related to the outdoor spaces).
Since the overall investment is shared between the two actors, several scenarios have been identified in order to assess whether joint interventions on indoor and outdoor spaces could be more convenient than separate actions completed by the infrastructure manager and the public administration. Accordingly, the following scenarios have been considered:
- 1.
TO BE interventions (related to both station manager and public administration);
- 2.
Only station (infrastructure) manager interventions;
- 3.
Only Public (administration) interventions;
Moreover, in order to understand what part of the renovation scheme drives the effectiveness of the project, the additional following scenarios have been included in the overall assessment:
- 4.
No overpass, no secondary access (i.e., the additional building is not considered, and the platforms are connected only through the existing underpass);
- 5.
TO BE + BRT (the TO BE scenario, with the additional city-wide infrastructure to improve the access to the station by means of a Bus Rapid Transit (BRT) urban line).
Table 8 shows the design elements considered in the scenarios and the overall costs for each scenario.
4.2. Results
The disaggregated measures of effectiveness for each KPI are not reported because they are outside the scope of this application, which rather intends to show the usability of the proposed methodological framework, focusing on the possible outcomes and policy implications.
In line with
Section 3.5, the Cost-Effectiveness Index was calculated for each scenario. To this aim, it was necessary to calculate the overall cost of each intervention alternative and the measure of effectiveness, in addition to the simulated scenarios, as well as of the current “AS IS” scenario. In fact, the effectiveness is expressed as a difference compared to the current state in such a way as to consider the magnitude of the improvement (see Equation (2)). In the proposed application, the weights have been defined by the national infrastructure manager, i.e., RFI, in line with the company’s objectives set out in the strategic plan [
2]. This method of defining the weights that contemplates the vision of a single subject can possibly be extended to the considerations of other stakeholders by resorting to well-established techniques, such as the Analytic Hierarchy Process (AHP), which involve the mathematical synthesis of numerous judgements (obtained through pair-wise comparisons) in order to estimate the relative magnitudes of factors.
Table 9 summarizes the scenario results aggregated by indicator and shows the Cost-Effectiveness Index of the investment alternatives. The measures of effectiveness are normalized in a range from 0 to 100, so the improvements in each analysis dimension compared to the current scenario can immediate be understood. The results are shown first through a horizontal analysis of the different scenarios, and subsequently through a vertical comparison between the scenarios.
5. Discussion
According to the simulations obtained mainly through GIS processing, targeted surveys, rating scales, and layout analysis software, the “AS IS” scenario is characterized by an overall effectiveness of 33.1. In detail, this scenario holds all the indicators in the range of 30–40 points, less than the much smaller indicator of equity and social aspects, which is equal to only 6.3. It is important to remember that all the KPIs that make up an indicator are also normalized between 0 and 1 through a lower bound (minimum effectiveness) and upper bound (maximum effectiveness) that represent the limit values that the KPI can assume. In this sense, since maximum effectiveness is the best achievable value that can be had for these KPIs, an overall effectiveness value of the “AS IS” scenario equal to 33.1 means that the current status of the station is very far from the strategic targets set by the infrastructure manager and by travelers’ desiderata. The “TO BE” scenario, which includes all the design elements defined in the station concept, has an overall effectiveness value of 71.3. With these interventions, therefore, more than a doubling of the overall effectiveness assigned to the railway station is obtained. The most significant increases certainly occur in the context of safety and security, environmental sustainability and equity (all with a score over 70 points), while the lowest increase occurs precisely for the indicator that at present was the highest of all, i.e., accessibility, which stands at 59.6 points. The estimated cost for the construction of the entire project is approximately EUR 20.1 million.
These results, therefore, inform decision makers that there is still room for improvement that can maybe only be achieved by rethinking some design elements (by increasing their quantity, quality, or level of service offered) or by taking into consideration further elements (which were initially neglected because they were thought to have little impact). The multi-dimensional CEA can therefore be seen not only as a method for assessing the quality of the designed scenarios with respect to their costs, but also as a tool to improve and direct the design towards the achievement of the key objectives previously set. It should be noted that the analysis carried out refers to an ex ante evaluation of the revamping project of the railway station, and therefore, we are in a preliminary design phase in which there is still time to make even structural changes to the project.
A further advantageous aspect to consider is that, unlike what could be obtained with more rigorous techniques such as the Cost-Benefit Analysis, the CEA has made it possible to carry out assessments in a shorter time, thus allowing to repeat the steps of the methodology several times in order to fully review the project up to the design elements and make improvements incrementally. The multi-dimensional CEA, therefore, allowed a compromise between scientific rigor and level of approximation of the analysis, resulting in a lean tool that guarantees processing times that are consistent with an ex ante assessment of the project. The “Only Railway Manager” and “Only Public Administration” interventions scenarios, if taken individually produce an overall increase in effectiveness that is much less than in the “TO BE” scenario. In particular, the difference in effectiveness produced by the interventions charged to the station manager is 26.0 points against an investment of EUR 14.6 million, while that produced by the interventions of the municipality is 11.1 points against an expenditure of EUR 5.4 million. However, the simulation of these two scenarios highlights an important result: the effects of the single interventions are not linear. In fact, the sum of the delta effectiveness of the two scenarios is not equal to the delta effectiveness reached with the “TO BE” scenario. This shows that together, the two public parties can produce better results. Indeed, it is likely to indicate that some design elements have an amplified impact when made in the presence of certain others. An example could be the integration between the cycle paths, provided by the municipality, and the bicycle parking station, provided by the station manager inside the station building. The presence of both design elements creates synergy, while the absence of one makes the presence of the other less impactful.
Regarding the results of the last two scenarios, in which the realization of one or more design elements is given up with respect to the complete concept project, it is interesting to note that the overpass and the additional access are the discriminating factors for the increase in accessibility, and that they have a minimal impact on the environmental sustainability of the project. Furthermore, the overpass is also fundamental for improving the architectural quality, while the redevelopment of the secondary front is undoubtedly necessary for an increase in the safety and security perceived by travelers (this is likely thanks to the installation of a new lighting system, an improvement in pedestrian road crossings, the additional parking lots, and the video surveillance system). On the other hand, the “TO BE + BRT” scenario, which contributes an urban scale infrastructure into the investment proposal, slightly improves the overall effectiveness, but with a non-competitive cost.
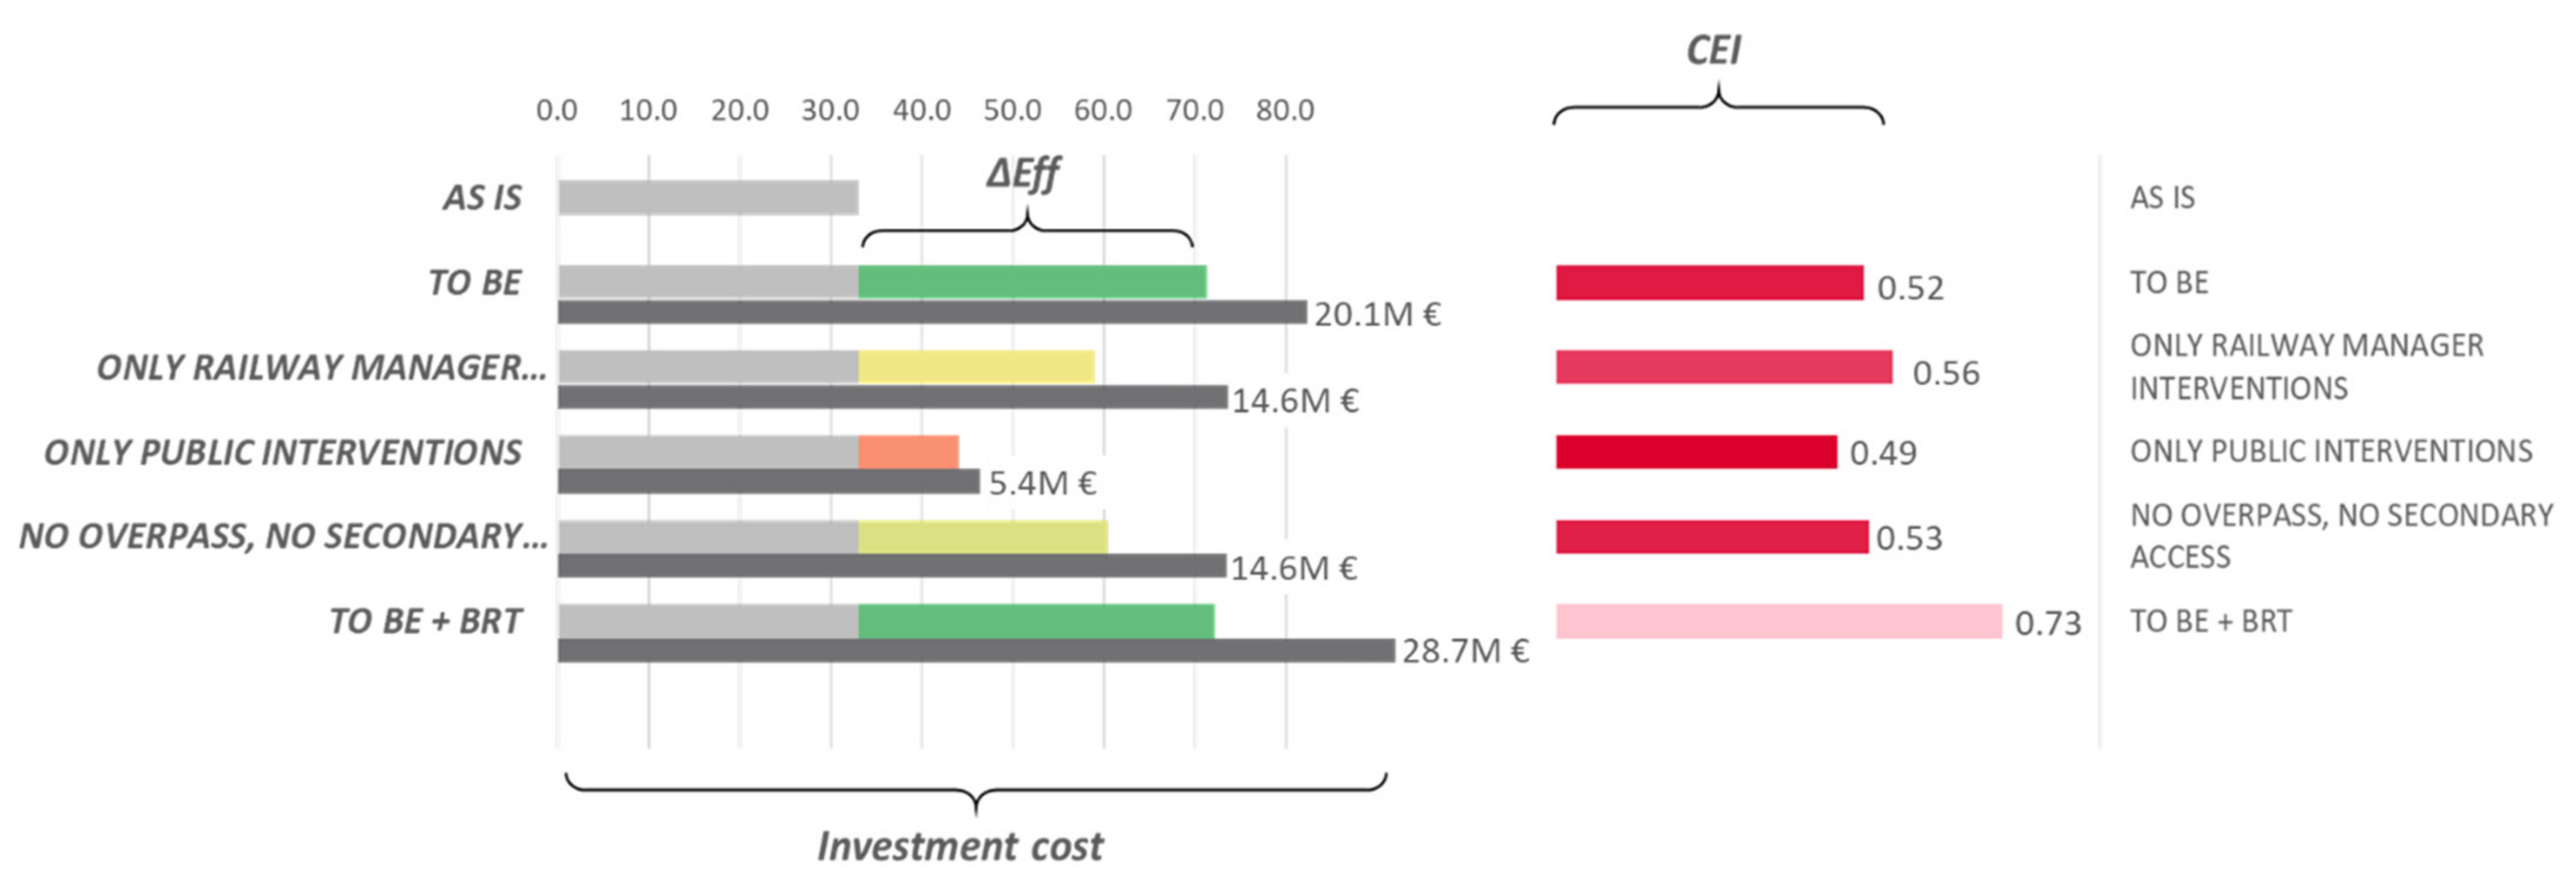
In addition, the comparison between the different intervention alternatives allows for the evaluation of the preferable scenarios in terms of cost-effectiveness. The chart in
Figure 5 graphically shows the relationship between the delta effectiveness, the cost, and the CEI for the evaluated alternatives. The scenario “Only Public Intervention” has the lowest cost-effectiveness ratio (0.49), followed by the scenario “TO BE” (0.52). Except for the “TO BE + BRT” scenario, the complete project scenario shows the highest increase in effectiveness (+38.3 points) compared to the minimal scenario of investments made by the municipality (+11.1 points); however, there is also a huge difference in terms of investment cost for the realization of the two scenarios, equal to 20.1 points and EUR 5.4 million, respectively. A compromise solution could be represented by the scenarios “No overpass, No secondary Access” and “Only Railway Manager”, with the same investment of EUR 14.6 million; the improvement is slightly higher in the former, with an effectiveness of 27.4 points (with a CEI equal to 0.53), compared to the latter, which has an effectiveness increase of 26.0.
Finally, the Cost-Effectiveness Index, as defined in this research, also makes it possible to estimate, depending on the investment alternative, the monetary cost to be incurred to increase the effectiveness of a unit. For example, it has been shown that the CEI associated with the “TO BE” scenario of the case study is equal to 0.52, which therefore means that in this context, approximately EUR 520 thousand are spent for each unit of increased effectiveness.
6. Conclusions
The application of the proposed methodological framework has shown that a multi-dimensional Cost-Effectiveness Analysis is a valid tool, available to designers and infrastructure managers, for a correct prioritization of investments, even in the presence of multiple strategic objectives. In fact, when budget constraints are set, it is possible to assess which intervention alternatives maximize the increase in effectiveness, whereas when the achievement of a certain level of effectiveness is set as a target (which can also be interpreted as a certain quality of the project), a weighted CEA allows the evaluation of interventions that reach this target at the minimum cost.
The application to the case study highlighted some peculiarities of a flexible tool such as the one proposed. Primarily, there is the observation that thanks to the effectiveness of the measurement methods used in the methodology, and exogenous to it, it is also possible to consider the non-linear effects and possible synergies that can arise when certain design elements are part of the same intervention scenario. Secondly, it should be noted that some design elements have no impact on some indicators and/or a relevant impact on others. Therefore, such an analytical approach can warn decision makers and analysts about which sacrifices they face, from the point of view of targets to be reached, if one rather than another design element is excluded from the project.
Regarding the risks and potential of such an analysis tool, one of the main drawbacks of the multi-dimensional Cost-Effectiveness Analysis lies in the fact that, as in all multi-criteria tools, it is necessary to derive the weights of each dimension, i.e., the importance associated with each of them, in order to homogenize the units of measurement. However, if, as in this study, the weights of the indicators, sub-indicators, and underlying KPIs are calibrated a priori, i.e., they are defined before carrying out the effectiveness measures and proceeding with the calculation of the CEI, then it is possible to legitimately orient the results of the analysis towards strategic planning decisions, without incurring a subjective and biased derivation of the weights aimed at privileging one investment alternative rather than another. On the other hand, among the advantages is the fact that this economic evaluation technique is often preferred to others because it can provide general information on investment costs and the impacts that different policies, layouts, and technological solutions would have in a simple and effective way. Moreover, the CEA, compared to other economic appraisal techniques, requires a much lower commitment in terms of time, resources, and monetary costs, since it is more immediate to implement. All these create the conditions for the Cost-Effectiveness Analysis to be a very powerful tool for informing decision makers and clients about the available intervention options and the best design solutions, easily helping to create the basis for a more transparent debate on resource allocation priorities.
This methodology has recently been adopted by the national infrastructure manager for the analysis and review of the investments for the revamping of five railway stations. In fact, for the financing of these asset renewal interventions, a CEA is required by the guidelines for the assessment of investments in the public works of the Italian Ministry of Infrastructure and Transport. In all these cases, the multidimensional CEA has proved to be a versatile tool for the critical examination of investments in progress and for their prioritization, also thanks to the debate and co-planning that it has been able to trigger with other local public bodies (such as municipalities, regions, port authorities, universities, local public transportation operators, etc.) and private entities (such as the financiers of third-party services for shared mobility, micro-mobility, electric vehicle charging infrastructures, etc.).
Among the further developments that the authors of this work intend to pursue in future research, there is certainly the desire, on the one hand, to improve the set of Key Porformance Indicators on which the analysis is based and, on the other hand, to verify if it is possible to compare the results of different railway stations projects with similar scenarios, applied in analogous contexts, but from a different geographical and socio-economical point of view, as well as characterized by different basic conditions, such as a dissimilar initial score related to the current scenario “AS IS”. The comparison would certainly be legitimate, thanks to the procedures introduced in the methodology that normalize the effectiveness estimates of the KPIs with respect to limit values, which report the effectiveness measures of all the indicators on a scale of scores between 0 and 100. However, as described in the methodological approach, the limit values depend on the case study considered; therefore, it is necessary to verify how much the comparison may be affected by this bias. Among the potential research perspectives, it is worth considering the possibility of integrating the multi-dimensional Cost-Effectiveness Analysis with techniques such as the Analytic Hierarchy Process for the definition of a system of weights in the presence of several decision-makers that conflict with each other. Finally, a further aspect to be explored is the possibility of reiterating the steps of this methodological framework in order to identify other design elements that might bring a greater marginal effectiveness, compared to the costs of intervention.


 ,
, 


