Article

Individual Momentary Experiences of Neighborhood Public Spaces: Results of a Virtual Environment Based Stated Preference Experiment

by
Yuwen Zhao
*,
Pauline E. W. van den Berg
,
Ioulia V. Ossokina
and
Theo A. Arentze
Department of the Built Environment, Eindhoven University of Technology, 5612 AZ Eindhoven, The Netherlands
*
Author to whom correspondence should be addressed.
Sustainability 2022, 14(9), 4938; https://0-doi-org.brum.beds.ac.uk/10.3390/su14094938
Submission received: 24 February 2022 / Revised: 30 March 2022 / Accepted: 17 April 2022 / Published: 20 April 2022

Abstract

:
Although it has become increasingly recognized that the spatial design of public space plays an important role in the perceived quality of the built environment by users, there is still little known about the influences of specific attributes on individuals’ experiences. Therefore, this study aims at (1) identifying the factors underlying momentary experiences in public space given both cognitive (satisfaction) and affective (emotion) responses and (2) understanding the experiences as a function of green and design attributes and analyzing the heterogeneity in preferences. To achieve the research goals, this study innovatively introduced an online video-based stated preference experiment. A national sample of 316 individuals from the Netherlands were invited to complete the experiment. The results of a factor analysis indicate that the momentary experiences of the environments presented can be reduced to a single preference dimension capturing the cognitive as well as affective elements of experiences. The results of a latent class regression analysis furthermore show that there is substantial heterogeneity on how attributes are experienced. Three classes emerge which differ in terms of satisfaction with life and satisfaction with availability of green in the current living environment on dwelling, neighborhood, and city level. Presence of trees, vertical green on façades, and grass surfaces were found to be most important for individuals’ experiences generally. The paper provides a new understanding of how spatial attributes in neighborhood public spaces can influence individuals’ momentary experiences. For cities pursuing both greenification and densification, this study offers quantitative evidence to support the selection of design attributes of neighborhood public spaces which can evoke positive experiences.

1. Introduction

The Charter of Public Space defines public spaces as ‘all places publicly owned or of public use, accessible and enjoyable by all for free and without a profit motive’ [1]. In Europe, more than 75% of the population lives in urban areas. Public space covers sometimes over 50% of the total area of our cities [2]. With the increasing population migration to cities in the Netherlands and worldwide, both densification of real estate and maintenance of green public space are becoming increasingly important [3,4]. Public space plays a key role in sustainable city development. Inadequate, poorly designed, or privatized public spaces can lead to increasingly segregated, unattractive, and sometimes unsafe cities [5]. At the neighborhood level, the availability of green public spaces affects the environmental quality [6], helps in stress restoration [7,8], enhances the feeling of social safety [1,9], creates a sense of community [10], and potentially contributes to people’s health [11]. Green in public spaces can also increase property values [12], provide a play space for children’s physical activity and support their mental development [11].
The study of individuals’ preferences regarding spatial design attributes of public space has a long history. In several studies, individuals’ valuations of a wide range of attributes have been considered. A variety of green and design attributes have been found to correlate with people’s preferences, such as the amount of open space (dimensions) [13,14], surrounding building stories [15,16], and natural elements such as grass surface [9,17,18], water [19], and trees [20,21]. Studies show that natural characteristics, among all design attributes, are the most valued by the users of urban public spaces [18,22]. Traditionally, urban parks which contain predominantly green elements have been widely investigated in terms of individuals’ preferences for green attributes (e.g., [3,22,23,24]). However, as for small-scaled neighborhood public space, empirical research on individuals’ preferences regarding various green attributes is still limited [15,25,26]. The small-scale neighborhood green public spaces are the nearest type of public space individuals interact with on a daily basis, compared to city parks and other larger-scale urban public spaces. Further, difficulties associated with the simultaneous pursuits of dwelling density and ensuring greening stand out even more in small-scale neighborhood public spaces. Given the above context, this paper zooms into the small-scale neighborhood public space as the research target.
In relation to individuals’ preferences, it is recognized that a successfully designed public space can contribute to individuals’ positive experiences and enhance their subjective well-being [27,28]. This potential impact of design choices on individuals’ momentary experiences in built environments has received increasing attention [29]. Psychological theories emphasize that momentary experiences encompass both cognitive (satisfaction) and affective (emotion) components. The cognitive component is related to an individual’s satisfaction with neighborhood environment regarding the various services an environment can provide, such as physical activity [13,30], recreation [11,31], stress restoration [32], aesthetical attractiveness [33,34], and climate regulation [9]. Although studies indicate that inclusiveness (the range of functions a public space can support) is an important indicator of public space quality [1], few studies have investigated public space satisfaction while considering multiple aspects of use simultaneously (e.g., [26]). Even less has been undertaken regarding how green attributes influence individuals’ satisfaction with the various services neighborhood public spaces can provide. The affective component of momentary experience has been studied by categorizing and identifying individuals’ positive and negative emotions. Happiness [28,35], comfort [36,37], annoyance [38,39], and sense of security [40,41] are four dimensions widely used in the literature to describe emotions an individual experiences when interacting with urban environments [28,42]. Only a few studies have focused on the impact of design attributes of green in public spaces on affective experiences (e.g., [41]). To achieve green public spaces that evoke positive experiences, it is important to understand how green and design attributes of public spaces influence peoples’ momentary experiences. Moreover, given the context of urban densification, whether the size of open space is adequate becomes an important concern. In addition, as several studies have shown, socio-demographic variables are also important determinants of peoples’ experience in urban environments [43,44]. However, heterogeneity among individuals regarding their green public spaces preferences has not received much attention [13]. Therefore, the first research question is proposed: Q1. How do the green and design attributes influence individuals’ momentary experiences in neighborhood public spaces? This question consists of a series of sub-questions: (1.1) Does the size of the neighborhood’s small-scale green spaces matter the most for individual experiences, compared with other design and green elements? (1.2) Can the presence of other design and green attributes make up for the inadequacy of public space size to enhance individuals’ experiences? (1.3) Can the space-saving approach, vertical greening, evoke positive experiences to the same degree as traditional green interventions (e.g., grass, tree)? Finally, (1.4) does heterogeneity exist in how attributes are experienced by individuals?
Regarding methods to investigate people’s momentary experience, revealed preference is the dominant approach. The Experience Sampling Method, in which respondents’ momentary experiences (satisfaction and emotions) are self-reported during daily use of public spaces is a widely used technique in this approach (e.g., [45]). However, a well-known drawback of revealed preference approaches is that spatial attributes in actual built environments tend to be strongly correlated with each other, which makes it difficult to disentangle the separate effects of spatial attributes on people’s experiences. The conjoint analysis (stated preference or stated choice) approach solves this problem. The traditional approach of conjoint experiments, where the alternatives are presented in text, obviously, is problematic for this measurement purpose as textual descriptions do not allow respondents to experience the environments. To circumvent this problem, recently, video-based stated preference experiments are increasingly being used in built environment studies (e.g., [46,47,48,49,50]). Instead of text alternatives, videos can simulate being situated and moving in fully manipulated 3D virtual environments by watching first-person animations. This offers the opportunities to measure individual momentary experiences and analyze the separate effects of design attributes on these experiences. In this paper, we use this technique to measure how public spaces are experienced as a function of design attributes.
As mentioned above, momentary experiences have a cognitive and an affective component. Previous studies have treated these two components as two factors or investigated them as two separate topics [32,42,51]. These lead to the second research question: Q2. Are the cognitive and affective components aligned and can the momentary experience of public spaces be reduced to a single preference dimension? To address this question, we use scales related to both cognitive (satisfaction) and affective (emotions) components. To derive a measure of momentary experience we will first use factor analysis on the response scales to determine whether the experience is a single-dimensional concept or not.
In sum, the aims of this study are twofold: (1) to identify underlying factors of momentary experiences in public spaces with both a cognitive (satisfaction with public space services) and an affective component (emotions) and (2) to identify the effects of design attributes on momentary experience and heterogeneity in experiences. To achieve these aims, this paper integrates a stated preference experiment with video-based virtual environments. In the experiment, respondents are asked to report both their satisfaction and emotions after exploring each virtual environment on relevant dimensions. Factor analysis is used to identify the dimensions of reported experiences and a latent class regression model is used to analyze to what extent the effects of the attributes vary between different groups of respondents. We take heterogeneity into account by a latent class analysis and using a national sample that is representative for the broad population. In total, 316 respondents from medium to large-sized cities in the Netherlands participated in the experiment.
The remainder of this paper is organized into five sections. Section 2 describes the theoretical framework by reviewing the existing literature on green and design attributes of public spaces, and measurement of satisfaction and emotion to analyze individuals’ preferences. This is followed by explaining the SP experiment design and data collection in Section 3. Section 4 describes the results. Then, Section 5 discusses the results and compares them with related built environment research. Section 6 finally summarizes conclusions, limitations, and recommends possible research directions.

2. Theoretical Framework

2.1. Spatial Attributes of Green Public Space

A large and growing body of literature has investigated users’ preferences on neighborhood public space design. This literature goes back to the seminal studies from the 1970–80s such as Gehl’s field research based on marking, counting, and tracking of users in public spaces [52]. More recent approaches have performed quantitative analyses of preferences for green in public spaces using statistical analysis and experiments in which specific spatial elements are manipulated [3,30]. These studies have shown statistically significant relationships between relevant green and design elements and users’ perceived attractiveness of public spaces. To identify relevant attributes of neighborhood small-scale open spaces for this study, we considered literature in a broad area of public spaces including parks, neighborhood public spaces and streets. The green and design attributes that are considered in this study are sevenfold.
(i) The size of the open space, taken as the total area of the block-shaped open space, is a widely discussed public space design factor [52]. However, different studies show varying results regarding the valuation people have for this attribute. Some studies have found that larger public open spaces are more likely to support and invite people to undertake walking or psychological restoration activities [17,30]. Others indicated that size does not influence visitors’ experience in the context of a small green public space [53]. As green public space in dense urban environments is a scarce resource, more insight into the influence of size on people’s public space valuation is needed.
Apart from size, (ii) the surface materialization of open spaces can influence people’s evaluation of the attractiveness of public spaces as well [17,18,54]. Several studies have found that greening as a general concept, which includes grass cover or other vegetation, has an important influence on people’s valuation of open spaces [41,55]. Only a few studies considered the influence of the specific materialization of the surfaces. For example, a study undertaken by Nordh [17] indicated that the percentage of surface covered by grass positively relates to people’s stress restoration. Todorova et al. [56] found that among photomontage simulations of street-side greenery below trees, the grass is more favored than the soil ground. (iii) Grass along the street also appeared to be important for perceived aesthetics and enjoyment in the neighborhood [57].
(iv) The presence of water, such as a pond or fountain, can evoke a positive feeling of relief [17]. Incorporating water elements has become an increasingly important consideration in public space design in the context of rain flood management and microclimate regulation [4]. Water elements can also contribute to aesthetics and enhance the public space attractiveness [20,58].
(v) Trees are also well-known to be positively valued [52,59]. Empirical studies support the idea that trees are one of the most significant elements positively related to people’s public space choices [17,18]. Kasraian et al. [21] found that trees are highly preferred and pedestrians are willing to trade sidewalk width for them. Furthermore, trees that conceal views of the urban scene are found to elicit greater stress restoration [9].
(vi) Vertical greening or green facades of buildings is increasingly used to reduce the heat island effects of buildings and to provide an aesthetic appearance of green. The effect on energy efficiency has been widely investigated [21,60,61]. Vertical greening offers an alternative greenery solution in dense urban areas where traditional approaches are not feasible. However, thus far little is known about how this space-saving greening approach contributes to people’s experience of public spaces.
(vii) The height of buildings (or land use intensity) is a potentially relevant design aspect of public spaces that has not received much attention in preference studies. Research on the subject has been mostly restricted to finding optimal depth/height ratio for a public space (e.g., [16]). With the trends of pursuing higher density and greener public spaces at the same time, more insight is required on the extent to which surrounding land-use intensity influences individuals’ perception of open space quality and attractiveness.
Based on the review above, the first hypothesis (H1) is proposed as follows.
Hypothesis 1.
Green and design attributes influence individuals’ momentary experiences in neighborhood public spaces.
To test H1 and its sub hypotheses (Table 1), a video-based online stated preference experience is conducted. A latent class regression model is used to analyze the data. The method will be explained in Section 3.

2.2. Momentary Experiences in Public Spaces

Experience can be conceptualized into long-term experience and momentary experience [28,62]. While the long-term experience is relatively static and consistent (e.g., satisfaction with life), momentary experience is more dynamic and can be closely associated with the environment a person interacts with [42,63,64]. As momentary experience is still a developing concept in the built environment research, a generally accepted definition of it is lacking. Despite this, there is an agreement [28,64,65] that momentary experience can be defined as a short-term perception that ‘’covers a wide range of subjective meanings such as moods, emotions and feelings of individuals’’ [65]. Recently, researchers have shown an increased interest in using momentary experiences influencing people’s evaluation of the design aspects of urban environments [28]. Although the cognitive component (satisfaction) and affective component (emotions) of momentary experience are typically considered separately, studies have shown that emotions not only coexist with, but are related to individuals’ satisfaction with the services the environment offers [42,66]. In this section, the literature focused on momentary experiences on these dimensions will be reviewed.

2.2.1. Satisfaction

Satisfaction with public spaces, which refers to its original definition in consumer studies [66], is a post-choice evaluative judgment based on individuals’ spatial experiences. Likert scales of perceived environmental quality are often used to derive the satisfaction level (e.g., a questionnaire on residential satisfaction [67]). In built environment studies, the evaluation of satisfaction is mostly achieved using an overall score (e.g., [68]) and focused on a single dimension (e.g., satisfaction of openness and satisfaction of green). Given the multidimensionality and complexity of the built environment satisfaction, researchers have argued that modeling satisfaction as a multidimensional concept will yield deeper insights and overcome the issue of inadequate measurement [66]. Thus, in this study, we evaluate individuals’ satisfaction based on four dimensions of green public space services. Namely, physical activity, aesthetic attractiveness, recreation and climate regulation.
Performing physical activity is an important motivation to use public space. The frequency of physical activity in public spaces appears to be positively related to space safety, aesthetics, amenities, and maintenance [69]. Walking, as a common and moderate physical activity, has been widely considered in public space behavioral studies (e.g., [11,44]). Physical activity is also usually investigated in application to a specific group of people (e.g., youth, older people). Environmental characteristics such as larger size of the open space [30,44], more natural elements [26,30,59,70] and street furniture [19,21] are found to positively associate with outdoor walking. While high traffic speed [71], poor maintenance [30,72], and lack of amenities [73] are reported to hinder walking behavior. More research is still needed to understand how different spatial attributes affect the evaluation of public space physical activity service by a heterogeneous socio-demographic group.
Individuals’ physical and psychological health not only benefits from physical activity in a public space, but also from enjoying a high aesthetic quality landscape [69]. This is a subjective value derived from the visual experience of an individual [74]. Empirical research has found that a clean environment with a high vegetation coverage normally offers high visual aesthetic value [75].
The flexibility of an environment to support multiple recreational activities is generally also an important quality element of public spaces. As Vikas [1] has suggested, an important dimension of the quality of public space is its inclusiveness—the ability to support various activities. High inclusiveness of public spaces and mixed land use can contribute to higher social interactions in the community [76]. It is also recommended to reinforce the multiple functions of neighborhood public spaces for all kinds of community members in the urban regeneration process [30]. To date, there is still little evidence on how green and design attributes influence people’s satisfaction with these aspects.
Microclimate effects, especially the thermal comfort an environment provides, is an additional well-known quality of green public spaces. Trees, water, and other green attributes can contribute to the reduction of the heat island effect [54]. At the same time, cooling effects of urban green have been proven to be considerable (e.g., [54]). Amerigo and Aragone [67] included thermal insulation of green public spaces in perceived residential quality studies. The microclimate adjustment function, therefore, may influence satisfaction with public spaces. However, the knowledge about which spatial attributes of a neighborhood stimulate users’ multidimensional satisfaction and how this takes place, is still limited (e.g., [67]). Thus, the satisfaction with climate regulation is also considered as a component of the momentary experience in this paper.

2.2.2. Emotion

Emotion here refers to emotional responses elicited specifically when experiencing public spaces (e.g., happiness, comfort, annoyance and safety). Studies support the idea that attributes of built environments are strongly related to people’s emotional responses (e.g., [28,42,77,78]). Generally, experienced emotions are measured subjectively using a Likert scale questionnaire [28,77,79]. For example, Hanyu et al. [77] examined the relationships between spatial attributes and emotional appraisals in the daytime experience of a neighborhood using a lab experiment with photographs. They found a positive relationship between affective appraisals and the degree of openness and naturalness. Another stream of research uses experience sampling methods based on physiological sensors attached to the body. For example, Shoval et al. [79] mapped the urban areas generating arousal using sensors that measure skin conductance worn by 68 tourists in the city of Jerusalem. In city areas with visual or aesthetic values and recreation areas along the street, reduced emotional arousal levels were detected. A shortcoming of using sensors and emotion mapping is the difficulty in interpreting what type of emotion aroused in a certain space, and what environment characteristics are related to it. Thus, in this study, we use the subjective approach and we consider four dimensions of emotions based on the findings of previous studies [9,28,42,66,80], namely, happiness, comfort, annoyance, and safety.
Happiness has been widely used as a measure of the quality of life and subjective wellbeing. Perceived happiness when experiencing an urban environment can be enhanced by a higher level of public space naturalness [81]. The age of the person and her subjective well-being have been found to be related to their level of happiness [28,82]. However, studies in the field are largely limited to the sense of happiness influenced by green as a general concept; the impacts of different types of green and design attributes have not received attention.
The feeling of comfort can be influenced by diverse spatial attributes such as sitting space, street furniture, generous sidewalk width, trees, shade, and shelters [1,52]. The sense of comfort is also positively related to the level of thermal comfort [83]. Moreover, people with poor health conditions have a lower degree of comfort during their experiences of urban public spaces [24].
Annoyance is the third dimension of emotion investigated in this study. Noise and annoyance are two correlated concepts in existing urban environment studies. Constant noise caused by traffic on streets is the main factor in inducing the feeling of annoyance [84]. A study indicated that instead of increasing noise barrier height, a lower barrier integrating visual design including vegetation can reduce noise annoyance more effectively [85]. However, research has paid only little attention to the relationship between annoyance and different public space design attributes. In addition, a study has shown that people in natural conditions generally show better recovery from stress and annoyance compared to an urban street condition [32].
The feeling of safety can stimulate an individual’s use of public green spaces [10] and public green space is generally associated with enhanced feelings of safety [86]. Lack of perceived safety can be a major barrier for potential users of green spaces and, particularly, for neighborhood public spaces [41]. Important determinants of a sense of safety are urban traffic safety [42] and degree of maintenance [32]. Disorder in the form of graffiti, garbage, and vandalism negatively affects perceived safety [86]. Socio-demographics can also influence the feeling of safety. Older people, women, and ethnic minorities have a higher likelihood to feel unsafe in green environments [86].
Although satisfaction with services and emotion are two dimensions of experience usually evaluated separately, overlaps and correlations exist. For instance, in one study individual satisfaction and emotional responses regarding hiking were measured and referred to using the general term ‘experience’ [87]. Furthermore, perceived safety, as a commonly used predictor of emotion, has also proven to be an important predictor of neighborhood environment satisfaction [67]. In built environment research, no quantitative analysis has been undertaken using emotion and satisfaction together. A combination of satisfaction and emotion as a measurement tool can reflect more comprehensive individual momentary experiences in public spaces. Based on the literature, we propose the second hypothesis (H2) as follows.
Hypothesis 2.
Satisfaction and emotions form one single dimension underlying the momentary experiences evaluations.
To test H2, a factor analysis was used. In Section 3, we will further elaborate on how the measurement of momentary experience was achieved.

2.2.3. Socio-Demographics and Characteristics of Individual’s Current Living Environment

Apart from green and design elements, the literature also indicated other factors that influence users’ evaluation of public spaces, namely, socio-demographics, public space usage, and characteristics of residents’ neighborhoods. Firstly, socio-demographics such as health condition, education level, age, gender, house type, household composition, and ethnic group have been found to influence users’ experience in public spaces [10,88]. For example, Schipperijn et al. [19] reported that the odds are two times higher that people in good health will be physically active in the nearest urban green spaces compared to the less healthy group. Higher education level was also found to positively relate to the frequency of physical activity [19]. Qin et al. [45] showed that differences in satisfaction with green spaces between age groups are considerable. Children and elderly people have higher overall satisfaction with urban green space than the middle-aged group. Wright Wendel et al. [41] found men to show higher use frequency of urban green space compared to women. However, other studies found no statistically significant effect of gender [28,45,89].
At the same time, characteristics of individuals’ current living environments could also influence their long-term and momentary experience. For example, urban density was reported to influence residents’ perceived public space attractiveness [6]. Higher densities were found to have a positive effect on overall social well-being, which is a component of long-term experience. In recent years, only a small number of studies have focused on the relationship between individuals’ living environment and their momentary experiences. For example, Weijs-Perrée et al. [62] found that satisfaction with the current living environment can positively influence individuals’ momentary experiences in urban public spaces. In addition, a private garden is a non-public form of green space which could potentially influence individuals’ preferences and momentary experiences in public green space. The compensation hypothesis suggests that people who have less available private gardens are more likely to use public green spaces [90], with studies finding both support [90,91] and contradicting [92] evidence for this. Recently, a study carried out by Poortinga et al. has provided new evidence of the compensation effect of private gardens for the lack of public spaces [93]. According to the above review, we propose the third hypothesis (H3).
Hypothesis 3.
Socio-demographics (health condition, education level, age, gender and household composition), characteristics of individual’s current living environment (urban density and private gardens) as well as their evaluation of their current living situation (satisfaction with green in their neighborhoods and cities) influence how environmental attributes are experienced in neighborhood public spaces.
A latent class regression model, Chi-square and ANOVA test were used. The analysis is presented in Section 4.

3. Materials and Methods

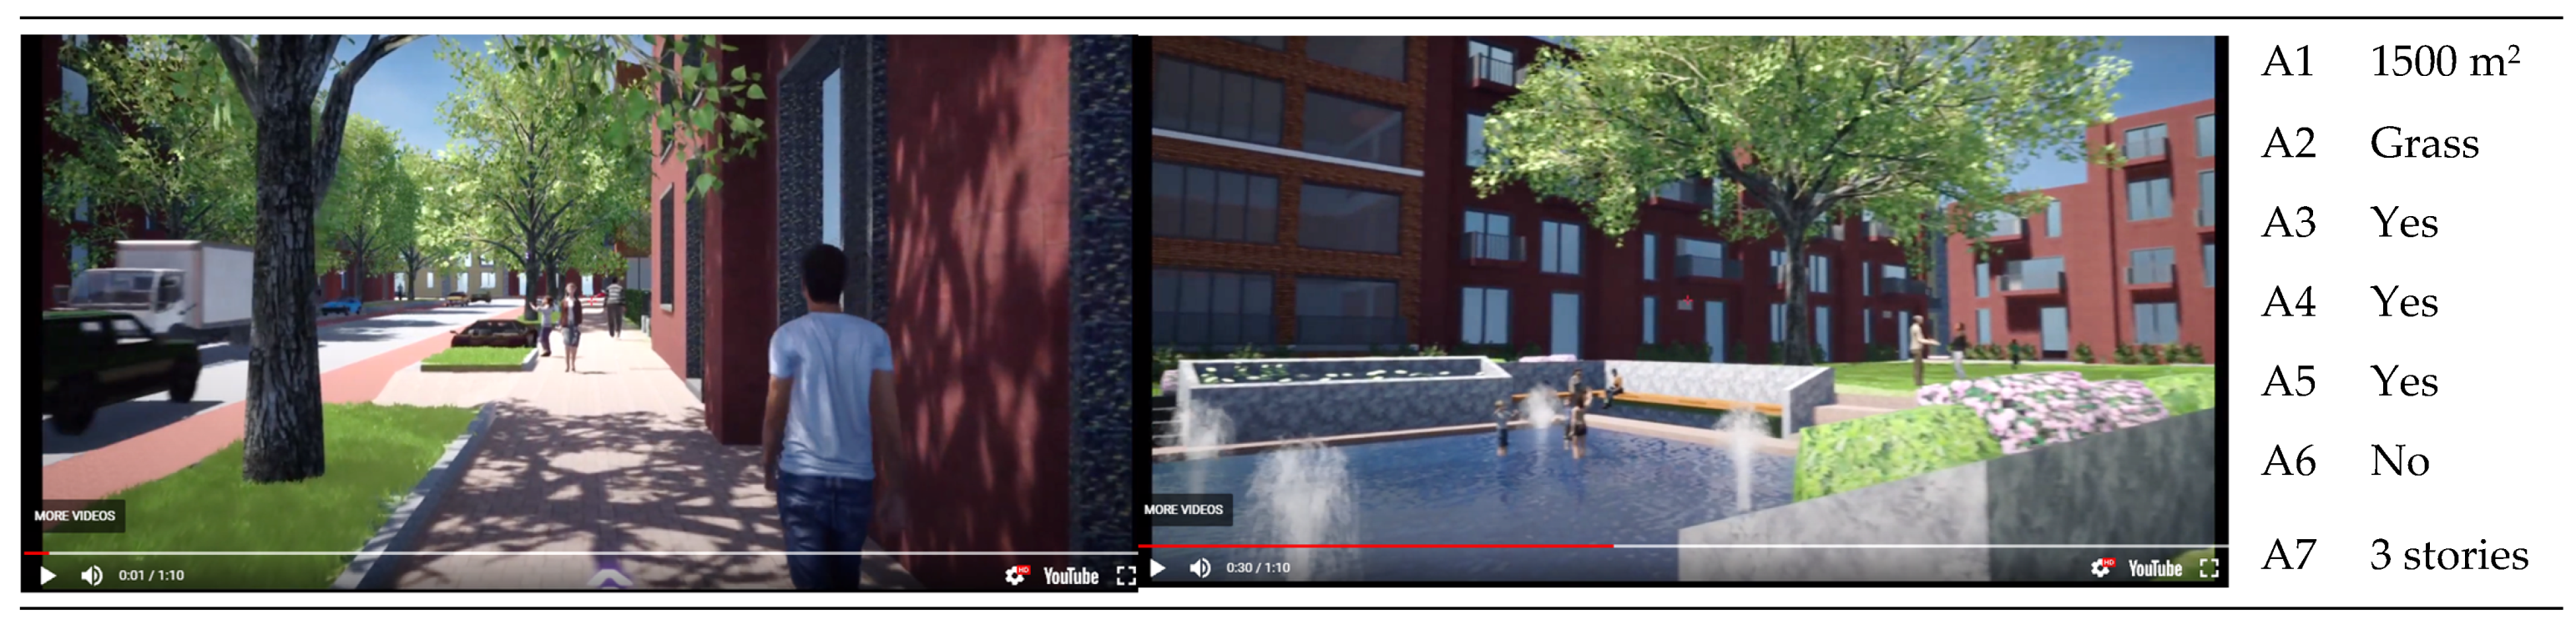
3.1. Data Collection and Experiment Design

To collect data on how individuals experience public spaces as a function of spatial attributes, a stated preference experiment was developed and implemented in an on-line survey. Alternatives that vary simultaneously on a selected set of attributes were created based on an experimental design. Each respondent received four alternatives. Each alternative was displayed as a video (embedded in the survey) that simulated walking through virtual public space based on a pre-designed route. After having watched the video, respondents were asked to indicate their perception and evaluation of each alternative.
Based on existing findings reported in the literature (Section 2.1), seven spatial attributes were identified to be used for the experiment (Table 2). As shown in Table 2, for each attribute, two levels were defined on which the alternatives varied. Given 7 two-level attributes, an orthogonal fractional factorial design consisting of 8 profiles could be used which allowed us to estimate all attribute main effects. As the spatial unit for the experiment, we took a neighborhood street block, which can represent the typical spatial scale of the environment residents interact with on a daily basis [67]. As the data were collected in the Netherlands, the design of the street block mimics the style of a Dutch neighborhood [18,57,94]. The main dwelling type in the street block is a terraced house, which is the most common housing type in the Netherlands [95]. In addition, a flat building is located at the end of the street since it is the second most common type of dwelling in the Netherlands. The street block is 151.0 m deep and 135.0 m wide. The building height for the 3-floor and 4-floor buildings is respectively 9.0 m and 12.0 m. The width of the driveway, bikeway, and pavement is respectively 7.0 m, 2.4 m, and 3.0 m. The design details of the street and the public open space (e.g., building façade material and vegetation), are based on twenty Google street views of terraced house neighborhoods in major Dutch cities (i.e., Amsterdam, Rotterdam, The Hague, Utrecht and Eindhoven), as well as five real estate projects with terraced houses or flats which were under construction. Regarding the trees, the virtual models are based on the Dutch Elm (Ulmus hollandica), which is a commonly found deciduous street tree in the Netherlands. The dimensions of the street trees are, crown: 8.0 ± 0.5 m, height: 12.0 ± 0.5 m.
These alternative designs of public space were then visualized in Sketch up Pro and Unreal Engine 4 (UE4). Firstly, the first alternative was modeled in Sketch up Pro as a base environment. Then it was exported into Unreal Engine 4 to incorporate animations, vegetation details, walking pedestrians as well as automobiles to increase authenticity. The configurations of the spatial attributes (see Table 2) of alternative one were then adjusted to create the other seven alternatives. The final alternatives were displayed as dynamic videos embedded in the on-line survey (see Appendix A for the link to all online videos). The length of each video is 1 min and 10 s. These first-person perspective videos present virtual public spaces seen from a pre-designed route to simulate the walking experience of the invited respondents. Figure 1 shows example screenshots and the profile of the alternatives presented.
After watching each video, respondents could indicate their satisfaction judgments and emotions experienced. Respondents were asked to indicate their satisfaction level related to each of the four services of green public space services that we identified based on the literature (see Section 2.2.1). These include physical activity (I enjoy walking in this street block), aesthetics (the environment of this street block is beautiful and delightful), recreation (I can think of many different activities to do in this street block) and climate regulation (I feel this street block can provide me enough cool air and shades in hot weather). Similarly, emotional experiences on multiple dimensions were asked (Section 2.2.2) using statements. These included happiness (I felt happy), comfort (I felt comfortable), annoyance (I felt annoyed), and safety (I felt safe). Each statement received a score on a 7-point Likert scale, varying from 1 ‘completely disagree’ to 7 ‘completely agree’. Each respondent watched and rated four videos of randomly selected alternatives and, thus, evaluated 4 × 8 statements in total. Figure 2 shows a screenshot of the satisfaction and emotion scales displayed after a video.
The experiment was implemented in an online questionnaire. To collect relevant personal background variables of the respondents, the first part of the questionnaire was focused on socio-demographics (e.g., age, gender, and household composition) which may affect people’s perception of greening in urban public spaces. Postcodes of respondents were also collected in this part to calculate corresponding neighborhood density values: the average number of addresses per square km within a radius of one kilometer (No or hardly urbanized: less than 1000 surrounding addresses. Moderately urbanized: 1000 to 1500 surrounding addresses. Strongly urbanized: 1500 surrounding addresses or more. The values of neighborhood density are based on Statistics Netherlands open-source dataset, 1 January 2020). The second part of the questionnaire contained questions regarding subjective evaluations of the current living environment (on a 5-point Likert scale). In addition, satisfaction with life was measured using the 5-item Satisfaction with Life Scale (SWLS, [96]). The third part of the questionnaire included the experiment.
To ensure a representative data collection, respondents were selected from an existing national online panel. In addition, screening questions were included. Our target group consisted of people living in medium to large cities in the Netherlands, i.e., cities with 100,000 or more inhabitants (32 cities in 2021), where neighborhood public spaces and city parks play more pronounced roles compared to small cities or rural areas.
The data were collected in April 2021. A total of 322 online questionnaires were completed. Questionnaires where all scale questions had the same scores as well as those completed in a very short time were removed. In total 316 questionnaires remained for the analysis.

3.2. Model Estimation

To estimate the effects of the attributes on the experiences taking into account possible heterogeneity in individuals’ responses, we use latent class regression analysis. The latent class regression model assumes that individuals are implicitly sorted into a set of K classes. The model is defined as [97,98]:
h ( y | x , ψ ) = k = 1 K π k f ( y | x , θ k )
π k 0 ,   k = 1 K π k = 1
where y is the dependent variable (in this study the factor score of momentary experiences each individual has on the dimension considered) that has a conditional density h , x is a vector of independent variables (in this study the seven spatial green and design attributes), π k is the prior probability that observation (x,y) belongs to class k , f is a univariate normal density with class-specific mean β k x and variance σ k 2 , θ k = ( β k , σ k 2 ) . θ k is the class-specific parameter vector for the density function f , and ψ = ( π 1 ,   ,   π K ,   θ 1 ,   ,   θ K ) is the vector of all parameters.
The posterior probability that observation (x,y) belongs to class j is defined as:
P ( j | x , y , ψ ) = π j f ( y | x , θ j ) k π k f ( y | x , θ k )
In this model, individuals are assigned to the latent class which has the highest probability. In this way, the class membership of individuals and relationships with personal socio-demographical background variables can be analyzed. The latent class regression parameters can be obtained by maximum likelihood estimation. To determine the optimal number of classes K, the Akaike information criterion (AIC = 2 B − 2 LL) and the Bayesian Information Criterion (BIC = 2 LL + ln(N) B) are used (LL is the log-likelihood of the model, B is the number of estimated parameters and N is the number of observations).

4. Results

4.1. Sample Characteristics

Table 3 shows the frequency distribution of the sample on several key socio-demographic characteristics. The sample includes a wide range of ages from 19 to 84 years old and approximately equal numbers of females and males. Nearly half of the respondents have at least college education. One-third of the sample is part of a couple and has children. More than half of the respondents have a household income of 30,000 euros per year or more, while 61% of the people live in an owner-occupied dwelling and 55% have a private garden. Regarding health conditions, most of the respondents reported no disabilities; only 3.1% reported extremely limiting disabilities. The distribution of gender does not deviate much from that in the Dutch population [99], but age and household composition have differences. Age groups 25–44 and 45–64 are overrepresented since our respondents are all adults (18 years or older). The sample also contains fewer single households and more multi-person households without children. Therefore, the findings should be interpreted with some caution.

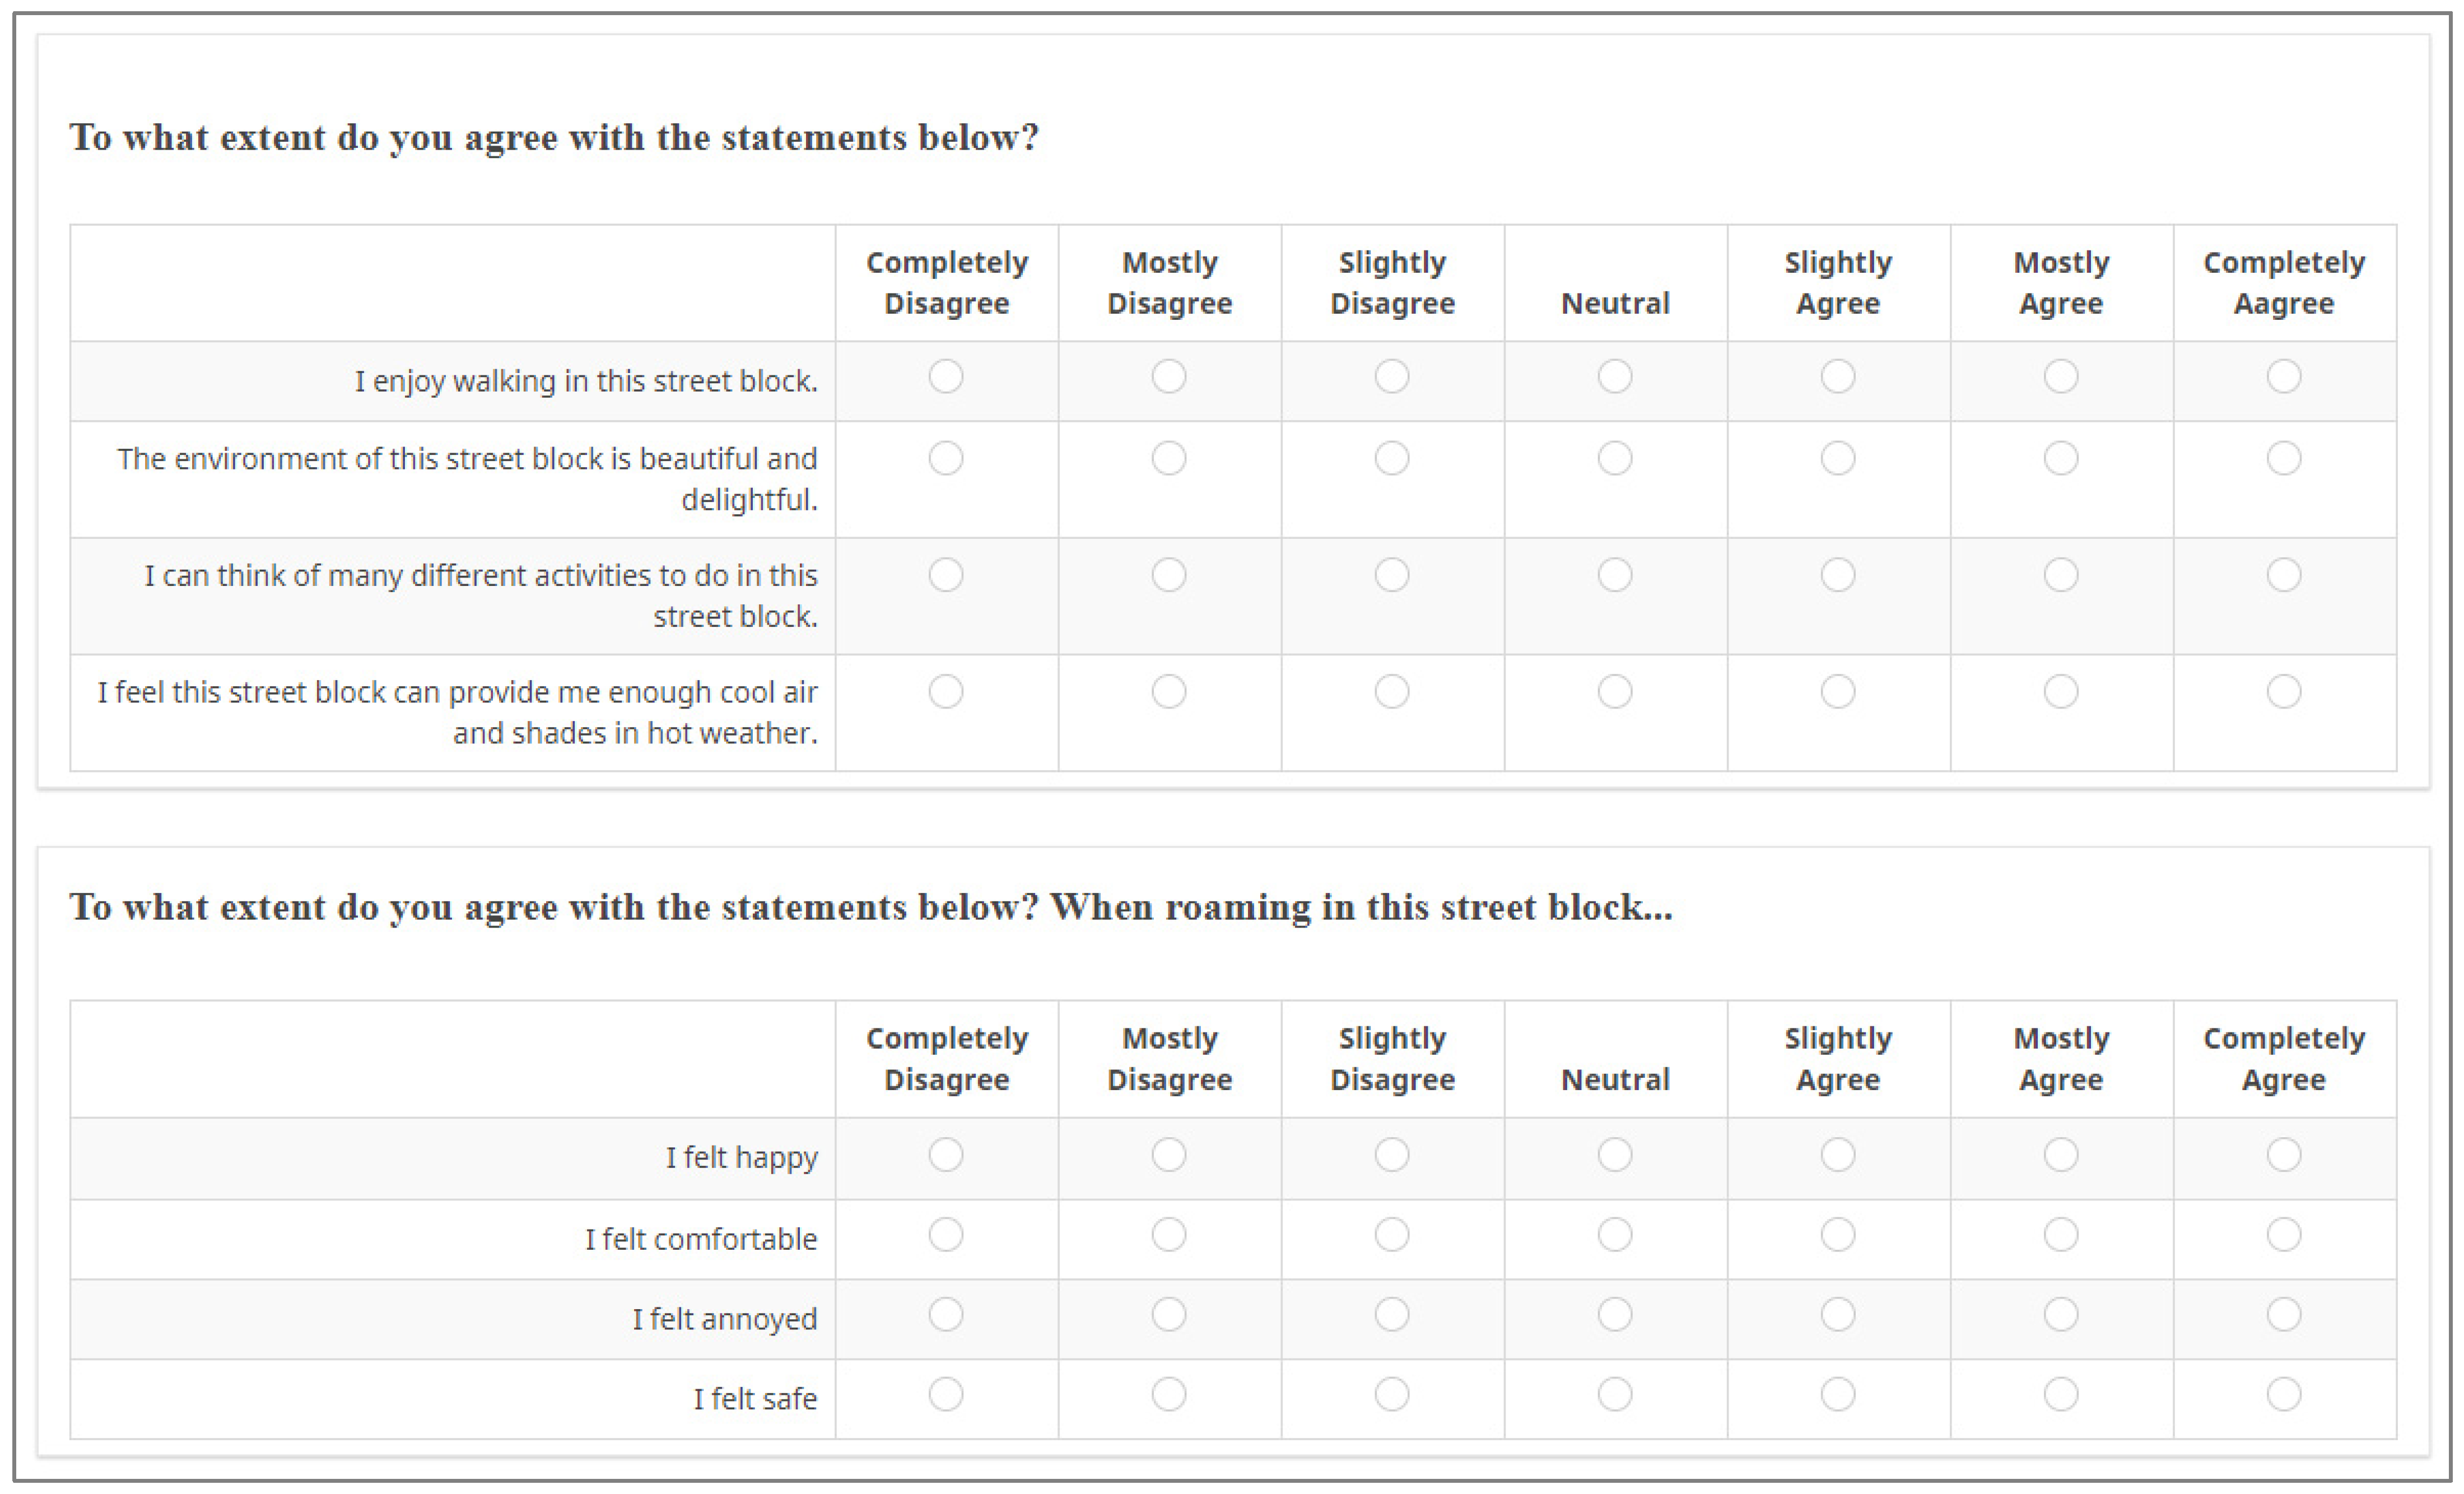
4.2. Measurement of Experience

To address first the research question regarding experience measurement, an exploratory factor analysis of the eight momentary experience scales is conducted. Seven scales of momentary experiences have the same preference direction from negative to positively valued experience. The exception is ‘I felt annoyed’ in which higher scores represent higher feelings of annoyance thus more negative experiences. Only the firstly component (factor) has an eigenvalue larger than one (5.325). This indicates that the momentary experience of the neighborhood alternatives measured by the 4 satisfaction and 4 emotion scales, can be reduced to a single preference dimension. The factor loadings are shown in Table 4. To detect if the common method bias [100] accounts for the one-factor results, a post-test is conducted. A marker variable [100,101] is added and the correlations between the marker and the eight momentary experiences scales are calculated. The marker variable is an item (respondents were asked to evaluate the extent they agree with the statement: ‘So far I have gotten the important things I want in life.’ using a 7-point scale) from the seven-point satisfaction with life scale as it has been identified to be theoretically unrelated to the eight momentary experiences items. As the correlation matrix shows (See Appendix B, Table A1), the eight items have statistically significant medium or high correlations, whereas the marker variable (i.e., the ‘life satisfaction’ variable) has substantially lower correlations with all the eight items. This test result suggests that the one-factor result cannot be explained as a bias of the measurement. Thus, we can conclude that the results of the factor analysis offer support for Hypothesis 2 that cognitive and affective aspects of experience are correlated with each other so that experience can be represented on a single preference dimension.
For model estimation, this means that experience can be treated as a single (dependent) variable. Table 4 shows the factor loadings of the eight items. By multiplying the standardized scores on the eight items with the corresponding factor loadings, we generate a new summary variable and use this as a measure of experience where a low score indicates low and high score high positive experience. In addition, Cronbach’s alpha test was used to test the reliability of the eight items (see Appendix C). The reliability coefficient is 0.923, suggesting that the items have relatively high internal consistency.

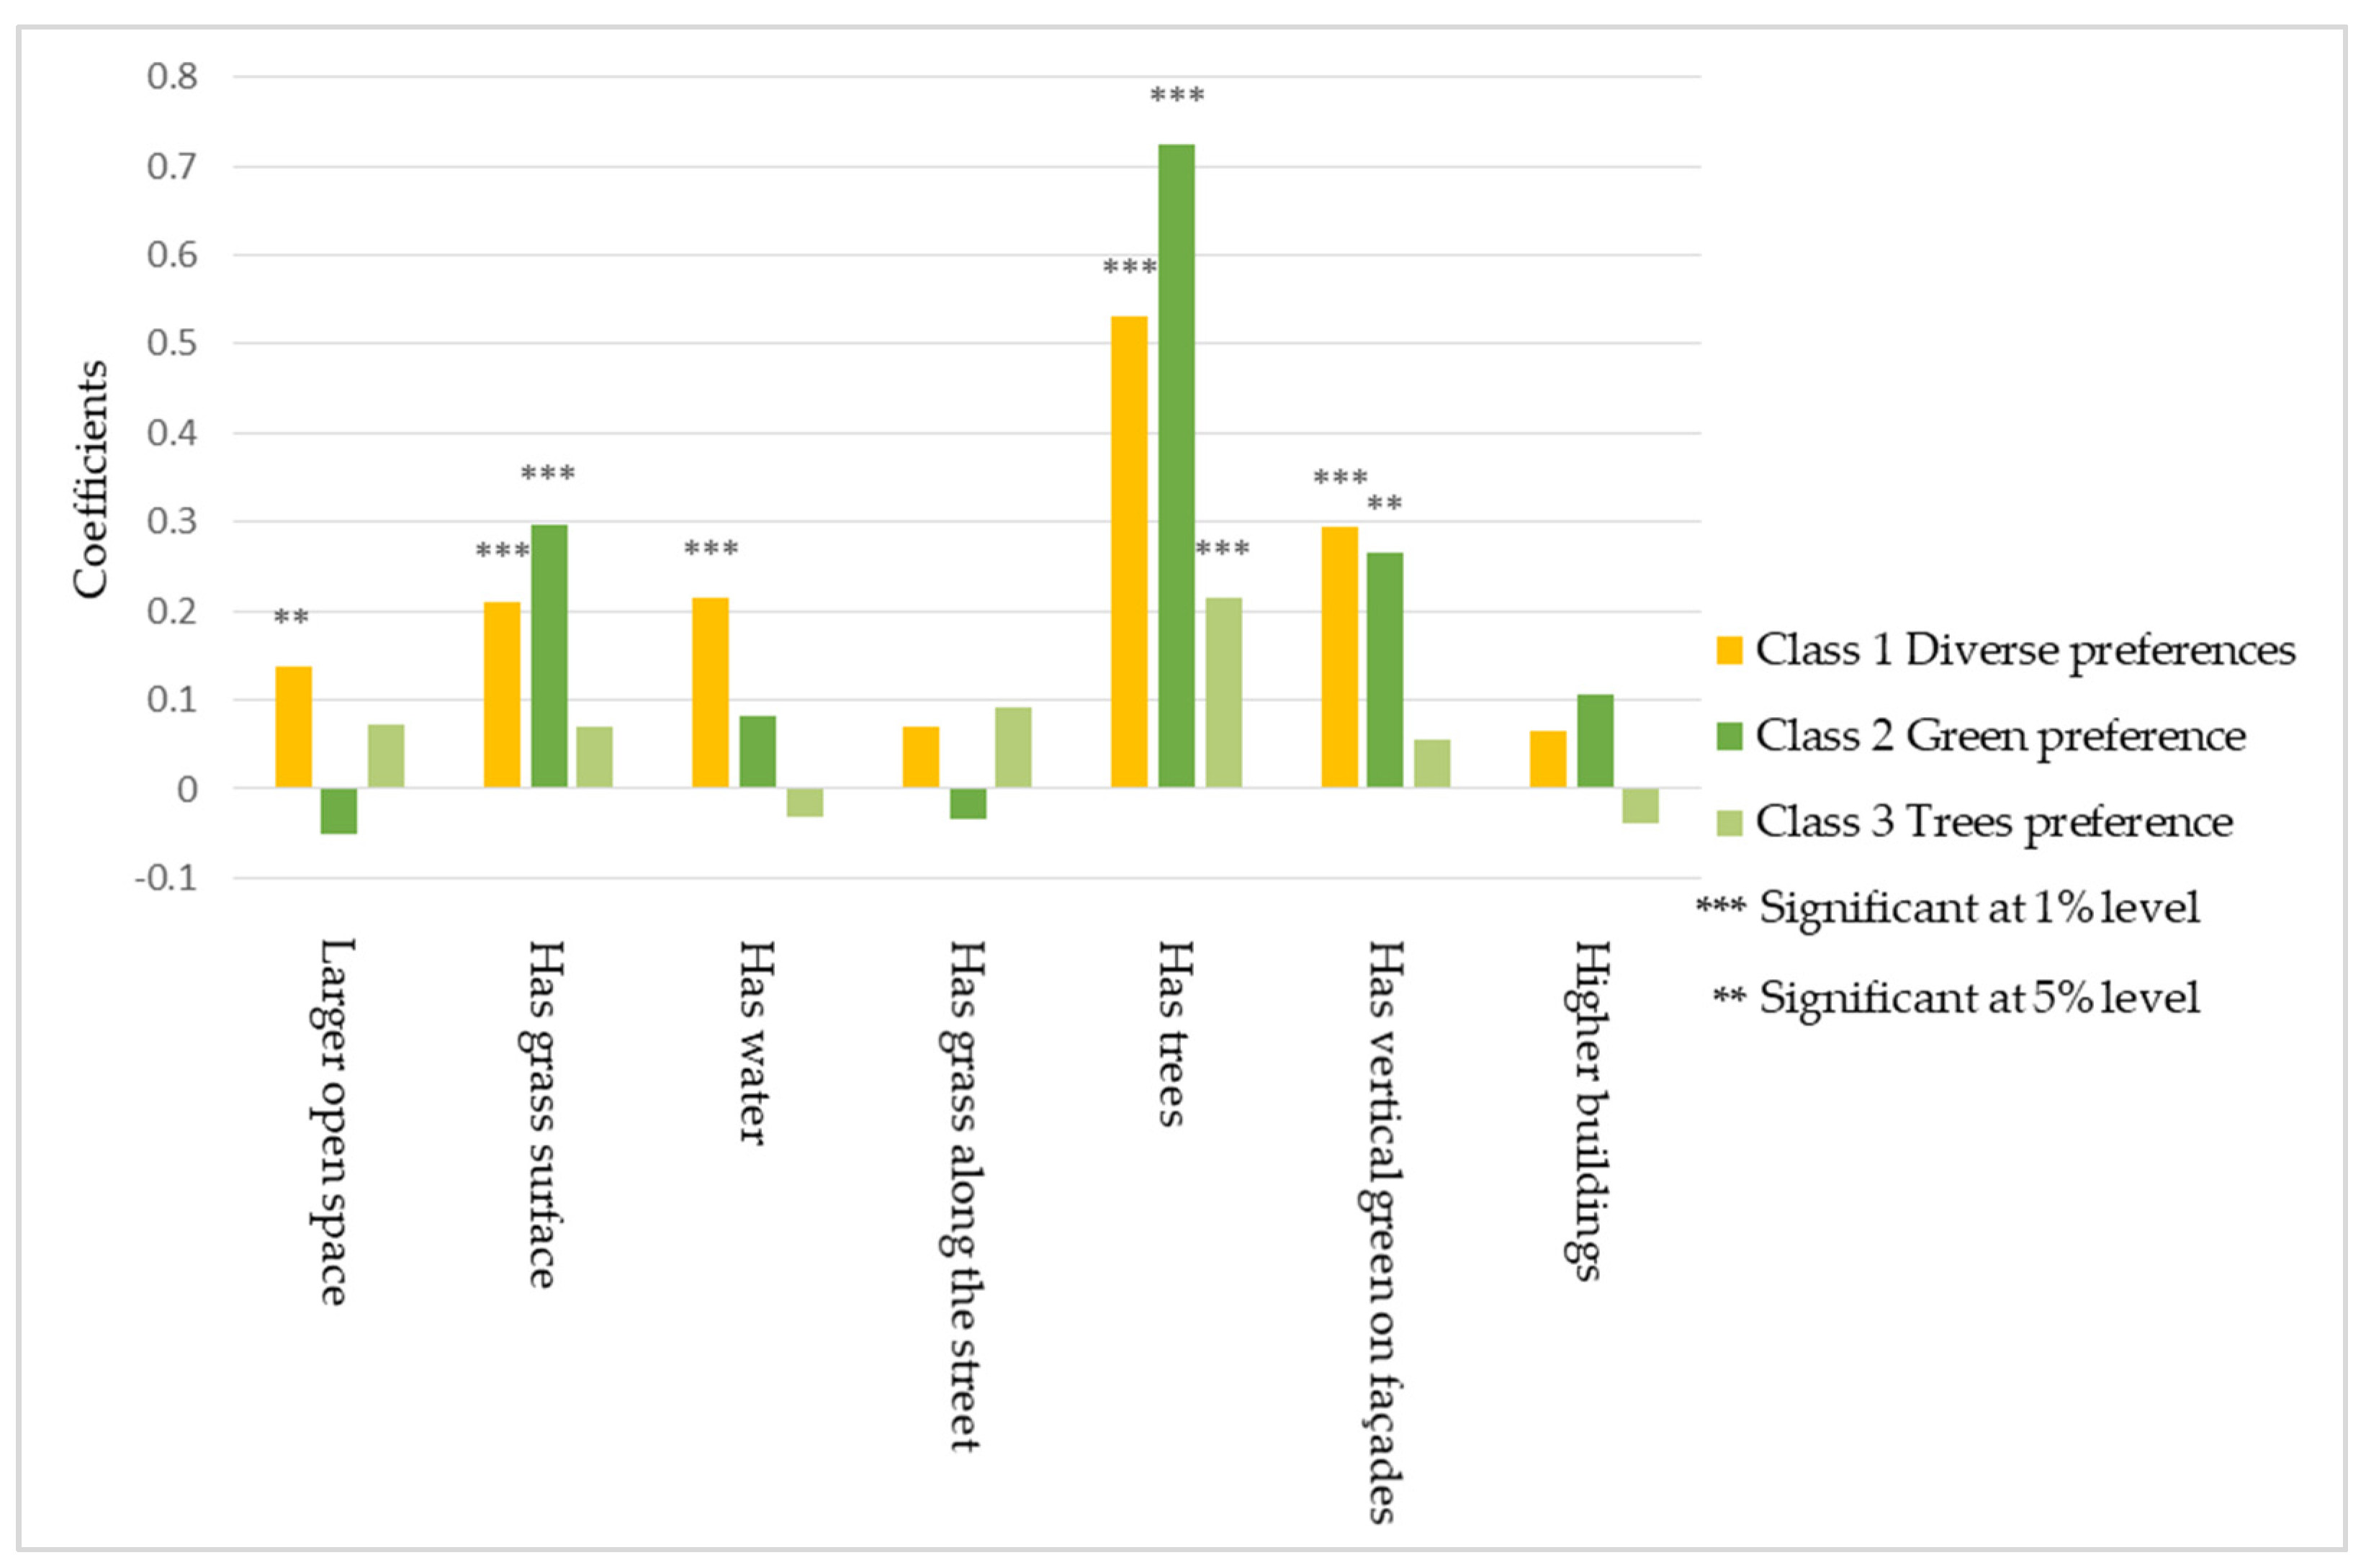
4.3. Latent Class Model Estimation

In the latent class regression model estimating Equation (2), the factor score is entered as the dependent variable and the seven spatial attributes as independent variables. To determine the optimal choice of K, we estimated the model 4 times varying K from K = 1 to K = 4. The results are shown in Table 5. It can be seen that the AIC and BIC keep decreasing, indicating that there is no optimum in this range of K. In the step from K = 3 to K = 4, however, the improvement is only very small and to arrive at a parsimonious model, the three-class model was selected.
Table 6 shows the results of the one-class and three-class models. Compared with the one-class model (Adj. Rho2 = 0.153), the adjusted McFadden Rho squared is substantially larger in the three-class model (Adj. Rho2 = 0.280), which indicates that there is substantial heterogeneity that can be captured by distinguishing three classes. Figure 3 visualizes the value of coefficients of the three-class model. The first class contains the majority (51.5%) of the respondents. This class can be labeled as a ‘Diverse preference’ group since for these people positive experiences are affected by a broad range of design and green attributes. A larger size, grassed surface, presence of water, trees, and vertical green are all contributing to their positive momentary experiences. The second class, which represents 33.5% of the respondents, is named ‘Green preference’ because for individuals in this class all green elements—grass surface, trees and vertical green are factors influencing their momentary experiences of neighborhood public spaces. Moreover, grass surface and trees have the highest parameter values in this class compared to the other two classes. The last class (14.9%) can be labeled as ‘Trees preference’, as this class considers only the presence of trees as an attribute contributing to their momentary experience. In addition, it should be noted that for all classes, the constants are statistically significant and different in value. These different base levels of positive experience are possibly related to other characteristics of a person (e.g., satisfaction with life), which we will test and explain in the next step.
To analyze the distribution of the individuals across the classes, we studied the relationships between class membership, on the one hand, and socio-demographics, and subjective evaluations of the current living environment, on the other. The results of this analysis are shown in Table 7 (based on a Chi-square or ANOVA test of differences between groups, depending on the measurement level of the variable). The results indicate that age and gender show no statistical difference between the three groups. The ‘Green preference’ group (class 2) has the highest percentage of individuals who own a private garden by their dwelling. Regarding satisfaction with life, the ‘Trees preference’ group (class 3) has the highest factor score, followed by the ‘Diverse preferences’ class, then ‘Green preference’. This corresponds with the differences in constants (base scores). Furthermore, the ‘Trees preference’ group has the highest score on all aspects of satisfaction with the current living environment (quality, amount of green in the neighborhood and the city) and Class 2 –‘Green preference’ the lowest scores on all four satisfaction aspects.
The results of Table 7 also indicate that individuals across the three classes vary in degree of urbanization. The ‘Green preference’ class has the largest percentage of individuals from strongly urbanized neighborhoods. The ‘Trees preference’ class has the lowest percentage of individuals from not or hardly urbanized areas and a larger share of people from moderate density areas. The ‘Diverse preferences’ group is in the middle of all three urban density levels.
Taking it all together, we can summarize the characteristics of the three groups as follows. Firstly, the ‘Diverse preferences’ group of people values trees as the most important element for momentary experiences in a public space. It is the only group that attaches importance to a large size of open space and the presence of water. This group represents approximately half (51.5%) of the respondents. More than 75% of individuals from this group live in strongly urbanized neighborhoods. The ‘Green preference’ group has the highest percentage of people who have a private garden and the lowest level of satisfaction with both life overall, green in their neighborhood and the city they live in. People from this group positively experience public spaces with (in terms of decreasing importance) trees, grass ground surface, and vertical green. The ‘Trees preference’ group on average has the highest base level of experience. However, of the attributes tested they only assign importance to the presence of trees for a positive experience of the public space. Secondly, this group also has the highest base level of positive momentary experience and at the same time, individuals from this group are most satisfied with their life and their current living environment. This suggests that the level of satisfaction with the existing situation positively influences the base level of experience. Consistent with this interpretation, the ‘Green preference’ class has the lowest base level of experience and the lowest level of satisfaction with life and satisfaction with green in their current environment.

5. Discussion

As mentioned in the literature review, green in public spaces is a multifunctional but limited resource, especially in dense urban areas. In this paper, we investigated individuals’ momentary experiences of virtual neighborhood public spaces. Firstly, the results of the factor analysis support H2, stating that the momentary experience of the neighborhood public spaces measured by the scales (Figure 2) can be reduced to a single dimension. The results suggest that satisfaction and emotion are correlated and can together be represented by a single preference dimension for the momentary experience. This finding confirms the association between emotion and satisfaction when experiencing an environment, as some studies have suggested [42,66]. As momentary experience is still a developing concept in built environment research [28], our finding contributes insights that might be useful for the further development of the concept. The combined measure can reflect individuals’ experiences more comprehensively. In this way, the method provides a feasible approach to measure individuals’ momentary experiences in a built environment.
Secondly, our results support H1, stating that green and design attributes influence individuals’ momentary experiences in the neighborhood public spaces. To be more specific, H1b, H1c and H1e are supported by the results. Grass surface and the presence of water and trees are found to be positively related to the individuals’ experiences. These findings are in line with previous studies [17,18,21,52,54,56,59]. Regarding H1a, the larger open space is only positively related to the momentary experiences in Class 1 and not statistically significant in the other two classes. We do not find sufficient evidence for H1d and H1g. That is, the presence of grass along the street and higher buildings both show no statistically significant effect on people’s experiences, this is in contrast to previous studies [16,57]. A relatively new finding is that vertical greening positively influences momentary experiences which supports H1f. Vertical greening is ranked second important in the one-class model. In the next paragraph, we will discuss and compare the effects of each attribute in detail.
Among the seven spatial attributes varying in neighborhood public space alternatives, ‘trees’ is the only commonly highly valued green attribute in all population groups. This is in line with previous research which showed that the presence of trees has a dominant influence on people’s streetscape preferences and route choices [18,21]. Apart from trees, vertical green has positive effects on individuals’ momentary experiences for the ‘Diverse preferences’ and ‘Green preference’ groups. In both groups, this attribute is even more important than the size of the open space. This is an encouraging finding which provides evidence that vertical green which contributes to building energy efficiency goals also substantially benefits individual outdoor environment experiences without demanding more open space. Grass surface is another attribute that positively influences individuals’ momentary experiences for both the ‘Diverse preferences’ and ‘Green preference’ groups. This finding is in line with previous studies that grass can help stress restoration [17] and enhance the experience of enjoyment in a street [57]. The presence of water has positive effects on momentary experience only for the ‘Diverse preferences’ group. It has approximately the same importance as grass surface for this group. Another interesting finding is that the average building height in the neighborhood has no statistically significant influence on peoples’ emotional responses and satisfaction. Similarly, the size of the open space is only statistically significant for one class. This finding is in contrast to previous studies which found that higher density has a negative impact on individual experiences [29] and a larger size of open spaces is unambiguously preferred [30]. Our findings, at least for the case considered, suggest that in a micro-scale neighborhood size has little effect on people’s momentary experience when it comes to public spaces (in this study 750 m2 and 1500 m2 were considered). The results suggest that the presence of other spatial attributes such as trees and vertical greening can make up for a lack of open space size in regard to enhancing individuals’ experiences. Furthermore, building height (in this study 3 and 6 stories) appears to be far less important compared to ‘trees’, ‘grass surface’, ‘vertical green’ and ‘water’.
We also found statistically significant heterogeneity among groups. The results of a Chi-square and ANOVA test support Hypothesis 3. Results suggest that an individual’s satisfaction with his or her current situation (life overall and green in the living environment) has a positive relationship with the base level of momentary experiences an individual can have. This finding is consistent with Weijs-Perré et al. [62] who found that individuals’ momentary subjective well-being (SWB) is positively related to their long-term SWB. In addition, individuals with a low satisfaction level of green in their current neighborhoods and cities tend to attach high importance to green attributes for their momentary experience. We found no statistically significant effect of age and gender. This finding matches those of other recent studies of experiences in built environments [28,62,89,102]. However, in studies of other experience dimensions in public spaces, age and gender were found to be related to the experiences of public spaces [45,90]. Results of this study further support the idea that, different from long-term experiences, momentary experiences are less correlated with the socio-demographics and are more strongly influenced by the characteristics of the built environment (e.g., [28,62,64,79]). Another interesting finding in this study is that, despite the highest rate of private garden ownership of the ‘Green preference’ group, people from this group have the lowest level of satisfaction with life and public green spaces in their living environment. For the ‘tree preference’ group, the reverse applies. A possible explanation is that individuals use the private garden as a compensation for a low satisfaction with green in their current living environment. Although, contradicting the recent findings of Poortinga et al. [93] that the availability of private gardens is linked to better wellbeing, our result is potentially consistent with the compensation hypothesis regarding private gardens [91].

6. Conclusions

In this paper, we investigated (1) the effects of green and design attributes of the public spaces on experiences and analyzed the heterogeneity in the evaluations of these attributes; (2) the factors underlying momentary experiences in public space given both cognitive (satisfaction) and affective (emotion) components. Three hypotheses were proposed: H1. Green and design attributes influence individuals’ momentary experiences of neighborhood public spaces; H2. Satisfaction and emotion form one single dimension underlying the momentary experiences evaluations; and H3. Socio-demographics (health condition, education level, age, gender and household composition) and characteristics of individual’s current living environment (urban density and private gardens) including his or her evaluation of the current living situation (satisfaction with green in the neighborhood and city) influence how environmental attributes are experienced in neighborhood public spaces. To test the hypotheses, we conducted an online stated preference experiment to measure and analyze individuals’ momentary experiences of public spaces. Data were collected in the Netherlands from a sample of 316 persons. Results of exploratory factor analysis support H2 that the momentary experience of the neighborhood public spaces can be described by a single dimension. This finding enhances our understanding of the relationship between satisfaction and emotion as well as the construct of momentary experience. We found three latent groups whose experience of the green and design attributes varied mutually. These groups differ on socio-demographics, satisfaction with life and current living environment, as well as housing and location characteristics (ownership of a private garden, the degree of urbanization). These findings support H1 but the attributes ‘building height’ and ‘grass along the street’ are not statistically significant. Our study is relevant to the development of public spaces which can stimulate positive experiences for various groups of people. As the results show, trees are the only high-valued attributes for all identified groups, while the appreciation of a water element, surface materialization, vertical green and size of open spaces depends on users’ characteristics. The higher importance of vertical green compared to the size of open space provides a practical reference for the cities that pursue both greenification and densification. That is, by integrating vertical green elements without expanding the size of open spaces, individuals’ experiences in neighborhood public spaces can be substantially improved. The results of this paper, therefore, extend our knowledge of which factors characterize attractive urban public spaces and promote positive momentary experiences. Regarding H3, we found that the way spatial attributes are experienced differs in terms of private garden ownership. In addition, the positive correlation between satisfaction with the current living situation and the base level of momentary experiences extends our knowledge about the relationship between long-term wellbeing and short-term experiences.
The experimental approach in the study of individuals’ momentary experiences in relation to the green and design attributes of public spaces is still relatively new. This study developed and applied a method for measuring and analyzing experiences. By incorporating planning/design alternatives into a video-based stated choice experiment, a broad range of participants can easily explore the virtual environment. Their evaluations can be analyzed to obtain quantitative information for making design decisions. Our methodology can thus work as a participation tool for urban designers and policy makers to obtain information from a large group of individuals’ momentary experiences of possible designs in a new or regeneration project before real construction. Given the worldwide need for densification and ensuring the quality and quantity of public green spaces, applying our approach to other contexts and design scenarios may provide useful and detailed knowledge.
Several limitations to this study need to be acknowledged. Firstly, the levels assumed for the green and design attributes used for the experiment are somewhat limited. Further work needs to be done to consider finer classifications and broader ranges to enrich the evidence on important green and design attributes. Secondly, several spatial attributes we included turned out to be not statistically significant for the way public spaces are experienced, this is in contrast to other studies [17,30]. Running another experiment for these attributes and also extending the set of attributes could increase our understanding. Thirdly, given the spatial pattern of a Dutch neighborhood, the findings may not be readily transferable to extremely urbanized areas including high-rise buildings. Repeating the experiment in different regions and settings is also recommended as it may increase the comprehensiveness of the insights.
To advance our knowledge of individuals’ satisfaction and emotional responses to the built environment, several further research directions are suggested. Firstly, different dimensions of momentary experiences can be investigated, for example, by extending the number of categories of emotional responses studied. Secondly, the videos in our experiment simulated the perspective of walking pedestrians, we suggest repeating our method with other types of public space users, for example, the momentary experiences of cyclists on streets. Thirdly, more in-depth studies of appraisals and mechanisms underlying experiences can contribute to a better understanding of why a certain momentary experience is generated in an environment.

Author Contributions

Conceptualization, Y.Z., P.E.W.v.d.B., I.V.O. and T.A.A.; Data curation, Y.Z.; Formal analysis, Y.Z.; Investigation, Y.Z.; Methodology, P.E.W.v.d.B., I.V.O. and T.A.A.; Supervision, P.E.W.v.d.B., I.V.O. and T.A.A.; Visualization, Y.Z.; Writing—original draft, Y.Z.; Writing—review & editing, Y.Z., P.E.W.v.d.B., I.V.O. and T.A.A. All authors have read and agreed to the published version of the manuscript.

Funding

This research was funded by the Chinese Scholarship Council (China), grant number CSC 201806250029. We would like to thank the Chinese Scholarship Council for providing the funding for the Ph.D. study.

Institutional Review Board Statement

The study was conducted in accordance with the Declaration of Helsinki, and approved by the Institutional Review Board of EINDHOVEN UNIVERSITY OF TECHNOLOGY (ERB2020BE51, 19 November 2020).

Informed Consent Statement

Informed consent was obtained from all subjects involved in the study.

Data Availability Statement

Data available on request due to restrictions e.g., privacy or ethical. The data presented in this study are available on request from the corresponding author. The data are not publicly available due to privacy reasons.

Conflicts of Interest

The authors declare no conflict of interest.

Appendix A

Links of the videos used in the stated preference experiment.

Appendix B

Table A1. Correlation matrix of the marker variable and the eight momentary experience scales (N = 1264).
ScaleMomentary Experiences VariablesMarker
WalkArtActivitiesCoolHappyComfortableAnnoyedSafeLife Satisfaction
Momentary experiences variablesWalk1
Art0.867 ***1
Activities0.708 ***0.702 ***1
Cool0.642 ***0.672 ***0.600 ***1
happy0.818 ***0.793 ***0.675 ***0.639 ***1
Comfortable0.758 ***0.752 ***0.647 ***0.588 ***0.799 ***1
Annoyed−0.467 ***−0.479 ***−0.351 ***−0.332 ***−0.488 ***−0.505 ***1
Safe0.556 ***0.581 ***0.487 ***0.400 ***0.600 ***0.676 ***−0.402 ***1
MarkerLife satisfaction0.108 ***0.128 ***0.187 ***0.096 ***0.151 ***0.162 ***−0.083 ***0.169 ***1
***. Correlation is significant at the 0.01 level (2-tailed).

Appendix C

Table A2. Cronbach’s Alpha of satisfaction and emotion scales.
Cronbach’s AlphaCronbach’s Alpha Based on Standardized ItemsN of Items
0.9230.9258
Table A3. Item-total statistics of satisfaction and emotion statements.
Scale Mean If Item DeletedScale Variance If Item DeletedCorrected Item-Total CorrelationSquared Multiple CorrelationCronbach’s Alpha If Item Deleted
I enjoy walking in this street block. (Walk)34.766.40.8620.8080.903
The environment of this street block is beautiful and delightful.(Art) 34.666.60.8690.8000.903
I can think of many different activities to do in this street block. (Activities)34.871.50.7310.5690.914
I feel this street block can provide me with enough cool air and shades in hot weather. (Cool)34.869.00.6730.5060.920
I felt happy34.768.00.8590.7640.904
I felt comfortable34.369.70.8380.7350.906
I felt annoyed34.274.40.5100.2910.932
I felt safe34.175.00.6370.4800.921

References

  1. Mehta, V. Evaluating Public Space. J. Urban Des. 2014, 19, 53–88. [Google Scholar] [CrossRef]
  2. Garau, P. Global Public Space Toolkit: From Global Principles to Local Policies and Practice; UN-HABITAT: Nairobi, Kenya, 2015; ISBN 978-92-1-132656-7. [Google Scholar]
  3. Wolch, J.R.; Byrne, J.; Newell, J.P. Urban green space, public health, and environmental justice: The challenge of making cities “just green enough”. Landsc. Urban Plan. 2014, 125, 234–244. [Google Scholar] [CrossRef] [Green Version]
  4. Jim, C.Y.; Chen, W.Y. Ecosystem services and valuation of urban forests in China. Cities 2009, 26, 187–194. [Google Scholar] [CrossRef]
  5. Bel, G.; Fageda, X. Why do local governments privatise public services? A survey of empirical studies. Local Gov. Stud. 2007, 33, 517–534. [Google Scholar] [CrossRef]
  6. Mouratidis, K. Built environment and social well-being: How does urban form affect social life and personal relationships? Cities 2018, 74, 7–20. [Google Scholar] [CrossRef]
  7. Groenewegen, P.P.; Van Den Berg, A.E.; De Vries, S.; Verheij, R.A. Vitamin G: Effects of green space on health, well-being, and social safety. BMC Public Health 2006, 6, 149. [Google Scholar] [CrossRef] [Green Version]
  8. Mennis, J.; Mason, M.; Ambrus, A. Urban greenspace is associated with reduced psychological stress among adolescents: A Geographic Ecological Momentary Assessment (GEMA) analysis of activity space. Landsc. Urban Plan. 2018, 174, 1–9. [Google Scholar] [CrossRef]
  9. Shepley, M.; Sachs, N.; Sadatsafavi, H.; Fournier, C.; Peditto, K. The impact of green space on violent crime in urban environments: An evidence synthesis. Int. J. Environ. Res. Public Health 2019, 16, 5119. [Google Scholar] [CrossRef] [Green Version]
  10. Li, S.; Zhao, P.; Zhang, H.; Quan, J. Walking behavior in the old downtown Beijing: The impact of perceptions and attitudes and social variations. Transp. Policy 2019, 73, 1–11. [Google Scholar] [CrossRef]
  11. Van Hecke, L.; Ghekiere, A.; Van Cauwenberg, J.; Veitch, J.; De Bourdeaudhuij, I.; Van Dyck, D.; Clarys, P.; Van De Weghe, N.; Deforche, B. Park characteristics preferred for adolescent park visitation and physical activity: A choice-based conjoint analysis using manipulated photographs. Landsc. Urban Plan. 2018, 178, 144–155. [Google Scholar] [CrossRef]
  12. Yoo, S.; Wagner, J.E. A review of the hedonic literatures in environmental amenities from open space: A traditional econometric vs. spatial econometric model. Int. J. Urban Sci. 2016, 20, 141–166. [Google Scholar] [CrossRef]
  13. Koohsari, M.J.; Mavoa, S.; Villianueva, K.; Sugiyama, T.; Badland, H.; Kaczynski, A.T.; Owen, N.; Giles-Corti, B. Public open space, physical activity, urban design and public health: Concepts, methods and research agenda. Health Place 2015, 33, 75–82. [Google Scholar] [CrossRef] [Green Version]
  14. Carrus, G.; Scopelliti, M.; Lafortezza, R.; Colangelo, G.; Ferrini, F.; Salbitano, F.; Agrimi, M.; Portoghesi, L.; Semenzato, P.; Sanesi, G. Go greener, feel better? The positive effects of biodiversity on the well-being of individuals visiting urban and peri-urban green areas. Landsc. Urban Plan. 2015, 134, 221–228. [Google Scholar] [CrossRef]
  15. Adeel, A.; Notteboom, B.; Yasar, A.; Scheerlinck, K.; Stevens, J. Sustainable streetscape and built environment designs around brt stations: A stated choice experiment using 3d visualizations. Sustainability 2021, 13, 6594. [Google Scholar] [CrossRef]
  16. Kim, J.; Kim, S. Finding the Optimal D/H Ratio for an Enclosed Urban Square: Testing an Urban Design Principle Using Immersive Virtual Reality Simulation Techniques. Int. J. Environ. Res. Public Health 2019, 16, 865. [Google Scholar] [CrossRef] [Green Version]
  17. Nordh, H.; Hartig, T.; Hagerhall, C.M.; Fry, G. Components of small urban parks that predict the possibility for restoration. Urban For. Urban Green. 2009, 8, 225–235. [Google Scholar] [CrossRef]
  18. Van Dongen, R.P.; Timmermans, H.J.P. Preference for different urban greenscape designs: A choice experiment using virtual environments. Urban For. Urban Green. 2019, 44, 126435. [Google Scholar] [CrossRef]
  19. Schipperijn, J.; Bentsen, P.; Troelsen, J.; Toftager, M.; Stigsdotter, U.K. Associations between physical activity and characteristics of urban green space. Urban For. Urban Green. 2013, 12, 109–116. [Google Scholar] [CrossRef]
  20. Aspinall, P.A.; Thompson, C.W.; Alves, S.; Sugiyama, T.; Brice, R.; Vickers, A. Preference and relative importance for environmental attributes of neighbourhood open space in older people. Environ. Plan. B Plan. Des. 2010, 37, 1022–1039. [Google Scholar] [CrossRef]
  21. Kasraian, D.; Adhikari, S.; Kossowsky, D.; Luubert, M.; Hall, B.G.; Hawkins, J.; Nurul Habib, K.; Roorda, M.J. Evaluating pedestrian perceptions of street design with a 3D stated preference survey. Environ. Plan. B Urban Anal. City Sci. 2020, 48, 1787–1805. [Google Scholar] [CrossRef]
  22. Ayala-Azcárraga, C.; Diaz, D.; Zambrano, L. Characteristics of urban parks and their relation to user well-being. Landsc. Urban Plan. 2019, 189, 27–35. [Google Scholar] [CrossRef]
  23. Kothencz, G.; Blaschke, T. Urban parks: Visitors’ perceptions versus spatial indicators. Land Use Policy 2017, 64, 233–244. [Google Scholar] [CrossRef]
  24. van Vliet, E.; Dane, G.; Weijs-Perrée, M.; van Leeuwen, E.; van Dinter, M.; van den Berg, P.; Borgers, A.; Chamilothori, K. The influence of urban park attributes on user preferences: Evaluation of virtual parks in an online stated-choice experiment. Int. J. Environ. Res. Public Health 2021, 18, 212. [Google Scholar] [CrossRef]
  25. Liu, Y.; Yang, D.; Timmermans, H.J.P.; de Vries, B. Analysis of the impact of street-scale built environment design near metro stations on pedestrian and cyclist road segment choice: A stated choice experiment. J. Transp. Geogr. 2020, 82, 102570. [Google Scholar] [CrossRef]
  26. Hadavi, S.; Kaplan, R. Neighborhood satisfaction and use patterns in urban public outdoor spaces: Multidimensionality and two-way relationships. Urban For. Urban Green. 2016, 19, 110–122. [Google Scholar] [CrossRef] [Green Version]
  27. Montgomery, C. Happy City: Transforming Our Lives through Urban Design; Penguin: London, UK, 2013; ISBN 0141957158. [Google Scholar]
  28. Birenboim, A. The influence of urban environments on our subjective momentary experiences. Environ. Plan. B Urban Anal. City Sci. 2018, 45, 915–932. [Google Scholar] [CrossRef]
  29. de Groot, H.L.F.; Marlet, G.; Teulings, C.; Vermeulen, W. The consumer city. Cities Urban Land Prem. 2015, 1, 58–75. [Google Scholar] [CrossRef]
  30. Giles-Corti, B.; Broomhall, M.H.; Knuiman, M.; Collins, C.; Douglas, K.; Ng, K.; Lange, A.; Donovan, R.J. Increasing walking: How important is distance to, attractiveness, and size of public open space? Am. J. Prev. Med. 2005, 28, 169–176. [Google Scholar] [CrossRef]
  31. Fan, Y.; Khattak, A.J. Does urban form matter in solo and joint activity engagement? Landsc. Urban Plan. 2009, 92, 199–209. [Google Scholar] [CrossRef]
  32. Van den Berg, A.E.; Jorgensen, A.; Wilson, E.R. Evaluating restoration in urban green spaces: Does setting type make a difference? Landsc. Urban Plan. 2014, 127, 173–181. [Google Scholar] [CrossRef]
  33. Cerin, E.; Saelens, B.E.; Sallis, J.F.; Frank, L.D. Neighborhood Environment Walkability Scale. Med. Sci. Sport. Exerc. 2006, 38, 1682–1691. [Google Scholar] [CrossRef] [PubMed] [Green Version]
  34. Walker, C. The Public Value of Urban Parks; Urban Institute: Washington, DC, USA, 2004; pp. 1–7. [Google Scholar]
  35. Chen, C.L.; Zhang, H. Using emotion to evaluate our community: Exploring the relationship between the affective appraisal of community residents and the community environment. Archit. Eng. Des. Manag. 2018, 14, 256–271. [Google Scholar] [CrossRef]
  36. Schnell, I.; Potchter, O.; Yaakov, Y.; Epstein, Y.; Brener, S.; Hermesh, H. Urban daily life routines and human exposure to environmental discomfort. Environ. Monit. Assess. 2012, 184, 4575–4590. [Google Scholar] [CrossRef]
  37. Stathopoulos, T.; Wu, H.; Zacharias, J. Outdoor human comfort in an urban climate. Build. Environ. 2004, 39, 297–305. [Google Scholar] [CrossRef]
  38. Paunović, K.; Jakovljević, B.; Belojević, G. Predictors of noise annoyance in noisy and quiet urban streets. Sci. Total Environ. 2009, 407, 3707–3711. [Google Scholar] [CrossRef] [PubMed]
  39. Ruotolo, F.; Maffei, L.; Di Gabriele, M.; Iachini, T.; Masullo, M.; Ruggiero, G.; Senese, V.P. Immersive virtual reality and environmental noise assessment: An innovative audio-visual approach. Environ. Impact Assess. Rev. 2013, 41, 10–20. [Google Scholar] [CrossRef]
  40. Cozens, P.M.; Saville, G.; Hillier, D. Crime prevention through environmental design (CPTED): A review and modern bibliography. Prop. Manag. 2005, 23, 328–356. [Google Scholar] [CrossRef] [Green Version]
  41. Wright Wendel, H.E.; Zarger, R.K.; Mihelcic, J.R. Accessibility and usability: Green space preferences, perceptions, and barriers in a rapidly urbanizing city in Latin America. Landsc. Urban Plan. 2012, 107, 272–282. [Google Scholar] [CrossRef]
  42. Weijs-Perrée, M.; Dane, G.; van den Berg, P. Analyzing the relationships between citizens’ emotions and their momentary satisfaction in urban public spaces. Sustainability 2020, 12, 7921. [Google Scholar] [CrossRef]
  43. Weziak-Białowolska, D. Quality of life in cities—Empirical evidence in comparative European perspective. Cities 2016, 58, 87–96. [Google Scholar] [CrossRef]
  44. Sugiyama, T.; Leslie, E.; Giles-Corti, B.; Owen, N. Associations of neighbourhood greenness with physical and mental health: Do walking, social coherence and local social interaction explain the relationships? J. Epidemiol. Community Health 2008, 62, e9. [Google Scholar] [CrossRef] [PubMed] [Green Version]
  45. Qin, J.; Zhou, X.; Sun, C.; Leng, H.; Lian, Z. Influence of green spaces on environmental satisfaction and physiological status of urban residents. Urban For. Urban Green. 2013, 12, 490–497. [Google Scholar] [CrossRef]
  46. Weijs-perrée, M.; Van De Koevering, J.; Appel-meulenbroek, R. Analysing user preferences for co-working space characteristics. Build. Res. Inf. 2019, 47, 534–548. [Google Scholar] [CrossRef] [Green Version]
  47. Arentze, T.A. Individuals’ social preferences in joint activity location choice: A negotiation model and empirical evidence. J. Transp. Geogr. 2015, 48, 76–84. [Google Scholar] [CrossRef]
  48. Ossokina, I.; Arentze, T.; Van Gameren, D.; Van, D. Best living concepts for elderly homeowners Combining a stated choice experiment with architectural design. J. Hous. Built Environ. 2020, 35, 847–865. [Google Scholar] [CrossRef] [Green Version]
  49. van den Berg, P.; Kemperman, A.; de Kleijn, B.; Borgers, A. Locations that support social activity participation of the aging population. Int. J. Environ. Res. Public Health 2015, 12, 10432–10449. [Google Scholar] [CrossRef] [Green Version]
  50. Houtkamp, J. Affective Appraisal of Virtual Environments. Ph.D. Thesis, Universiteit Utrecht, Utrecht, The Netherlands, 2012. [Google Scholar]
  51. Carneiro, J.; Saraiva, P.; Conceição, L.; Santos, R.; Marreiros, G.; Novais, P. Predicting satisfaction: Perceived decision quality by decision-makers in Web-based group decision support systems. Neurocomputing 2019, 338, 399–417. [Google Scholar] [CrossRef]
  52. Gehl, J. Life Between Buildings Using Public Space. Available online: https://www.academia.edu/29430383/jan_Gehl_Life_Between_Buildings (accessed on 15 April 2022).
  53. Peschardt, K.K.; Stigsdotter, U.K. Associations between park characteristics and perceived restorativeness of small public urban green spaces. Landsc. Urban Plan. 2013, 112, 26–39. [Google Scholar] [CrossRef]
  54. Declet-Barreto, J.; Brazel, A.J.; Martin, C.A.; Chow, W.T.L.; Harlan, S.L. Creating the park cool island in an inner-city neighborhood: Heat mitigation strategy for Phoenix, AZ. Urban Ecosyst. 2013, 16, 617–635. [Google Scholar] [CrossRef]
  55. Pfeiffer, D.; Cloutier, S. Planning for Happy Neighborhoods. J. Am. Plan. Assoc. 2016, 82, 267–279. [Google Scholar] [CrossRef]
  56. Todorova, A.; Asakawa, S.; Aikoh, T. Preferences for and attitudes towards street flowers and trees in Sapporo, Japan. Landsc. Urban Plan. 2004, 69, 403–416. [Google Scholar] [CrossRef]
  57. Birenboim, A.; Dijst, M.; Ettema, D.; de Kruijf, J.; de Leeuw, G.; Dogterom, N. The utilization of immersive virtual environments for the investigation of environmental preferences. Landsc. Urban Plan. 2019, 189, 129–138. [Google Scholar] [CrossRef]
  58. Laumann, K.; Gärling, T.; Stormark, K.M. Selective attention and heart rate responses to natural and urban environments. J. Environ. Psychol. 2003, 23, 125–134. [Google Scholar] [CrossRef]
  59. Dunton, G.F.; Almanza, E.; Jerrett, M.; Wolch, J.; Pentz, M.A. Neighborhood Park Use by Children Use of Accelerometry and Global Positioning Systems. Am. J. Prev. Med. 2014, 46, 136–142. [Google Scholar] [CrossRef] [Green Version]
  60. Perini, K.; Ottelé, M.; Haas, E.M.; Raiteri, R. Vertical greening systems, a process tree for green façades and living walls. Urban Ecosyst. 2013, 16, 265–277. [Google Scholar] [CrossRef]
  61. Ling, T.Y.; Chiang, Y.C. Well-being, health and urban coherence-advancing vertical greening approach toward resilience: A design practice consideration. J. Clean. Prod. 2018, 182, 187–197. [Google Scholar] [CrossRef]
  62. Weijs-perr, M.; Dane, G.; Van Den Berg, P. A Multi-Level Path Analysis of the Relationships between the Momentary Experience Characteristics, Satisfaction with Urban Public Spaces, and Momentary- and Long-Term Subjective Wellbeing. Int. J. Environ. Res. Public Health 2019, 16, 3621. [Google Scholar] [CrossRef] [PubMed] [Green Version]
  63. Vittersø, J.; Vorkinn, M.; Vistad, O.I.; Vaagland, J. Tourist experiences and attractions. Ann. Tour. Res. 2000, 27, 432–450. [Google Scholar] [CrossRef]
  64. Dane, G.; Borgers, A. Subjective Immediate Experiences during Large-Scale Cultural Events in Cities: A Geotagging Experiment. Sustainability 2019, 11, 5698. [Google Scholar] [CrossRef] [Green Version]
  65. Chhetri, P.; Arrowsmith, C.; Jackson, M. Determining hiking experiences in nature-based tourist destinations. Tour. Manag. 2004, 25, 31–43. [Google Scholar] [CrossRef]
  66. Westbrook, R.A.; Oliver, R.L.; Westbrook, R.A.; Oliver, R.L. The Dimensionality of Consumption Emotion Patterns and Consumer Satisfaction. J. Consum. Res. 1991, 18, 84–91. [Google Scholar] [CrossRef]
  67. Amérigo, M.; Aragones, J.I. A Theoretical and Methodological Approach to the Study of Residential Satisfaction|Elsevier Enhanced Reader. J. Environ. Psychol. 1997, 17, 47–57. [Google Scholar] [CrossRef]
  68. Hur, M.; Nasar, J.L.; Chun, B. Neighborhood satisfaction, physical and perceived naturalness and openness. J. Environ. Psychol. 2010, 30, 52–59. [Google Scholar] [CrossRef]
  69. McCormack, G.R.; Giles-Corti, B.; Bulsara, M. The relationship between destination proximity, destination mix and physical activity behaviors. Prev. Med. 2008, 46, 33–40. [Google Scholar] [CrossRef] [Green Version]
  70. Ettema, D.; Smajic, I. Walking, places and wellbeing. Geogr. J. 2015, 181, 102–109. [Google Scholar] [CrossRef]
  71. Kaczynski, A.T.; Potwarka, L.R.; Saelens, B.E. Association of Park Size, Distance, and Features with Physical Activity in Neighborhood Parks. Am. J. Public Health 2008, 98, 1451–1456. [Google Scholar] [CrossRef] [PubMed]
  72. Sepe, M. Placemaking, livability and public spaces. Achieving sustainability through happy places. J. Public Space 2017, 2, 63. [Google Scholar] [CrossRef] [Green Version]
  73. Tinsley, H.E.A.; Tinsley, D.J.; Croskeys, C.E. Park usage, social milieu, and psychosocial benefits of park use reported by older urban park users from four ethnic groups. Leis. Sci. 2002, 24, 199–218. [Google Scholar] [CrossRef]
  74. Ode, Å.; Fry, G.; Tveit, M.S.; Messager, P.; Miller, D. Indicators of perceived naturalness as drivers of landscape preference. J. Environ. Manag. 2009, 90, 375–383. [Google Scholar] [CrossRef]
  75. Wang, R.; Zhao, J.; Liu, Z. Consensus in visual preferences: The effects of aesthetic quality and landscape types. Urban For. Urban Green. 2016, 20, 210–217. [Google Scholar] [CrossRef]
  76. Karuppannan, S.; Sivam, A. Social sustainability and neighbourhood design: An investigation of residents’ satisfaction in Delhi. Local Environ. 2011, 16, 849–870. [Google Scholar] [CrossRef]
  77. Motoyama, Y.; Hanyu, K. Does public art enrich landscapes? The effect of public art on visual properties and affective appraisals of landscapes. J. Environ. Psychol. 2014, 40, 14–25. [Google Scholar] [CrossRef]
  78. Pánek, J.; Pászto, V.; Marek, L. Mapping Emotions: Spatial Distribution of Safety Perception in the City of Olomouc. In The Rise of Big Spatial Data; Springer: Cham, Switzerland, 2017; pp. 211–224. [Google Scholar] [CrossRef]
  79. Shoval, N.; Schvimer, Y.; Tamir, M. Tracking technologies and urban analysis: Adding the emotional. Cities 2018, 72, 34–42. [Google Scholar] [CrossRef]
  80. Koenig-Lewis, N.; Palmer, A. Experiential values over time—A comparison of measures of satisfaction and emotion. J. Mark. Manag. 2008, 24, 69–85. [Google Scholar] [CrossRef]
  81. Lin, C.; Zhao, G.; Yu, C.; Wu, Y.J. Smart city development and residents’well-being. Sustainability 2019, 11, 676. [Google Scholar] [CrossRef] [Green Version]
  82. Weijs-Perrée, M.; Appel-Meulenbroek, R.; Arentze, T.; Romme, G. The influence of the physical work environment of business centres on social networking and knowledge sharing in the Netherlands. Intell. Build. Int. 2019, 11, 105–125. [Google Scholar] [CrossRef]
  83. Bosselmann, P.; Flores, J.; Gray, W. Sun, Wind, and Comfort a Study of Open Spaces and Sidewalks in Four Downtown Areas; Institute of Urban and Regional Development, College of Environmental Design, University of California: Berkeley, CA, USA, 1984; Volume 15. [Google Scholar]
  84. Paviotti, M.; Vogiatzis, K. On the outdoor annoyance from scooter and motorbike noise in the urban environment. Sci. Total Environ. 2012, 430, 223–230. [Google Scholar] [CrossRef]
  85. Echevarria Sanchez, G.M.; Van Renterghem, T.; Sun, K.; De Coensel, B.; Botteldooren, D. Using Virtual Reality for assessing the role of noise in the audio-visual design of an urban public space. Landsc. Urban Plan. 2017, 167, 98–107. [Google Scholar] [CrossRef] [Green Version]
  86. Maas, J.; Spreeuwenberg, P.; Van Winsum-Westra, M.; Verheij, R.A.; de Vries, S.; Groenewegen, P.P. Is green space in the living environment associated with people’s feelings of social safety? Environ. Plan. A 2009, 41, 1763–1777. [Google Scholar] [CrossRef] [Green Version]
  87. Hull, R.B.; Stewart, W.P. The Landscape Encountered and Experienced While Hiking. Environ. Behav. 1995, 27, 404–426. [Google Scholar] [CrossRef]
  88. Veitch, J.; Salmon, J.; Deforche, B.; Ghekiere, A.; Van Cauwenberg, J.; Bangay, S.; Timperio, A. Park attributes that encourage park visitation among adolescents: A conjoint analysis. Landsc. Urban Plan. 2017, 161, 52–58. [Google Scholar] [CrossRef]
  89. Tabrizian, P.; Baran, P.K.; Smith, W.R.; Meentemeyer, R.K. Exploring perceived restoration potential of urban green enclosure through immersive virtual environments. J. Environ. Psychol. 2018, 55, 99–109. [Google Scholar] [CrossRef]
  90. Maat, K.; de Vries, P. The influence of the residential environment on green-space travel: Testing the compensation hypothesis. Environ. Plan. A 2006, 38, 2111–2127. [Google Scholar] [CrossRef]
  91. Curl, A.; Fitt, H.; Tomintz, M. Experiences of the built environment, falls and fear of falling outdoors among older adults: An exploratory study and future directions. Int. J. Environ. Res. Public Health 2020, 17, 1224. [Google Scholar] [CrossRef] [PubMed] [Green Version]
  92. Lin, B.B.; Fuller, R.A.; Bush, R.; Gaston, K.J.; Shanahan, D.F. Opportunity or orientation? Who uses urban parks and why. PLoS ONE 2014, 9, e87422. [Google Scholar] [CrossRef] [PubMed] [Green Version]
  93. Poortinga, W.; Bird, N.; Hallingberg, B.; Phillips, R.; Williams, D. The role of perceived public and private green space in subjective health and wellbeing during and after the first peak of the COVID-19 outbreak. Landsc. Urban Plan. 2021, 211, 104092. [Google Scholar] [CrossRef]
  94. Patterson, Z.; Darbani, J.M.; Rezaei, A.; Zacharias, J.; Yazdizadeh, A. Comparing text-only and virtual reality discrete choice experiments of neighbourhood choice. Landsc. Urban Plan. 2017, 157, 63–74. [Google Scholar] [CrossRef]
  95. Small and Relatively Expensive Housing in Amsterdam. Available online: https://www.cbs.nl/en-gb/news/2016/14/small-and-relatively-expensive-housing-in-amsterdam (accessed on 20 March 2022).
  96. Diener, E. Subjective well-being: The science of happiness and a proposal for a national index. Am. Psychol. 2000, 55, 34–43. [Google Scholar] [CrossRef]
  97. Leisch, F. FlexMix: A general framework for finite mixture models and latent class regression in R. J. Stat. Softw. 2004, 11, 1–18. [Google Scholar] [CrossRef] [Green Version]
  98. DeSarbo, W.S.; Cron, W.L. A maximum likelihood methodology for clusterwise linear regression. J. Classif. 1988, 5, 249–282. [Google Scholar] [CrossRef]
  99. StatLine—Kerncijfers Wijken en Buurten. 2021. Available online: https://opendata.cbs.nl/#/CBS/nl/dataset/85039NED/table (accessed on 28 March 2022).
  100. Kock, F.; Berbekova, A.; Assaf, A.G. Understanding and managing the threat of common method bias: Detection, prevention and control. Tour. Manag. 2021, 86, 104330. [Google Scholar] [CrossRef]
  101. Lindell, M.K.; Whitney, D.J. Accounting for common method variance in cross-sectional research designs. J. Appl. Psychol. 2001, 86, 114–121. [Google Scholar] [CrossRef] [PubMed] [Green Version]
  102. Rahnema, S.; Sedaghathoor, S.; Allahyari, M.S.; Damalas, C.A.; Bilali, H. El Preferences and emotion perceptions of ornamental plant species for green space designing among urban park users in Iran. Urban For. Urban Green. 2019, 39, 98–108. [Google Scholar] [CrossRef]
Figure 1. Screenshots of the Alternative 4 video at the 1st second (left) and the 30th seconds (middle), and the profile (right).
Sustainability 14 04938 g001
Figure 2. Screenshot of the satisfaction and emotion scales.
Sustainability 14 04938 g002
Figure 3. Clustered chart of coefficients of spatial attributes in the three latent classes model.
Sustainability 14 04938 g003
Table 1. Sub hypotheses of Hypothesis 1.
H1aThe size of open spaces positively influences individuals’ momentary experiences in neighborhood public spaces.
H1bThe grass surface of open spaces, compared with pavement surface, positively influences individuals’ momentary experiences in neighborhood public spaces.
H1cThe presence of water positively influences individuals’ momentary experiences in neighborhood public spaces.
H1dThe grass along the street, compared with no grass, positively influences individuals’ momentary experiences in neighborhood public spaces.
H1eThe presence of trees positively influences individuals’ momentary experiences in neighborhood public spaces.
H1fThe presence of vertical greening positively influences individuals’ momentary experiences in neighborhood public spaces.
H1gThe building height around open spaces negatively influences individuals’ momentary experiences in neighborhood public spaces.
Table 2. Attributes and levels.
TypeAttributesAttributes Levels
Open spaceA1 Size of open spaceLevel 0: 750 m2Level 1: 1500 m2
A2 Surface material of open spaceLevel 0: PavementLevel 1: Grass
A3 WaterLevel 0: NoLevel 1: Yes
StreetA4 Grass along the streetLevel 0: no grassLevel 1: grass
A5 TreesLevel 0: NoLevel 1: Yes
BuildingA6 Vertical greening Level 0: NoLevel 1: Yes
A7 Height of buildingsLevel 0: 3 storiesLevel 1: 6 stories
Table 3. Sample characteristics.
VariableLevelsSampleCities with 100,000 or more Inhabitants, Netherlands *
AgeMean46.8 (min = 19, max = 84)
15–24 6.6%13.5%
25–4439.6%29.3%
45–6437.7%25.6%
65 or older15.8%16.3%
GenderMale48.6%49.6%
Household compositionSingle26.3%46.1%
Multi-person with children30.1%29.0%
Multi-person without children34.5%24.8%
Ethnic groupHave Dutch background91.8%
Education levelBasic0.6%
Secondary14.1%
Pre-vocational education13.5%
Junior college28.2%
College42.6%
Household IncomeLess than 10,000 euros2.8%
10,000 to 29,999 euros24%
30,000 to 49,999 euros29.2%
50,000 euros or more 32.5%
House ownershipOwner-occupied61.1%
Rented37.9%
Private gardenYes55.8%
DisabilitiesYes, somewhat limited by this8.5%
Yes, extremely limited by this3.1%
Total 316
* (Statistics Netherlands, January 2021).
Table 4. Factor Loadings.
ItemFactor 1
I enjoy walking in this street block. (Walk)0.906
The environment of this street block is beautiful and delightful. (Art) 0.909
I can think of many different activities to do in this street block. (Activities)0.765
I feel this street block can provide me enough cool air and shades in hot weather. (Cool)0.706
I felt happy.0.899
I felt comfortable.0.873
I felt annoyed.−0.519
I felt safe.0.664
Table 5. Statistics for latent class regression models (sum score of satisfaction and emotion).
No. of Class (K)Parameters (B)Log Likelihood (LL) AICBIC
19−1705.03428.13474.4
219−1504.43046.83144.7
329−1426.52911.03060.4
439−1385.62849.03050.0
N = 1264 observations.
Table 6. Estimation results of the one-class and three-class model (factor score of momentary experiences).
One-Class ModelThree Latent Classes Model
Class 1
Diverse Preferences
Class 2
Green Preference
Class 3
Trees Preference
Coefficient p-ValueB sigBsigBSig
Constant (base score)−0.631 ***0.000−0.539 ***0.000−1.501 ***0.0000.844 ***0.000
Larger open space0.0250.6330.137 **0.020−0.0500.6640.0720.253
Has grass surface0.199 ***0.0000.211 ***0.0000.298 ***0.0040.0700.256
Has water 0.138 ***0.0080.215 ***0.0010.0830.492−0.0320.674
Has grass along the street0.0550.2860.0710.226−0.0340.7490.0910.167
Has trees0.554 ***0.0000.531 ***0.0000.724 ***0.0000.215 ***0.000
Has vertical green on façades0.246 ***0.0000.295 ***0.0000.265 **0.0120.0560.456
Higher buildings0.0520.3240.0640.2850.1070.293−0.0380.630
Class membership probability10.515 ***0.0000.335 ***0.0000.149 ***0.000
McFadden Rho20.1590.297
Adj. McFadden Rho20.1530.280
***, ** ==> Significance at 1%, 5% level.
Table 7. Relationship between class membership, socio-demographics and satisfaction of current living environment (factor score of satisfaction and emotion).
Class 1
Diverse Preferences
Class 2
Green Preference
Class 3
Tree Preference
p-Value of χ2 or F Value
AgeMean46.2047.9047.040.379 (0.685)
GenderMale52.9%45.2%50.0%1.562 (0.458)
Private gardenYes61.3%73.3%59.6%2.516 (0.082)
Satisfaction with lifeMean25.1022.0526.4510.778 (0.000)
Satisfaction: amount of green in your neighborhoodMean3.983.774.284.109 (0.017)
Satisfaction: quality of green in your neighborhoodMean3.883.534.156.828 (0.001)
satisfaction: amount of green in the cityMean3.473.303.722.498 (0.084)
Satisfaction: quality of green in the cityMean3.603.203.777.115 (0.001)
Degree of urbanizationNot or hardly urbanized 10.20%12.00%8.60%30.586 (0.000)
Moderately urbanized 13.10%9.00%14.90%
Strongly urbanized 76.80%79.00%76.60%
Publisher’s Note: MDPI stays neutral with regard to jurisdictional claims in published maps and institutional affiliations.

