
Mapping the Potential of High-Reflective Roof Coverings in Residential Buildings in Italy


Energy Efficiency Unit Department (DUEE), Italian National Agency for New Technologies, Energy and Sustainable Economic Development (ENEA), Via Martiri di Monte Sole 4, 40129 Bologna, Italy
*
Author to whom correspondence should be addressed.
Sustainability 2022, 14(9), 4969; https://0-doi-org.brum.beds.ac.uk/10.3390/su14094969
Submission received: 7 February 2022
/
Revised: 17 March 2022
/
Accepted: 29 March 2022
/
Published: 21 April 2022
(This article belongs to the Special Issue Strategies for Increasing the Sustainability of the Built Environment)
Abstract
:The current warming trend of the earth’s climate is making it increasingly necessary to focus on solutions to improve indoor comfort while reducing energy demand for buildings during the hot season. The use of high-reflective products on the building envelope, and particularly on the roof, has been suggested as a potential solution. The overall impact of using high-reflective products on roofs largely depends on the local climatic conditions and on the characteristics of the building, making it difficult to determine whether the use of these products is beneficial without the use of detailed modelling approaches. In this context, this study aims to propose a method to provide indications for designers and policymakers to make early decisions on the potential benefits of the use of high-reflective products on residential buildings, based on simple and readily-available climatic data of the location. The approach, based on the use of state-of-the-art simulation software, allows researchers to obtain a multi-linear regression of the effect of high-reflective products on roofs as a function of the heating degree days and of the local value of the climate vector. The approach is applied to the case of the Italian territory, where a block-of-flats is selected as the reference building, with features common to a significant part of the national residential stock. The proposed approach allows for the provision of a quantitative estimate of the expected impact of high-reflective roof coverings on the energy performance of residential buildings in all Italian municipalities. The analysis shows that high-reflective products on roofs are likely to reduce the building annual energy demand for heating and cooling in 9% to 25% of Italian municipalities, depending on the building energy renovation state. The proposed approach, whose results are expressed also by means of thematic maps, can be replicated to other geographic areas and can be extended to different energy saving technologies.
1. Introduction
1.1. Background
In the context of fighting the current climate emergency and limiting the impact of human activities on the climate, a large focus needs to be placed on buildings. As of 2019, buildings represented approximately 35% of the global energy use (including residential buildings, non-residential buildings, and the building construction industry) and approximately 38% of global CO emissions [1].
As global temperatures grow and summers become hotter, building cooling is taking an increasingly large share of the overall building energy demand. While space heating is a well investigated field of research for most countries located in temperate climates, there is relatively little information for what concerns cooling demands. Werner [2] estimated a potential total demand for space cooling in the European Union of about 1000 TWh/year. For the case of Switzerland, Frank [3] estimated that a 4.4 °C rise in the yearly mean temperatures would lead to an increase in office building energy demands ranging between 223% and 1050%, with heating energy demands decreasing by 33% to 44% in the same scenarios. A similar analysis conducted by Mutschler et al. [4] led to the conclusion that space cooling demand in Switzerland could add up to between 3 and 17.5 TWh by the middle of the 21st century and in the most extreme cases would become comparable with heating energy demands.
The use of products with high reflectance to solar radiation and high spectral emittance (named “cool” products) is largely promoted on urban surfaces, in order to reduce the difference of temperature between the urban built environment and surrounding areas [5]. The energy consumption of buildings is influenced by the mitigation of this overheating, but “cool” products also have a direct impact on the energy demand of the building, if they are used on its envelope components [6].
On the one hand, higher solar reflectance increases the amount of solar radiation that a surface is able to reflect diffusely. On the other hand, higher thermal emittance results in enhancing the ability of a surface to radiate the absorbed solar energy [7]. Therefore, “cool” envelope components reduce the building energy demand for cooling but increase that for space heating, and several studies have confirmed that the effectiveness of “cool” products—as a measure of the energy efficiency of buildings—is strictly related to the climate zone where the building is located [8]. In order to overcome this limitation and extend the benefits of “cool” envelope products to the cases with prevalent demand for space heating, switchable “cool” materials are being studied in addition to the static ones [7,9].
1.2. Review of Relevant Literature
Several studies investigate the optimization of “cool” products. Their focus may be on the combination of “cool products” with other energy upgrade measures, such as thermal insulation [10] or phase change materials [11], or on the comparison with alternative passive technologies for the envelope [8]. However, many studies concentrate on analysing “cool” products and optimizing their use in relation to the climate zone, generally by comparing energy simulations carried out in a definite number of locations [12].
Ascione et al. [13] propose a surface factor as a function of climate conditions, namely the intensity of summer solar radiation and the number of heating degree days, with the latter expressing duration and intensity of the heating season. The surface factor is based on building energy simulations carried out in the climate conditions of ten locations and it is verified through simulations for twenty further places. The developed criterion was intended as a simple design tool for selecting the external coating of the building envelope as a function of outdoor climatic conditions, without software analysis. Ding et al. [8] have recently combined climate zone and wall orientation as parameters to examine the effectiveness of reflective coatings used as wall finishing.
The existing studies provide relevant data to support the designer in properly implementing “cool” products in new buildings or in the energy renovation of the existing ones. Nonetheless, studies generally compare a small number of locations and use them as representative for different climate zones. Consequently, there is limited information about the effectiveness of “cool” products by varying climate parameters in the same zone. This is also the case because the examination of this aspect is absorbed in the detailed study of each building.
Since the effect of cool materials depends on multiple factors, ranging from the climate zone to peculiarities of the building envelope, a detailed analysis is necessary to identify the energy efficiency solutions with the best balance of technical feasibility, economic effectiveness, and environmental impact. Design support tools have been proposed to help in the selection of the best alternatives or to help with combining different solutions, while well-established methodologies extend the analysis to the perspective of the life cycle. In order to develop strategies promoting the energy efficiency of buildings, technical solutions and their effectiveness should also be examined on a territorial scale, taking into account the main features of the building stock together with climate parameters and their expected changes over time. Being passive as guidelines and interactive as platforms and software [14], these tools are mainly related to the policy level, where they support design strategies, identify priorities, and select measures to promote in relation to local or territorial conditions.
1.3. Aim
This research aims to examine the potential energy savings resulting from the application of high-reflective products to the opaque envelope of buildings. The purpose is providing regulators and stakeholders with guidelines, where the effectiveness of the analysed solution is related to the variation of climate conditions on a territorial scale. In this study, the proposed methodology is applied to the case of Italy.
The derived methodology can be extended to multiple energy efficiency solutions and building typologies. This is intended as the basis of a tool to support strategies promoting the energy efficiency of the building stock.
2. Materials and Methods
The methodology developed in this study is based on the identification of a reference building, which is able to represent the largest part of the Italian stock of existing, non-historic residential buildings (Section 2.1).
EnergyPlus [15] was used to develop a numerical model of the reference building, in order to carry out sets of annual energy dynamic simulations. These ones were performed for locations with available and comparable climate data that were adequate for annual simulations with hourly time step; among the almost 8000 Italian municipalities, the 75 sites with climate file in EnergyPlus database [16] were selected.
The objective of the simulations was to estimate the effect of increasing roof surface reflectance on the energy demand of the building. These simulations were performed by varying a selection of the modelling assumptions: the location of the building, which influences the climatic conditions; and the building’s parameters (such as number of floors, the building’s orientation), which are described more in detail in Section 2.2.
In order to extrapolate results for the entire Italian territory from the outcomes obtained for the selected locations, findings of the simulations were used to derive linear regressions, which link the net yearly effect of high-reflective roof coverings on the building energy demand to climate data available for all of Italy. For this purpose, heating degree days (HDD) [17] and magnitude of the climate vector [18] were used (Section 2.3).
2.1. Reference Building
The reference building was identified, for the Italian residential stock, through data collected for the 2011 national census on population and housing [19]. For the purpose of this research, census data were not used to deduce the most frequent building type of the Italian stock, because the result would not have been necessarily suitable for very different built environments, such as big towns and small villages. Census data were used to find recurrent size and construction features to be used as a basis for a building type adaptable to different contexts.
2.1.1. Building Size and Morphology
The open access census database does not allow one to explore data on the residential building stock by distinguishing rural from urban areas or centre from neighbourhood. Although the greatest group consists of two-storey houses, buildings with four storeys are prevalent in the most populated Italian towns. Since relevant features of the model (ground floor area, number of dwellings in the building, number of dwellings per storey) are connected to the number of floors, data from the biggest towns were preferred to the general ones. In this way, the number of storeys could be varied in simulations without becoming incompatible with the other features of the reference building.
In the top ten Italian towns for population, as far as buildings with at least four storeys are concerned, the most frequent case is that of 16 or more dwellings and one staircase.
Furthermore, in all macro-areas of the country, the prevalent size of dwelling ranges from 80 m2 to 99 m2 and the database does not relate this feature to the number of storeys. Consequently, a net floor area of 90 m2 was considered.
Based on these features, it was assumed that the reference building is made of 18 dwellings (close to the definition of “16 or more”), three per floor on six storeys, with no basement (Figure 1). The net area of each floor is 300 m2, accounting for 30 m2 of staircase and lift. Constant in all simulations of this study, the net floor area is obtained through a rectangle 11.4 × 29.4 m. The corresponding gross floor area is approximately 12 m × 30 m, since the external walls are 29-cm-thick (Table 1).
Differently from the ground floor area, the number of floors ranges from three to seven in the simulations, and the number of dwellings is consequential. Net height of each storey was set at 2.70 m—the minimum allowed by the Italian regulation—and thickness of floor was set at 30 cm.
Since this research is focused on the application of reflective products, such as roof coverings, the surface ratio between the openings and the opaque envelope is not considered as a variable in the model and accounts for 21%. This value complies with the minimum requirement of Italian regulation (D.M. 05/07/1975), which states that openings must correspond to at least 12.5% of net floor area in each room of a house.
2.1.2. Construction Features
Census data about building age was used to characterize the construction features of the model. The public database does not allow one to relate this information to the other features discussed and shows that the residential buildings dating back to 1971–1980 are the prevalent group. Therefore, it was assumed that the structure of the reference building is a reinforced concrete frame, which is the most used solution in Italian residential construction after the Second World War.
Composition and thermal features of opaque envelope components, summarized in Table 1, are based on the Italian technical report UNI/TR 11552:2014. The inner partition among dwellings or between dwelling and staircase has no correspondence in this standard but uses its thermal data.
As far as openings are concerned, aluminium frame without thermal break (Uf = 7.0 W·m−2·K−1) and 4-mm double glass with 12-mm air gap (Ug = 2.8 W·m−2·K−1) were modeled with thermal transmittance Uw = 3.7 W·m−2·K−1, in the hypothesis that the frame corresponds to 20% of the surface of the window. The use of aluminium for windows is quite common starting in the late 1970s and the study is able to take into account a rate of substitution of windows during the first decades after building construction.
2.1.3. Energy Systems for Heating and Cooling and Operational Schedules
Based on the assumption that the building dates back to the 1970s, the following energy systems are modelled:
- Centralized heating system (natural gas boiler) with radiators;
- Centralized water heating system (natural gas boiler);
- Decentralized systems for summer air conditioning, based on a compression refrigeration cycle.
The centralized heat generator for space heating is modelled with a load-dependent efficiency curve, according to the parameter “past energy upgrade measures” discussed in Section 2.2.
The decentralized systems for air conditioning are modelled based on a temperature- and load-dependent function. No difference in the air conditioning systems performance is considered between different scenarios.
The equations representing the efficiency curves as mentioned above are reported as follows:
where represents the component’s (boiler or AC compressor) load, the boiler’s efficiency, the AC system’s coefficient of performance, , , and the correction coefficients based on the AC flow factor (defined as the air flow compared to the nominal one), temperatures (wet bulb temperature of the air flow to be cooled and dry bulb ambient temperature ), and load. The coefficients are provided in Table 2. The value chosen for the nominal COP (COP) of the cooling unit is 3.0.
It was supposed that all apartments in the building are used during the whole year and are equipped with both heating and cooling systems.
In the EnergyPlus model, each system was associated to an operational schedule. For space heating, Italian legislation sets the yearly heating period and the maximum number of daily running hours according to the climate zone (from A to F in increasing order of heating degree days). The operational schedule of the heating system complies with this regulation (Figure 2), while the choice of start-and-stop times was based on the authors’ expertise.
Yearly consumption of around 880 m3 domestic hot water (DHW) was estimated according to UNI/TS 11300-2:2019. System size and schedule are consequential.
As far as space cooling is considered, the time limit to the use of this system is not ruled and the contribution of natural ventilation to the achievement of comfortable conditions cannot be neglected. The operational schedules used for cooling system and natural ventilation make it so that windows are open when outdoor temperature is T °C, while the cooling system is on if indoor temperature is T °C. The contemporary satisfaction of both conditions is negligible because of the difference between the two thresholds.
In spring and autumn, when both heating and cooling systems are not used, the same schedule for natural ventilation was set for the entire country (windows open completely from 7 to 8 a.m. and halfway from 4 to 6 p.m.).
2.2. Sets of Simulations
The reference building is made of six storeys and is built with solutions typical to the Italian stock of the 1970s. It is not surrounded by shading elements such as neighbouring buildings, and its main facades (30-m-long) are oriented one to the east and the other to the west.
Three main features are variables of this model: location, roof pitch, and reflectance of roof covering. More in detail, the building model was simulated in 75 Italian locations with available climate file in the database provided by EnergyPlus. In each location, simulations were carried out by considering both the case of flat roof and a slope of 17 degrees (equivalent to 30%), which is frequent in the Italian residential coverings with baked clay tiles. Both conditions—flat and pitched roof—were inspected with two different values of solar reflectance of the roof covering, namely 0.3 and 0.7. The variation of these features results in a basic set of 300 simulations.
The effects of other characteristics, which are relevant to the energy demand of the building for heating and cooling, were inspected by varying a single parameter at each simulation. The analysed features are: building orientation, number of storeys, past energy upgrade measures, height of surrounding buildings, schedule of heating setpoint, and schedule of cooling setpoint. For each of these characteristics, the value adopted in the reference model and its variations are collected in Table 3.
On the one hand, the choice of one-parameter-at-a-time variations excludes the fact that all possible combinations of varied characteristics are considered. On the other hand, this criterion allows the calculations to be limited to a manageable number of simulations, namely 5700, without giving up a sensitivity analysis of results.
The feature “past energy upgrade measures” represents the circumstance that energy upgrade measures were carried out on the building. Two scenarios were considered. In the first one (named “Renovation1”), windows were changed and the gas boiler for space heating was replaced. In the second scenario (“Renovation2”), deep renovation of the reference building was emphasised by applying the current Italian requirements (D.M. 26 June 2015) to both transparent and opaque envelope components; furthermore, class-A condensing boiler was considered for space heating.
2.3. Extrapolation to the Italian Territory
Locations where the simulations were carried out are limited in number, although they are representative of the most populated Italian towns. To make the results useful for planning activities on a territorial scale, all national land needs to be covered. However, weather data available for the rest of the country consists of aggregated statistics, more specifically, the heating degree days (HDD) and the summer climatic vector (SCV).
The HDDs are used in several countries to estimate the severity of climatic conditions of a certain area and are defined as [17]. In Italy, the number of heating degree days (HDDs) associated with each municipality is listed in the attachment A to D.P.R. 412/1993, changed in limited parts in the following years. Although HDDs have been updated by the Italian technical standard UNI 10349-3:2016, values listed in D.P.R. 412/1993 are still in force and are used to divide the national territory into six climate zones.
Increasing the solar reflectance of the roof is expected to have a positive influence on the energy demand for air conditioning during summer. This effect is expected to be larger as summer climatic conditions become more challenging.
The technical standard UNI 10349-3 also defines a climate vector and a climate severity index, whose relationship allows for the estimation of a normalized demand of thermal energy for cooling in each location. The SCV includes considerations related to ambient temperature, ambient humidity, and solar radiation:
Therefore, the number of HDDs and the module of the SCV can be intended as proxy of the amount of energy required for heating in winter and cooling in summer, respectively. Consequently, in this study the number of HDDs and the module of the SCV were employed to derive linear regressions from the outcomes of the simulations carried out for 75 locations, in order to extrapolate results for the entire Italian territory.
Since summer thermal zones are not included in mandatory regulation, while HDDs from D.P.R. 412/1993 are still in force, this research refers to current legislation for HDDs and to UNI 10349-3 for the module of climate vector. Data for all Italian locations are summarized in Figure 3, which shows that the 75 locations with complete EPW weather file mostly cover the variability in both HDD and SCV of Italian municipalities.
Linear regression was derived through the following Equation (10):
By means of a sensitivity analysis, the effect of the model features (roof tilt and the characteristics listed in Table 3) on the coefficients of linear combination were examined. As discussed in the previous part of this text, the sensitivity of the model to its main parameters was calculated using a one-parameter-at-a-time approach in order to limit the number of required simulations. Based on this approach, the net effect of each parameter on each regression coefficient was determined as the absolute difference between the minimum and maximum values obtained. Based on this analysis, different sets of linear regressions were generated in correlation to the features that the coefficients were more sensitive to.
Each regression was used to develop thematic maps for the Italian territory, in order to express the energy convenience of using high-reflective roof coverings in residential buildings, depending on local climate conditions (essentially in terms of temperature).
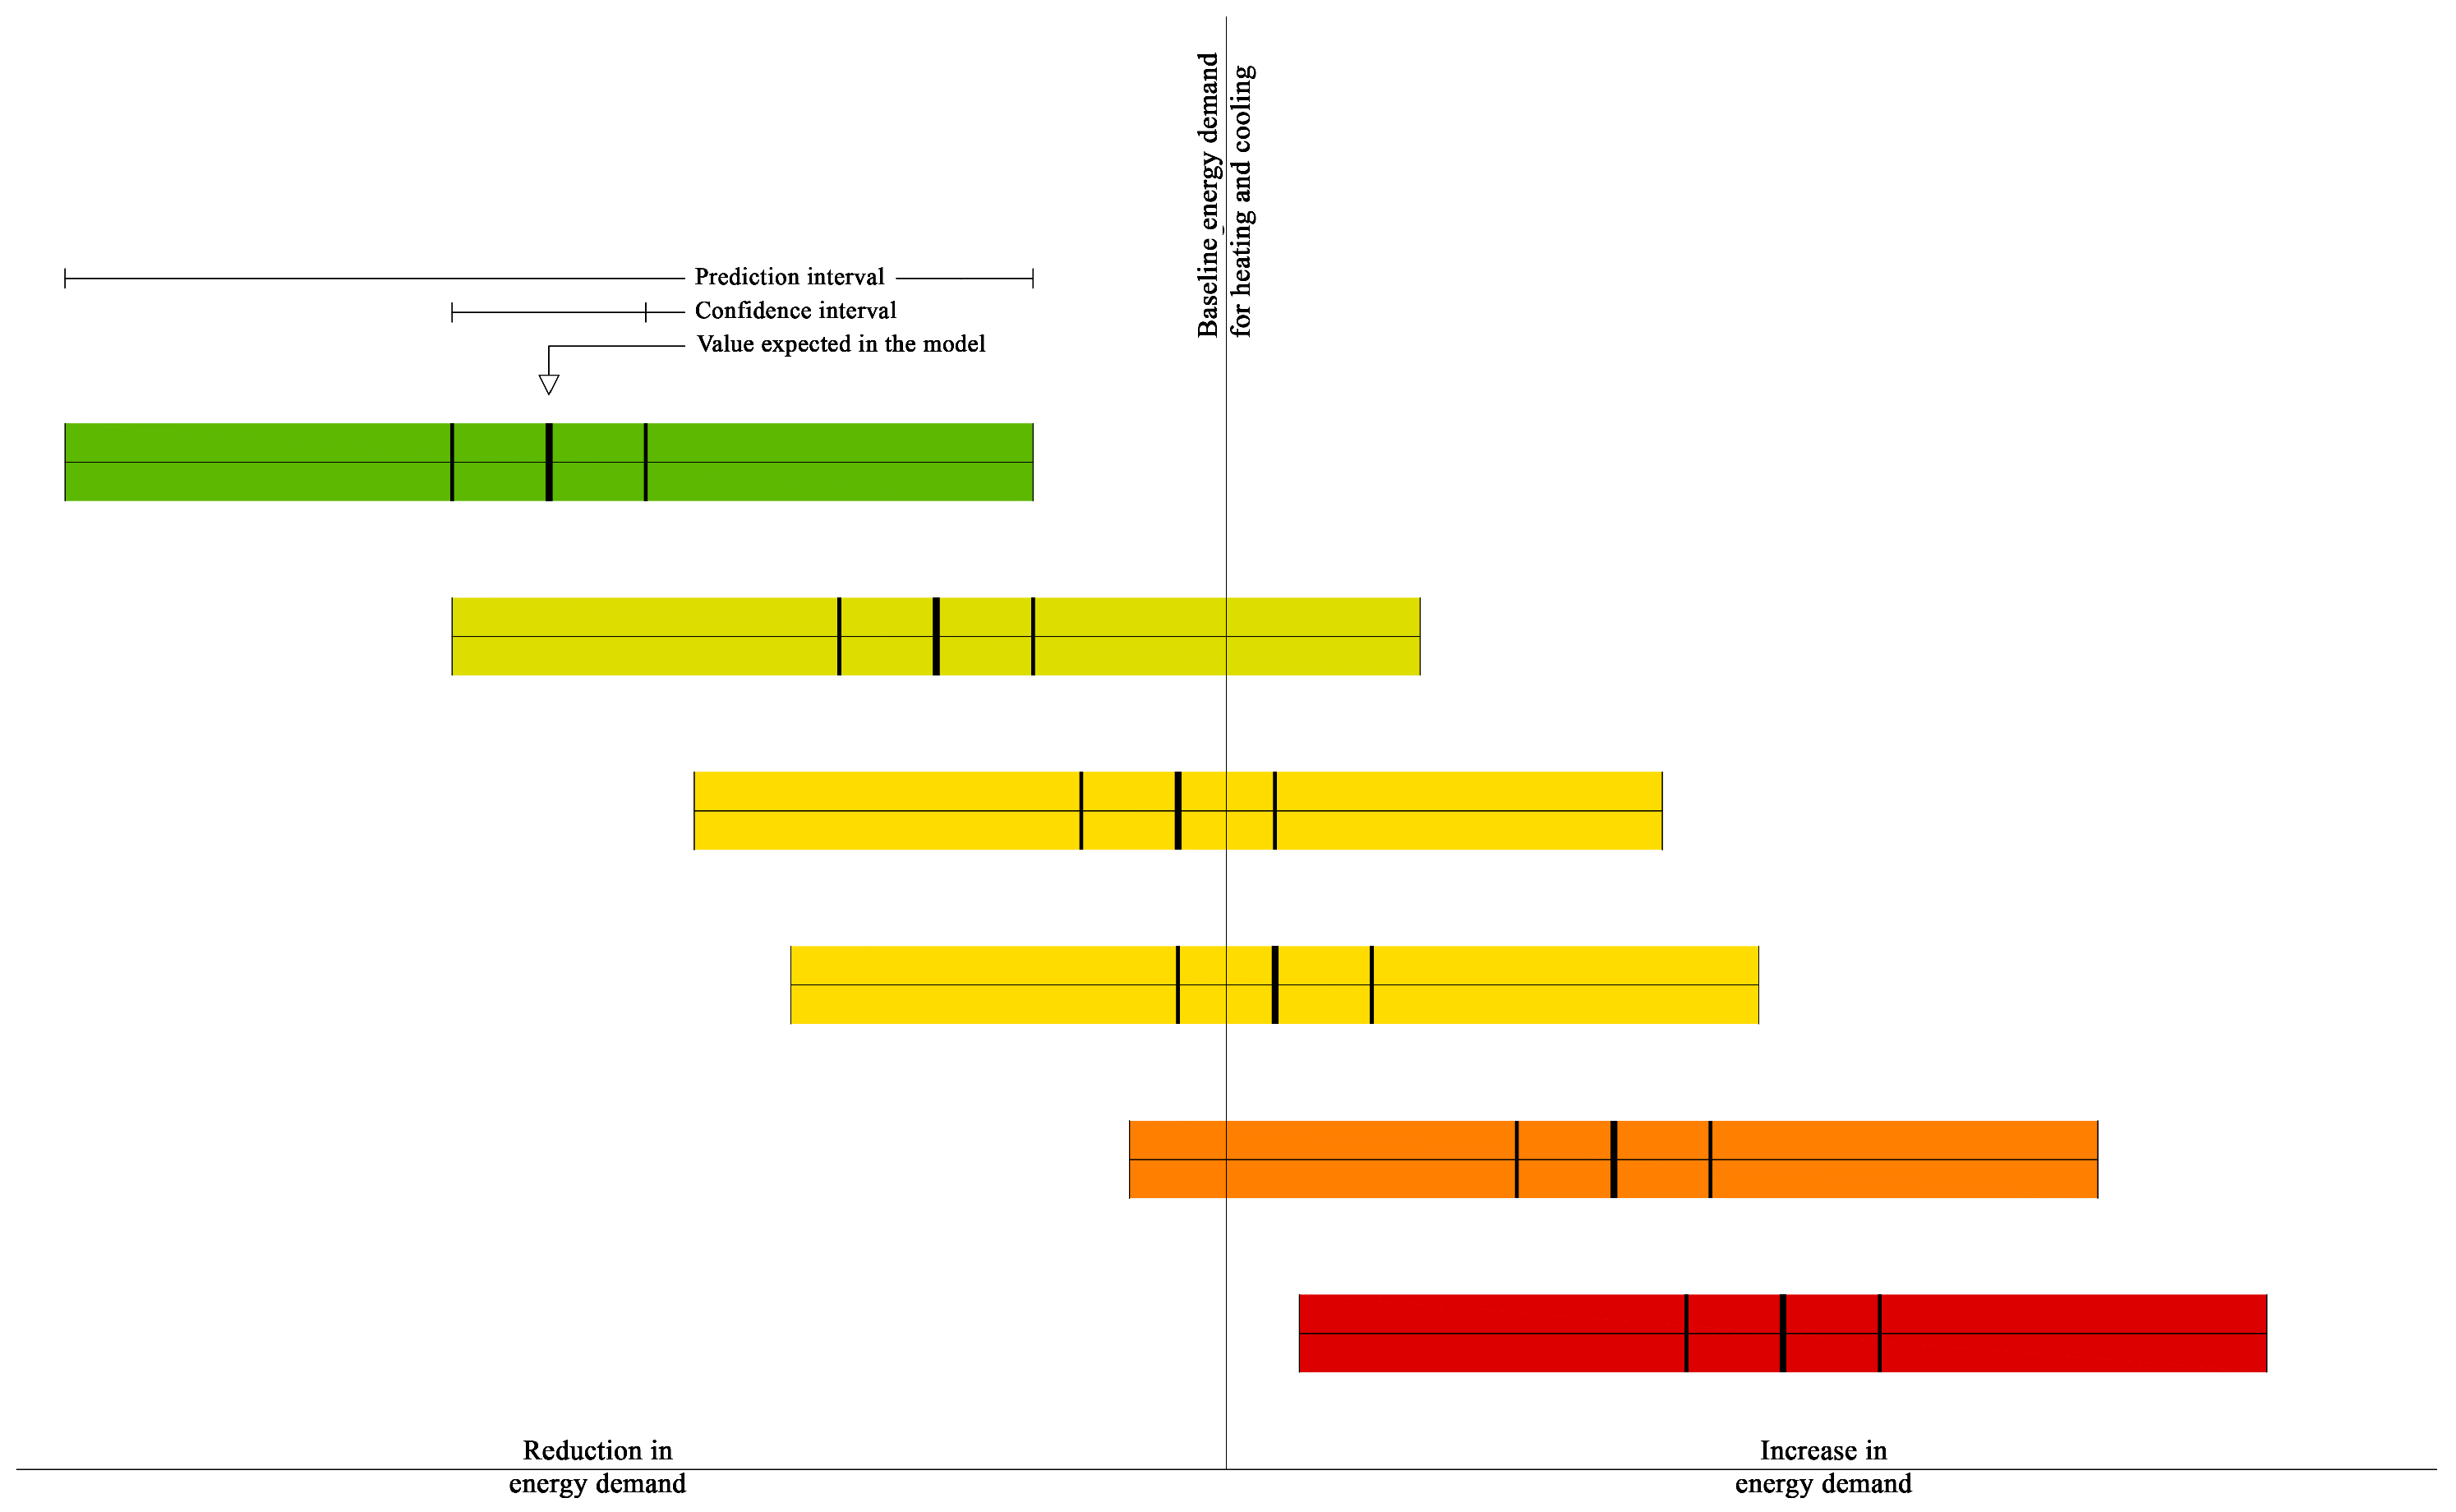
For this purpose, a chromatic scale was defined (Figure 4). This is based on the intervals of prediction and confidence, which were calculated using the in-built functions in the R programming language (the reader is referred to R documentation for additional details on the specific equations used). The chromatic scale is made of five colours, whose meaning is summarized in Table 4. This qualitative representation shows the magnitude of the net effect of reflective covering on the building energy demand and takes into account the uncertainty of the estimation.
In practice, a “weak positive suggestion” (light green) is only given if the calculated effect is larger than the confidence interval; a “strong positive suggestion” (green) is given if the effect is larger than the prediction interval. The same logic is used on the opposite side of the spectrum.
The thematic maps were prepared through the software QGIS 3.14. Open access shapefiles by the Italian Institute of Statistics (ISTAT), with municipal boundaries updated at 1 January 2020, were used as cartographic base.
3. Results
3.1. In-Depth Analysis of Selected Locations
The most direct impact of the use of high-reflective products as roof coverings lies in reducing the amount of solar radiation absorbed by the treated surface.
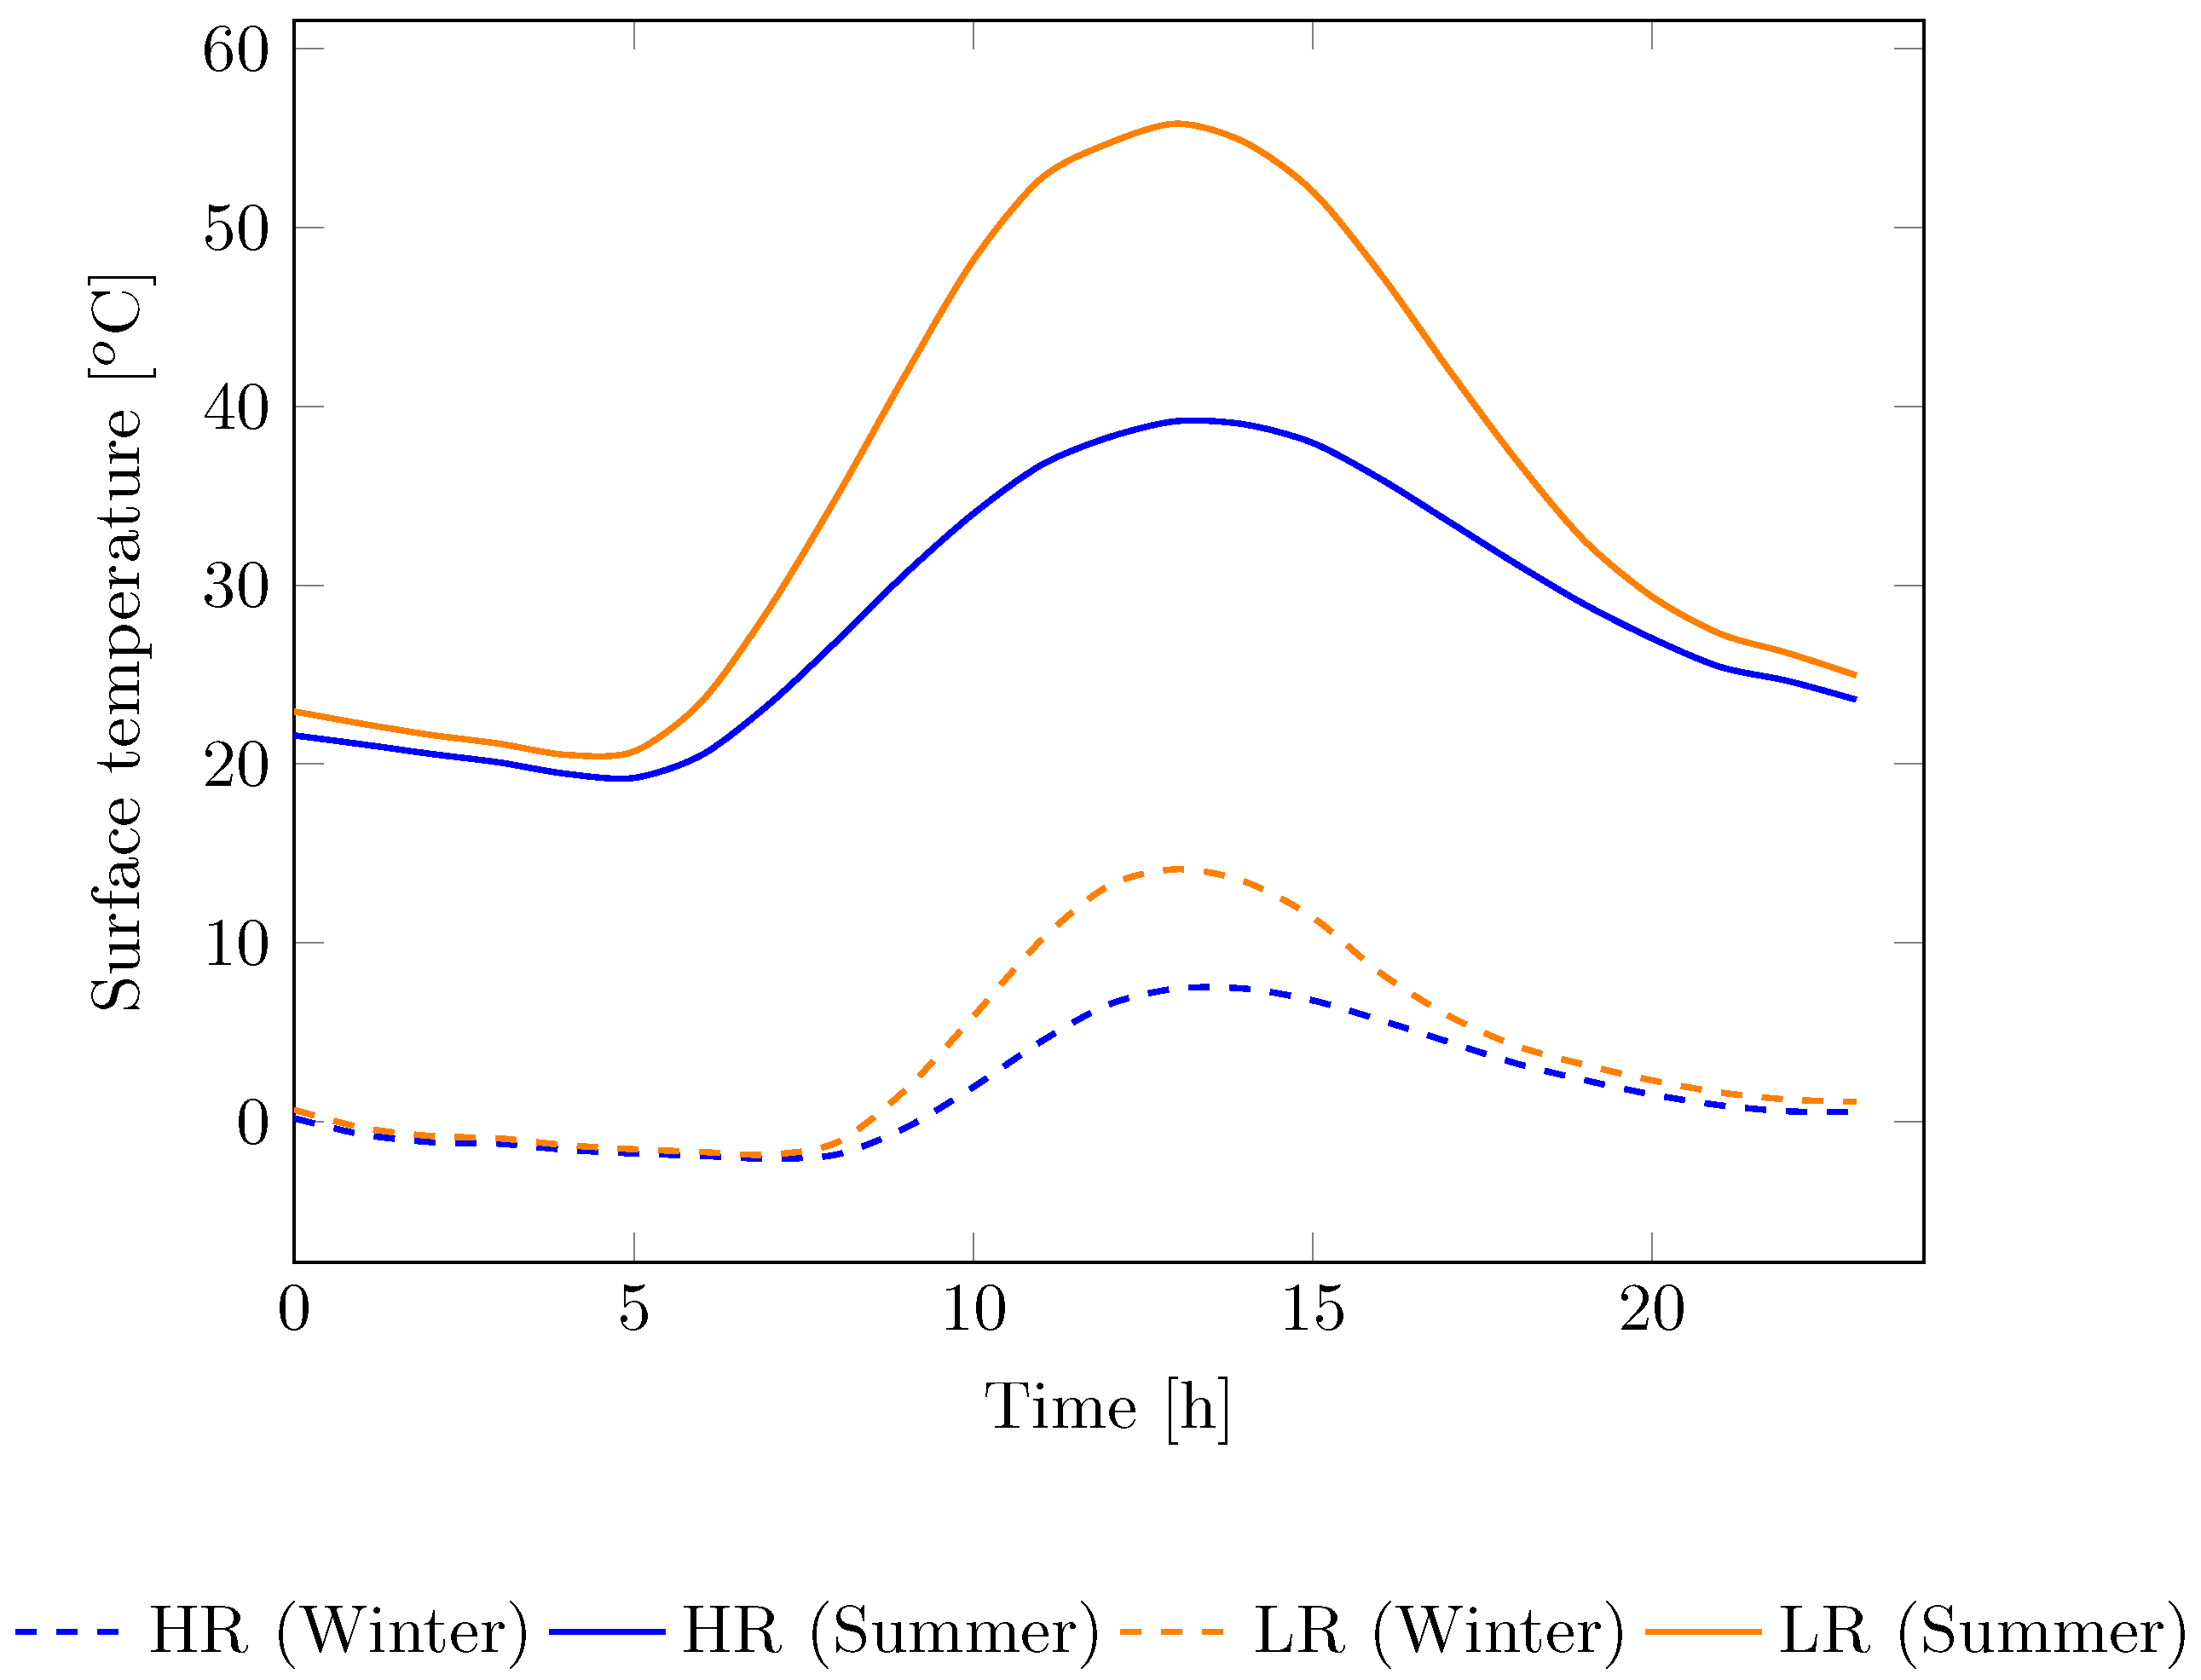
Looking at Bologna, Northern Italy, as an example, Figure 5 shows that decreasing the solar reflectance reduces the amount of solar radiation absorbed by the envelope element. The higher reflectance of the surface translates to a lower surface temperature, as shown in Figure 6.
The lower temperature of the elements with increased reflectance influences the exchange of convective heat between envelope component and zone air, as shown in Figure 7. During summer, the higher reflectance leads to a lower amount of heat exchanged between the element and the thermal zone; during winter, the lower temperature of the envelope component leads to increased heat exchange instead.
This dual behaviour—beneficial during summer, detrimental during winter—implies that, as the surface reflectance of the envelope increases, heating demand increases and cooling demand decreases (Figure 8). As a consequence, depending on the yearly energy balance of the building, the net effect of reflective materials on roof coverings is strongly influenced by local climatic conditions. This is evident in the results of the basic set of 300 simulations, carried out on the reference building.
In Figure 9, the yearly net effect of increasing the solar reflectance of the roof on the primary energy consumption of the building in ToE (tons of oil equivalent) is shown. These results suggest that the effect is strongly correlated to both the winter climate zone and the yearly average temperature of the location: as the temperature increases, the positive effect of higher surface reflectance of the roof increases and its negative effect decreases, up to a point where the net effect becomes positive.
To investigate this phenomenon with additional detail, the daily evolution of the overall effect of increasing solar reflectance of the roof on the primary energy demand of the reference building is shown for the case of Bologna in Figure 10 and for the case of Palermo in Figure 11. In the first case—a location where winter is relatively cold—the net effect is moderately negative (i.e., primary energy demand increases with the solar reflectance). Conversely, the reduction in cooling demand outweighs the increase in heating demand in the case of Palermo, Southern Italy, where winters are relatively mild.
3.2. Derivation of the Linear Regression Model
The first part of the analysis focused on the identification of the most appropriate combination of climatic variables to include in the regressions. The results of the use of different linear regressions, based on the possible combinations of predictors HDD and SCV, are shown in Table 5. Although most of the variance is explained by HDD, the results show that including the SCV improves the model fit and has a limited, but non-negligible, statistical significance. Based on these results, the SCV was included as well in the model definition.
The second step involved estimating the sensitivity of the regression to the variation of a subset of model parameters that were deemed potentially relevant based on the author’s expertise. The results of this analysis are presented in Table 6, where the influence of the features listed in Table 3 on the regression coefficients is shown. In this Table, the statistics is calculated as:
Based on the results presented in Table 6, the building type (intended as features of both the envelope and thermal system) and the roof tilt were identified as the most relevant among the analysed features. The sensitivity is particularly evident to the building type. As a consequence, different sets of regression coefficients (a total of six, based on three building types and two roof tilt angles) were identified and the regression Equation (10) was specified as follows:
In Equation (10), represents the predicted value of the effect of the increase in solar reflectance on the yearly HVAC energy demand of the building. The values of coefficients , , and are reported in Table 7, while the validity of the regressions is shown in Figure 12.
In the solution of Equation (12), building type (superscript BT) is related to three scenarios (reference building, Renovation1, Renovation2 as described in Section 2.2), while roof pitch (superscript RP) is alternatively 0 (flat roof) or 17 degrees.
3.3. Extrapolation to the Italian Territory
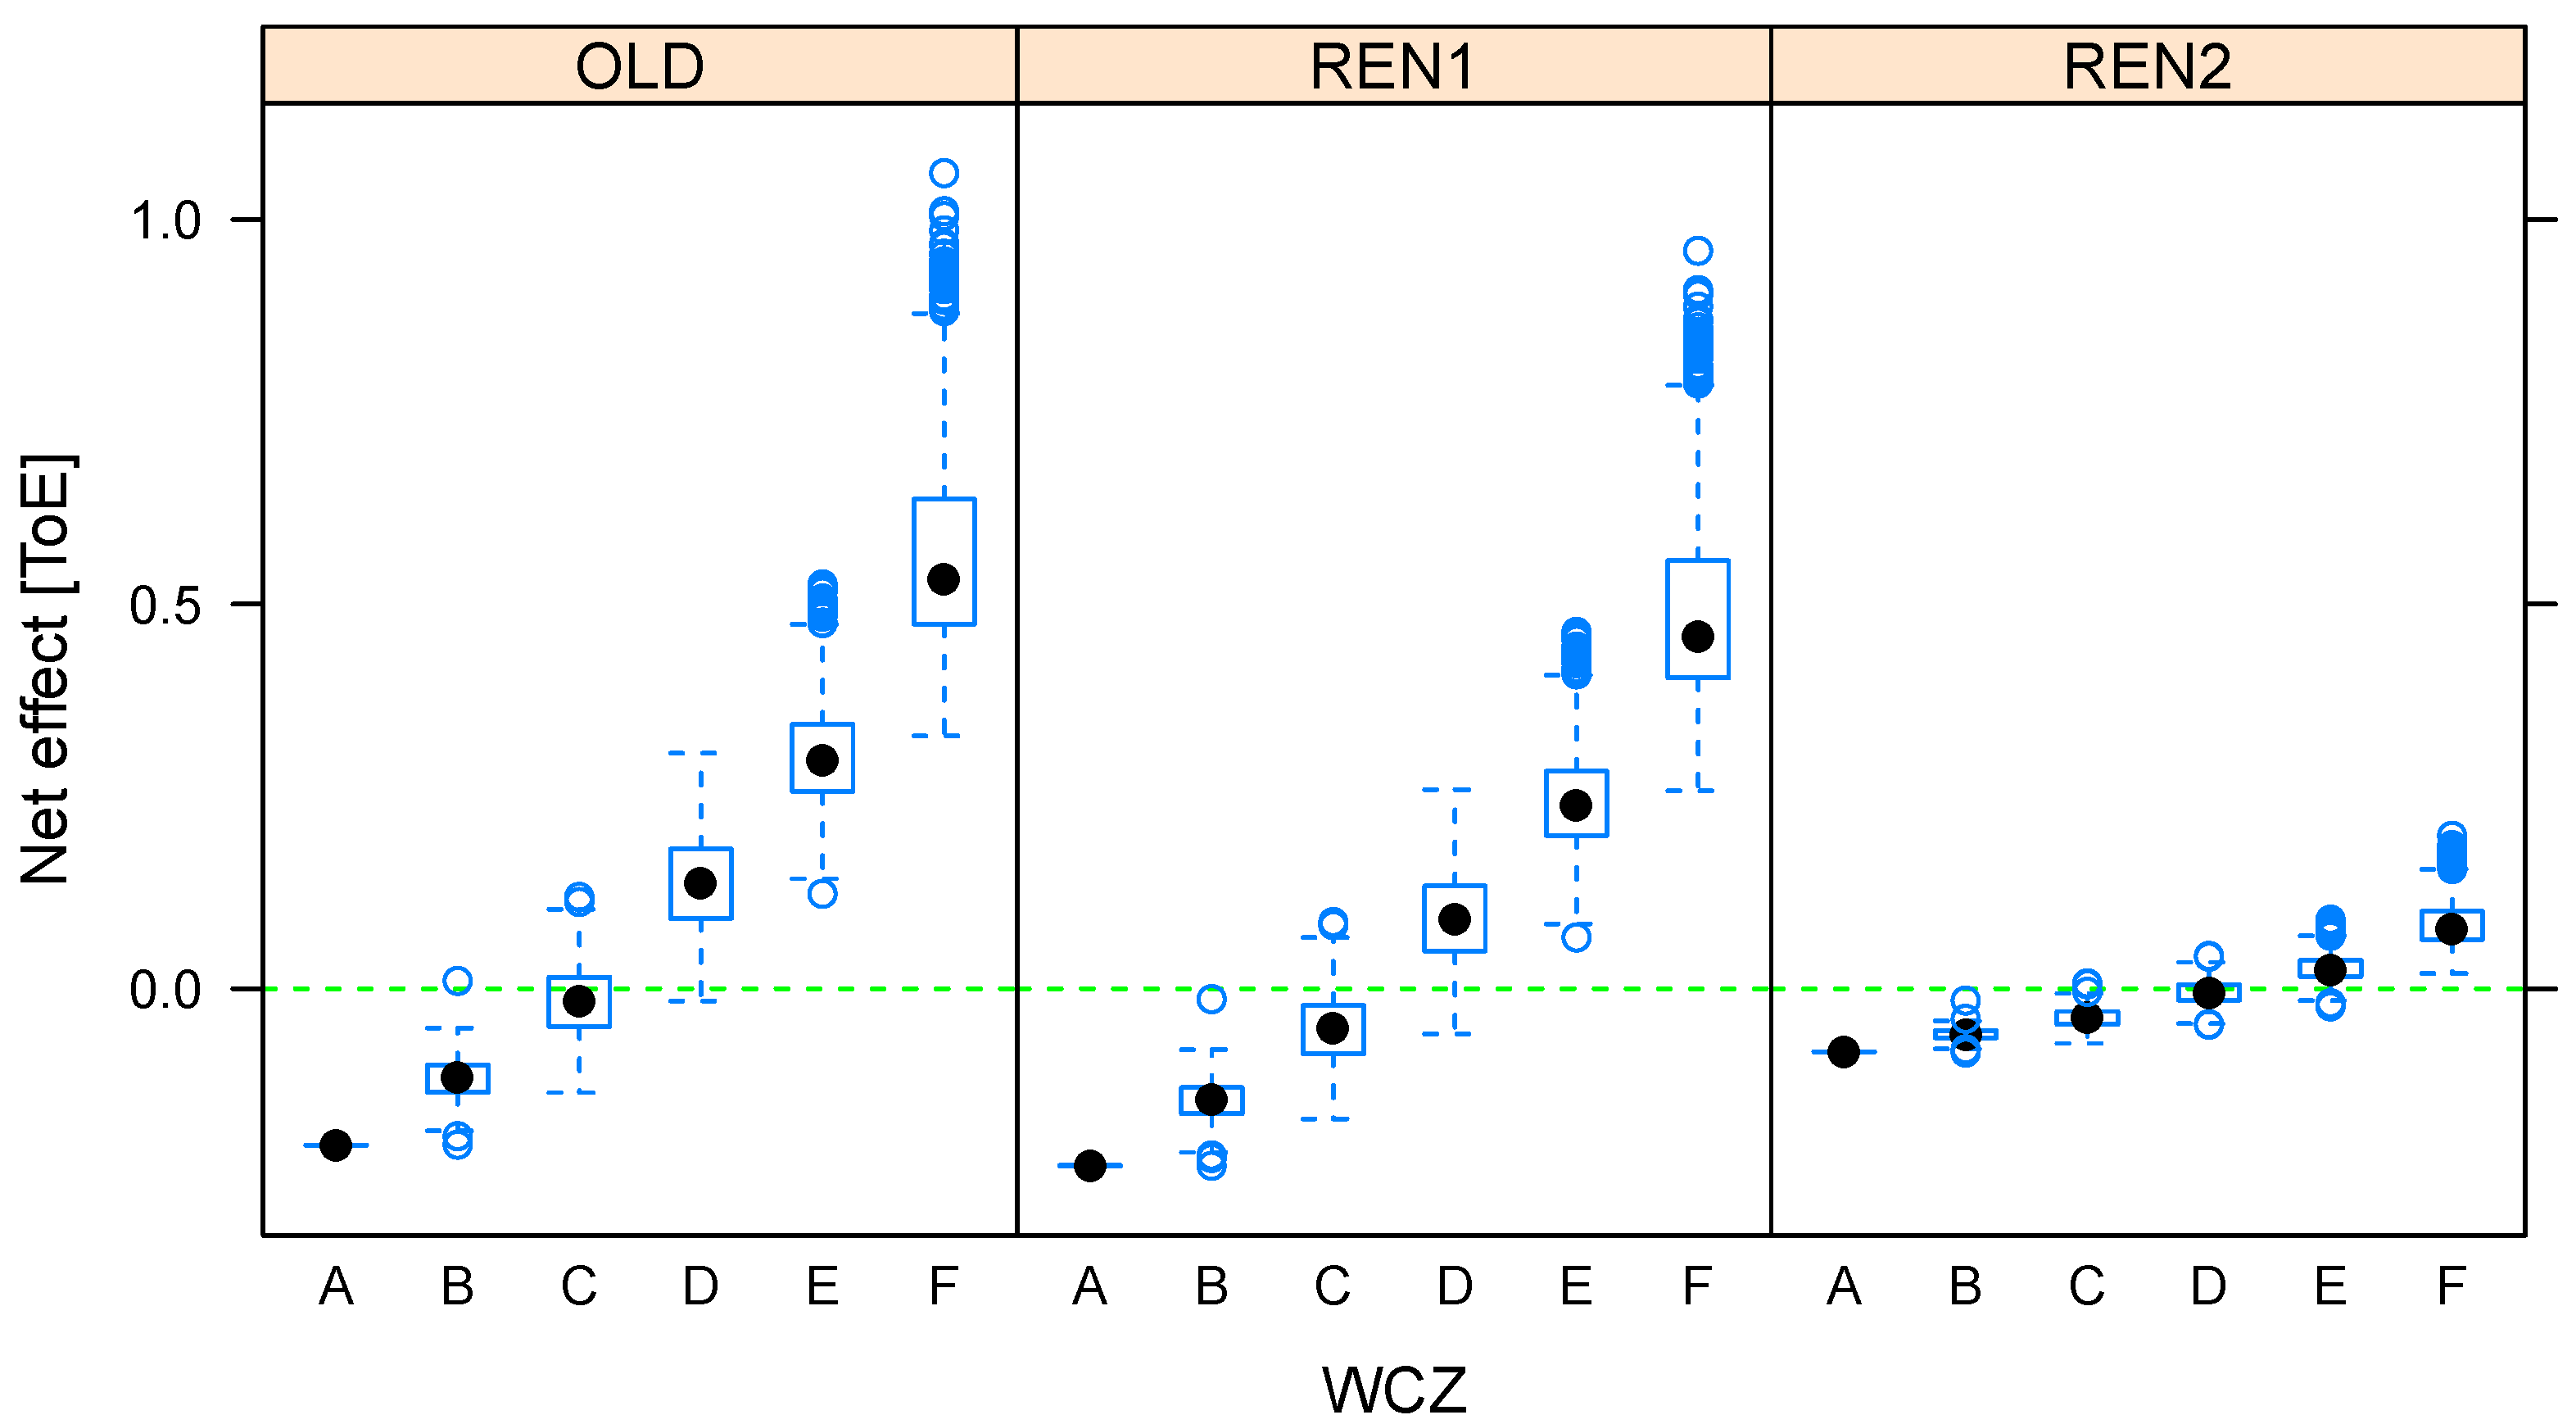
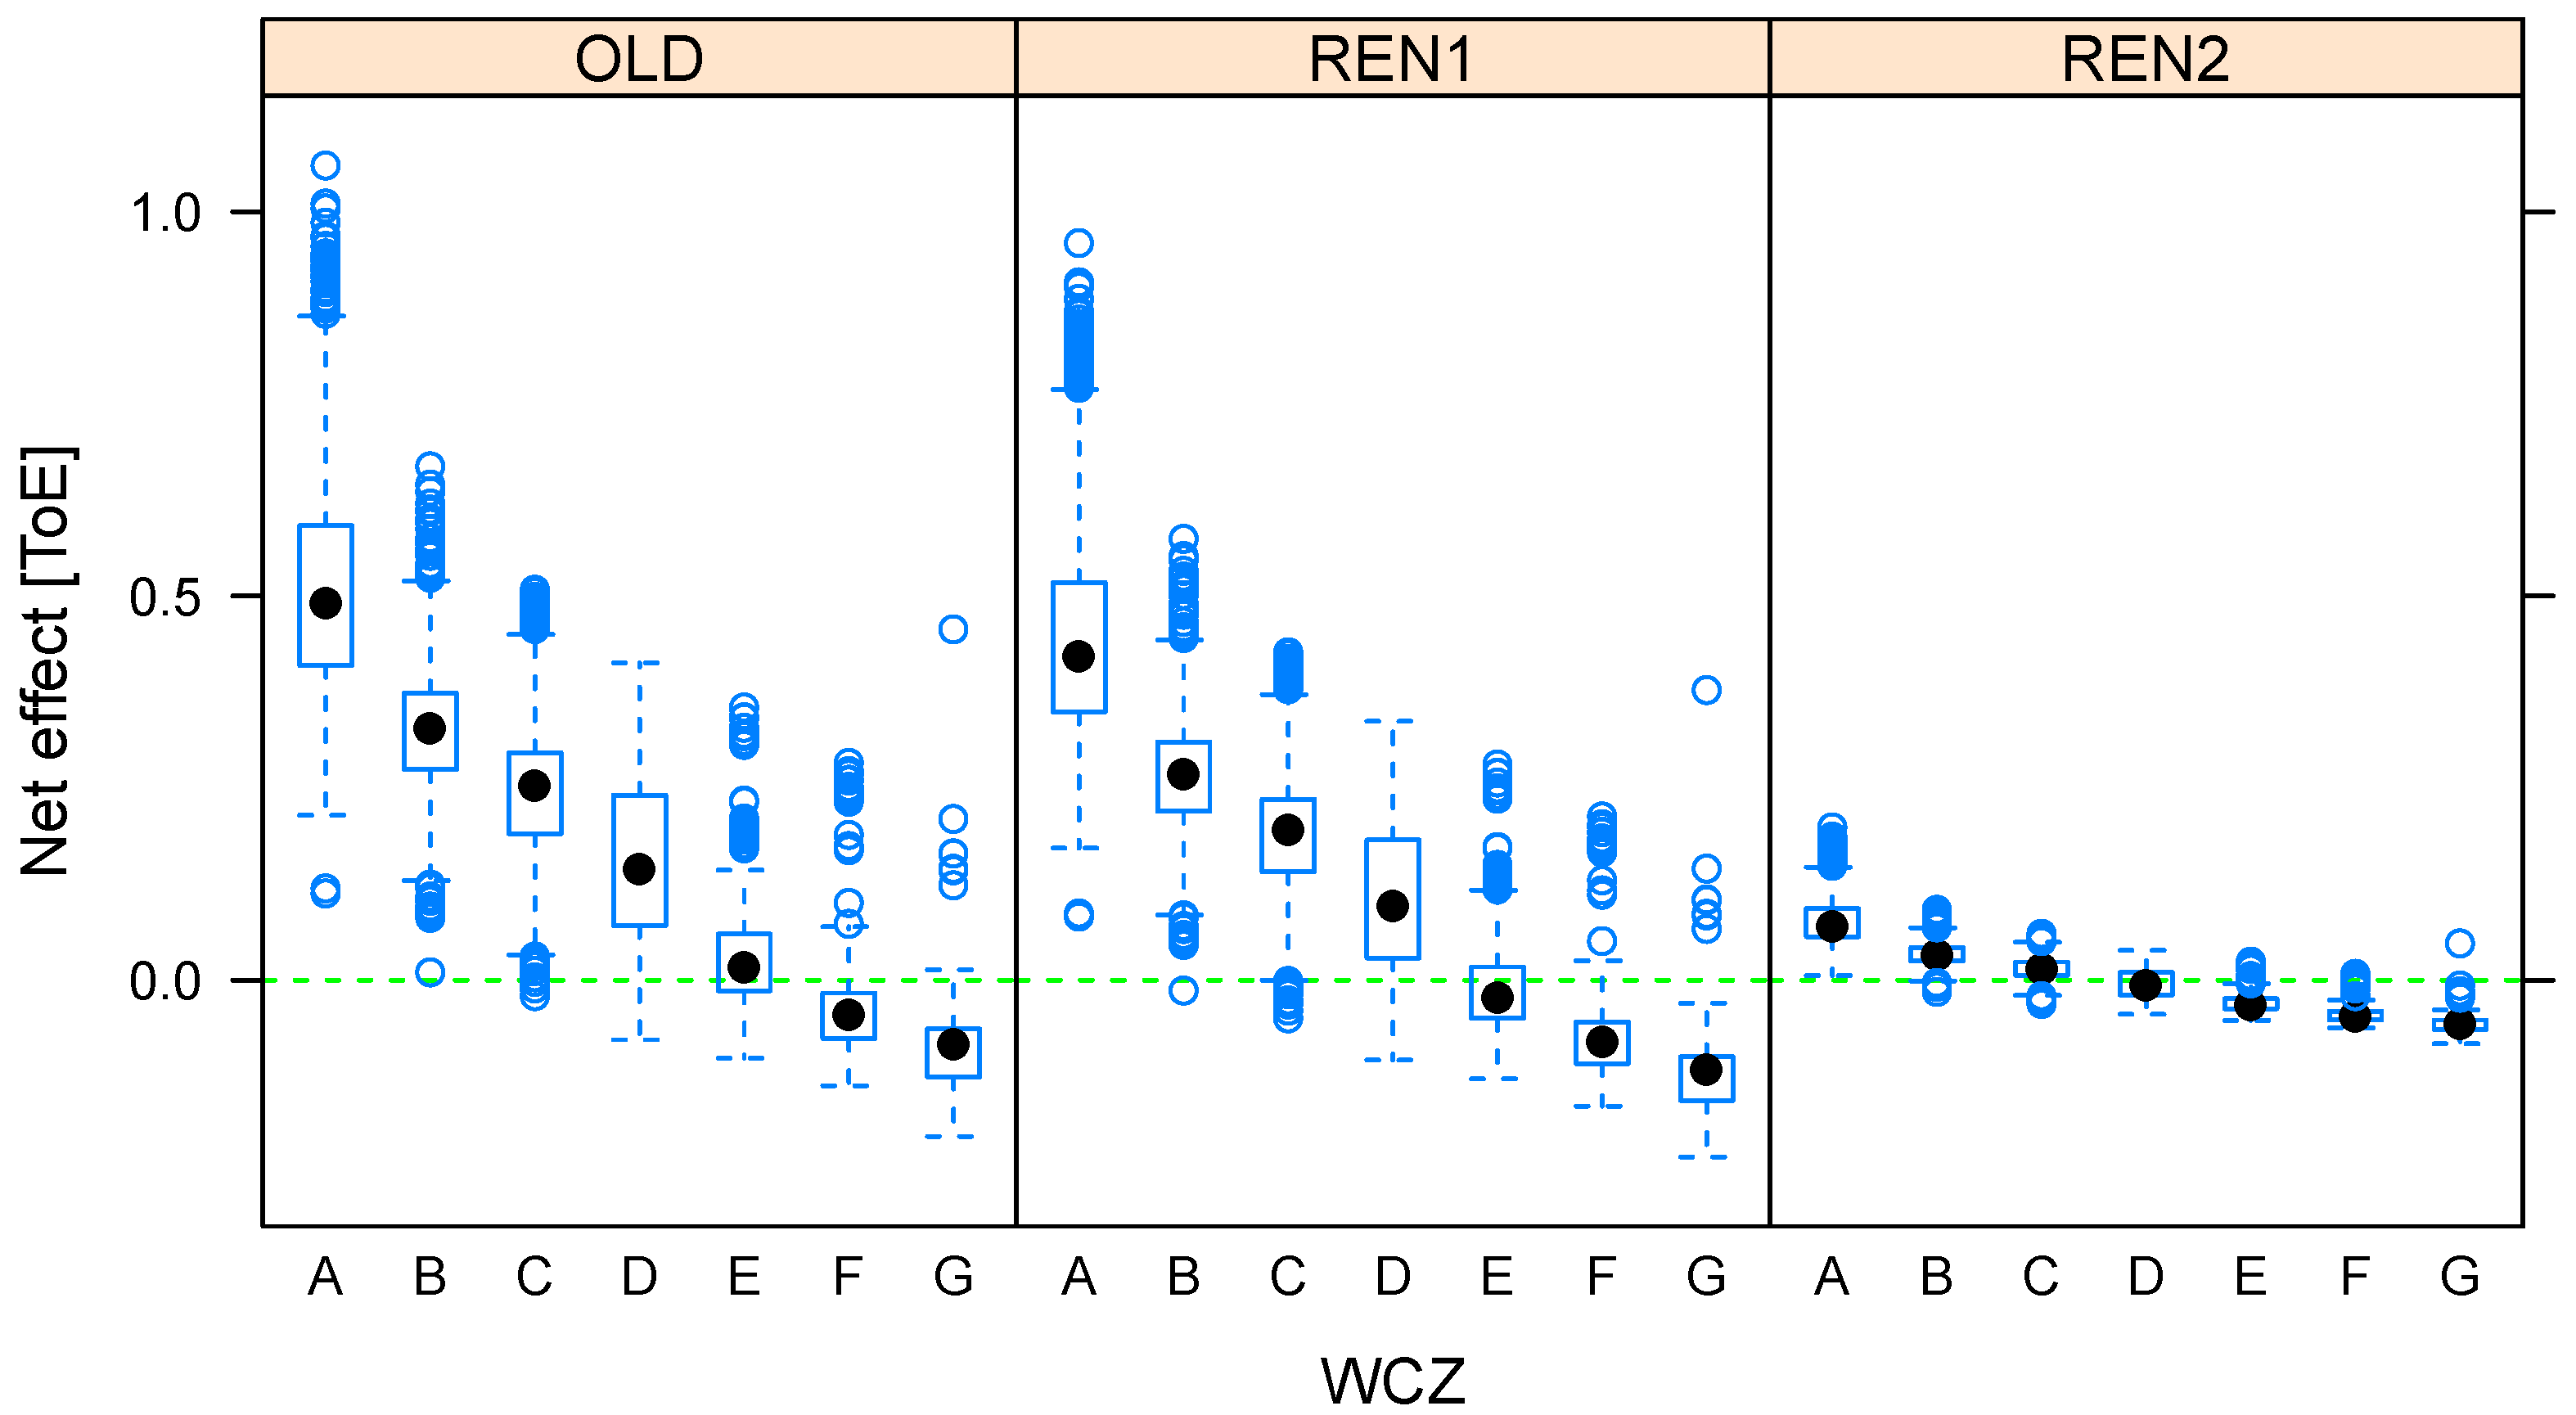
The results for all of Italy are presented as box plots in Figure 13 and Figure 14, where the net effect of high-reflective roof coverings on the yearly primary energy demand of the building is shown against winter and summer climate zone. These figures suggest that both climatic categorizations can be considered as relevant predictors.
The thematic maps of Figure 15 refer to the current climate conditions and show the results for the building with the flat roof in the three cases of no refurbishment, slight, and deep renovation. These maps highlight the geographic areas of Italy—mainly the southern coastal areas—where the use of high-reflective coverings on flat roofs is able to reduce the overall energy demand of the building. Furthermore, comparison among the three maps suggests that the benefit increases if renovation works have been carried out to improve the energy performance of the building.
The thematic maps for the case of the pitched roof show a similar trend and are available in the Supplementary Materials.
Table 8, in which results are related to the winter climate zones of national regulation, shows that using reflective components on building roofs is always positive (at least “light green”) in winter climate zones A (HDDs ≤ 600) and B (600 < HDDs ≤ 900).
3.4. Extrapolation to Future Climatic Conditions
In order to consider the rise of temperature due to the ongoing climate change, in this study the relationship between the two climate indicators used as independent variables (HDDs and SCV) and the average yearly temperature was modelled through a linear regression. The results of this approximation are shown in Figure 16 and highlight the validity of the assumption.
The regression coefficients obtained and used in the study are summarized as follows:
The results related to a 1 °C increase in average yearly temperatures (which, based on the above, corresponds to an increase of 288 HDD and an increase of 0.0519 in the magnitude of the SCV), also shown quantitatively in Table 9, are presented in the form of thematic maps (Figure 17), corresponding to the cases shown in Section 3.3.
In the 1 °C warmer climate scenario, the share of municipalities where the use of high-reflective roof covering is energetically convenient increases from 9% to 16% in the reference building, 11% to 18% in the light renovated building, and 25% to 34% in the deep renovated building.
4. Discussion
4.1. Method Discussion
This research analyses a reference building for the purpose of estimating and mapping the effectiveness of high-reflective roof coverings as a measure to reduce the energy demand of dwellings for thermal needs. In order to enlarge the number of existing constructions represented by the model, several characteristics of the reference building were set as variables and investigated through a parametric analysis. Nonetheless relevant features, such as building morphology or the difference between single- and multi-family houses, cannot be managed adequately as variables of the same model and a set of reference buildings should be used to achieve results applicable to the entire residential stock in the analysed territory.
The presence of adjacent buildings could have been considered in the employed model, by changing its minor facades in adiabatic components. However, this feature is strictly related to building morphology and urban characteristics. Consequently, it was considered more appropriate to exclude the presence of adjacent constructions from the parametric analysis of this study and to examine this feature in the further development of additional building models.
In this study, apartments are equipped with individual air conditioning systems while space heating is centralised. Furthermore, occupant behaviour is modelled with the same schedules in all dwellings, both for air conditioning and the use of natural ventilation. These assumptions were acceptable from the perspective of deriving information for a large territory from simulations carried out on a limited number of locations where detailed climate data are available. At the same time, it is known that systematic discrepancies between estimated demand and actual consumption of energy in buildings and building stocks is related to the modelling of occupant behaviour [20,21,22,23]. Therefore, it will be crucial to detail this aspect for two main purposes: on the one hand, to assess the sensitivity of the results to the model of energy systems for heating and cooling; and on the other hand, to improve the estimation of energy demand in order to increase the reliability of the maps, which plot the energy convenience of high-reflective roof coverings according to local climate conditions.
Furthermore, further research should include an environmental and cost analysis: while reflective coatings might potentially be useful to reduce the energy footprint of a residential building, this might not necessarily be the wisest choice economically (because of the cost of the investment) or environmentally (because of the environmental footprint of the manufacturing of the paint). In the Italian built environment, reflective coatings are still a relatively new energy efficiency measure, and limited data are available for this type of analysis, which should however be performed in the future.
Extending this research to the economic analysis will allow two relevant developments. On the one hand, the colour scale of the maps could be updated in order to show not only the energy balance of the examined upgrade measure but also its cost-effectiveness according to the achievable energy savings. On the other hand, future scenarios could be suggested not only as consequences of climate change but also in relation to changes in the national energy mix and long-term trends of energy cost.
Finally, climate warming has been represented through a simplification: HDDs and SCV related to the assumed increase of 1 °C were obtained by means of a linear regression, using HDDs from current regulation and SCV from UNI 10349-3. Further development of this study should also compare the results based on in-force HDDs with those related to the updated HDDs proposed by the technical standard UNI 10349-3. Besides this development, a detailed model of climate change, including solar irradiance conditions, should be used.
4.2. Results Discussion
Results plotted in the map of Figure 15 show that the high-reflective flat roof would probably be beneficial to the energy balance of buildings (light green or better) in 9% of Italian municipalities. The amount rises to 11% if the building was slightly retrofitted (“Renovation1”) and to 25% in the case of deeper energy upgrade measures (“Renovation2”). In all cases, the number of locations where the entire prediction interval corresponds to a reduction in annual primary energy demand for heating and cooling is negligible (0.4%, 1.4%, and 14.7%, respectively). Conversely, municipalities where the use of the high-reflective flat roof is surely negative amount for 75.2%, 70.4%, and 42.9% in the three scenarios.
The increase in positive prediction, when switching from old to renovated buildings, could be related to the fact that the most common energy upgrade measures—as those assumed in this study—are mainly focused on the energy demand for heating. Therefore, when assessing the effects of high-reflective products, the increase in demand for space heating is more limited if compared with scenarios where the reference building is not renovated. In this sense, it is worth noticing that the enhanced effectiveness of high-reflective roofs as an energy upgrade measure is also depicted by the scenarios in which a climate warming equal to 1 °C was assumed (Figure 17). Similar trends apply to pitched roofs, as shown by the maps included as Supplementary Materials.
The negligible number of municipalities with definite reduction in building energy demand points out that high-reflective roof products, when aimed to improve energy efficiency, must be analysed according to the specific features of the building and to the interaction with concurrent upgrade measures. However, in terms of plans and strategies (such as incentives and local regulation), support for the use of high-reflective roof coverings should also consider the benefits of mitigating the urban heat island effects, which have indirect effects on the energy demand of buildings in urban areas. From this point of view, the maps proposed in this study should be complemented with detailed focus on urban areas by moving to a different scale of analysis.
Finally, as shown in Table 8 and Table 9, there is a substantial correspondence between the energy balance convenience of high-reflective roof coverings and the classification of Italian municipalities in thermal zones. In current climatic conditions, there is significant confidence in the positive impact of applying high-reflective roof coverings in thermal zones A and B (and C, for deep renovated buildings). On the other hand, high-reflective roof covering in buildings in thermal zones E and F is never considered convenient (or only marginally in the 1 °C warmer climate with deep renovated building scenario). Therefore, Table 8 and Table 9 suggest that the method exposed in this study, when focused on high-reflective roof coverings, provides a relevant tool for analyses in climate zones C and D, for which the calculated regressions could be refined.
While it can certainly not be expected that high-reflective coverings will be widespread in the whole country, it can safely be said that, in the Italian context, they could have a potentially significant impact as part of a wider range of solutions for residential energy efficiency, particularly for improving the performance during the summer season and in sight of a warming climate.
5. Conclusions
This research focuses on the use of high-reflective products as roof coverings with the purpose of improving the energy efficiency of buildings. The effectiveness of this upgrade measure has been inspected not by means of a limited number of case studies for different climatic zones but by deriving results for all municipalities in a large territory—Italy—according to local climate conditions.
The study has confirmed the well-established findings of literature: high-reflective roofs increase the energy demand for space heating and reduce that for space cooling; hence, their effectiveness as an energy upgrade measure depends on the overall energy balance of the building, which is strictly related both to its features and climate conditions.
The analysis suggests that, for buildings with features comparable to the model used in the simulations, the high-reflective flat roof is likely to reduce the annual energy demand for heating and cooling in 9–25% of Italian municipalities (9–24% in the case of the pitched roof), depending on the building energy renovation state. More in detail, this percentage increases if the building has had renovations in the thermal system and envelope components.
Furthermore, the study shows that the effect of high-reflective roof coverings on the building energy balance is positive in the two Italian thermal zones with the lowest values of HDDs, while it is negative in the two zones with the highest HDDs. For the intermediate thermal zones, the calculated regressions proved to be relevant to inspect the effectiveness of the examined products.
The results have shown that the analysis of high-reflective roof coverings on a territorial scale provides useful indications for planning and regulation activities because it was able to assess the effects of this measure on the energy balance of buildings in relation to renovation state, winter and summer climate zone, and expected change of climate parameters over time.
Supplementary Materials
The following supporting information can be downloaded at: https://0-www-mdpi-com.brum.beds.ac.uk/article/10.3390/su14094969/s1, Figure S1: Maps showing the results extrapolated to the Italian territory, in case of building model with pitched roof in current climate conditions. The colour code used in these maps was defined in Figure 4 and Table 4. Figure S2: Maps showing the results extrapolated to the Italian territory for a building model with pitched roof, in case of 1 °C warmer climate conditions. The colour code used in these maps was defined in Figure 4 and Table 4.
Author Contributions
Conceptualization, F.B., E.G., A.G. and M.-A.S.; methodology, F.B., E.G., A.G. and M.-A.S.; software, F.B., E.G. and A.G.; formal analysis, F.B., investigation, F.B. and E.G.; writing—original draft preparation, F.B. and E.G.; writing—review and editing, F.B., E.G. and A.G.; supervision, M.-A.S.; project administration, A.G. and M.-A.S. All authors have read and agreed to the published version of the manuscript.
Funding
This work was supported by the Italian Ministry of Economic Development through the project “COOL-IT” within the “Ricerca di sistema elettrico—Parte B” funding scheme.
Institutional Review Board Statement
Not applicable.
Informed Consent Statement
Not applicable.
Data Availability Statement
Data available on request from the corresponding author.
Conflicts of Interest
The authors declare no conflict of interest.
Abbreviations
The following abbreviations are used in this manuscript:
| HDD | Heating Degree Day |
| SCV | Summer Climatic Vector |
| WCZ | Weather Climate Zone |
References
- UNEP. 2020 Global Status Report for Buildings and Construction: Towards a Zero Emission, Efficient and Resilient Buildings and Construction Sector; Technical Report; United Nations Environment Programme: Nairobi, Kenya, 2020. [Google Scholar]
- Werner, S. European space cooling demands. Energy 2016, 110, 148–156. [Google Scholar] [CrossRef]
- Frank, T. Climate change impacts on building heating and cooling energy demand in Switzerland. Energy Build. 2005, 37, 1175–1185. [Google Scholar] [CrossRef]
- Mutschler, R.; Rüdisüli, M.; Heer, P.; Eggimann, S. Benchmarking cooling and heating energy demands considering climate change, population growth and cooling device uptake. Appl. Energy 2021, 288, 116636. [Google Scholar] [CrossRef]
- Akbari, H.; Kolokotsa, D. Three decades of urban heat islands and mitigation technologies research. Energy Build. 2016, 133, 834–842. [Google Scholar] [CrossRef]
- Pisello, A.L. State of the art on the development of cool coatings for buildings and cities. Sol. Energy 2017, 144, 660–680. [Google Scholar] [CrossRef]
- Testa, J.; Krarti, M. A review of benefits and limitations of static and switchable cool roof systems. Renew. Sustain. Energy Rev. 2017, 77, 451–460. [Google Scholar] [CrossRef]
- Ding, Y.; Wei, X.; Wang, Q. Optimization approach of passive cool skin technology application for the building’s exterior walls. J. Clean. Prod. 2020, 256, 120751. [Google Scholar] [CrossRef]
- Zinzi, M.; Agnoli, S.; Ulpiani, G.; Mattoni, B. On the potential of switching cool roofs to optimize the thermal response of residential buildings in the Mediterranean region. Energy Build. 2021, 233, 110698. [Google Scholar] [CrossRef]
- Domínguez-Torres, C.A.; Domínguez-Torres, H.; Domínguez-Delgado, A. Optimization of a combination of thermal insulation and cool roof for the refurbishment of social housing in Southern Spain. Sustainability 2021, 13, 10738. [Google Scholar] [CrossRef]
- Triano-Juárez, J.; Macias-Melo, E.; Hernández-Pérez, I.; Aguilar-Castro, K.; Xamán, J. Thermal behavior of a phase change material in a building roof with and without reflective coating in a warm humid zone. J. Build. Eng. 2020, 32, 101648. [Google Scholar] [CrossRef]
- Rawat, M.; Singh, R.N. A study on the comparative review of cool roof thermal performance in various regions. Energy Built Environ. 2021, 3, 327–347. [Google Scholar] [CrossRef]
- Ascione, F.; Bellia, L.; Mazzei, P.; Minichiello, F. Solar gain and building envelope: The surface factor. Build. Res. Inf. 2010, 38, 187–205. [Google Scholar] [CrossRef]
- Petrichenko, K.; Aden, N.; Tsakiris, A. Tools for Energy Efficiency in Buildings: A Guide for Policy-Makers and Experts; Technical Report; UNEP DTU Partnership: Copenhagen, Denmark; WRI: Washington, DC, USA, 2016. [Google Scholar]
- Crawley, D.B.; Lawrie, L.K.; Winkelmann, F.C.; Buhl, W.F.; Huang, Y.J.; Pedersen, C.O.; Strand, R.K.; Liesen, R.J.; Fisher, D.E.; Witte, M.J.; et al. EnergyPlus: Creating a new-generation building energy simulation program. Energy Build. 2001, 33, 319–331. [Google Scholar] [CrossRef]
- Lawrie, L.K.; Crawley, D.B. Development of Global Typical Metereological Years (TMYx). 2019. Available online: http://climate.onebuilding.org (accessed on 14 February 2022).
- Dufton, A. Degree-days. J. Inst. Heat. Vent. Eng. 1934, 2, 83–85. [Google Scholar]
- Terrinoni, L.; Signoretti, P.; Iatauro, D. Indice di Severità Climatica: Classificazione dei Comuni Italiani ai Fini Della Climatizzazione Estiva Degli Edifici; Rds Report; Italian National Agency for New Technologies, Energy and Sustainable Economic Development (ENEA): Rome, Italy, 2012. [Google Scholar]
- Istituto Nazionale di Statistica (ISTAT). Censimento Popolazione Abitazioni. 2011. Available online: http://dati-censimentopopolazione.istat.it/ (accessed on 14 February 2022).
- Happle, G.; Fonseca, J.; Schlueter, A. A review on occupant behavior in urban building energy models. Energy Build. 2018, 174, 276–292. [Google Scholar] [CrossRef] [Green Version]
- Brøgger, M.; Wittchen, K.B. Estimating the energy-saving potential in national building stocks—A methodology review. Renew. Sustain. Energy Rev. 2018, 82, 1489–1496. [Google Scholar] [CrossRef]
- Ding, Y.; Han, S.; Tian, Z.; Yao, J.; Chen, W.; Zhang, Q. Review on occupancy detection and prediction in building simulation. Build. Simul. 2022, 15, 333–356. [Google Scholar] [CrossRef]
- Heydarian, A.; McIlvennie, C.; Arpan, L.; Yousefi, S.; Syndicus, M.; Schweiker, M.; Jazizadeh, F.; Rissetto, R.; Pisello, A.L.; Piselli, C.; et al. What drives our behaviors in buildings? A review on occupant interactions with building systems from the lens of behavioral theories. Build. Environ. 2020, 179, 106928. [Google Scholar] [CrossRef]
Figure 1.
Geometry of the model of the reference building.

Figure 2.
Schedules used for space heating and natural ventilation during the heating season, according to the climate zones established by the Italian regulation.
Figure 2.
Schedules used for space heating and natural ventilation during the heating season, according to the climate zones established by the Italian regulation.

Figure 3.
Summary of climate data for Italy.

Figure 4.
Graphic legend of the chromatic scale described in Table 4.
Figure 4.
Graphic legend of the chromatic scale described in Table 4.

Figure 5.
Solar radiation absorbed by the envelope element. HR and LR refer to “High Reflectance” and “Low Reflectance”, respectively.
Figure 5.
Solar radiation absorbed by the envelope element. HR and LR refer to “High Reflectance” and “Low Reflectance”, respectively.

Figure 6.
External surface temperature of the envelope element. HR and LR refer to “High Reflectance” and “Low Reflectance”, respectively.
Figure 6.
External surface temperature of the envelope element. HR and LR refer to “High Reflectance” and “Low Reflectance”, respectively.

Figure 7.
Convective heat transfer between the envelope element and the neighbouring thermal zone. HR and LR refer to “High Reflectance” and “Low Reflectance”, respectively.
Figure 7.
Convective heat transfer between the envelope element and the neighbouring thermal zone. HR and LR refer to “High Reflectance” and “Low Reflectance”, respectively.

Figure 8.
Heating and cooling demand for the relevant thermal zone. HR and LR refer to “High Reflectance” and “Low Reflectance”, respectively.
Figure 8.
Heating and cooling demand for the relevant thermal zone. HR and LR refer to “High Reflectance” and “Low Reflectance”, respectively.

Figure 9.
Yearly effect of the use of reflective materials for 75 locations in Italy. (a) Savings versus WCZ. (b) Savings versus yearly average temperature.
Figure 9.
Yearly effect of the use of reflective materials for 75 locations in Italy. (a) Savings versus WCZ. (b) Savings versus yearly average temperature.

Figure 10.
Day-by-day and cumulative energy balance for space heating, Bologna.

Figure 11.
Day-by-day and cumulative energy balance for space heating, Palermo.

Figure 12.
Predicted net effect of the use of reflective materials against simulated values. Different plots represent the different building types. Results are shown for the case of flat roof.
Figure 12.
Predicted net effect of the use of reflective materials against simulated values. Different plots represent the different building types. Results are shown for the case of flat roof.

Figure 13.
Results of the application of the linear regression: net effect of reflective materials on primary energy use against the WCZ for different building types.
Figure 13.
Results of the application of the linear regression: net effect of reflective materials on primary energy use against the WCZ for different building types.

Figure 14.
Results of the application of the linear regression: net effect of reflective materials on primary energy use against the WCZ for different building types.
Figure 14.
Results of the application of the linear regression: net effect of reflective materials on primary energy use against the WCZ for different building types.

Figure 15.
Maps showing the results extrapolated to the Italian territory, in case of building model with flat roof in current climate conditions. The colour code used in these maps was defined in Figure 4 and Table 4.

Figure 16.
Local climatic variables versus yearly average temperature.

Figure 17.
Maps showing the results extrapolated to the Italian territory for a building model with flat roof, in case of 1 °C warmer climate conditions. The colour code used in these maps was defined in Figure 4 and Table 4.


Table 1.
Construction features of the building envelope components of the reference building. Note that the symbols d, , , R, U, and c represent, respectively, thickness, thermal conductivity, density, thermal resistance, thermal transmittance, and specific heat capacity.
Table 1.
Construction features of the building envelope components of the reference building. Note that the symbols d, , , R, U, and c represent, respectively, thickness, thermal conductivity, density, thermal resistance, thermal transmittance, and specific heat capacity.
| Material | d | R | U | c | ||
|---|---|---|---|---|---|---|
| Outer walls (type MLP03 from UNI/TR 11552) | ||||||
| Plaster—outer | 0.02 | 0.90 | 1800 | 0.029 | 35.0 | 1000 |
| Semi-hollow bricks | 0.25 | 0.40 | 1000 | 0.625 | 1.6 | 1000 |
| Plaster—inner | 0.02 | 0.70 | 1400 | 0.029 | 35.0 | 1000 |
| Roof (type COP04 from UNI/TR 11552) | ||||||
| Clinker | 0.03 | 0.70 | 1500 | 0.043 | 23.3 | 1000 |
| Bituminous membrane | 0.01 | 0.17 | 1200 | 0.059 | 17.0 | 1000 |
| Screed | 0.06 | 1.06 | 2000 | 0.057 | 17.7 | 1000 |
| Brick concrete slab | 0.22 | 0.67 | 1270 | 0.330 | 3.0 | 1000 |
| Plaster—inner | 0.02 | 0.70 | 1400 | 0.029 | 35.0 | 1000 |
| Inner floor (type SOL05 from UNI/TR 11552) | ||||||
| Stoneware | 0.015 | 1.47 | 1700 | 0.010 | 98.0 | 1000 |
| Cement mortar | 0.02 | 1.40 | 2000 | 0.014 | 70.0 | 1000 |
| Screed | 0.06 | 1.06 | 1700 | 0.019 | 53.0 | 1000 |
| Brick concrete slab | 0.22 | 0.67 | 1270 | 0.33 | 3.0 | 1000 |
| Plaster—inner | 0.02 | 0.70 | 1400 | 0.029 | 35.0 | 1000 |
| Inner partition walls | ||||||
| Plaster—inner | 0.02 | 0.70 | 1400 | 0.029 | 35.0 | 1000 |
| Hollow bricks | 0.12 | 0.39 | 610 | 0.31 | 2.5 | 1000 |
| Plaster—inner | 0.02 | 0.70 | 1400 | 0.029 | 35.0 | 1000 |
| Ground floor | ||||||
| Stoneware | 0.015 | 1.47 | 1700 | 0.010 | 98.0 | 1000 |
| Cement mortar | 0.02 | 1.40 | 2000 | 0.014 | 70.0 | 1000 |
| Screed | 0.06 | 1.06 | 1700 | 0.019 | 53.0 | 1000 |
| Brick concrete slab | 0.22 | 0.67 | 1270 | 0.33 | 3.0 | 1000 |
Table 2.
Summary of coefficients used for the calculation of the efficiency of the energy conversion units in the buildings.
Table 2.
Summary of coefficients used for the calculation of the efficiency of the energy conversion units in the buildings.
| Eq. n. | Coefficients |
|---|---|
| 1 | |
| 3 | |
| 4 | |
| 5 |
Table 3.
Model characteristics varied through a one-parameter-at-a-time approach, compared to the corresponding values in the reference building model. Note that surrounding buildings in the non-reference simulations are located at a distance of 12 m from the modelled building.
Table 3.
Model characteristics varied through a one-parameter-at-a-time approach, compared to the corresponding values in the reference building model. Note that surrounding buildings in the non-reference simulations are located at a distance of 12 m from the modelled building.
| Parameter | Value in Reference Model | Variations |
|---|---|---|
| Building orientation [degree] | 0 | 45, 90, 135, 180, 225, 270, 315 |
| Number of storeys | 6 | 3, 4, 5 |
| Past energy upgrade measures | 1970s type | Renovation1, Renovation2 |
| Height of surrounding buildings [m] | 0 | 15, 21 |
| Schedule of heating setpoint [°C] | 20 | 19, 21 |
| Schedule of cooling setpoint [°C] | 26 | 25, 27 |
Table 4.
Legend of the chromatic scale set to develop thematic maps representing the effects of high-reflective roof coverings on the energy demand of the reference building.
Table 4.
Legend of the chromatic scale set to develop thematic maps representing the effects of high-reflective roof coverings on the energy demand of the reference building.
| Colour | Meaning |
|---|---|
| Green | The entire prediction interval corresponds to a reduction in annual primary energy demand for heating and cooling. |
| Light Green | Part of the prediction interval corresponds to an increase in annual primary energy demand for heating and cooling, but the entire confidence interval is in the field of reduction in energy demand. High-reflective roof is likely to reduce annual energy consumption. |
| Yellow | Both intervals (prediction and confidence) are divided between the fields of energy reduction and energy increase. It is not possible to expect positive or negative effects from the application of high reflective materials on the building roof, if the specific conditions of the real building are not considered. |
| Orange | Part of the prediction interval corresponds to a reduction in annual primary energy demand for heating and cooling, but the entire confidence interval is in the field of increased energy demand. High-reflective roof is likely to increase annual energy consumption. |
| Red | The entire prediction interval corresponds to an increase in annual primary energy demand for heating and cooling. |
Table 5.
Analysis of the regression using the reference dataset (* = p ≤ 0.05; *** = p ≤ 0.001).
| Model | R | p (HDD) | p (SCV) | p (HDD·SCV) |
|---|---|---|---|---|
| HDD | 0.82 | *** | - | - |
| SCV | 0.66 | - | *** | - |
| HDD + SCV | 0.83 | *** | * | - |
| HDD + SCV + HDD·SCV | 0.83 |
Table 6.
Regression coefficients of the multi-linear regression between the net effect of high-reflective surfaces and the selected building-related parameters.
Table 6.
Regression coefficients of the multi-linear regression between the net effect of high-reflective surfaces and the selected building-related parameters.
| Past energy upgrade measures | 1.38 |
| Number of storeys | 0.02 |
| Building orientation | 0.01 |
| Height of surrounding buildings | 0.01 |
| Roof tilt | 0.15 |
Table 7.
Final regression coefficients for the effect of the use of reflective materials on roofs.
| Roof Pitch | BT | R | |||
|---|---|---|---|---|---|
| Flat roof | OLD | 0.362 | 1.84 | −0.319 | 0.85 |
| REN1 | 0.377 | 1.64 | −0.333 | 0.86 | |
| REN2 | 0.131 | 2.98 | −0.109 | 0.91 | |
| Pitched roof | OLD | 0.390 | 1.88 | −0.333 | 0.85 |
| REN1 | 0.382 | 1.70 | −0.336 | 0.86 | |
| REN2 | 0.140 | 3.06 | −0.114 | 0.90 |
Table 8.
Summary of the results for current climate conditions, separated for climate zone, roof tilt, and building type. The values indicate the share of the municipalities for which the colour is light green or green.
Table 8.
Summary of the results for current climate conditions, separated for climate zone, roof tilt, and building type. The values indicate the share of the municipalities for which the colour is light green or green.
| Flat Roof | Pitched Roof | |||||
|---|---|---|---|---|---|---|
| OLD | REN1 | REN2 | OLD | REN1 | REN2 | |
| A | 100% | 100% | 100% | 100% | 100% | 100% |
| B | 99% | 99% | 100% | 99% | 99% | 99% |
| C | 57% | 74% | 99% | 52% | 67% | 99% |
| D | 0% | 0% | 53% | 0% | 0% | 48% |
| E | 0% | 0% | 0% | 0% | 0% | 0% |
| F | 0% | 0% | 0% | 0% | 0% | 0% |
| Tot | 9% | 11% | 25% | 9% | 10% | 24% |
Table 9.
Summary of the results for 1 °C warmer climate conditions, separated for climate zone, roof tilt, and building type. The values indicate the share of the municipalities for which the colour is light green or green.
Table 9.
Summary of the results for 1 °C warmer climate conditions, separated for climate zone, roof tilt, and building type. The values indicate the share of the municipalities for which the colour is light green or green.
| Flat Roof | Pitched Roof | |||||
|---|---|---|---|---|---|---|
| OLD | REN1 | REN2 | OLD | REN1 | REN2 | |
| A | 100% | 100% | 100% | 100% | 100% | 100% |
| B | 100% | 99% | 100% | 100% | 99% | 99% |
| C | 96% | 97% | 100% | 94% | 96% | 100% |
| D | 10% | 21% | 87% | 8% | 17% | 83% |
| E | 0% | 5% | 0% | 0% | 0% | 3% |
| F | 0% | 0% | 0% | 0% | 0% | 0% |
| Tot | 16% | 18% | 34% | 15% | 17% | 33% |
Publisher’s Note: MDPI stays neutral with regard to jurisdictional claims in published maps and institutional affiliations. |
© 2022 by the authors. Licensee MDPI, Basel, Switzerland. This article is an open access article distributed under the terms and conditions of the Creative Commons Attribution (CC BY) license (https://creativecommons.org/licenses/by/4.0/).
Share and Cite
MDPI and ACS Style
Baldi, F.; Genova, E.; Gugliandolo, A.; Segreto, M.-A. Mapping the Potential of High-Reflective Roof Coverings in Residential Buildings in Italy. Sustainability 2022, 14, 4969. https://0-doi-org.brum.beds.ac.uk/10.3390/su14094969
AMA Style
Baldi F, Genova E, Gugliandolo A, Segreto M-A. Mapping the Potential of High-Reflective Roof Coverings in Residential Buildings in Italy. Sustainability. 2022; 14(9):4969. https://0-doi-org.brum.beds.ac.uk/10.3390/su14094969
Chicago/Turabian StyleBaldi, Francesco, Enrico Genova, Alessandra Gugliandolo, and Maria-Anna Segreto. 2022. "Mapping the Potential of High-Reflective Roof Coverings in Residential Buildings in Italy" Sustainability 14, no. 9: 4969. https://0-doi-org.brum.beds.ac.uk/10.3390/su14094969
Note that from the first issue of 2016, this journal uses article numbers instead of page numbers. See further details here.