
The Pentagon Model of Urban Social Sustainability: An Assessment of Sociospatial Aspects, Comparing Two Neighborhoods


Department of Architecture, Bursa Uludag University, 16059 Bursa, Turkey
*
Author to whom correspondence should be addressed.
Sustainability 2022, 14(9), 4990; https://0-doi-org.brum.beds.ac.uk/10.3390/su14094990
Submission received: 5 April 2022
/
Revised: 16 April 2022
/
Accepted: 19 April 2022
/
Published: 21 April 2022
(This article belongs to the Special Issue Social Sustainability)
Abstract
:Social concerns have caused a critical rethinking of urban space in today’s society, with sociospatial issues at the forefront of discussions. This study aims to better understand the relationship between sociospatial aspects of urban space and social sustainability. We provide a pentagon model for urban social sustainability by identifying five dimensions: person (demographic and household characteristics), place (accessibility, social infrastructure, open spaces, and places for daily operations), people (sense of community, social relations, and social network), perception (sense of place, and security and safety), and process (participation, and future of space). The research methodology includes a spatial analysis, questionnaire survey, and statistical analyses, applied to two study areas in Izmir, Turkey. The findings show that the two study areas have significantly different scores in terms of social sustainability criteria. Residents who reported their neighborhood as being more accessible and having better places for daily operations indicated a higher sense of place and participation. Residents who rated their open spaces more highly reported better social relations and social networks, and greater security and safety. In addition, there are a variety of positive associations between indicators of social sustainability. The study summarizes the relationship between social sustainability indicators, followed by a discussion.
1. Introduction
Social and cultural needs, such as attachment, social relations, and networks in daily life, are beginning to be emphasized in the sustainable development agenda [1,2,3]. Although there are significant differences in ideas, goals, and themes in the literature, social sustainability is always linked to how people, communities, and societies interact with each other, now and in the future. Traditional subjects such as equity, inclusion, justice, and poverty have been expanded by more intangible themes such as sense of place, social interaction, and identity, as seen in the chronological assessment of the social sustainability literature. This shift from ‘hard’ to ‘soft’ themes, as Colantonio [2] puts it, places importance on the social role of urban space in achieving ‘soft’ goals. Concerns about communities and societies have inspired a critical reconsideration of urban environments, ushering in a period of unprecedented change and instability, with space-related social issues at the forefront. We need to redefine the reasoning for social challenges since various concepts impact them. Urban space, with its sociospatial contributions to society, offers enormous potential for achieving social goals by allowing for the realization of socially sustainable cities. Many arguments have arisen about the role of housing in social sustainability, including vulnerable or disadvantaged groups, design, planning, participation, governance, history, and policy [4,5,6,7,8]. The urban form is another subject that receives extensive attention due to its relationship to urban space [9,10,11,12,13,14,15,16,17,18]. However, achieving social sustainability is not limited to concerns about housing or just the urban form; it should include the sociospatial aspects provided by the urban space.
The research aims to improve our understanding of social sustainability dynamics by emphasizing sociospatial indicators. We propose a pentagon model with distinctive dimensions to evaluate urban social sustainability. By conducting a summary of key findings, we address the following research questions: (1) What are the sociospatial dimensions of social sustainability? (2) In what ways do urban-attributed issues contribute to social sustainability? (3) How do the indicators in the pentagon model relate to each other regarding their contribution to social sustainability? By answering these questions, this study discovers the influence of sociospatial aspects of urban space on social sustainability, with a case study in Izmir, Turkey, as a representative of other cities in developing countries.
The rest of the paper is structured as follows: The second section introduces the study’s conceptual framework and gives a brief review of social sustainability. The third section explains the research methodology applied to Izmir as a case study. It briefly introduces two study areas, presenting their spatial analysis. The fourth section summarizes the findings on social sustainability in two settlements, combining a spatial analysis and questionnaire survey data, followed by a discussion. It outlines the relationship between urban-attributed issues and social sustainability. In conclusion, we provide some recommendations to build more socially sustainable urban spaces.
2. Pentagon Model: Social Sustainability and Its Sociospatial Aspects
Social sustainability is a multifaceted concept addressed as an approach, a paradigm, or a tool in various fields with no agreement on a singular definition. It exists as a gray area between academia, politics, and practice. Discipline-based research, in which context-dependent definitions, indicators, and measurement criteria dominate, is used for determining its theoretical and methodological foundations [1,6,8]. According to Yiftachel and Hedgcock [19], social sustainability means a city’s long-term viability as a setting for human interaction, communication, and cultural growth. Polese and Stren [20] define it as development and/or growth compatible with civil society’s harmonious evolution, fostering an environment conducive to the compatible cohabitation of culturally and socially diverse groups while encouraging social integration and improving the quality of life for all segments of the population.
Some scholars prefer to introduce key themes, aspects, or criteria related to sustainability’s social dimension rather than seeking a consensus definition [6]. According to Bramley et al. [1], social sustainability has two fundamental dimensions: social equity and the sustainability of communities. Social equity includes affordable housing and access to services and opportunities. Sustainability of communities refers to social interaction, social cohesion, social capital, attachment, sense of safety, satisfaction, and participation. Dempsey et al. [18] introduced an additional factor to this framework: environmental equity, which involves the opportunity to access green areas and open spaces. Although the terminology used in diverse research appears similar, it may not be identical in terms of content and meaning throughout the literature [6]. Landorf [5], for example, agrees that one of the three pillars of social sustainability is social equity. However, he defines social equity as the quantity and diversity of housing infrastructure at the level of access to services, amenities, and opportunities. Concisely, the themes and dimensions frequently mentioned throughout the literature include social equity, social cohesion, social capital, sustainability of the community, and environmental equity [1,12,13,18].
Since social sustainability is diverse and multidimensional, multiple conceptual frameworks in the subject have no consensus on evaluation criteria. We investigated various approaches to social sustainability to provide a conceptual model of its relationship to urban space [1,3,5,18,21,22,23,24,25] (Table 1). The literature shows that, in exploring the relationship between urban space and social sustainability, many studies prefer more particular urban form characteristics, especially density, with some contradictory results [1,12,13,14,18,26]. Numerous studies have demonstrated the controversial consequences of density for social sustainability, emphasizing that the relationship between these factors is nonlinear and highly context-dependent and mediated by other factors that significantly impact the type of influence [27]. Despite the fact that urban form has a significant effect on urban design and planning, it should not be considered the only concern when assessing social sustainability. Undoubtedly, density defines a city’s inherent capacity in public transportation, public spaces, and shared services and facilities [14]. However, the social concerns about density’s effect may be attributed to the sociospatial aspects of urban areas rather than the design of the urban form, as this study aims to reveal. Although this study excludes issues relating to urban form in the research context, we include some factors such as mixed land use with participants’ assessment of other features through walkable distance (in the scope of accessibility) and providing places for daily operations. Rather than using urban form terminologies, we prefer a more place-centric approach.
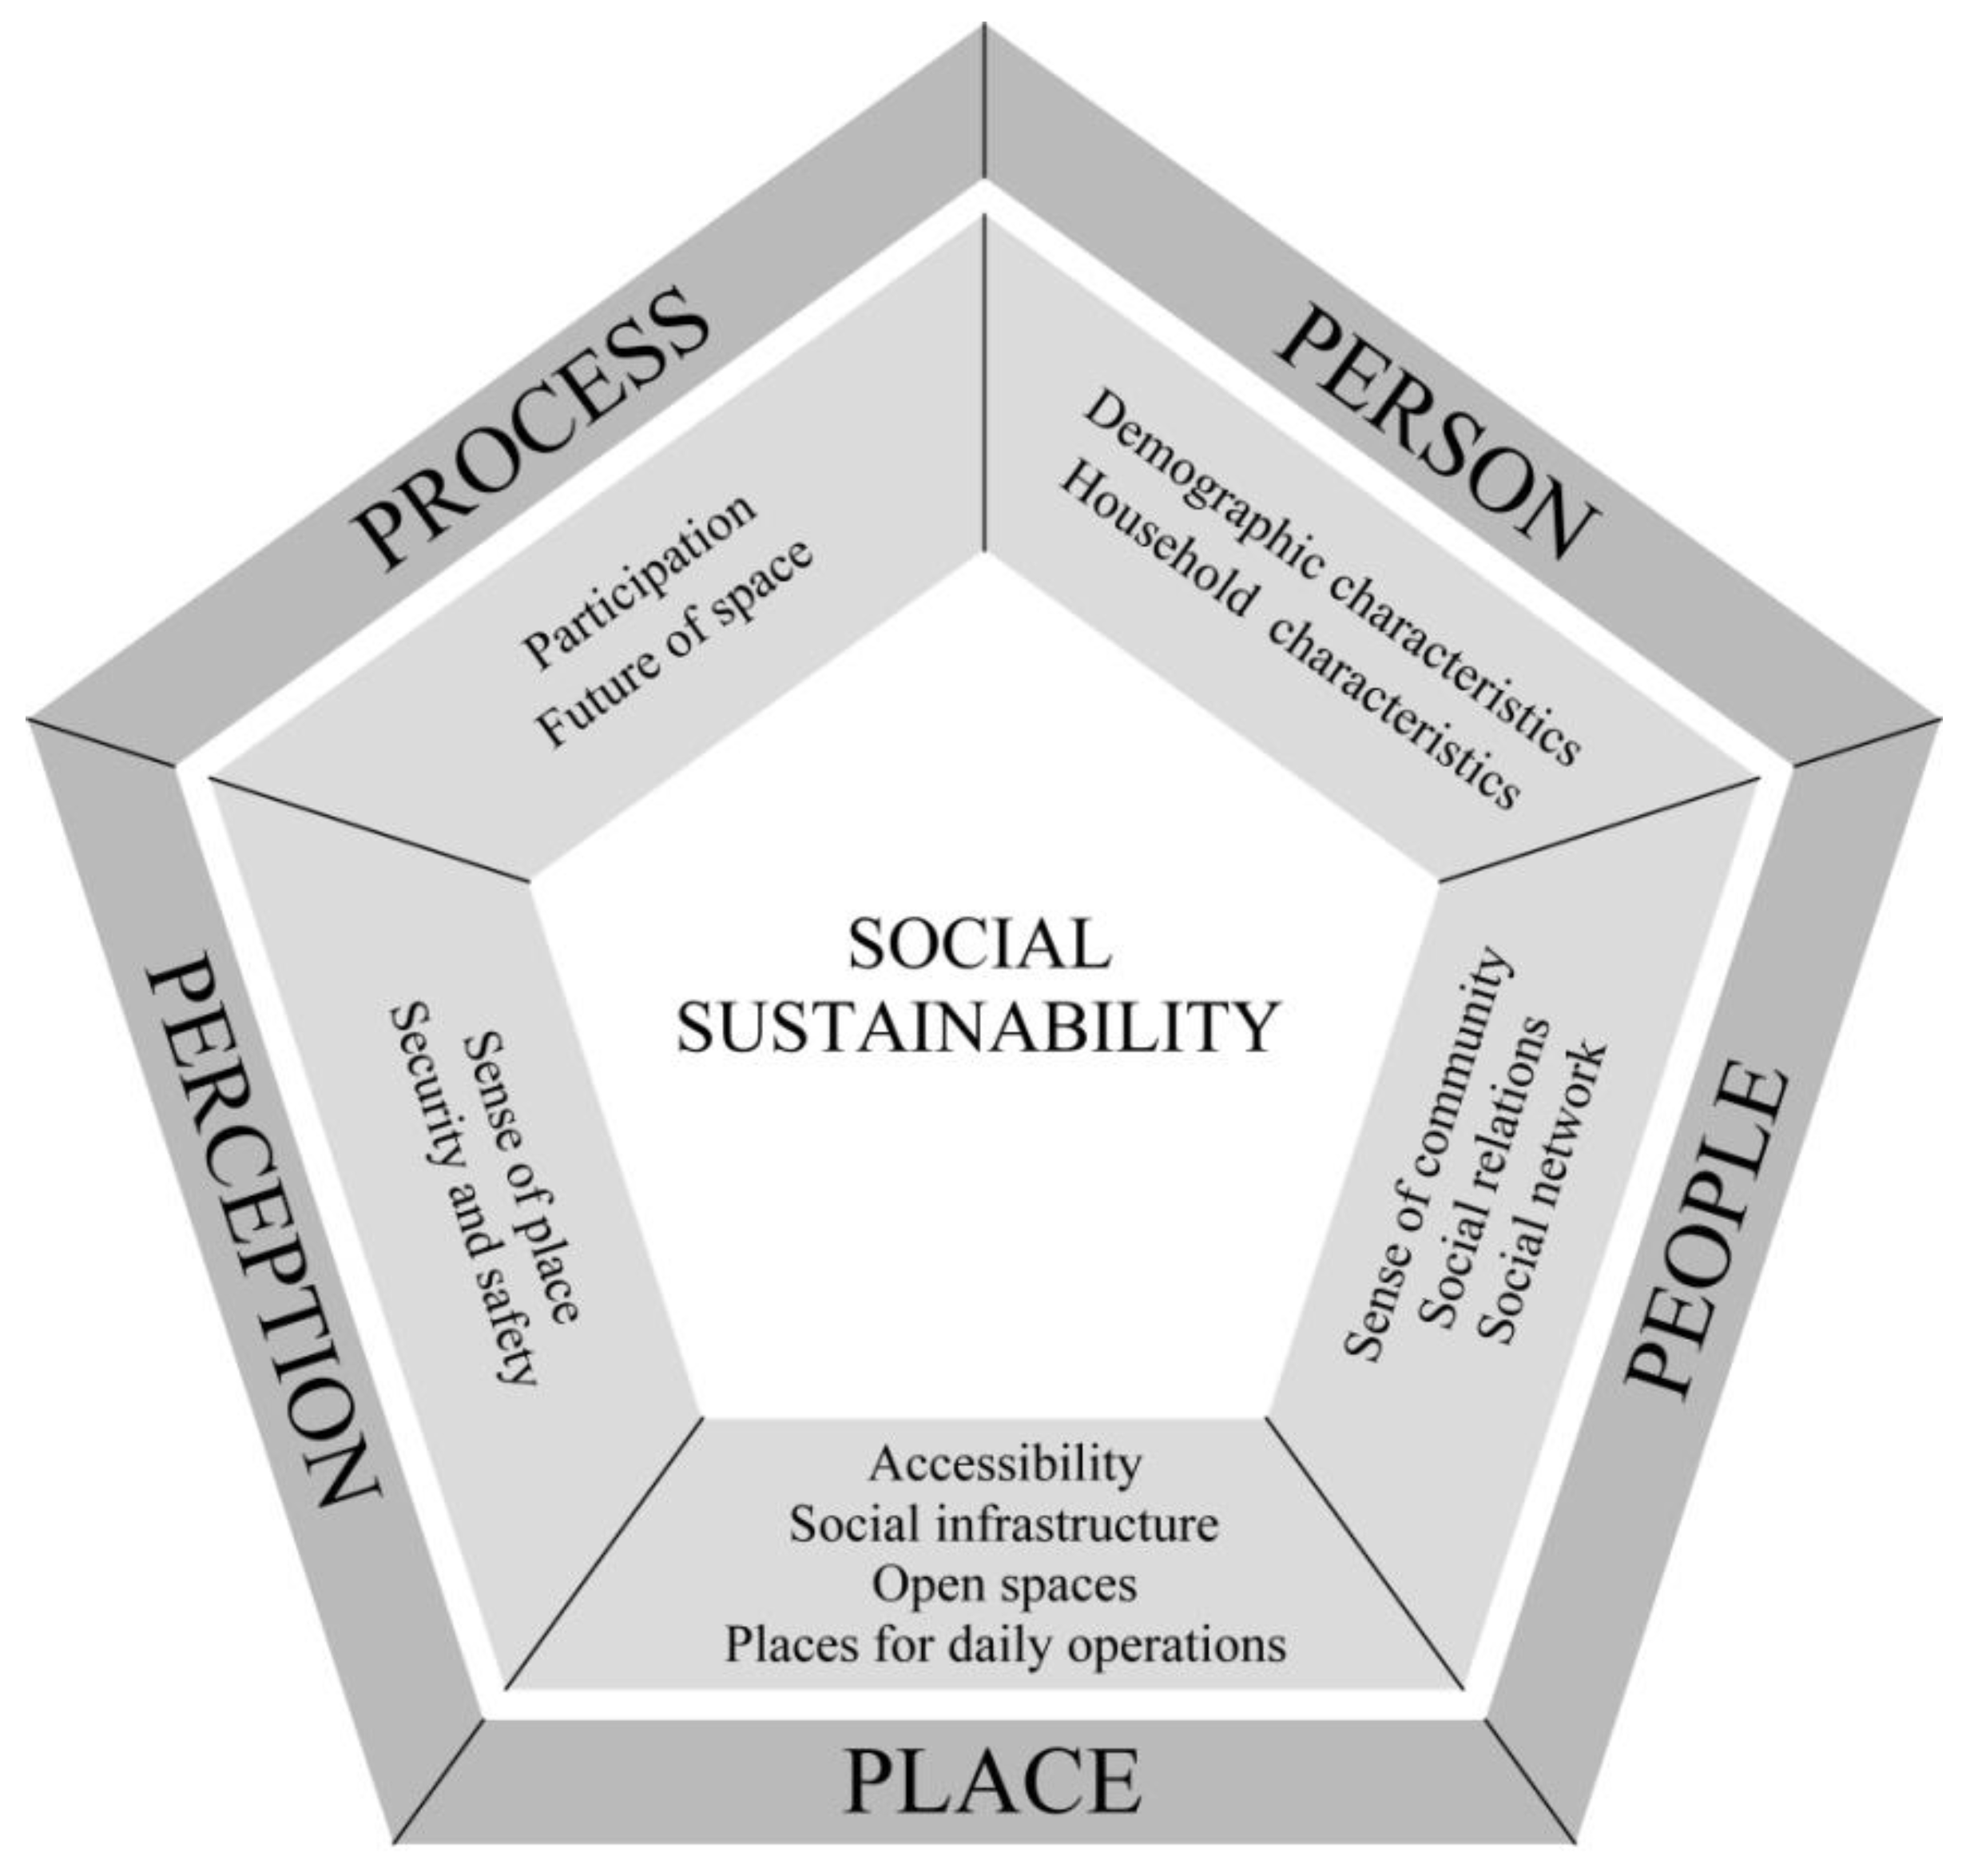
This study suggests a pentagon model for urban social sustainability, including five dimensions: person, place, people, perception, and process. The pentagon model suggests a different approach to social sustainability compared to other conceptual frameworks in the literature, as Table 1 illustrates via several examples. First, we believe that the different dimensions of social sustainability are interconnected and have an iterative effect on each other. Therefore, we assume that each dimension is both an explanatory and a response variable in ensuring social sustainability. Many studies try to establish a cause-and-effect relationship between urban form and social sustainability, but we suggest the 5P dimensions of the pentagon model as a way of understanding their integrated relation. Second, different to other conceptual frameworks, this study also considers the “person,” with given demographic and household characteristics, as one of the main dimensions. By recognizing the distinct effects of individual characteristics on the place, people, perception, and process dimensions, we can develop more inclusive and diversified urban policy and planning strategies by combining them with participation tools. This may help to meet the needs and expectations of different users and social groups, which are social sustainability objectives.
In addition, we believe the “place” dimension is the most significant variable in the pentagon model, which we can involve directly with design and planning tools, as well as because of its tremendous influence on the other three dimensions, people, perception, and process. We present its indicators as accessibility [3,12,17,22,23,24,25,29,31,32], social infrastructure [1,3,5,12,13,18,22,23,24,25,29,30,32,33,34], open spaces [3,12,18,23,25,35], and places for daily activities [23,26,36] in the place dimension, with their opportunities and sociospatial contributions to social sustainability through urban space. While indicators of the place dimension are directly associated with urban space, indicators of the people, perception, and process may be considered a social response, in which urban space plays an integral part in building and maintaining it. The “people” dimension, including the sense of community, social relations, and social networks [1,3,5,12,13,15,18,24,25,30,34,35,37,38,39], affects the place, perception, and process dimensions. The “perception” dimension includes the sense of place [1,3,13,15,18,30,33,34,38,39], and security and safety [1,3,5,12,13,15,17,18,22,25,29,30,31,34,37,39].
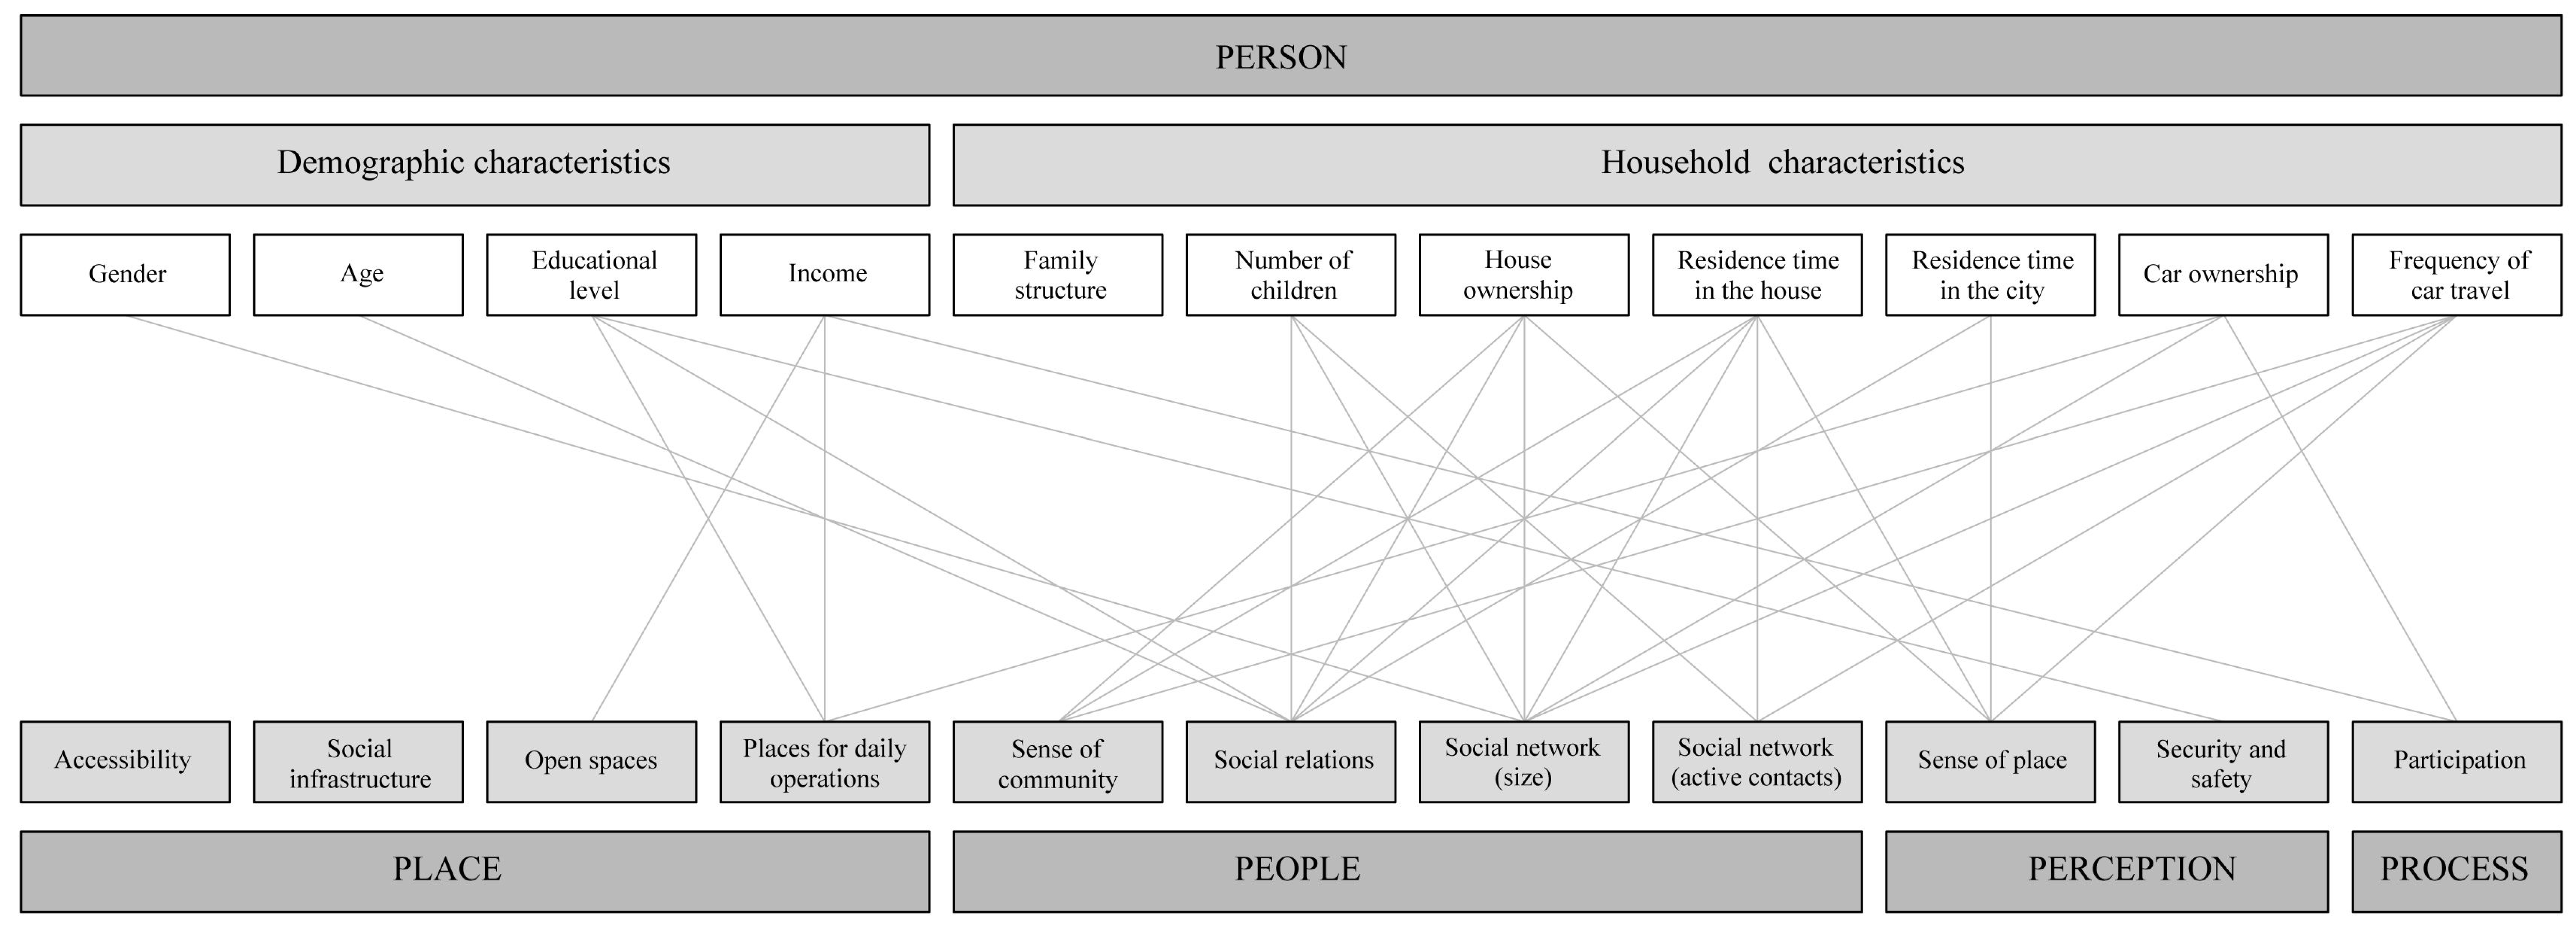
The pentagon model includes the “process” dimension since sustainability is intrinsically a dynamic and continuous notion rather than a static outcome or circumstance. In this context, the participation of the citizens in the processes related to the urban space [1,5,13,15,23,25,29,33,37,39] and the space’s ability to respond to the needs and expectations of the future society was also seen as a part of the model. Adaptability and flexibility are significant design principles in architectural and urban spaces. Spatial features of adaptability and flexibility support various lifestyles and users with various expectations and needs. However, we prefer to mention these qualities for the future of space as its development through time and responsiveness to future needs. Social values will undoubtedly change over time, regardless of how well we incorporate social visions into the built environment [29]. This underlines the importance of flexible, adaptive, and resilient environments to adjust to changing demands and consider future society’s needs. However, the future of the space is excluded from the scope of the case studies since it requires repeated evaluation. Figure 1 shows the pentagon model as the study’s conceptual framework in which the sociospatial aspects of urban space are considered both a contributor and an indicator for evaluating social sustainability. Considering that various researchers use these terms to complement or substitute for one another or even refer to different content, we refer to these dimensions as umbrella concepts regarding the relationships between urban space and social sustainability (Table 2). The indicators suggested for the pentagon model are listed in Table 2, mentioning scholars in the social sustainability literature. Regarding the indicators of the person dimension, a few studies consider house ownership and residence time as measures of residential or community stability [1,12,18,34,39], which are submeasures of household characteristics for our pentagon model. However, they are excluded from the indicators table since they correspond to neither the contextual structure nor the hierarchical level of measurement in our framework’s scope.
3. Methods and Data
This study aims to determine the relationship between sociospatial aspects of urban space and social sustainability in residential areas, especially in Turkey, a developing country. The research framework comprises a spatial analysis, a questionnaire survey, and statistical analyses. The study areas were chosen from settlements developed in the second half of the 20th century in Karsiyaka, Izmir. Both settlements are located in the city center of Izmir, which represents the relevant dynamics and features of a modern urban space. Among the reasons for choosing Izmir as a case study was its potential to represent Turkey as a modern city in a developing country. Developing countries tend to have several features in common due to their history and geography, particularly in how social, cultural, and economic developments affect the urban space. Turkey has a complex social structure due to intersecting multiple cultures at a strategic location where East meets West. Izmir is an excellent example, having a diverse social structure formed by several ethnicities and religions, even before the foundation of the republic, affecting its social and cultural fabric and its urban space.
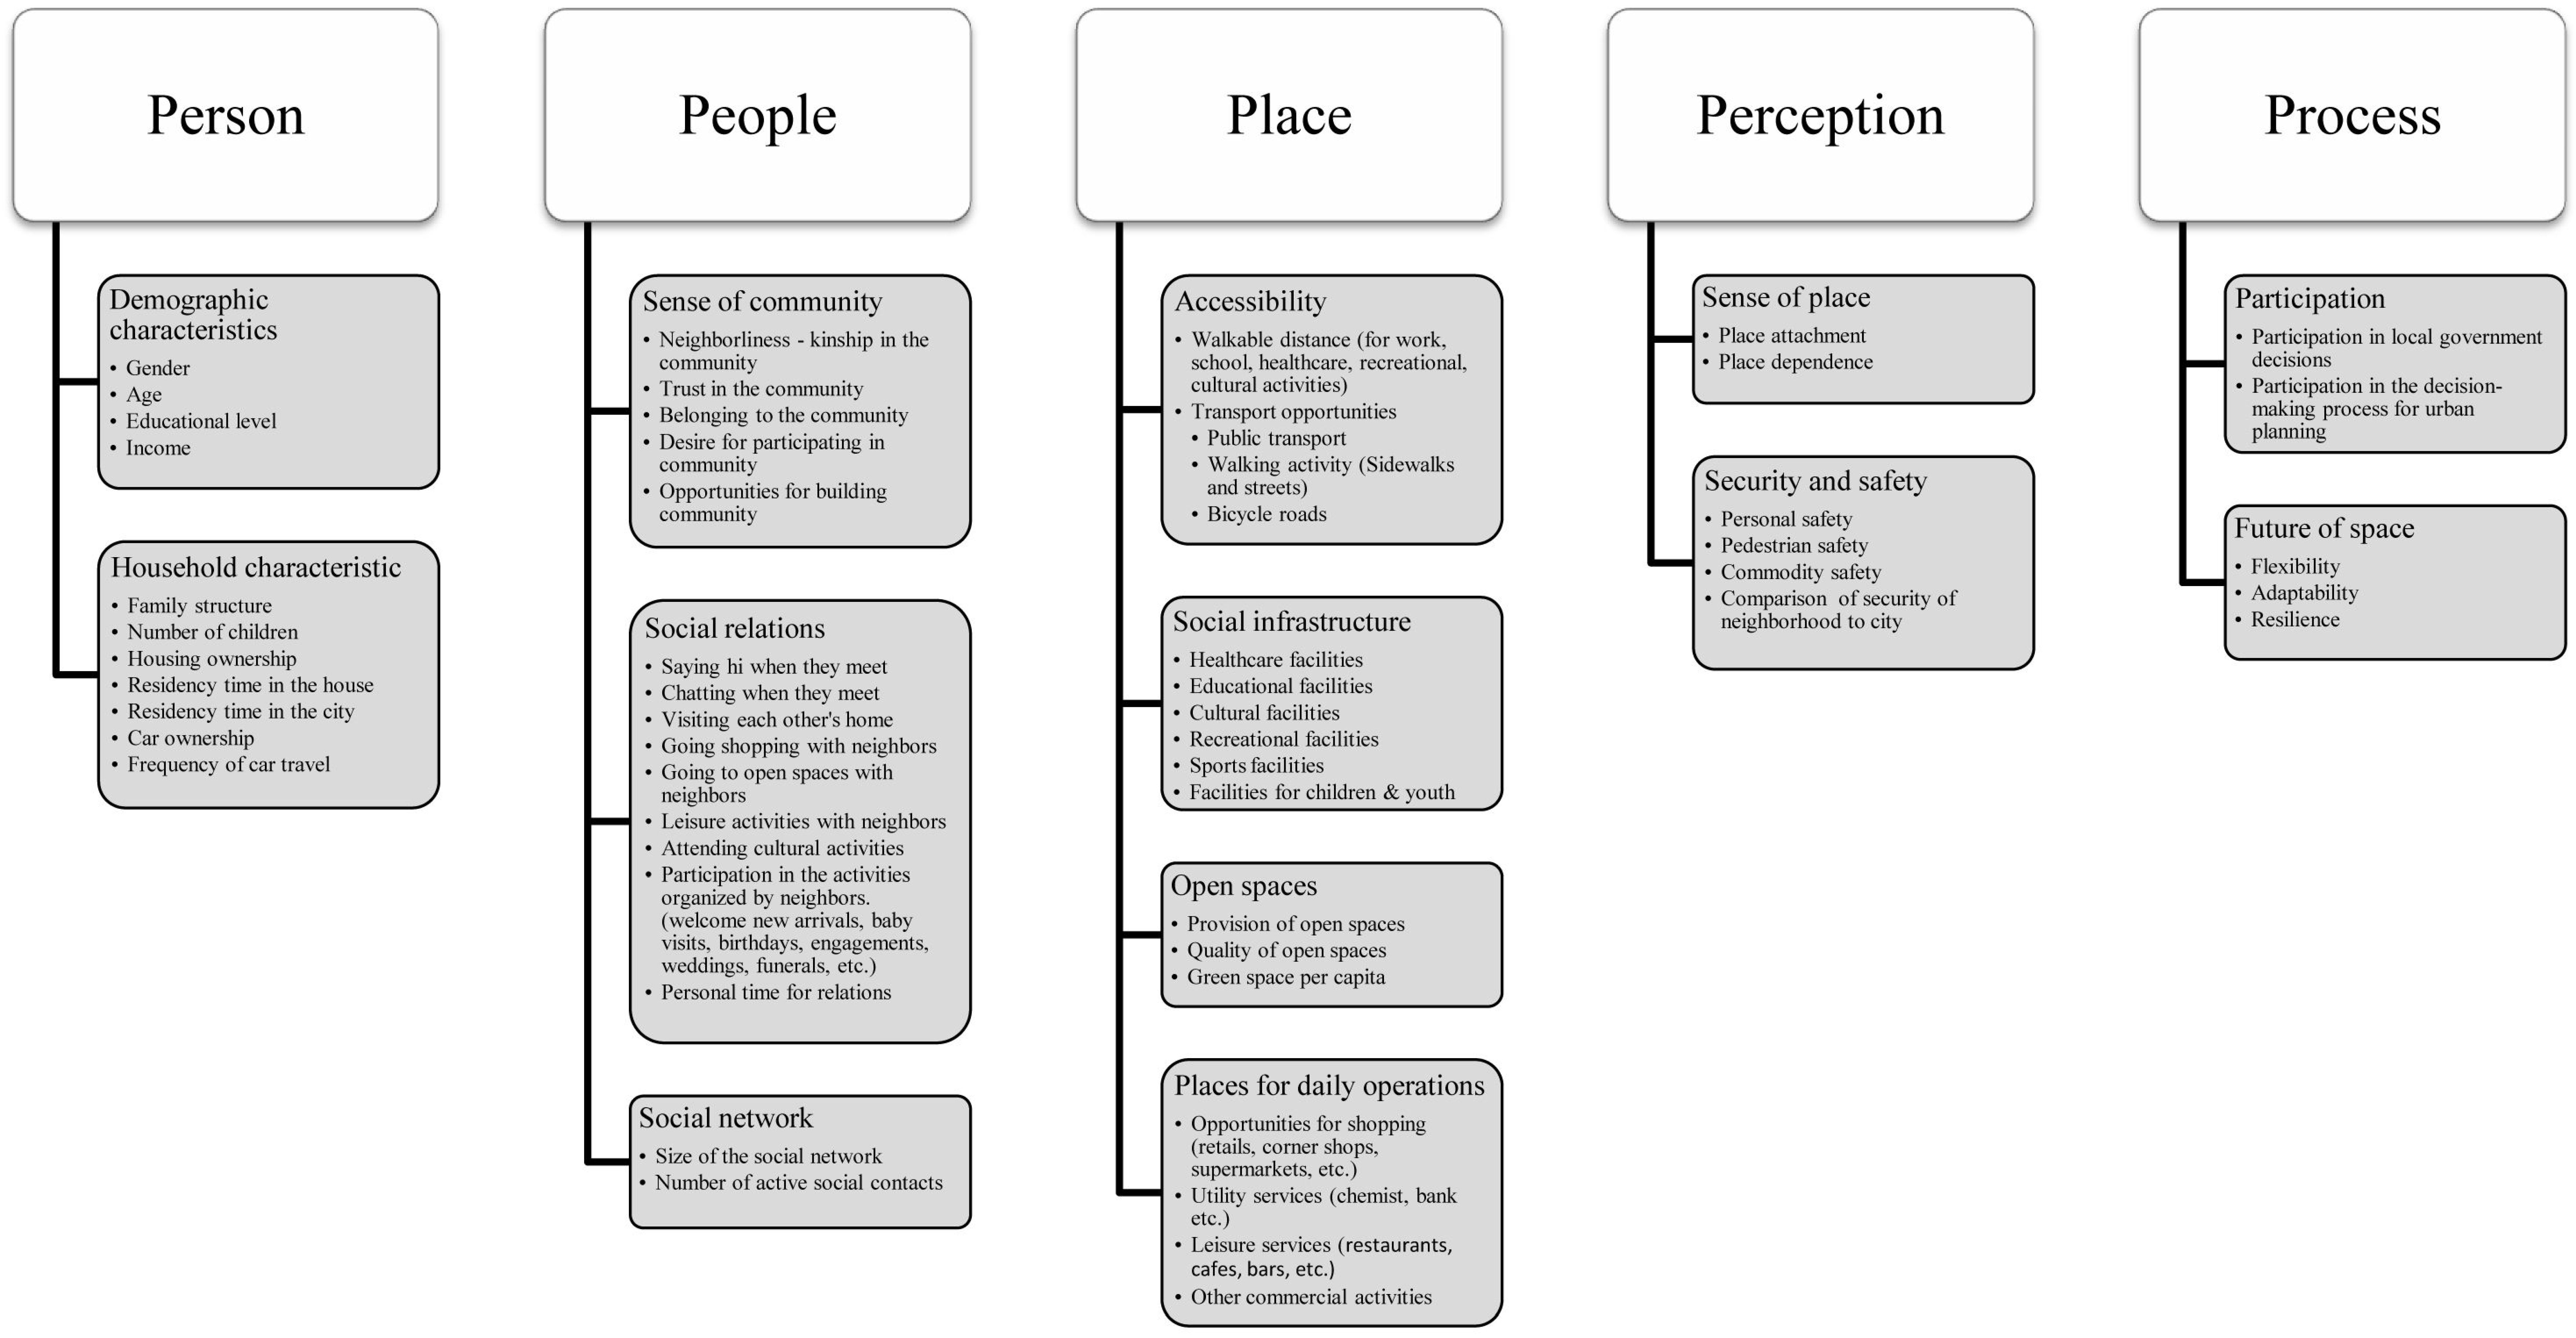
The questionnaire was designed by using previous discussions as a guide. It includes questions about the participants’ demographic characteristics and sociospatial indicators of social sustainability. The themes presented in Figure 2, categorized as dimensions, indicators, and measures, were determined by reviewing the empirical studies about social sustainability mentioned in Table 2 while considering urban-attributed issues as a focus of attention. Quantitative variables were structured as open-ended questions to minimize reporting bias and reconstructed when categorical variables were required in the analysis. Respondents scored each statement relating to the variables with a 5-point Likert-type scale. As a pilot test, 50 participants of varying ages, levels of education, and housing backgrounds participated in the questionnaire. Following revisions, the final questionnaire was conducted face-to-face with 500 residents, 250 for each study area. A total of 234 questionnaires were valid for the evaluation, equating to a 46.8% response rate.
3.1. Study Areas
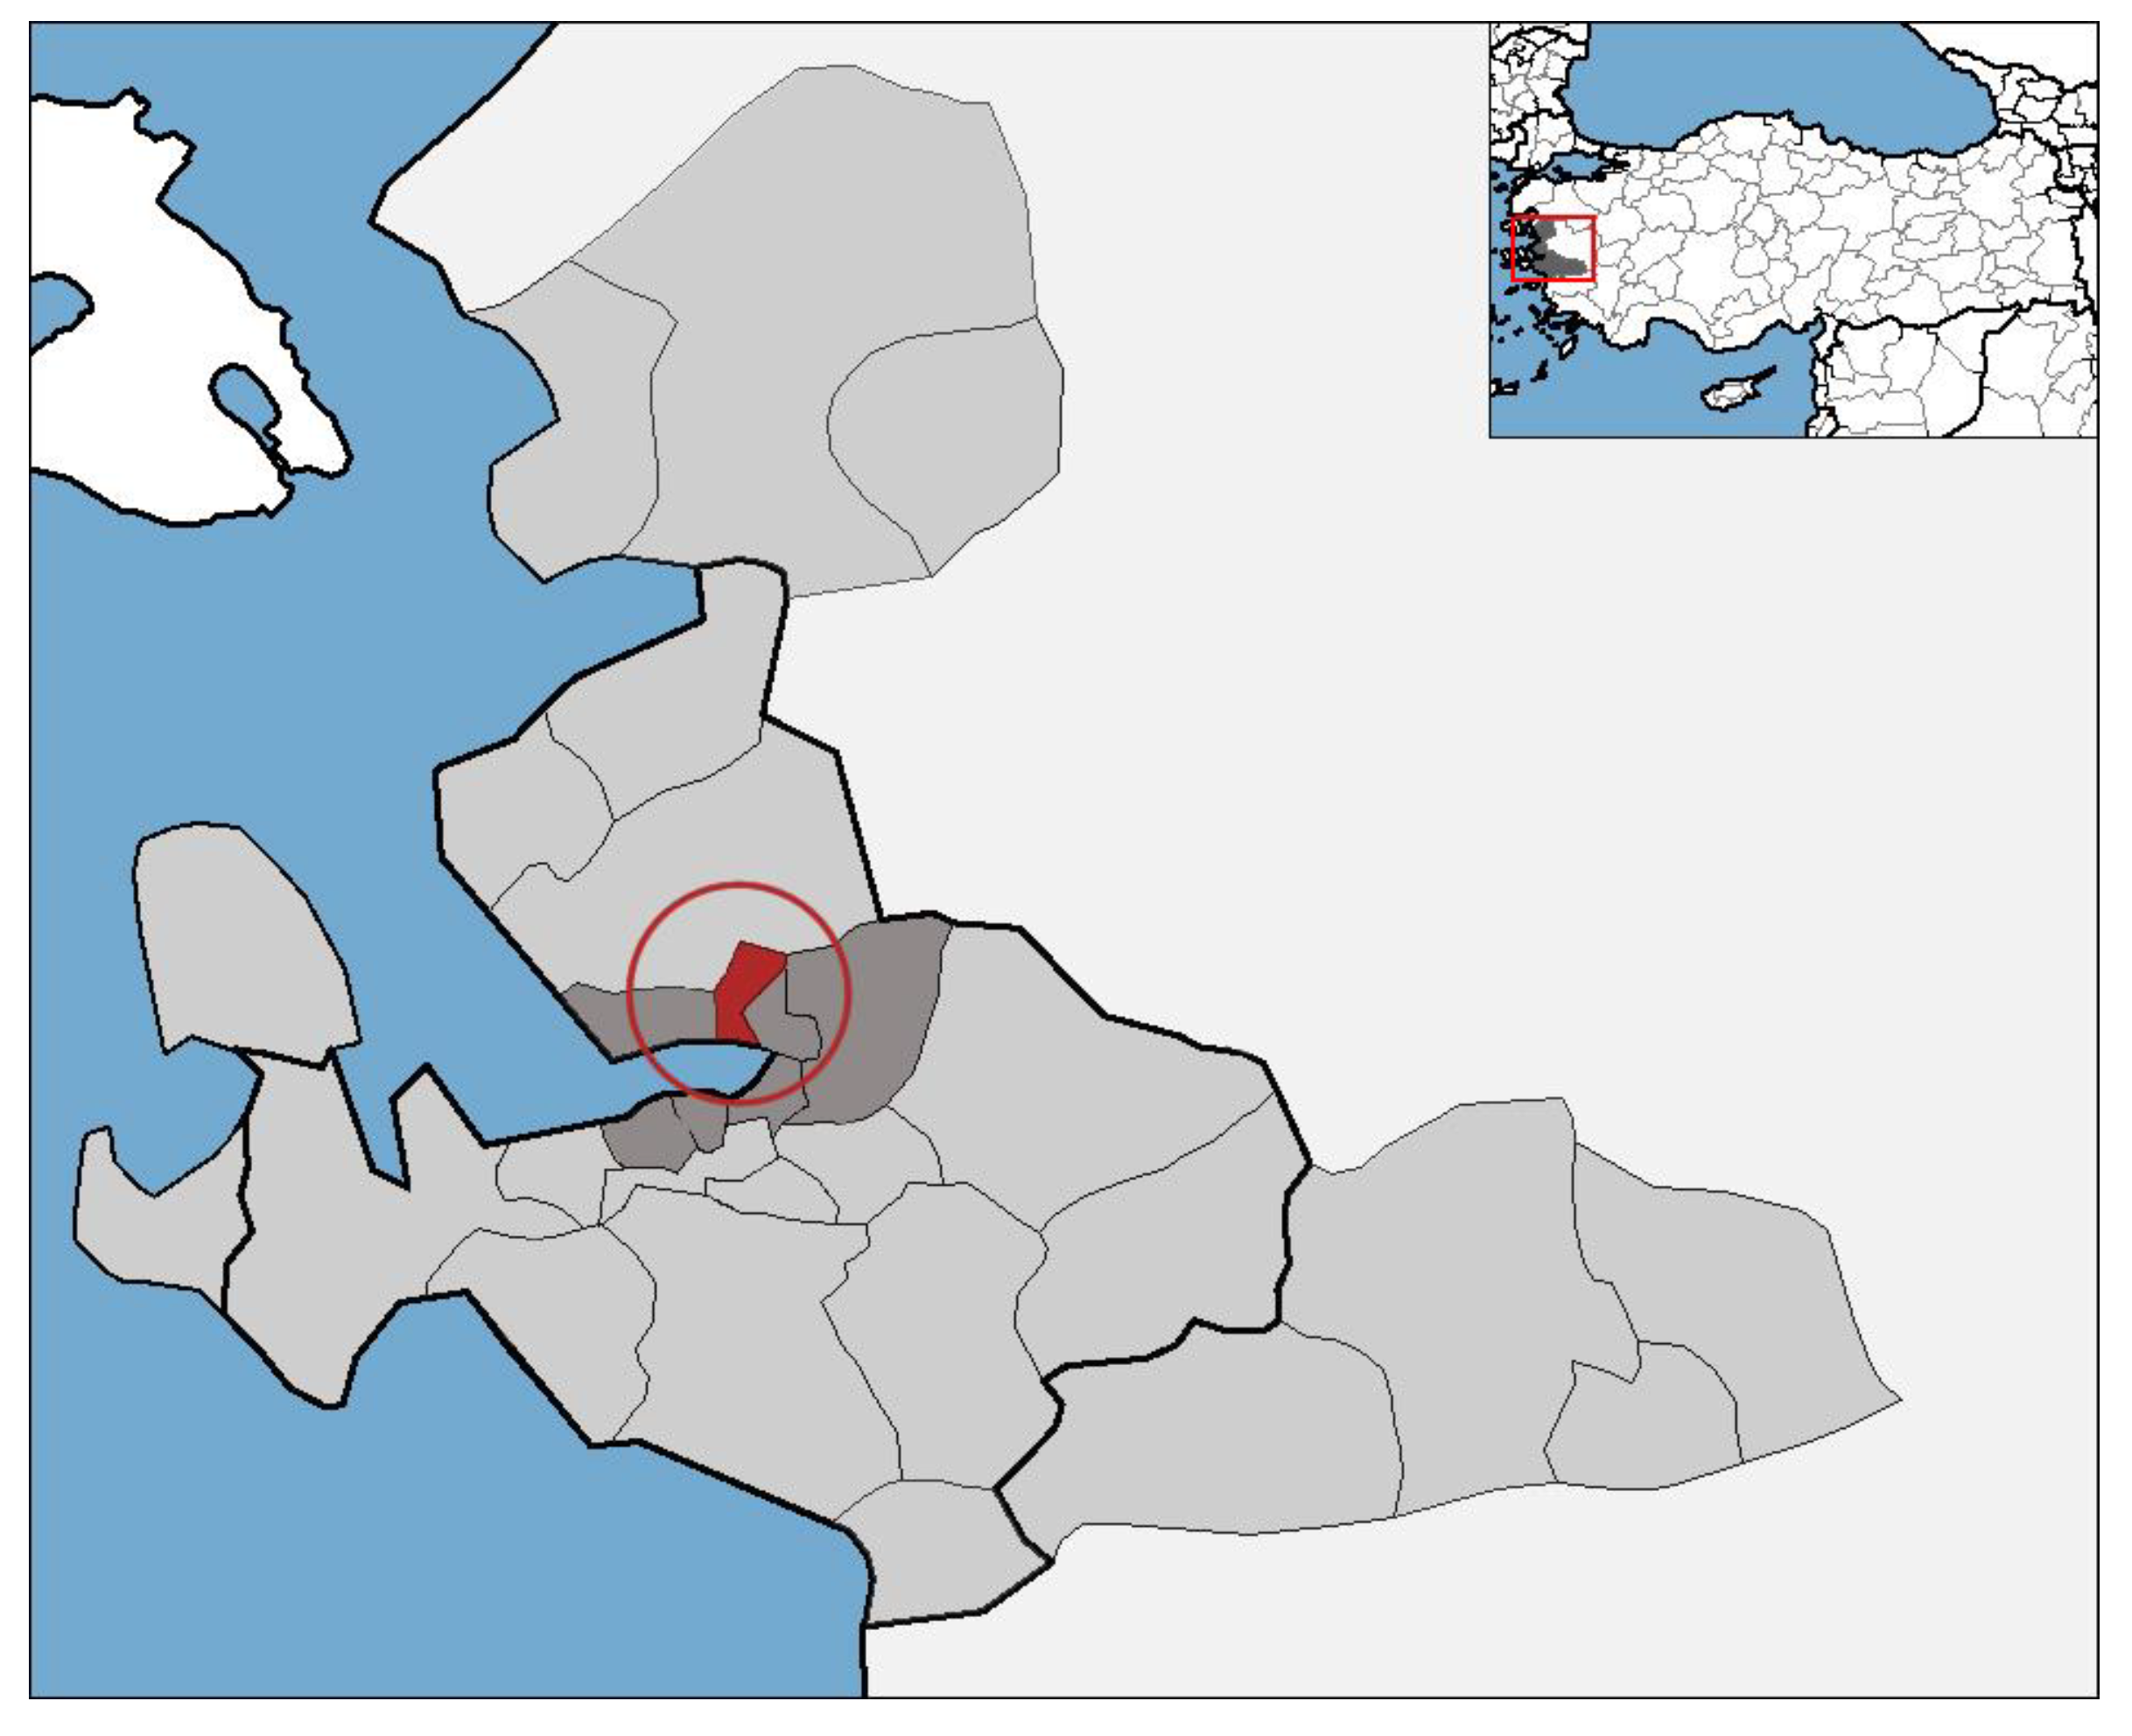
Located in the west of Turkey, with over 4 million inhabitants, Izmir is the country’s third most populous city (Figure 3). As one of Anatolia’s oldest settlements, the natural port structure, which is unique to its geography, is the basis of the urban development of Izmir. Izmir, a small coastal town during the 17th century, has grown into a vital population center due to the rapid expansion of coastal usage as a commercial nexus [41]. Its geographical characteristics and location significantly influenced its urban development during the pre- and post-industrial periods. Karsiyaka, one of the significant districts around the gulf, is located north of the city. Despite the regional and economic growth of Izmir, there was no substantial urban development in Karsiyaka until the mid-nineteenth century [42]. We chose Karsiyaka as a study area since its urban space developed in line with the twentieth century’s urbanization dynamics.
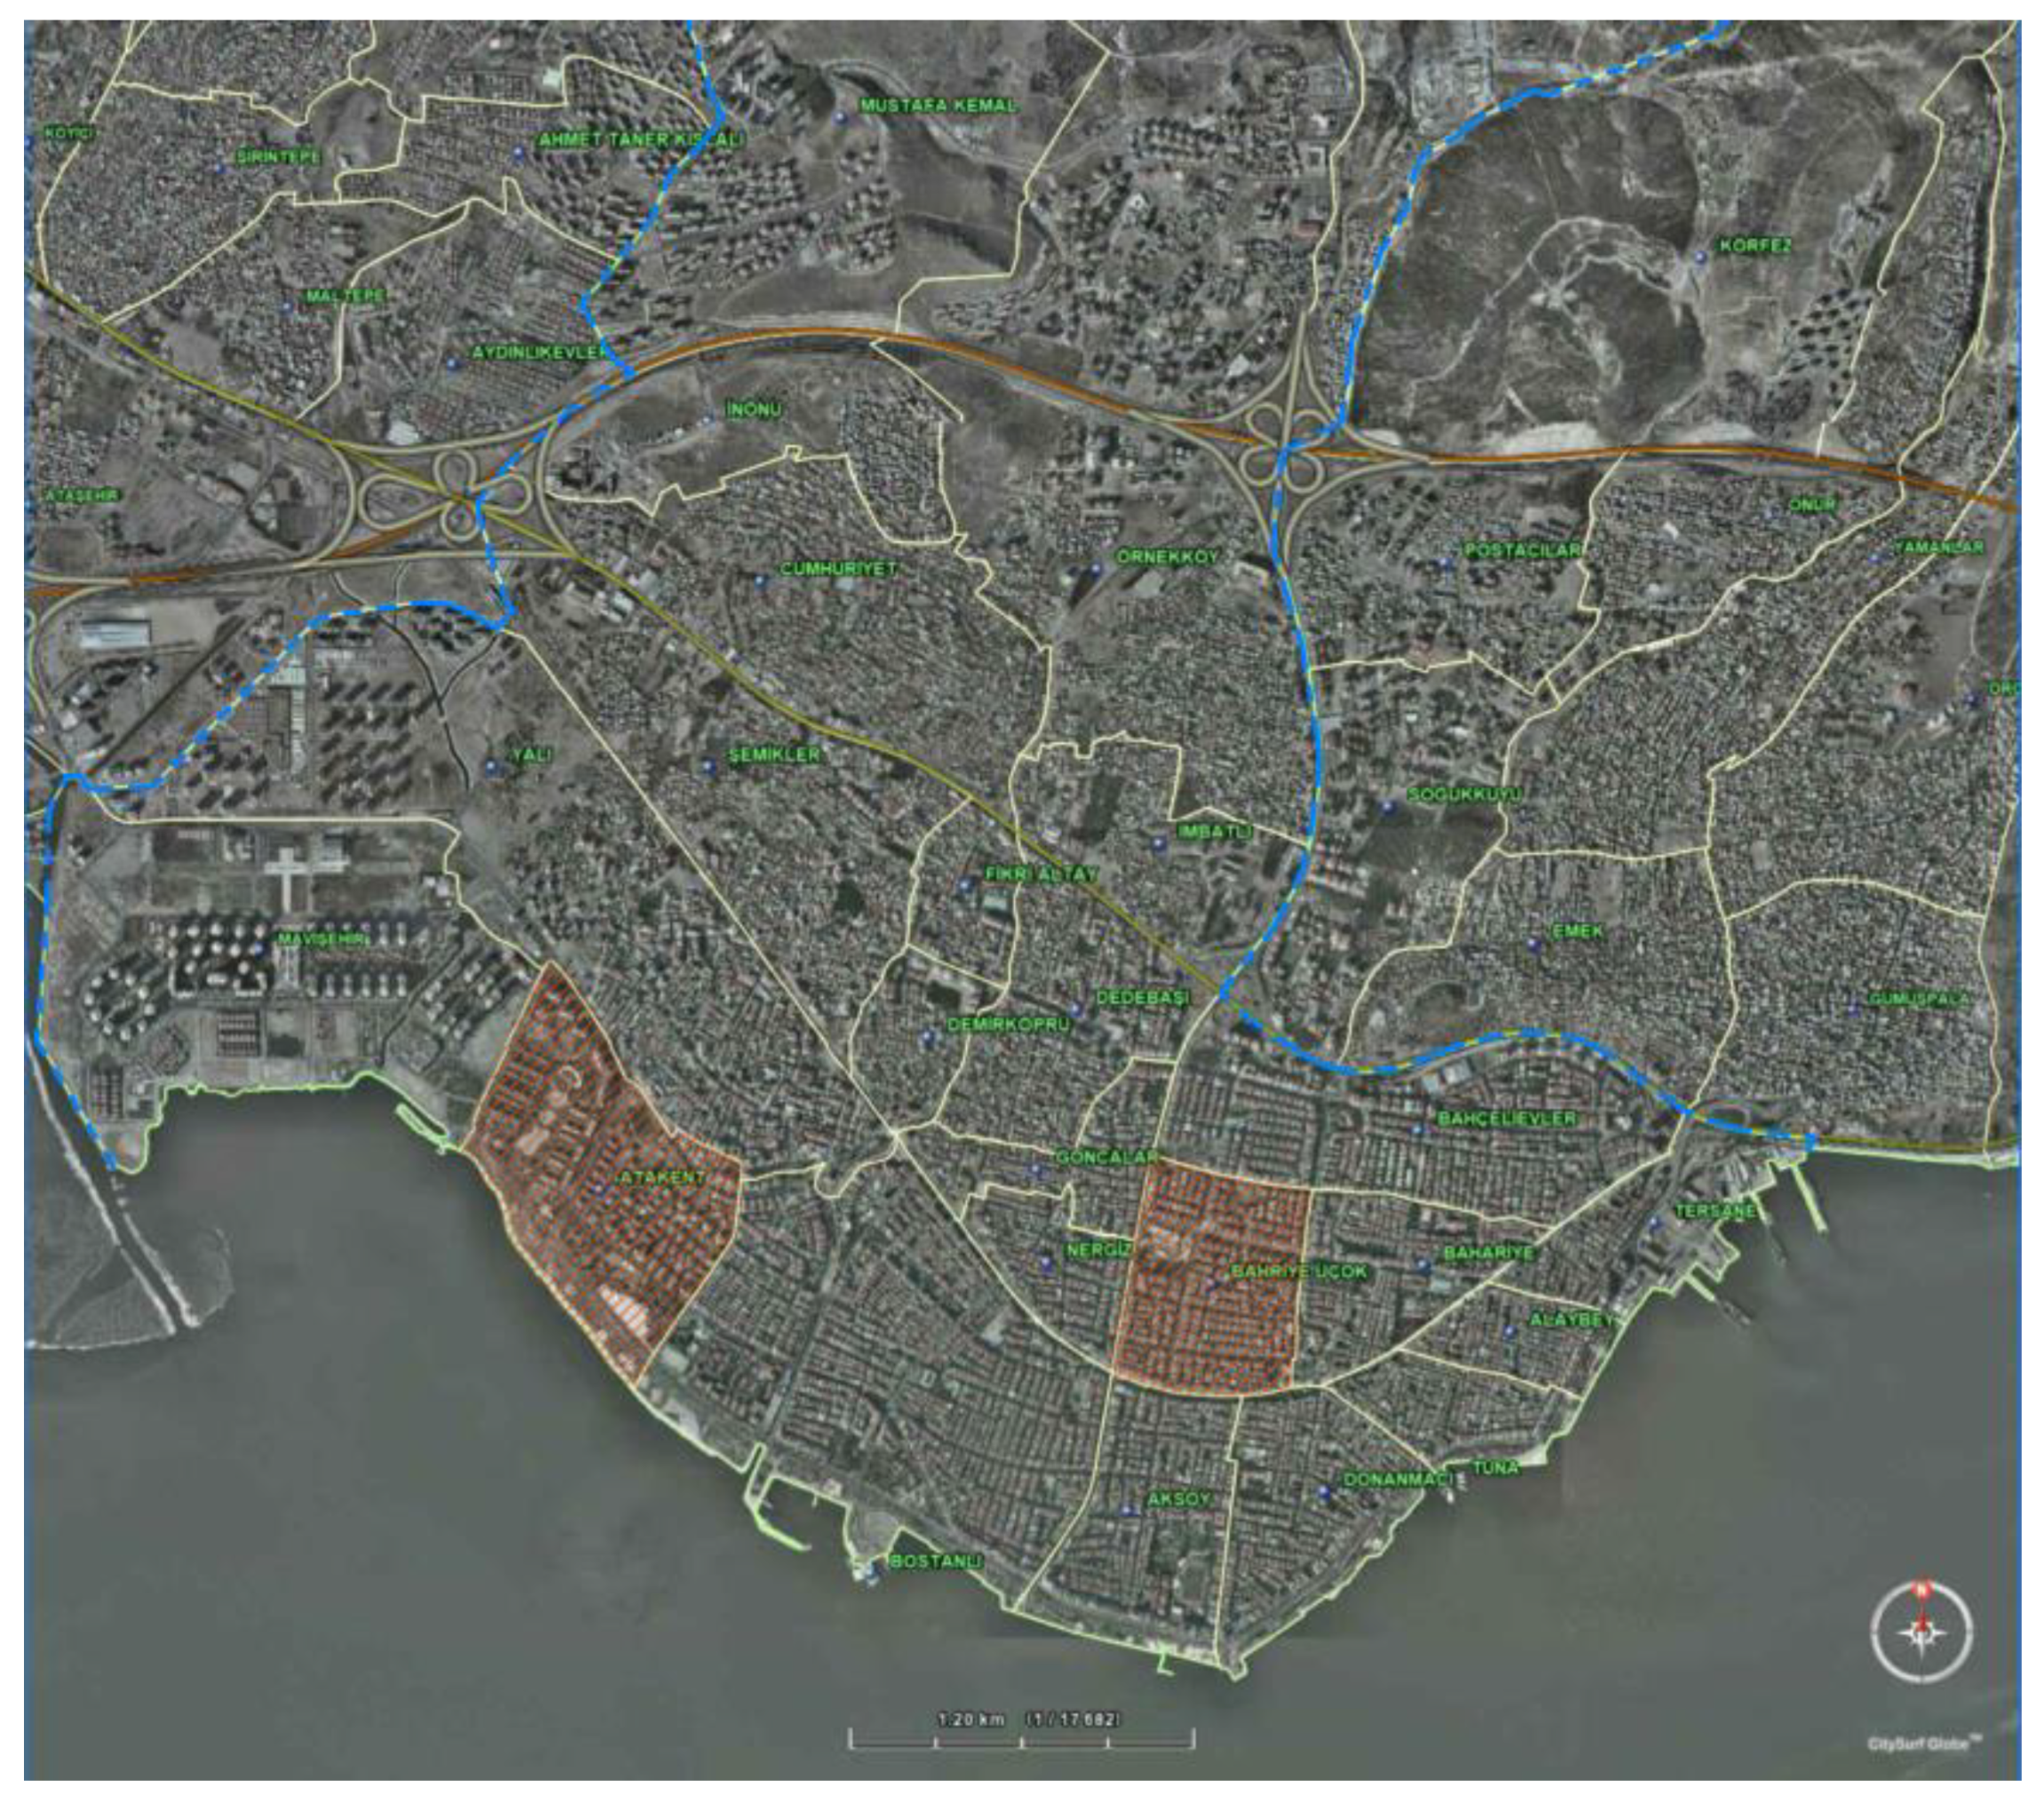
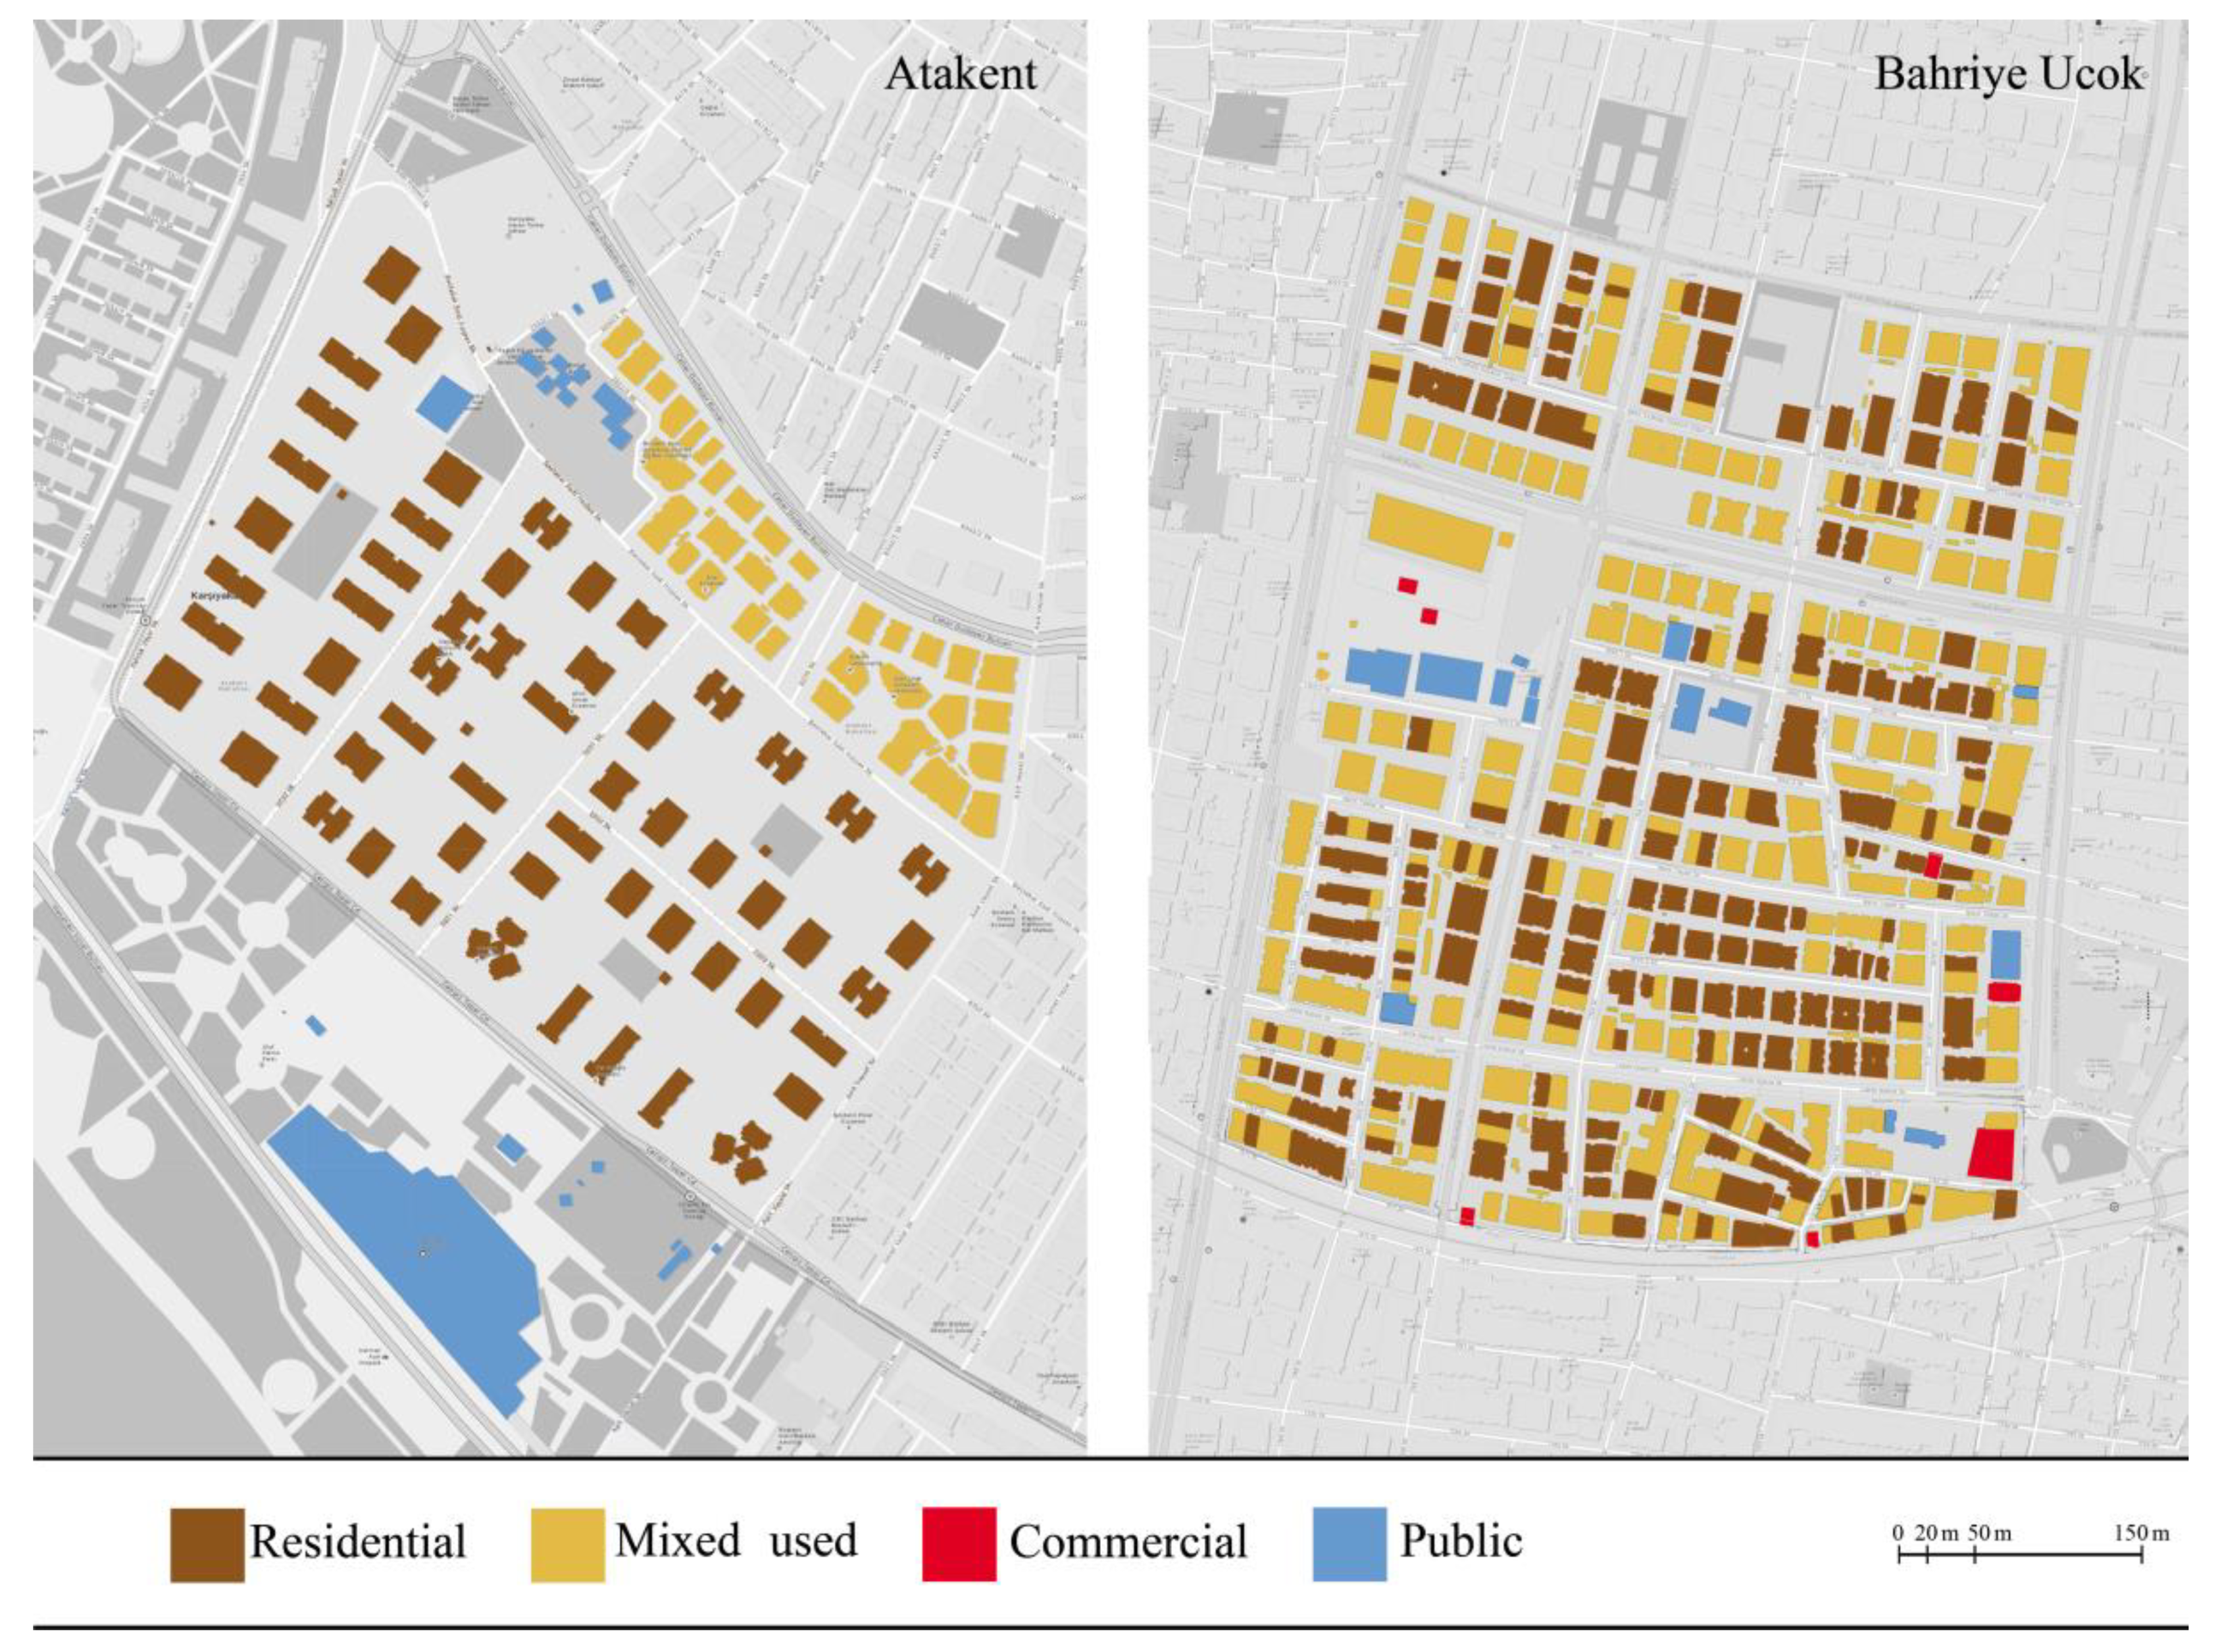
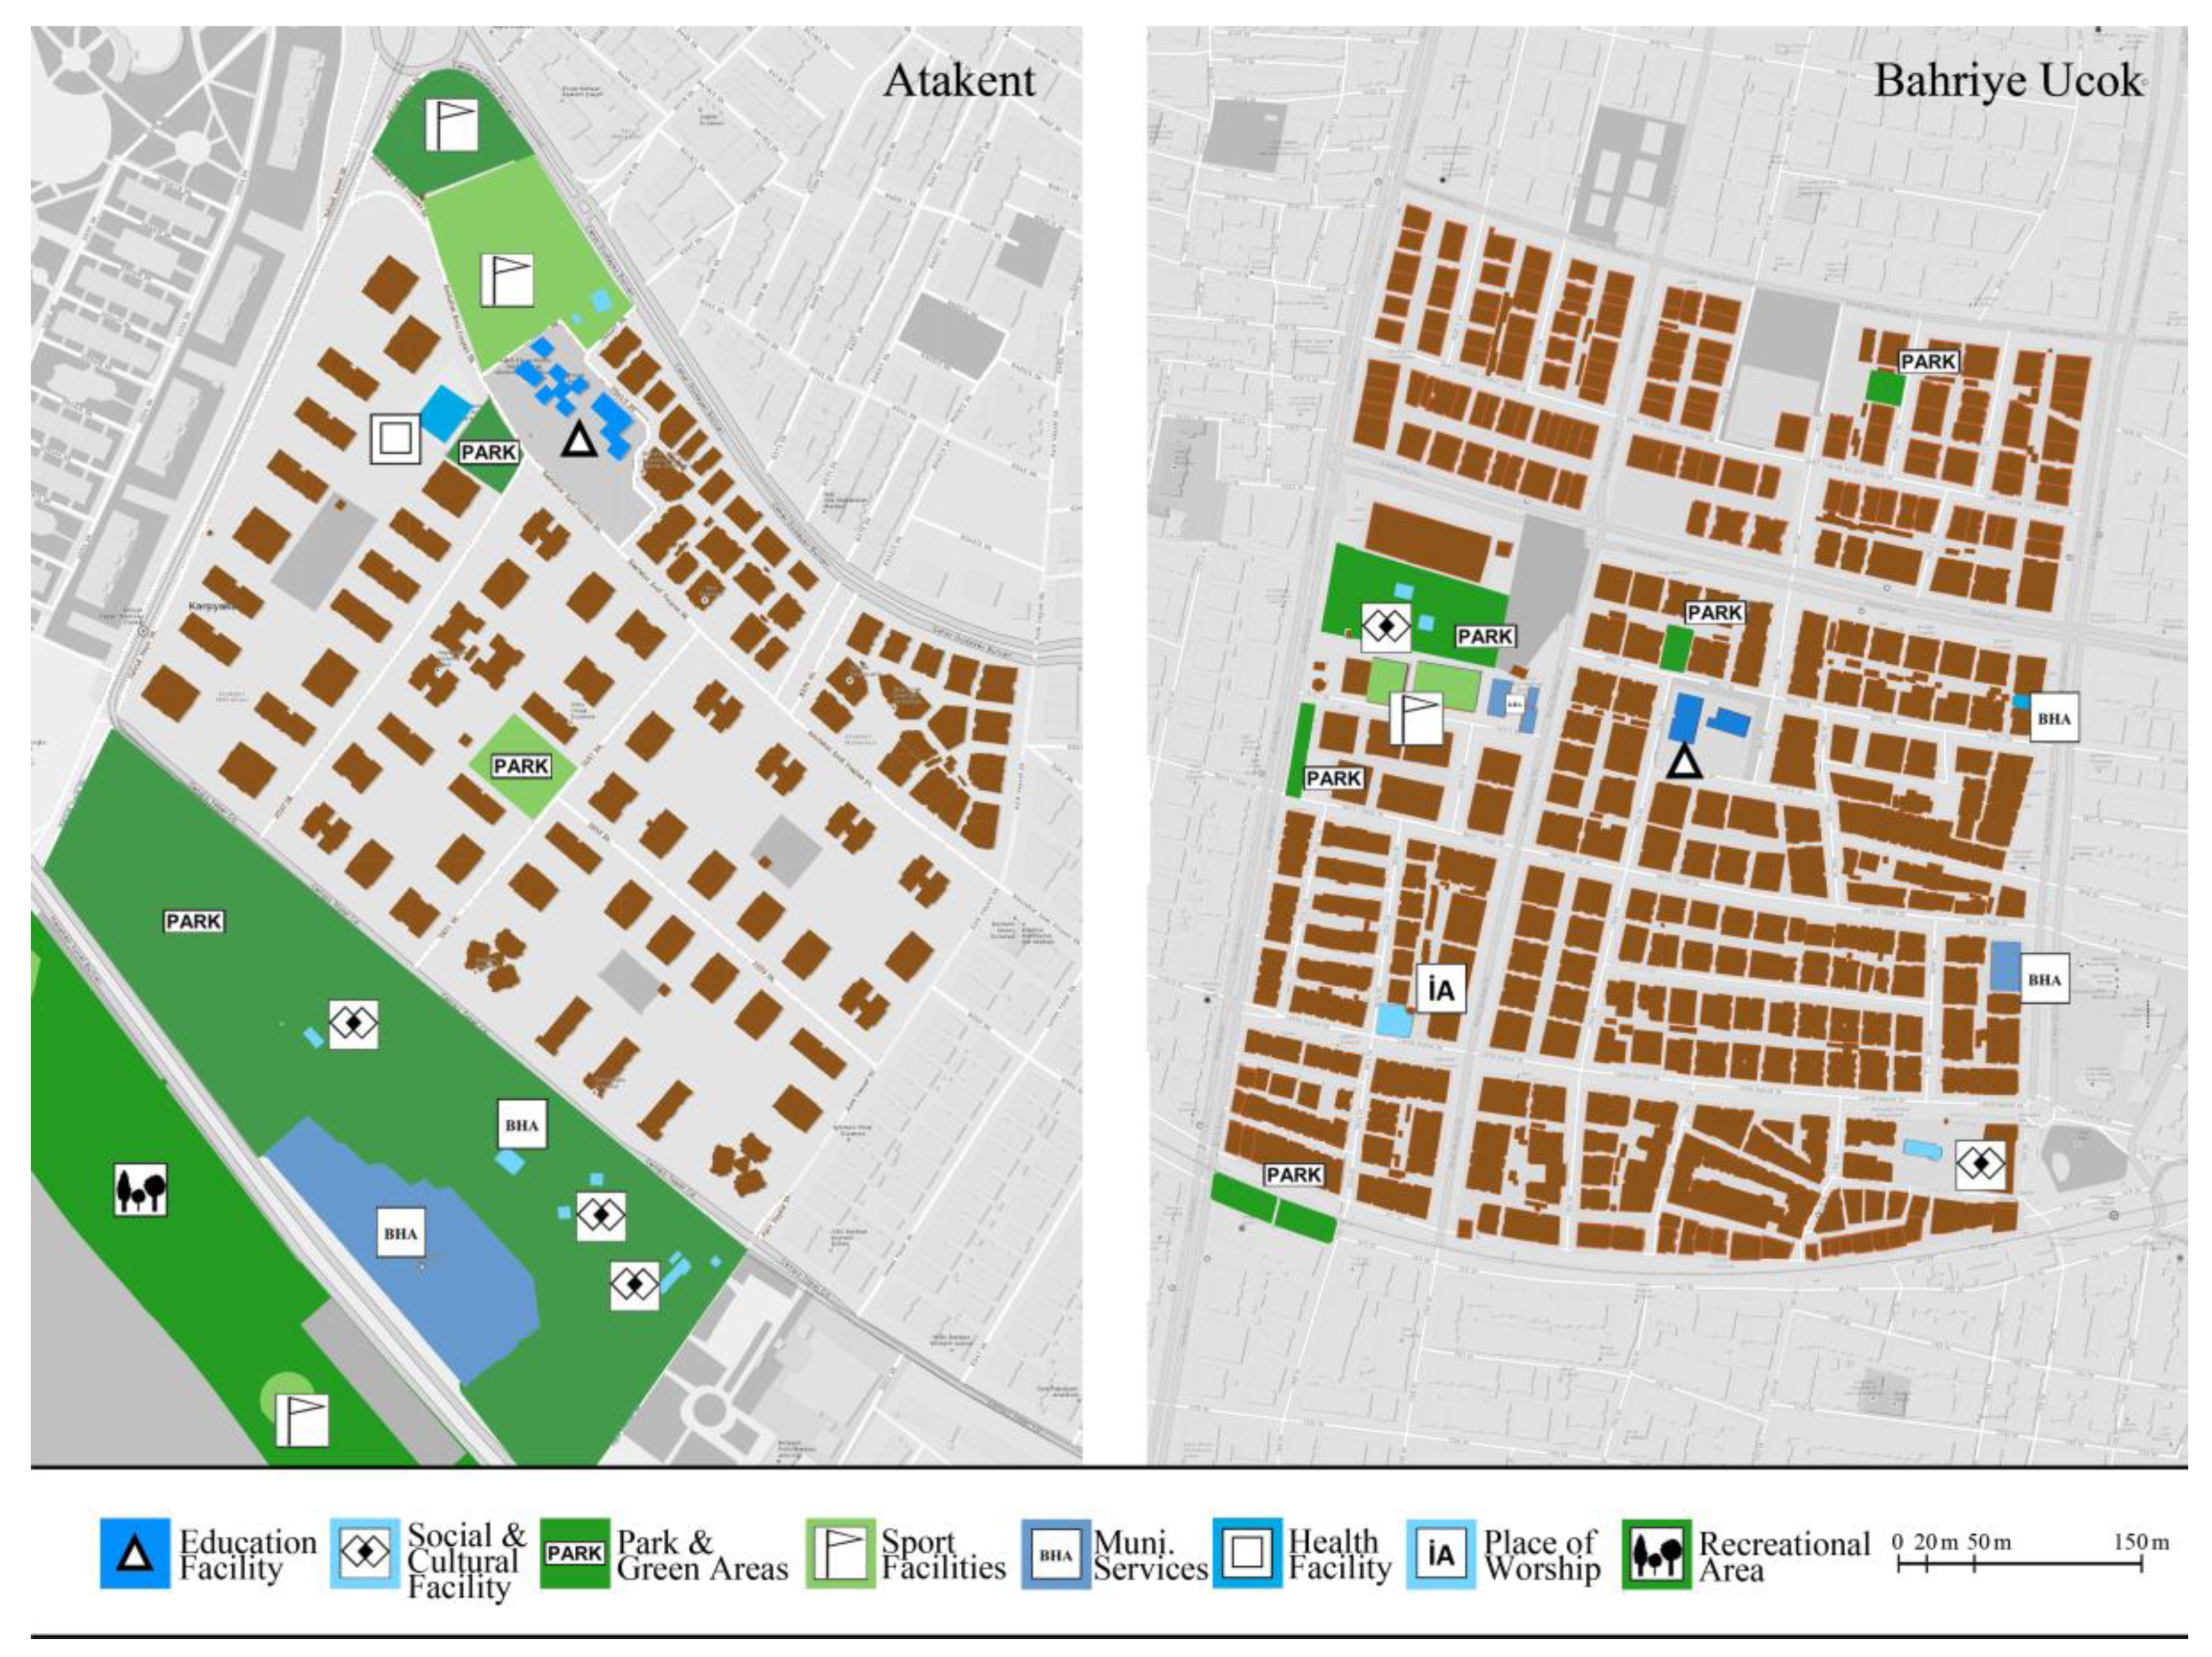
We defined the Bahriye Ucok and Atakent neighborhoods as research areas within the boundaries of the Karsiyaka district (Figure 4), based on various criteria such as planned urban development, the provision of social infrastructure in different typologies, open spaces, and availability of daily operations. Through a spatial analysis, we examined the residential areas regarding their land use (Figure 5), social facilities, and open spaces (Figure 6). Both study areas included a variety of building characteristics and a neighborhood perimeter. While Bahriye Ucok is distinguished by its characteristics such as mixed land use and the better availability of places for daily operations, Atakent is distinguished by the availability of open spaces and green space per capita (Bahriye Ucok: 0.58 m2/per person; Atakent: 15.02 m2/per person) (Figure 7).
3.2. Data Analysis
The data obtained from the questionnaire were analyzed using the Statistical Package for Social Sciences version 24 (IBM SPSS Statistics). As confirmed by Q–Q plots, responses to the Likert-type scale questions were distributed normally. The survey data were analyzed using several statistical methods: reliability, independent t-test, variance analysis (ANOVA), correlation, and chi-square analysis. The main indicators were created as the composite variables by combining their measures as latent variables. In the search for the relations between the indicators, when there was a lack of statistical evidence or a result conflicting with the existing literature, we evaluated the measures individually to reach more consistent findings. So, while comparing the categorical variables to the indicators (composite variables), the measures and submeasures (latent variables) are also mentioned. We tried to avoid generalizing that the absence of differentiation to the main indicators implies there is no influence. Instead, the latent variables are mentioned if there is a significant difference between the categorical and latent variables. Reliability analyses were performed to identify whether the overall scale and each indicator have internal consistency. Skewness and kurtosis values were within the acceptable normal distributions range [43]. Cronbach’s alpha (α) value for the overall scale was 0.932, which was sufficient for the present sample. The alpha values for each component measured greater than 0.7, indicating that the scale’s items have good internal consistency [44].
4. Research Findings and Discussion
First, the “person” dimension indicators were compared to other dimensions in the pentagon model using independent t-tests and one-way ANOVA tests. As presented in Table 3, various aspects of demographic and household characteristics have significant differences from other indicators, measures, and their submeasures. We considered worth mentioning the measures individually in Table 3 when the primary indicator shows no significant difference. Then, the indicators of the Person dimension were tested with a Chi-square analysis to see whether there was a difference in the resident profile between the participants of the two study areas. There were significant differences in variables such as educational level (p = 0.000), household income (p = 0.000), family structure (p = 0.034), car ownership (p = 0.000), and driving frequency (p = 0.013). So, the socioeconomic level of Atakent was higher due to the differentiation of its population. For family structure, the two-person family structure was more common in Bahriye Ucok, while the four-person family structure was more common in Atakent. Car ownership also presented a significant difference (p = 0.000). While Bahriye Ucok had an average of 0.55 automobiles per household, Atakent had an average of 0.93. Participants in Atakent used their cars several times a week, while participants in Bahriye Ucok used their cars only when necessary. The relationships between the person dimension and other indicators in the pentagon model are presented in Figure 8.
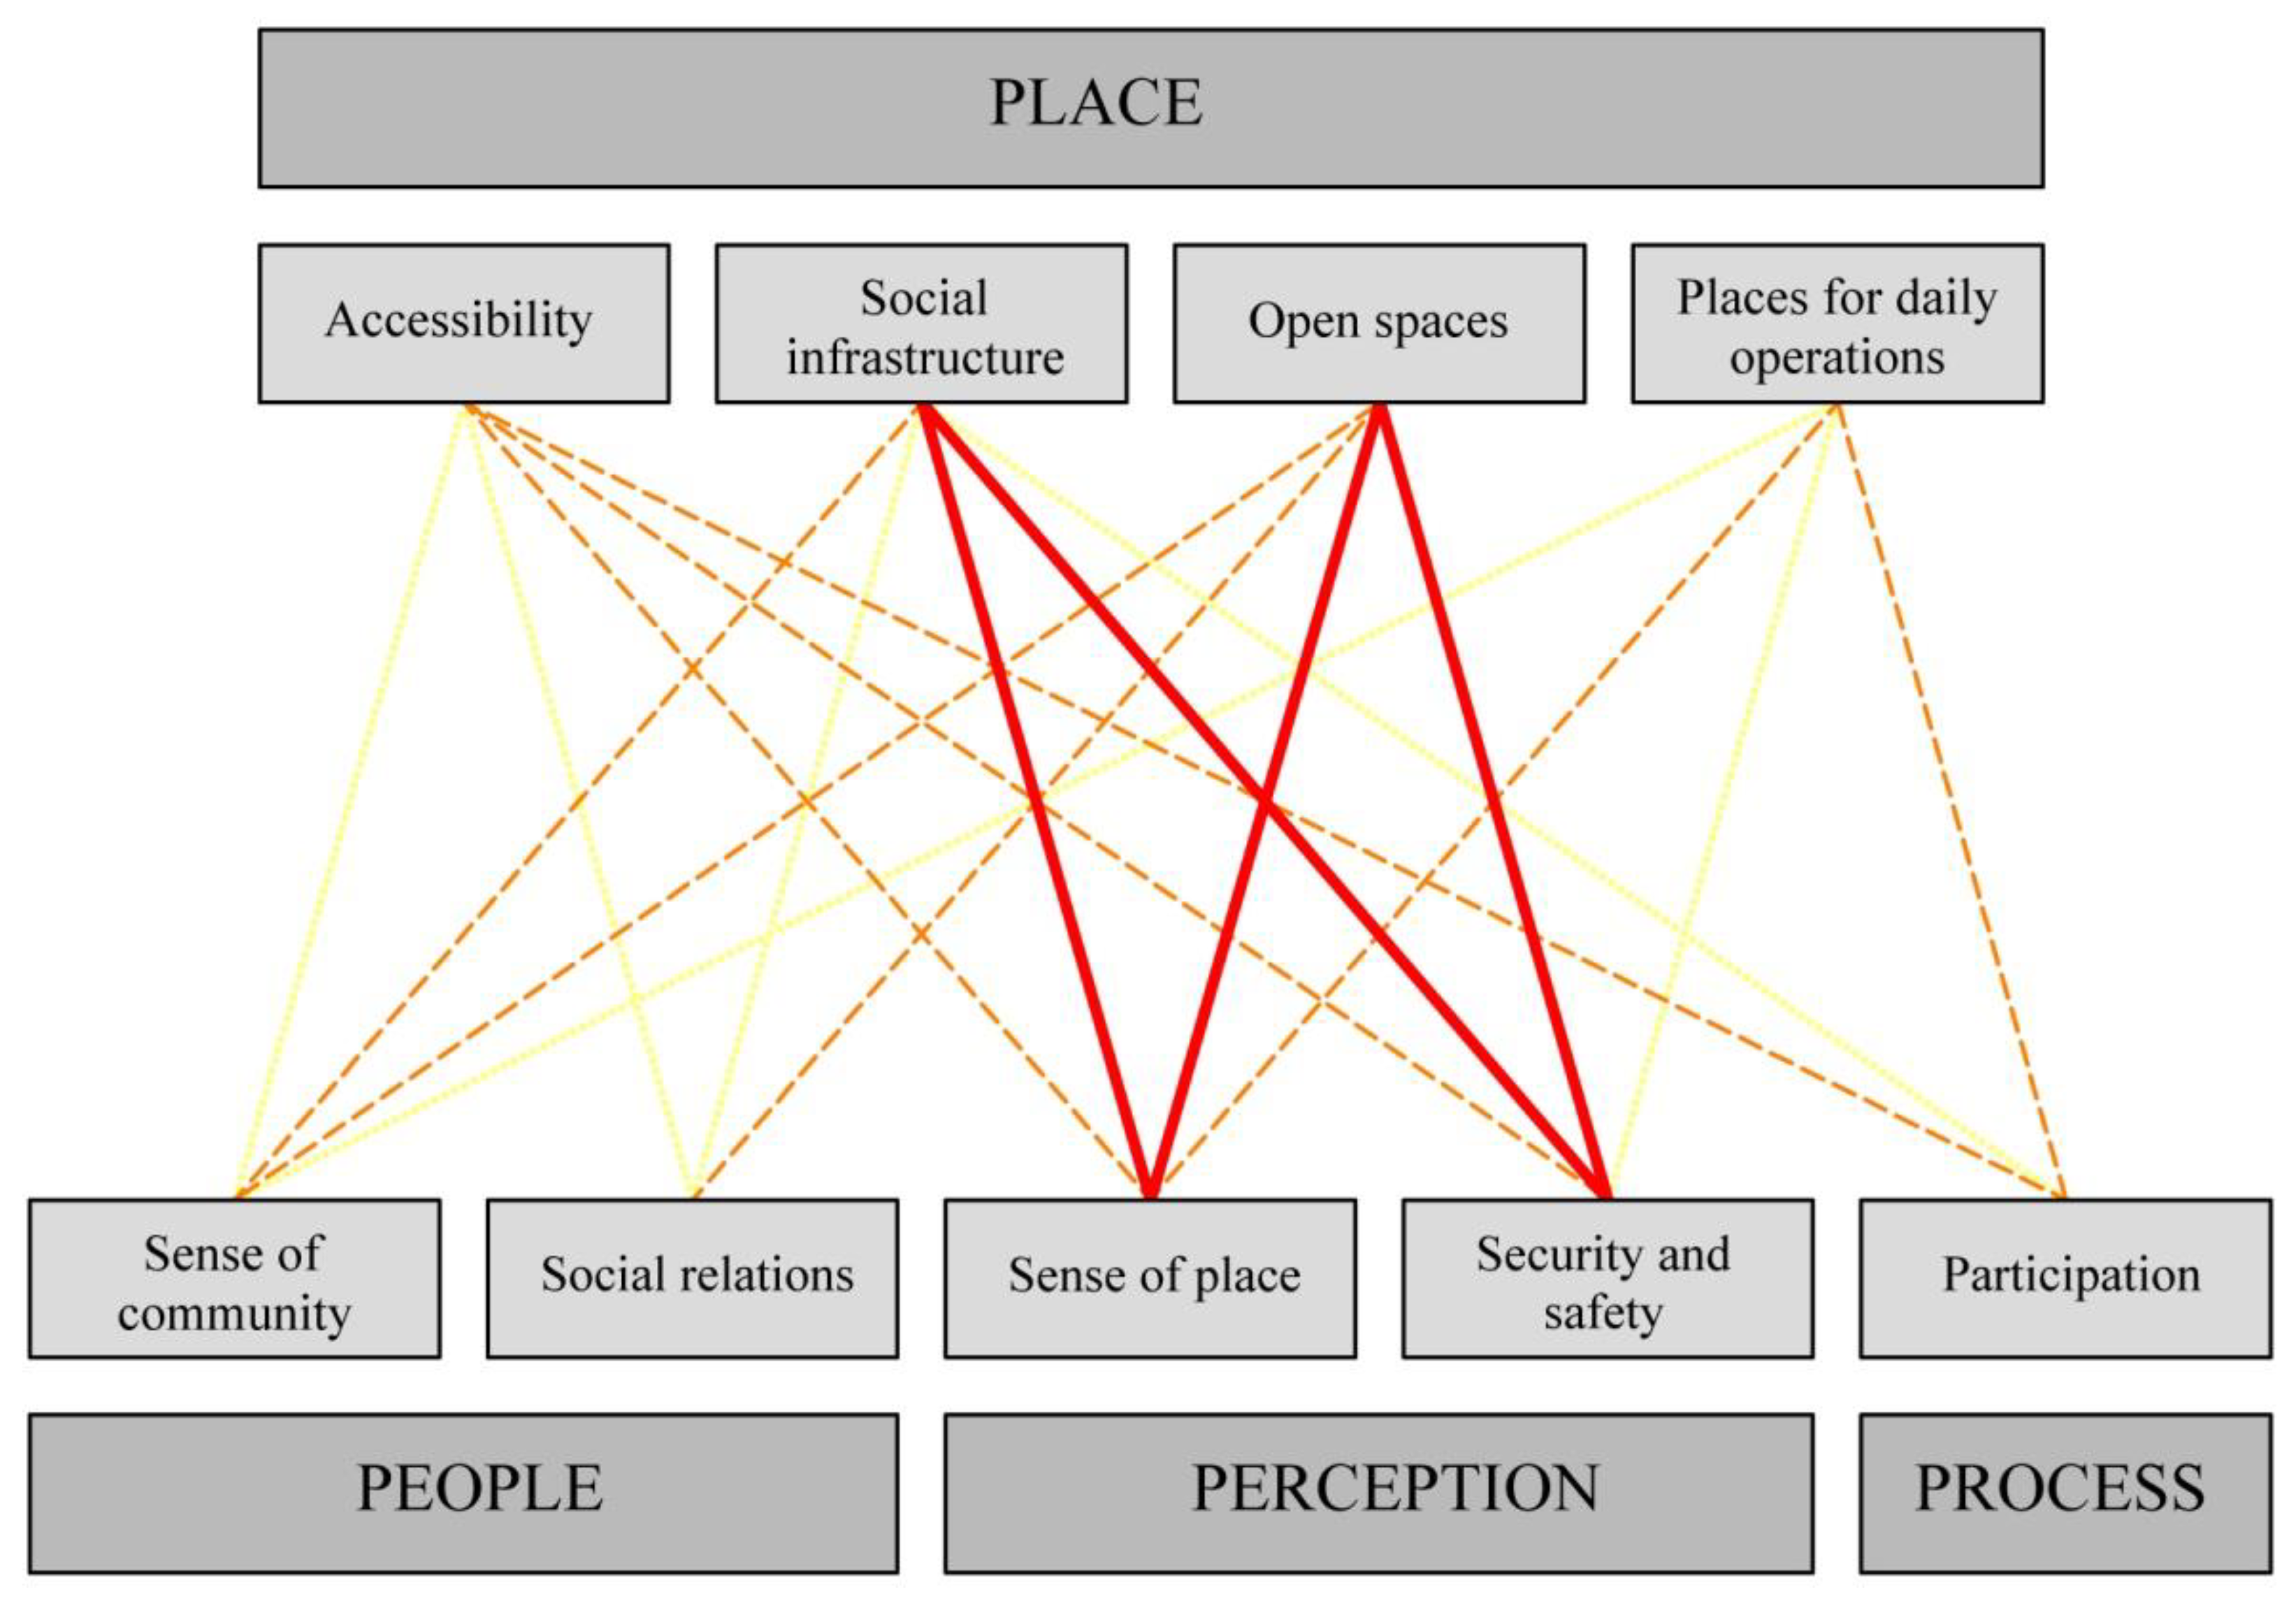
A Pearson correlation test was performed to determine the relationship between the “place” dimension and other indicators and its strength. The grading scale for evaluating the correlation test is recommended, with r values of 0.00–0.19 for “very weak”, 0.20–0.39 for “weak”, 0.40–0.59 for “moderate”, 0.60–0.79 for “strong”, and 0.80–1.0 for “extremely strong” relationships [45]. As shown in Table 4, several indicators had statistically significant and positive relationships. For accessibility, there was a weak association with open space, sense of place, security and safety, and participation. Social infrastructure had a moderate relationship with the sense of place and security and safety, and correlated weakly with the sense of community. Open spaces had a moderate relationship with the sense of place and security and safety, and were weakly associated with the sense of community, social relations, and participation. Lastly, places for daily operations had weak associations with the sense of place and participation. Figure 9 presents the correlations between the place dimension and other indicators in the pentagon model.
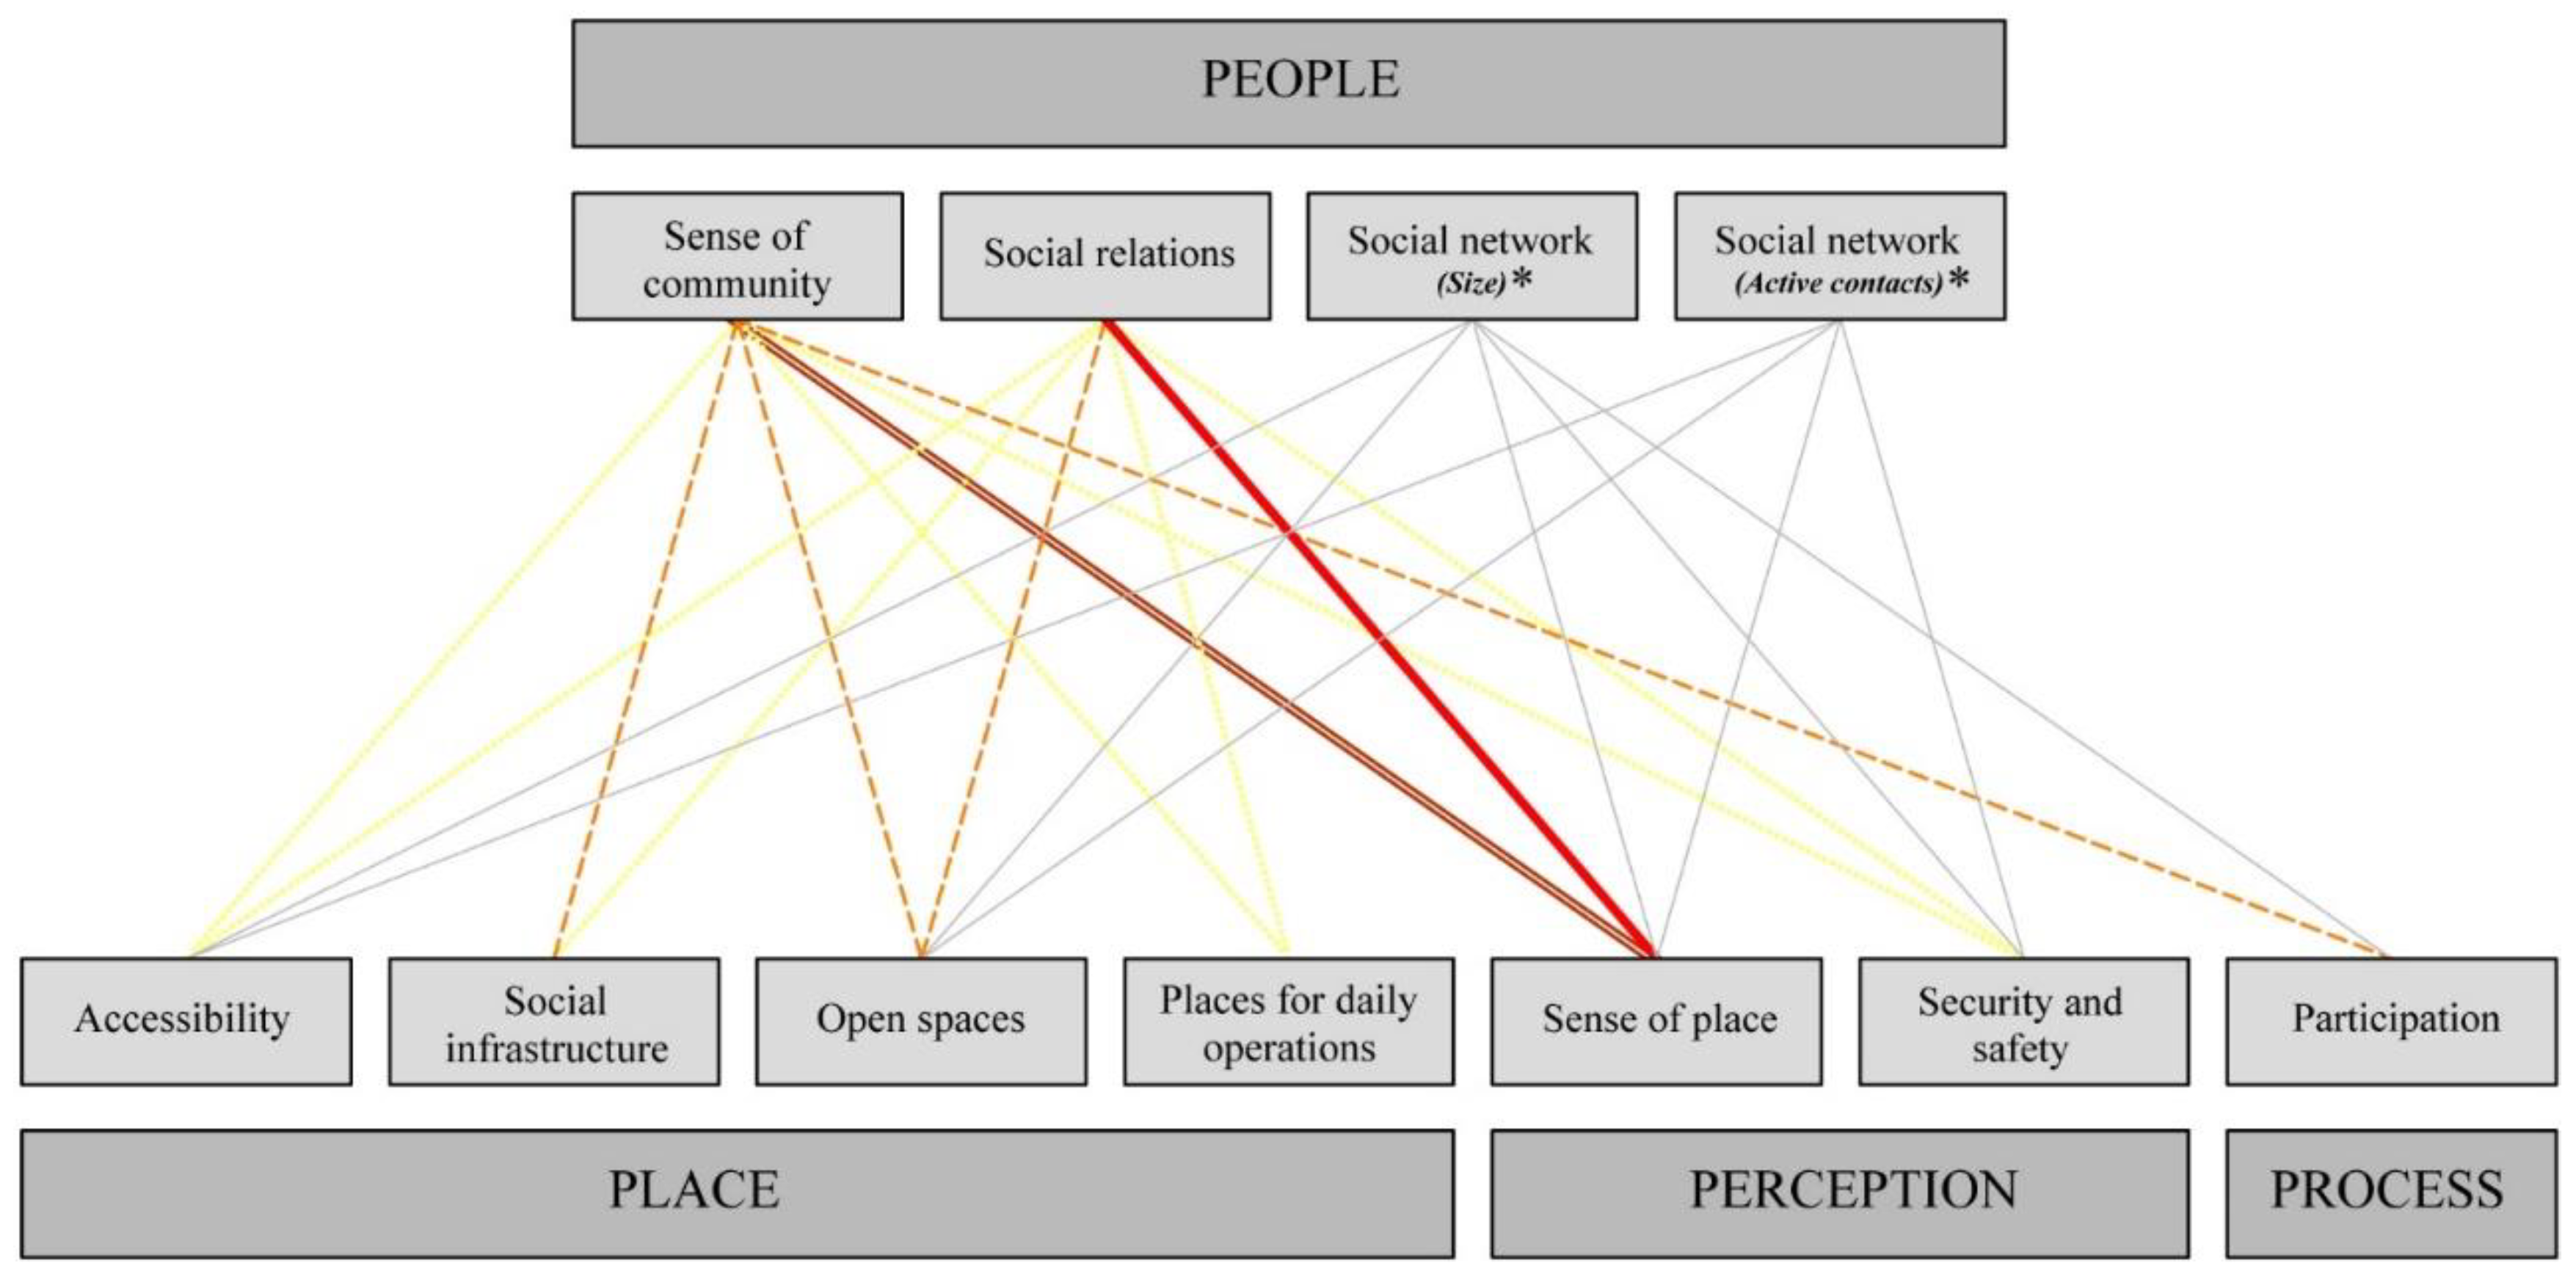
The “people” dimension was compared to other indicators in the pentagon model using the Pearson correlation and one-way ANOVA tests (Table 5). The sense of community had a strong correlation with the sense of place. However, there was a weak association between social infrastructure, open spaces, and participation. Social relations had a moderate relationship with the sense of place, and correlated weakly with open space. The size of social networks differed with all indicators in various significance levels, except for social infrastructure and places for daily operations. However, the size of social networks showed a statistical difference in terms of healthcare facilities and facilities for children and youth regarding the submeasures of social infrastructure. In terms of active social contacts, it had similar influence as the size of the social network had, except for participation. Figure 10 illustrates the correlations and significant differences between the people dimension and other indicators in the pentagon model. By comparing the person, place, and people dimensions to each indicator in the model, the findings related to the perception and process dimensions are also encompassed. Thus, they are not displayed individually to avoid repetition.
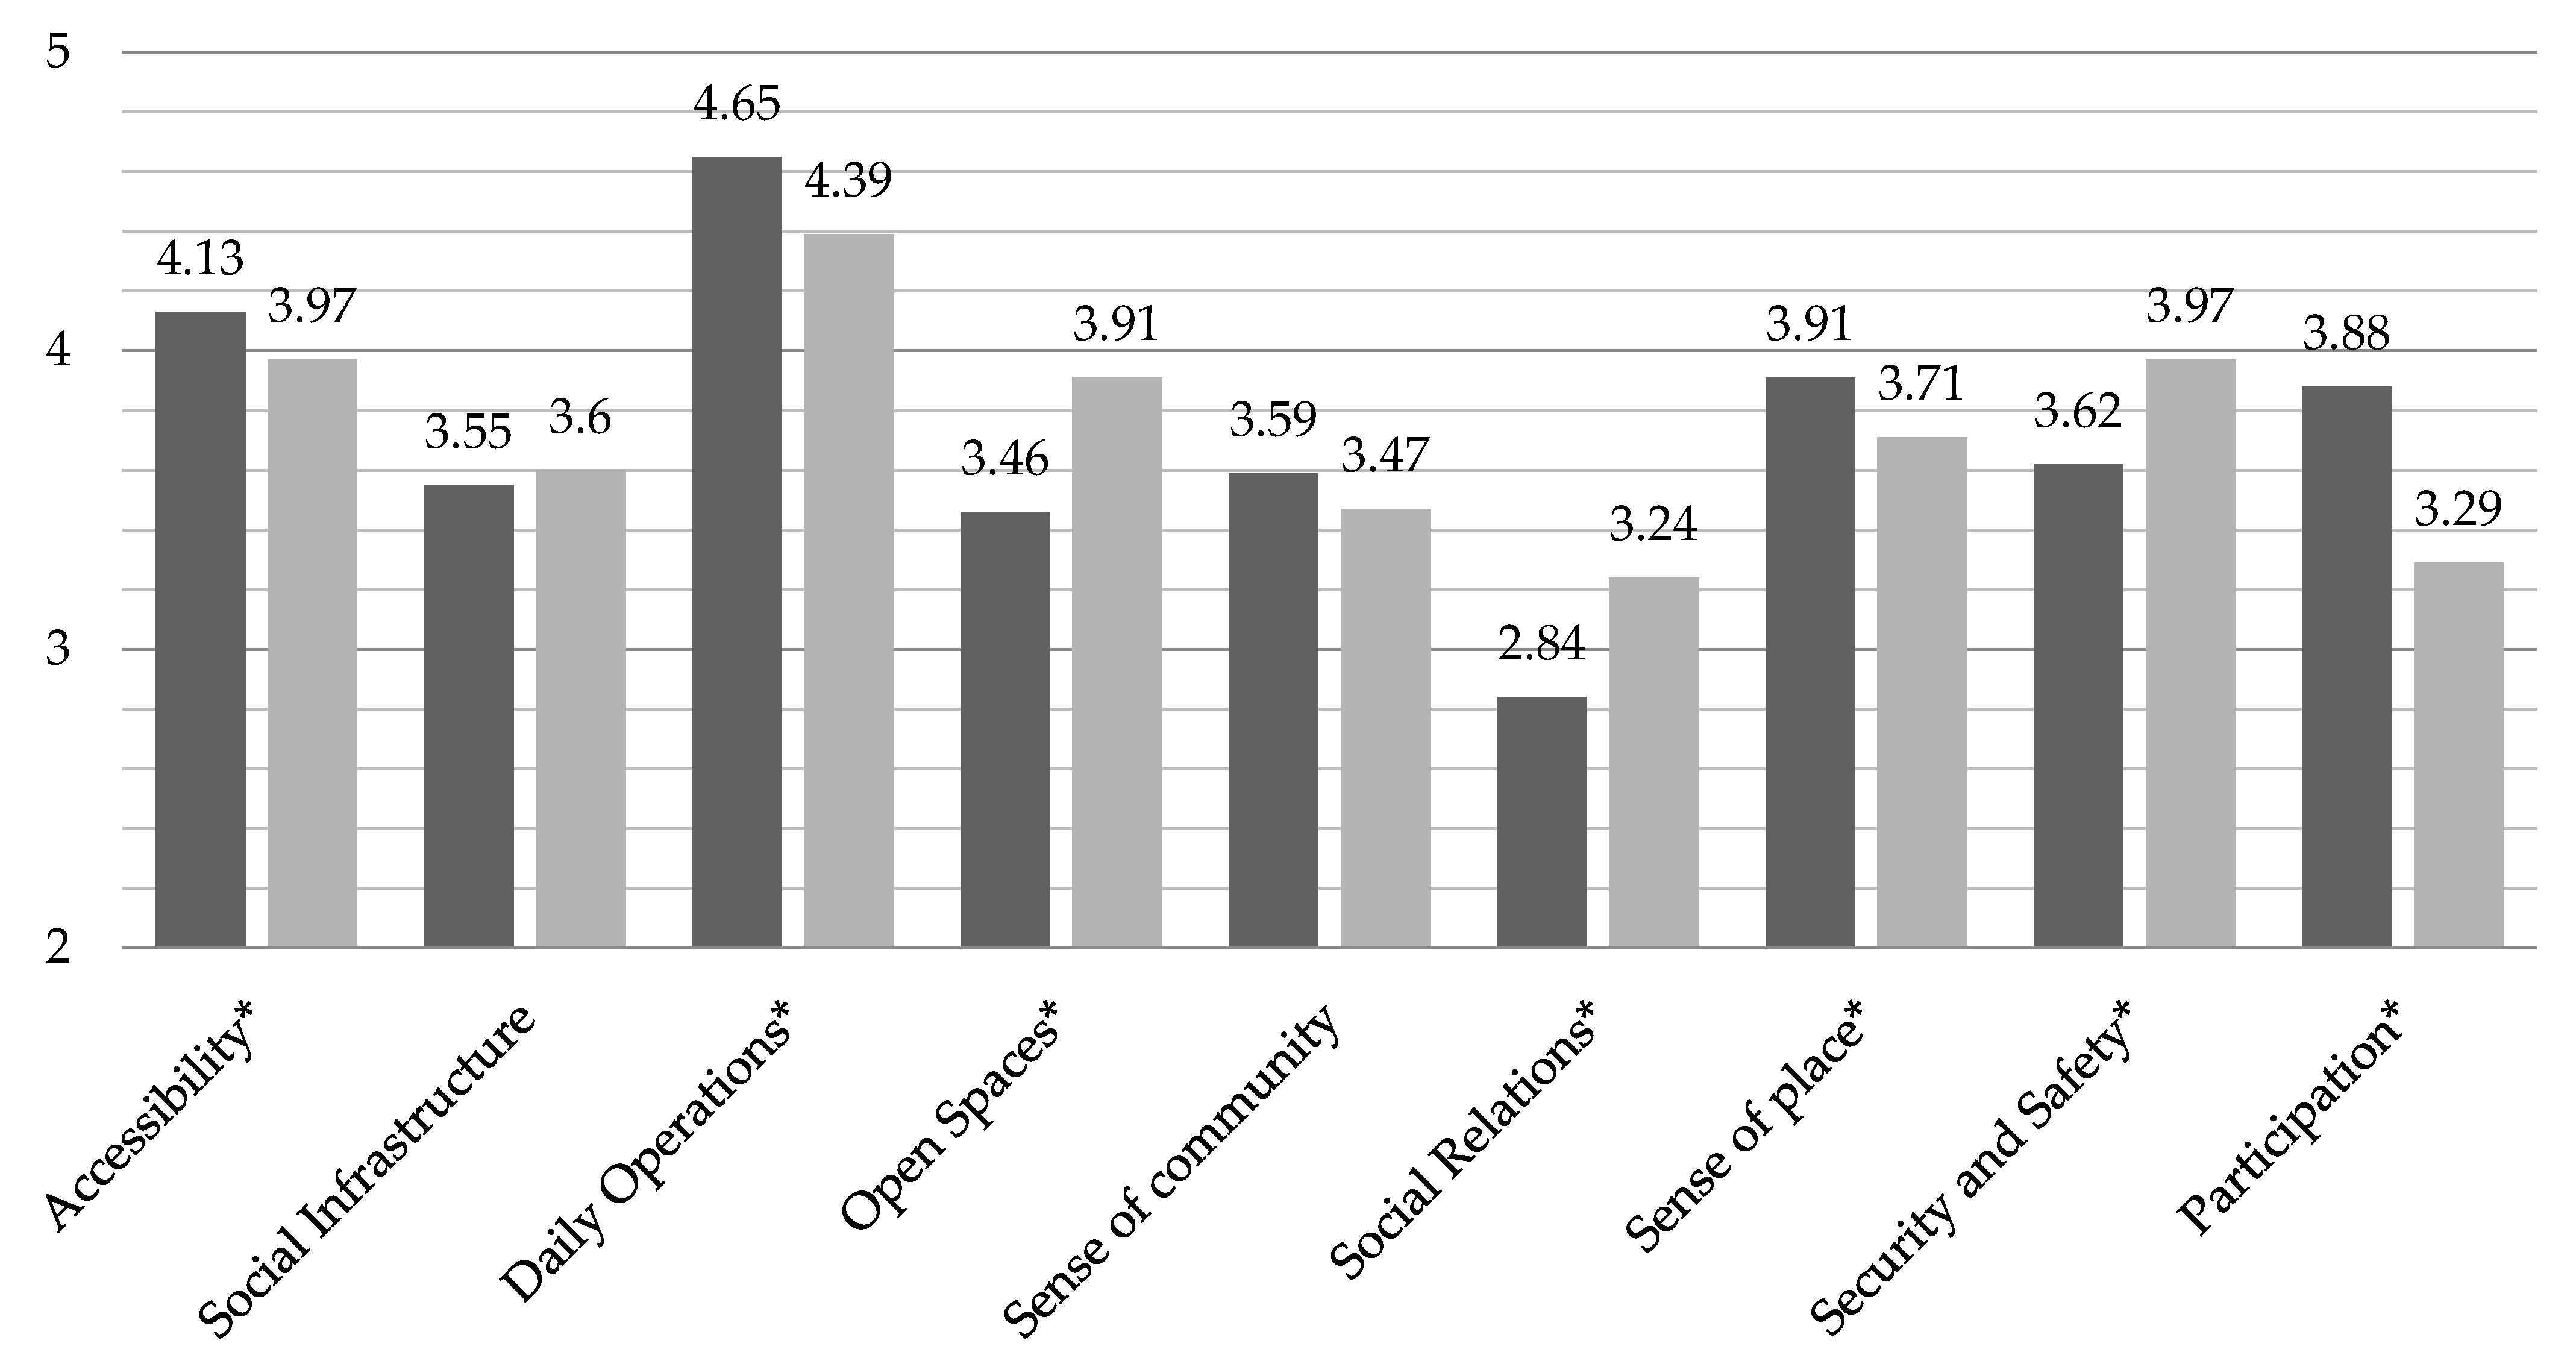
The study areas were compared using independent t-tests. As Table 6 shows, most indicators were significantly different, except for social infrastructure and the sense of community. We also tested measures and submeasures to discover determine whether there was an undiscovered differentiated variable if the leading indicators showed no statistical difference. Bahriye Ucok participants were significantly more satisfied with the accessibility and places for daily operations, more attached to their neighborhood, and more willing to participate in decision-making processes. Atakent participants were more satisfied with open spaces, engaged with others socially, had a more extensive social network and active social contacts, and perceived their settlement as more secure and safer (Figure 11). Although the social infrastructure showed no significant difference, submeasures such as healthcare and cultural facilities were significantly different. Likewise, despite the lack of a statistically significant difference in the sense of community, participants of Atakent rated neighborliness, desire to participate in the community, and opportunities for building community higher than Bahriye Ucok.
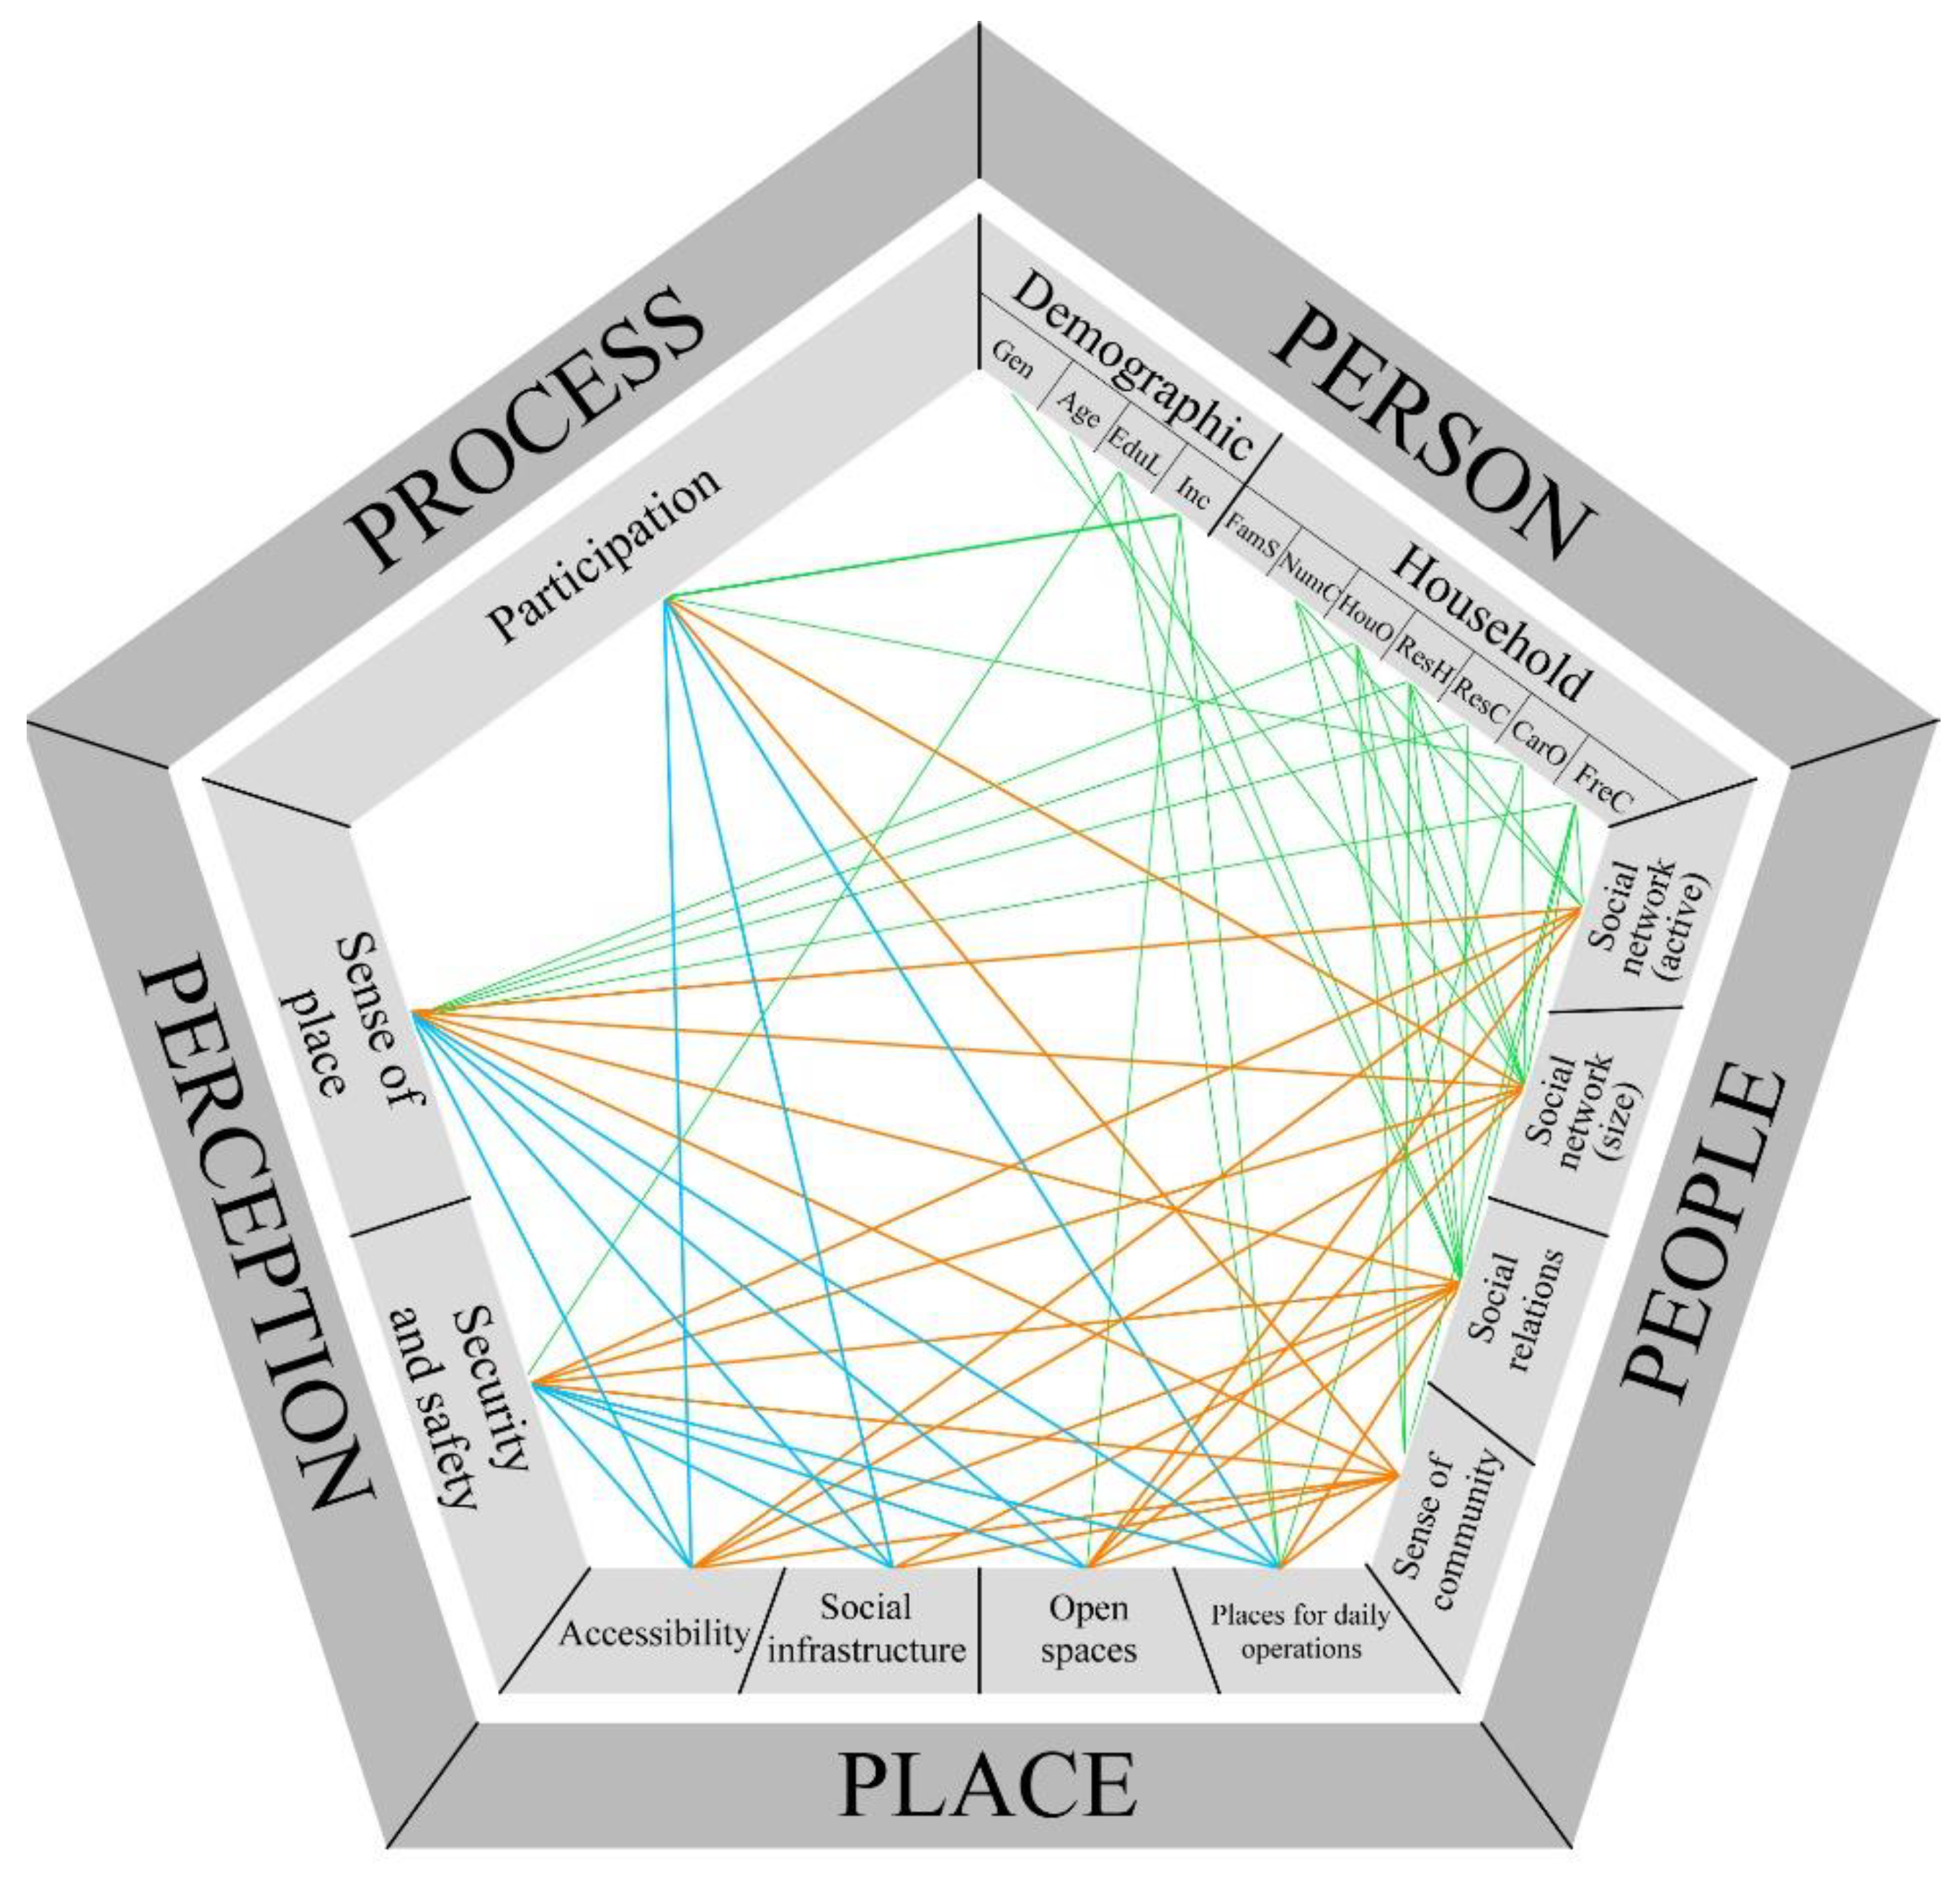
In this research, we proposed the pentagon model for urban social sustainability, which includes five dimensions: person, place, people, perception, and process. The findings confirm our claim that sociospatial indicators of social sustainability are inextricably linked through various statistical analyses. As presented in Figure 12, regardless of the grading scale used for correlations and significance levels, the intensity of the relationship network shows the complexity of the sociospatial aspects of urban space considering social sustainability. We will discuss the results by comparing two study areas with the main focus on the place dimension, as follows:
Bahriye Ucok scored higher on accessibility than Atakent because there are alternative modes of transport and easy access to the neighborhood. Additionally, mixed land use allows inhabitants to meet various needs within walking distance. Since mixed land use is more intense in Bahriye Ucok, the average participant assessments of the places for daily operations are consistently higher. Mixed land use design and the availability of a variety of destinations encourage walking, which contributes to a sense of community [46] by promoting local social interactions among inhabitants [47,48]. In addition, places for daily operations serve as a platform for interaction among residents and the establishment of community relationships, which is especially important for developing relationships via shared experiences while supporting day-to-day operations [23,49,50]. However, according to a correlation analysis, we found a very weak association of accessibility and daily operations with the sense of community and social relations (Table 5). In addition, Bahriye Ucok, with of its better accessibility and more places for daily operations, was expected to score higher on the sense of community and social relations and higher on social networks, which shows the contrary results of this study. It resonates with studies suggesting that the sense of community may start to decline when a certain threshold is reached on walkability [51]. Also, it is consistent with the ‘outsider or stranger’ concept, which states that the more diverse the land use mix, particularly the presence of a higher density of retail and commercial mix, the more likely there is to be an increase in the number of strangers visiting the area. This might decrease people’s sense of community with their neighbors [52]. In addition, by providing better access to opportunities and services, mixed land use fosters integration, vitality, and diversity and creates a walkable community and natural surveillance at the street level [53], which increases the sense of safety and security [54]. However, increased commercial density is often linked with higher traffic and congestion. It was discovered that people who lived on busy roads knew far fewer people in their neighborhood than those who lived on quieter streets. This implies that the presence of traffic and strangers in the neighborhood reduces time spent on the street by residents, detracting from social interactions and thus the creation of a sense of community [52,55,56]. This is consistent with our findings that, despite better accessibility and more places for daily operations in Bahriye Ucok, social relations, size of social networks, and security and safety scored lower in Bahriye Ucok than in Atakent. Furthermore, the evaluation of walkable distances may be different due to individual characteristics such as age, family structure, and car ownership. Additionally, education level, income, and car ownership affect the assessment of places for daily operations, while age and number of children impact commercial activities (Table 3).
The prosperity of cities and their communities are dependent on their social infrastructure [57]. Public services such as basic education, health care, cultural entertainment, and so on may all be used to understand the impact of social infrastructure on urban life, as well as to address people’s fundamental needs [58]. Social infrastructure contributes significantly to developing social networks and interaction [3] and increases belonging and attachment [1,23]. In this study, social infrastructure was moderately correlated with the sense of place, and security and safety. In addition, it was weakly associated with the sense of community and very weak with social relations (Table 4). However, the size of the social network and number of active social contacts did not have any significant influence on social infrastructure, contrary to previous studies and hypotheses (Table 5). Despite ranging in strength with other indicators, there was no statistical difference between the two study areas for social infrastructure in this sample (Table 6). However, the healthcare and cultural facilities showed a significant difference in a further analysis. In addition, among individual characteristics, income, number of children, residence time in the house, car ownership, and frequency of driving a car influenced the assessment of cultural facilities. Car ownership also impacted the evaluation of social infrastructure, while the education level of participants affected the evaluation of educational facilities (Table 3).
Open spaces provide chances for social gathering and interaction. They encourage informal or spontaneous interaction by fostering circumstances that support social sustainability [14,23]. They allow people to form social networks that develop a sense of belonging [23,59]. According to the correlation analysis, open spaces have a weak association with social relations and the sense of community (Table 4). However, the size of the social network and the number of active social contacts had a significant influence on open space (Table 5). The sense of place in Atakent was expected to be higher due to the moderate relationship between open spaces. However, the sense of place was higher in Bahriye Ucok. We can interpret this result in two ways: First, the sense of place also includes measures of place dependence. Therefore, the places for daily operations in Bahriye Ucok may have a higher impact on the sense of place. Second, the correlation of attachment with places for daily operations and accessibility, ranked higher in Bahriye Ucok, may be more influential regardless of the weak strength of the association with open spaces. Open space also contributes to the sense of safety while lowering local crime rates [3]. We found a moderate relationship between open space and security and safety (Table 4). Our finding is also consistent with both open spaces and the security and safety results of Atakent in this sample, which is higher than in Bahriye Ucok (Table 5). Additionally, more green space in residential areas improves residents’ perceptions of safety [60,61]. Atakent, with 15.02 m2 green area per person, has reported higher security and safety than Bahriye Ucok, with 0.58 m2/per person. However, it should be emphasized that the ‘outsider or stranger’ concept may influence the lower evaluation of security and safety in Bahriye Ucok; this requires further investigation in the future. In addition, among the indicators of the person dimension, income was the only characteristic affecting open spaces in this sample (Table 3).
While the community is not directly associated with a particular location, it involves a place-centric process in its development [62]. Social interaction, social networks, participation in collective groups, and levels of trust throughout the community are all examples of community behaviors [1,18]. Some scholars refer to the sense of community as a generic term that includes the earlier community behaviors, while some may consider them individual concepts or substitutional. This study evaluated the “people” dimension through the indicators of the sense of community, social relations, and social networks. In addition, there is no consensus on a definition of or methodological approach to emotional bonds to places [63]. The theories widely accepted in the literature are place attachment [64], place identity [65], place dependence [66], and sense of place [67]. Despite the fact that this research tries to explore each concept individually, terminological inconsistencies throughout the literature manifest their complexity. So, we define the sense of place as an emotional bond between a place and its inhabitants that is all-encompassing.
Although we present our findings on the people dimension regarding its relation to perception and process dimension, we suggest that the structure of the relationship of these indicators may be bidirectional, as we claim about the pentagon model. For instance, according to Shaftoe [68], social interaction increases attachment, which leads to an increased sense of community. However, Dinnie et al. [69] state that place attachment increases the establishment of social networks, strengthens social relationships, and enhances community well-being. Rather than searching for a cause and effect, we focus on the interplay between them. So, our findings support previous findings that the sense of community has a strong relationship with the sense of place. Social relations also have a moderate correlation to the sense of place (Table 5). The size of social networks and number of active social contacts has a significant impact on the sense of place, and security and safety. Comparing the two study areas, there is a statistically significant difference in social relations and social networks (Table 6). Although social relations and social networks are stronger in Atakent, there was no statistically significant difference in the sense of community. This conflicting result encouraged us to further compare submeasures of the sense of community. We found significant differences in neighborliness, desire to participate in the community, and opportunities for building community, which were all higher in Atakent, consistent with better social network characteristics.
Furthermore, a sense of community, mainly formed via daily, face-to-face contact, is an essential component in sustaining livability, security, participation, and identity [54,70,71]. Additionally, there is a positive relationship between a neighborhood’s perceived safety and the sense of community [48,72]. Individuals who feel safe interact more [18]. The sense of safety enhances the sense of community among residents and contributes to a sense of place and belonging [68,73]. Our findings support the fact that the size of social networks and the number of active social contacts make a significant difference in terms of security and safety. However, the sense of community has a very weak association with security and safety (Table 5). Residents involved in the urban planning of their communities are more likely to have their needs and desires met. Simultaneously, residents may feel that they are a part of the community and their sense of belonging increases [74]. However, the sense of community has a weak correlation with participation. Nevertheless, there is a significant difference between the size of social networks and participation (Table 5). Furthermore, individual characteristics such as housing ownership, residence time in the house, and frequency of car travel have a significant impact on the sense of community. Age, educational level, number of children, housing ownership, residence time in the house and city, and frequency of car travel affect social relations. In addition, the sense of place differed significantly due to household characteristics such as house ownership, residence time in the house and city, and frequency of car travel. Security and safety were only affected by educational level in this sample. In terms of participation, income and car ownership differed statistically. Further correlations between the indicators of the person dimension and other submeasures are presented in Table 3 and Figure 8.
Furthermore, we could re-evaluate and compare two hypotheses in the literature in this sample. First, spontaneous encounters during daily life activities and routines contribute to social relations and social networks due to the high accessibility and provision of daily operations. Second is the role of open spaces in developing and improving social relations. Consequently, compared to daily operations and open spaces, in terms of their contributions to social relations, open spaces appear to be more effective in this sample. We should also emphasize that there is a significant difference between the two study areas in terms of sociodemographic characteristics such as education level, income, family structure, and car ownership, which may have an effect on the results.
In this study, the pentagon model was proposed to discover how the sociospatial features of urban space and social sustainability are linked. It was also applied to two residential areas as an evaluation method, comparing their socio-spatial aspects as social sustainability indicators. The pentagon model may have a significant impact as a post-evaluation assessment tool for urban developments at the neighborhood scale. We recommend the pentagon model for evaluating social sustainability in existing residential areas, as it could provide valuable insights for urban regeneration, redevelopment, and interventions. Moreover, it may also be improved as a guideline for the early stages of urban design and planning with the contributions of further studies. Expanding the dataset and comparing the study’s findings to those from other cities in Turkey, or other countries, may provide a more accurate picture of design parameters for the future. We acknowledge that there is no ideal prescription that will apply to every community since there are different needs and expectations in different geographies and cultures around the world. So, the pentagon model’s inclusion of person and process dimensions reflects this particular emphasis in this context. Nevertheless, the pentagon model provides a promising basis to achieve it.
Since the pentagon model was applied to two study areas, there are some recommendations particular to these areas for improving social sustainability, especially in the context of the place dimension. We would like to demonstrate briefly how the research findings can be applied in practice using the pentagon model before giving our general recommendations and conclusions. First, we suggest increasing the green space per capita in the Bahriye Ucok neighborhood and improving the open spaces. Furthermore, commercial use density should be reduced; however, additional research should support determining the threshold for decreasing this density. On the contrary, there should be more places for daily operations in the Atakent neighborhood. Participation tools are vital to achieving the desired changes in the areas. As a result of community participation in the decision-making process, the place characteristics of residential areas should be more in accordance with the community’s needs and expectations. Another point to consider is residents’ personal and household characteristics, especially the two-person family structure in Bahriye Ucok versus the four-person family structure in Atakent. In this way, the place will also contribute to the indicators in the dimensions of people and perception.
5. Conclusions
Building socially sustainable cities that are environmentally and economically sustainable has become one of the most important goals in the global agenda. By evaluating what aspects impact social sustainability, it is possible to develop solutions for future communities. In this context, this study investigated the sociospatial aspects of urban space that influence social sustainability through the pentagon model. The dimensions of urban social sustainability were identified as the person (demographic and household characteristics), place (accessibility, social infrastructure, open spaces, and places for daily operations), people (sense of community, social relations, and social network), perception (sense of place, and security and safety), and process (participation, and future of space). Then, we explored in what ways urban-attributed issues and pentagon dimensions are related to social sustainability. We compared two residential areas through a spatial analysis, a questionnaire, and a statistical analyses. The comparison showed that the two residential areas, each with distinct spatial characteristics, had significantly different outcomes for the social sustainability criteria. We also found a range of positive associations between social sustainability indicators. When the urban space is planned for serving their communities, other dimensions may be enriched simultaneously through its sociospatial contributions. None of the pentagon dimensions needs to be compromised or prioritized to achieve social sustainability. On the contrary, all of them should be recognized simultaneously.
Lessons for future development can be drawn for Izmir, Turkey, and other developing countries. Developing countries’ progress through industrialization and urbanization is often unbalanced. It involves distinctive needs and requirements, with different dynamics in urban space compared to traditional Western examples. Rapid urbanization has surpassed most cities’ ability to offer appropriate services to their inhabitants, resulting in poor accessibility, a lack of adequate social infrastructure and places for daily operations, and insufficient open spaces and green areas. To address urban problems, governments must urgently establish effective urban road map strategies to address the fundamental issues in urban areas. The first step is developing a national urban policy to provide the necessary direction and course of action to promote urban development towards reclaiming more sustainable urban space [75]. The urban issues must be addressed at several levels and scales by improving organizational structures. This requires better coordination between national actors, all levels of government, and institutions, including the private sector, academics, and civil society, for there to be efficient national and local functioning. Even though cities are all affected by comparable situations and challenges, the solutions to one city’s difficulties may differ considerably. It might not be easy to conceptualize a broad generalization that applies to all. Since all cities have distinct development and sociocultural features, there is no universal sustainable development prescription. Because of the wide range of economic, social, political, and cultural variables, the policies must be tailored to the unique characteristics of each country.
Although the division between the developed and developing world is a widely accepted concept, such binary labeling may not be as effective when considering the social sustainability discourse. Since Turkey is a developing country, this study’s applicability may be presumed to be restricted to the developing world. As mentioned before, many cities and settlements face urban challenges at numerous levels, and not just those particular to developing countries [76]. We cannot ignore concerns about the decline of a sense of community and the withdrawal of social and communal values in developed countries. In most cases, community discussions are dominated by themes of loss and recovery, evoking a world that we hope to return to [77,78]. Community is considered a fundamentally positive phenomenon. Its decline is cited as both a cause and a consequence of many issues, such as increasing fear of crime, antisocial behavior, growing social exclusion, and isolation. Although developed countries seem to be much better at providing social infrastructure and open space—which we label the sociospatial drivers of social sustainability—it does not necessarily mean that they are being actively used and favored by their communities. So, they should be further evaluated at the microscale, especially by enhancing their accessibility, spatial quality and design elements, management, and maintenance to reclaim their social values. We hope that the results of this study inspire future research on urban areas, not just in developing cities such as Izmir but also in developed ones. For enhancing social sustainability, the following points should be considered:
Accessibility, the freedom and facilitation of geographic mobility, is regarded as a fundamental human right that must be protected [23]. Everyone should have easy access to particular places in their everyday lives, especially without driving long distances [79]. Accessibility should include alternative modes of transport, such as walking, cycling, or public transport. Investment in urban transportation has mostly been in the form of increased road capacity for vehicles, frequently at the expense of other forms of transportation. The strategy for better accessibility must include supporting bicycle and pedestrian traffic and the provision of low-cost access routes for public transportation.
For social infrastructure, the authorities should reserve the required areas in the development plans with a diversity of functions to correspond to the needs of various social groups and consider future requirements. Local governments should make a great effort to improve basic infrastructure and supply essential services. Although planning guidelines include some standards with pro-rata provision (square meters per person), the participation method would be more efficient to support communities. Social infrastructure is fundamental in promoting basic human rights such as education and health and including amenities that support social and cultural development. Social infrastructure should be designed and managed so that it can adapt to the changing needs of the community.
The planning guidelines for open spaces, which have traditionally emphasized pro-rata provision, need to be reassessed. Open spaces that are used well are accessible to all members of the community. Every community has a distinct character and set of needs; therefore, similarly diversified spaces will accommodate a wide variety of those needs. The design of open spaces is crucial for increasing distinctiveness and supporting the diversity of the community. In addition, communities and their recreational demands change over time. They should accommodate the changing requirements and expectations of the community they serve. Multifunctional and flexible spaces adapt well to these changes, allowing various users to enjoy them at the same time. One of the most important aspects of open spaces is that they should encourage social interaction. An open space is an important meeting area for building new relationships and maintaining existing ones. Successful open spaces and green areas are meaningful to people’s daily lives. Their success is not just a result of accessibility or recreational activities but also, more crucially, the ties that they establish with their community and environment.
Daily operations are vital for meeting essential needs in daily life, whether they provide utility or leisure services. Although categorizing human activity by land use types is a well-established method from the 19th and 20th centuries, there has been a significant amount of scholarly discussion about its limits and practice in contemporary urban planning. Zoning restrictions separating human behaviors into separate areas around the city are undesirable [80]. Places for daily operations should accommodate inhabitants’ basic needs by providing various services. Mixed land use development is an excellent way to promote daily operations in residential areas. To properly provide daily operations, several strategies should be explored. First, we should identify and relegislate any mixed-use development restrictions in zoning, subdivision, development, and other regulatory codes. Then, there must be a detailed analysis of the needs and demands of a specific community, region, or district for daily activities. Opportunities should be evaluated for infill and redevelopment to use existing infrastructure and minimize the need for new facilities to offer horizontal or vertical mixed-use zones. However, we also have to discover the thresholds of commercial density where the benefits to communities end and the disadvantages begin.
We would also emphasize community participation. Global debates on sustainable development highlight new governance structures and establish participation as a primary criterion for successful decision-making. We have also called attention to the value of citizen involvement in urban development. Only an active community and public engagement could significantly influence urban planning methods. Participation has become particularly crucial in structuring the interaction between planning processes, urban development, and the impacted residents and communities [81]. The process of participation is a transforming tool for social change, with an increased role for residents in decision-making and policymaking. Insufficient levels of public participation are a global issue, arising from a lack of trust, social inequality, a lack of motivation, a tradition of nondemocratic decision making, and poor participatory processes [82,83]. Community participation and involvement in the decision-making process may prevent many future issues, including policies being detached from the daily urban experience of people in both developing and developed countries. The pentagon model has the potential to generate valuable data for identifying urban space issues at a local scale that can be resolved through participation tools.
The sociospatial aspects of urban spaces serve as a foundation for social sustainability. Urban space is where individuals have personal development and enhancement opportunities, feel secure and attached, interact with each other, and participate in communal life. This research provides valuable information for governments, policymakers, urban researchers, planners, and architects to help them design and implement programs to improve social sustainability. This study presents a context-sensitive understanding of the influence of urban space’s sociospatial aspects on social sustainability. The study’s methodological limitations include its reliance on self-reported data, which might be vulnerable to reporting bias despite efforts to minimize it. We also recommend further research to see how other factors of urban space may affect these outcomes. The ultimate aim of integrating planning inputs into social outcomes is critical. For ensuring social sustainability, more social goal-oriented planning is advised. Another particularly noteworthy case might be the COVID-19 pandemic, which is devastating the world at the time of publication.
Author Contributions
Conceptualization, S.A.; methodology, S.A.; software, S.A.; formal analysis, S.A.; writing—original draft preparation, S.A.; writing—review and editing, S.A. and A.C.; visualization, S.A.; supervision, A.C.; funding acquisition, S.A. All authors have read and agreed to the published version of the manuscript.
Funding
Partial financial support was received from the nonprofit national public agency Turkish Healthy Cities Association as part of a doctoral research support grant to Seyda Akcali.
Institutional Review Board Statement
The study was conducted in accordance with the Declaration of Helsinki, and approved by Bursa Uludag University Research and Publication Ethics Committees (Science and Engineering Sciences Research and Extension Ethics Committee) (2019-4 Decision 2; 24 June 2019; Number: 26468960-044/23938).
Informed Consent Statement
Informed consent was obtained from all subjects involved in the study.
Conflicts of Interest
The authors declare no conflict of interest.
References
- Bramley, G.; Dempsey, N.; Power, S.; Brown, C.; Watkins, D. Social Sustainability and Urban Form: Evidence from Five British Cities. Environ. Plan. A Econ. Sp. 2009, 41, 2125–2142. [Google Scholar] [CrossRef]
- Colantonio, A. Urban Social Sustainability Themes and Assessment Methods. Proc. Inst. Civ. Eng. Urban Des. Plan. 2010, 163, 79–88. [Google Scholar] [CrossRef]
- Karuppannan, S.; Sivam, A. Social Sustainability and Neighbourhood Design: An Investigation of Residents’ Satisfaction in Delhi. Local Environ. 2011, 16, 849–870. [Google Scholar] [CrossRef]
- Sachs, I. Social Sustainability and Whole Development: Exploring the Dimensions of Sustainable Development. In Sustainability and the Social Sciences; Becker, E., Jahn, T., Eds.; Zed Books: London, UK, 1999; pp. 25–28. [Google Scholar]
- Landorf, C. Evaluating Social Sustainability in Historic Urban Environments. Int. J. Herit. Stud. 2011, 17, 463–477. [Google Scholar] [CrossRef]
- Weingaertner, C.; Moberg, Å. Exploring Social Sustainability: Learning from Perspectives on Urban Development and Companies and Products. Sustain. Dev. 2014, 22, 122–133. [Google Scholar] [CrossRef] [Green Version]
- Davidson, K.M.; Kellett, J.; Wilson, L.; Pullen, S. Assessing Urban Sustainability from a Social Democratic Perspective: A Thematic Approach. Local Environ. 2012, 17, 57–73. [Google Scholar] [CrossRef]
- Woodcraft, S. Social Sustainability and New Communities: Moving from Concept to Practice in the UK. Procedia Soc. Behav. Sci. 2012, 68, 29–42. [Google Scholar] [CrossRef] [Green Version]
- Carmona, M. Sustainable Urban Design: Principles to Practice. Int. J. Sustain. Dev. 2009, 12, 48–77. [Google Scholar] [CrossRef]
- Ghahramanpouri, A.; Lamit, H.; Sedaghatnia, S. Urban Social Sustainability Trends in Research Literature. Asian Soc. Sci. 2013, 9, 185–193. [Google Scholar] [CrossRef] [Green Version]
- Bramley, G.; Power, S. Urban Form and Social Sustainability: The Role of Density and Housing Type. Environ. Plan. B Plan. Des. 2009, 36, 30–48. [Google Scholar] [CrossRef]
- Ali, H.H.; Al-Betawi, Y.N.; Al-Qudah, H.S. Effects of Urban Form on Social Sustainability—A Case Study of Irbid, Jordan. Int. J. Urban Sustain. Dev. 2019, 11, 203–222. [Google Scholar] [CrossRef]
- Hemani, S.; Das, A.K.; Chowdhury, A. Influence of Urban Forms on Social Sustainability: A Case of Guwahati, Assam. Urban Des. Int. 2017, 22, 168–194. [Google Scholar] [CrossRef]
- Jabareen, Y.R. Sustainable Urban Forms. J. Plan. Educ. Res. 2006, 26, 38–52. [Google Scholar] [CrossRef]
- Larimian, T.; Sadeghi, A. Measuring Urban Social Sustainability: Scale Development and Validation. Environ. Plan. B Urban Anal. City Sci. 2021, 48, 621–637. [Google Scholar] [CrossRef] [Green Version]
- Sharifi, A.; Murayama, A. Changes in the Traditional Urban Form and the Social Sustainability of Contemporary Cities: A Case Study of Iranian Cities. Habitat Int. 2013, 38, 126–134. [Google Scholar] [CrossRef]
- Alipour, S.M.H.; Galal Ahmed, K. Assessing the Effect of Urban Form on Social Sustainability: A Proposed ‘Integrated Measuring Tools Method’ for Urban Neighborhoods in Dubai. City Territ. Archit. 2021, 8, 1. [Google Scholar] [CrossRef]
- Dempsey, N.; Brown, C.; Bramley, G. The Key to Sustainable Urban Development in UK Cities? The Influence of Density on Social Sustainability. Prog. Plann. 2012, 77, 89–141. [Google Scholar] [CrossRef]
- Yiftachel, O.; Hedgcock, D. Urban Social Sustainability: The Planning of an Australian City. Cities 1993, 10, 139–157. [Google Scholar] [CrossRef]
- Polese, M.; Stren, R. Understanding the New Sociocultural Dynamics of Cities: Comparative Urban Policy in a Global Context. In The Social Sustainability of Cities; Polese, M., Stren, R., Eds.; University of Toronto Press: Toronto, ON, Canada, 2000; pp. 3–38. ISBN 9781442682399. [Google Scholar]
- Chiu, R.L.H. Sustainable Development: A New Perspective for Housing Development. In Proceedings of the National Housing Conference 2003, Adelaide, Australia, 26–28 November 2003; pp. 1–17. [Google Scholar]
- Porta, S.; Renne, J.L. Linking Urban Design to Sustainability: Formal Indicators of Social Urban Sustainability Field Research in Perth, Western Australia. Urban Des. Int. 2005, 10, 51–64. [Google Scholar] [CrossRef] [Green Version]
- Chan, E.; Lee, G.K.L. Critical Factors for Improving Social Sustainability of Urban Renewal Projects. Soc. Indic. Res. 2008, 85, 243–256. [Google Scholar] [CrossRef]
- Ancell, S.; Thompson-Fawcett, M. The Social Sustainability of Medium Density Housing: A Conceptual Model and Christchurch Case Study. Hous. Stud. 2008, 23, 423–442. [Google Scholar] [CrossRef]
- Bacon, N.; Cochrane, D.; Woodcraft, D. Creating Strong Communities: How to Measure the Social Sustainability of New Housing Developments; The Berkeley Group: Cobham, UK, 2012. [Google Scholar]
- Bramley, G.; Dempsey, N.; Power, S.; Brown, C. What Is ‘Social Sustainability’, and How Do Our Existing Urban Forms Perform in Nurturing It? In Proceedings of the Sustainable Communities and Green Futures Conference, London, UK, 5 April 2006; pp. 1–40. [Google Scholar]
- Kyttä, M.; Broberg, A.; Haybatollahi, M.; Schmidt-Thomé, K. Urban Happiness: Context-Sensitive Study of the Social Sustainability of Urban Settings. Environ. Plan. B Plan. Des. 2016, 43, 34–57. [Google Scholar] [CrossRef]
- Madanipour, A. Rethinking Public Space: Between Rhetoric and Reality. Urban Des. Int. 2019, 24, 38–46. [Google Scholar] [CrossRef]
- Stender, M.; Walter, A. The Role of Social Sustainability in Building Assessment. Build. Res. Inf. 2019, 47, 598–610. [Google Scholar] [CrossRef]
- Shirazi, M.R.; Keivani, R. Social Sustainability of Compact Neighbourhoods Evidence from London and Berlin. Sustainability 2021, 13, 2340. [Google Scholar] [CrossRef]
- Opp, S.M. The Forgotten Pillar: A Definition for the Measurement of Social Sustainability in American Cities. Local Environ. 2017, 22, 286–305. [Google Scholar] [CrossRef]
- Pitarch-Garrido, M.-D. Social Sustainability in Metropolitan Areas: Accessibility and Equity in the Case of the Metropolitan Area of Valencia (Spain). Sustainability 2018, 10, 371. [Google Scholar] [CrossRef] [Green Version]
- Mehan, A. An Integrated Model of Achieving Social Sustainability in Urban Context through Theory of Affordance. Procedia Eng. 2017, 198, 17–25. [Google Scholar] [CrossRef] [Green Version]
- Abed, A.; Al-Jokhadar, A. Common Space as a Tool for Social Sustainability. J. Hous. Built Environ. 2022, 37, 399–421. [Google Scholar] [CrossRef]
- Moulay, A.; Ujang, N.; Said, I. Legibility of Neighborhood Parks as a Predicator for Enhanced Social Interaction towards Social Sustainability. Cities 2017, 61, 58–64. [Google Scholar] [CrossRef]
- Goosen, Z.; Cilliers, E.J. Enhancing Social Sustainability Through the Planning of Third Places: A Theory-Based Framework. Soc. Indic. Res. 2020, 150, 835–866. [Google Scholar] [CrossRef]
- Motealleh, T.; Zakeri, S.M.H.; Vakilinezhad, R.; Ekhtiari, M. Characterisation of Social Sustainability in a Decayed Urban Block in Iran (a Case Study of: Saheb Al-Amri Neighbourhood of Ghasr-Dasht, Shiraz). Local Environ. 2021, 26, 1152–1173. [Google Scholar] [CrossRef]
- Lotfata, A.; Ataöv, A. Urban Streets and Urban Social Sustainability: A Case Study on Bagdat Street in Kadikoy, Istanbul. Eur. Plan. Stud. 2020, 28, 1735–1755. [Google Scholar] [CrossRef]
- Soltani, S.; Gu, N.; Ochoa, J.J.; Sivam, A. The Role of Spatial Configuration in Moderating the Relationship between Social Sustainability and Urban Density. Cities 2022, 121, 103519. [Google Scholar] [CrossRef]
- Pitarch-Garrido, M.-D. Social Sustainability through Accessibility and Equity; Brief for Global Sustainable Development Report 2015; 2015; pp. 1–3. Available online: https://sustainabledevelopment.un.org/content/documents/5918Social%20sustainability%20through%20accessibility%20and%20equity.pdf (accessed on 18 April 2022).
- Martal, A. Değişim Sürecinde İzmir’de Sanayileşme: 19. Yüzyıl; Dokuz Eylül Yayınları: İzmir, Turkey, 1999. [Google Scholar]
- Gündüz, O.; Kiray, M.T. 20. Yüzyılda Karsiyaka’da Kentsel ve Mimari Dönüşümler. In Karsiyaka Kültür ve Çevre Sempozyumu; Şanal Matbacılık: İzmir, Turkey, 2006; pp. 82–93. [Google Scholar]
- George, D.; Mallery, P. IBM SPSS Statistics 23 Step by Step; Routledge: New York, NY, USA, 2016; ISBN 9781134793334. [Google Scholar]
- Nunnally, J.C.; Bernstein, I.H. The Assessment of Reliability; McGraw-Hill: New York, NY, USA, 1994. [Google Scholar]
- Evans, J.D. Straightforward Statistics for the Behavioral Sciences; Brooks/Cole Publishing: Pacific Grove, CA, USA, 1996. [Google Scholar]
- Leyden, K.M. Social Capital and the Built Environment: The Importance of Walkable Neighborhoods. Am. J. Public Health 2003, 93, 1546–1551. [Google Scholar] [CrossRef] [PubMed]
- Cattell, V. Poor People, Poor Places, and Poor Health: The Mediating Role of Social Networks and Social Capital. Soc. Sci. Med. 2001, 52, 1501–1516. [Google Scholar] [CrossRef]
- Lund, H. Pedestrian Environments and Sense of Community. J. Plan. Educ. Res. 2002, 21, 301–312. [Google Scholar] [CrossRef]
- Low, S.; Smart, A. Thoughts about Public Space During Covid-19 Pandemic. City Soc. 2020, 32, ciso.12260. [Google Scholar] [CrossRef]
- Adams, M.; Holding, E.; Kimball, M. Social Sustainability: Process, Place, People; JTP Press: London, UK, 2012. [Google Scholar]
- Wood, L.; Shannon, T.; Bulsara, M.; Pikora, T.; McCormack, G.; Giles-Corti, B. The Anatomy of the Safe and Social Suburb: An Exploratory Study of the Built Environment, Social Capital and Residents’ Perceptions of Safety. Health Place 2008, 14, 15–31. [Google Scholar] [CrossRef]
- Wood, L.; Frank, L.D.; Giles-Corti, B. Sense of Community and Its Relationship with Walking and Neighborhood Design. Soc. Sci. Med. 2010, 70, 1381–1390. [Google Scholar] [CrossRef]
- Schwanke, D. Mixed-Use Development Handbook; Urban Land Institute: Washington, DC, USA, 2003. [Google Scholar]
- Jacobs, J. The Death and Life of Great American Cities; Random House: New York, NY, USA, 2006. [Google Scholar]
- Appleyard, D. Livable Streets; University of California Press: Berkeley, CA, USA, 1981. [Google Scholar]
- Hart, J. Driven to Excess: Impacts of Motor Vehicle Traffic on Residential Quality of Life in Bristol, UK; University of the West of England: Bristol, UK, 2008. [Google Scholar]
- Enyedi, G. Social Sustainability of Large Cities Social Sustainability of Large Cities. Ekistics New Habitat 2002, 69, 142–144. [Google Scholar] [CrossRef]
- Lan, F.; Gong, X.; Da, H.; Wen, H. How Do Population Inflow and Social Infrastructure Affect Urban Vitality? Evidence from 35 Large- and Medium-Sized Cities in China. Cities 2020, 100, 102454. [Google Scholar] [CrossRef]
- Bridge, G. The Neighbourhood and Social Networks; ESRC Centre for Neighbourhood Research: Swindon, UK, 2002; pp. 16–18. [Google Scholar]
- Kuo, F.E.; Bacaicoa, M.; Sullivan, W.C. Transforming Inner-City Landscapes. Environ. Behav. 1998, 30, 28–59. [Google Scholar] [CrossRef]
- Maas, J.; Spreeuwenberg, P.; van Winsum-Westra, M.; Verheij, R.A.; Vries, S.; Groenewegen, P.P. Is Green Space in the Living Environment Associated with People’s Feelings of Social Safety? Environ. Plan. A Econ. Sp. 2009, 41, 1763–1777. [Google Scholar] [CrossRef] [Green Version]
- Meegan, R.; Mitchell, A. ’It’s Not Community Round Here, It’s Neighbourhood’: Neighbourhood Change and Cohesion in Urban Regeneration Policies. Urban Stud. 2001, 38, 2167–2194. [Google Scholar] [CrossRef]
- Hidalgo, M.C.; Hernández, B. Place Attachment: Conceptual and Empirical Questions. J. Environ. Psychol. 2001, 21, 273–281. [Google Scholar] [CrossRef]
- Gerson, K.; Stueve, C.A.; Fischer, C.S. Attachment to Place. In Networks and Places; Fischer, C.S., Jackson, R.M., Stueve, C.A., Gerson, K., Jones, L., Baldassare, M., Eds.; The Free Press: New York, NY, USA, 1977; pp. 139–161. [Google Scholar]
- Proshansky, H.M. The City and Self-Identity. Environ. Behav. 1978, 10, 147–169. [Google Scholar] [CrossRef]
- Stokols, D.; Shumaker, S.A. People in Places: Transactional View of Settings. In Cognition, Social Behavior, and the Environment; Harvey, J.H., Ed.; Lawrence Erlbaum Associates: Hillsdale, NJ, USA, 1981; pp. 441–488. [Google Scholar]
- Hummon, D.M. Community Attachment. In Place Attachment; Springer US: Boston, MA, USA, 1992; pp. 253–278. [Google Scholar]
- Shaftoe, H. Community Safety and Actual Neighbourhoods. In Sustainable Communities: The Potential for Eco-Neighbourhoods; Barton, H., Ed.; Earthscan Publications: London, UK, 2000; pp. 230–245. ISBN 9781853835131. [Google Scholar]
- Dinnie, E.; Brown, K.M.; Morris, S. Community, Cooperation and Conflict: Negotiating the Social Well-Being Benefits of Urban Greenspace Experiences. Landsc. Urban Plan. 2013, 112, 1–9. [Google Scholar] [CrossRef]
- Goffman, E. Interaction Ritual; Essays in Face-to-Face Behavior; Aldine Publishing: Chicago, IL, USA, 1967. [Google Scholar]
- Lemert, C.; Branaman, A. The Goffman Reader; Blackwell: Cambridge, UK, 1997. [Google Scholar]
- Lund, H. Testing the Claims of New Urbanism: Local Access, Pedestrian Travel, and Neighboring Behaviors. J. Am. Plan. Assoc. 2003, 69, 414–429. [Google Scholar] [CrossRef]
- Nash, V.; Christie, I. Making Sense of Community; Institute for Public Policy Research: London, UK, 2003. [Google Scholar]
- Ng, M.K.; Cook, A.; Chui, E.W.T. The Road Not Travelled: A Sustainable Urban Regeneration Strategy for Hong Kong. Plan. Pract. Res. 2001, 16, 171–183. [Google Scholar] [CrossRef]
- UN-Habitat. 20+ Reasons Why NUP Matters; GPO: Nairobi, Kenya, 2019. [Google Scholar]
- Kühner, T.; da Silva Pinto, C.V.; Naves David Amorim, C. International Urban Agendas and Sustainable Integrated Urban Development in Developing Countries: The Case of Brazil. Cid. Comunidades Territ 2021. Available online: http://journals.openedition.org/cidades/3475 (accessed on 18 April 2022). [CrossRef]
- Bauman, Z. The Individualized Society; Polity: Cambridge, UK, 2001. [Google Scholar]
- Mari, M. Community: Seeking Safety in an Insecure World; Polity Books: Queensland, Australia, 2007. [Google Scholar] [CrossRef]
- Koenig, J.G. Indicators of Urban Accessibility: Theory and Application. Transportation 1980, 9, 145–172. [Google Scholar] [CrossRef]
- Raman, R.; Roy, U.K. Taxonomy of Urban Mixed Land Use Planning. Land Use Policy 2019, 88, 104102. [Google Scholar] [CrossRef]
- Sorensen, A.; Sagaris, L. From Participation to the Right to the City: Democratic Place Management at the Neighbourhood Scale in Comparative Perspective. Plan. Pract. Res. 2010, 25, 297–316. [Google Scholar] [CrossRef]
- Irvin, R.A.; Stansbury, J. Citizen Participation in Decision Making: Is It Worth the Effort? Public Adm. Rev. 2004, 64, 55–65. [Google Scholar] [CrossRef]
- Fung, A. Putting the Public Back into Governance: The Challenges of Citizen Participation and Its Future. Public Adm. Rev. 2015, 75, 513–522. [Google Scholar] [CrossRef]
Figure 1.
The pentagon model of social sustainability.

Figure 2.
Dimensions, indicators, and measures for sociospatial indicators of social sustainability.
Figure 2.
Dimensions, indicators, and measures for sociospatial indicators of social sustainability.

Figure 3.
The location of Izmir and central districts of the city (study areas, Karsiyaka, in the circle).
Figure 3.
The location of Izmir and central districts of the city (study areas, Karsiyaka, in the circle).

Figure 4.
Karsiyaka district, Izmir and study areas.

Figure 5.
Land use analysis of study areas.

Figure 6.
Social facilities and open spaces in study areas.

Figure 7.
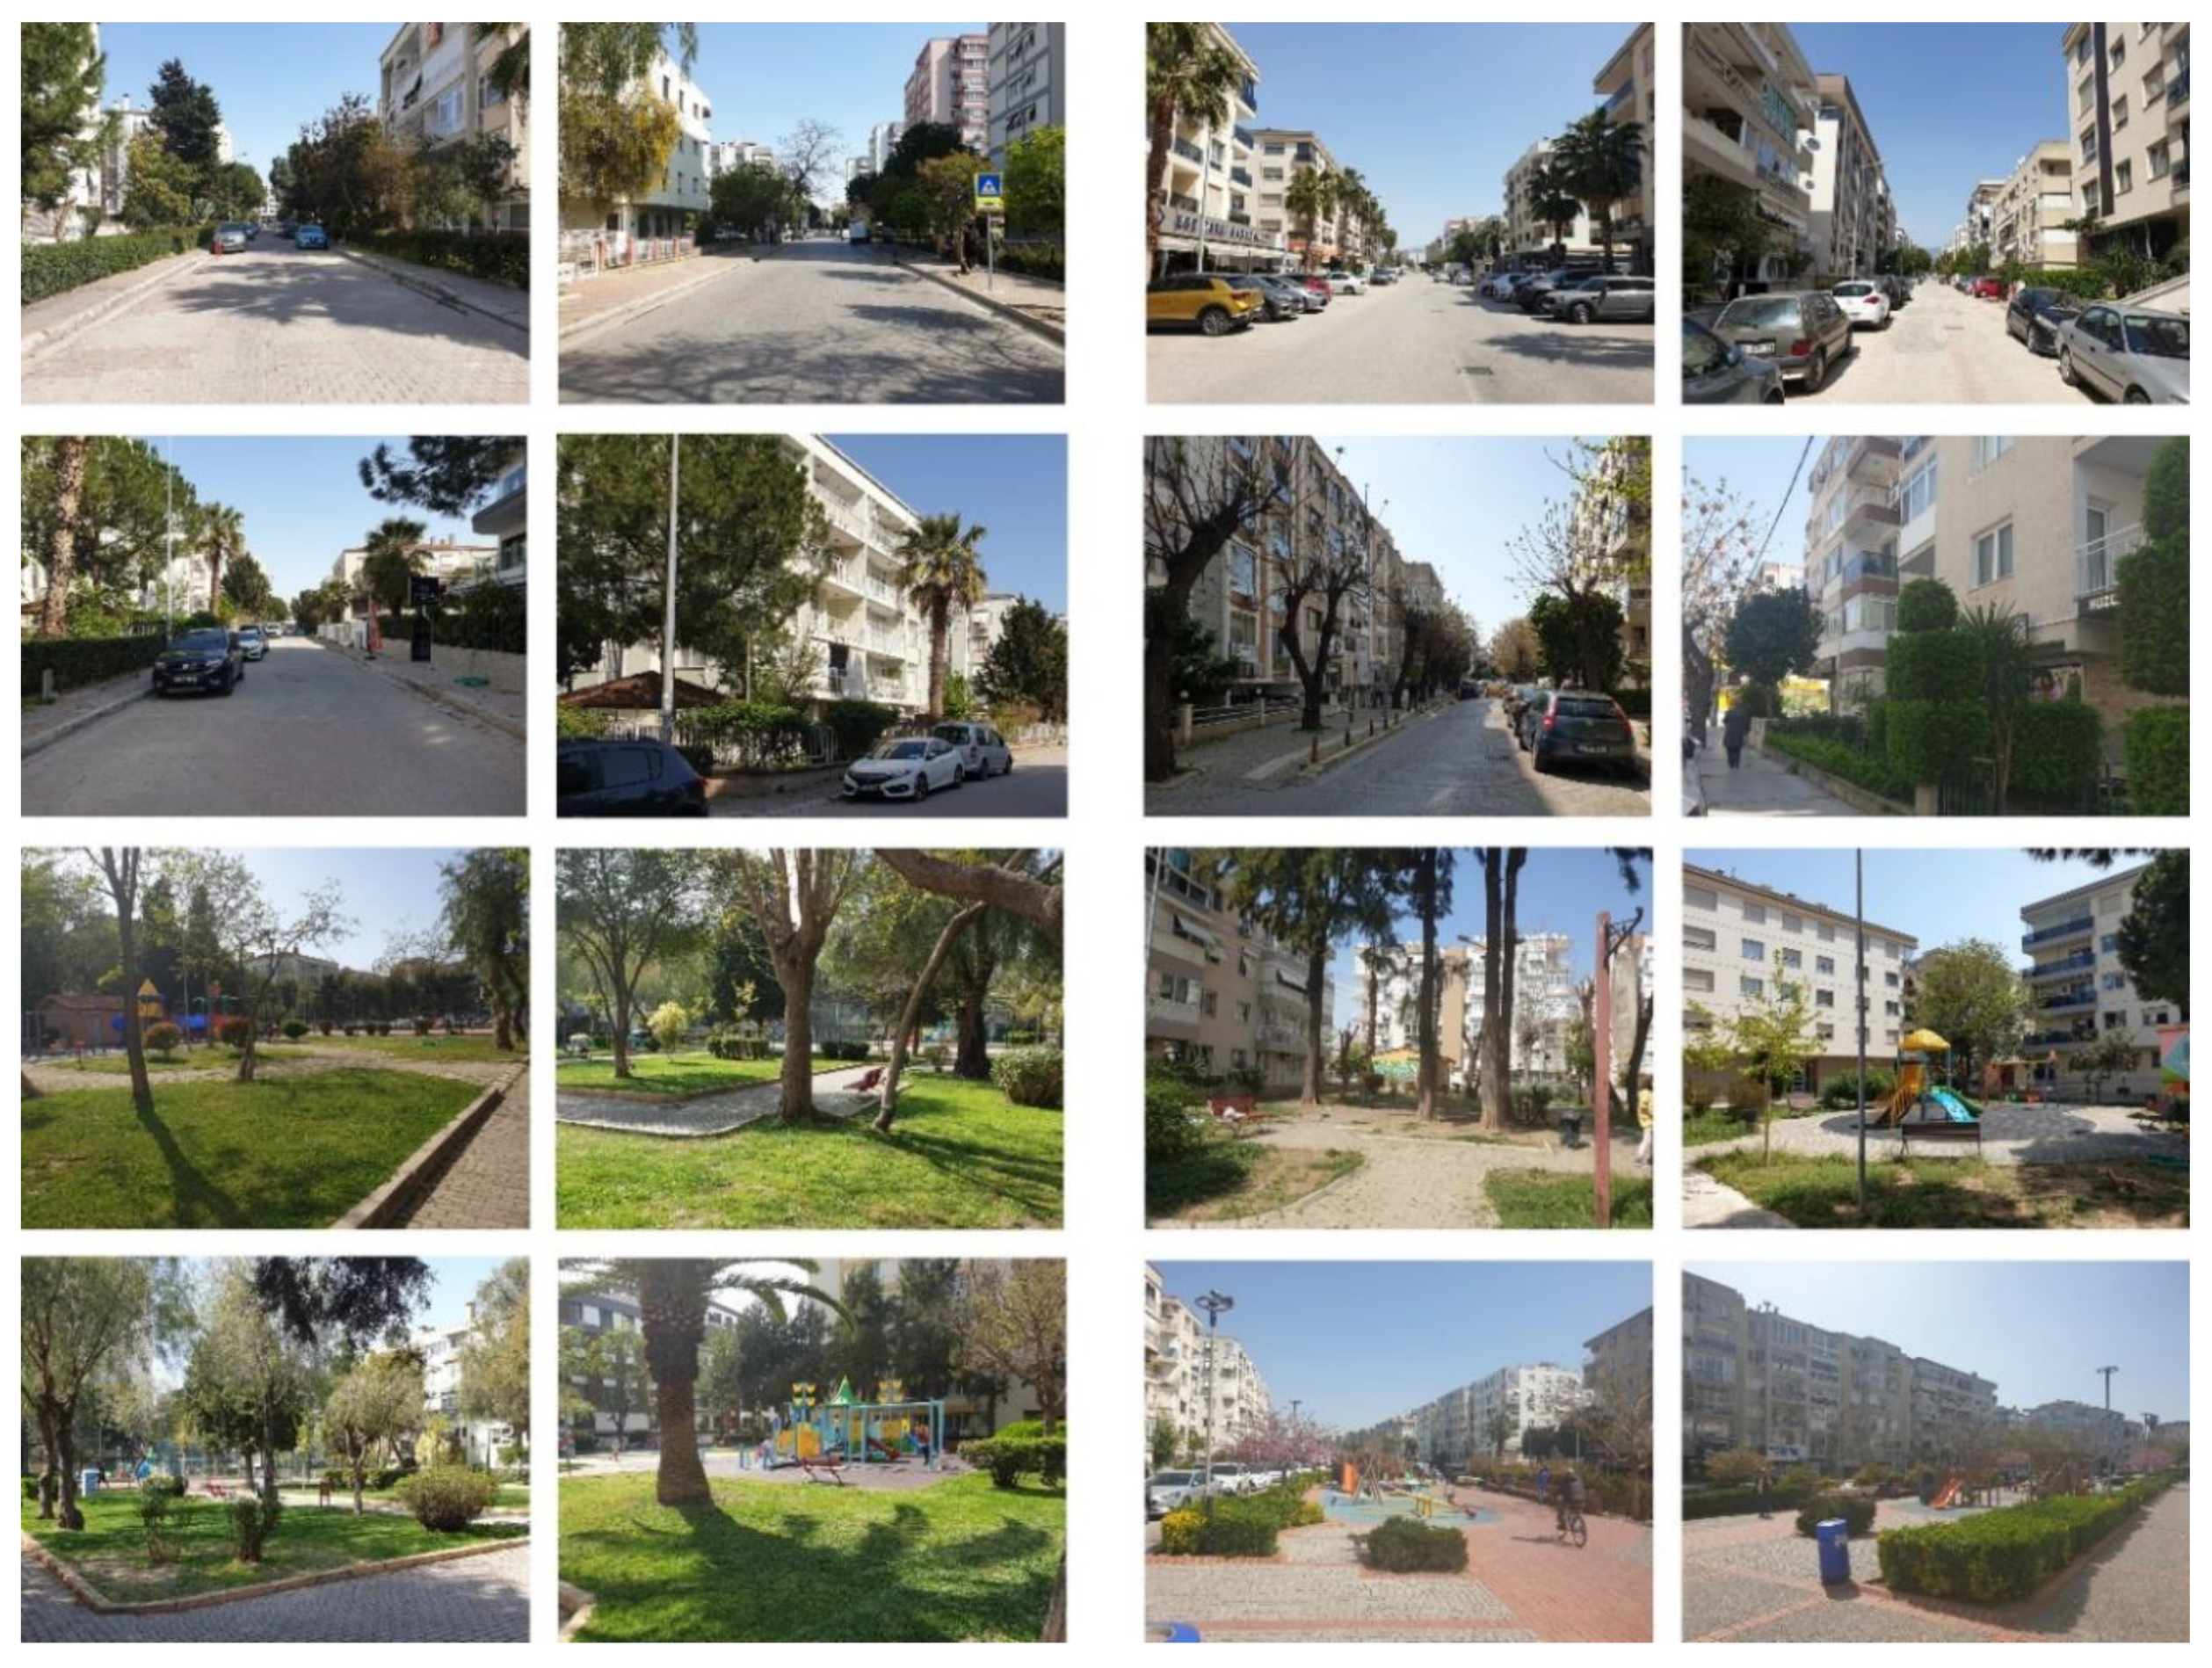
Images from neighborhoods (left: Atakent; right: Bahriye Ucok).

Figure 8.
Relationships between Person dimension and other indicators in the pentagon model (based on one-way ANOVA results, significance levels are disregarded).
Figure 8.
Relationships between Person dimension and other indicators in the pentagon model (based on one-way ANOVA results, significance levels are disregarded).

Figure 9.
Relationships between Place dimension and other indicators in the pentagon model (dotted lines: very weak; dashed lines: weak; straight lines: moderate).
Figure 9.
Relationships between Place dimension and other indicators in the pentagon model (dotted lines: very weak; dashed lines: weak; straight lines: moderate).

Figure 10.
Relationships between People dimension and other indicators in the pentagon model (dotted lines: very weak; dashed lines: weak; straight lines: moderate; double line: strong. * Based on one-way ANOVA results, significance levels are disregarded).
Figure 10.
Relationships between People dimension and other indicators in the pentagon model (dotted lines: very weak; dashed lines: weak; straight lines: moderate; double line: strong. * Based on one-way ANOVA results, significance levels are disregarded).

Figure 11.
Comparing the two study areas (* significantly different indicators).

Figure 12.
The network of relationships between the indicators in the pentagon model (the colors represent the findings in previous tables: green for Table 3, orange for Table 4; and blue for Table 5).


Table 1.
Some conceptual models for social sustainability in the literature (papers are listed in chronological order).
Table 1.
Some conceptual models for social sustainability in the literature (papers are listed in chronological order).
| Author(s) | Dimensions of Social Sustainability | Themes/Criteria Considered |
|---|---|---|
| Bramley et al., 2009 [1] | Social equity | Access to services and opportunities; essential local services such as shops, schools, health centers; recreational opportunities, open space public transport; job opportunities; affordable housing |
| Sustainability of community | pride in and attachment to neighborhood; social interaction within the neighborhood; safety/security (vs. risk of crime, antisocial behavior); perceived quality of local environment; satisfaction with the home; stability (vs. residential turnover); participation in collective group/civic activities | |
| Landorf, 2011 [5] | Social equity | Access to services; facilities and opportunities; level of institutional stability and flexibility |
| Social coherence | Strength of network; participation, identification, and tolerance; level of empowerment and accountability | |
| Basic Needs | Objective satisfaction of basic needs; Subjective satisfaction of basic needs | |
| Bacon et al., 2012 [25] | Amenities and infrastructure | Provision of community space; transport links; place with distinctive character; integration with wider neighborhood; accessible street layout; physical space on development that is adaptable in the future |
| Social and cultural life | Positive local identity; relationships with neighbors; well-being; feelings of safety; community facilities | |
| Voice and influence | Perceptions of ability to influence local area; willingness to act to improve area | |
| Dempsey et al., 2012 [18] | Social equity | Access to services (supermarkets; local shops; parking provision); mode of transport |
| Environmental equity | Open spaces | |
| Sustainability of community/human well-being | Feelings of safety; community stability; sense of place; social networks; social interaction | |
| Hemani et al., 2017 [13] | Social capital/social cohesion | Social interactions/social networks; trust/reciprocity; place attachment/pride; social participation/community engagement; fear of crime/perception of safety |
| Social inclusion/social equity | Availability and access to basic services, facilities and amenities | |
| Ali et al., 2019 [28] | Sustainability of community | Social interaction; safety; residential stability, sense of belonging; neighborhood as place to live |
| Social equity | Access to services; open spaces/parks; transportation availability; job accessibility | |
| Stender and Walter, 2019 [29] | Social cohesion | Identity; safety; meeting places; social activities; connection; amenities |
| Participatory process | Participation; inclusion | |
| Accessibility | Mixed dwellings; affordable housing; employment and education; health | |
| Shirazi and Keivani, 2021 [30] | Neighbors | Social mix |
| Neighboring | Access to facilities; social networking; safety and security; sense of attachment; quality of home; quality of neighborhood; neighborhood participation | |
| Neighborhood | Mixed land use; density; building typology; urban pattern; quality of center |
Table 2.
Sociospatial aspects in social sustainability (papers are listed in chronological order).
| Indicators | Scholars |
|---|---|
| Accessibility | Porta and Renne, 2005 [22]; Ancell and Thompson-Fawcett, 2008 [24]; Chan and Lee, 2008 [23]; Karuppannan and Sivam, 2011 [3]; Bacon et al., 2012 [25]; Opp, 2017 [31]; Pitarch-Garrido, 2018 [32]; Ali et al., 2019 [12]; Stender and Walter, 2019 [29]; Alipour and Galal Ahmed, 2021 [17] |
| Social infrastructure | Porta and Renne, 2005 [22]; Ancell and Thompson-Fawcett, 2008 [24]; Chan and Lee, 2008 [23]; Bramley et al., 2009 [1]; Karuppannan and Sivam, 2011 [3]; Landorf, 2011 [5]; Dempsey et al., 2012 [18]; Bacon et al., 2012 [25]; Hemani et al., 2017 [13]; Mehan, 2017 [33]; Pitarch-Garrido, 2018 [40]; Ali et al., 2019 [12]; Stender and Walter, 2019 [29]; Shirazi and Keivani, 2021 [30]; Abed and Al-Jokhadar, 2022 [34] |
| Places for Daily Operations (or Third Spaces) | Bramley et al., 2006 [26]; Chan and Lee, 2008 [23]; Goosen and Cilliers, 2020 [36] |
| Open Spaces | Chan and Lee, 2008 [23]; Karuppannan and Sivam, 2011 [3]; Bacon et al., 2012 [25]; Dempsey et al., 2012 [18]; Moulay et al., 2017 [35]; Ali et al., 2019 [12] |
| Sense of Community | Bramley et al., 2009 [1]; Dempsey et al., 2012 [18]; Ali et al., 2019 [12]; Lotfata and Ataöv, 2019 [38] |
| Social Relations (or Interactions) | Ancell and Thompson-Fawcett, 2008 [24]; Bramley et al., 2009 [1]; Karuppannan and Sivam, 2011 [3]; Dempsey et al., 2012 [18]; Bacon et al., 2012 [25]; Hemani et al., 2017 [13]; Moulay et al. 2017 [35]; Ali et al., 2019 [12]; Larimian and Sadeghi, 2021 [15]; Lotfata and Ataöv, 2019 [38]; Soltani et al., 2022 [39] |
| Social Networks | Karuppannan and Sivam, 2011 [3]; Landorf, 2011 [5]; Dempsey et al., 2012 [18]; Hemani et al., 2017 [13]; Shirazi and Keivani, 2021 [30] |
| Sense of Place (or Attachment) | Bramley et al., 2009 [1]; Karuppannan and Sivam, 2011 [3]; Dempsey et al., 2012 [18]; Hemani et al., 2017 [13]; Mehan, 2017 [33]; Lotfata and Ataöv, 2019 [38]; Larimian and Sadeghi, 2021 [15]; Shirazi and Keivani, 2021 [30]; Abed and Al-Jokhadar, 2022 [34]; Soltani et al., 2022 [39] |
| Security and Safety | Porta and Renne, 2005 [22]; Bramley et al., 2009 [1]; Karuppannan and Sivam, 2011 [3]; Landorf, 2011 [5]; Dempsey et al., 2012 [18]; Bacon et al., 2012 [25]; Opp, 2017 [31]; Hemani et al., 2017 [13]; Ali et al., 2019 [12]; Stender and Walter, 2019 [29]; Alipour and Galal Ahmed, 2021 [17]; Larimian and Sadeghi, 2021 [15]; Motealleh et al., 2021 [37]; Shirazi and Keivani, 2021 [30]; Abed and Al-Jokhadar [34], 2022; Soltani et al., 2022 [39] |
| Participation | Chan and Lee, 2008 [23]; Bramley et al., 2009 [1]; Landorf, 2011 [5]; Bacon et al., 2012 [25]; Mehan, 2017 [33]; Motealleh et al., 2021 [37]; Stender and Walter, 2019 [29]; Soltani et al., 2022 [39]; Hemani et al., 2017 [13]; Larimian and Sadeghi, 2021 [15] |
| Future of Space (Flexibility or Adaptability) | Bacon et al., 2012 [25]; Stender and Walter, 2019 [29] |
Table 3.
Person dimension compared to other indicators in the pentagon model and comparison of study areas.
Table 3.
Person dimension compared to other indicators in the pentagon model and comparison of study areas.
| PLACE | PEOPLE | PERCEPTION | PROCESS | |||||||||
|---|---|---|---|---|---|---|---|---|---|---|---|---|
| Accessibility | Social Infrastructure | Open Spaces | Places for Daily Operations | Sense of Community | Social Relations | Social Network | Sense of Place | Security and Safety | Participation | Chi-Square (Sig.) | ||
| Demographic Characteristics | Gender | Desire 0.030 ** | Size 0.072 * | Personal 0.066 * | 0.380 | |||||||
| Age | Walkable distance 0.000 *** | Commercial activities 0.085 * | Desire 0.000 *** | 0.009 ** | Dependence 0.077 * | 0.444 | ||||||
| Educational Level | Edu. fac. 0.060 * | 0.077 * | 0.067 * | 0.034 ** | 0.000 *** | |||||||
| Income | Cult. Fac. 0.040 ** | 0.095 *** | 0.066 * | Personal time 0.009 ** | Pedestrian 0.003 ** | 0.059 * | 0.000 *** | |||||
| Household Characteristic | Family Structure | Walkable distance 0.097 * | Personal time 0.069 * | Commodity 0.058 * | 0.034 ** | |||||||
| Number of Children | Cult. Fac. 0.050 ** | Commercial activities 0.089 * | 0.020 ** | Size 0.086 * Active 0.012 ** | Dependence 0.037 ** | Personal 0.015 ** | 0.554 | |||||
| House Ownership | 0.034 ** | 0.015 ** | Size 0.000 *** | 0.040 ** | 0.214 | |||||||
| Residence Time in the House | Cult. Fac. 0.037 ** | 0.076 * | 0.000 *** | Size 0.007 ** Active 0.050 ** | 0.076 * | Comparing 0.017 ** | 0.406 | |||||
| Residence Time in the City | Trust 0.055 * Belonging 0.025 ** | 0.010 *** | 0.002 ** | 0.194 | ||||||||
| Car Ownership | Walkable distance 0.069 * | Healthcare fac. 003 ** Cult. Fac. 0.015 ** | 0.035 ** | Belonging 0.016 ** | Personal time 0.060 * | Size 0.014 ** | Pedestrian 0.082 * Comparing 0.044 ** | 0.015 ** | 0.000 *** | |||
| Frequency of Car Travel | Cult. Fac. 0.037 ** | 0.076 * | 0.000 *** | Size 0.007 ** Active 0.050 ** | 0.076 * | Comparing 0.017 ** | 0.000 *** | |||||
*** Significance level 0.01; ** Significance level 0.05; * Significance level 0.10.
Table 4.
Place dimension’s relations with other indicators via correlation analysis.
| PEOPLE | PERCEPTION | PROCESS | ||||
|---|---|---|---|---|---|---|
| Sense of Community | Social Relations | Sense of Place | Security and Safety | Participation | ||
| PLACE | Accessibility | 0.186 ** | 0.166 * | 0.265 ** | 0.304 ** | 0.361 ** |
| Social Infrastructure | 0.264 ** | 0.199 ** | 0.438 ** | 0.401 ** | 0.199 ** | |
| Open Spaces | 0.283 ** | 0.281 ** | 0.401 ** | 0.527 ** | 0.374 ** | |
| Places for Daily Operations | 0.196 ** | 0.114 | 0.335 ** | 0.168 ** | 0.347 ** | |
** Correlation is significant at the 0.01 level (2-tailed). * Correlation is significant at the 0.05 level (2-tailed). n = 234.
Table 5.
The relations of the People dimension to other indicators in the pentagon model.
| PLACE | PERCEPTION | PROCESS | |||||||
|---|---|---|---|---|---|---|---|---|---|
| Accessibility | Social Infrastructure | Open Spaces | Places for Daily Operations | Sense of Place | Security and Safety | Participation | |||
| PEOPLE | Sense of Community | Pearson Correlation Sig. (2-tailed) | 0.186 ** (0.004) | 0.283 ** (0.000) | 0.264 ** (0.000) | 0.196 ** (0.003) | 0.636 ** (0.000) | 0.137 * (0.036) | 0.373 ** (0.000) |
| Social Relations | Pearson Correlation Sig. (2-tailed) | 0.166 ** (0.011) | 0.199 *** (0.003) | 0.281 *** (0.000) | 0.114 * (0.081) | 0.425 *** (0.000) | 0.154 ** (0.018) | 0.093 (0.164) | |
| Social Network (Size) | ANOVA (F value) | 0.079 * (2.571) | Healthcare 0.058 * (2.889) children & youth 0.084 * (2.510) | 0.004 ** (5.691) | - | 0.003 ** (6.071) | 0.001 * (6.853) | 0.027 ** (3.677) | |
| Social Network (Active contacts) | ANOVA (F value) | 0.096 * (2.363) | - | 0.046 ** (3.125) | - | 0.000 * (10.636) | 0.036 ** (3.379) | - | |
*** Significance level 0.01; ** Significance level 0.05; * Significance level 0.10.
Table 6.
Comparing the two study areas on indicators of social sustainability.
| Bahriye Ucok (n = 122) | Atakent (n = 112) | t | p | ||
|---|---|---|---|---|---|
| Mean (std. dev.) | Mean (std. dev.) | ||||
| PLACE | Accessibility | 4.13 (0.67) | 3.97 (0.60) | 1.978 | 0.049 ** |
| Social Infrastructure | 3.55 (0.79) | 3.60 (0.63) | −0.598 | 0.551 | |
| Healthcare facilities | 4.06 (0.99) | 3.52(1.13) | 3.863 | 0.001 *** | |
| Cultural facilities | 3.38 (1.03) | 3.60 (0.97) | −0.657 | 0.099 * | |
| Daily Operations | 4.65 (0.43) | 4.39 (0.48) | 4.159 | 0.000 *** | |
| Open Spaces | 3.46 (0.86) | 3.91 (0.60) | −4.627 | 0.000 *** | |
| PEOPLE | Sense of community | 3.59 (0.91) | 3.47 (0.87) | 1.054 | 0.293 |
| Neighborliness | 3.10 (1.01) | 3.61 (1.06) | 3.577 | 0.000 *** | |
| Desire to participate in the community | 3.51 (1.18) | 3.79 (0.88) | −2.089 | 0.038 ** | |
| Opportunities for building community | 3.58 (1.04) | 3.96 (0.78) | −3.065 | 0.002 ** | |
| Social Relations | 2.84 (0.84) | 3.24 (0.92) | −3.519 | 0.001 *** | |
| Social Network (size) | 15.51 (12.86) | 22.77 (13.19) | −5.355 | 0.000 *** | |
| Social Network (active) | 5.57 (3.31) | 7.72 (4.77) | −3.081 | 0.002 ** | |
| PERCEPTION | Sense of place | 3.91 (0.85) | 3.71 (0.65) | 2.025 | 0.044 ** |
| Security and Safety | 3.62 (0.84) | 3.97 (0.58) | −3.636 | 0.000 *** | |
| PROCESS | Participation | 3.88 (0.79) | 3.29 (0.92) | 5.184 | 0.000 *** |
*** Significance level 0.01; ** Significance level 0.05; * Significance level 0.10.
Publisher’s Note: MDPI stays neutral with regard to jurisdictional claims in published maps and institutional affiliations. |
© 2022 by the authors. Licensee MDPI, Basel, Switzerland. This article is an open access article distributed under the terms and conditions of the Creative Commons Attribution (CC BY) license (https://creativecommons.org/licenses/by/4.0/).
Share and Cite
MDPI and ACS Style
Akcali, S.; Cahantimur, A. The Pentagon Model of Urban Social Sustainability: An Assessment of Sociospatial Aspects, Comparing Two Neighborhoods. Sustainability 2022, 14, 4990. https://0-doi-org.brum.beds.ac.uk/10.3390/su14094990
AMA Style
Akcali S, Cahantimur A. The Pentagon Model of Urban Social Sustainability: An Assessment of Sociospatial Aspects, Comparing Two Neighborhoods. Sustainability. 2022; 14(9):4990. https://0-doi-org.brum.beds.ac.uk/10.3390/su14094990
Chicago/Turabian StyleAkcali, Seyda, and Arzu Cahantimur. 2022. "The Pentagon Model of Urban Social Sustainability: An Assessment of Sociospatial Aspects, Comparing Two Neighborhoods" Sustainability 14, no. 9: 4990. https://0-doi-org.brum.beds.ac.uk/10.3390/su14094990
Note that from the first issue of 2016, this journal uses article numbers instead of page numbers. See further details here.