
Risk-Compensation Trends in Road Safety during COVID-19


Department of Civil, Environmental, and Construction Engineering, University of Central Florida, Orlando, FL 32816, USA
*
Author to whom correspondence should be addressed.
Sustainability 2022, 14(9), 5057; https://0-doi-org.brum.beds.ac.uk/10.3390/su14095057
Submission received: 14 December 2021
/
Revised: 19 April 2022
/
Accepted: 20 April 2022
/
Published: 22 April 2022
(This article belongs to the Special Issue Sustainable Analysis of Traffic Crash Risk)
Abstract
:The COVID-19 pandemic has had a global impact, disrupting the normal trends of our everyday life. More specifically, the effects of COVID-19 on road safety are still largely unexplored. Hence, this study aims to investigate the change in road safety trends due to COVID-19 using real-time traffic parameters. Results from the extensive analyses of the 2017 to 2020 data of Interstate-4 show that traffic volume decreased by 13.6% in 2020 compared to the average of 2017–2019’s volume, whereas there is a decreasing number of crashes at the higher volume. Average speed increased by 11.3% during the COVID-19 period; however, the increase in average speed during the COVID-19 period has an insignificant relationship with crash severities. Fatal crashes increased, while total crashes decreased, during the COVID-19 period; severe crashes decreased with the total crashes. Alcohol-related crashes decreased by 22% from 2019 to 2020. Thus, the road-safety trend due to the impact of COVID-19 has evidently changed and presents a unique trend. The findings of the study suggest a larger need for a more in-depth study to analyze the impact of COVID-19 on road safety, to minimize fatalities on roads through appropriate policy measures.
1. Introduction
Severe acute respiratory syndrome coronavirus 2 SARS-CoV-2, mostly known as COVID-19, was first identified in December 2019 in Wuhan, Hubei, China [1], and the World Health Organization (WHO) announced COVID-19 as a new disease on 7 January 2020 [2]. The first case in the USA was reported on 20 January 2020, in Washington State, and, on 11 March 2020, WHO declared the outbreak of COVID-19 to be a pandemic [2]. As of 16 April 2022, across the world, more than 501 million people are infected with COVID-19 and more than 6.2 million people have died from the disease [3]. In addition to the loss of life, there have been significant economic losses, business closures, job losses, and widespread disruption of educational, religious, cultural, and social activities, which eventually result in huge negative impacts on quality of life [4]. Some notable changes are also reported in the transportation sectors, particularly due to the immediate lockdown/stay-at-home order to prevent the spreading of this infectious disease [5].
Particularly, road accidents are a global problem and result in an unacceptably high socio-economic toll, which is placing a heavy burden on people’s health and economics [5,6]. Worldwide, each year, more than 1.35 million people die on roads, and 50 million suffer severe injuries due to road crashes [7]. As driving behavior and traffic patterns have significantly changed due to the impact of a global pandemic, it is expected that there should be some effects on road crash patterns due to the impact of the global pandemic [8,9]. Hence, there is much interest in how road crash patterns are impacted by the global COVID-19 pandemic, to ensure safer roads through adopting appropriate policies. This has motivated the authors most to investigate the changed patterns of road crash trends due to the impact of COVID-19.
2. Literature Review
Safety researchers make an effort to assess or evaluate the effects of any change in a traditional system, whether due to economic downfall [10], changes in any laws related to traffic safety [11,12], the introduction of new technology [13], changes in any service measure [14,15], and so on. Behnood and Mannering assessed the changes in pedestrian-injury severity due to the effect of the global recession (the time period for this global recession was from December 2007 to June 2009) [10]. Robertson et al. assessed the impacts of television messages on safety-belt use [12]. Lee, Abdel-Aty and Park analyzed the effects of marijuana-involved fatal crashes due to changes in five types of marijuana-related law [11]. Park et al. analyzed before–after study effects and developed crash-modification functions to assess the effects of adding bike lanes to urban arterials [14]. Yue et al. evaluated the performance of newly introduced forward-collision-warning technology under different scenarios [13]. Abdel-Aty, Devarasetty and Pande assessed the performance and safety effects of resurfacing projects on multilane arterials with partially-limited access [15]. In this regard, as COVID-19, the global pandemic, has affected almost all sectors around the world, it also drew the attention of the safety researchers.
A number of significant studies have been conducted to investigate different aspects of road crashes due to the impact of COVID-19. An immediate study after the COVID-19 outbreak by Vingilis et al. predicted that collisions, injuries, and deaths would be reduced, since there would be less traffic. However, stress and anxiety among people, the consumption of drugs and alcohol and, hence, impaired driving, speeding and stunt driving activities would be increased [16]. Another study assessed the impact of lockdown on road safety and found that a lockdown/stay-home order impacted only the road crashes with nonserious or no injuries (a mostly decreasing trend), and they found no effect of lockdown on serious or fatal injuries [17]. Another study reported that driving days per week decreased by 37% and vehicle miles driven (VMD) decreased by 35% for teens; however, older teens, ethnic minorities, and employed teens reduced their driving to a lesser extent during COVID-19 restrictions and their driving behavior remained the same [18]. Studies that were conducted a sufficient time after the COVID-19 outbreak gave a real instinct.
The majority of the studies have reported that traffic volume decreased significantly due to the impact of COVID-19, with this decrement even reaching 81% during the lockdown period [19]. A study compared monthly traffic flow between 2019 and 2020 and reported that traffic decreased 19% in March, 37% in April, 26% in May, 13% in June, 11% in July, and 12% in August 2020 [20]. Most of the studies reported that the total number of crashes was reduced due to the effect of COVID-19. However, different studies reported different percentages based on the location and time of those studies, and they mostly ranged from 20% to 76% [19,21,22,23,24,25,26,27]. Contrary to traffic volume, most of the studies reported an increase in speed during the lockdown and the immediate reopening time. This range varied from 6% to 31% from the previous time [19,28], and a study reported an increase by 2.27 km/h on average, compared to the forecasted evolution [27]. Although the intention to drink and drive [29], and harsh-acceleration and harsh-braking events were reported to be increased by up to 12% [19]; interestingly, traffic violations and distracted driving decreased by 73% [26], and 43% [24], respectively. Ambiguous results were reported in cases of fatal and other types of crash severities. Nonfatal injuries and serious injuries were reported to be decreased by 63% [23] and 19% to 48% [23,25], respectively. Whereas some studies reported an increment in fatal crashes by 18% [21], some reported that the number remained the same during the pandemic [30], whereas some found it to be decreased by 68% to 72% [23,25].
From Table 1, it is evident that total crashes are reported to be decreased in all the studies except the study of Qureshi et al. [17]. The decrement varied from 37% to 74.3% in different studies. Fatal crashes showed larger variations in results and some studies reported it to be increased, whereas many studies found fatalities to be decreased. The National Highway Traffic Safety Administration (NHTSA) and the US Department of Transportation are publishing a series of quarterly reports on the different effects of COVID-19 on road safety, and they, along with Qureshi et al. [17], reported fatal crashes to be significantly increased during the lockdown/stay-at-home order period. However, the other studies listed in Table 1 found that fatal crashes decreased or remained unchanged. Severe crashes and property-damage-only (PDO) crashes decreased in the pandemic period. All the studies reported a significant increase in speeding and speeding-related crashes and behaviors, i.e., harsh accelerations and braking, distracted driving, etc. However, there is a large variation in the reported values. Mobility and traffic volume were reported to be decreased in all the listed studies.
As shown in Table 1, there are few studies that have an overall overview of road-safety trends due to the impact of COVID-19. Another fundamental problem with the aforementioned studies is that most of them analyzed the short-term immediate effects of COVID-19, rather than projecting its true trend. Most of these studies considered a short time range, i.e., during the lockdown and immediately before or after the lockdown, and this produced a large variation in the results and even open contradictions between similar studies. Particularly, there are very few attempts to investigate the change in road-safety trends due to the impact of the global pandemic. This research gap has motivated the authors to conduct this study, with the aim to explore the impacts of COVID-19 on road safety from a long-term perspective using a large data set.
To achieve the objectives, the study will analyze the I-4 freeway data from 2017 to 2020. In addition, the study will investigate basic traffic parameters, i.e., speed and volume, and their changes during the time period. It is frequently reported that, during the COVID-19 period, people became socially disconnected and there was a large increase in drug, alcohol, and distracted driving activities [31]. This study will analyze the effects of such activities on road safety as well. Finally, the study will investigate the effects of these parameters on total crashes and crash severity due to the influence of COVID-19, by developing a negative binomial model and ordinal logistic regression model, respectively.
3. Methodology
This section is divided into three subsections to better explain how the study was conducted. The rationale of selecting the study area is discussed in the first subsection, the data collection process is described in the second subsection, and, finally, the basemap preparation and result analyses techniques are discussed in the third subsection.
3.1. Study Area
The study area used in this research is a portion of the I-4 (Interstate-4) freeway. I-4 generally runs in an east–west direction from Daytona Beach to Tampa, Florida, bisecting Orlando on its way [32]. This study selected part of I-4 that was 76.19 mile long, stretching from the interchange of I-4 and Florida Turnpike interchange on the east side, to the interchange of I-4 and I-275 (Interstate-275) on the west side, where I-4 ends. The rationale for selecting this road was that it is a major corridor connecting major metropolitan areas in Florida with heavy traffic. Since it passes through major population centers and rural areas, it perfectly serves as the research target of this study.

Table 1.
Summary of key findings from the rigorous literature search.
| Reference | Total Crashes | Fatal Crashes | Severe Crashes | PDO Crashes | Vehicle Speed | Traffic Volume/Mobility | Drug, Alcohol, and Distracted-Driving Crashes |
|---|---|---|---|---|---|---|---|
| Lotan and Shinar [5] | −67% | −76% | |||||
| Qureshi et al. [17] | +1.12% | +29.42% | −5.52% | ||||
| Katrakazas et al. [19] | −41% | −8% | −42% | +6% to +11% | −25.86% to −73.96% | Harsh accelerations and braking, +12%; speed violations, +10% to +39% | |
| Saladié, Bustamante and Gutiérrez [22] | −74.3% | −41% | −62.90% | ||||
| Vandoros [23] | −62% | −68% | −48% | −63% | |||
| Barnes et al. [24] | −47% | Unchanged | −46% | −50% | −38% to −50% | −43% | |
| Muley et al. [26] | −37% | −30% | −73% | ||||
| Katrakazas et al. [27] | −49% | +2.27 km/h per 100 km | |||||
| Amberber et al. [28] | −63% | Harsh accelerations, +200%; speed violations, +35% | |||||
| NHTSA [33] | Increased | Over 100 mph, +87%; speeding crashes, +8%; | Citation, +14% | ||||
| NHTSA [34] | At least one drug, +27.36%; two or more drugs +43.75%; | ||||||
| NHTSA [35] | −31% to −35% | ||||||
| NHTSA [36] | Increased | −19% to −29% | |||||
| NHTSA [37] | Increased | Above the speed limit by 20 mph, +45% | |||||
| NHTSA [38] | −2% | −16.60% | |||||
| DeVoe et al. [39] | −45% | −33% | Speeding crash, +35% | −30% to −66% | |||
| Colorado DOT [40] | +6% | +150% | |||||
| Wegman and Katrakazas [41] | −17.3% | −12.70% |
Note: All the values indicate the percentage change in the COVID-19 period compared to the pre-COVID-19 period. + value indicates that a particular variable has increased during the COVID-19 period compared to the pre-COVID-19 period, and vice versa.
3.2. Data Collection
Crash data can provide comprehensive information for crashes, including the number, time, severity (fatal, incapacitating injuries, non-incapacitating injuries, possible injuries and property damage only (PDO)), traffic volume, and speed at the moment of crash occurrence [42]. In this study, the crash data from 2017 to 2020 were collected from Signal Four Analytics (S4A) and State Safety Office Geographic Information System (SSOGIS). These two data sources were used to ensure the most accurate and complete crash information. Crash information was matched within these two data sources to ensure completeness. After collecting raw data and initial screening of the crash information from these two data sources by cleaning repeated observations, 10,503 crashes were finally considered for the analyses.
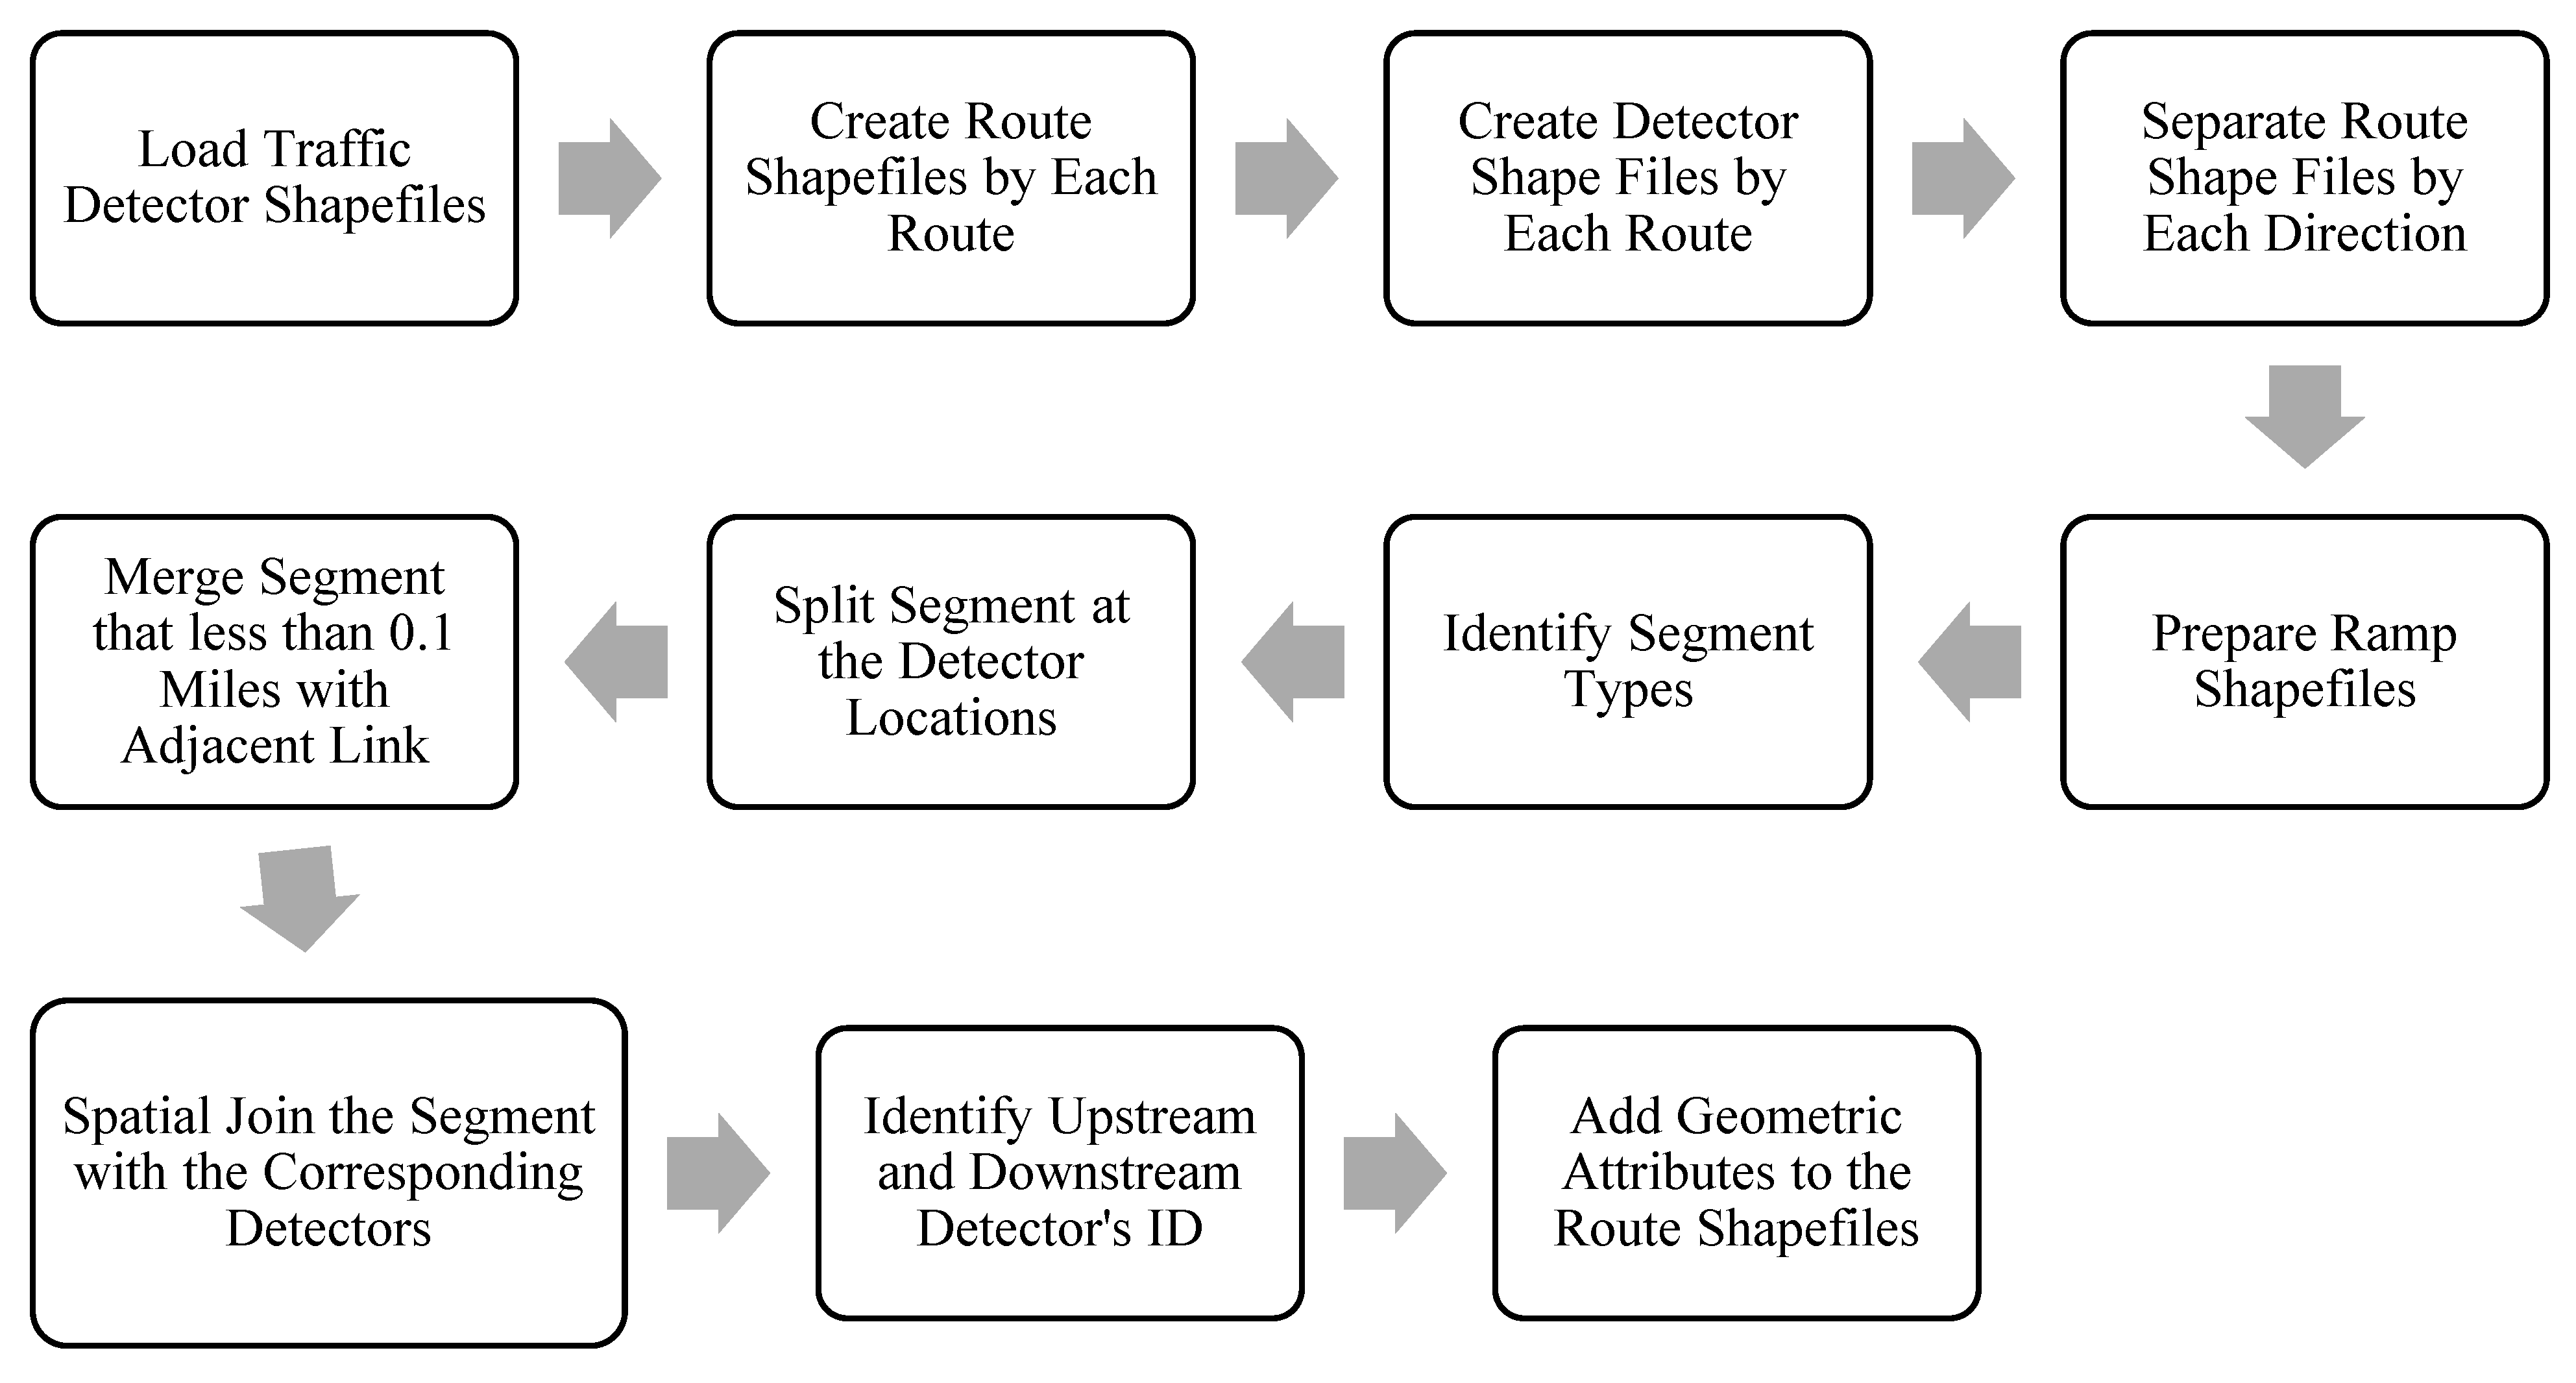
3.3. Basemap Preparation
Basemap was prepared to locate the crash in a particular segment of the I-4. The segments were determined based on the detector location. Steps for preparing the basemap are shown in Figure 1. On average, the length of road segments is 0.34 miles.
3.4. Real-Time Traffic Parameters Extraction
After preparing the basemap, real-time-speed and volume data were extracted from the detector information. There are around 315 and 310 Microwave Vehicle Detection Systems (MVDS) on the east and west I-4 road, respectively, and they provide traffic parameters every 30 s. For each crash, traffic data of 5 min prior to the crash from upstream and downstream Microwave Vehicle Detection System (MVDS) detectors closest to the crash location were collected, aggregated, and, finally, the average value per minute was used in this study [43]. Python was used to extract the aforementioned information. The purpose of using traffic parameters aggregated into 5 min was to minimize the effects of the crash-time-reporting error as well as to represent the traffic-state condition more accurately during the time of crash occurrence.
3.5. Crash Modeling
As from the literature it is evident that there is ambiguity about the effects of COVID-19 on different levels of crash severity, this study investigated such effects by incorporating the negative binomial model for total crashes and the ordinal logistic regression model for different crash-severity levels. The rationale for selecting the negative binomial model to investigate the effects of COVID-19 along with real-time-traffic parameters, i.e., speed and volume, the influence of drugs and alcohol, and distracted driving activities, is that, since over-dispersion is a common phenomenon in crash-data analyses, negative binomial regression is one of the most appropriate and recommended techniques for total-crash modeling [44]. In addition, this method is widely used in the literature to predict crash frequencies [45]. On the other hand, the ordinal logistic regression model is very popular to formulate crash-severity model since there are different levels of crash severities and the severity data are ordinal and categorical [46,47]. In addition, the ordered logistic regression model can capture the qualitative differences between different severity categories [48]. To perform the negative binomial model and the ordinal logistic regression model, we used the Stata statistical software (version 15). After obtaining all the variables required to fulfill the objective of this study, extensive analyses were performed, which are described in the next section.
4. Data Analyses and Results
This study used 2017 to 2020 data, where 2017 to 2019 data was considered as the pre-COVID-19 stage and 2020 data as the during-COVID-19 stage. This section is divided into different subsections to show the changes in, and impacts of, different variables, i.e., volume, speed, total crashes and crash severities, drugs, alcohol and distracted driving, and, eventually, an attempt to investigate the trend of road-safety patterns due to the impact of COVID-19 was made through statistical modeling.
4.1. Volume
From the analyses of the real-time-traffic volume data during the crash occurrence, it was found that volume per minute at the location of the crash during a particular crash occurring ranged from 1 to 434, with a mean of 44 for the pre-COVID-19 period. Whereas, during the COVID-19 period, this range varied from 1 to 103 with a mean of 38. Average traffic volume during a particular crash occurrence was down by 13.64% during the COVID-19 period (year 2020) compared to the pre-COVID-19 period (year 2017 to 2019).
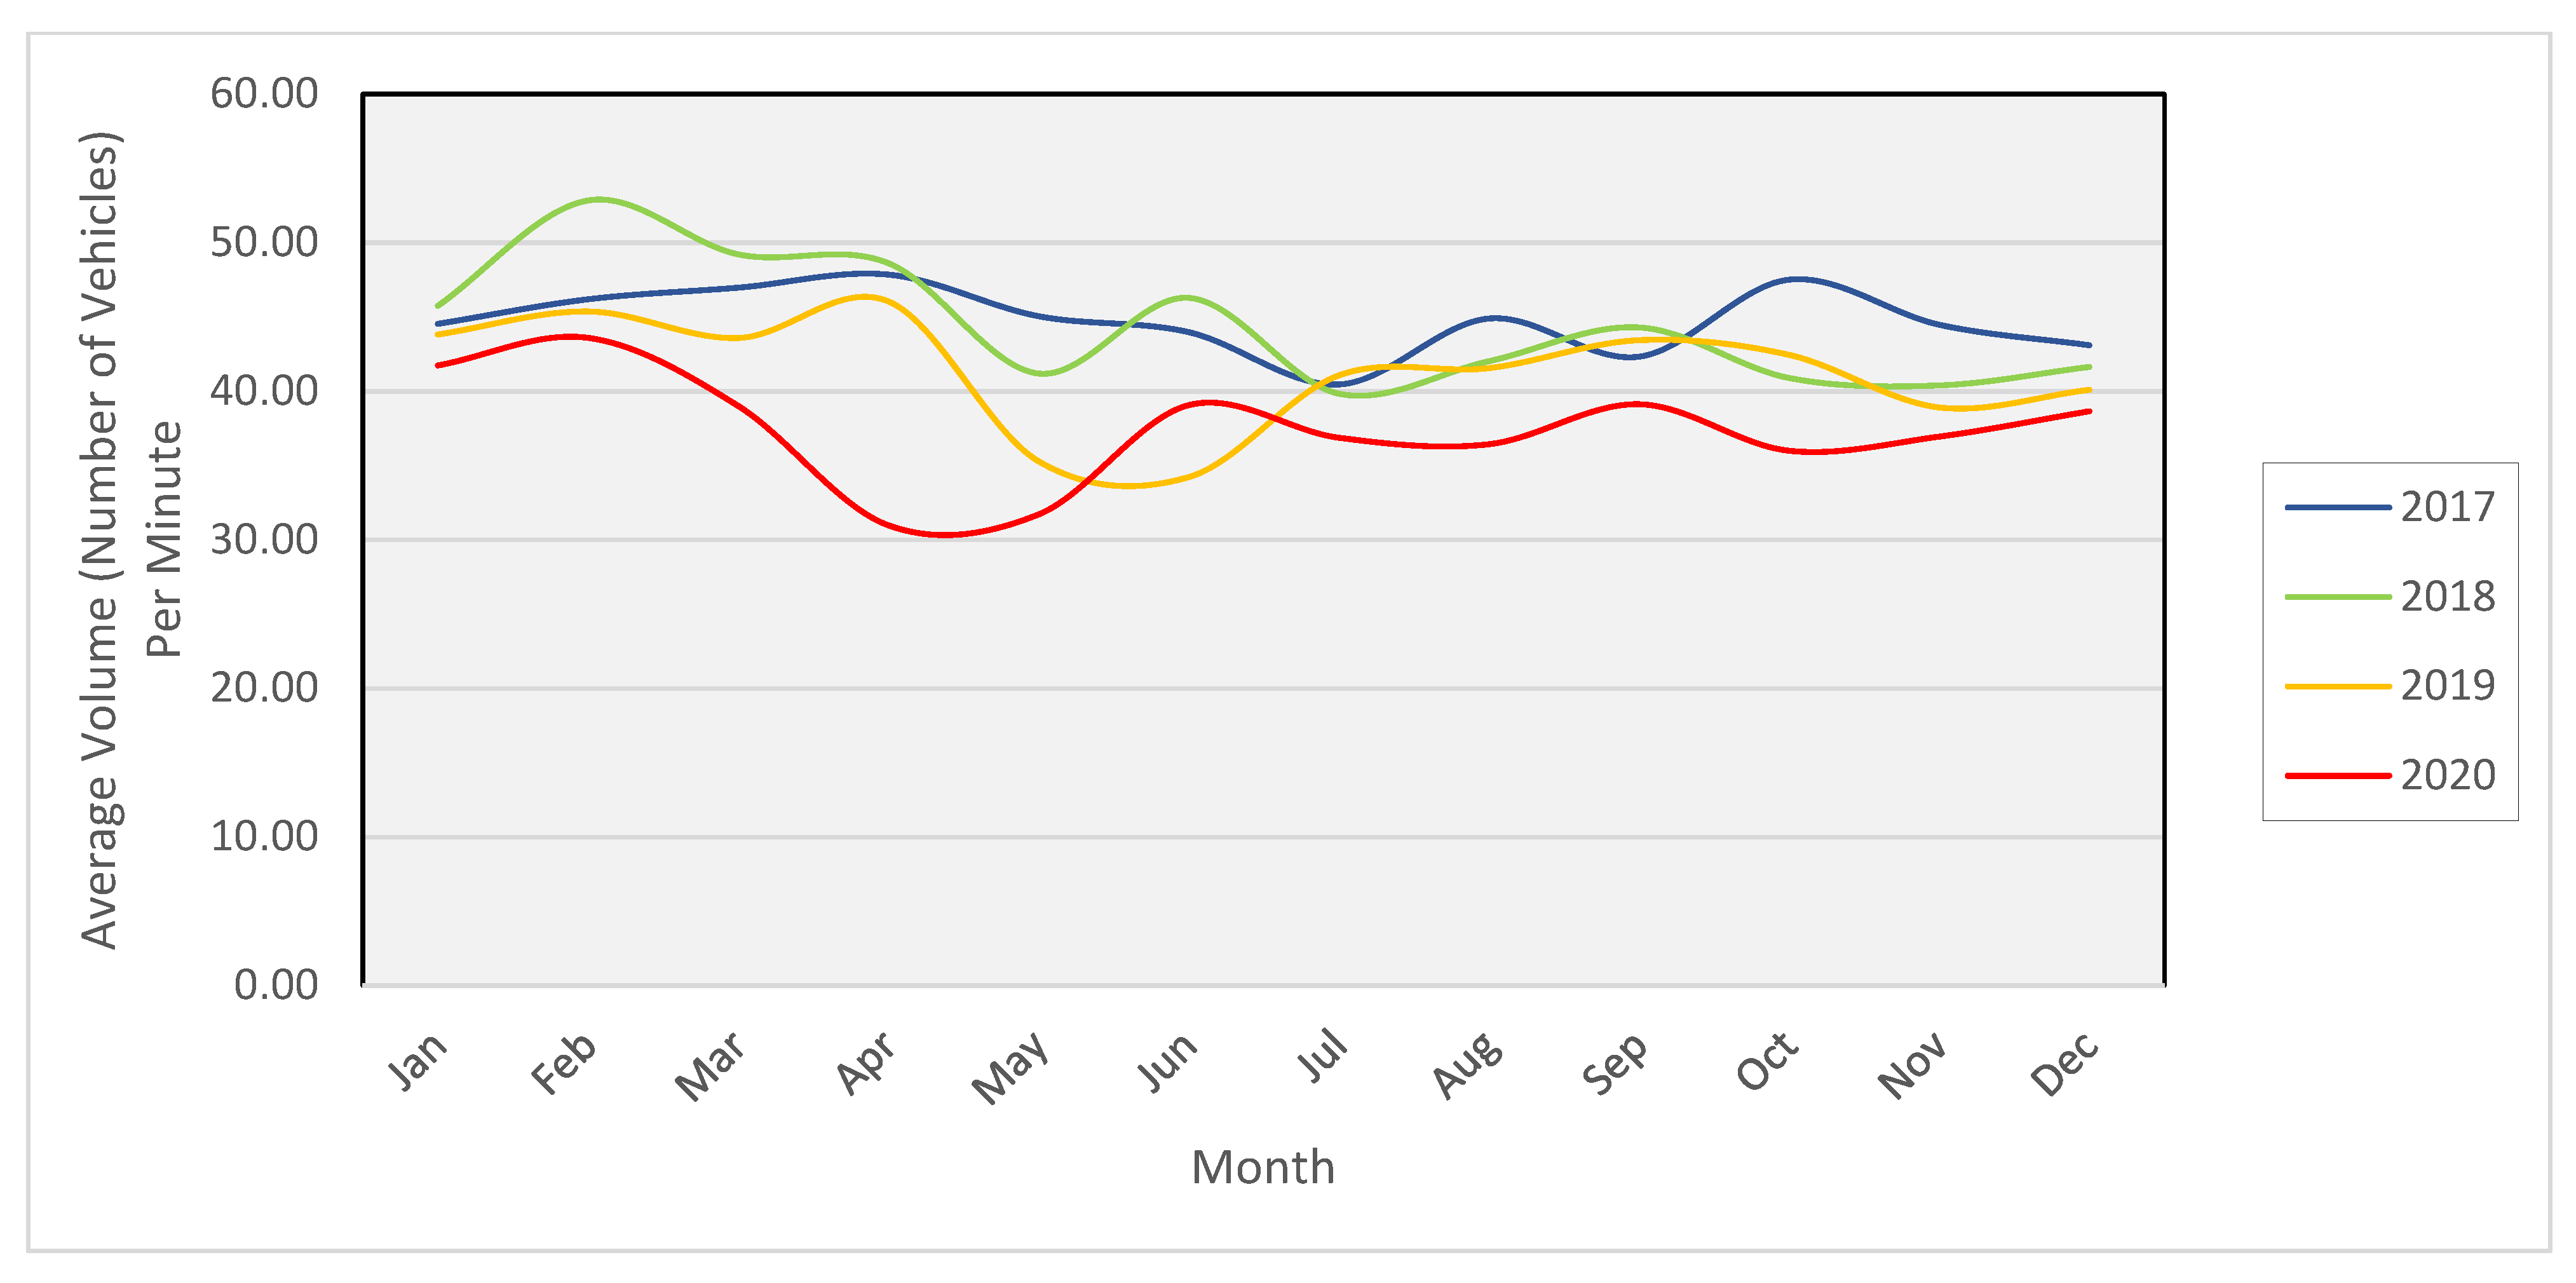
Figure 2 shows the monthly variation in volume from 2017 to 2020. In 2020, traffic volume was reasonably lower due to the stay-home order. In particular, in Florida, the stay-at-home order was issued on 20 March 2020 and the lockdown spanned between 3 April and 30 April, when the stay-at-home order was lifted [49]. However, in May to July 2019, there was another sharp decrease in traffic volume, with values even lower than the ones in the same period of 2020, soon after COVID-19 mobility restrictions were levied.
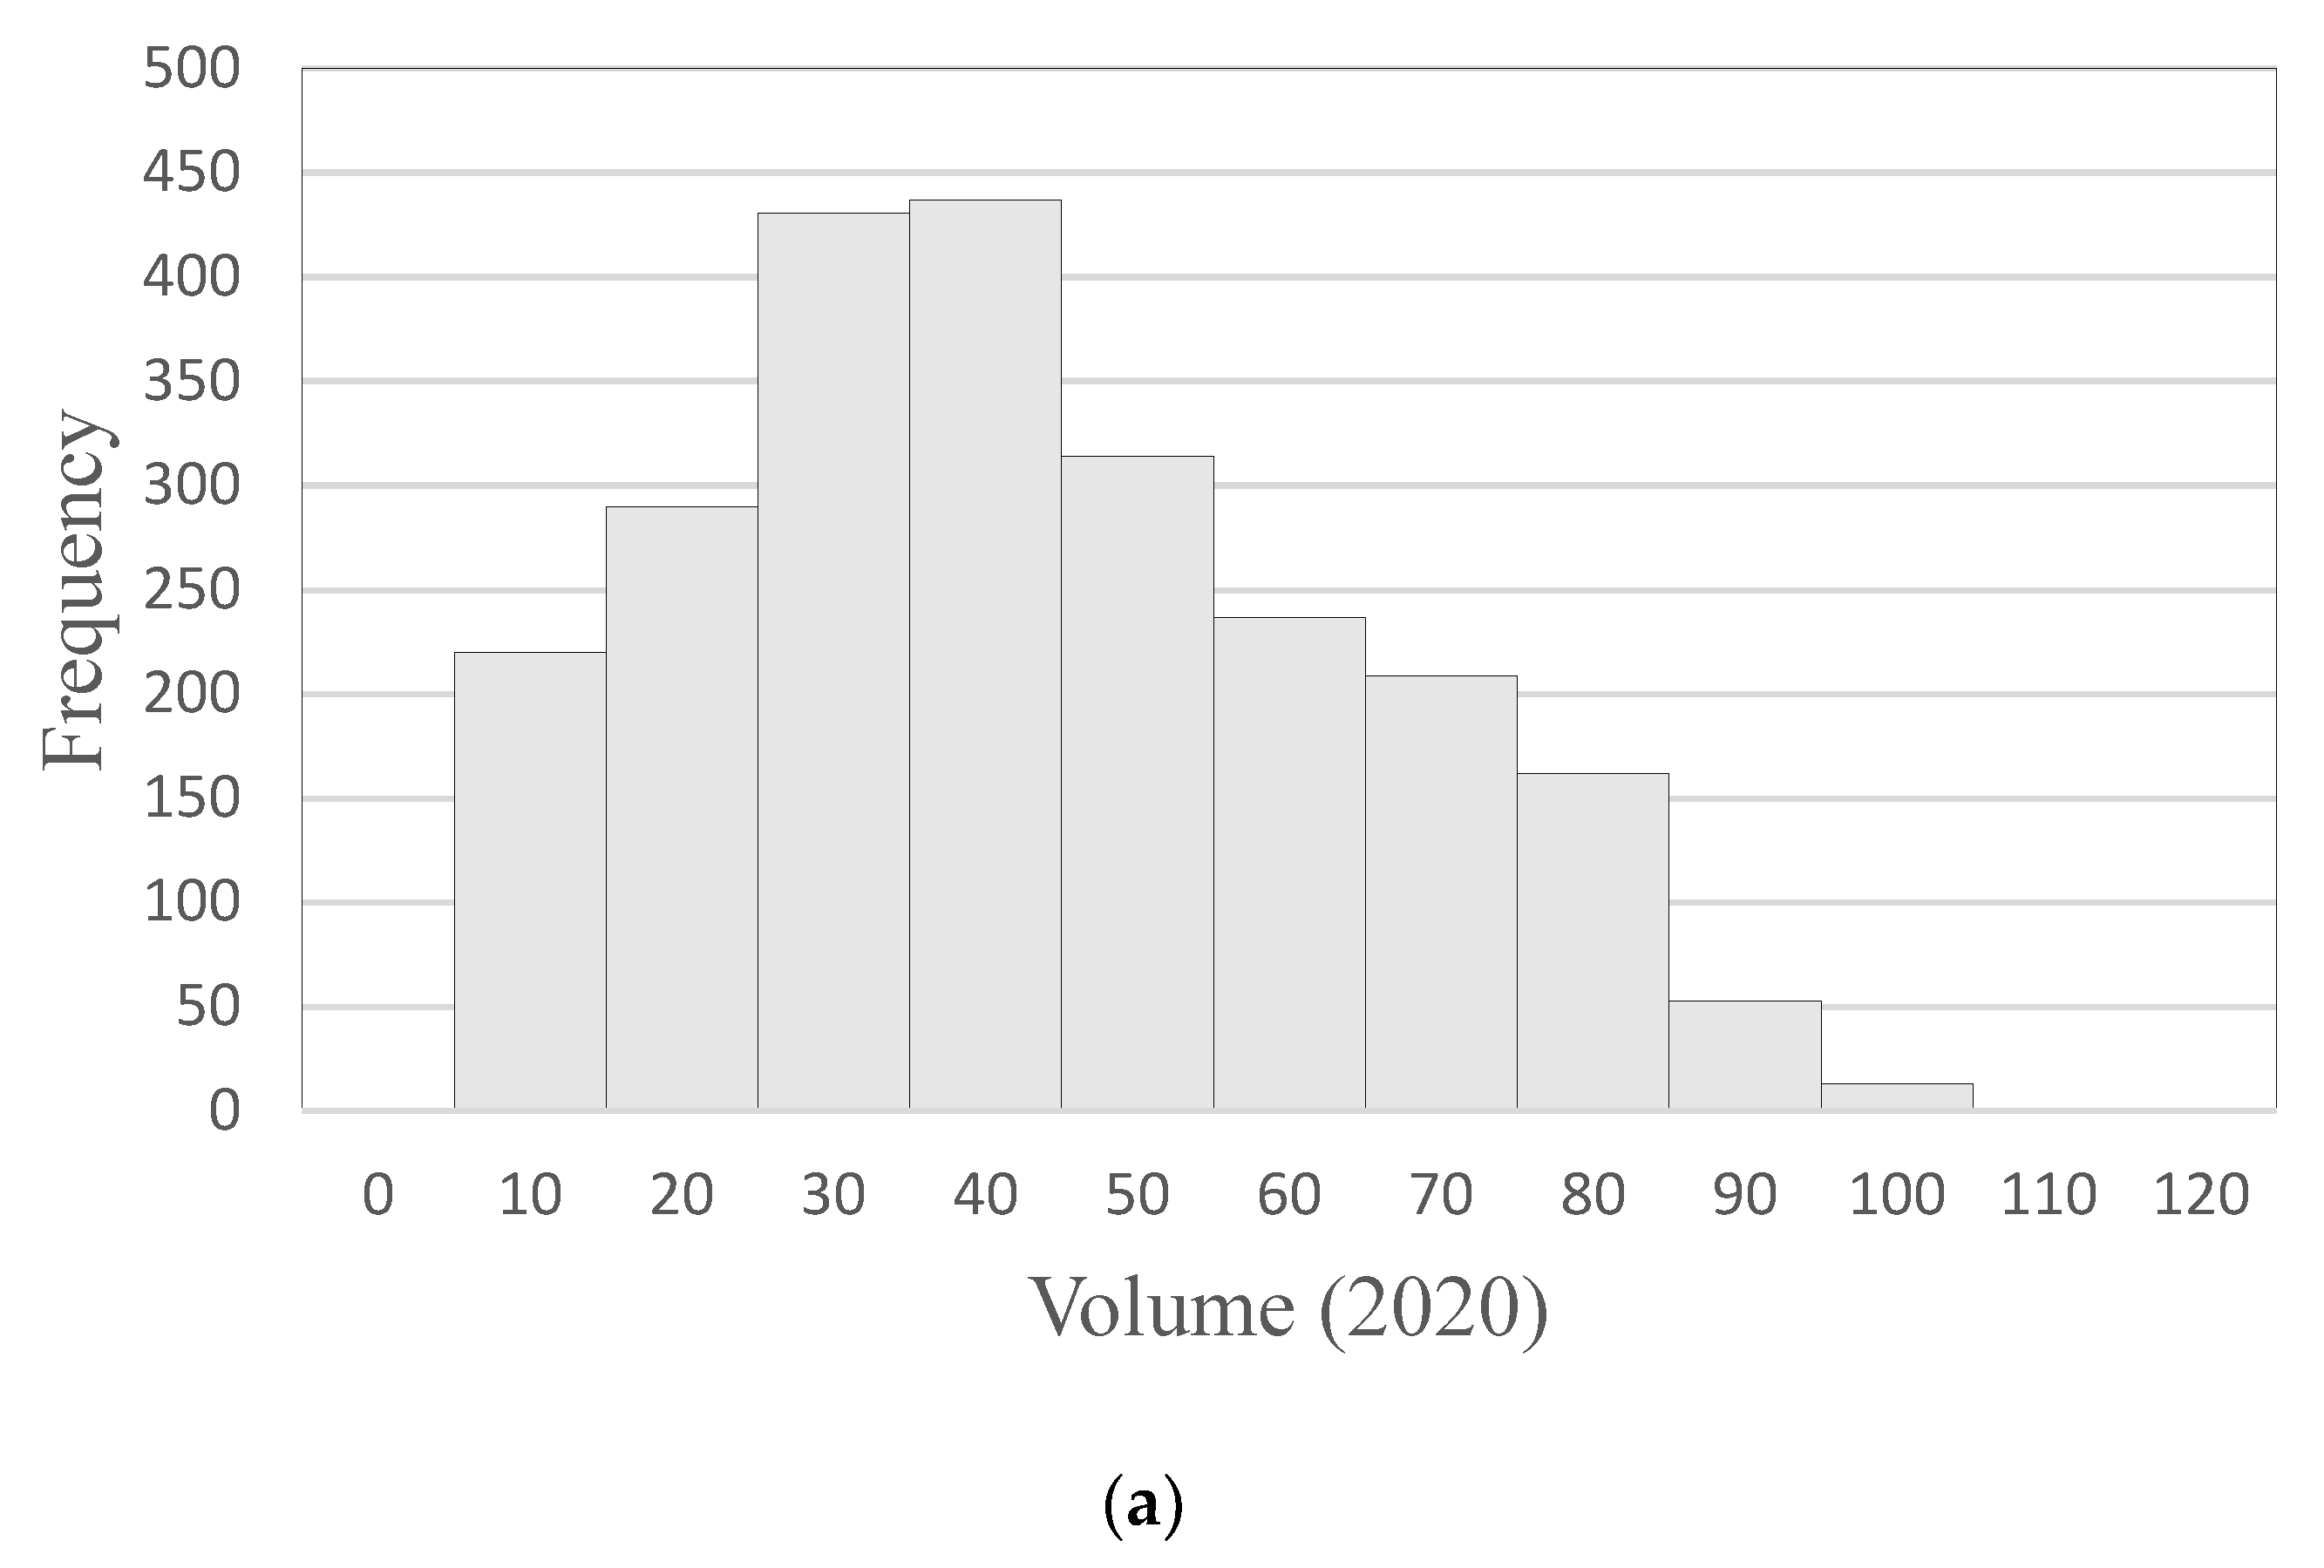
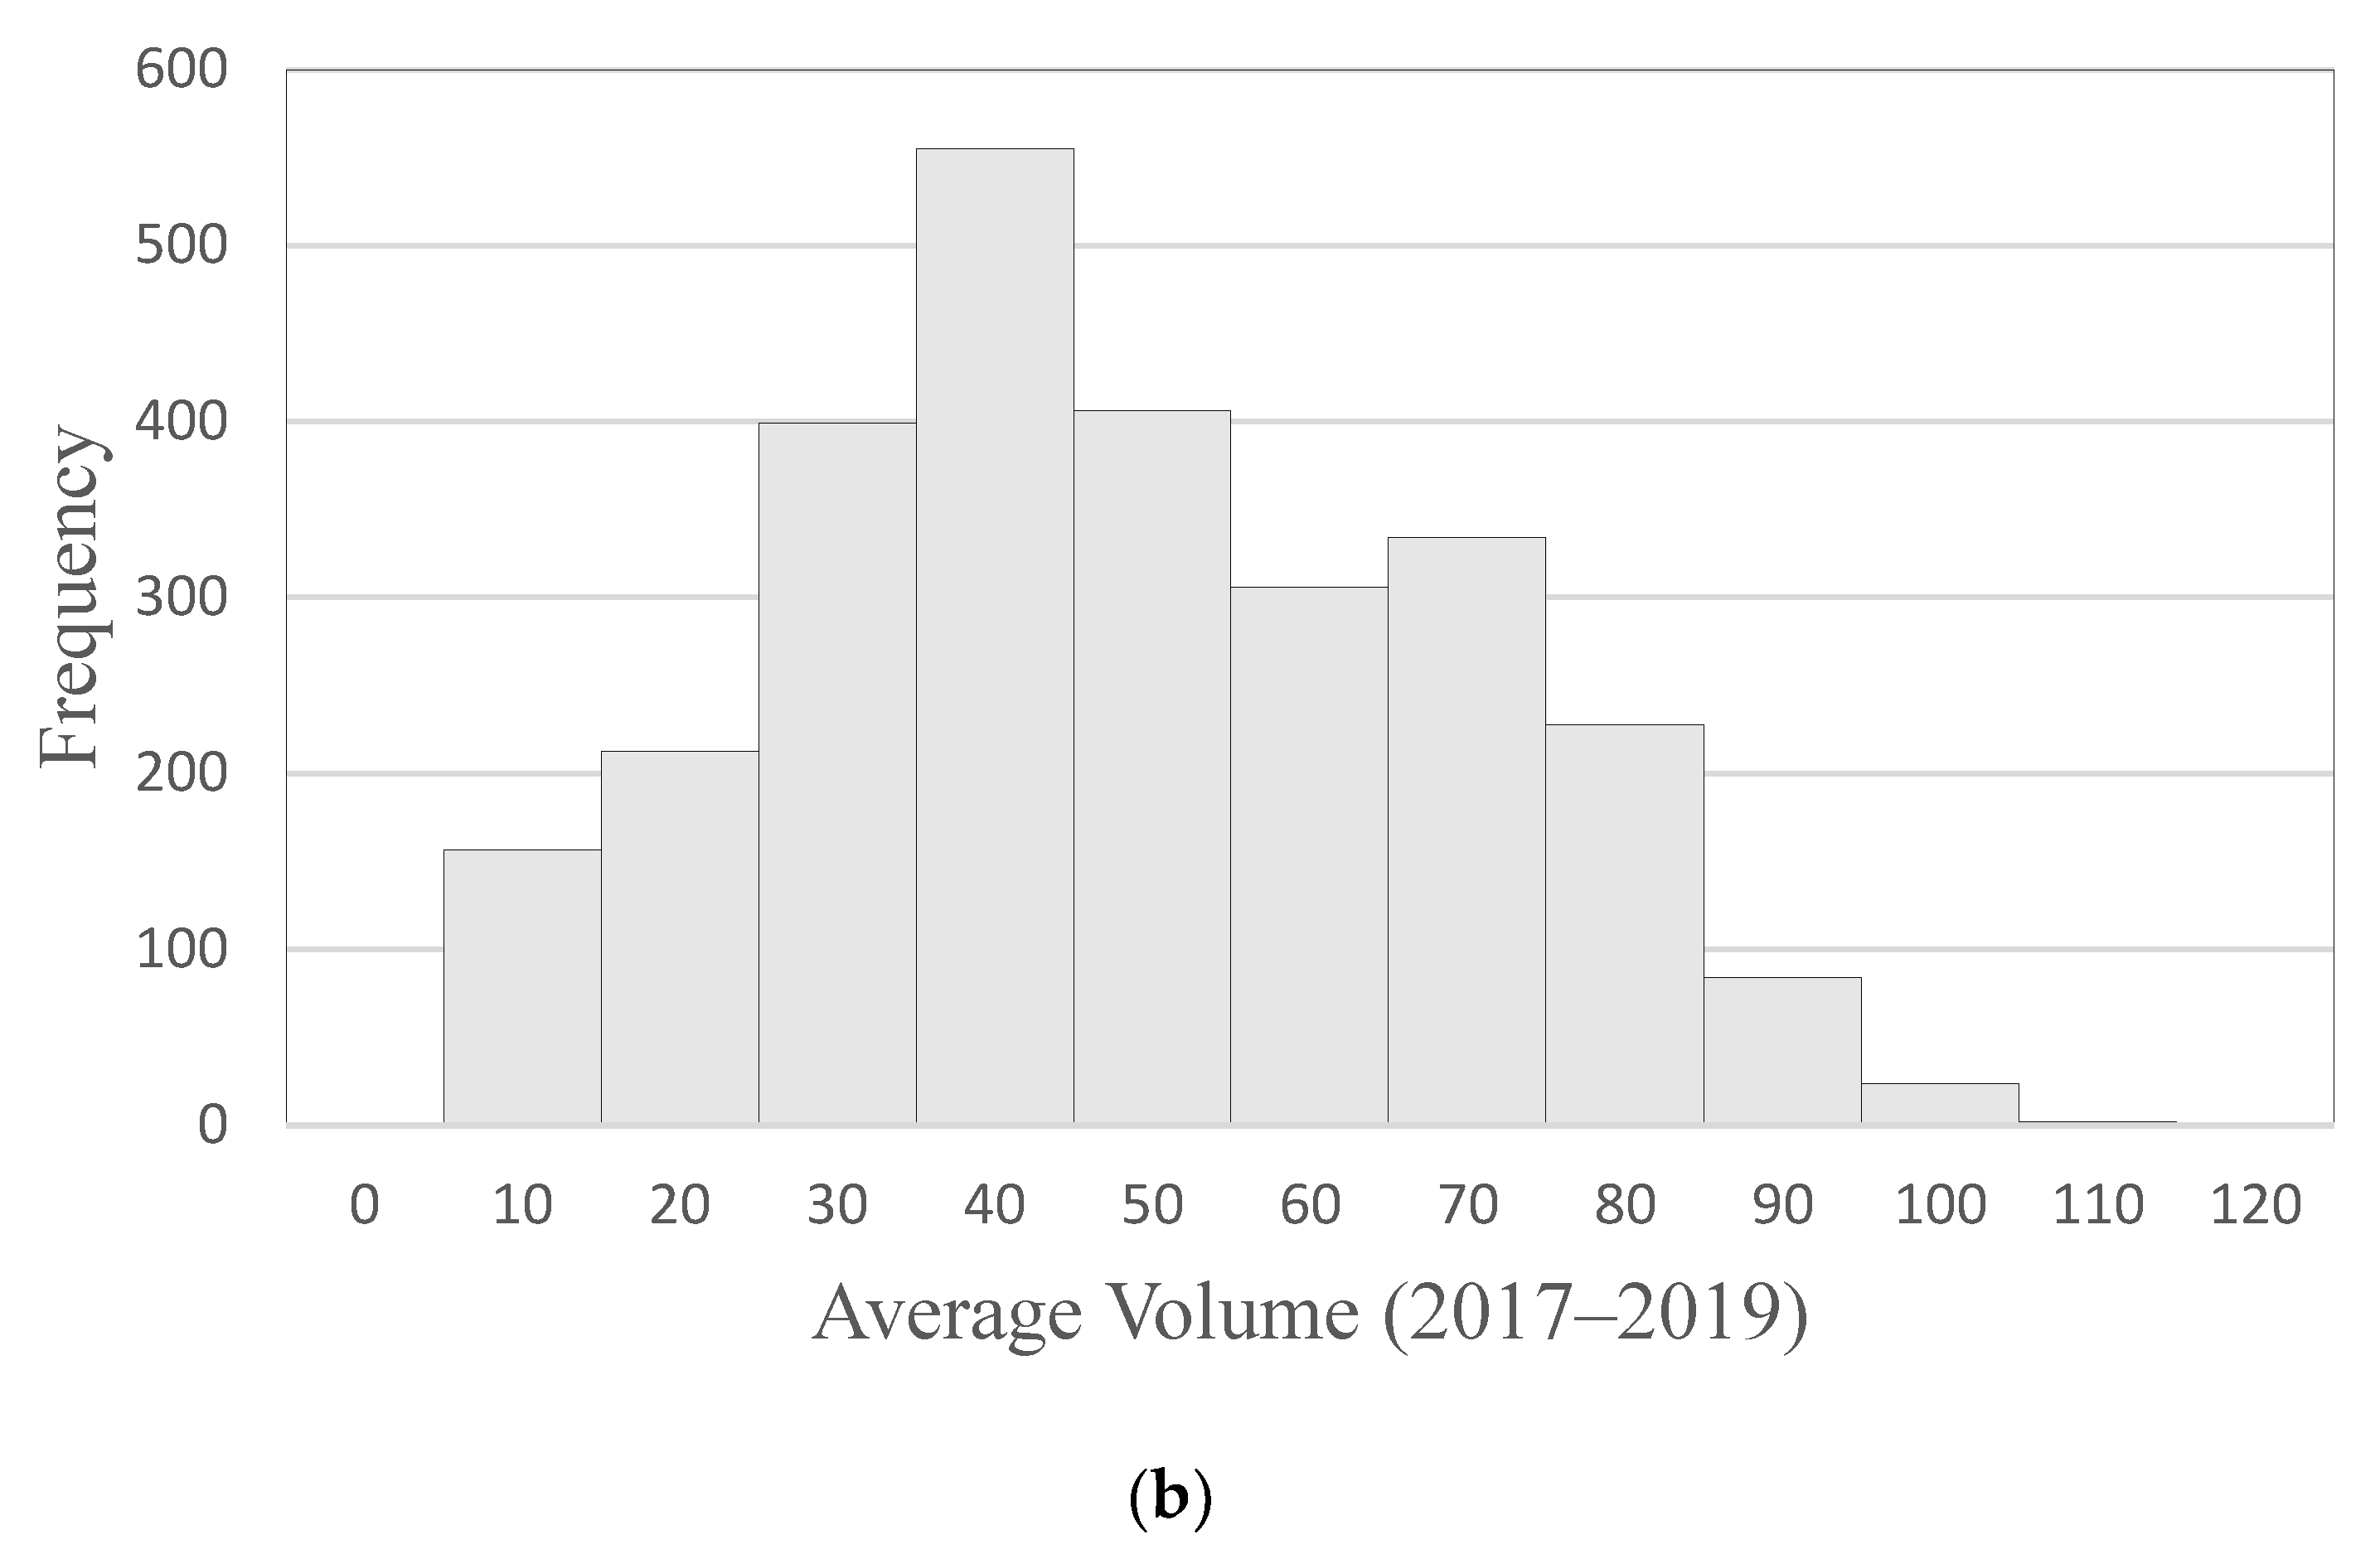
To better apprehend the volume statistics, the volume-frequency distribution is shown in Figure 3. Frequency distribution for the year 2020 was calculated by dividing the traffic volume per minute at the location of the crash during a particular crash occurrence into certain ranges, i.e., 0 to less than 10, 10 to less than 20, and so on, and then summing the total number of crashes in those particular ranges to obtain the overall frequency for the year 2020. Frequency distribution for the year of 2017–2019 was calculated by dividing the traffic volume per minute at the location of the crash during a particular crash occurrence into certain ranges, i.e., 0 to less than 10, 10 to less than 20, and so on, and then averaging the total number of crashes with respect to the number of years in those ranges to obtain the overall frequency for the year 2017–2019. Comparing parts (a) and (b) of Figure 3, it is evident that, despite the changes in traffic volume, crashes were most frequent in a particular range, and this was around 30 to 50, in both pre-COVID-19 and during-COVID-19 periods. In addition, there was a decreasing trend in the number of crash occurrences with the increase of volume. This implies that, as the number of vehicles increased in a roadway section, the probability of a crash decreased for that section.
4.2. Speed
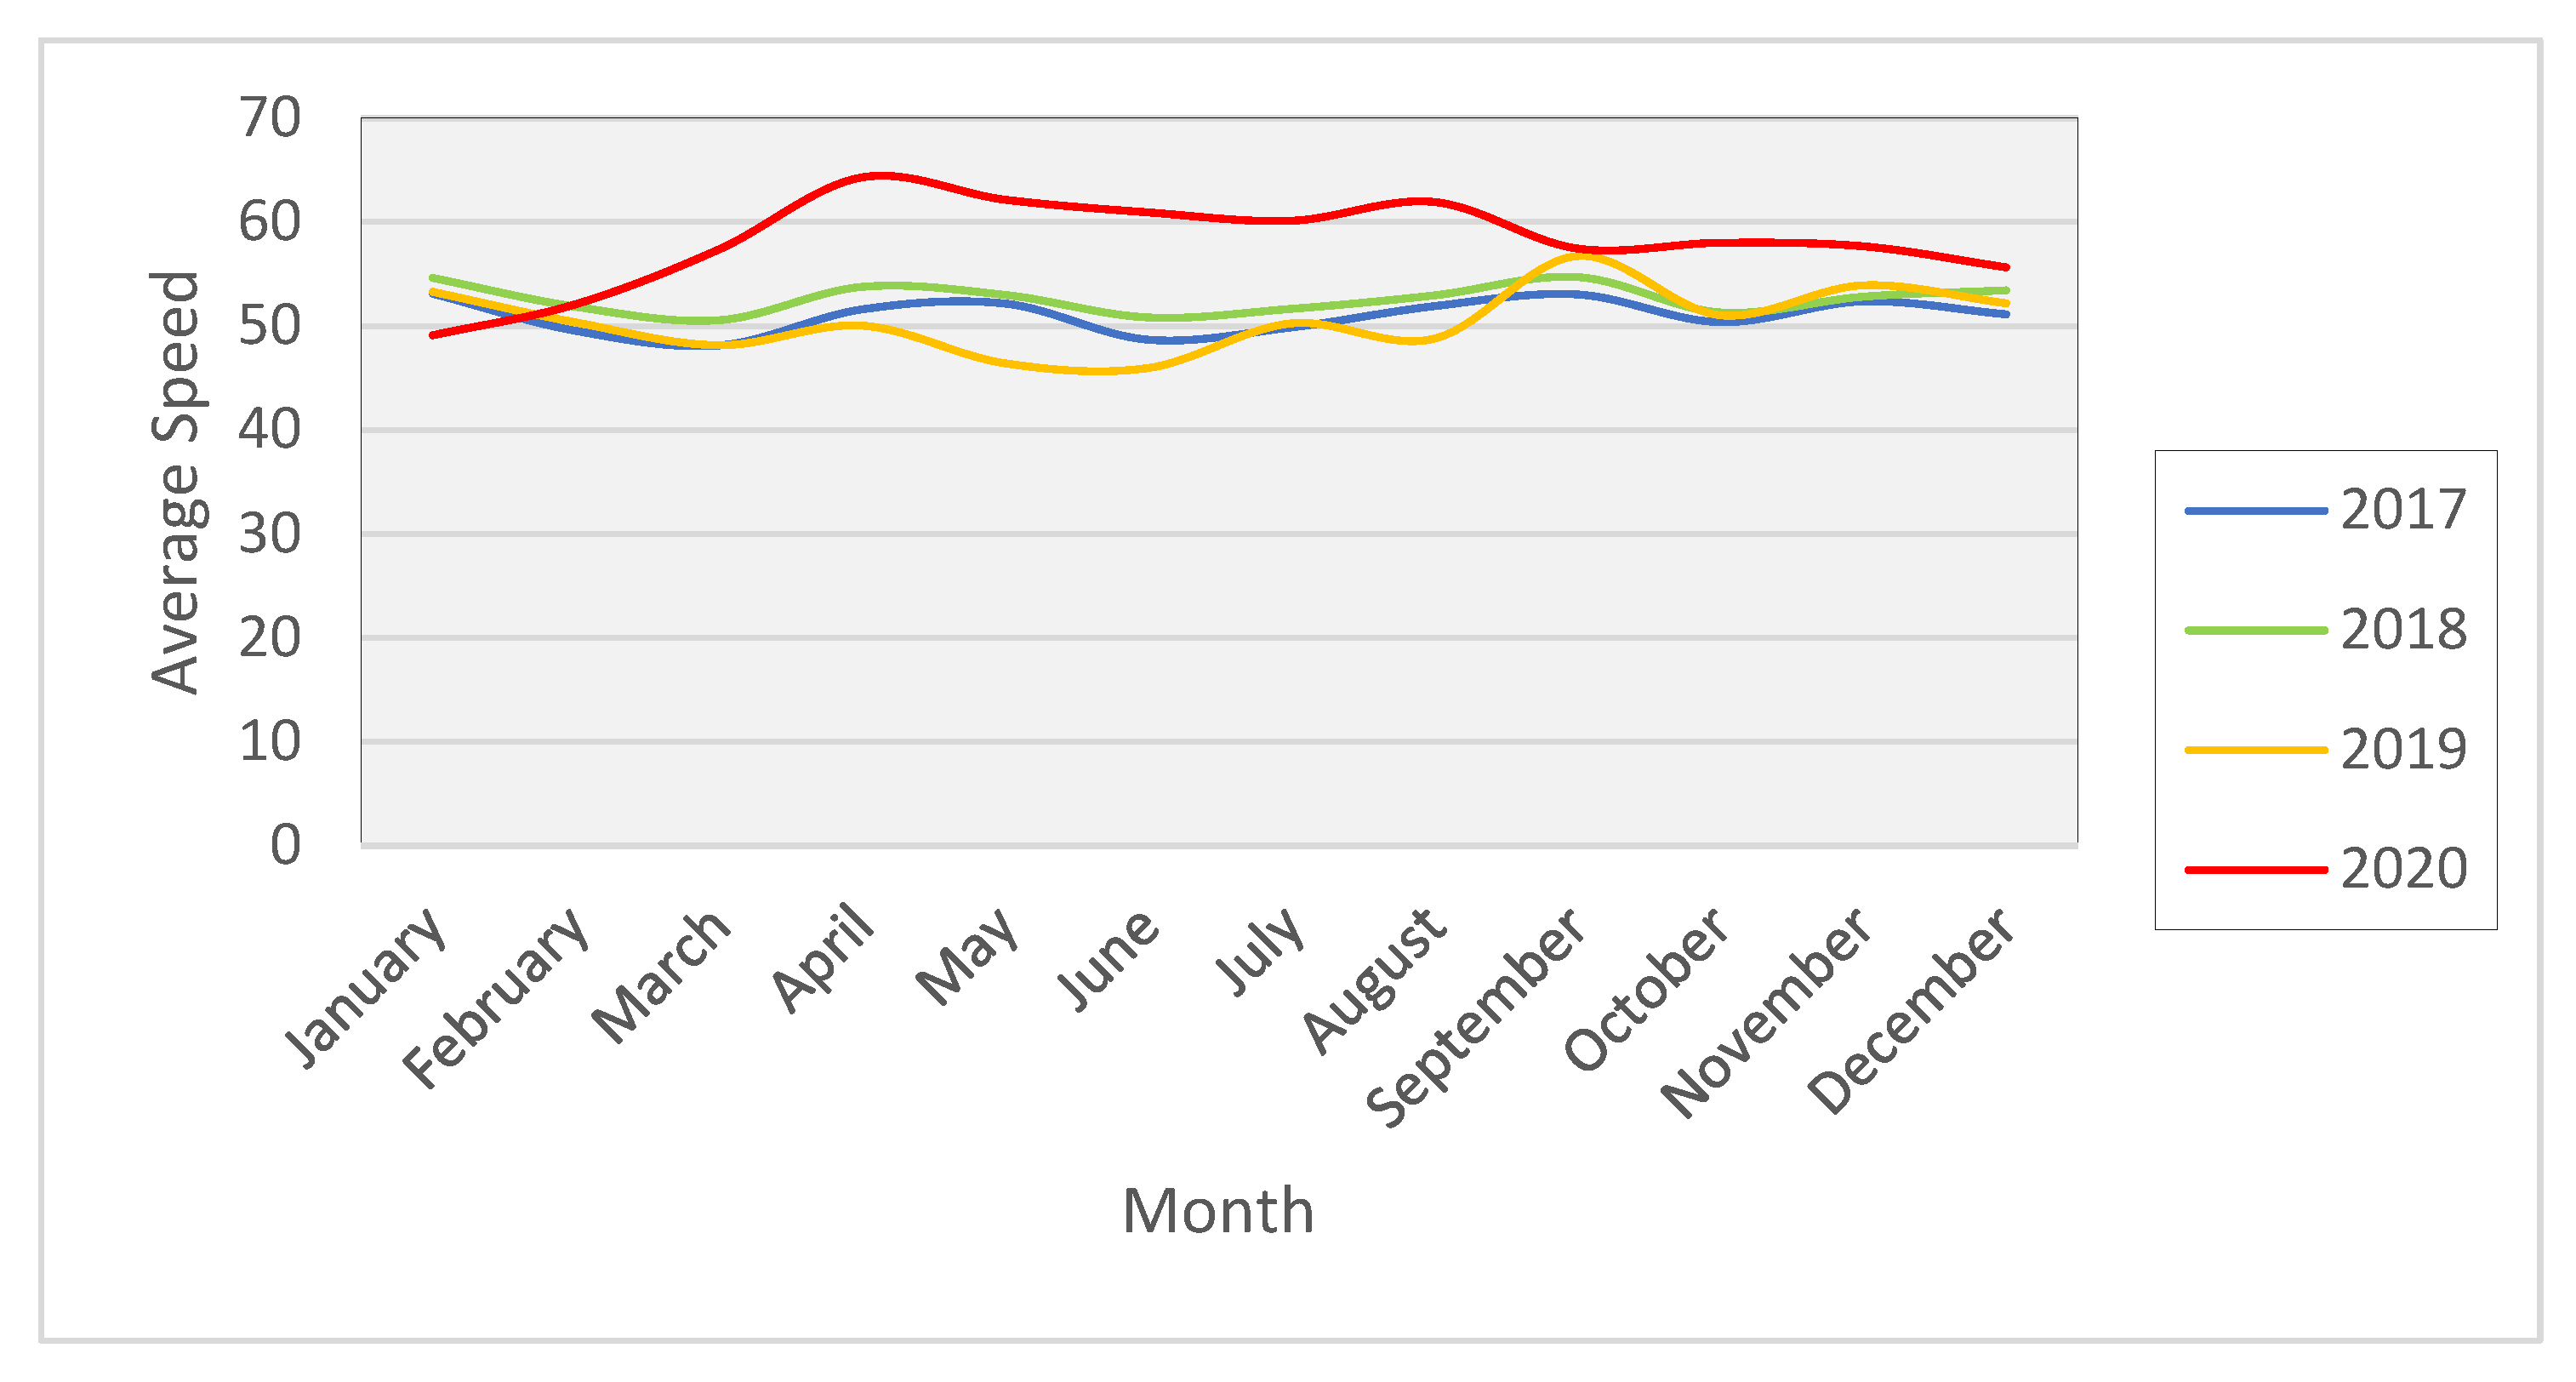
Five minutes’ average aggregated speed at the crash location in the direction of crash prior to the crash occurrence was analyzed in this study to investigate the speed trend. The maximum and minimum speeds for crashes from 2017 to 2019 were 0 and 118 mph, respectively, with a mean of 51.42 mph (variance (standard deviation of 17.92 mph)). Whereas, in the year 2020, this range varied from 0 to 108 mph with a mean of 57.23 mph (variance (standard deviation of 18.97 mph)). Compared to the 2017–2019 speed average, in the year 2020, the speed of vehicles during crashes increased by 11.3%, and z-test results showed that this difference was significant. Figure 4 shows the monthly variation in the speed of vehicles when a crash occurred. Initially, the speed in 2020 was low compared to the other years’ data; however, after February 2020, vehicles encountered crashes with higher speed compared to the vehicles’ average speed from the year 2017 to 2019.
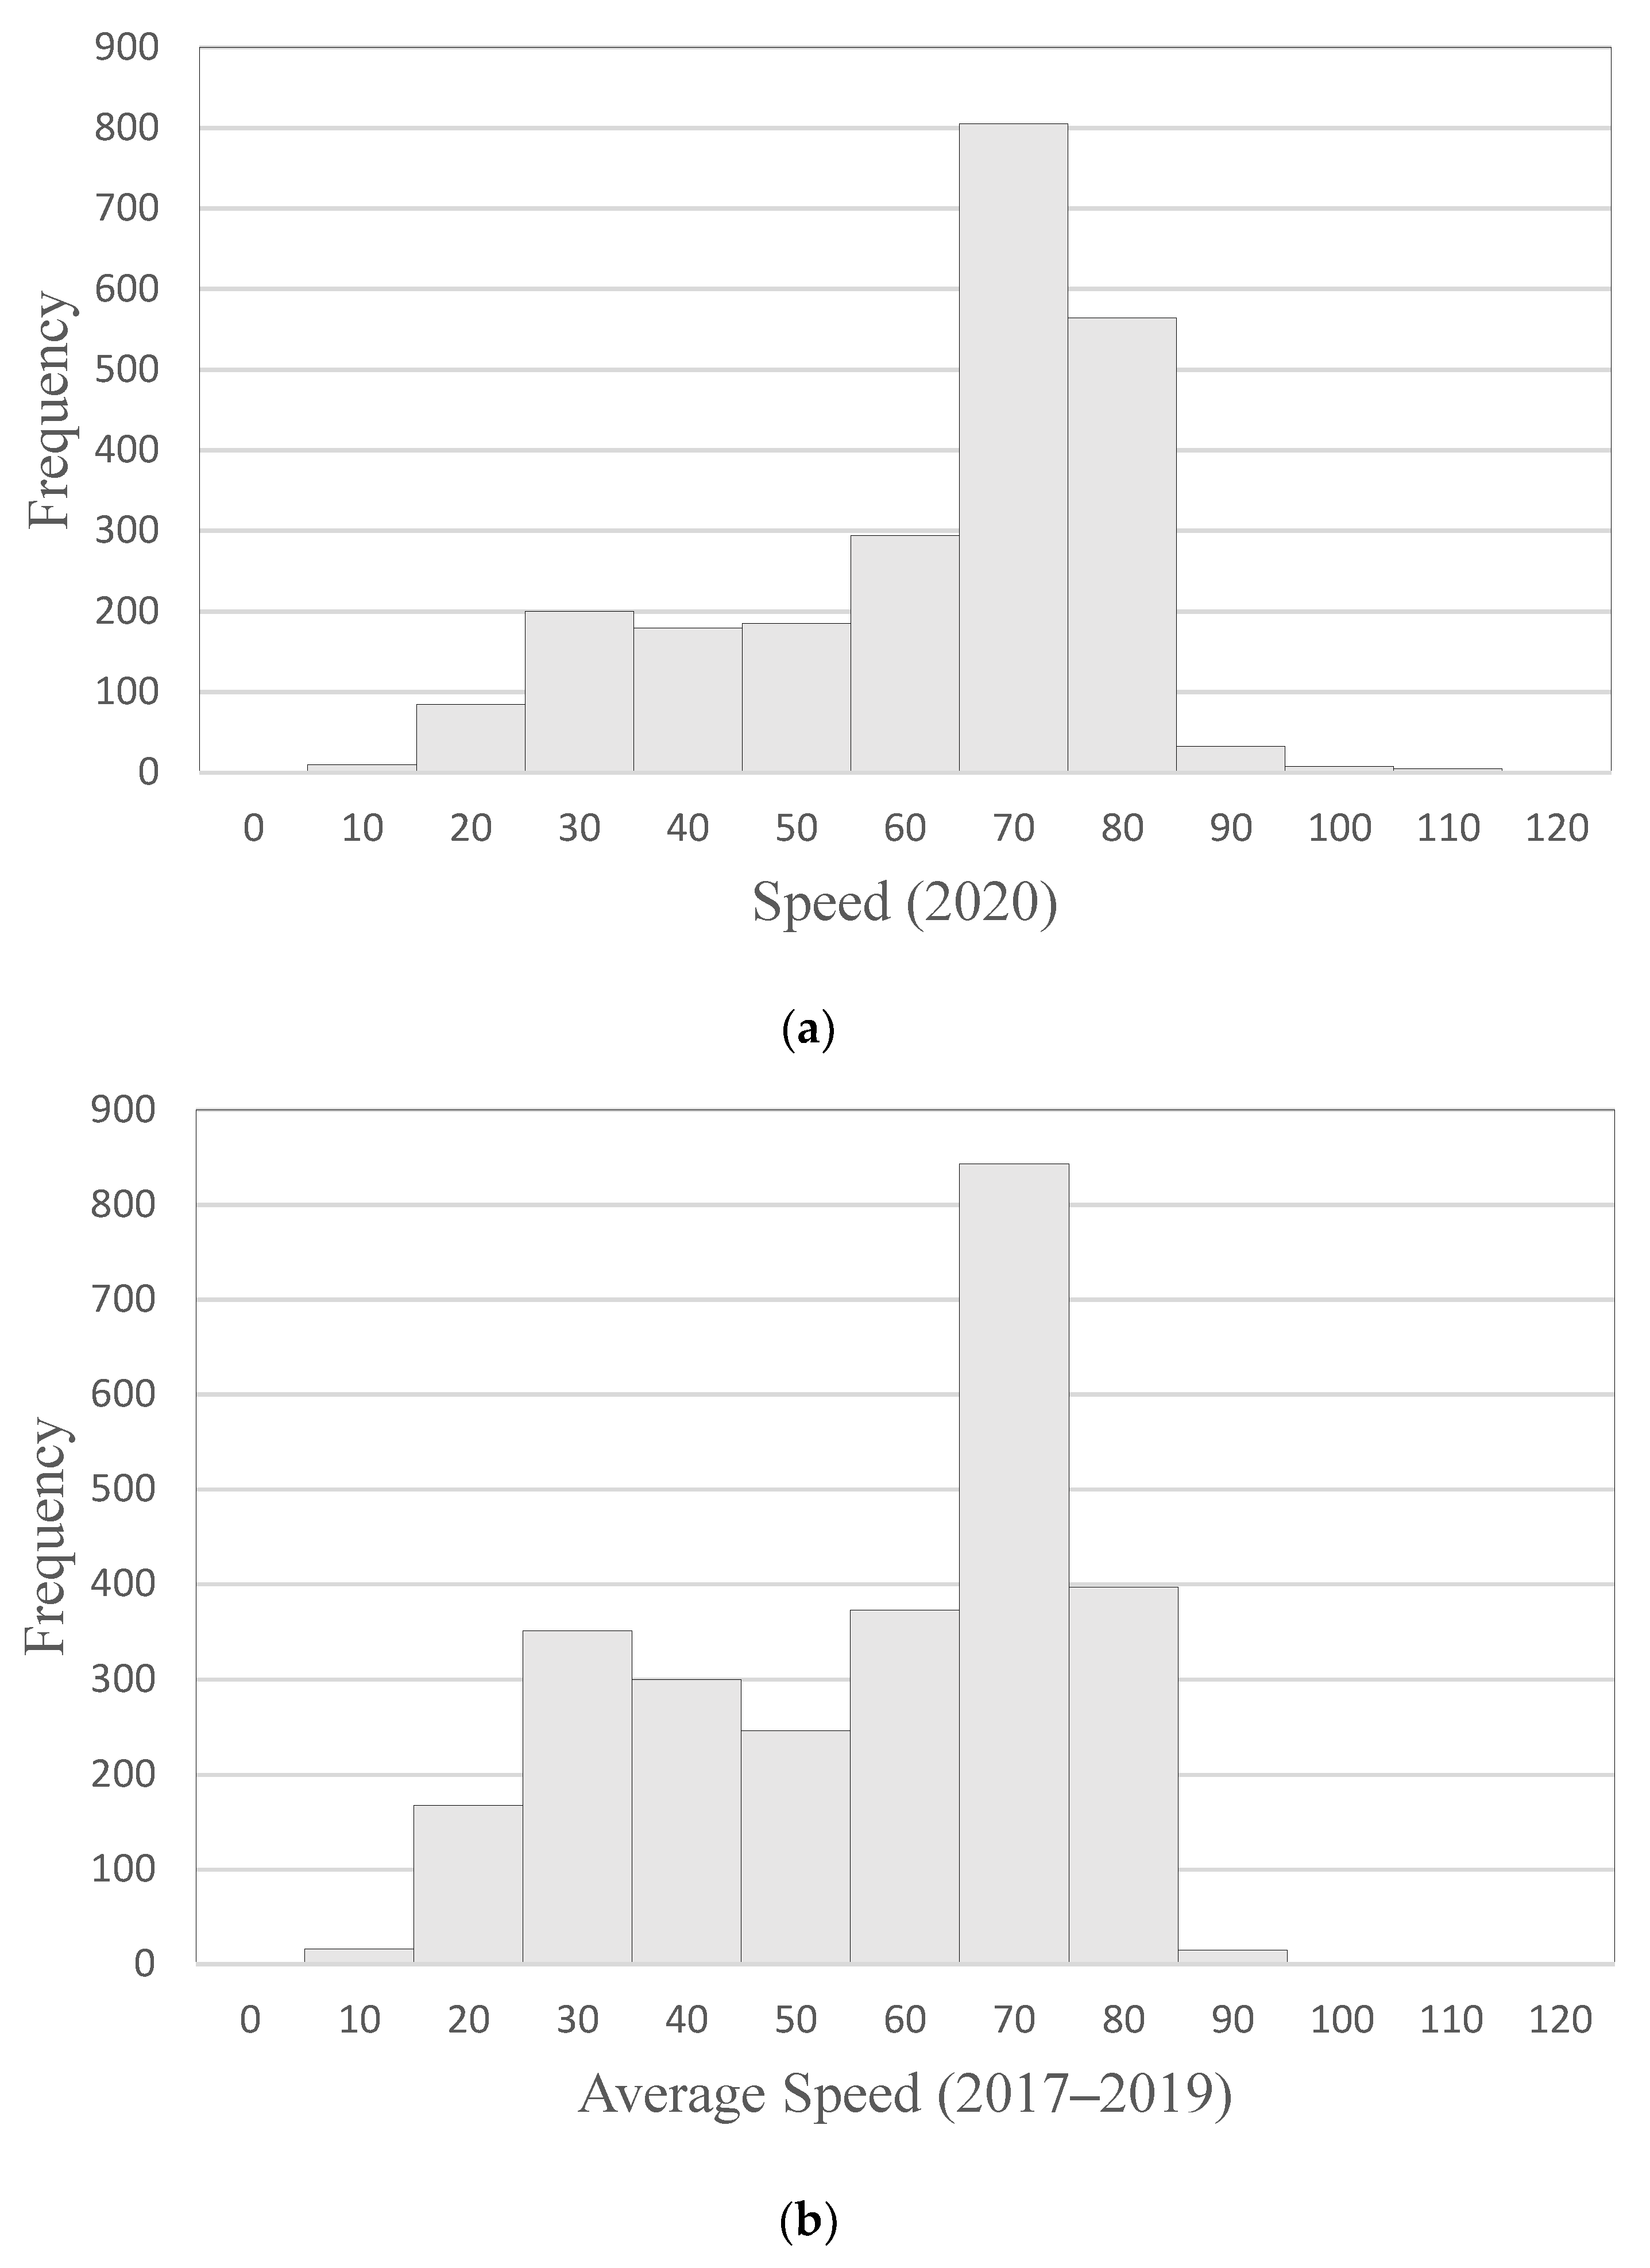
Frequency distribution of the 5 min average speed at the crash location in the direction of crash prior to the crash occurrences is shown in Figure 5. Most of the crashes occurred on the I-4 have a speed range between 60 mph and 80 mph. The posted speed limit was 65 mph. This implies that most of the vehicles ran at a slightly higher speed than the posted speed limit. However, in 2020, some vehicles showed a significantly higher speed than usual. On the other hand, the number of crashes that occurred at a lower speed (0 to 65 mph) than the posted speed limit was higher in 2017 to 2019 than in 2020, which also implies that vehicles were running at a higher speed during the COVID-19 time than the pre-COVID-19 time. This can be explained from the fundamental diagram [50,51]. According to the fundamental diagram of traffic flow, when the volume drops, speed increases.
4.3. Total Crashes and Crash Severities
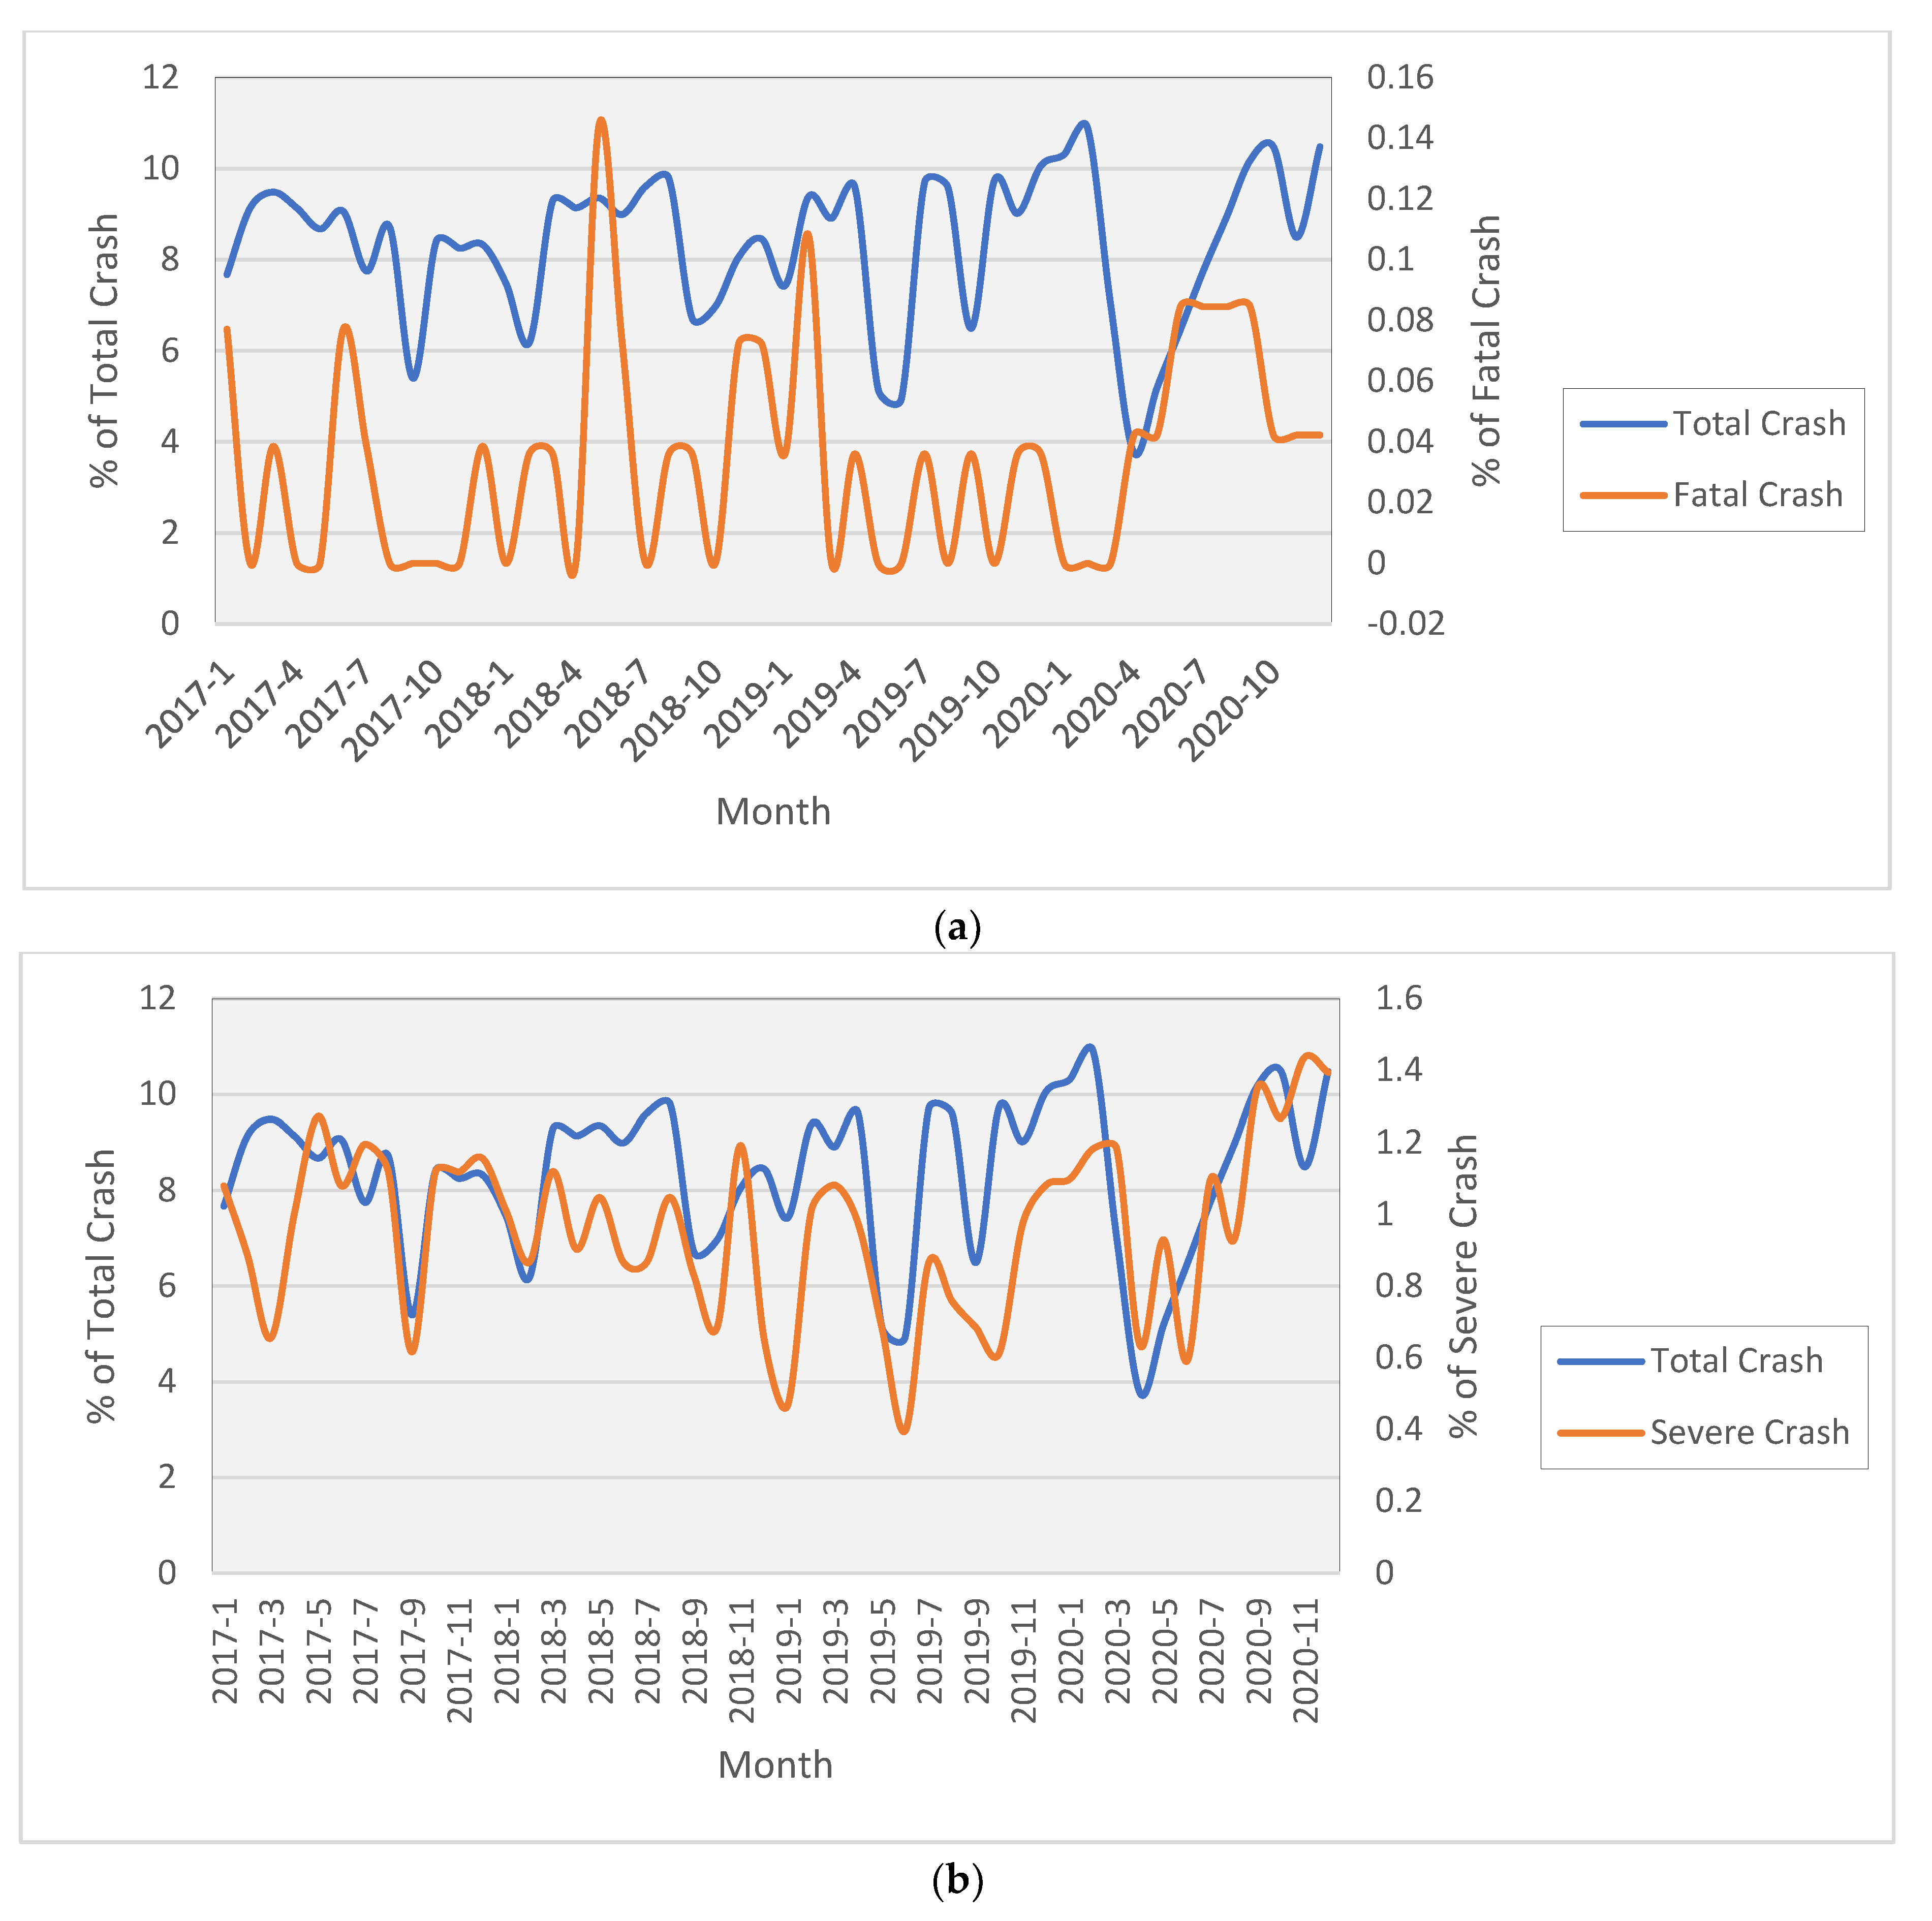
In this analysis, we followed the KABCO crash-severity scale, where K refers to a fatal crash, A refers to incapacitating injury, B refers to a non-incapacitating injury, C refers to a possible injury and O refers to property damage only. Total crashes are defined as the ‘All crash types in KABCO’, and severe crashes are defined as the ‘All crash types (KAB severities)’ [42]. To capture this effect, monthly variation in the percentages of total crashes vs. fatal crashes and severe crashes are shown in Figure 6.
Percentages of total crashes for a particular month were calculated by dividing the total number of crashes of all KABCO severities of that particular month by the total number of crashes of all KABCO severities of that particular year. Similarly, percentages of fatal crashes for a particular month were calculated by dividing the number of fatal crashes (K) of that particular month by the total number of crashes of all KABCO severities of that particular year. In addition, percentages of severe crashes for a particular month were calculated by dividing the number of severe crashes (KAB) of that particular month by the total number of crashes of all KABCO severities of that particular year. Figure 6a shows that, from the beginning of 2020, the number of total crashes was decreasing, and it reached the lowest point around April 2020, then again it returned to the initial stage. On the other hand, the number of fatal crashes started to rise from February 2020 and reached the peak around August 2020. However, the number of total crashes was continuously fluctuating, and it showed several nadir points, particularly around October 2017 and June 2019, where there was no such impact of COVID-19 or any other observable events in the studied area to change the outcomes. For the case of fatal crashes, the highest peak was observed during July 2018, and, interestingly, there was no drop in the total crashes at that time period. The peak obtained in January 2019 was higher than the peak obtained during the COVID-19 period. Again, from Figure 6b, it is evident that, from January 2020 to May 2020, severe crashes were decreasing with the total crashes, and again, after that period, it was increasing with the total crashes.
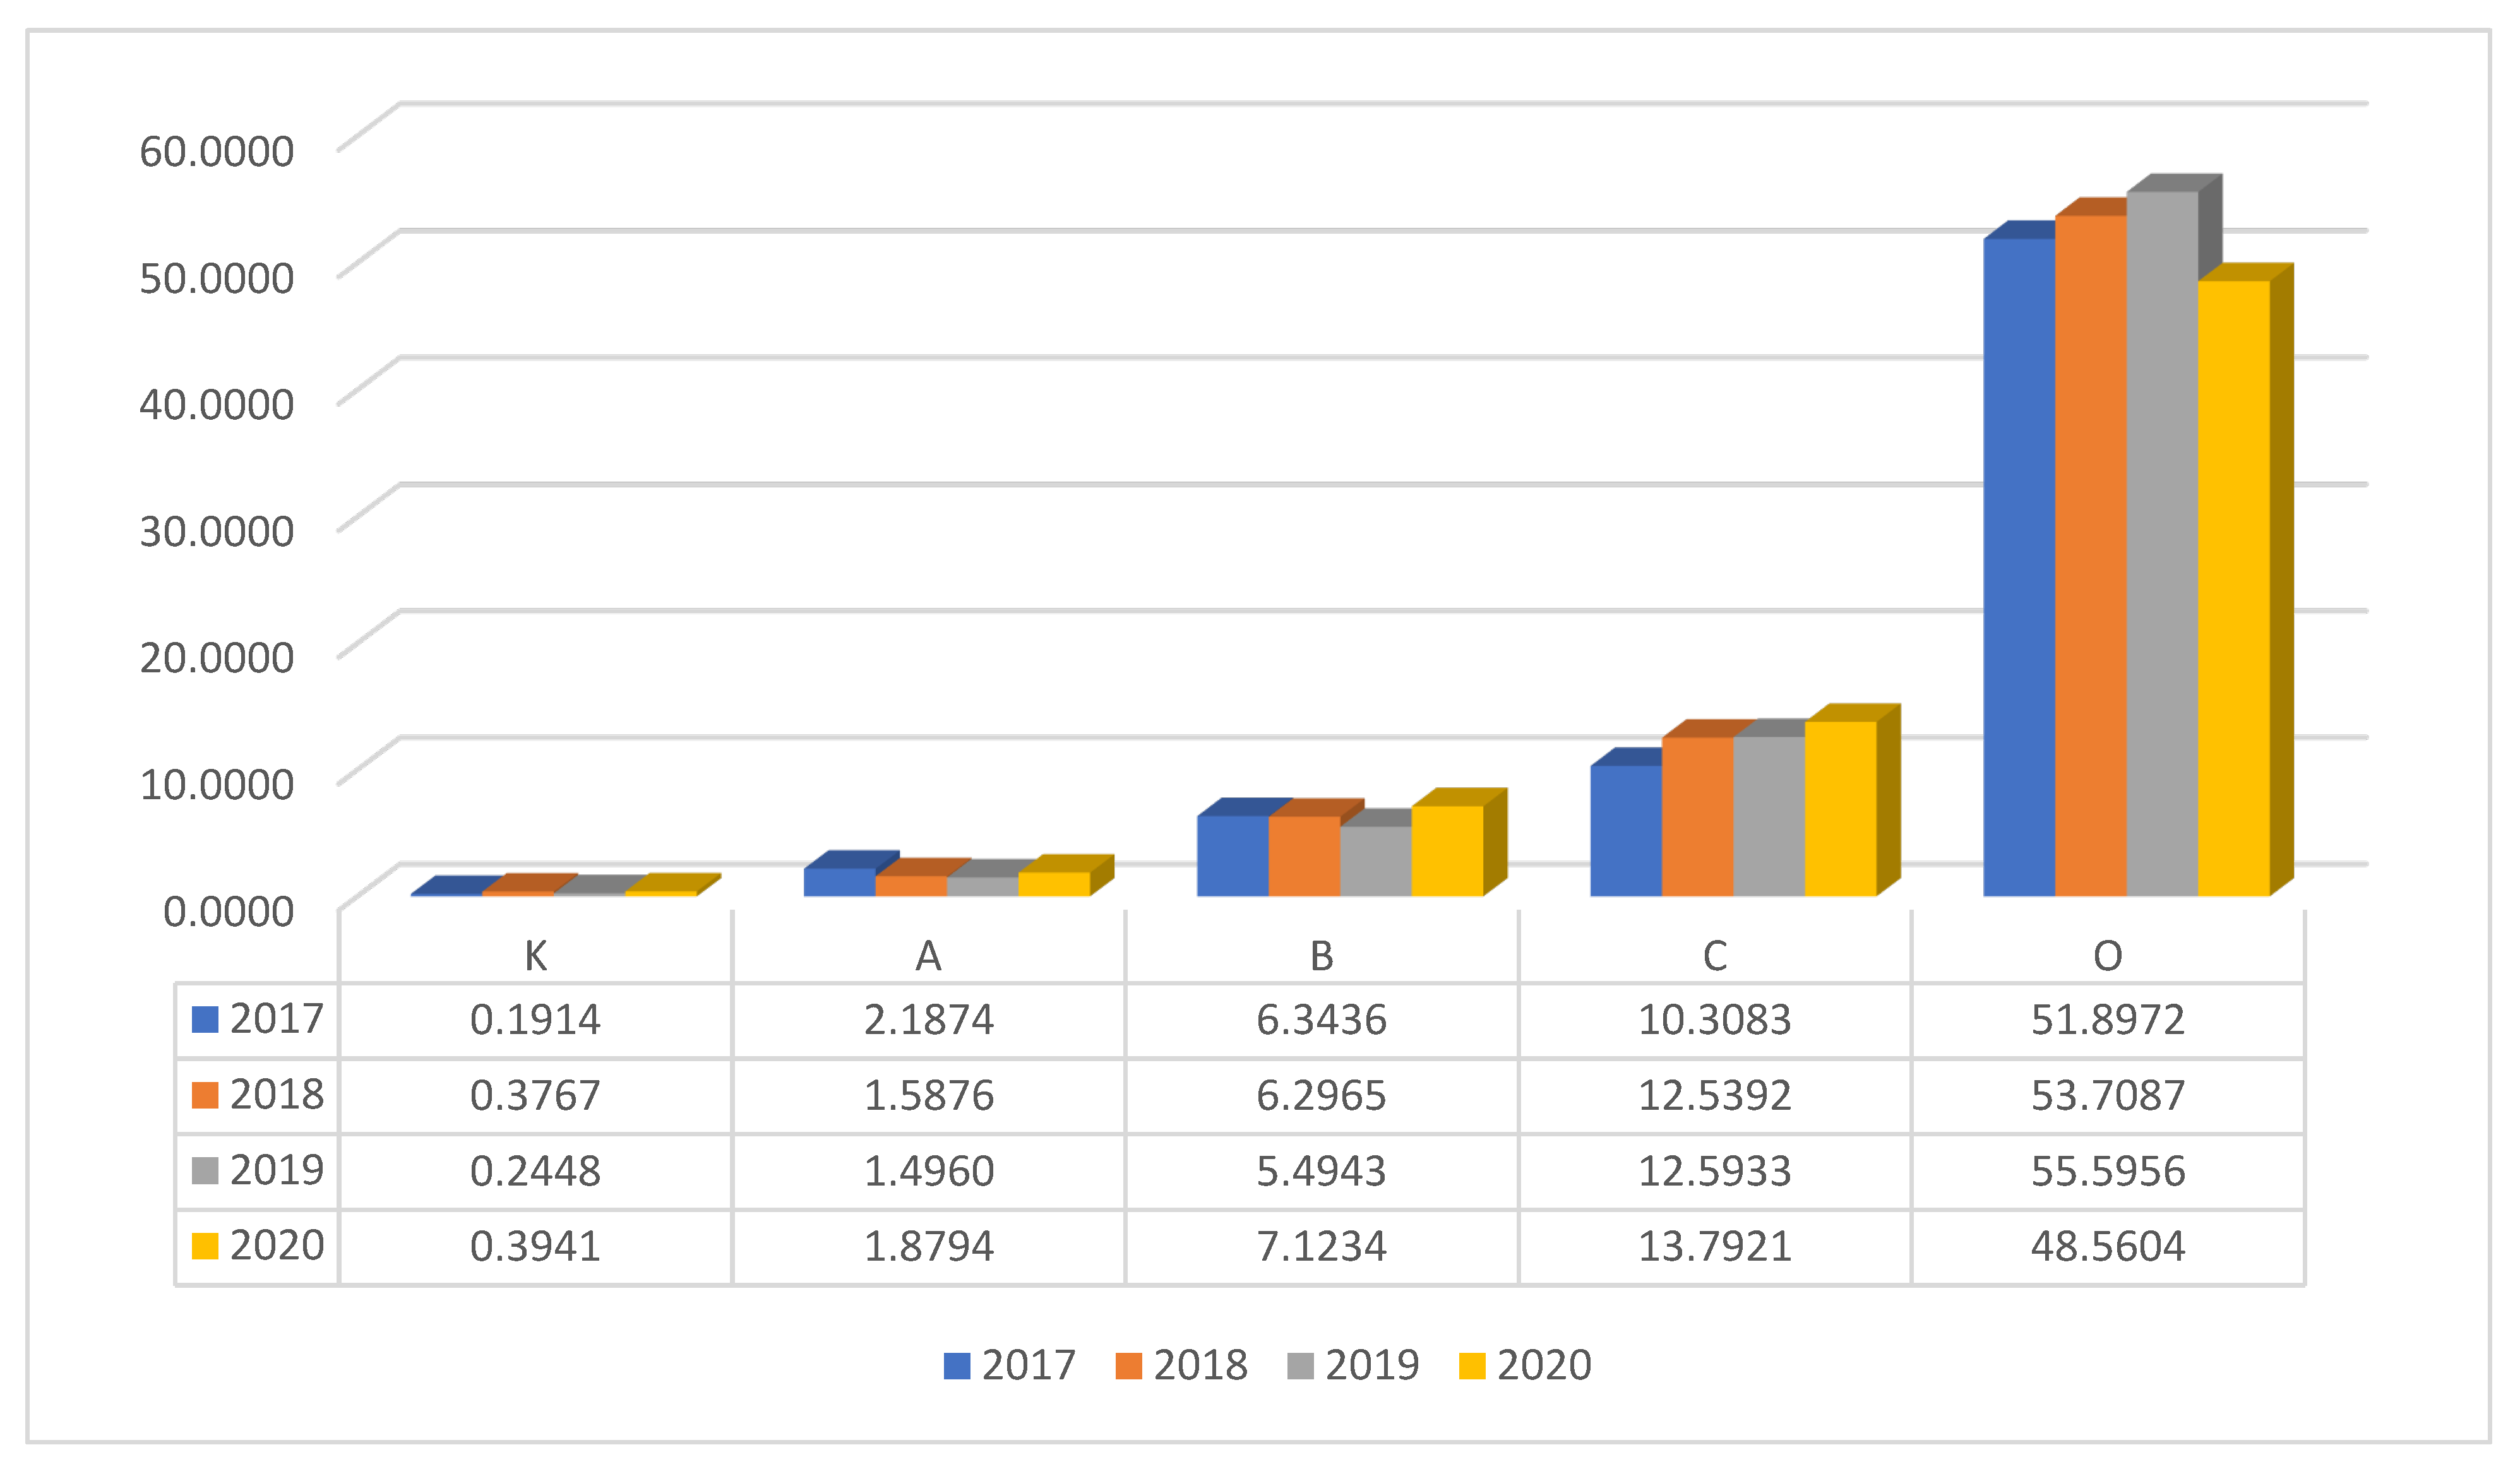
To observe these changes more clearly, crash rates per 100 million vehicle miles traveled for different crash severities were also calculated. From Figure 7, it is evident that fatal crashes showed a slight increase in 2018 compared to 2017, then a slight decrease in 2019 and ending with an increase again in 2020. Incapacitating injuries and non-incapacitating injuries gradually decreased from 2017 to 2019 and slightly increased in 2020. Conversely, possible injuries and property damage only crashes gradually increased from 2017 to 2020, except the property damage only crashes decreased in the last year. However, these changes are negligible, and, to investigate whether these are significant, a paired one tailed t-test was performed.
The paired one tailed t-test showed that there was no significant differences between the pre-COVID-19 and during-COVID-19 periods’ mean number of different crash severities (except property damage crashes only), i.e., K severities (p-value: 0.2016 > 0.05), A severities (p-value: 0.3589 > 0.05), B severities (p-value: 0.2870 > 0.05), C severities (p-value: 0.3569 > 0.05), O severities (p-value: 0.02236 < 0.05).
4.4. Drug, Alcohol, and Distracted Driving
To investigate this effect, the data from 2017 to 2019, and 2020 were analyzed, and findings are shown in Table 2.
Table 2 shows that alcohol-related crashes had an increasing trend from 2017 to 2018 and 2018 to 2019; however, from 2019 to 2020, it decreased by 21.99%. However, distraction- and drug-related crashes showed a constant increasing trend.
4.5. Trend of Crash Severities during COVID-19
Finally, a modeling effort was attempted to investigate the underlying impacts of the considered variables on different crash severities. Ordinal logistic regression (OLR) model and Negative Binomial (NB) model were used in this study as the preferred method to perform such analyses [52,53,54]. Table 3 shows the OLR-model output for different crash severities and Table 4 shows the NB model output for total crashes. From the model results, the trend of crash severities was drawn to help the policymakers to understand the underlying impacts of COVID-19 on road safety.
From Table 3 and Table 4, it is evident that COVID-19 has a positive correlation with crash severities, and both the OLR model and NB model are showing this relationship as significant. However, the positive correlation implies that K events will have the highest rate of increase due to the increase in COVID-19 effects, and O events will have the lowest rate of increase due to the increase in COVID-19 effects. In other words, if the COVID-19 effect decreases, K events will decrease at the highest rate, and O events will decrease at the lowest rate. Similar effects are found for the speed and drug, alcohol, and distracted driving, and both the models show a significant correlation of these factors with the crash severities. On the contrary, the volume shows a negative significant correlation with the crash severities. That indicates that, if the volume on the road during the crash increases, O events will be decreased at the highest rate, and K events will be decreased at the lowest rate. In other words, if volume decreases, O events will be increased at the highest rate, and K events will be increased at the lowest rate.
5. Discussion
COVID-19 has affected all aspects of life, and it has had significant effects on road safety as well. This section summarizes the reasoning, interpretation, and long-term effects of such changes based on the findings from this study. In addition, this section discusses the policy implications of such findings and guides toward possible future research directions to improve safety on roads during such pandemic situations.
First, the study analyzed the trends of traffic volume during the COVID-19 period (2017–2019). The mean traffic volume per minute at the location of the crash during crash occurrence dropped from 44 to 38, a 13.64% decrease. However, if we look at the range, it was between 1 and 434 during the pre-COVID-19 period, and 1 and 103 during the COVID-19 period. This implies that traffic volume varied widely during the COVID-19 period. However, during the COVID-19 period, the range was very small, and it implies that, even in the peak period, there was very a much smaller number of vehicles on the road. Even the analyses of monthly variation in volume revealed that, in each month, the volume was reasonably low in 2020 compared to the previous years, i.e., 2017 to 2019 (except June 2019). This implies that, in such a pandemic period or stay-at-home order period, roads had fewer vehicles, and this gave wider freedom to road users. To apprehend the relation of traffic volume with the crashes, crash frequency distribution was assessed, and it was found that crashes were most frequent in a particular range, i.e., 30 to 50, irrespective of whether it was the pre-COVID-19 or during-COVID-19 period. However, an interesting finding from the analyses was that, as the number of vehicles increased on a roadway, the probability of crashes decreased for that period. This is reasonable, since if there is much traffic on the roads, drivers become more careful and their freedom to maneuver their vehicles or violate the traffic regulations becomes limited [6]. To understand the effects of volume on crash severities during the COVID-19 period, NB and OLR modeling were conducted. From the modeling results, it was found that volume had a negative significant correlation with the crash severities. This implies that if volume decreases, O events will be increased at the highest rate, and K events will be increased at the lowest rate. This indicates that, on a road with less traffic, there will be more severe and fatal crashes compared to a road with normal traffic. The rationale for such a finding is justifiable from the earlier explanation of the freedom of road users on a less traffic-volume road. Even if we compare the finding of our study with the earlier studies, it is very consistent with their findings regarding traffic volume changes during the pandemic period [5,19,22,24,26,28,35,36,38,39,41,55].
Then, the speed trends in the pre-COVID-19 and during-COVID-19 period were analyzed. Speed increased by 11.3% during the pandemic period compared with the 2017–2019 data. However, the mean speed of 57.23 mph during the pandemic with a standard deviation of 18.97 represented a wider variation in speed during the pandemic period compared with the mean speed of 51.42 mph with a standard deviation of 17.92 mph during the pre-COVID-19 period. This implies that there were more variations in speed among the vehicles running during the pandemic period. Furthermore, from the frequency-distribution analyses, it was found that vehicles show a significantly higher speed during COVID-19 compared to the pre-COVID-19 period. Total crashes that occurred at a lower speed than the posted speed limit were higher in 2017 to 2019 than in 2020. Modeling results from NB and OLR models showed that speed has a positive significant correlation with crash severity, and this implies that K events will have the highest rate of increase due to the increase in speed, and O events will have the lowest rate of increase due to the increase in speed. The rationale for such a finding is that, as there was less traffic on road during 2020 compared to 2017–2019, the drivers had much freedom to speed up their vehicles. In addition, as per this modeling result, the more drivers speed up their vehicle; the more likely they are to experience fatal and severe crashes. The speeding-related findings are consistent with many of the earlier studies [19,27,33,37,39,40].
The analyses of total crashes and crash severities revealed that the number of total crashes started to fall at the beginning of COVID-19, and it continued till the end of the stay-at-home order period. Then, it started to return to the normal level. This is reasonable, since the mobility and traffic volume fell after the beginning of COVID-19, and people limited their movement in fear of an uncertain disease; therefore, there were few vehicles on roads, resulting in a lower number of crashes. However, after that period, the stay-at-home order was lifted, and people felt that this might be the end of this unknown disease, as the total cases of COVID-19 infections and deaths started to fall also during that time period. Furthermore, fatal crashes continued to increase from the beginning of COVID-19 till August 2020. This can be explained by the previous discussion on volume and speed. As there were few vehicles on the roads, drivers on roads were reckless and they utilized their full freedom to overspeed. In addition, they had limited perception power of their speed and front-case scenarios, as there might not have been any leading vehicles in front of them to guide them in such scenarios. When any sudden change in the environment occurred, they might be unprepared to handle such cases, and, since they were at high speed, they experienced crashes with a higher severity. Although this is out of the scope of the current study, still, one prediction regarding the crash types is that, in such scenarios, they were more likely to experience off-road crashes as the sudden change in environment should persuade them to change their driving maneuvers and, thus, lose control, and eventually experience fatal and severe crashes [56]. Such explanations are validated through the crash-rate analyses, which showed that the fatal crash rate was highest in 2020 among all the 4 years. Since the total crashes decreased and fatal crashes increased, it is expected that the PDO crashes should decrease as well, and the crash rate for different crash severities showed that PDO crashes decreased in 2020 compared with all the previous 3 years. These findings are consistent with previous literature and also clarified the issues raised by some articles [5,19,26,27,33,36,37,39].
Finally, the analyses of drug, alcohol, and distracted driving revealed that distraction and drug-related crashes increased by around 25% and 300% in 2020 compared to 2019. This also validated the earlier findings and explanations. As, due to the effects of COVID-19, people were socially disconnected and in distress, there was an increase in the consumption of drugs, and social disconnection caused distraction [57], which eventually led them to have fatal and severe crashes during that period, which is consistent with our earlier explanations and the previous literature [19,28,33,34,40].
The findings of the current study have a great implication for practitioners, policymakers, and researchers. First, the findings of the study demand special guidelines for all the road users during such a pandemic/unusual/stay-at-home period. In such a situation, as the traffic volume will decrease, the limited number of road users might overspeed their vehicles. In addition, as people become socially disconnected, lose their jobs and normal life, they are likely to be in distress. Hence, there is a high chance that they might become addicted to drugs and, hence, drugs, alcohol, and distracted driving might be increased. Hence, a special policy should focus on such aspects to control and limit the behavior of road users during such a pandemic or unusual period. In addition, it is very usual that road users will try to utilize the opportunity if there is a lack of monitoring bodies to implement the traffic rules and regulations. Hence, the study highly suggests having 24/7 monitoring bodies to control the behaviors of road users in such situations. As this study is limited to a particular study area and dataset, more in-depth studies should consider rigorous policy-making perspectives to ensure safety on roads during pandemics and unusual situations.
6. Conclusions
This study explored the change in road-safety trends due to the impact of COVID-19. Data of Interstate-4 (I-4) from 2017 to 2020 were analyzed considering the 2017 to 2019 data as the pre-COVID-19 period and 2020 data as the during-COVID-19 period. The traffic volume of 2020 was reduced by 13.64% compared to the 2017–2019 traffic volume. This result is consistent with the findings mentioned in Table 1. The rationale for such a finding may be due to the lockdown/stay-at-home order, as most people restricted their unnecessary trips [58], and, hence, the volume dropped compared to the pre-COVID-19 period. Frequency distribution of volume showed that, as the number of vehicles increased in a roadway section, the probability of a crash decreased. This might be due to the fact that, when there are other closer vehicles, people become more careful driving, and, hence, the risk of exposure to crashes decreases. Speed was increased by 11.3% due to the effect of the global pandemic, and most of the crashes occurred in the speed range 60 mph to 80 mph. This aligns with the findings listed in Table 1. The rationale for such findings can be justified by the fact that, as the traffic volume dropped, people felt more confident in driving, and they could not perceive and control their surrounding environment since it was different during the lockdown/stay-at-home order period than their normal driving period [8]. In addition, the model results showed that, during the year 2020, there was no significant relationship between crash severities and speed. From the crash severities’ analyses, it was found that total crashes decreased while the fatal crashes increased; however, severe crashes also decreased with the same pattern as total crashes. Alcohol-related crashes decreased by 22% in the year 2020, and drug- and distraction-related crashes showed an irregular pattern. As there was ambiguity regarding the results of the different types of crashes listed in Table 1, the result of this study is in line with the findings from the series of reports of NHTSA [33,34,35,36,37,38]. This result can be justified by the fact that, as the overall mobility dropped significantly during this period, it is reasonable that the total number of crashes dropped. However, as the vehicles were at high speed, and drug, alcohol, and distracted driving were increased significantly, crashes that occurred at that time were highly likely to be fatal/severe [59]. The findings of this study have clarified some ambiguous findings from the previous literature and can be used for making policies to improve road safety during pandemic periods.
Future studies can incorporate additional significant and relevant variables and extend the works by comparing different types of road facilities to identify the more rigorous changes in road-safety trends due to the global pandemic and suggest appropriate policy measures to improve road safety.
Author Contributions
The authors confirm contributions to the paper as follows: study conception and design: M.R.I. and M.A.-A.; data collection: M.R.I., Z.I. and S.Z.; analysis and interpretation of results: M.R.I., M.A.-A., Z.I. and S.Z.; draft manuscript preparation: M.R.I., M.A.-A., Z.I. and S.Z. All authors have read and agreed to the published version of the manuscript.
Funding
This research received no external funding.
Institutional Review Board Statement
Not applicable.
Informed Consent Statement
Not applicable.
Data Availability Statement
All the data sources are described in the Methodology section.
Acknowledgments
All results and opinions are those of the authors only and do not reflect the opinions or positions of the sponsors. The author would also like to thank the University of Central Florida Smart and Safe Transportation (UCF SST) team.
Conflicts of Interest
The authors declare no conflict of interest.
References
- Anwari, N.; Tawkir Ahmed, M.; Rakibul Islam, M.; Hadiuzzaman, M.; Amin, S. Exploring the Travel Behavior Changes Caused by the COVID-19 Crisis: A Case Study for a Developing Country. Transp. Res. Interdiscip. Perspect. 2021, 9, 100334. [Google Scholar] [CrossRef]
- Shirani-bidabadi, N.; Ma, R.; Anderson, M. Within-Day Travel Speed Pattern Unsupervised Classification—A Data Driven Case Study of the State of Alabama during the COVID-19 Pandemic. J. Traffic Transp. Eng. Engl. Ed. 2021, 8, 170–185. [Google Scholar] [CrossRef]
- WHO. Coronavirus Disease Statistics. Available online: https://covid19.who.int/ (accessed on 19 April 2021).
- Kim, K. Impacts of COVID-19 on Transportation: Summary and Synthesis of Interdisciplinary Research. Transp. Res. Interdiscip. Perspect. 2021, 9, 100305. [Google Scholar] [CrossRef] [PubMed]
- Lotan, T.; Shinar, D. Sustainable Public Safety and the Case of Two Epidemics: COVID-19 and Traffic Crashes. Can We Extrapolate from One to the Other? Sustainability 2021, 13, 3136. [Google Scholar] [CrossRef]
- Islam, M.R.; Barua, S.; Akter, S.; Hadiuzzaman, M.; Haque, N. Impacts of Nongeometric Attributes on Crash Prediction at Urban Signalized Intersections of Developing Countries. J. Transp. Saf. Secur. 2020, 12, 671–696. [Google Scholar] [CrossRef]
- Romo, L.; Julien Sweerts, S.; Ordonneau, P.; Blot, E.; Gicquel, L. Road Accidents in Young Adults with ADHD: Which Factors Can Explain the Occurrence of Injuries in Drivers with ADHD and How to Prevent It? Appl. Neuropsychol. Adult 2021, 28, 372–377. [Google Scholar] [CrossRef]
- Tucker, A.; Marsh, K.L. Speeding through the Pandemic: Perceptual and Psychological Factors Associated with Speeding during the COVID-19 Stay-at-Home Period. Accid. Anal. Prev. 2021, 159, 106225. [Google Scholar] [CrossRef]
- Muley, D.; Shahin, M.; Dias, C.; Abdullah, M. Role of Transport during Outbreak of Infectious Diseases: Evidence from the Past. Sustainability 2020, 12, 7367. [Google Scholar] [CrossRef]
- Behnood, A.; Mannering, F.L. An Empirical Assessment of the Effects of Economic Recessions on Pedestrian-Injury Crashes Using Mixed and Latent-Class Models. Anal. Methods Accid. Res. 2016, 12, 1–17. [Google Scholar] [CrossRef]
- Lee, J.; Abdel-Aty, A.; Park, J. Investigation of Associations between Marijuana Law Changes and Marijuana-Involved Fatal Traffic Crashes: A State-Level Analysis. J. Transp. Health 2018, 10, 194–202. [Google Scholar] [CrossRef]
- Robertson, L.S.; Kelley, A.B.; O’Neill, B.; Wixom, C.W.; Eiswirth, R.S.; Haddon, W. A Controlled Study of the Effect of Television Messages on Safety Belt Use. Am. J. Public Health 1974, 64, 1071–1080. [Google Scholar] [CrossRef] [PubMed] [Green Version]
- Yue, L.; Abdel-Aty, M.; Wu, Y.; Ugan, J.; Yuan, C. Effects of Forward Collision Warning Technology in Different Pre-Crash Scenarios. Transp. Res. Part F Traffic Psychol. Behav. 2021, 76, 336–352. [Google Scholar] [CrossRef]
- Park, J.; Abdel-Aty, M.; Lee, J.; Lee, C. Developing Crash Modification Functions to Assess Safety Effects of Adding Bike Lanes for Urban Arterials with Different Roadway and Socio-Economic Characteristics. Accid. Anal. Prev. 2015, 74, 179–191. [Google Scholar] [CrossRef] [PubMed]
- Abdel-Aty, M.; Devarasetty, P.C.; Pande, A. Safety Evaluation of Multilane Arterials in Florida. Accid. Anal. Prev. 2009, 41, 777–788. [Google Scholar] [CrossRef] [Green Version]
- Vingilis, E.; Beirness, D.; Boase, P.; Byrne, P.; Johnson, J.; Jonah, B.; Mann, R.E.; Rapoport, M.J.; Seeley, J.; Wickens, C.M.; et al. Coronavirus Disease 2019: What Could Be the Effects on Road Safety? Accid. Anal. Prev. 2020, 144, 105687. [Google Scholar] [CrossRef]
- Qureshi, A.I.; Huang, W.; Khan, S.; Lobanova, I.; Siddiq, F.; Gomez, C.R.; Suri, M.F.K. Mandated Societal Lockdown and Road Traffic Accidents. Accid. Anal. Prev. 2020, 146, 105747. [Google Scholar] [CrossRef]
- Stavrinos, D.; McManus, B.; Mrug, S.; He, H.; Gresham, B.; Albright, M.G.; Svancara, A.M.; Whittington, C.; Underhill, A.; White, D.M. Adolescent Driving Behavior before and during Restrictions Related to COVID-19. Accid. Anal. Prev. 2020, 144, 105686. [Google Scholar] [CrossRef]
- Katrakazas, C.; Michelaraki, E.; Sekadakis, M.; Yannis, G. A Descriptive Analysis of the Effect of the COVID-19 Pandemic on Driving Behavior and Road Safety. Transp. Res. Interdiscip. Perspect. 2020, 7, 100186. [Google Scholar] [CrossRef]
- Meyer, M.W. COVID Lockdowns, Social Distancing, and Fatal Car Crashes: More Deaths on Hobbesian Highways? Camb. J. Evid. Based Polic. 2020, 4, 238–259. [Google Scholar] [CrossRef]
- Brodeur, A.; Cook, N.; Wright, T. On the Effects of COVID-19 Safer-at-Home Policies on Social Distancing, Car Crashes and Pollution. J. Environ. Econ. Manag. 2021, 106, 102427. [Google Scholar] [CrossRef]
- Saladié, Ò.; Bustamante, E.; Gutiérrez, A. COVID-19 Lockdown and Reduction of Traffic Accidents in Tarragona Province, Spain. Transp. Res. Interdiscip. Perspect. 2020, 8, 100218. [Google Scholar] [CrossRef] [PubMed]
- Vandoros, S. COVID-19, Lockdowns and Motor Vehicle Collisions: Empirical Evidence from Greece. Inj. Prev. 2021, 28, 81–85. [Google Scholar] [CrossRef] [PubMed]
- Barnes, S.R.; Beland, L.-P.; Huh, J.; Kim, D. The Effect of COVID-19 Lockdown on Mobility and Traffic Accidents: Evidence from Louisiana in GLO Discussion Paper; Global Labor Organization (GLO): Essen, Germany, 2020. [Google Scholar]
- Oguzoglu, U. COVID-19 Lockdowns and Decline in Traffic Related Deaths and Injuries; IZA Discussion Paper; Institute for the Study of Labor (IZA): Bonn, Germany, 2020. [Google Scholar]
- Muley, D.; Ghanim, M.S.; Mohammad, A.; Kharbeche, M. Quantifying the Impact of COVID–19 Preventive Measures on Traffic in the State of Qatar. Transp. Policy 2021, 103, 45–59. [Google Scholar] [CrossRef]
- Katrakazas, C.; Michelaraki, E.; Sekadakis, M.; Ziakopoulos, A.; Kontaxi, A.; Yannis, G. Identifying the Impact of the COVID-19 Pandemic on Driving Behavior Using Naturalistic Driving Data and Time Series Forecasting. J. Saf. Res. 2021, 78, 189–202. [Google Scholar] [CrossRef] [PubMed]
- Amberber, N.; Howard, A.; Winters, M.; Harris, M.A.; Pike, I.; Machperson, A.; Cloutier, M.-S.; Richmond, S.A.; Hagel, B.; Fuselli, P.; et al. Road Traffic Injury during the COVID-19 Pandemic: Cured or a Continued Threat? Univ. Toronto J. Public Health 2021, 2, 1–7. [Google Scholar] [CrossRef]
- Watson-Brown, N.; Truelove, V.; Parker, E.; Davey, J. Drink Driving during the COVID-19 Pandemic. Transp. Res. Part F Traffic Psychol. Behav. 2021, 78, 369–380. [Google Scholar] [CrossRef]
- Lin, L.; Shi, F.; Li, W. Assessing Road Traffic Safety during COVID-19: Inequality, Irregularity, and Severity. arXiv 2020, arXiv:2011.02289. [Google Scholar] [CrossRef]
- Vanlaar, W.G.M.; Woods-Fry, H.; Barrett, H.; Lyon, C.; Brown, S.; Wicklund, C.; Robertson, R.D. The Impact of COVID-19 on Road Safety in Canada and the United States. Accid. Anal. Prev. 2021, 160, 106324. [Google Scholar] [CrossRef]
- Abdel-Aty, M.; Haleem, K.; Cunningham, R.; Gayah, V. Application of Variable Speed Limits and Ramp Metering to Improve Safety and Efficiency of Freeways in 2nd International Symposium on Freeway and Tollway Operations. 2009. Available online: http://citeseerx.ist.psu.edu/viewdoc/download?doi=10.1.1.567.1108&rep=rep1&type=pdf (accessed on 13 December 2021).
- NHTSA. Examination of the Traffic Safety Environment during the Second Quarter of 2020; NHTSA: Washington, DC, USA, 2020. [Google Scholar]
- NHTSA. Drug and Alcohol Prevalence in Seriously and Fatally Injured Road Users before and during the COVID-19 Public Health Emergency; NHTSA: Washington, DC, USA, 2020. [Google Scholar]
- NHTSA. Update to Special Reports on Traffic Safety during the COVID-19 Public Health Emergency: Third Quarter Data; NHTSA: Washington, DC, USA, 2021. [Google Scholar]
- NHTSA. Update to Special Reports on Traffic Safety during the COVID-19 Public Health Emergency: Fourth Quarter Data; NHTSA: Washington, DC, USA, 2021. [Google Scholar]
- NHTSA. Continuation of Research on Traffic Safety during the COVID-19 Public Health Emergency: January–June 2021; NHTSA: Washington, DC, USA, 2021. [Google Scholar]
- NHTSA. Early Estimate of Motor Vehicle Traffic Fatalities for the First Half (Jan–Jun) of 2020; NHTSA: Washington, DC, USA, 2021. [Google Scholar]
- DeVoe, E.; Leuer, D.; Saari, I.; Wagner, M. Traffic Safety Impact of COVID-19. 2020. Available online: http://www.dot.state.mn.us/trafficeng/safety/docs/traffic-safety-impact-of-covid19.pdf (accessed on 10 April 2020).
- Colorado DOT. What Are the Impacts of COVID-19 to Traffic Safety? In 2020. Available online: https://www.codot.gov/safety/traffic-safety/assets/crash-data/covid-19-impacts.pdf (accessed on 13 December 2021).
- Wegman, F.; Katrakazas, C. Did the COVID-19 Pandemic Influence Traffic Fatalities in 2020? A Presentation of First Findings. IATSS Res. 2021, 45, 469–484. [Google Scholar] [CrossRef]
- Park, J.; Abdel-Aty, M. Assessing the Safety Effects of Multiple Roadside Treatments Using Parametric and Nonparametric Approaches. Accid. Anal. Prev. 2015, 83, 203–213. [Google Scholar] [CrossRef]
- Wu, Y.; Abdel-Aty, M.; Lee, J. Crash Risk Analysis during Fog Conditions Using Real-Time Traffic Data. Accid. Anal. Prev. 2018, 114, 4–11. [Google Scholar] [CrossRef] [PubMed]
- Abdel-Aty, M.A.; Radwan, A.E. Modeling Traffic Accident Occurrence and Involvement. Accid. Anal. Prev. 2000, 32, 633–642. [Google Scholar] [CrossRef]
- Mahmoud, N.; Abdel-Aty, M.; Cai, Q.; Zheng, O. Vulnerable Road Users’ Crash Hotspot Identification on Multi-Lane Arterial Roads Using Estimated Exposure and Considering Context Classification. Accid. Anal. Prev. 2021, 159, 106294. [Google Scholar] [CrossRef] [PubMed]
- Zhu, S. Analysis of the Severity of Vehicle-Bicycle Crashes with Data Mining Techniques. J. Saf. Res. 2021, 76, 218–227. [Google Scholar] [CrossRef] [PubMed]
- Nguyen, D.V.M.; Vu, A.T.; Polders, E.; Ross, V.; Brijs, T.; Wets, G.; Brijs, K. Modeling the Injury Severity of Small-Displacement Motorcycle Crashes in Hanoi City, Vietnam. Saf. Sci. 2021, 142, 105371. [Google Scholar] [CrossRef]
- Khattak, A.J.; Rocha, M. Are SUVs “Supremely Unsafe Vehicles”?: Analysis of Rollovers and Injuries with Sport Utility Vehicles. Transp. Res. Rec. J. Transp. Res. Board 2003, 1840, 167–177. [Google Scholar] [CrossRef]
- Xu, D. Physical Mobility under Stay-at-Home Orders: A Comparative Analysis of Movement Restrictions between the U.S. and Europe. Econ. Hum. Biol. 2021, 40, 100936. [Google Scholar] [CrossRef]
- Li, J.; Zhang, H.M. Fundamental Diagram of Traffic Flow. Transp. Res. Rec. J. Transp. Res. Board 2011, 2260, 50–59. [Google Scholar] [CrossRef] [Green Version]
- Islam, M.R.; Hadiuzzaman, M.; Barua, S.; Shimu, T.H. Alternative Approach for Vehicle Trajectory Reconstruction under Spatiotemporal Side Friction Using Lopsided Network. IET Intell. Transp. Syst. 2019, 13, 356–366. [Google Scholar] [CrossRef]
- Anwari, N.; Ahmed, M.T.; Islam, M.R. Investigating the Characteristics and Opinions of Public Transit Users in an Industrial City of a Developing Country. In TRB 101th Annual Meeting; Transportation Research Board (TRB): Washington, DC, USA, 2021. [Google Scholar]
- Lord, D.; Mannering, F. The Statistical Analysis of Crash-Frequency Data: A Review and Assessment of Methodological Alternatives. Transp. Res. Part A Policy Pract. 2010, 44, 291–305. [Google Scholar] [CrossRef] [Green Version]
- Hall, T.; Tarko, A.P. Adequacy of Negative Binomial Models for Managing Safety on Rural Local Roads. Accid. Anal. Prev. 2019, 128, 148–158. [Google Scholar] [CrossRef] [PubMed]
- Guida, C.; Ugan, J. Ecological Transition: Perspectives from U.S. and European Cities. TeMA J. L Use Mobil. Environ. 2021, 14, 271–277. [Google Scholar] [CrossRef]
- Salottolo, K.; Caiafa, R.; Mueller, J.; Tanner, A.; Carrick, M.M.; Lieser, M.; Berg, G.; Bar-Or, D. Multicenter Study of US Trauma Centers Examining the Effect of the COVID-19 Pandemic on Injury Causes, Diagnoses and Procedures. Trauma Surg. Acute Care Open 2021, 6, e000655. [Google Scholar] [CrossRef] [PubMed]
- Wells, S.Y.; Morland, L.A.; Wilhite, E.R.; Grubbs, K.M.; Rauch, S.A.M.; Acierno, R.; McLean, C.P. Delivering Prolonged Exposure Therapy via Videoconferencing during the COVID-19 Pandemic: An Overview of the Research and Special Considerations for Providers. J. Trauma. Stress 2020, 33, 380–390. [Google Scholar] [CrossRef] [PubMed]
- Monterde-i-Bort, H.; Sucha, M.; Risser, R.; Kochetova, T. Mobility Patterns and Mode Choice Preferences during the COVID-19 Situation. Sustainability 2022, 14, 768. [Google Scholar] [CrossRef]
- Măirean, C.; Havârneanu, G.M.; Barić, D.; Havârneanu, C. Cognitive Biases, Risk Perception, and Risky Driving Behaviour. Sustainability 2021, 14, 77. [Google Scholar] [CrossRef]
Figure 1.
Steps for preparing the basemap.

Figure 2.
Traffic volume trend at the locations of crashes during crash occurrence.

Figure 3.
Frequency distribution of traffic volume at the crash location during the crash occurrence. (a) Frequency distribution of volume at the crash locations during the crash occurrence in 2020; (b) Average frequency distribution of volume at the crash location during the crash occurrence from the year 2017 to 2019.


Figure 4.
Traffic speed trend at the locations of crashes during crash occurrence.

Figure 5.
Frequency distribution of speed. (a) Frequency distribution of speed in 2020; (b) Frequency distribution of Speed in 2017–2019.
Figure 5.
Frequency distribution of speed. (a) Frequency distribution of speed in 2020; (b) Frequency distribution of Speed in 2017–2019.

Figure 6.
Trend of changes in percentages of different crash severities. (a) Percentages of total crashes vs. percentages of fatal crashes; (b) percentages of total crashes vs. percentages of severe crashes.
Figure 6.
Trend of changes in percentages of different crash severities. (a) Percentages of total crashes vs. percentages of fatal crashes; (b) percentages of total crashes vs. percentages of severe crashes.

Figure 7.
Crash rate for different crash severities.

Table 2.
Percentage changes for drug, alcohol, and distracted driving.
| Year | Alcohol Related | Distraction Related | Drug Related | None |
|---|---|---|---|---|
| 2017 | 636 | 18 | 3 | 1937 |
| 2018 | 679 | 30 | 3 | 2057 |
| %Change | 6.76 | 66.67 | 0.00 | 6.20 |
| 2018 | 679 | 30 | 3 | 2057 |
| 2019 | 773 | 32 | 3 | 1965 |
| %Change | 13.84 | 6.67 | 0.00 | −4.47 |
| 2019 | 773 | 32 | 3 | 1965 |
| 2020 | 603 | 40 | 12 | 1713 |
| %Change | −21.99 | 25.00 | 300.00 | −12.82 |
Table 3.
Ordinal logistic regression (OLR) model for different crash severities.
| Dependent Variable | Coef. | Std. Err. | z Value | p-Value | OR |
|---|---|---|---|---|---|
| KABCO = 1 | 1.010461 | 0.088434 | |||
| KABCO = 2 | 2.140722 | 0.091144 | |||
| KABCO = 3 | 3.636945 | 0.104126 | |||
| KABCO = 4 | 5.607193 | 0.175417 | |||
| Independent variable | |||||
| COVID | 0.175 | 0.051 | 3.470 | 0.001 | 1.192 |
| speed | 0.004 | 0.001 | 3.580 | 0.000 | 1.004 |
| volume | −0.008 | 0.001 | −7.590 | 0.000 | 0.992 |
| drug_alco | 0.485 | 0.045 | 10.750 | 0.000 | 1.624 |
| Model Fit Result | |||||
| Chi-square (p value) | 236.67 (0.0000) | ||||
| Log-likelihood | −8928.423 | ||||
| McFadden pseudo-R2 | 0.013 | ||||
Table 4.
Negative binomial (NB) model for total crashes.
| Variables | Coef. | Std. Err. | z Value | p-Value |
| constant | 0.31862 | 0.033265 | 9.58 | 0.000 |
| COVID | 0.034747 | 0.01947 | 1.78 | 0.074 |
| speed | 0.001513 | 0.000448 | 3.38 | 0.001 |
| volume | −0.00199 | 0.000381 | −5.24 | 0.000 |
| drug_alco | 0.118017 | 0.017287 | 6.83 | 0.000 |
| Model Fit Result | ||||
| Chi-square (p value) | 107.52 (0.000) | |||
| Log-likelihood | −13,454.9 | |||
| McFadden pseudo-R2 | 0.004 | |||
Publisher’s Note: MDPI stays neutral with regard to jurisdictional claims in published maps and institutional affiliations. |
© 2022 by the authors. Licensee MDPI, Basel, Switzerland. This article is an open access article distributed under the terms and conditions of the Creative Commons Attribution (CC BY) license (https://creativecommons.org/licenses/by/4.0/).
Share and Cite
MDPI and ACS Style
Islam, M.R.; Abdel-Aty, M.; Islam, Z.; Zhang, S. Risk-Compensation Trends in Road Safety during COVID-19. Sustainability 2022, 14, 5057. https://0-doi-org.brum.beds.ac.uk/10.3390/su14095057
AMA Style
Islam MR, Abdel-Aty M, Islam Z, Zhang S. Risk-Compensation Trends in Road Safety during COVID-19. Sustainability. 2022; 14(9):5057. https://0-doi-org.brum.beds.ac.uk/10.3390/su14095057
Chicago/Turabian StyleIslam, Md Rakibul, Mohamed Abdel-Aty, Zubayer Islam, and Shile Zhang. 2022. "Risk-Compensation Trends in Road Safety during COVID-19" Sustainability 14, no. 9: 5057. https://0-doi-org.brum.beds.ac.uk/10.3390/su14095057
Note that from the first issue of 2016, this journal uses article numbers instead of page numbers. See further details here.