Article

Spatiotemporal Changeability of the Load of the Urban Road Transport System under Permanent and Short-Term Legal and Administrative Retail Restrictions

by
Marta Borowska-Stefańska
1,*,
Michał Kowalski
1,
Paulina Kurzyk
1,
Alireza Sahebgharani
2 and
Szymon Wiśniewski
1
1
University of Lodz, Institute of the Built Environment and Spatial Policy, 90-142 Lodz, Poland
2
Department of Transportation Engineering, Isfahan University of Technology, Isfahan 84156-83111, Iran
*
Author to whom correspondence should be addressed.
Sustainability 2022, 14(9), 5137; https://0-doi-org.brum.beds.ac.uk/10.3390/su14095137
Submission received: 5 April 2022 / Revised: 21 April 2022 / Accepted: 22 April 2022 / Published: 24 April 2022

Abstract

:
In Poland, in 2018, the act on Sunday retail restrictions was introduced, changing citizen’s spatial mobility (altered patterns of transport behaviour related to shopping on a weekly scale). Moreover, the COVID-19 pandemic (from 2020) on transport behaviour during this time has had an impact, since people were encouraged to stay at home and limit their mobility to an absolute minimum. As a result, the main aim of the article was to identify spatiotemporal changeability of the load of the urban road transport system under permanent and short-term legal and administrative retail restrictions and to determine its spatial and temporal nature on the example of Łódź (a big city in central Poland) during 2018–2021. For that purpose, the authors used three types of source data, i.e., official governmental normative data (acts, ordinances, etc.), informative data (official pandemic announcements issued during ministerial press conferences, governmental social media content, etc.), and objective empirical data (induction loops). The pandemic restrictions imposed on top of the existing permanent retail restrictions were shown to distinctly shape the weekly distribution of traffic. In weeks with non-trading Sundays, the percentage of vehicle traffic on weekdays was substantially higher than on weekends, which was particularly noticeable during the first year of the pandemic (2020). Long-term observations have also shown that people began to plan their weekends differently upon the initial implementation of Sunday retail restrictions.

1. Introduction

The development of urban transport systems, which are extremely complex and require continuous improvement, evolved from capital-intensive to intense management. In general, traffic management in cities is becoming more complicated, especially when facing non-typical disturbances, which, for dense transport networks in urban areas, may have numerous co-occurring, congestion-instigating causes. Major sources of disturbances within the road transport network include the spatiotemporal irregularity of demand that stems from traffic changeability on different days of the week for various scenarios, e.g., different spatiotemporal distribution of traffic on weekdays, weekends, and ‘transition’ days, i.e., Monday and Friday [1]. This paper focuses on the spatiotemporal changeability of the urban system of road transport with regard to permanent and short-term legal and administrative retail restrictions. What makes the issue so vital is the fact that disturbances within the urban network have a direct impact on mobility processes and shape specific movement conditions in the network. Moreover, deteriorating traffic conditions may also translate into changes of transport behaviour, affecting departure times, length of journey, destinations and modes of transport, or even resulting in abandoning a trip. Finally, due to the short period since the implementation of the statutory Sunday retail restrictions (2018) and the occurrence of the global COVID-19 pandemic, this important subject in urban traffic management still remains relatively unexplored.
The COVID-19 pandemic led to a massive economic shock that has had serious consequences for the EU market. Due to the highly infectious nature of the virus, drastic measures were taken to curb daily mobility all over the world. This approach had major repercussions on transport behaviour, since people were encouraged to stay at home and limit their mobility to an absolute minimum. Thus, the pandemic has had a significant impact on transport systems, although the severity varies depending on the mode of transport. In general, the drop in global-wide mobility mainly affected the use of mass transit, with people opting for the private car as a safer transport alternative, a fact which is by no means concordant with the idea of sustainable urban mobility.
This study focuses on the shopping-related daily mobility of residents of a large Polish city which is diverse in terms of purchase transaction time, frequency, travel time, selected means of transport, etc. The act on Sunday retail restrictions was introduced in 2018, changing citizen’s spatial mobility (altered patterns of transport behaviour related to shopping on a weekly scale), which is confirmed by a pilot survey conducted by Borowska-Stefańska et al. [2,3]. The implementation of these nationwide retail regulations has had an immense impact on people’s spatial behaviour, since, while non-grocery shopping can still be done online, there is a great social necessity for groceries to be freely available.
Moreover, daily mobility in Łódź was influenced by the COVID-19 pandemic during the analysed period. As shown by research carried out, i.e., by Macioszek and Kurek [4], the COVID-19 pandemic had a significant impact on the volume of traffic in cities. While the circadian rhythm (morning and afternoon peaks) remained basically unchanged, the volume of traffic decreased significantly, mainly after the first lockdown, when a significant part of daily mobility was replaced by online work and learning [5]. Understanding the changes in traffic in a given city is extremely important, as it allows for the better management and adaptation of a strategy to meet the requirements of sustainable transport.
In the face of the aforementioned problem, the main aim of the article is to identi-fy the spatiotemporal changes of the load of the urban road transport system under permanent and short-term legal and administrative retail restrictions and to examine the spatiotemporal nature of this changeability on the example of Łódź (a big city in central Poland) during 2018–2021. The innovative character of the study stems primarily from the fact that it determines changes in the ‘regular’ transport behaviour of residents in a large city. Another feature that makes this study so innovative is the incorporation of ITS data (Big Data set), since research on transport behaviour plays a crucial role in the planning and management of transport systems. Moreover, due to the fact that the effects of the COVID-19 pandemic have been felt worldwide, the results herein can be compared with research conducted elsewhere. Interestingly, the global pandemic offers an unprecedented opportunity to observe the effects of simulation modelling conducted on ‘a living organism’ of the urban transport system. The extraordinary circumstances of the COVID-19 pandemic allow researchers to prognosticate on how urban transport systems need to react to the ongoing relocation of activities (e.g., working, management and administration, and services, including the retail trade) online. Another vital issue is to determine whether COVID-19 pandemic-related behaviour will disappear together with the threat itself, or whether the new transport behaviour has consolidated to such an extent that modifications to transport systems will have to be made or, in some cases, even terminated, which is also crucial in terms of applying the principles of sustainable urban mobility.
This paper consists of six sections, the first being the introduction, followed by two parts devoted to a review of the existing literature on travel behaviour analysis (including an overview of the literature on the impact of the global COVID-19 pandemic and other restrictions on daily mobility, particularly shopping trips) and a description of permanent and short-term legal and administrative retail restrictions in Poland. The fourth section specifies the research area, providing detailed information on population, its density and distribution, and the structure of built-up development in Łódź. This part also includes descriptions of the system of the induction loop sensors against the network of the urban road infrastructure and the shopping-related daily mobility of residents in large cities. The fifth section presents the source materials used in the paper and the applied research methods (including a note on their limitations). Finally, the results are presented, juxtaposed with the findings of other studies, and followed by conclusions.

2. The Impact of Permanent and Short-Term Retail Restrictions on Daily Mobility—A Review of Existing Studies

2.1. Travel Behaviour Analysis

One of the main theories in traffic management is understanding human movement patterns [6] and analysing this behaviour while considering factors such as mode choice, travel time, activity type, etc. [7,8]. Due to the complexity of the movement patterns, there is an extensive literature that addresses travel behaviour analysis using different theories and approaches.
In a general classification, two supporting theories can be identified for travel behaviour analysis. The first is based on economic and physical concepts and the second on the notion of social psychology. Economic and physical theories that are related to the determinant mechanisms and extrinsic factors of travel behaviour attempt to describe movement patterns regarding space–time constraints and the benefits gained by choosing a particular option. Space–time theories stem from time geography and are elaborated on by Torsten [9], who explained that activity–travel sequences are feasible when considering the spatiotemporal constraints imposed by activity and transportation systems [6,10]. Economic theories spring from the random utility theory and discrete choice principles introduced by McFadden or Ben-Aakiva and Lerman [11,12] and are the essence of travel demand studies, being used to illustrate the way people choose to participate in activities by different modes, routes, etc., regarding the utility of existing alternatives [13]. Social psychology theories (starting from the work of Ajzen [14]) are related to the intrinsic factors that function as a catalyst, speeding up decision-making processes and mobility patterns [15]. Such theories strive to adapt social and psychological concepts within the framework of travel behaviour analysis to explicate the effect of attitudes, habits, and values on travel behaviour.
Several of the developed approaches and factors have been identified in the literature of travel behaviour analysis that apply these theories in practice and examine the effects of socio-economic, psycho-social, and built environment/physical variables on the main factors of transportation systems and vice versa. From the built environment aspect, Cervero and Kockelman [16], for example, presented density, diversity, and design as the main factors of the urban form. Ewing and Cervero [17] and Ewing et al. [18] added distance to transit and destination accessibility to the built environment variables, while Ewing and Cervero [19] put forward demand management variables such as parking costs for their travel behaviour analysis. Regarding the socio-economic aspect, age, income, car ownership, and employment were considered to be important factors affecting travel behaviour in human settlements [20]. Regarding the psycho-social aspect, Cao et al. [21], among others, studied the impact of self-selection on travel behaviour. Hiscock et al. [22] compared the advantages of cars with the advantages of public transport in terms of the social and psychologic characteristics of each mode. Steg [23] investigated the impact of emotional and symbolic attitudes towards cars on their usage for daily trips.
To study the aforementioned factors and variables, both qualitative and quantitative methods have been adopted by researchers and scholars. While the former have focused on the experience of individuals with regard to travel and are appropriate for addressing micro-scale questions, the latter concentrate on trip distribution and frequency, which are primarily suitable for tackling macro-scale questions [24]. The quantitative methods used in the context of travel behaviour analysis are based on regression models (e.g., linear regression [25], logistic regression [26], negative binomial regression [27], Poisson regression [28] Tobit regression [29], and the Structural Equation Model [30]). Questionnaires and surveys are the main data gathering techniques applied for this sort of research. Qualitative methods, on the other hand, utilize grounded theory [31,32], content analysis [33], case study [34] descriptive-explorative analysis [35], and thematic analysis [36] methods. Interviews and the forming of focus groups are the fundamental ways of gathering the required data for this type of research. Another stream of applied research methods is the combination of qualitative with quantitative approaches called the mixed method. In this approach, data and research methods can be acquired from both qualitative and quantitative resources. For example, Baslington [37] used questionnaires and travel diaries as well as interviews to analyse route choice behaviour. Skippon [38] employed statistical tests and thematic analysis to examine vehicle performance, with a specific focus on the private car.
A review of the literature also shows that, in addition to the standard data gathering methods (i.e., questionnaires, surveys, interviews, and so on), other types of datasets collected from passive resources have been used in travel behaviour analysis. These can improve the accuracy of the conventional data formats [39] and give insights about mobility patterns in combination with active databases. These datasets emerged by the extensive application of location-aware and intelligent transportation systems. Location-aware systems (including global positioning and mobile phone data) help produce key elements of travel behaviour such as the origin–destination matrix (Thakur et al. [40]), route choice recognition (Tawfik and Rakha [41]), and trip purpose identification (Schönfelder and Samaga [42]). An example of the application of intelligent transportation system data in travel behaviour analysis involves utilizing loop data to study mode choice behaviour and was carried out by Zhang et al. [43]. Borowska-Stefańska et al. [2] blended both inductive loop data with a two-stage questionnaire to analyse changes in travel behaviour due to a policy of retail restrictions.
Using the above-mentioned theories, factors, and methods, travel behaviour studies have been conducted for a wide range of topics such as gender difference and travel patterns [44,45], travel behaviour of older adults [46,47], leisure activity–travel behaviour [48], residential location and relocation [49,50], energy consumption [43,51,52], and residential mobility [53].

2.2. Trade Activity/Pandemic Conditions and Travel Behaviour Analysis

Sunday shopping restrictions were introduced in Poland in March, 2018, following on from the Act of 10 January 2018 on restrictions on trading on Sundays, public holidays, and certain other days. According to this step-by-step policy, from March, 2018, shops could be opened for only two Sundays in each month. From 2019, shops could be opened only one Sunday per month, and, after 2020, all shops were not allowed to trade on Sundays except for four Sundays before major holidays, the last Sundays in January, April, June, and August [54]. Consequently, there has been a change to the travel behaviour and spatial mobility of residents using these facilities. Moreover, since 2019, the emergence of the COVID-19 pandemic has become another source of travel behaviour change, which has built an additional barrier for spatial mobility. A review of the existing literature shows that several works have been dedicated to the analysis of the travel behaviour changes after either the implementation of a certain policy, the holding of an event, the carrying out of a project, or the arising of a pandemic situation. For instance, Cheng et al. [55] analysed the impact that policies restricting the use of vehicles had on demand for transport in the built environment of Xi’an, China. Gu et al. [56] examined the effects of Beijing’s policy for driving restriction (i.e., banning drivers from travelling by their vehicles one weekday per week) on the travel behaviour of the city’s residents. Yang et al. [57] explored the effect of restricting car ownership on travel behaviour. Arroyo et al. [58] and García-Garcés et al. [59] explored the impact of travel behaviour changes on trip characteristics (i.e., allocated time for driving, number of companions on trips, etc.). Shires et al. [60] studied travel behaviour change after the closure of the Forth Road Bridge in Edinburgh, Scotland. Walsh et al. [61] investigated the impact of wildcard events on transport infrastructures. Parkes et al. [62] conducted research into understanding the travel behaviour changes that took place during the London 2012 Olympic Games. Li and Guo [63] reported the effect of the Olympic Games and the associated traffic restriction on travel speed and traffic volume change in Beijing, China. Han et al. [64] and Wang et al. [65] studied the effect of holidays on travel behaviour. Ren et al. [66] researched the impact of a high-speed rail project on travel behaviour changes in Chengdu-Chongqing, China.
Since COVID-19 was declared a public health emergency of international concern, many countries have fought to prevent the importation and subsequent local transmission of SARS-CoV-2 [67]. This has led to most countries in the world introducing numerous restrictions, not only on economic activity, but also on transport, travel, and the daily mobility of people [68,69,70,71].
The coronavirus pandemic has proved a major challenge around the world, including countries in the European Union [72]. The spread of the COVID-19 pandemic has resulted in the implementation of emergency measures that restrict travel, movement, and participation in various types of events [53,73]. A number of stringent rules, for example, stay-at-home policies, the remote operations of schools, public institutions and workplaces, as well as restrictions on public transport, have affected around 90% of the world’s population, contributing to an unprecedented reduction in daily mobility [74,75,76,77].
Closed and crowded places, including the transport hubs that are visited by crowds of people every day, are potential sites for the spread of coronavirus [78,79,80]. There is a risk of virus transmission in the means of public transport, which are used by millions of people worldwide every day [81,82]. There are two main approaches to studying the issue of public transport from the perspective of the COVID-19 pandemic. On the one hand, researchers have examined the impact of the transport sector on the spread of COVID-19. Most research has demonstrated how changes in spatial mobility affect the spread of the COVID-19 pandemic [83]. Shamshiripour et al. [77] studied the reshaping of activity–travel behaviour resulting from the spread of COVID-19 by performing a comprehensive study in the Chicago metropolitan area. Irawan et al. [84] examined activities and the associated journeys in Indonesia during the COVID-19 pandemic, with a special focus on norms and protective behaviours. Abdullah et al. [85] explored the effects of the COVID-19 pandemic on transport mode preferences and travel behaviour. Grenfell et al. [86] pointed out that COVID-19 cases related to transport means and hubs are a key factor in the spread of the pandemic. Linka et al. [87] suggested that unrestricted mobility would greatly accelerate the spread of the COVID-19 pandemic, particularly in central Europe, Spain, and France. According to Müller et al. [88] as well as Marston et al. [81], public transport plays a significant role in spreading infectious diseases, and attempts to control the spread of infections through public transport are therefore able to limit the rate of the spread of infections. As evidenced by the research conducted by Przybylowski [69], the pandemic has had a profound impact on changes in mobility options, such as a drop in shared mobility and an increased reliance on private mobility. In addition, a growing number of publications reveal a strong interest in the impact of the coronavirus pandemic on mobility, which will allow for a comparison of the impact of (pandemic-related) restrictions on mobility in international terms [69,89,90,91,92].

2.3. Impact of Activity/Travel Policies on Travel Behaviour for Shopping

Besides the above-mentioned studies, there are particular pieces of research that are squarely aimed at travel behaviour for shopping activity. For example, Wiese et al. [93] concentrated on the influencing factors and the environmental effects. They took consumer characteristics (i.e., socio-demographic, personal, and situational) together with external variables into account when analysing the choice of transport mode and travel behaviour of different groups. This study explained the factors affecting travel behaviour for shopping by utilizing a qualitative method; however, the concept of travel behaviour changes due to shopping activity restriction was not covered. Similarly, Zhang et al. [94] explored travel behaviour for the shopping habits of millennials by considering the built environment, life stages, and preferences. They used travel survey data to explore the determinants of travel behaviour for the shopping and mode choices of millennials. Although the effect of the indicated factors was measured and they found that completed shopping facilities and a connection to public transportation encouraged the usage of active modes, the impact of travel behaviour changes resulting from restricting the shopping amenities has not been analysed. Farag et al. [95] took the notion of changes to travel behaviour and applied it to assess the effect of e-shopping on travel behaviour. The results showed that travel behaviour is highly affected by e-shopping in the central and medium-sized cities of the Randstad, and the increase in this type of shopping is expected to reduce the use of car, walking, and cycling modes in the travel behaviour of people in both the less and more urbanized areas of the Netherlands. Zhou and Wang [96] also examined the relationship between e-shopping and shopping trips and found that online shopping encourages shopping trips while shopping trips decrease the inclination to do e-shopping. However, these works did not address the changes to travel behaviour for shopping caused by adopting a particular policy.
Although the above-mentioned studies addressed the topic of changes to travel behaviour or travel behaviour for shopping, there are few pieces of research that have examined the changes to travel behaviour due to implementing a policy of trading restrictions. Chmielewski [97] explored the effect of trade bans on daily traffic volumes on weekends in Bydgoszcz. He found that traffic volume in places located far away from the central parts of the city with low transport attractiveness in terms of trading and shopping activities significantly increased after the introduction of such restrictions. Borowska-Stefańska et al. [3] investigated the changes to consumer travel and mobility behaviour after the trade ban. Based on a survey, the effects of variables (e.g., motivation, modal share, and shopping time) were measured. They found that the behaviour of people changed considerably after the execution of this policy. In terms of travel purposes, after the introduction of the Sunday trade ban, people tended to travel for recreation and leisure activities instead of staying at home or doing grocery shopping. Borowska-Stefańska et al. [2] studied changes of transport behaviour after the imposition of the retail restrictions. Traffic load and volume, the main factors for analysing spatial mobility patterns [98,99,100], together with variables such as trip motivation, the number of trips, travel time, mode transfer, and travel time window, were collected through a two-stage questionnaire and disclosed the spatial mobility of residents. The results implied that the legislative restrictions related to the trade ban notably affect mobility parameters. Along with the COVID-19 pandemic and measures on the shopping activity, Parady et al. [101] conducted a web-based survey and suggested that the degree of self-restriction of a person from the others has a small association with the reduction in travel frequencies for shopping purposes. Beck and Hensher [102] carried out a comprehensive survey to analyse household activity–travel changes after restrictive measures were implemented. For shopping travel behaviour, they found that travel for shopping purposes, either for food or other items has fallen, along with a reduction in the total number of household trips.
To recapitulate, the literature on changes to travel behaviour in response to the trade ban policy and COVID-19 pandemic reveals that the existing works tackled either the first or the second topic. However, in practice, both of these impediments affect trips for the purpose of shopping and, consequently, residents’ activity–travel behaviour. Thus, analysing the coexistence effect of these elements on the change of travel behaviour and mobility patterns is of utmost importance for the areas that follow policies such as Sunday trade bans together with pandemic situation, as it not only develops an understanding about the consequences of the activity prohibition policies on travel behaviour, but also has implications for future policy-making in the sense that lawmakers can evaluate the effectiveness and premises behind the new course of actions and regulations. Additionally, most of the indicated studies utilized surveys to ascertain the changes to travel behaviour. Nevertheless, spatial facets of mobility patterns were not directly reflected through the descriptive data and stated preferences. Therefore, there is room for the application of empirical data gathered from auxiliary sources (i.e., detectors and smart sensors) alongside those used to profoundly scrutinize the spatial distribution of journeys and changes to travel behaviour. In short, this article contributes to the body of existing knowledge by (1) using extensive and accurate spatiotemporal data for analysing changes to travel behaviour and (2) assessing the effects of both Saturday trade bans as a step-by-step policy and the COVID-19 pandemic on spatial mobility patterns, a notion including the movement of people, commodity, information, capital, and the local features related to traveling and daily trips in urban spaces [103].

3. Permanent and Short-Term Legal and Administrative Retail Restrictions in Poland

3.1. Permanent Sunday Retail Restriction

Regulating shop opening hours is not a new phenomenon. In fact, it has been a recurring economic issue for decades, one which affects other spheres, including law, religion, and ethics [104]. Therefore, the problem can be analysed not only from an economic point of view (based on profit efficiency and maximisation, employment and pricing policies, and competitiveness), but also in terms of government strategy or religious values [104]. Retail restrictions have both positive and negative effects for businesses, employees, and consumers, as shown by Freathy and Sparks, Skuterud, Genakos and Danchev, Kovács and Sikos, Khan [104,105,106,107,108].
Initially, regulations on retail restrictions in Europe were adopted for political and religious reasons so that employees previously working on Sundays could visit places of worship. This rationale has changed following the dynamic restructuration of European retail markets, which has led to the dominance of big players. This has forced legislators to introduce laws protecting the small retailers who could not compete in spheres such as marketing [109]. The issue of regulations concerning shop opening hours (on Sundays in particular) has been regularly discussed in many European countries over the last two decades. Since there is no common EU law to regulate the matter, member states individually exercise control over retail trade on Sundays [110].
In Poland, an act on retail restrictions on Sundays and public holidays (as well as certain other days) was introduced in March 2018. The restrictions were introduced gradually [2,3]. However, by imposing such restrictions, Poland remains an exception in the EU [111].

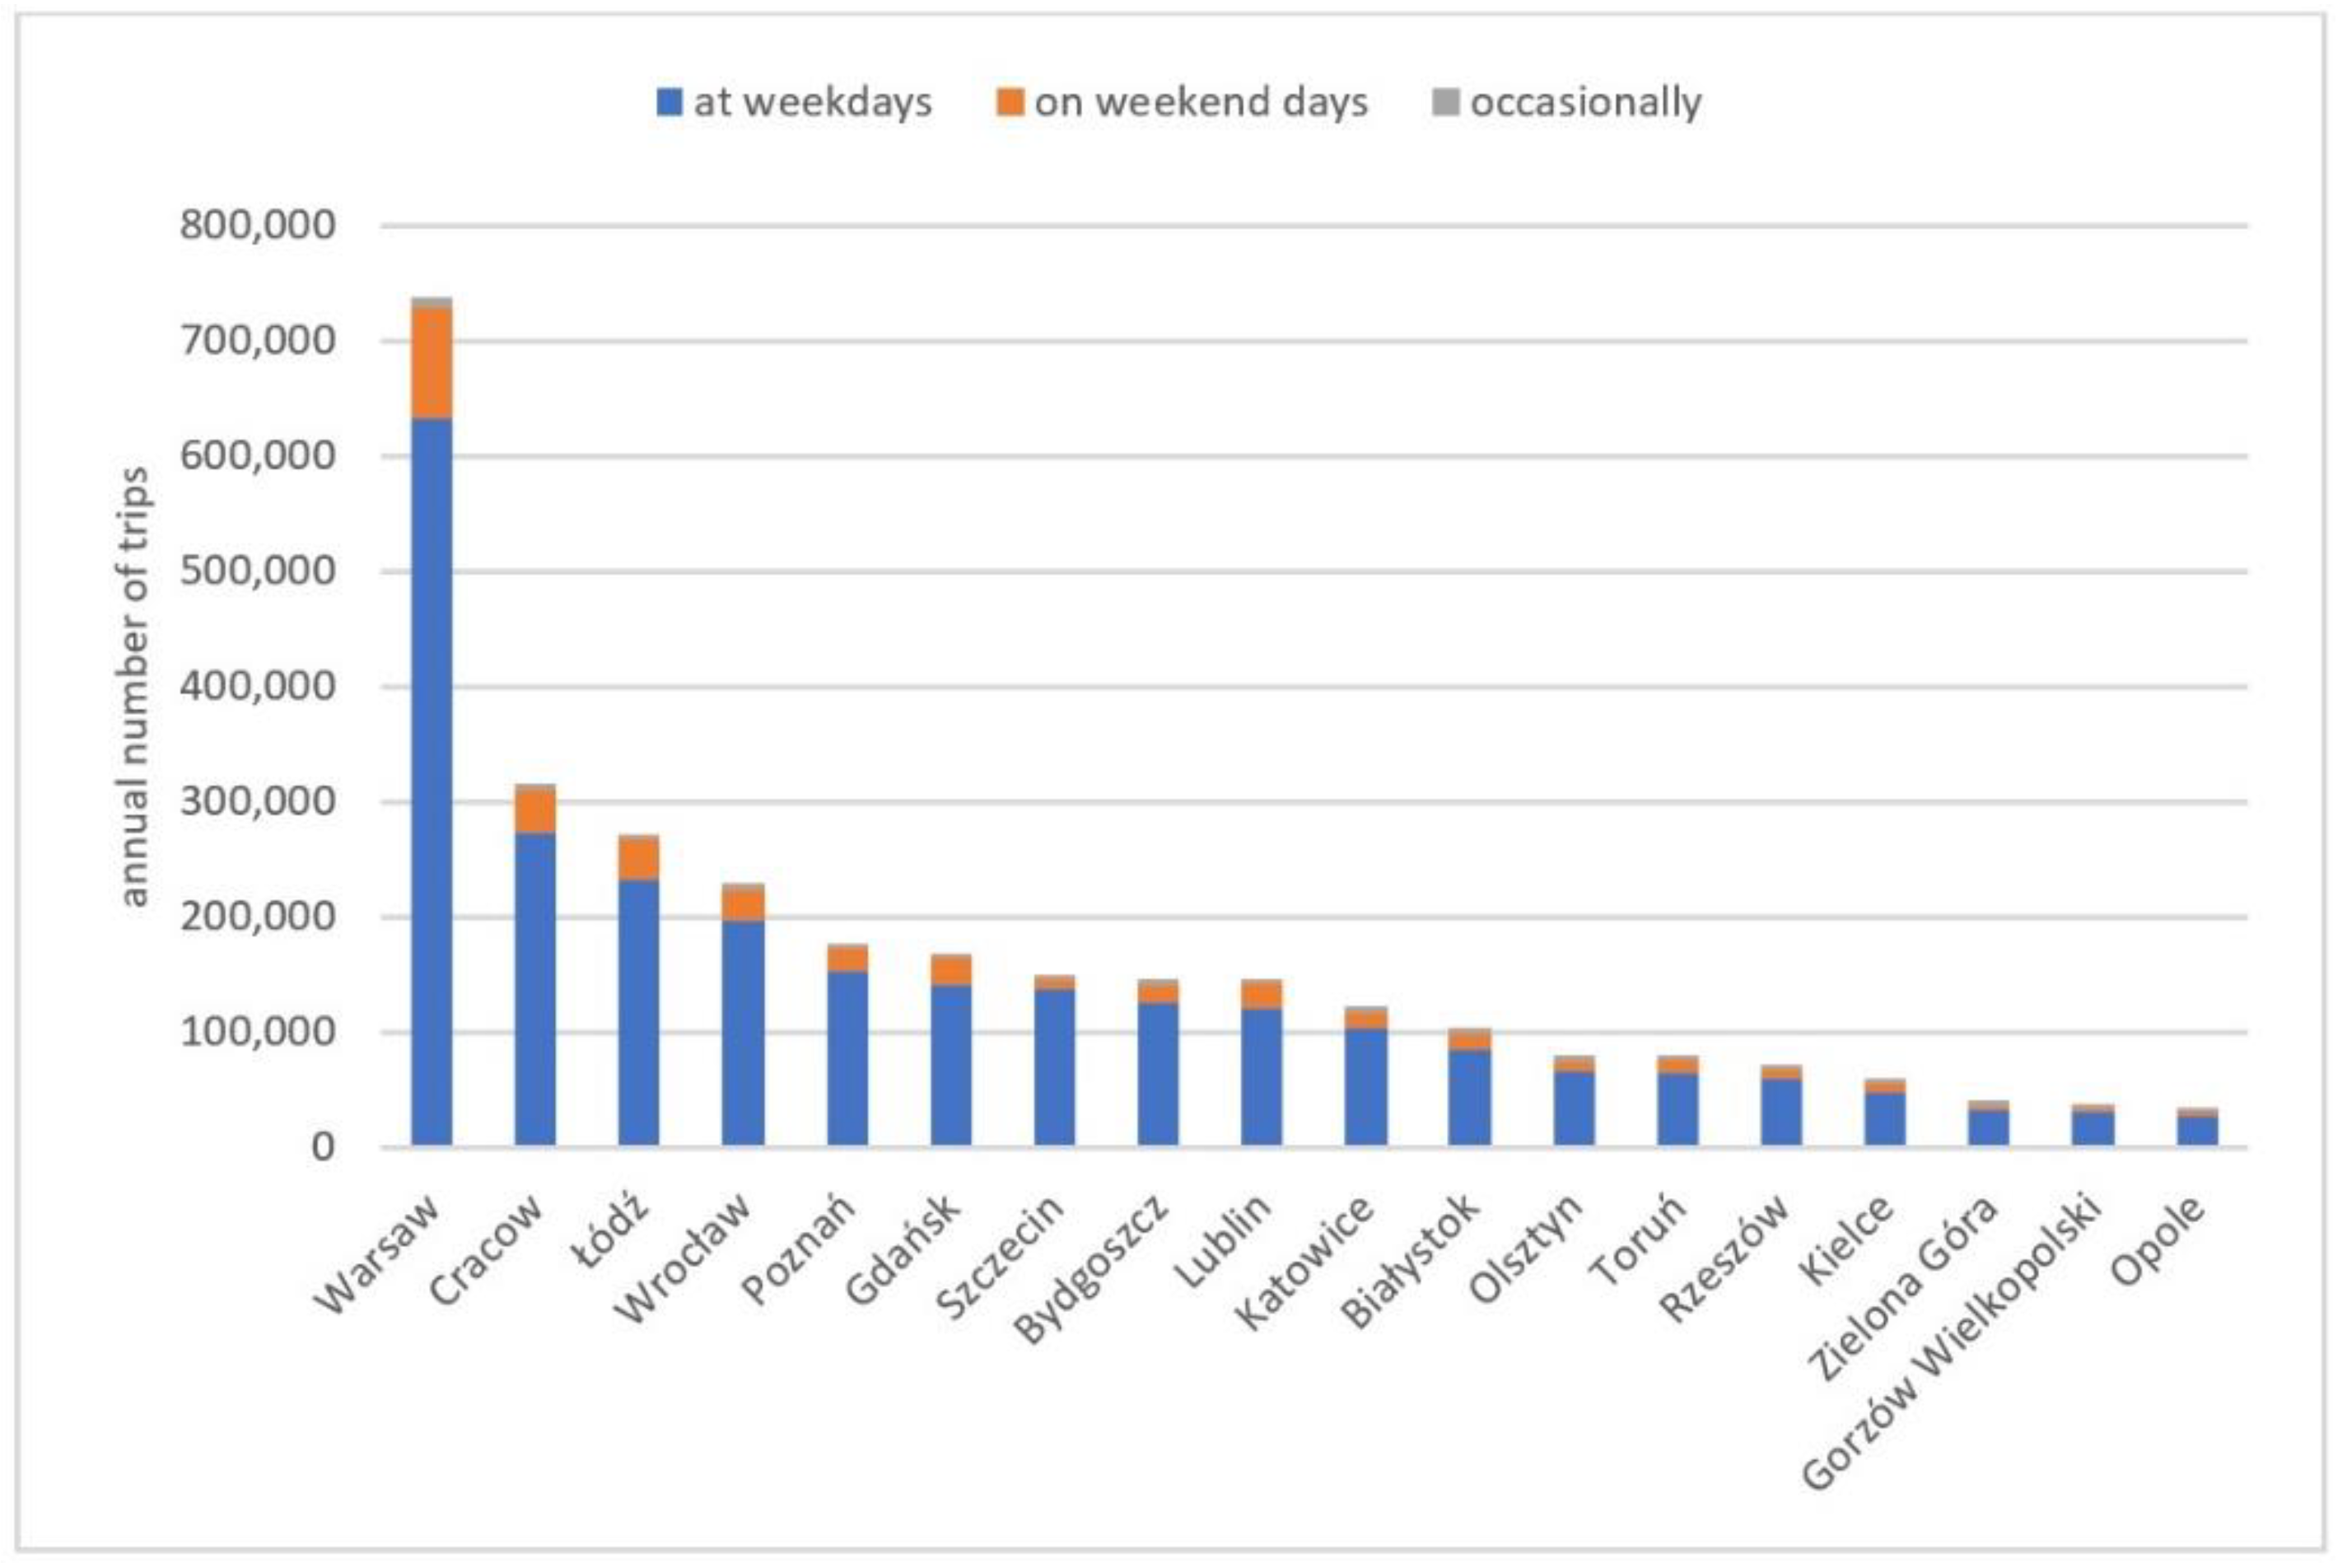
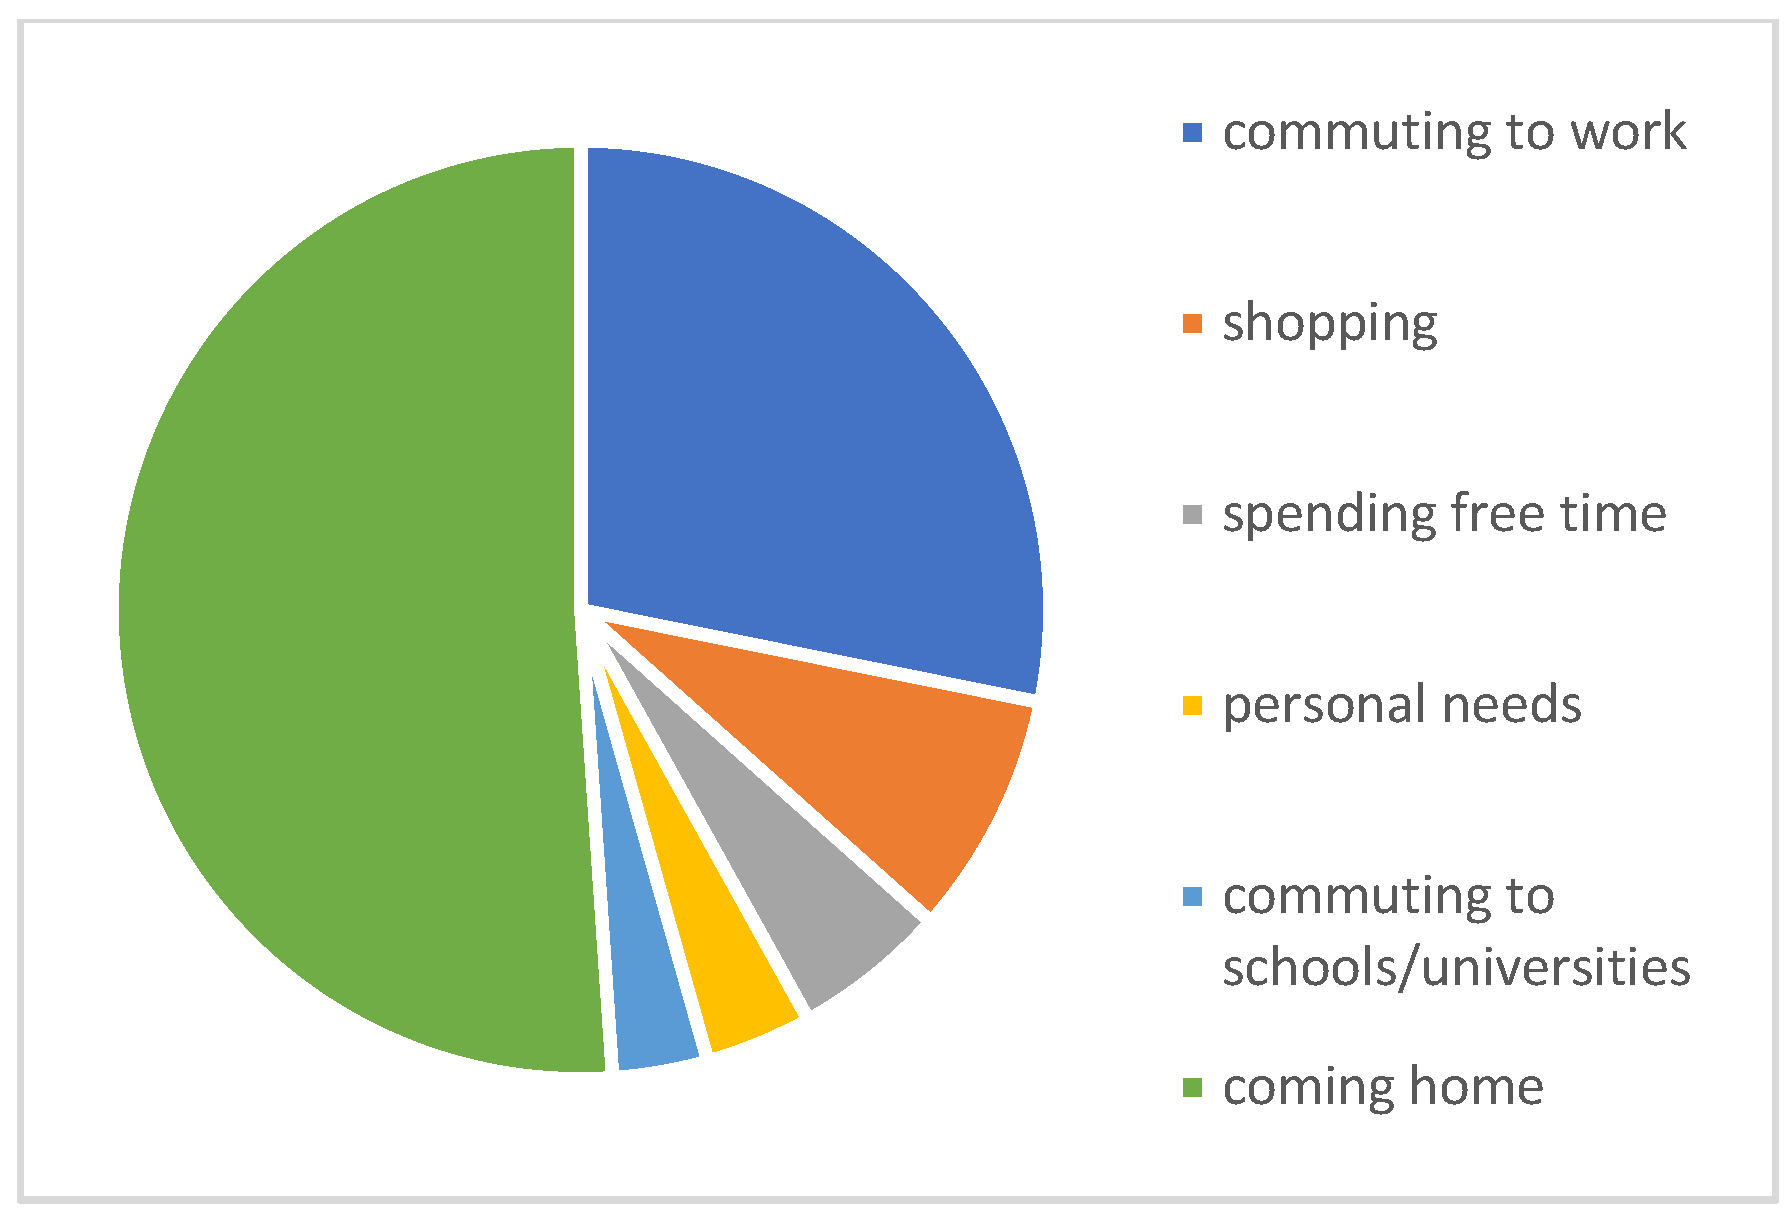
3.2. Short-Term Retail Restrictions Due to the COVID-19 Pandemic
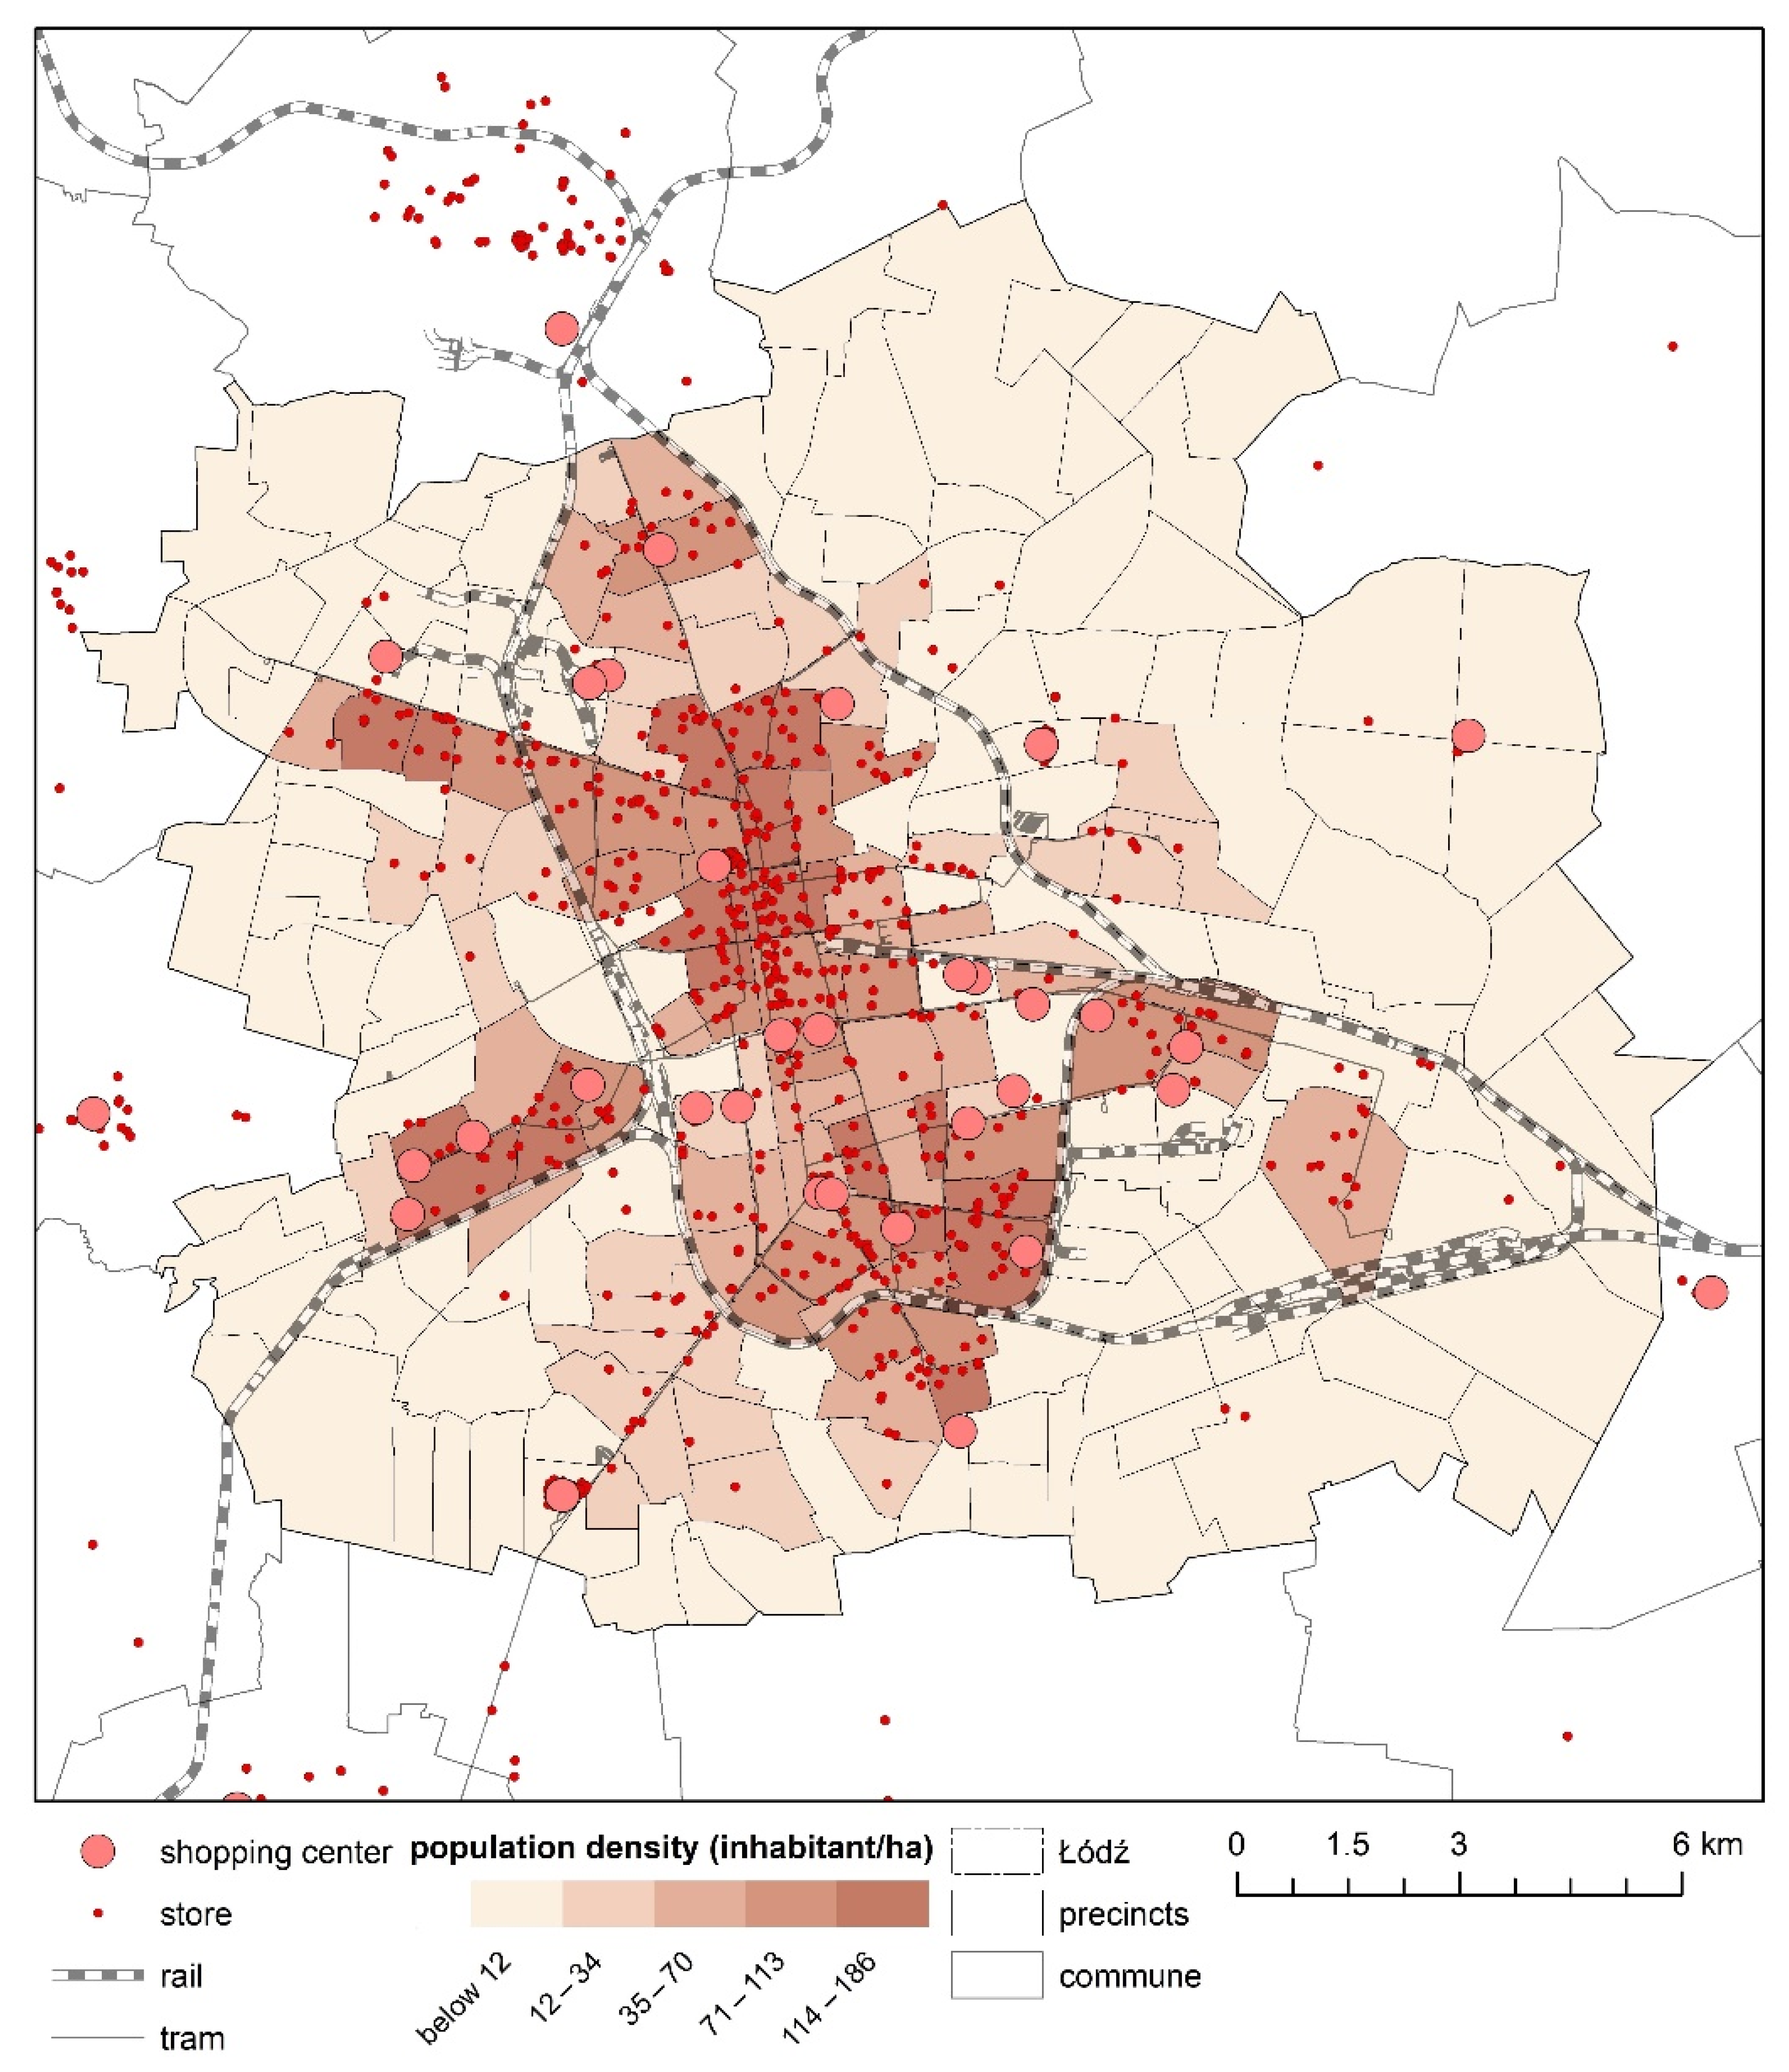
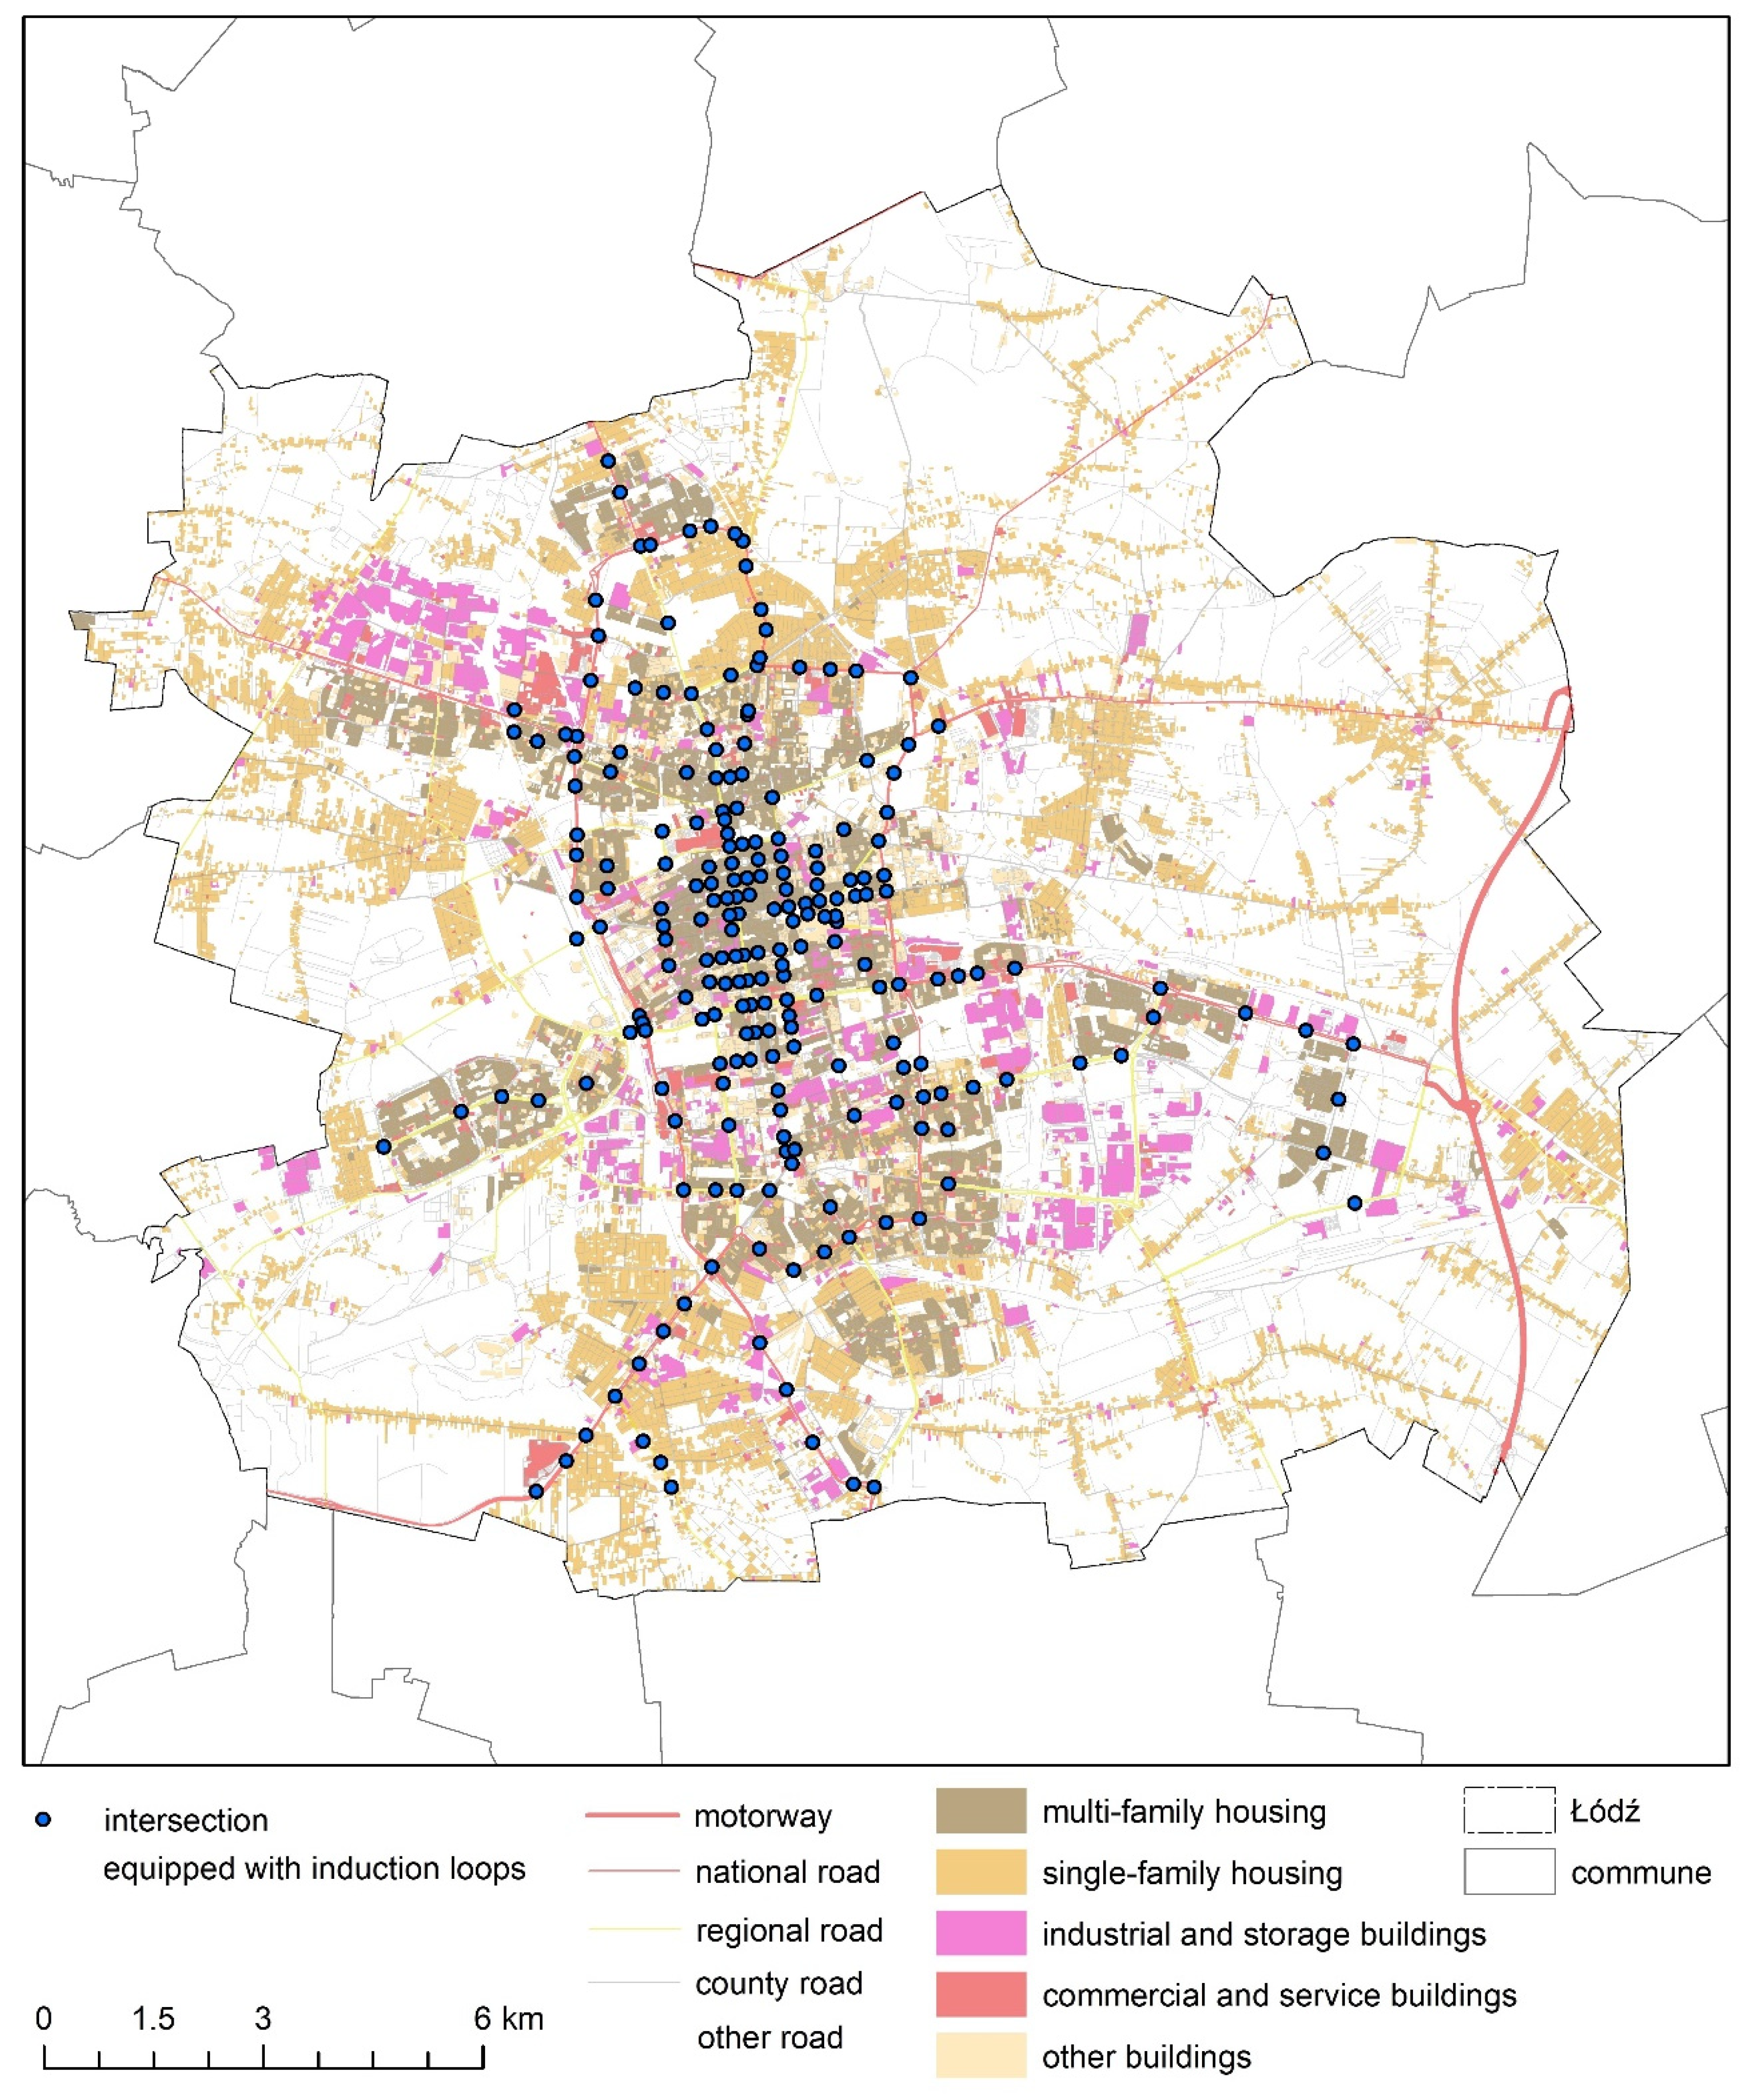
The COVID-19 pandemic has impacted nearly all aspects of people’s life due to the numerous restrictions and bans implemented by governments to curb the spread of the virus. This has particularly affected the retail trade [94,112], since the whole pandemic period has been marked by limited access to retail facilities—both individual shops and large shopping malls. Below, the authors present the chronology of retail restrictions related to the pandemic in Poland. The very first restrictions were imposed on 14 March 2020, i.e., 12 days after Poland’s patient zero was confirmed. They applied to all retail facilities, excluding grocery stores, laundries, pharmacies, and health and beauty retailers. Initially, retail facilities were supposed to reopen on 25 March 2020; however, due to the continuous spread of the virus, the ban was extended till 11 April 2020, and then until 20 April 2020. In addition, on 31 March 2020, the number of customers allowed in a shop was limited to three people per cash register, and ‘hours for senior citizens’ were implemented (10 a.m. to 12 a.m.), when shopping could only be done by customers over 65. Government announcements also obliged all customers to wear masks and disposable gloves inside the shop. The first softening of restrictions began on 20 April 2020—shops that offered up to 100 sqm of retail space per customer could serve four people per cash register, while larger stores were supposed to provide a minimum of 15 sqm of retail space per person. Stores in shopping centres and malls reopened even later, namely on 4 May 2020, and customers who visited them had to strictly comply with the principles of the sanitary regime. At this time, the hours for senior citizens were abandoned. However, the most important stage of lifting restrictions took place on 30 May 2020, when all customer limits were removed (except the obligation to wear a mask). This marked the end of the first and most stringent period of COVID-related retail restrictions.
Following a few months of relative stability, the pandemic situation became more dynamic in August 2020. Facing an increasing number of new infections, the government decided to introduce a regionalisation scheme at the county level, dividing Poland into three types of zones: red, yellow, and green. The classification was fluid and based on current pandemic statistics. In each type of zone, different restrictions remained in force, depending on the number infected in a given county, with the most stringent restrictions applying to counties in the red zone. Important for the retail trade, regardless of the zone, there were no substantial changes except for the obligation to keep a safe distance of 1.5 m and to wear a mask. On 10 October 2020, the whole territory of Poland was declared a yellow zone, where shoppers were obligated to disinfect their hands upon entry and use disposable gloves. Due to a dramatic rise in the number of new infections, on 15 October 2020, hours for senior citizens (10 a.m. to 12 a.m.) were restored, and stricter retail restrictions were imposed in red-zone counties. Namely, shops that offered up to 100 sqm of retail space per customer could only serve five people per cash register at a time, while larger stores had to provide a minimum of 15 sqm of retail space per shopper. In the face of the worsening pandemic crisis and the rocketing number of new cases, on 7 November 2020, stores in shopping malls were closed again (excluding grocery and DIY stores, pet shops, health and beauty retailers, and pharmacies). In shops that offered below 100 sqm of retail space per customer, one shopper per each 10 sqm could enter, while, in larger stores, the limit remained one customer per 15 sqm of retail space.
With the Christmas season approaching, the government decided to reopen shopping malls on 28 November 2020, provided they were in compliance with the strict principles of the sanitary regime and still observed the limits of retail space per customer. Additionally, the number of trading Sundays in December was increased from two (13, and 20 December) to three (6 December).
On 28 December 2020, Poland entered a period of national quarantine, during which all shopping malls were closed (with the exception of grocery stores, pharmacies, and health and beauty retailers). These restrictions were lifted only after New Year’s Day. On 1 February 2021, malls were reopened with customer limits sustained (one shopper per 10 sqm in shops that offered up to 100 sqm of retail space, and one person per 15 sqm in larger stores with retail space over 100 sqm).
The constantly increasing number of infections forced the government to reintroduce the regionalisation scheme, this time based on larger administrative units (provinces, not counties). On 27 February 2021, all shopping centres and malls in the Warmia-Masuria Province (northern Poland) were closed again, followed on 11 March 2021 by the Pomeranian Province (also northern Poland), the Masovian Province (central Poland, which includes the country’s capital city), and the Lubusz Province (western borderlands). Almost a week later, on 17 March 2021, a partial national lockdown was imposed, affecting retail trade throughout Poland.
Before Easter, safety regulations were retightened. All shopping centres and malls were closed (with the exception of grocery stores, health and beauty retailers, pharmacies, news agents, and bookshops), including large-format DIY stores with retail space above 2000 sqm, and customer limits were lowered again—one person per 15 sqm in stores below 100 sqm of retail space, and one person per 20 sqm in facilities above 100 sqm of retail space. These restrictions were only loosened in late April 2021, when regionalisation was reintroduced at the level of province (including the Łódź Province) before being gradually lifted from 4 May 2021.

4. Study Area

The research focuses on the city of Łódź, an area in central Poland that is particularly interesting for demographic, retail, and transport research, as has been proven by numerous studies including that of Wójcik’s [113], who showed that the contemporary structure of the settlement network in the province is the result of multiple changes during the industrialisation period. These mainly affected the size of the main cities, as can be seen in Łódź—the capital of the region, which has a ten times larger population than other towns in the administrative borders of the Łódź Province. What is more, the Łódź Agglomeration alone possesses half of the economic potential of the whole province [114].
Characterised by a relatively high population density, especially in the large housing estates of Retkinia, Olechów, Teofilów, Chojny, and Widzew, the city has a structure of retail network (Figure 1) that corresponds with its population density. This is particularly noticeable in the central and western parts of the city. As shown by Kowalski and Wiśniewski [115], Łódź boasts 15 shopping centres, which, according to the division applied by the Polish Council of Shopping Centres, are divided into 13 traditional shopping malls, 1 retail park, and 1 specialised retail centre. Traditional shopping centres are scattered around the city and are mostly located in the centre and along the axes connecting large housing estates.
Since the study herein focuses on induction loops in Łódź, the authors had to take into account the local road infrastructure and types of built-up development (Figure 2). The majority of loops are located in the Śródmieście district (city centre) and across other central parts of the city, and their distribution corresponds with the grid-shaped framework layout of roads in the city centre, which becomes gradually more disharmonious the farther out one goes. With regard to built-up development, the highest concentration of loops can be observed in residential areas, especially in housing estates consisting of apartment blocks. The transport axes of the city are streets and avenues of national and regional roads running longitudinally and latitudinally. Another factor that determines the city’s accessibility is the network of expressways and motorways which form an unclosed ring road [115].
In Łódź, 79.3% of trips are taken by motorised transport, including 42.4% by private car, and 35.3% by mass transit. As for passenger–kilometre ratio covered, this percentage (trips taken by motorised transport) is 94.4%, including 54.9% for passenger car, and 28.4% for mass transit.
A Pilot Survey… [116] showed that Łódź is the third biggest city in Poland when it comes to the number of trips (Figure 3), following Warsaw (the country’s capital) and Cracow (one of the oldest cities and a former capital). In terms of frequency, the structure of trips in Łódź is obviously dominated by journeys taken on weekdays, while weekend trips amount to nearly 10% of all journeys (Figure 4), which is similar to other big cities in Poland (excluding Warsaw, where the values are higher, but also incomparable, mainly due to the dominant administrative function of the capital city).
Moreover, when compared to other capitals of provinces, Łódź has the lowest average distance for shopping trip per person, which means that, in the researched area, the highest traffic density is generated by shopping trips (Figure 5).
The structure of annual car mileage in Łódź is dominated by very long (>300 km) and short (11 to 20 km) journeys. Over 47% of the mileage done by Łódź residents in cars are local trips (Figure 6).

5. Materials and Methods
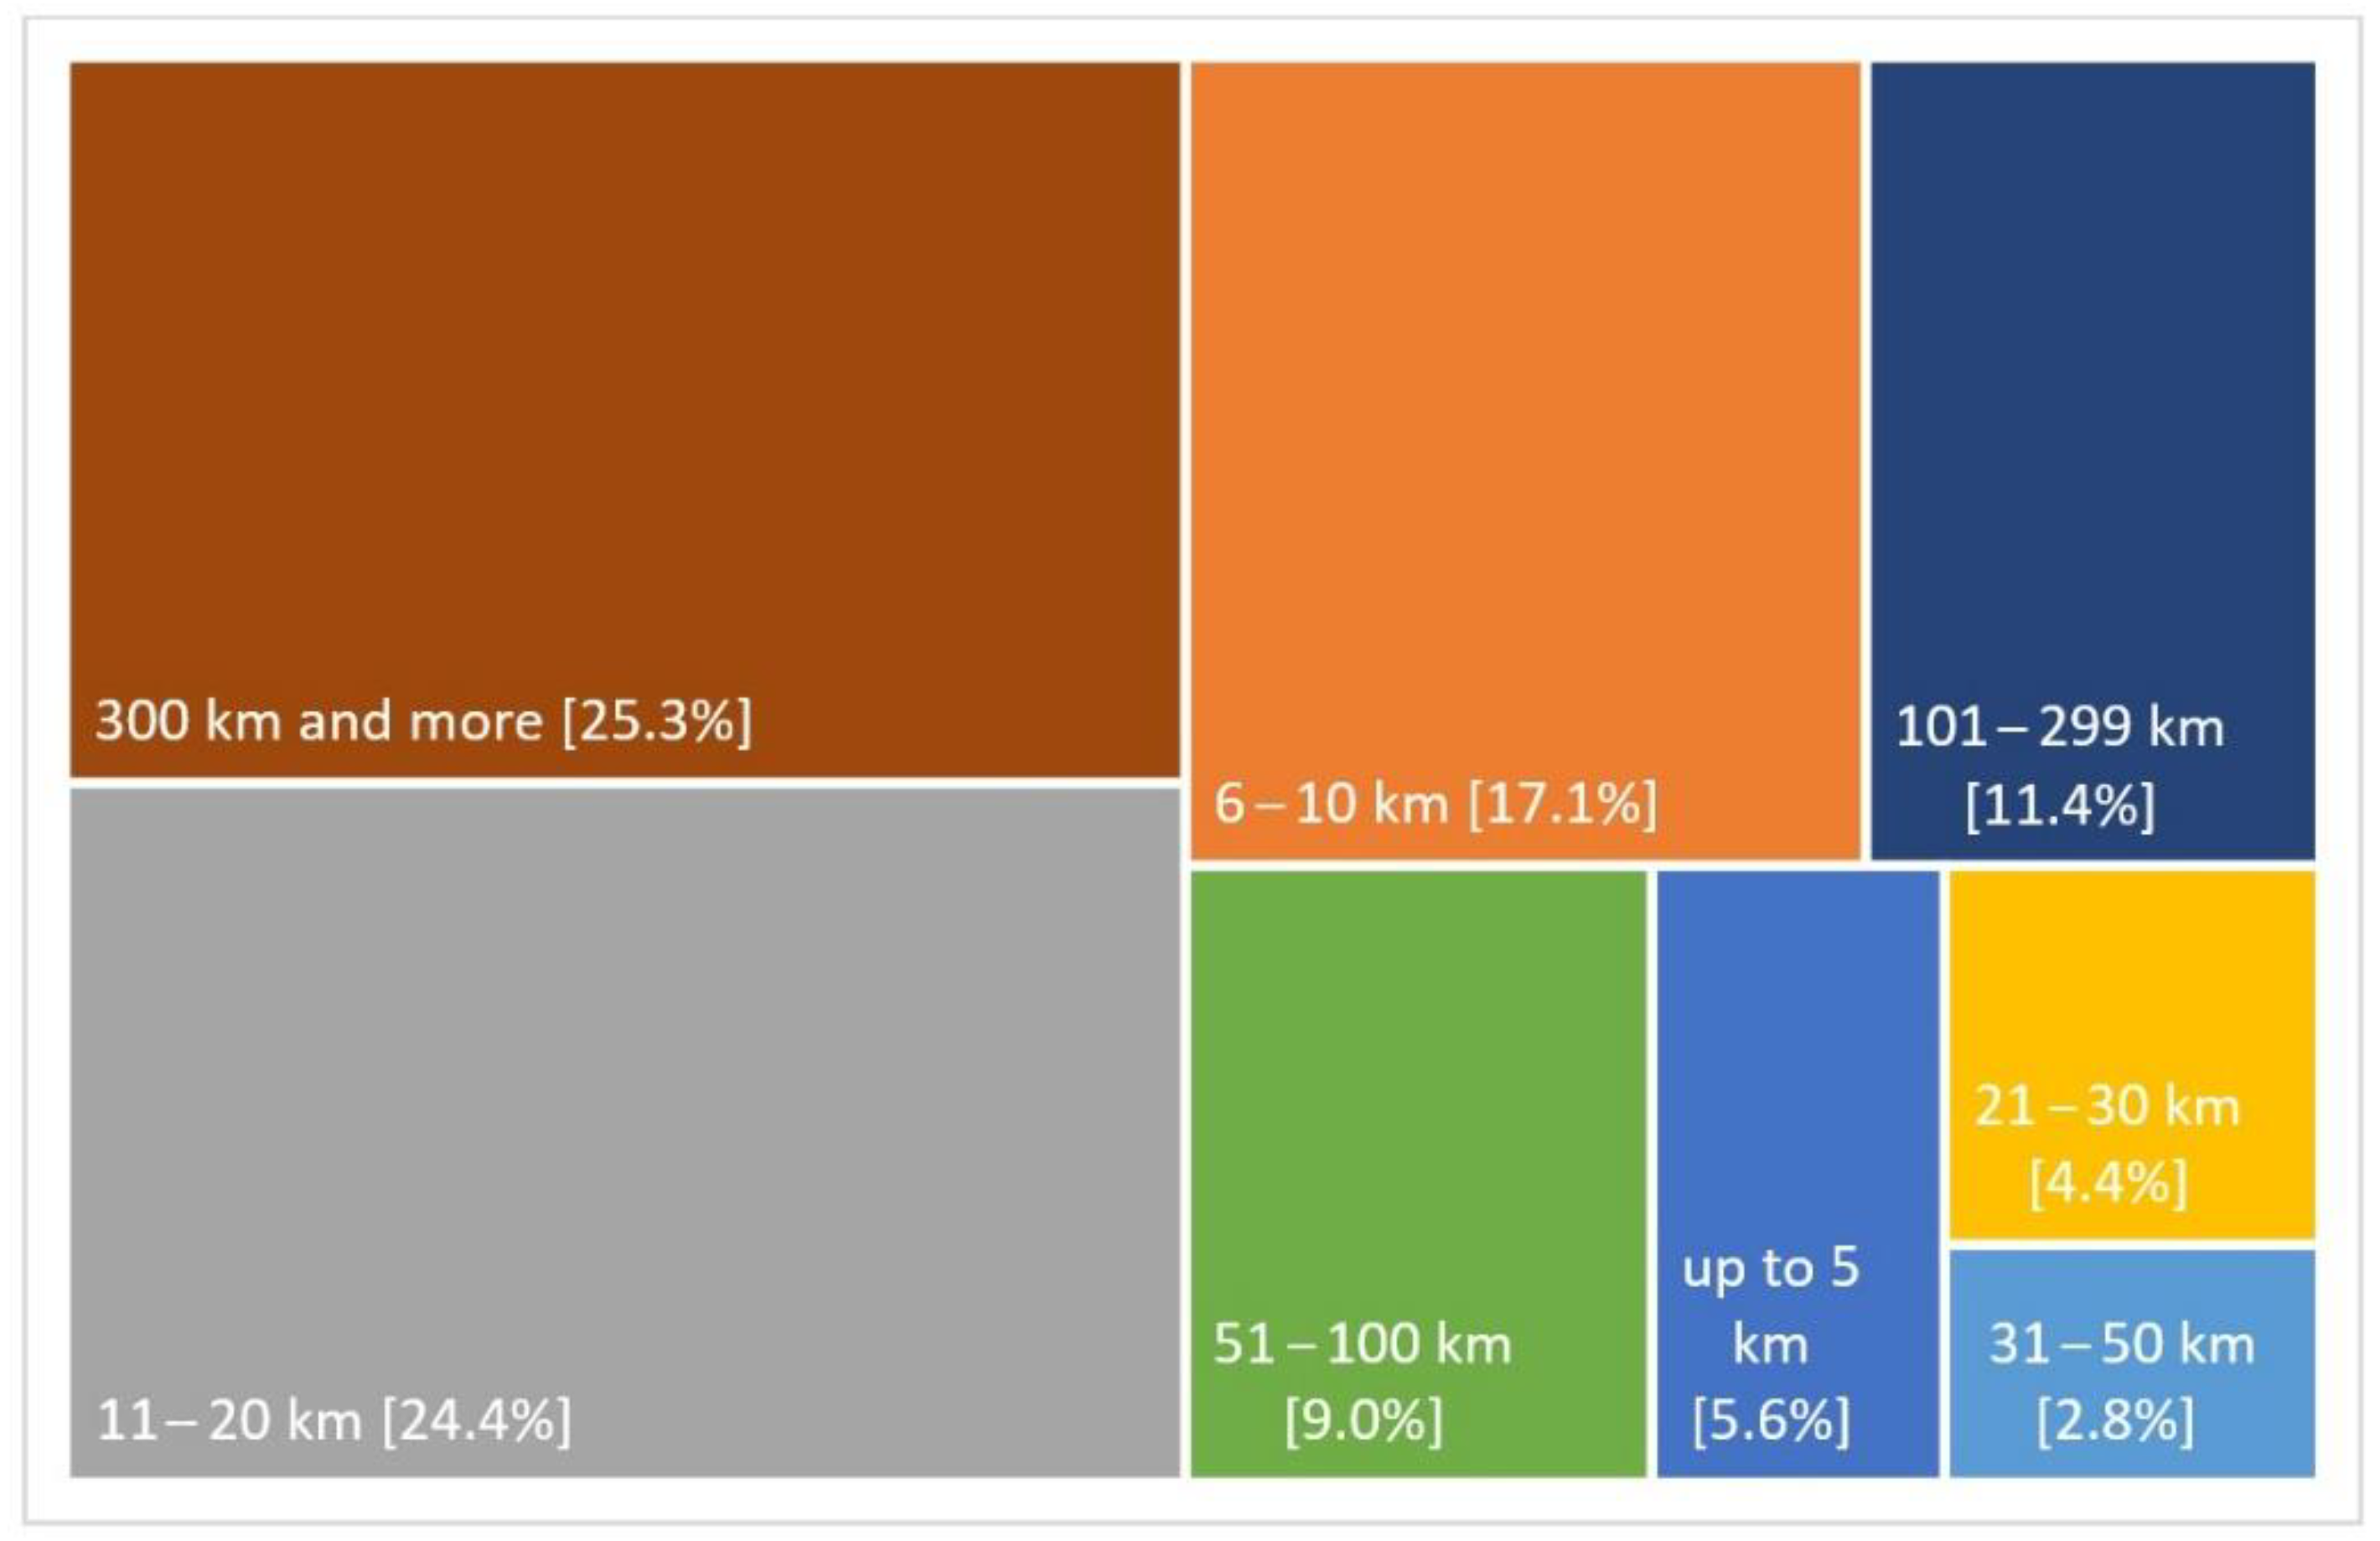
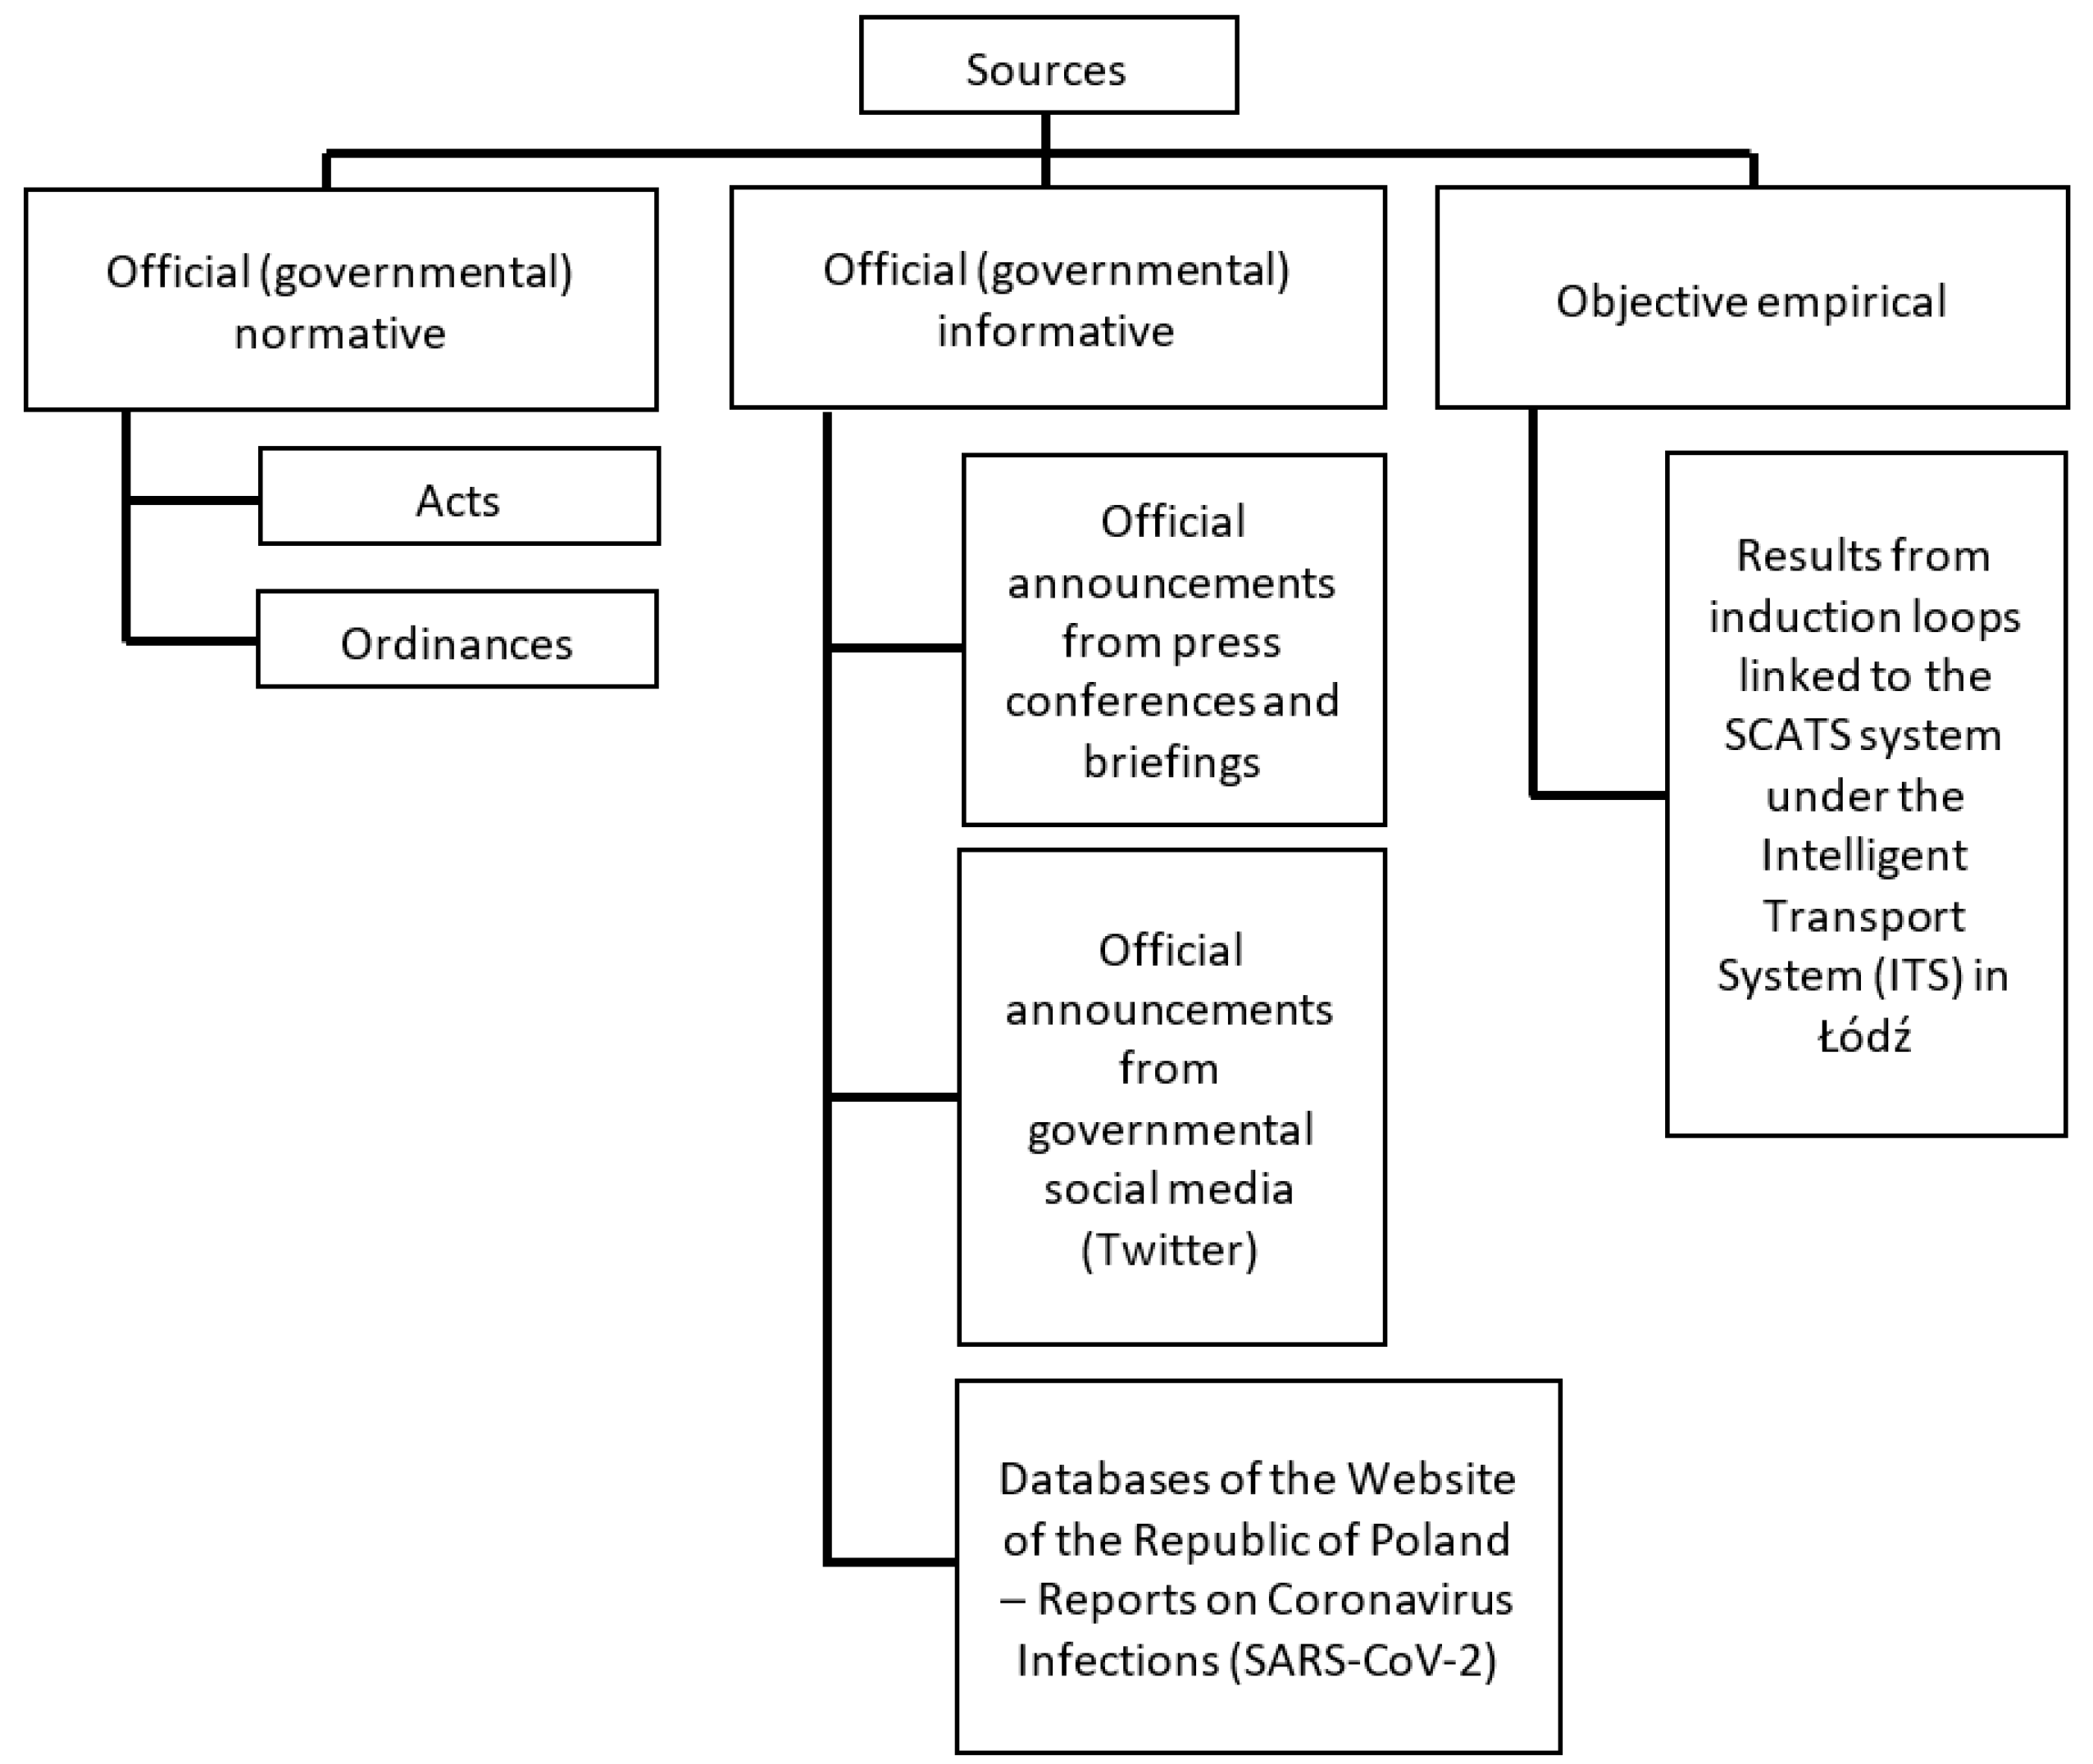
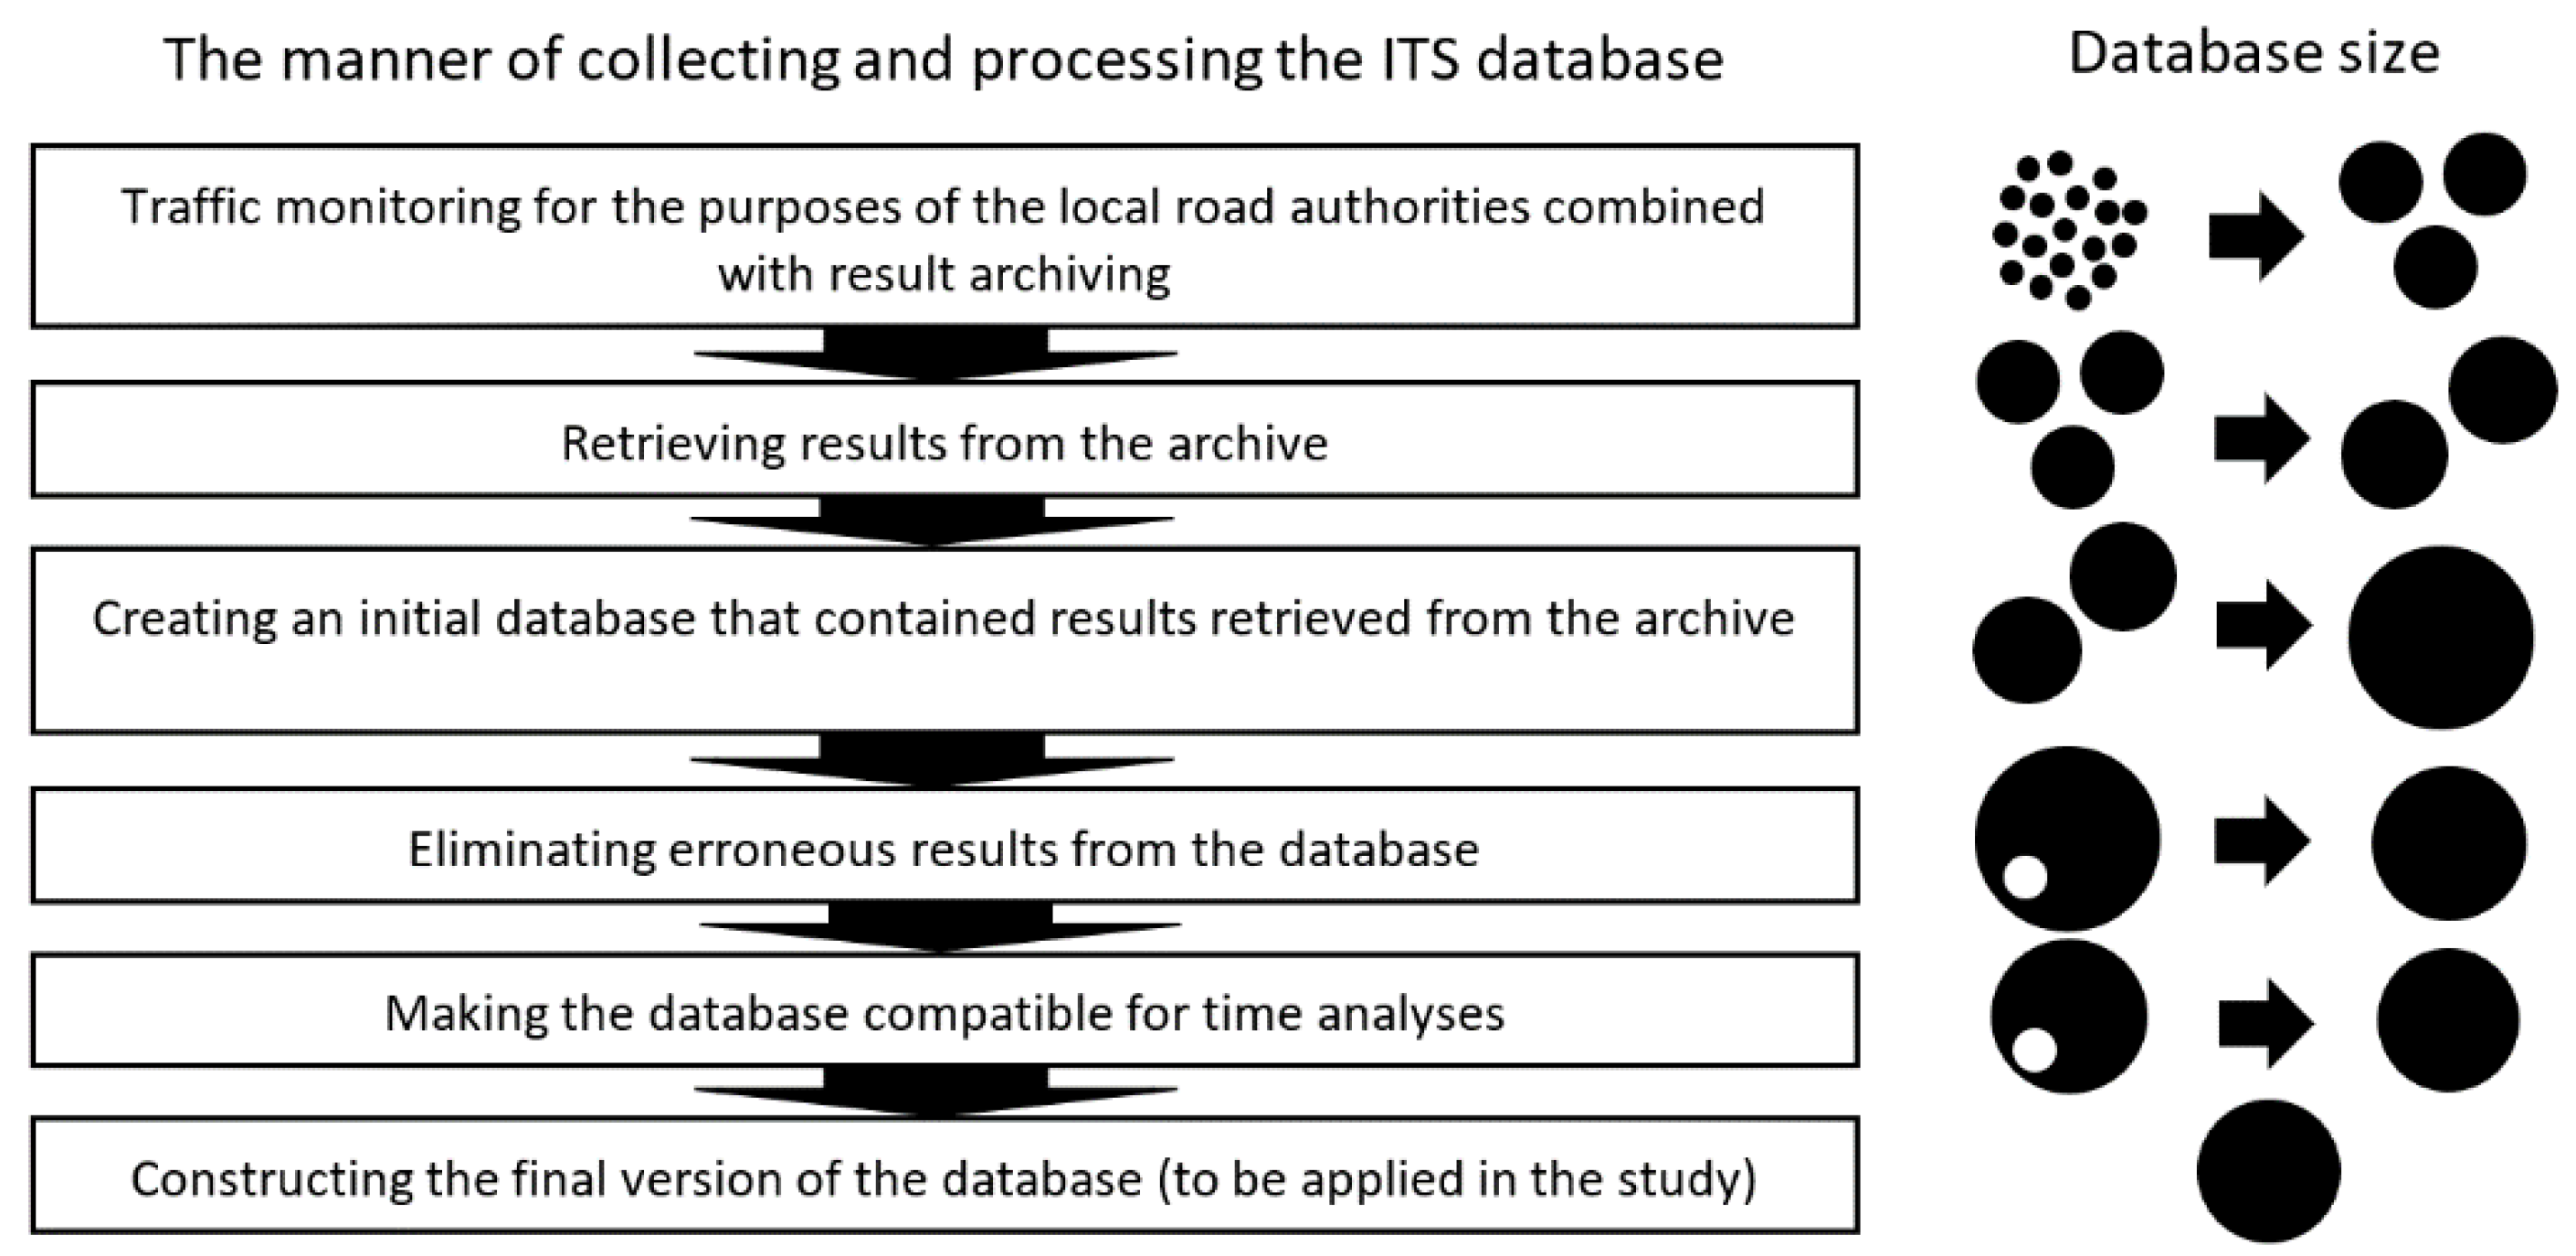
5.1. Materials

The source data used in the study can be divided into three classes (Figure 7), the first being normative data, based on official acts and ordinances applicable nationwide (Poland is a unitary state) and containing information on the type of restrictions, their territorial scope, and chronology. The second class (official informative data) is based on information that was used for two major purposes—the analysis of time periods between public announcements on restrictions and the date when they entered into force (usually after a few days) and the juxtaposition of pandemic-related variables (number of infections, hospitalised patients, people in quarantine, and deaths due to COVID-19) against measurements that determine mobility. Even though the applied variables are not faultless [117], they must be assumed to be objective, since, on their basis, specific steps have been taken to implement various restrictions; moreover, due to the lack of other data, these variables constitute criteria used to illustrate the scale of the pandemic to the public.
The third class of sources are results of empirical measurements conducted by induction loops of the ITS in Łódź [118], collected between 2016 and 2021. These data have features that enable them to be classified into Big Data sets [119] and be used in geographical and traffic engineering studies [115,120]. Due to the archiving method applied by the data administrator (the City of Łódź) and the type of detectors and their network, the obtained data had to undergo a series of verification procedures before they could be used for the purposes of this study (Figure 8).
The aforementioned procedures and (Figure 8) individual stages were as follows: During the first stage—conducted automatically by the SCATS system—, traffic was monitored continuously (measurements taken by detectors of induction loops) in 15-min intervals and 24 h per day for each lane within all intersections monitored by the system. Next, the results were archived by the local road authorities and could be exported as tables with measurements at 15-min intervals for each induction loop installed within a given intersection (the database allows exportation of a single data file for one intersection) in a given year. The next step was to combine the observations from all dates into one database. During the next stage, a series of separate files retrieved from the archive were combined into one coherent database. Then, erroneous records were deleted: firstly, any results directly indicating an error were removed (data: ‘DA’, ‘BAD’, and ‘-’); then, all records indirectly containing erroneous information were erased (e.g., the number of vehicles that travelled through an intersection within a 15-min interval exceeded the sensical capacity of a given lane in free flow traffic conditions). The next stage was a step necessary due to the fact that the analysed data covered a long period of time during which the road network was being modernised (e.g., lanes on intersections were added or removed) and the ITS system increased its scope of operation (a broader range of monitoring). In order to avoid the effect of excessive cumulation of vehicle numbers in records taken by a constantly expanding network of detectors, the authors decided to narrow the research area only to those intersections and detectors from which records were available throughout the whole analysed period. The final version of the database contained information on a given intersection and lane, as well as date, hour, and results of the measurement (taken at a 15-min interval). This procedure was applied so that new data (coming from the developing system) or erroneous data did not distort the picture in the period-to-period comparisons.

5.2. Methods

The databases prepared for this study were research material that allowed the authors to ‘search’ for the changeability of the load of the urban road network in time and space, which accompanies the implementation of permanent and short-term retail restrictions. Changeability in time was analysed first. For each researched year, the average number of vehicles was determined based on the ITS measurements taken at 15-min intervals for each day of the week. Years 2016 and 2017 (no retail restrictions) were incorporated as ‘points’ of reference. They allowed the authors to determine how transport behaviour (at least the one affecting traffic distribution in the city) changed in the following years, when retail restrictions became more and more stringent. For years with retail restrictions, the authors additionally averaged the aforementioned time aggregates (15-min intervals, days of the week), applying a division into weeks with trading or non-trading Sundays. In order to analyse the spatial dimension of the changes in question, the average weekend traffic volume for weeks with and without retail restrictions on intersections monitored by the subsystem of induction loops (illustrated with a pie chart) was superimposed on the map of the road network in Łódź. This allowed the authors to establish the average number of vehicles and the fluctuations between weekends with and without a trading Sunday on the individual nodes of the network.
A similar approach was applied to analyse correlations between the load of the road network and short-term retail restrictions related to the COVID-19 pandemic. Time changeability was studied by superimposing—on the time axis illustrating the period of the pandemic in Poland (represented by days of the week characterised by a specific image of traffic distribution in time—Monday, Tuesday–Wednesday–Thursday, Friday, Saturday, and Sunday)—the following variables: the number of vehicles recorded by the ITS on a daily basis during the pandemic; the number of vehicles recorded by the ITS during the corresponding period a year before; the period of restrictions related to shopping; and the period of religious and public holidays, which are statutory days off. For the purpose of identifying and analysing possible spatial changes in the load of the road network, the whole city was divided into eight concentric research areas, constructed around the Urban Core Zone of Łódź, which was nominated as research area no. 1. Other ‘districts’ were created by assigning the city’s sections with different degrees of vicinity to the Urban Core Zone. Sections that shared the same degree of vicinity were classified as a single research area. Next, for each area, the authors identified the location of loop detectors within its borders, and then, on the basis of the results obtained from the network of sensors in a given area, they determined the volume of road traffic for the period when each type of retail restrictions remained in force and for the corresponding period a year before. This enabled the authors to present percentage changes in the volume of road traffic for different areas of the city when compared to a ‘regular’ period for each of the analysed cases.
The main limitation of the study lies in the data component itself. First of all, the data on vehicle flows shows traffic density monitored at access points, i.e., entrances to intersections that have limited capacity. In consequence, the temporal (15-min intervals) representation of traffic density on the road network only shows the amount of traffic that could travel through the intersection during a given interval. What is more, the ITS data illustrate all traffic without specifying trip motivations, which means that researchers must be very careful when drawing conclusions on the impact of retail restrictions on traffic volumes.

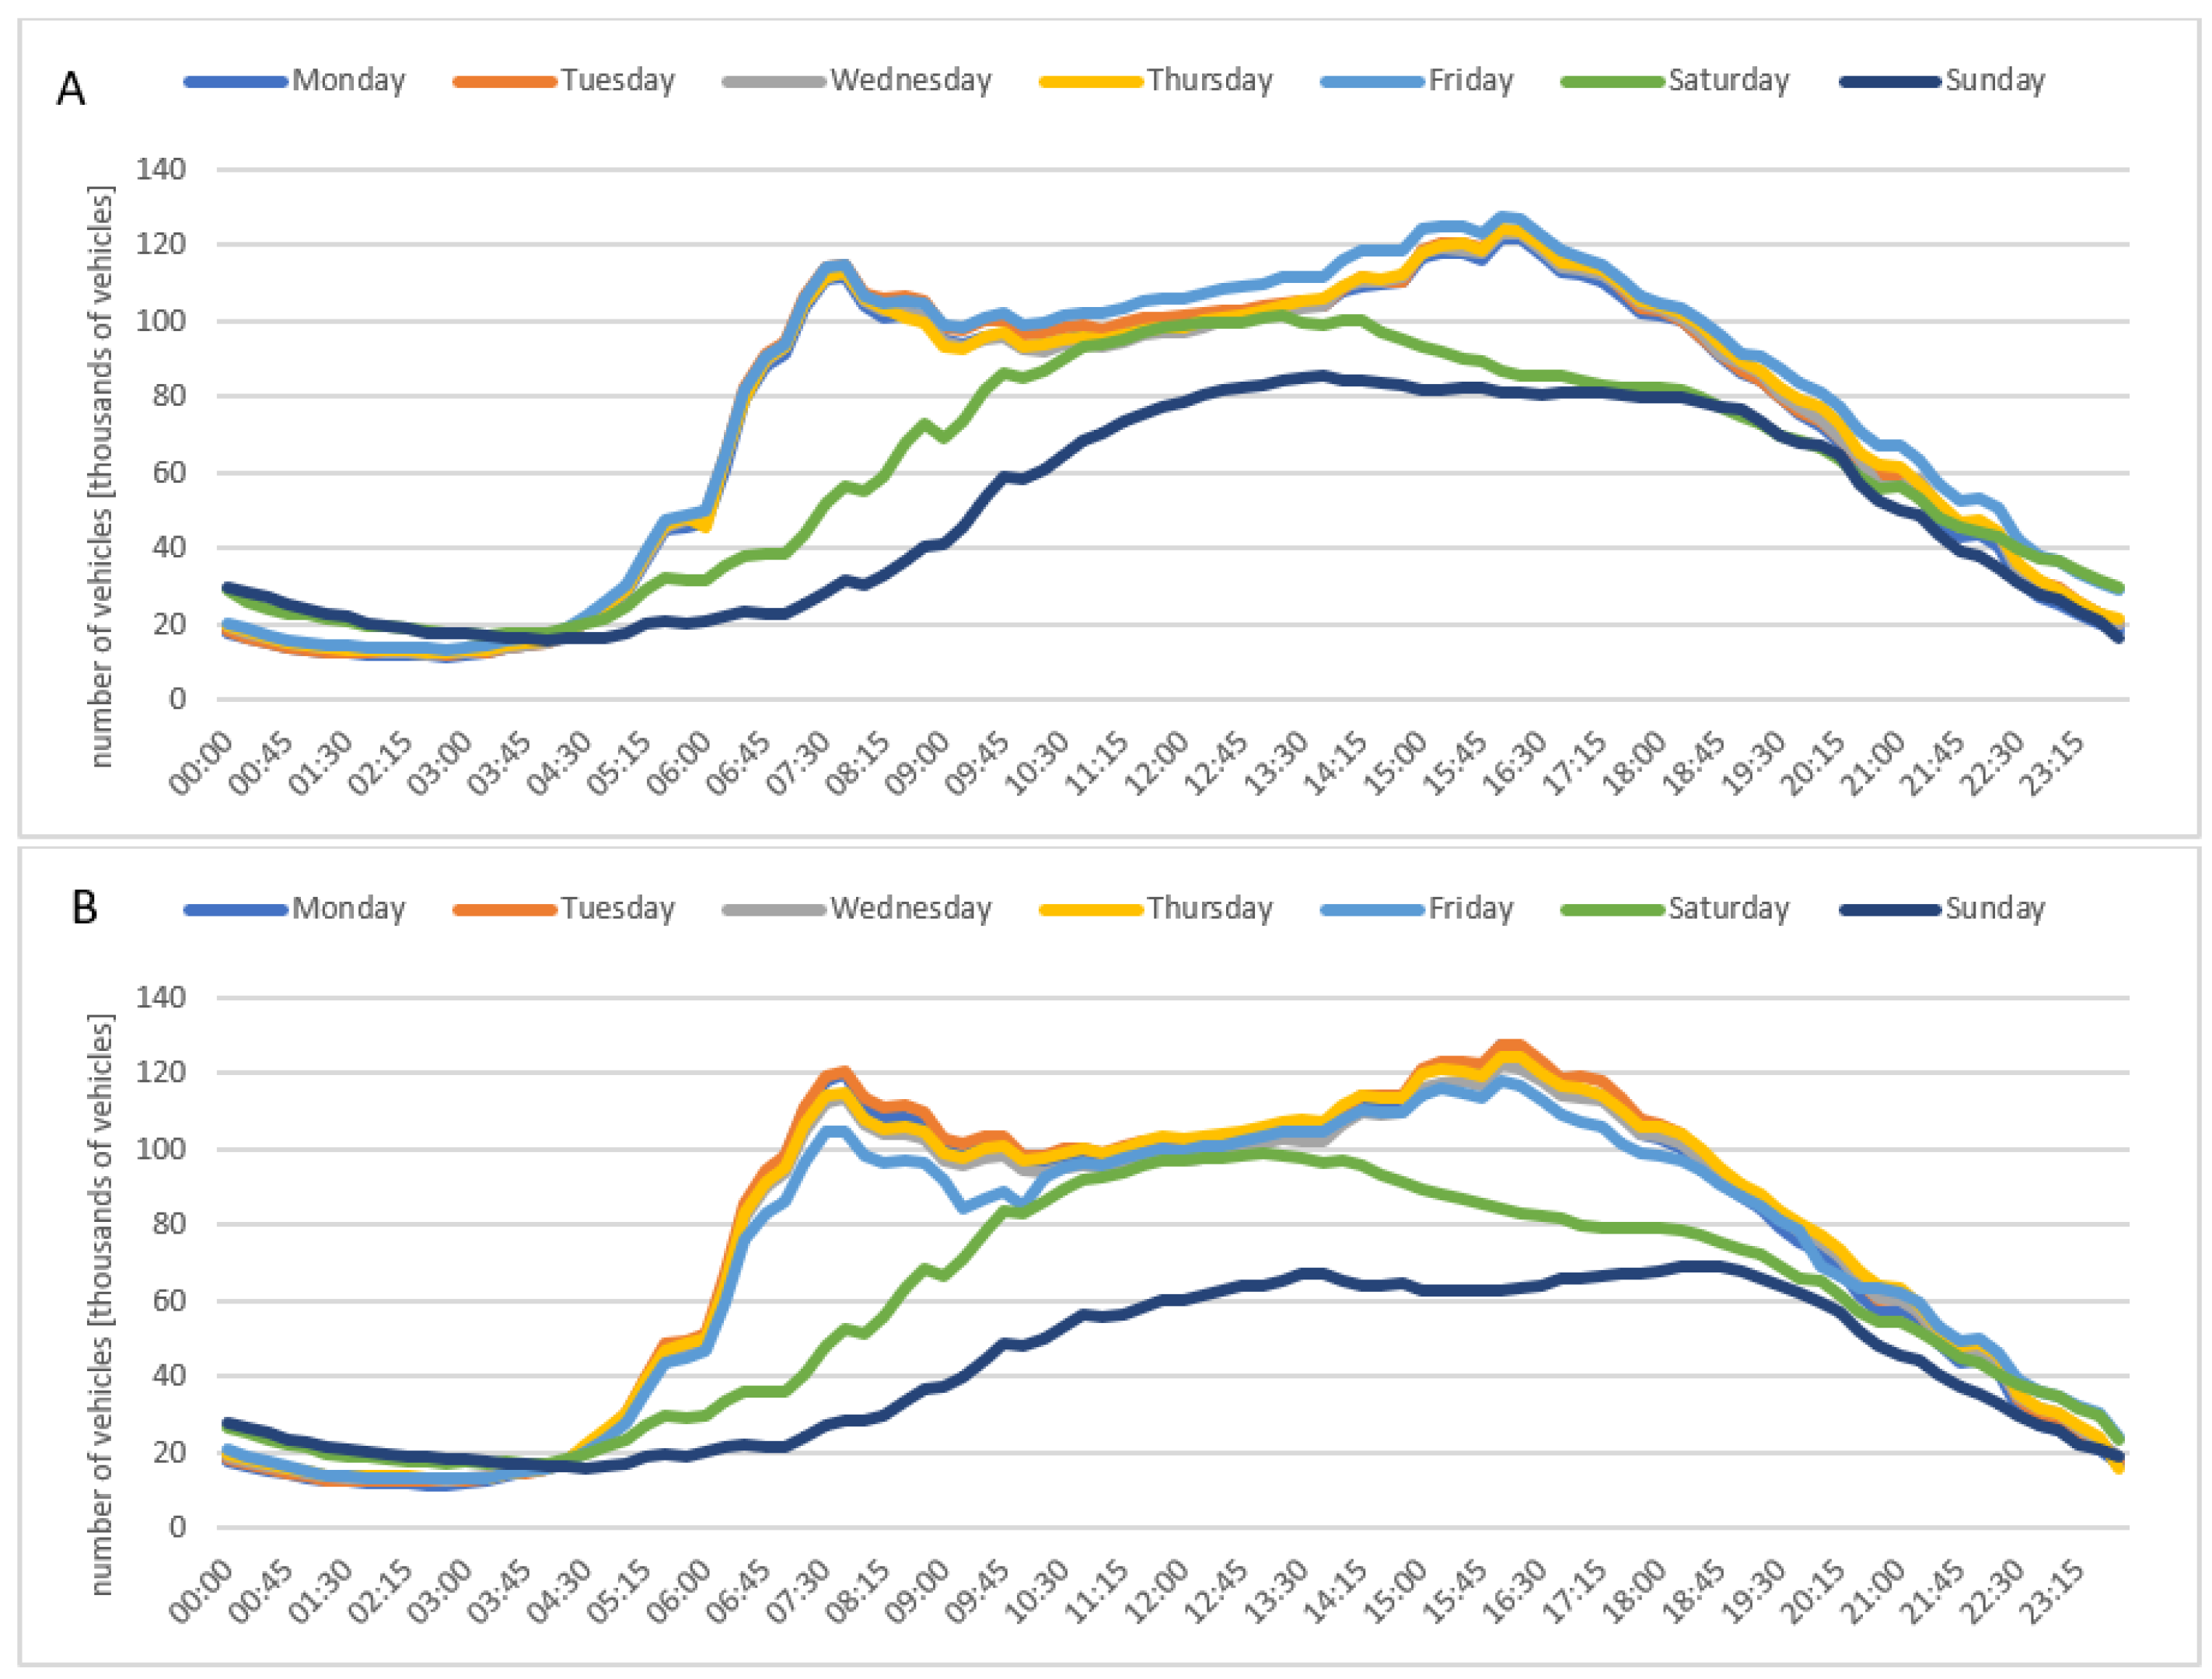
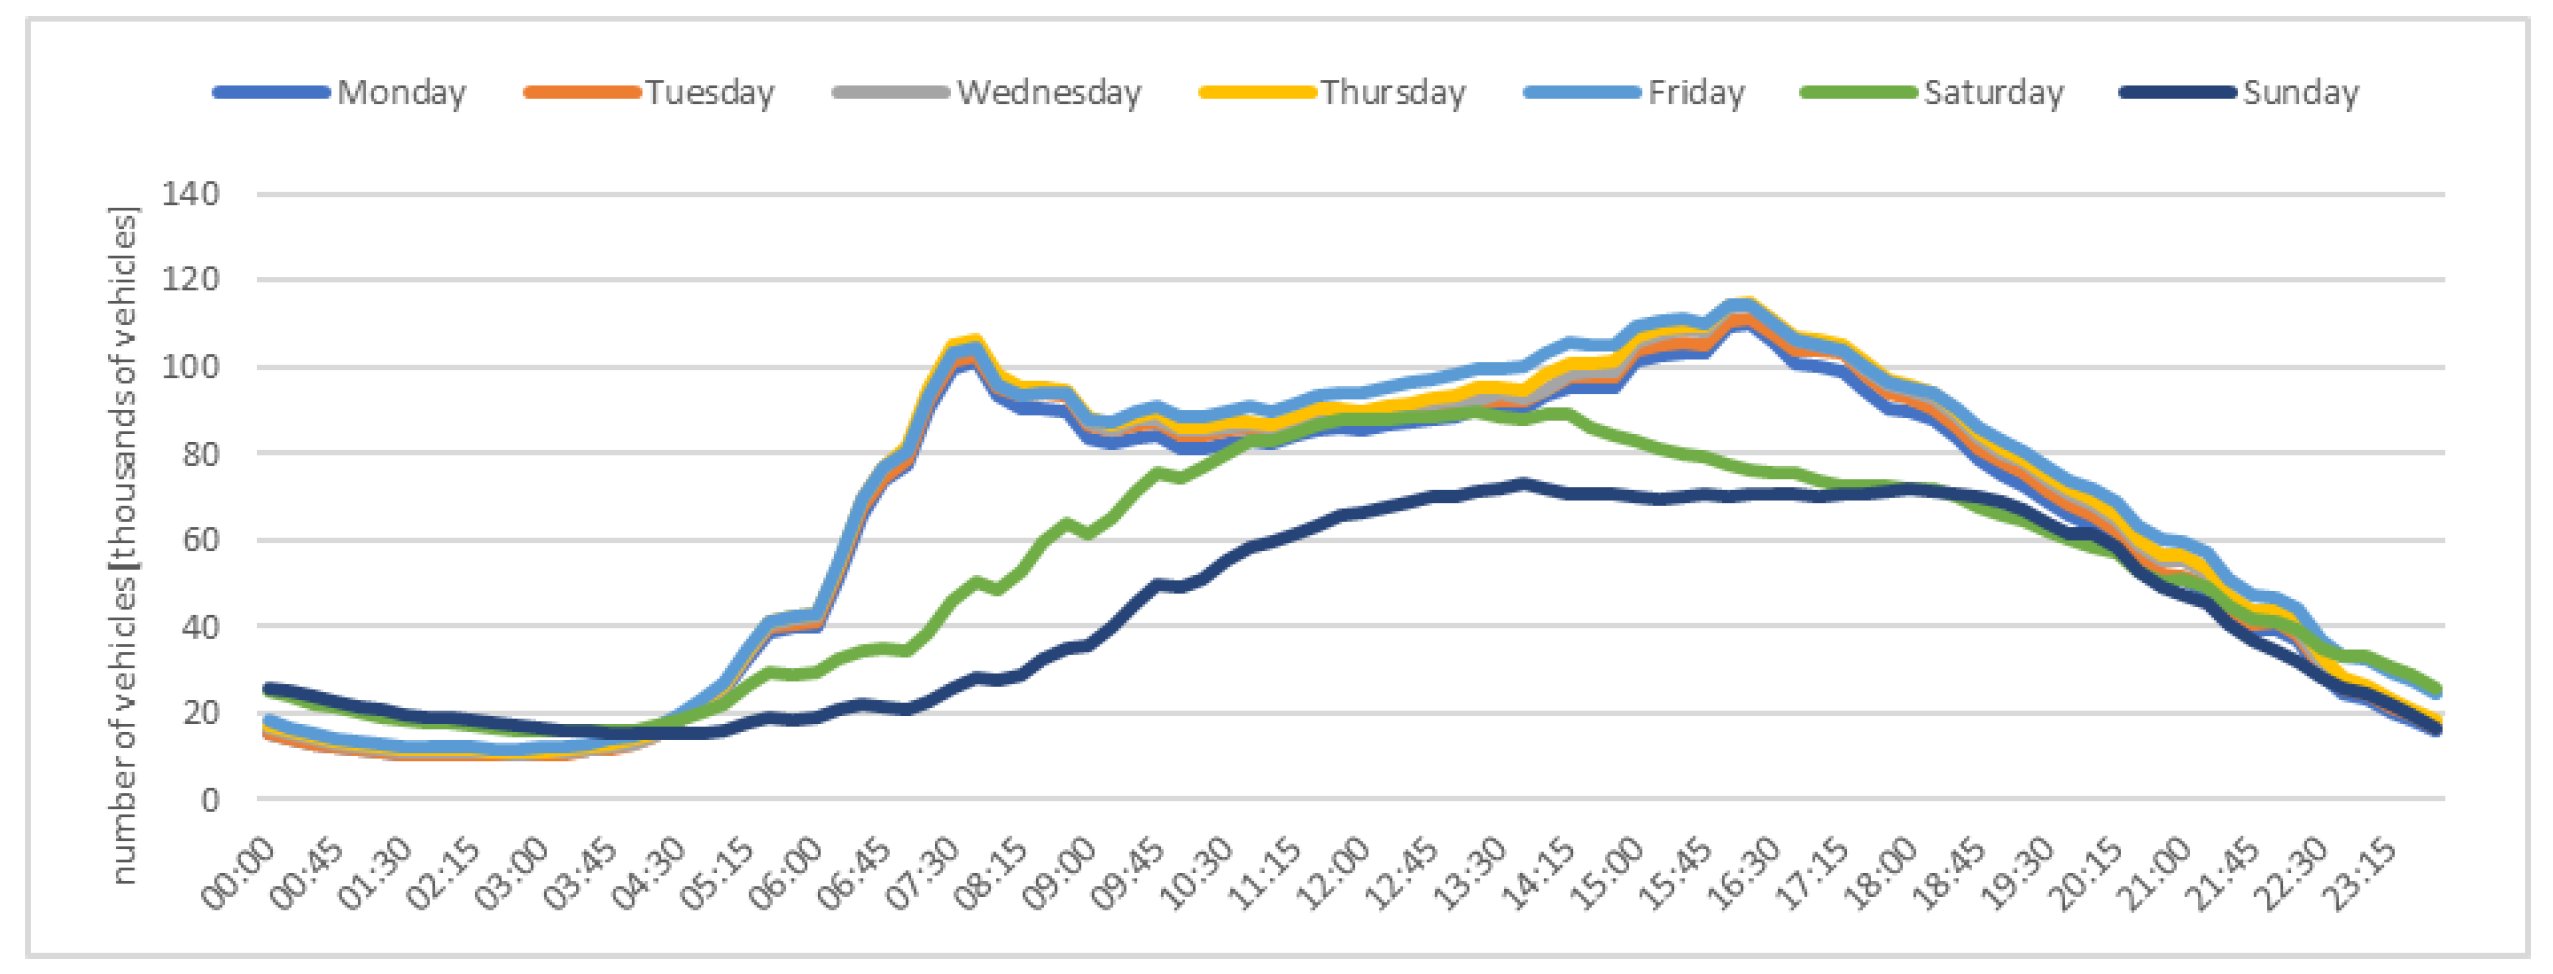
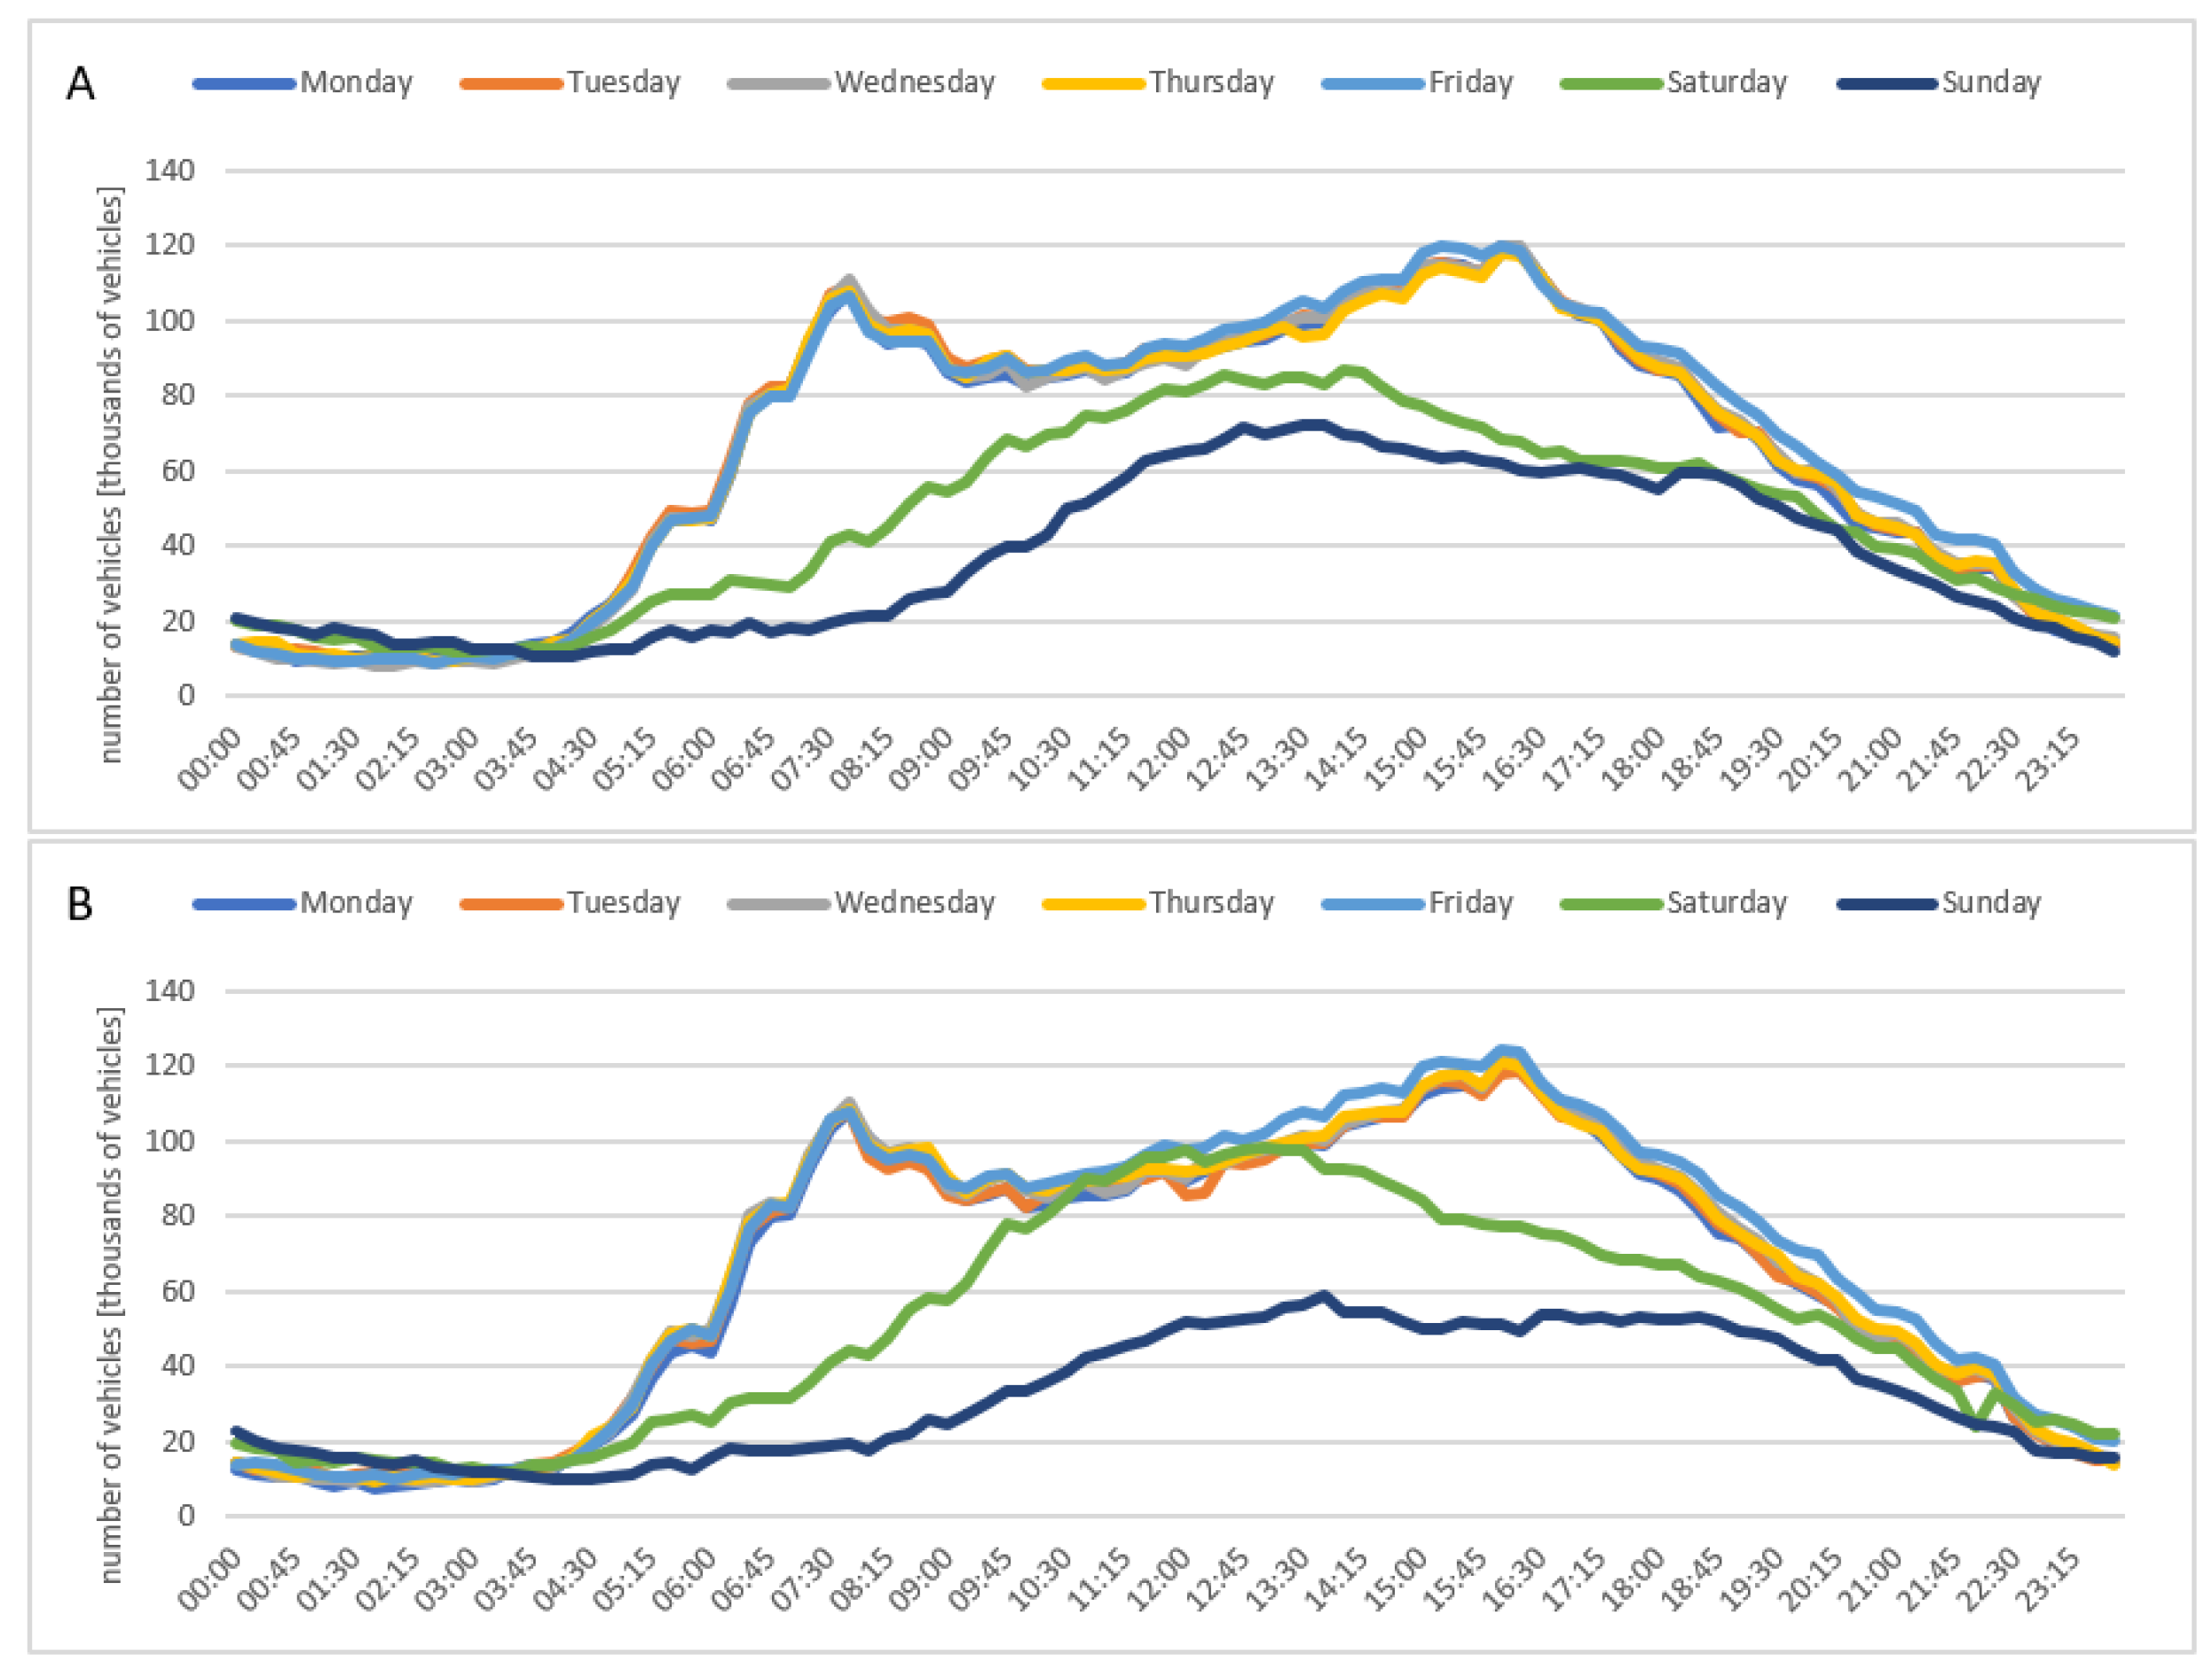
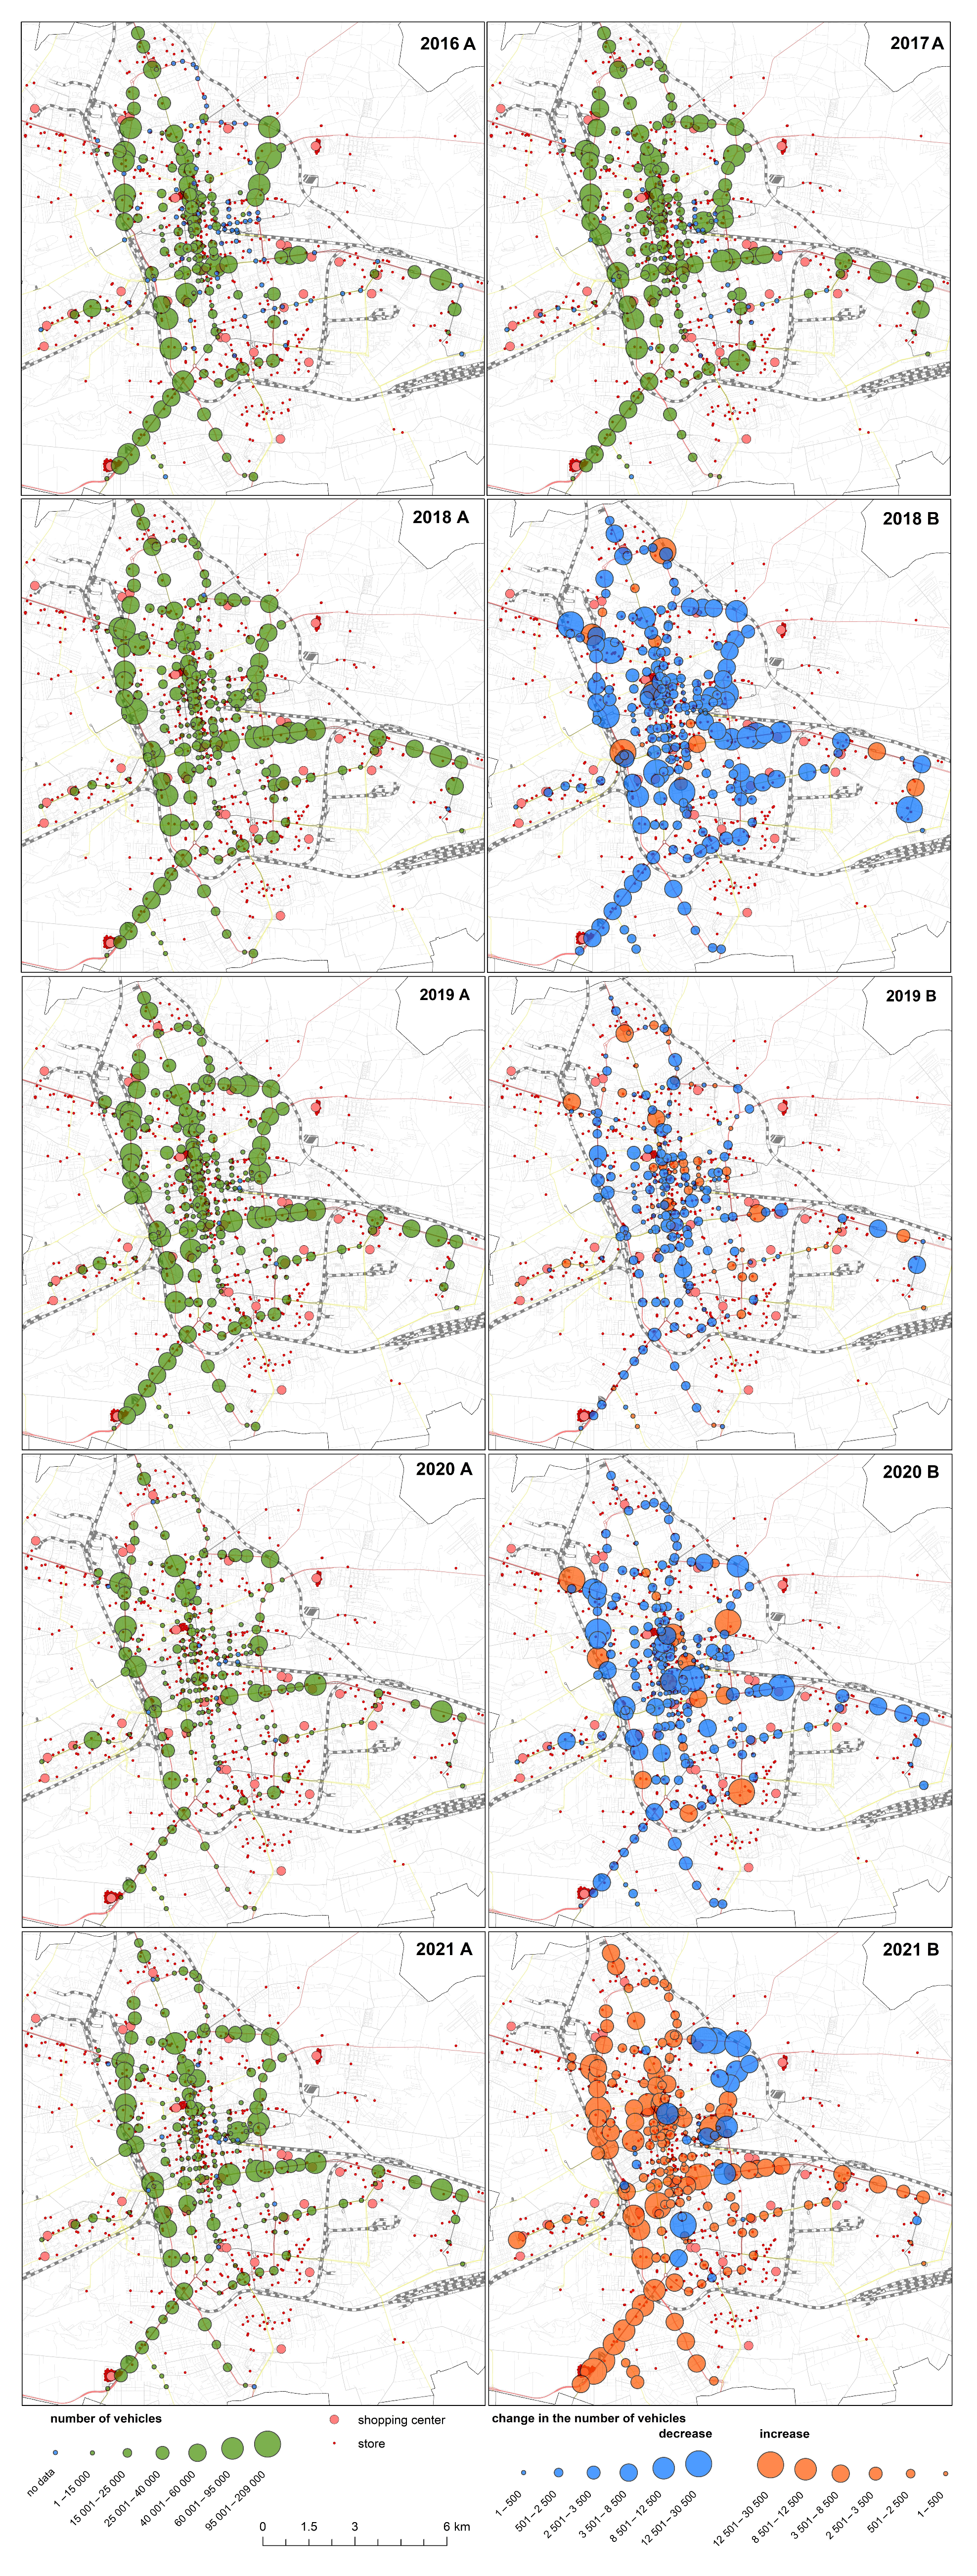
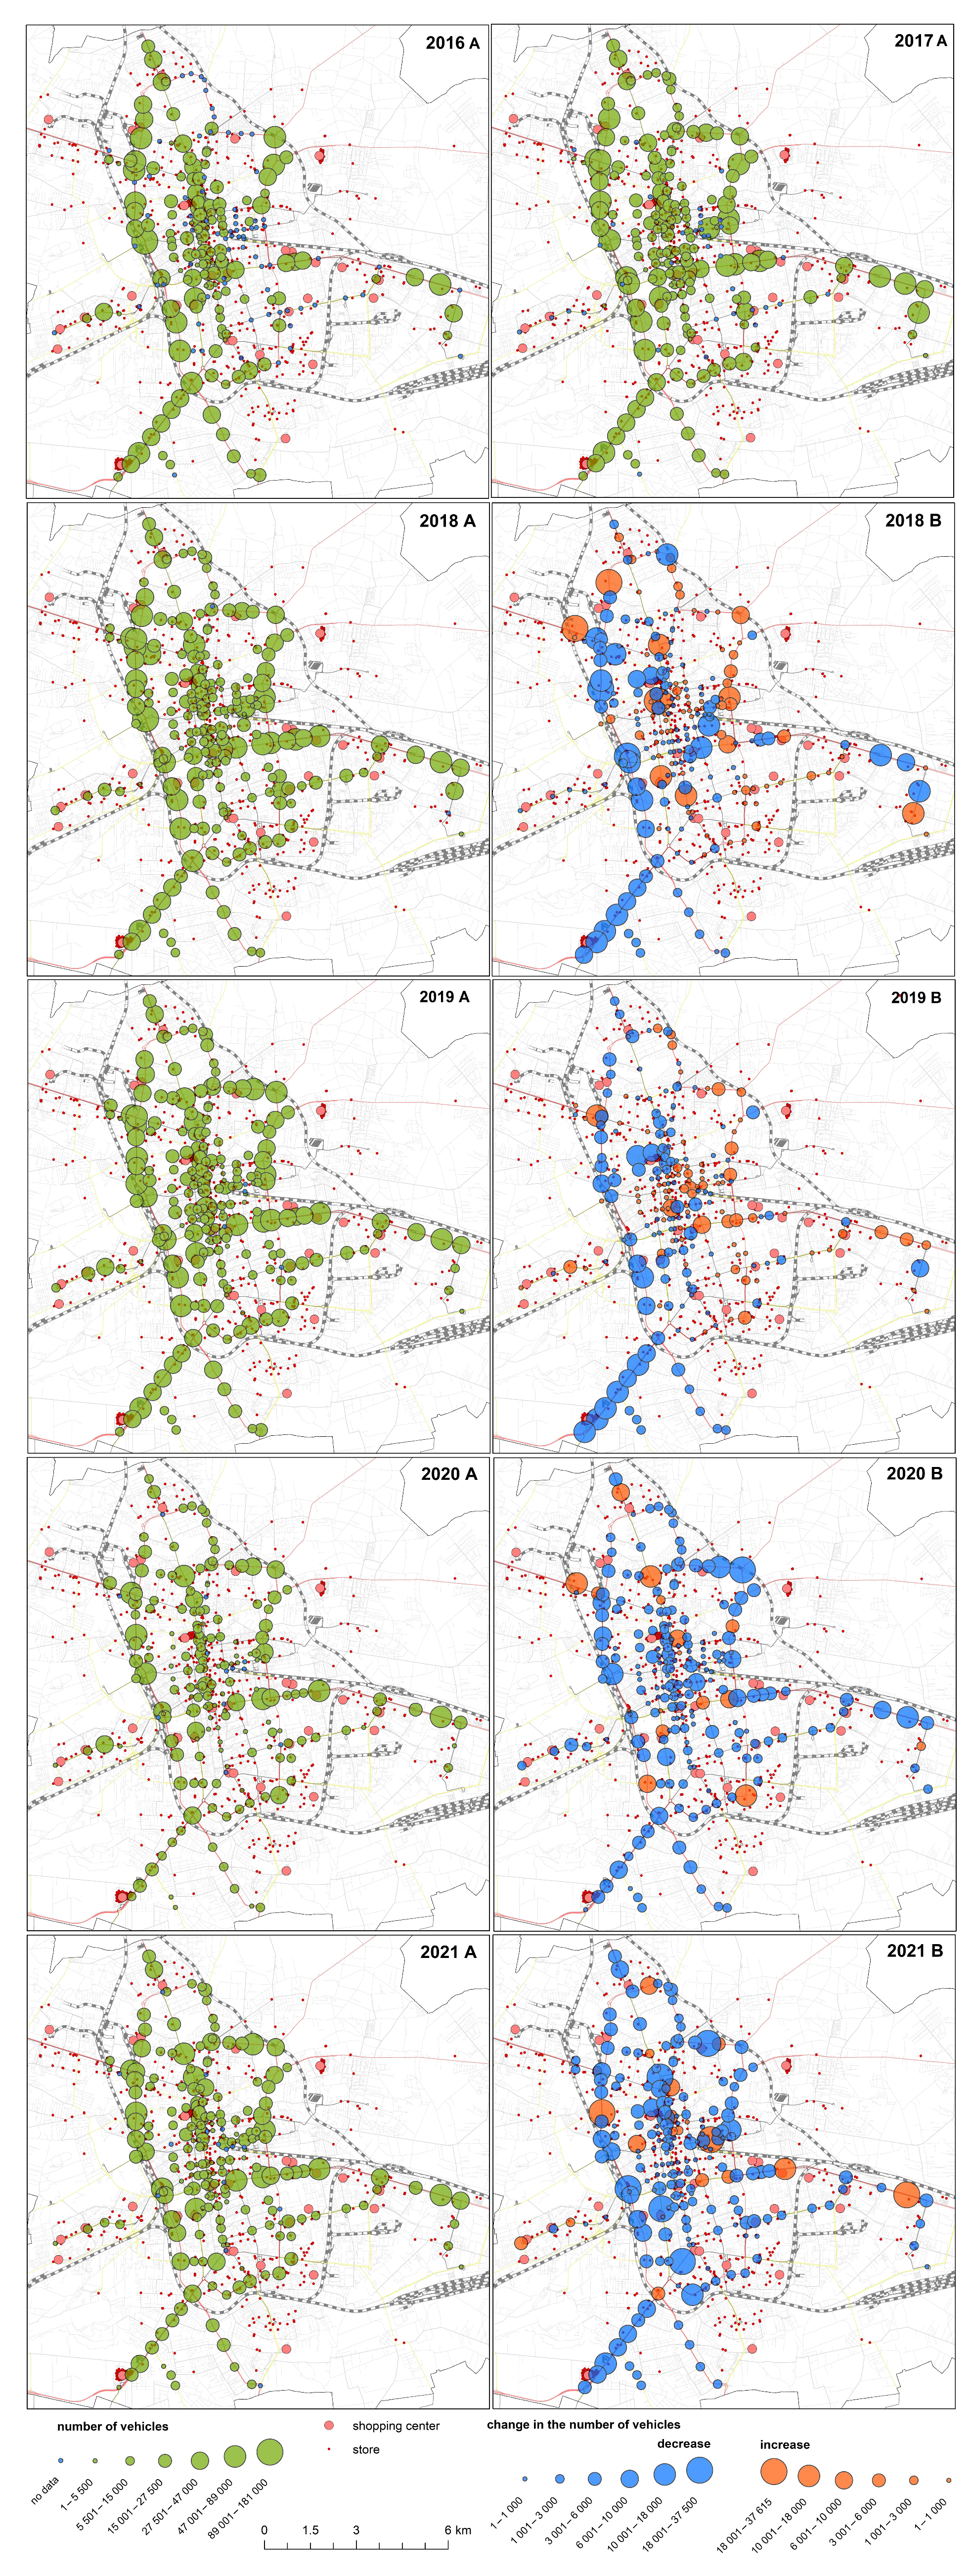
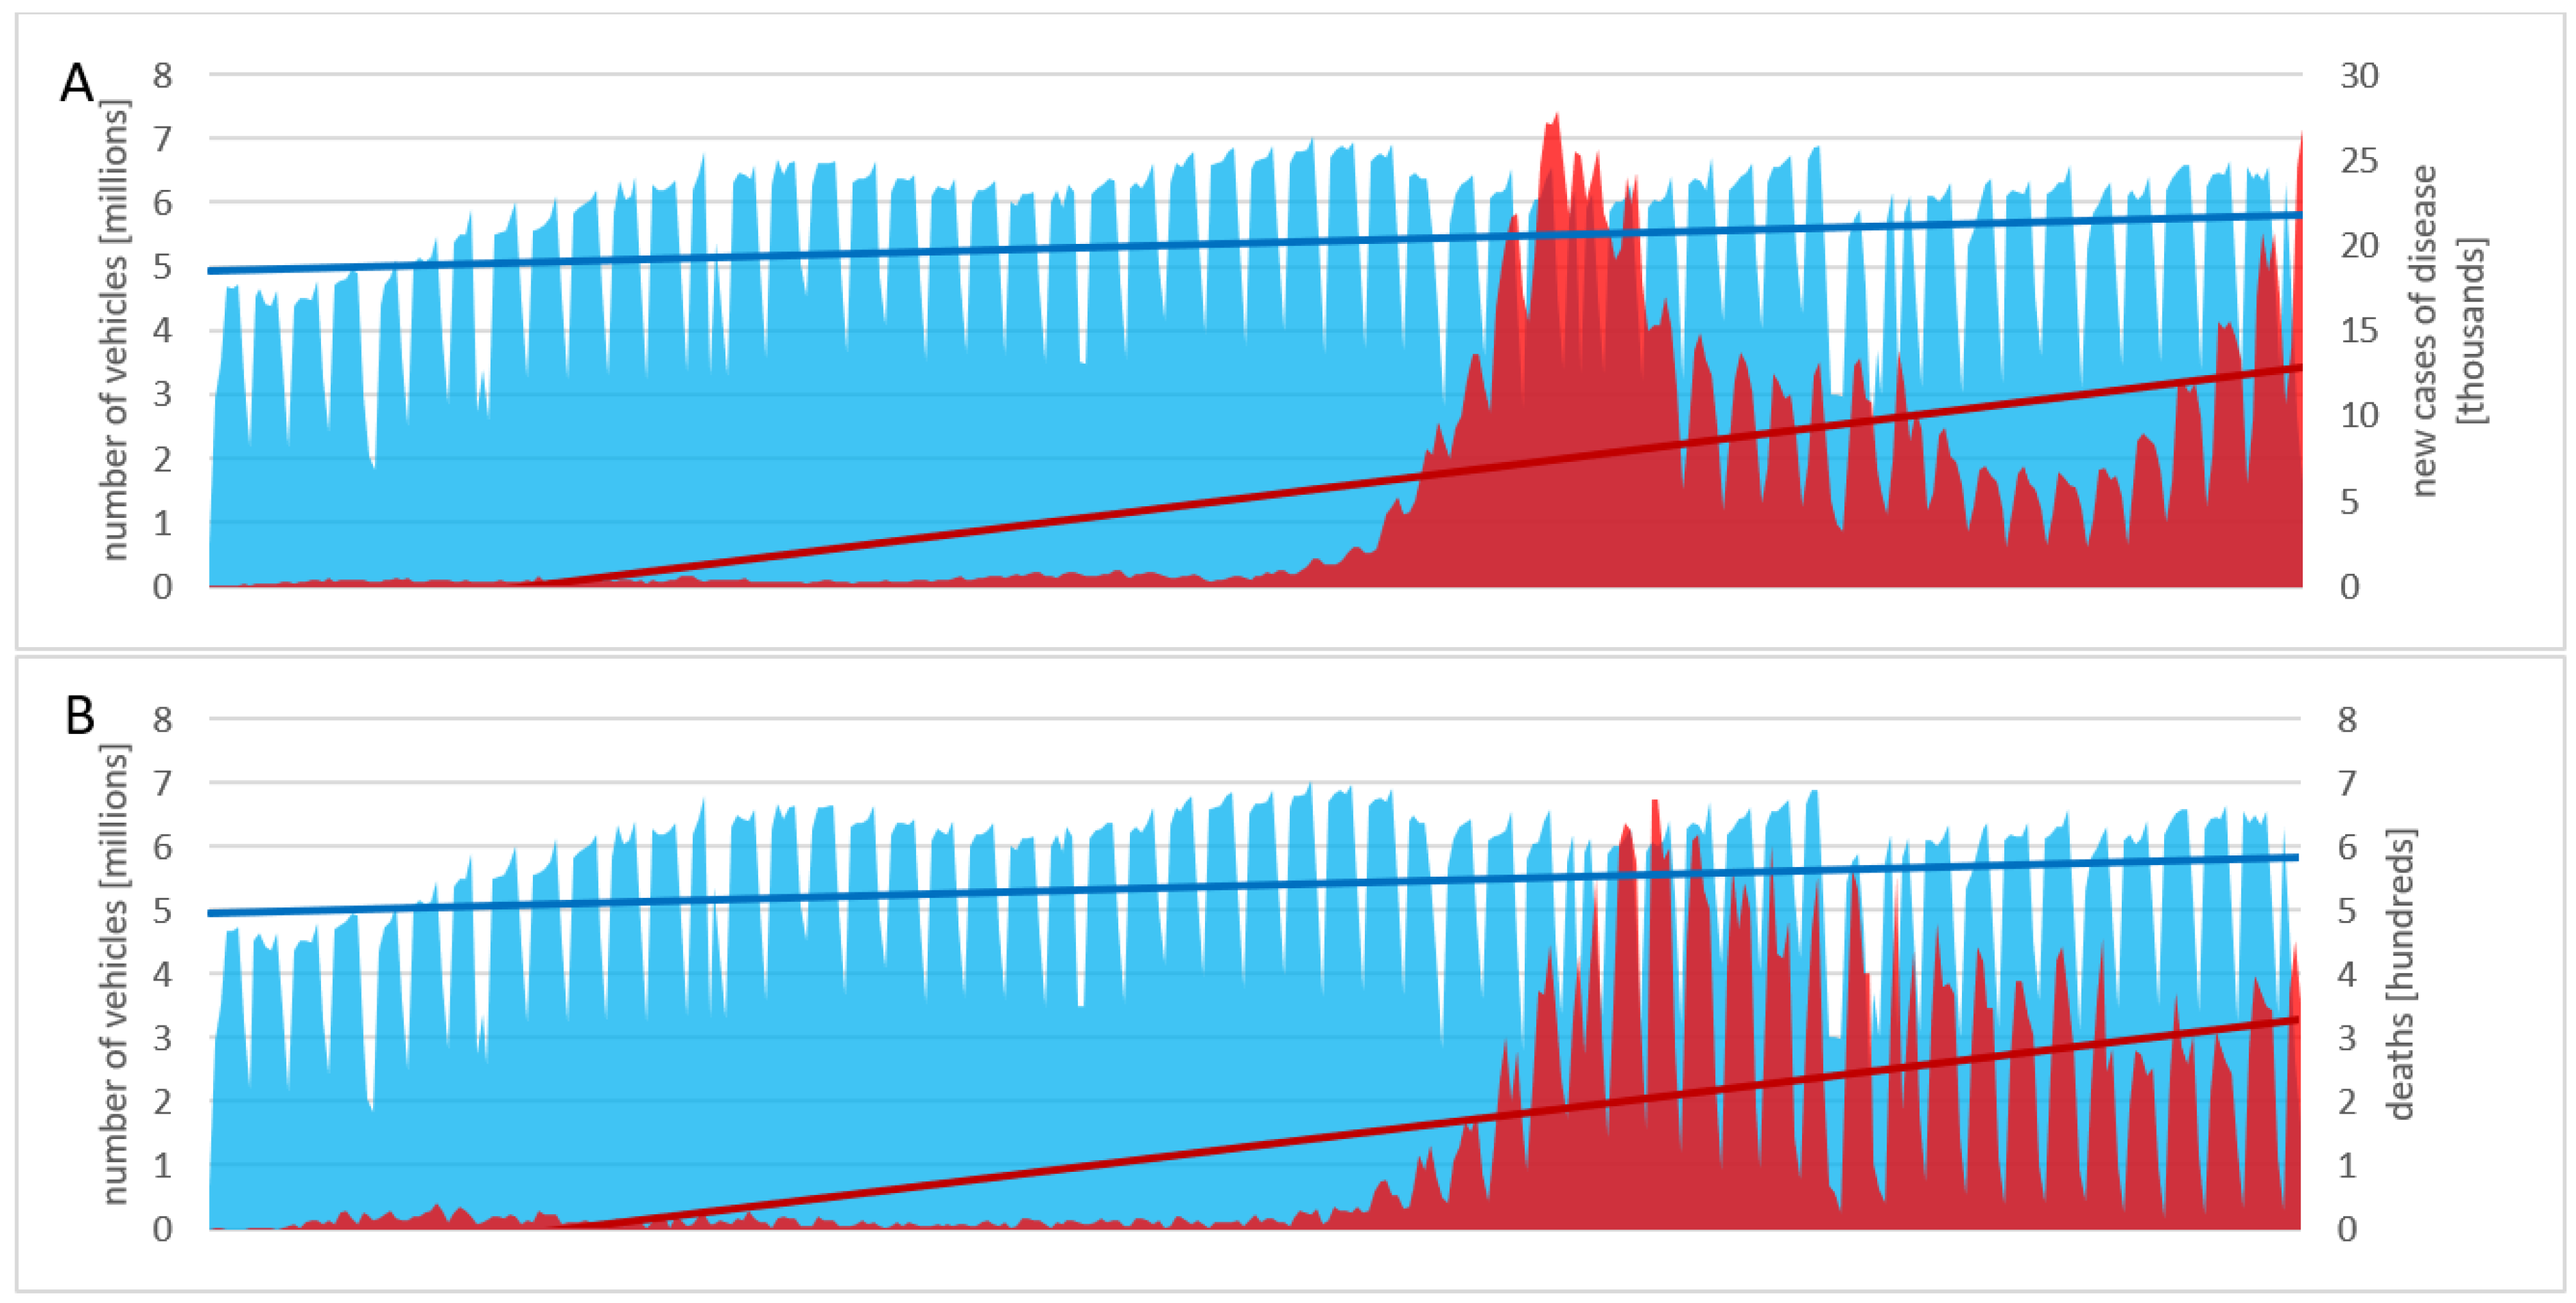
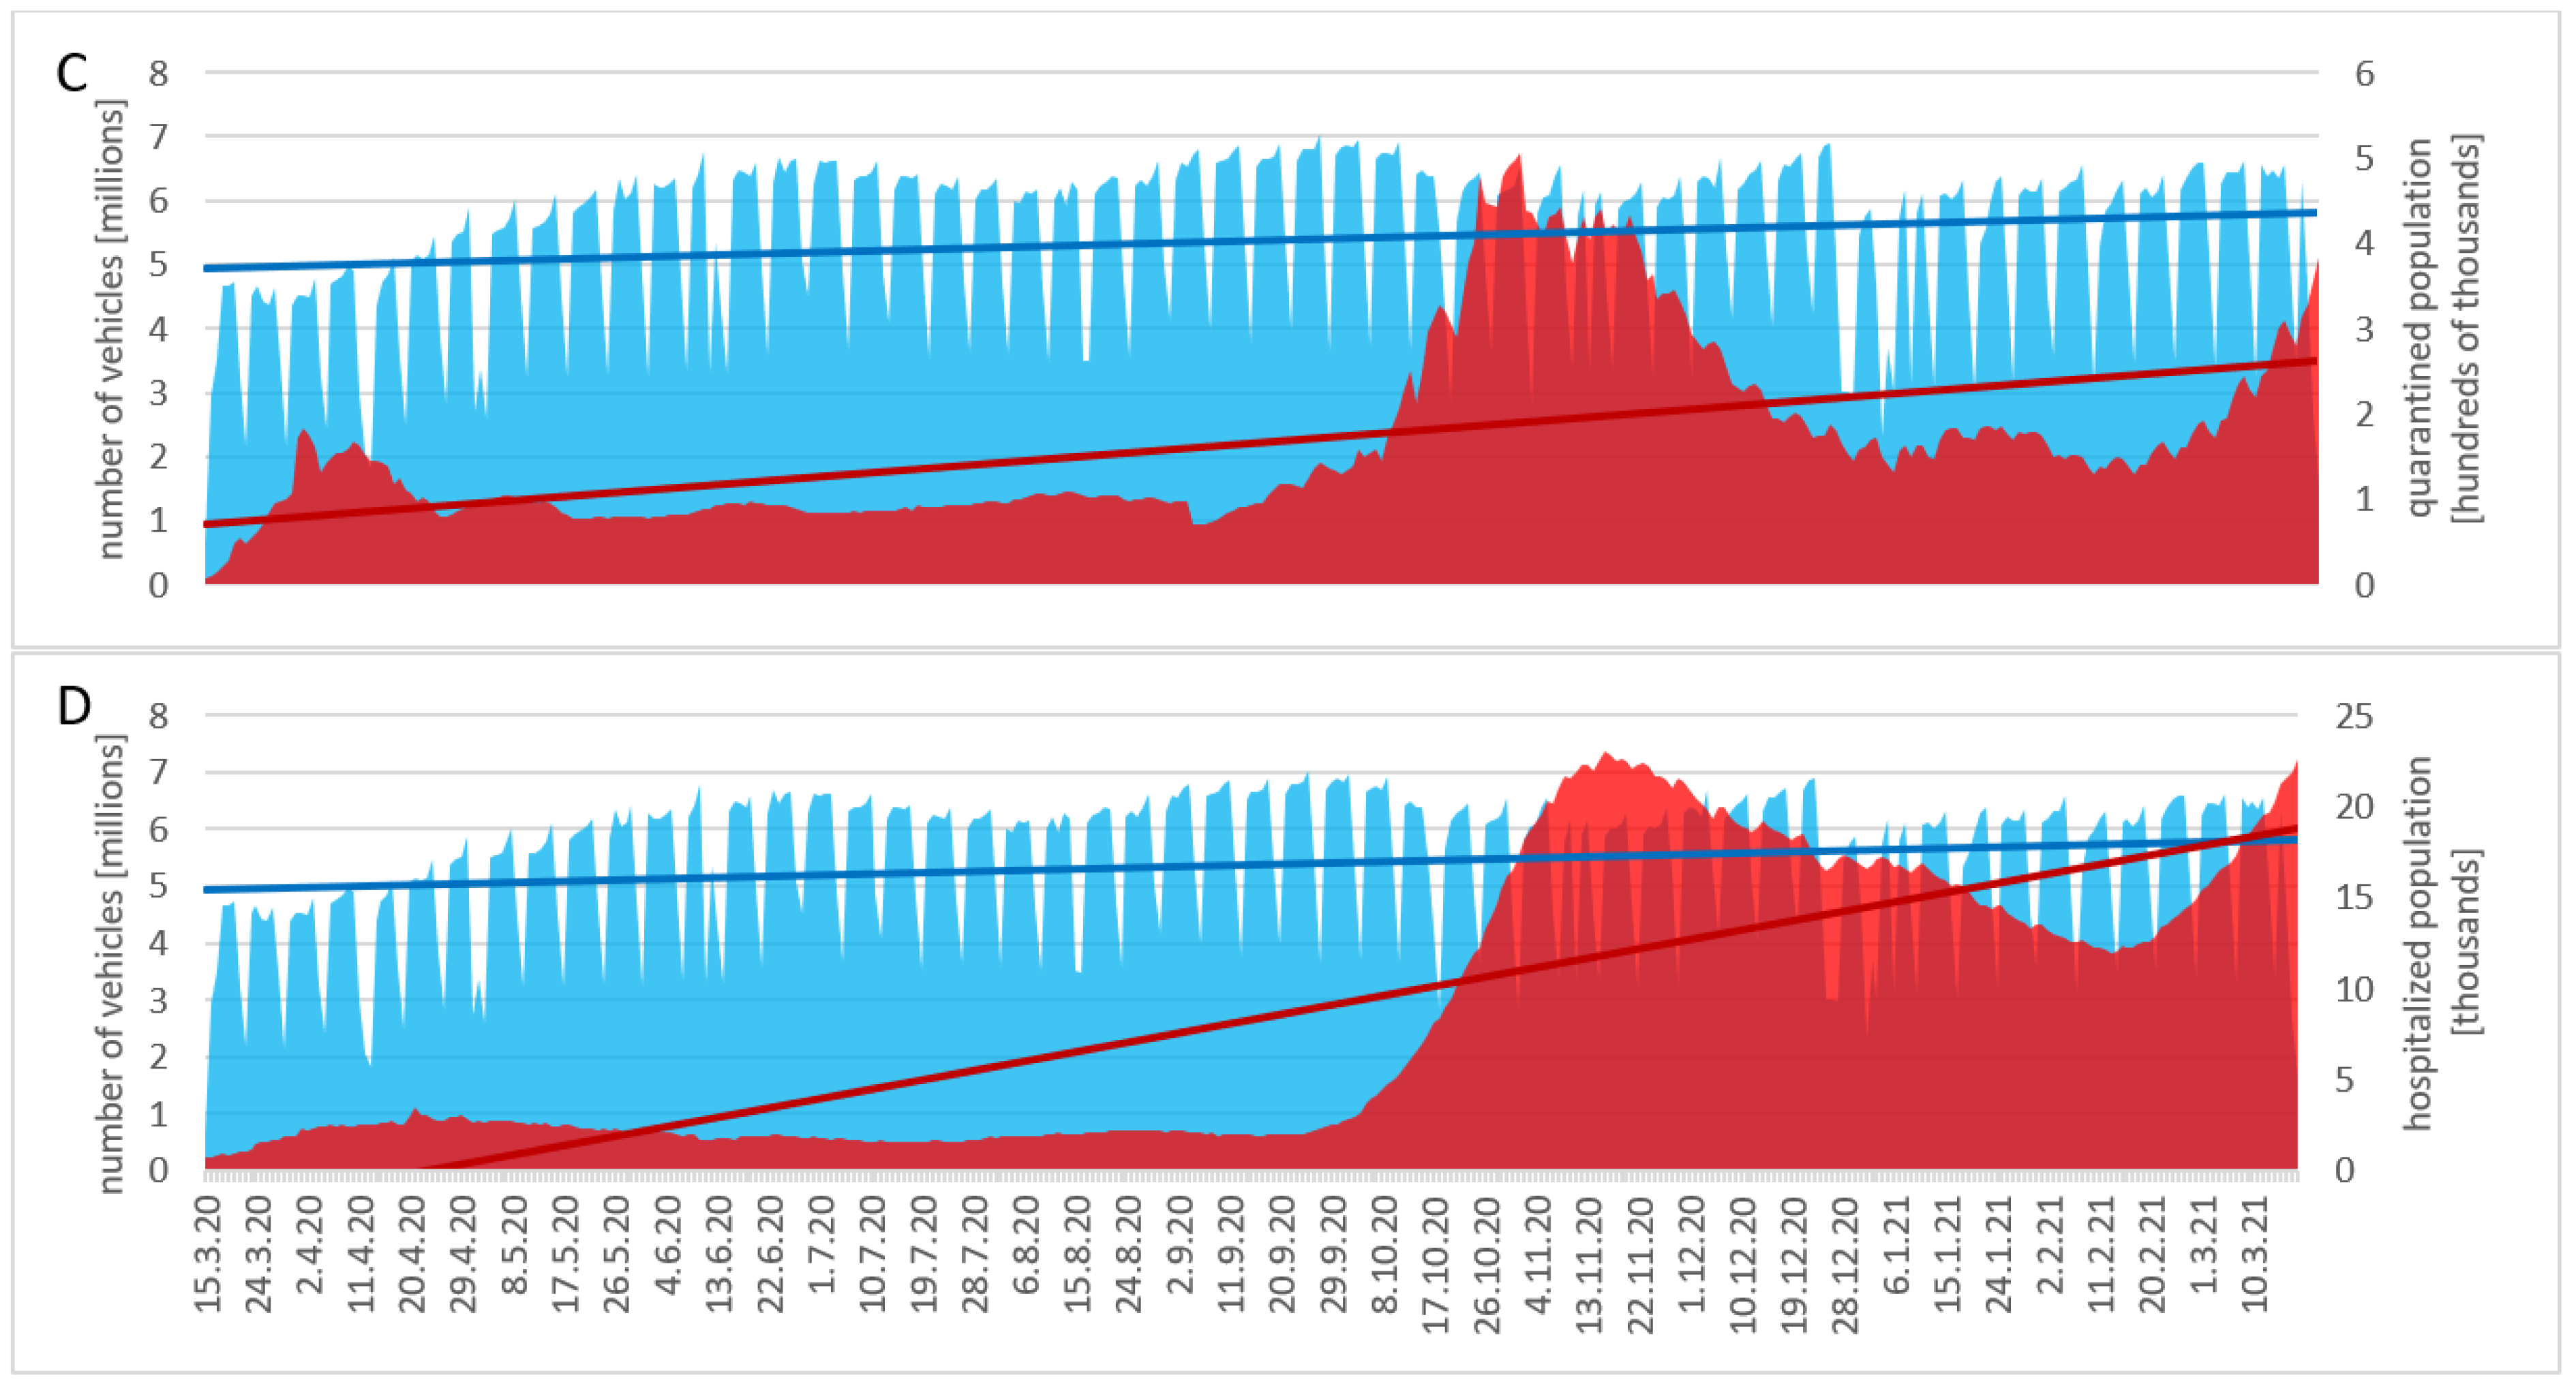
6. Results and Discussion

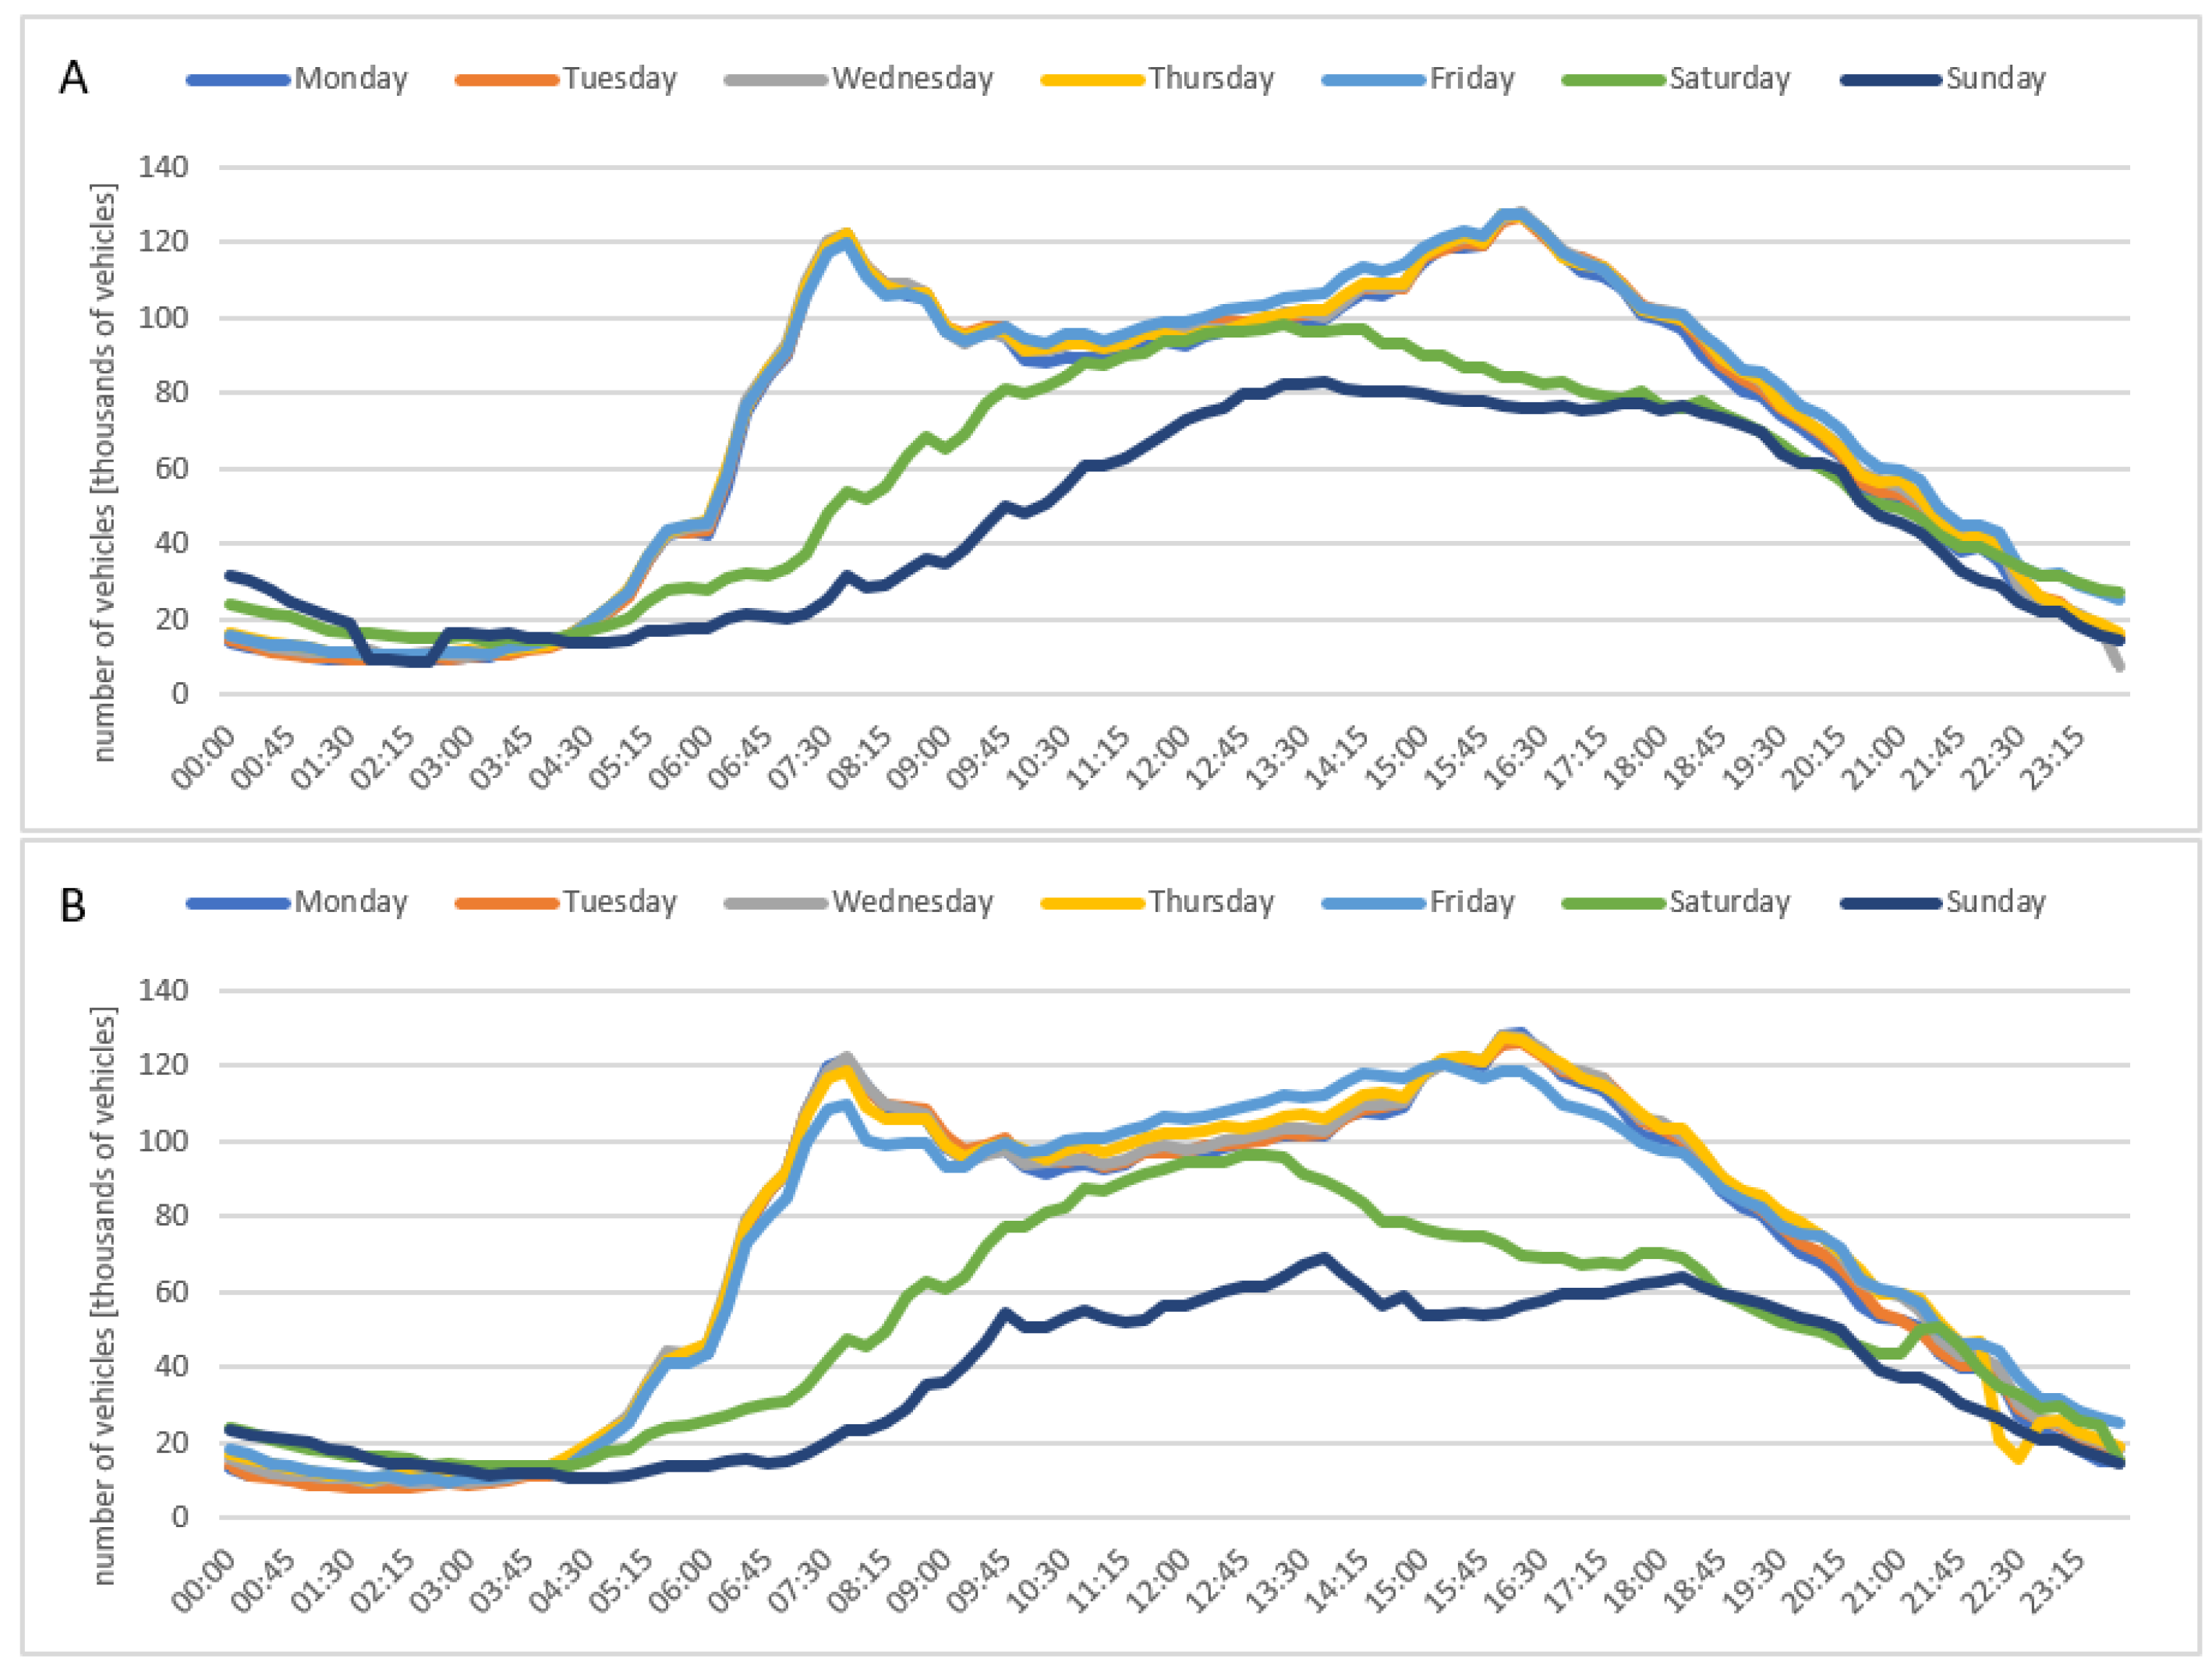
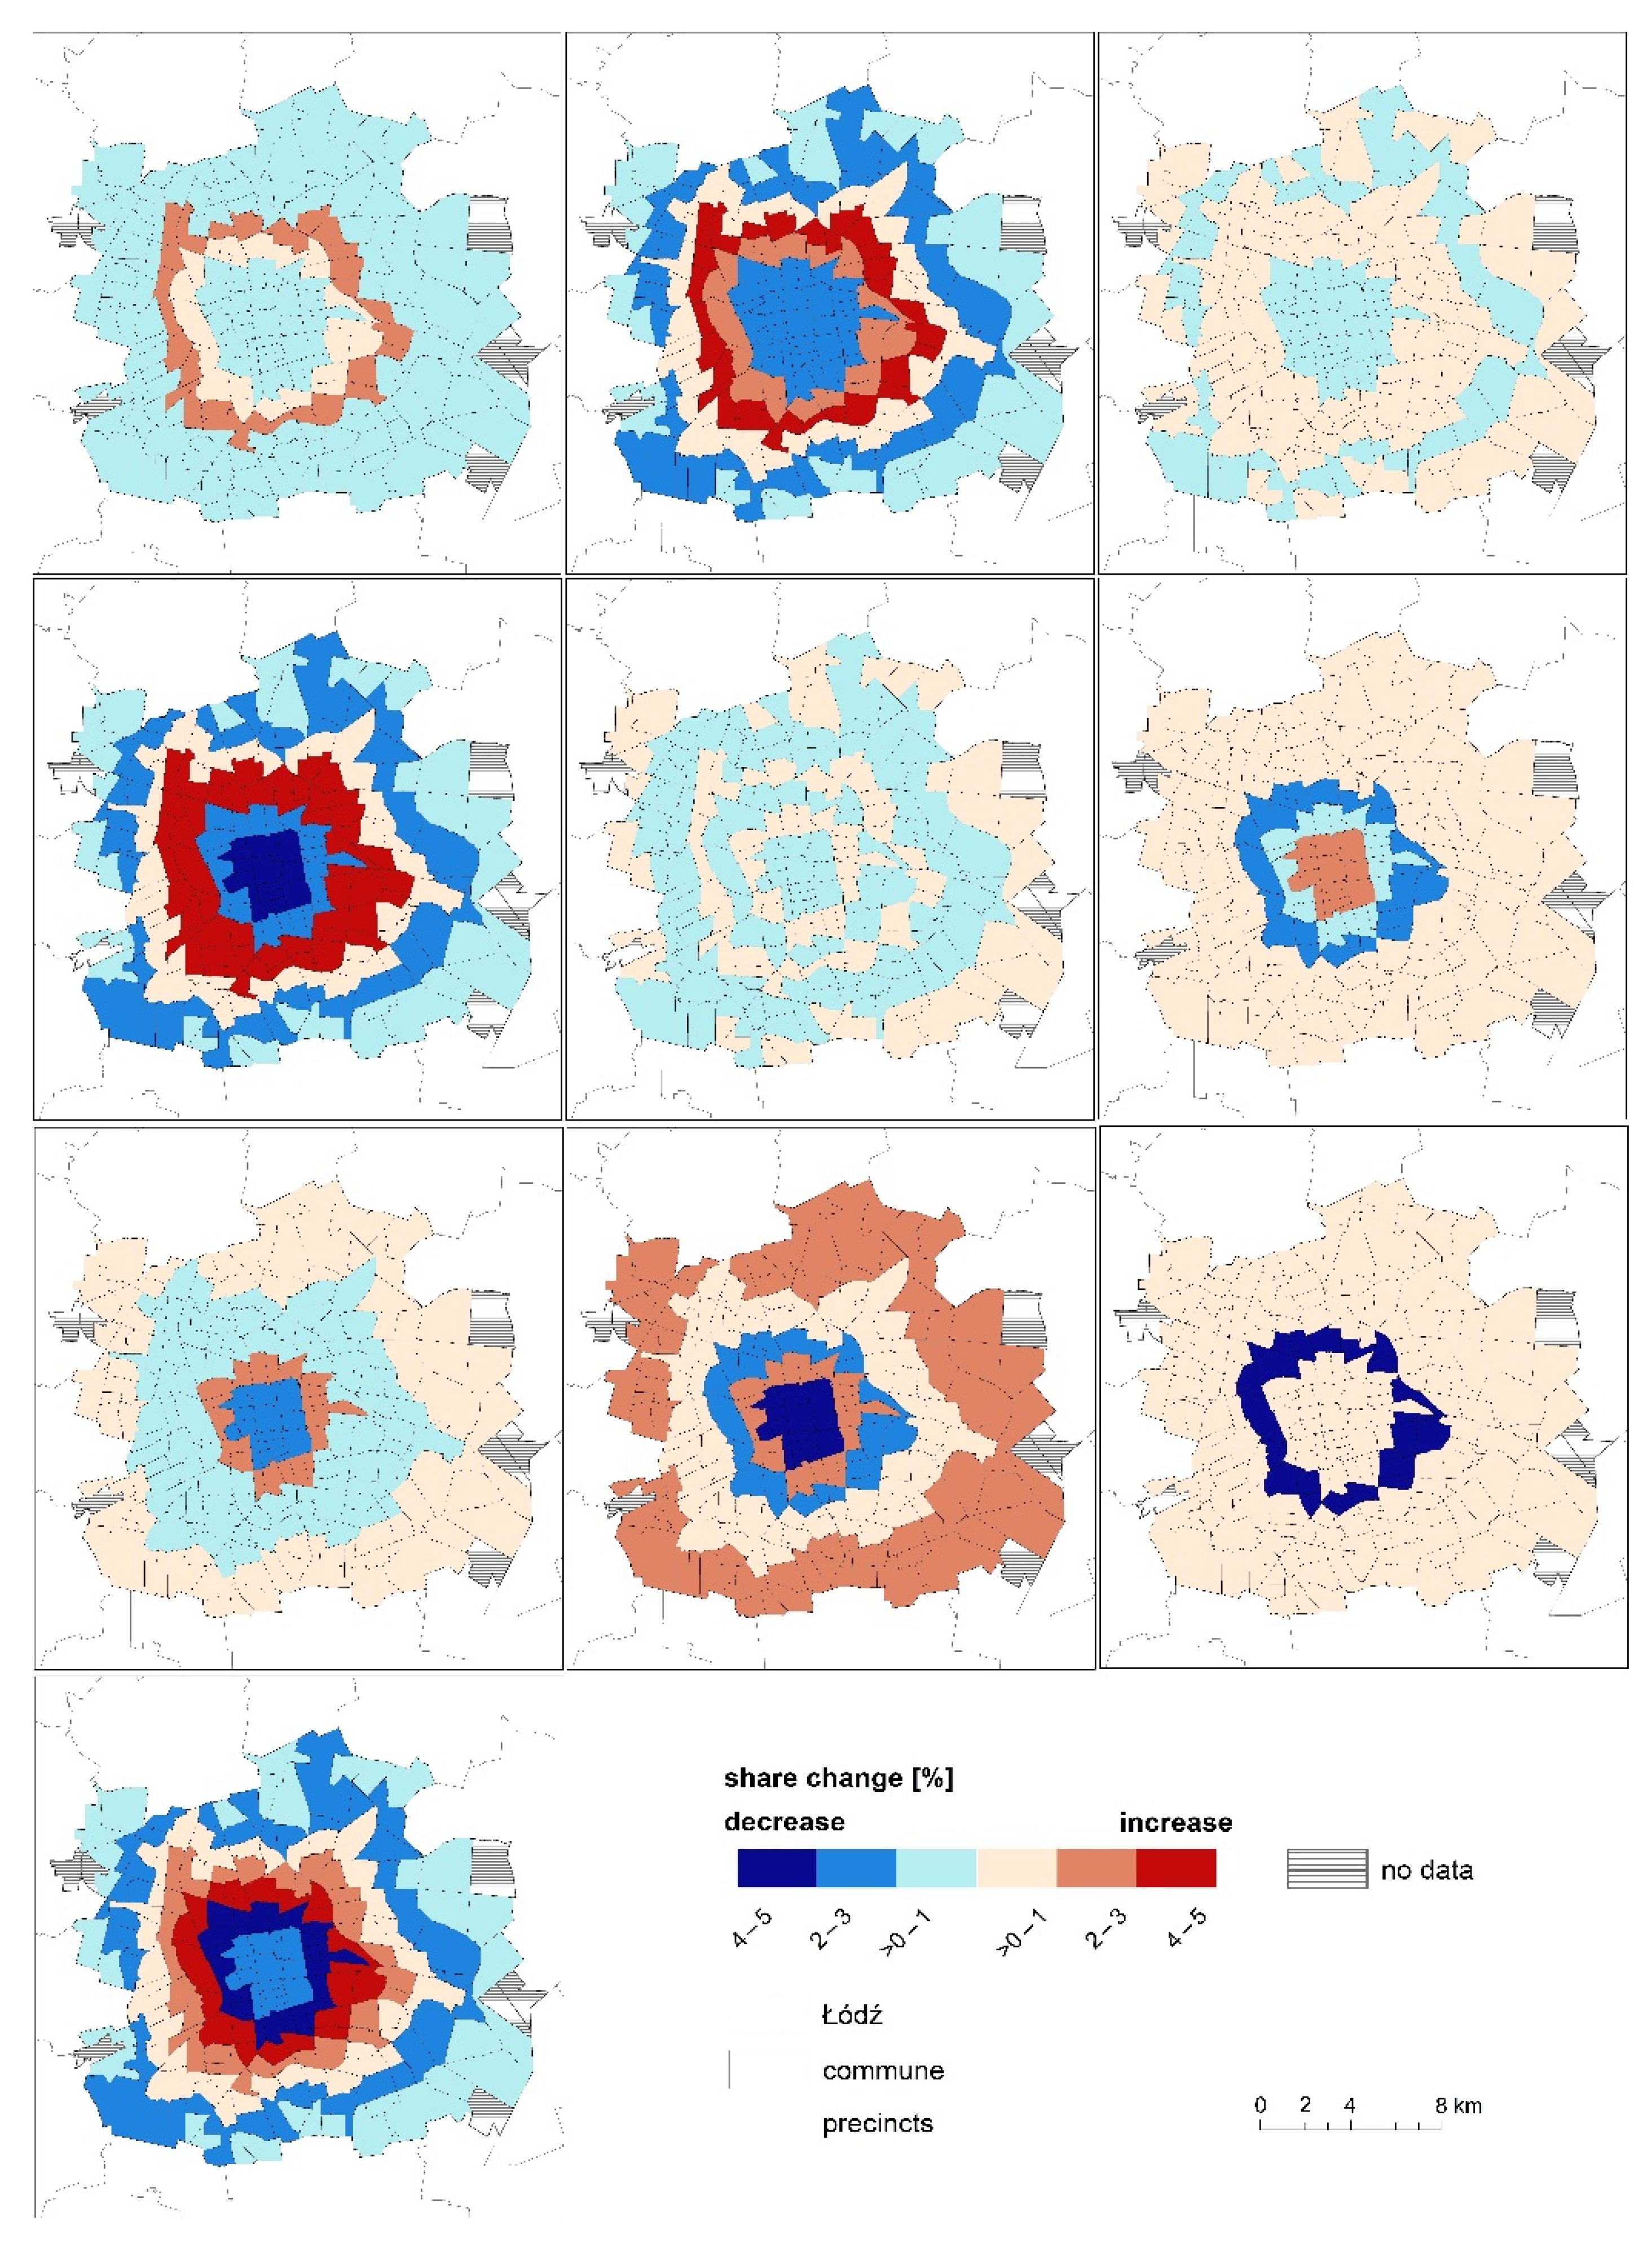
6.1. Permanent Retail Restrictions

The implementation of Sunday retail restrictions resulted in a noticeable decrease in the traffic percentage on non-trading Sundays in the weekly distribution of traffic volumes (Table 1). Importantly, a lower mobility of car users is observed regardless of whether retail restrictions are in force.
As can be seen in the first months following the implementation of retail restrictions, some shoppers—still unaccustomed to the concept of non-trading Sunday—did their shopping last-minute, i.e., the day before (hence, the high load of the road network on late Saturday afternoons). During this period, considerably denser traffic was recorded on Saturdays preceding non-trading Sundays [3]. However, the analyses conducted for a longer period return quite different results. It turns out that, in absolute terms, less traffic is, on average, observed on Saturdays preceding non-trading Sundays (Figure 9 and Figure 10). The temporal distribution of traffic on Saturdays preceding trading Sundays (Figure 10) is similar to the values observed on Saturdays before the implementation of statutory retail restrictions (Figure 11). The transport peak on Saturdays preceding non-trading Sundays is significantly shorter, even though the value of maximum measurements (max. 15-min intervals) is comparable. The situation related to the traffic load of the road network for trading and non-trading Saturdays changed in 2021, when a distinct rise in the number of vehicles was observed in Łódź on Saturdays preceding non-trading Sundays (Figure 12, Figure 13 and Figure 14).
This may stem from the surge in purchases previously blocked by pandemic-related restrictions (that were not loosened before February). In Poland, these needs are customarily satisfied during non-daily shopping in malls [121]. The lack of purchases can be indirectly seen in the data, revealing the dynamic growth of savings that were amassed by Poles in the first pandemic year. Facing limited possibilities to spend money and relatively mild transformations on the job market, Poles increased their savings by a staggering 10% on a YoY basis as of late September 2020. More direct evidence of how sudden the consumer responded to the opening of retail facilities can be found in the data on YoY changes in retail sale volumes. While in January (the height of pandemic restrictions), retail sales decreased by nearly 3% on a YoY basis (which is a relatively low value when compared to the non-pandemic January of 2019), and the value rose by over 17% and over 25% in February and March, respectively (the low base effect can only be considered for the March stats [122]. Even stronger evidence can be found in the detailed data on the structure of these spendings (Table 2).
On trading Sundays, traffic is considerably denser than on Sundays with permanent statutory retail restrictions (Figure 15). The clear difference unambiguously shows that a substantial percentage of Sunday car mobility in Łódź is related to chains of trips where shopping is a motivator.

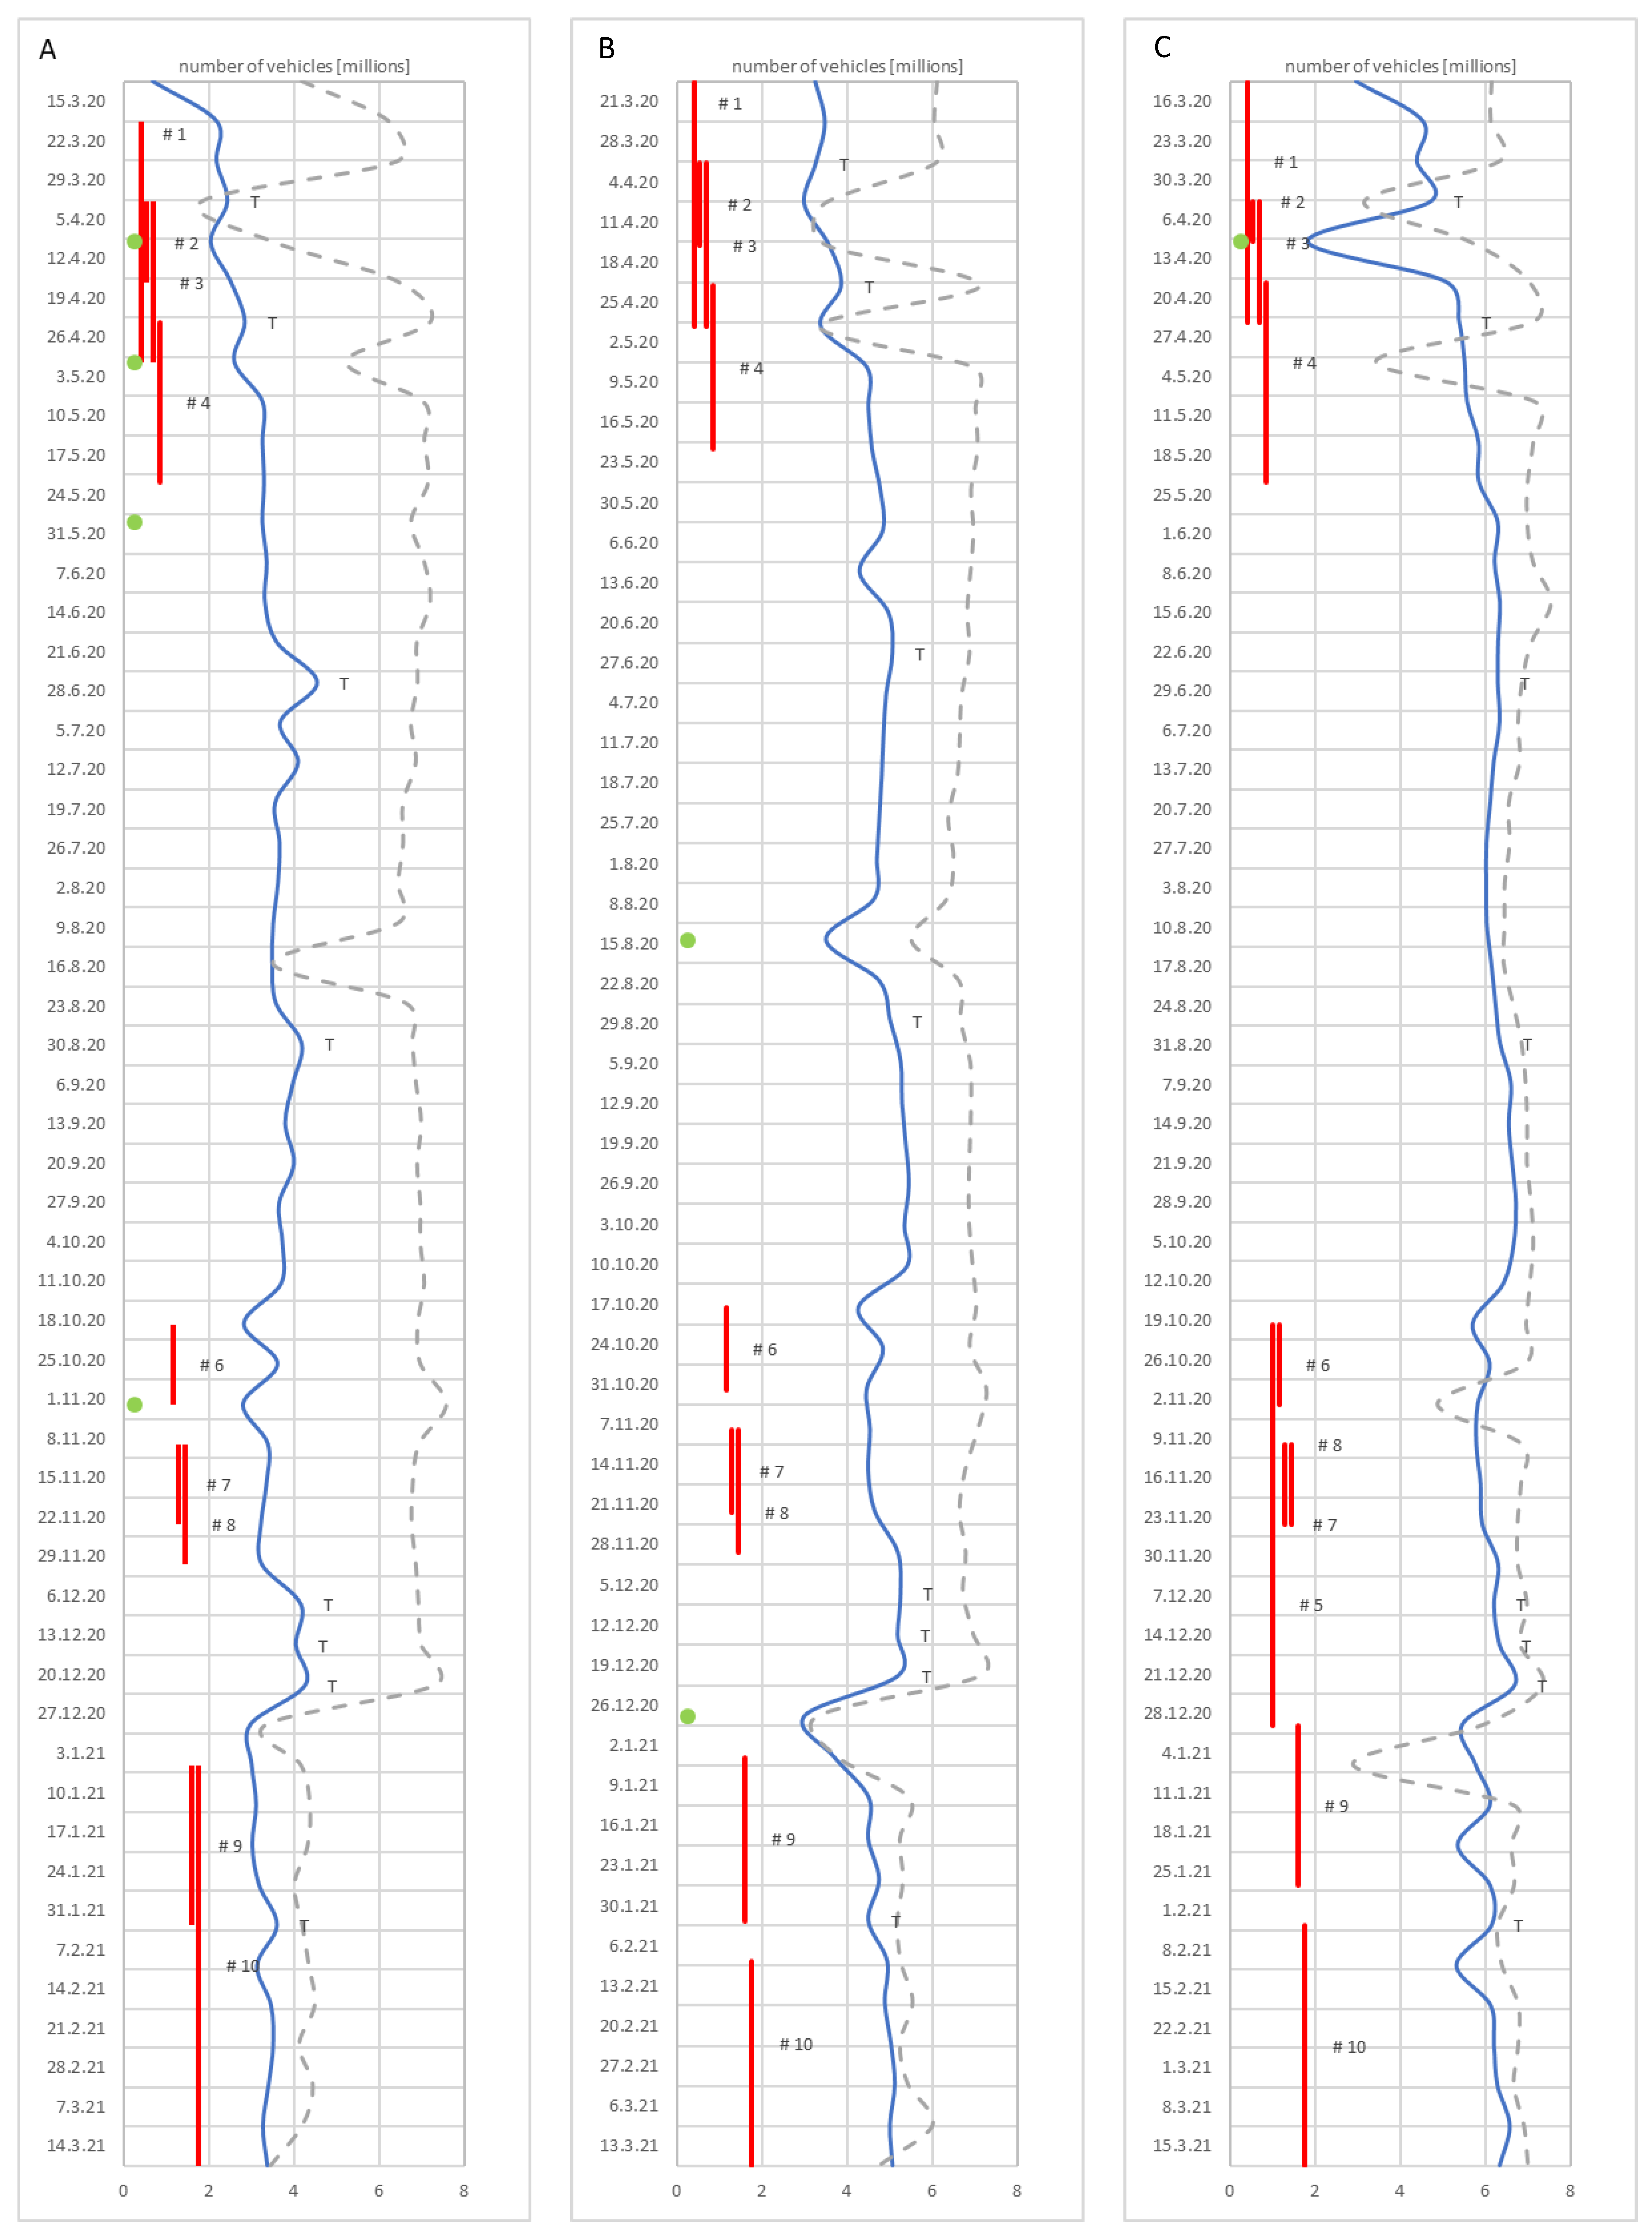
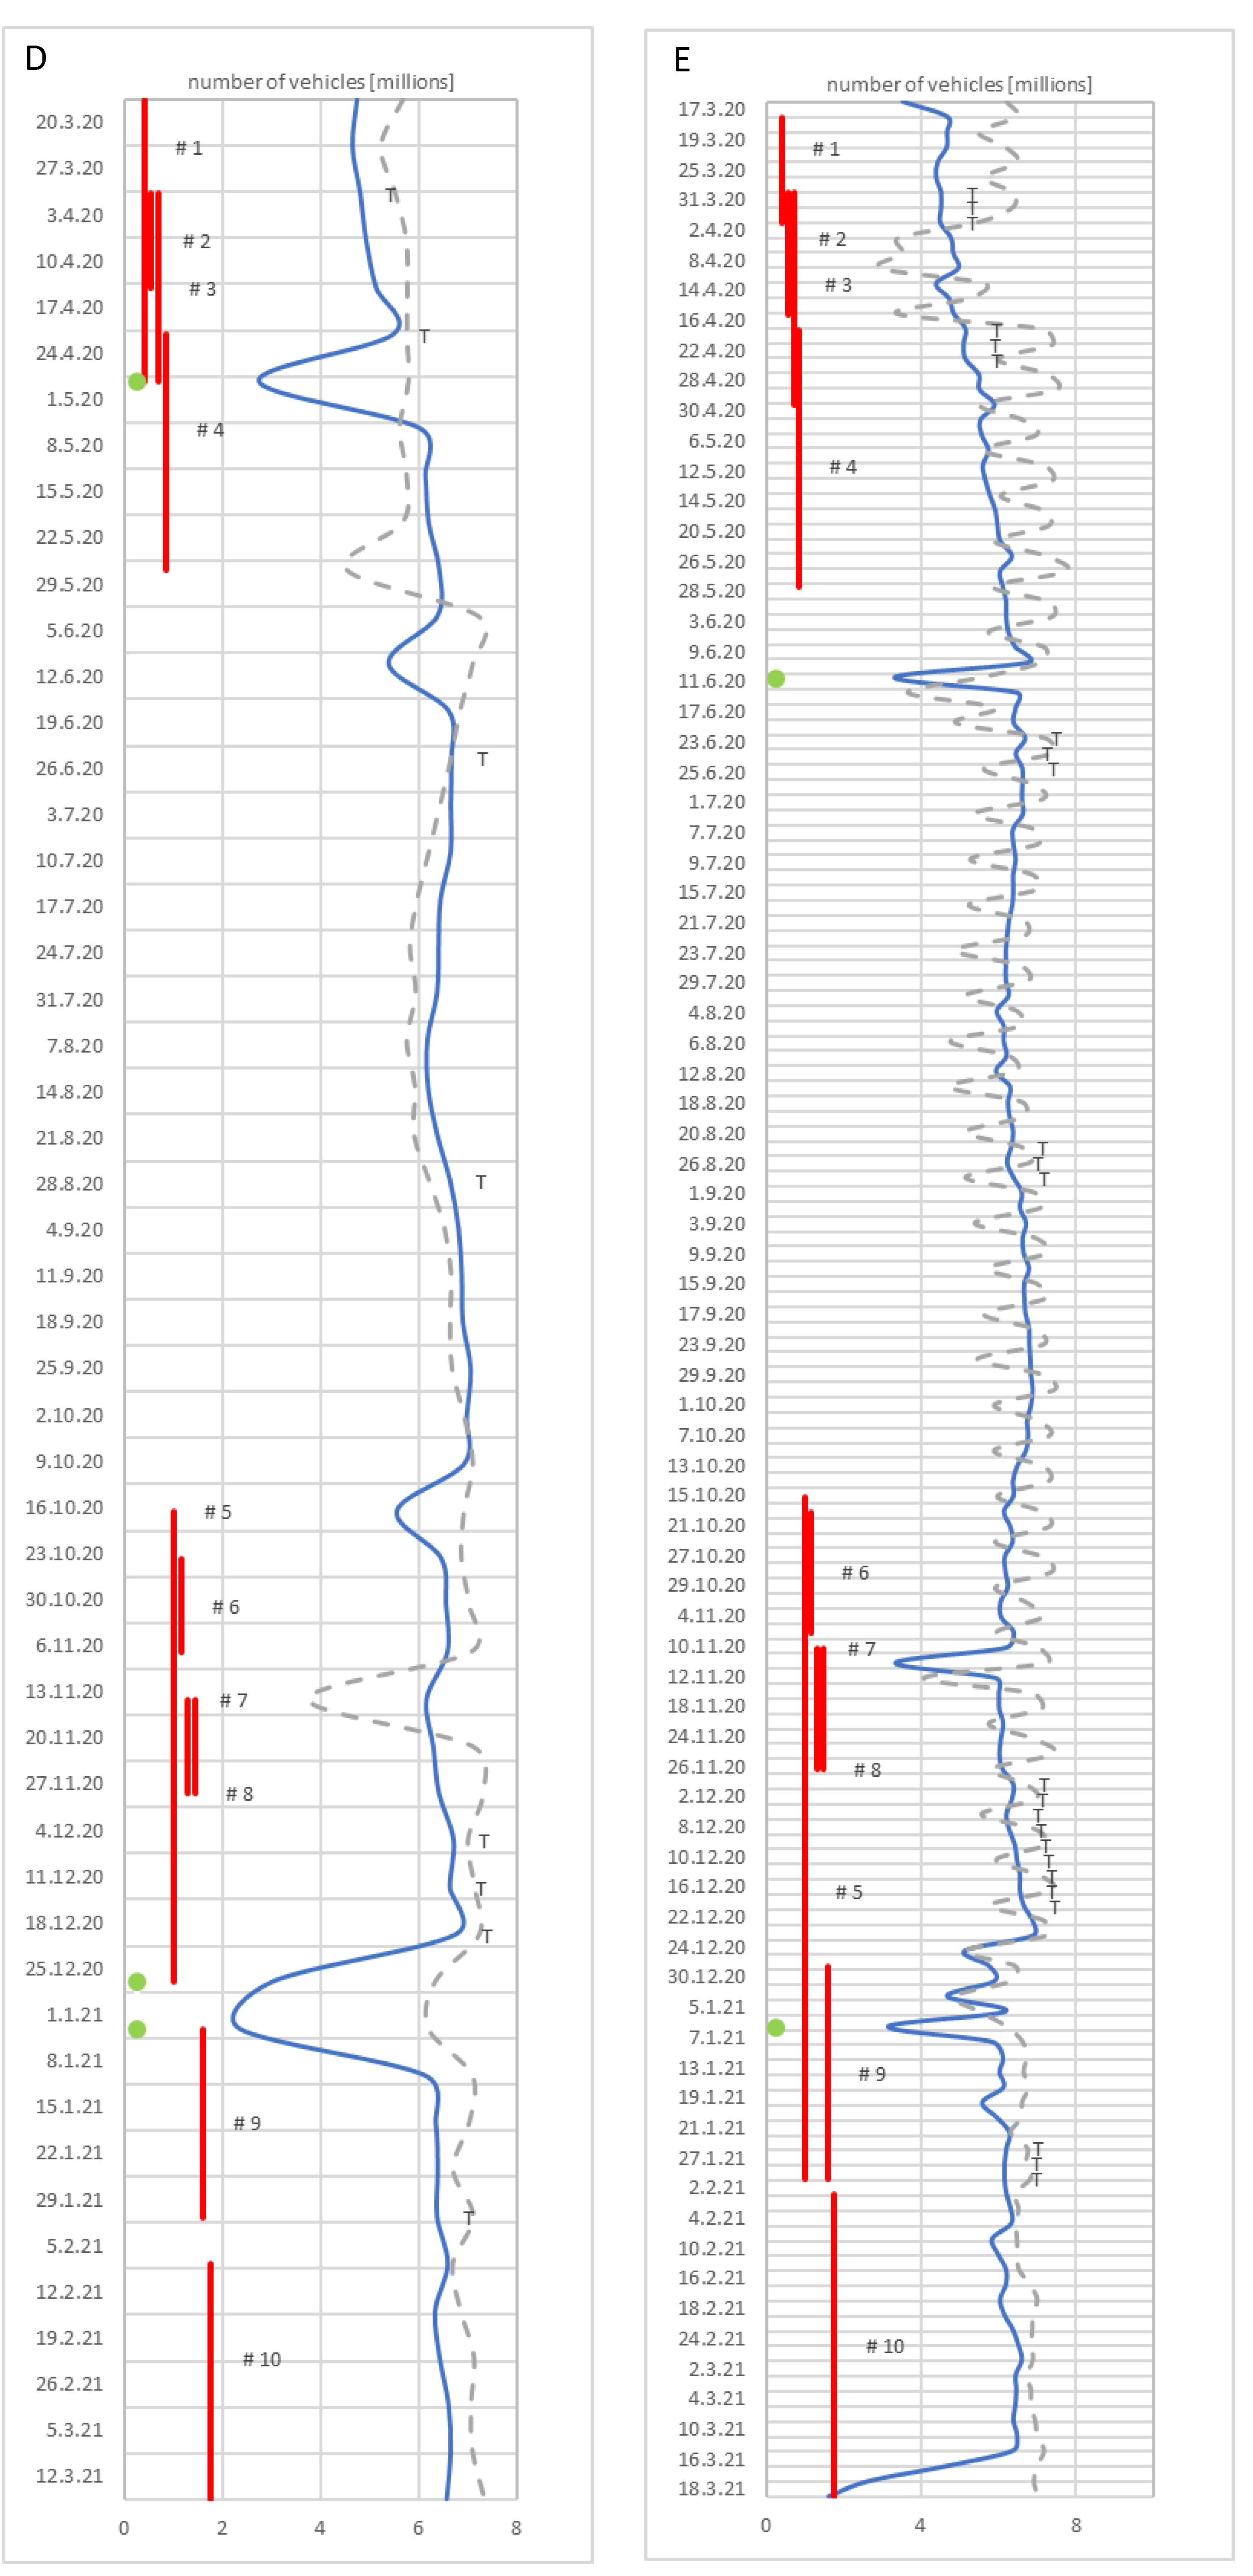
6.2. Short-Term Retail Restrictions

Since the section above mainly focuses on the impact that permanent retail restrictions have on the load of the transport network, and since the issue of short-term (pandemic-related) restrictions is discussed rather superficially, the section below is devoted to a more detailed presentation of the effect of the short-term restrictions on the urban road network.
An initial analysis showed that fear of COVID-19 had a marginal impact on mobility in Łódź. When volumes of recorded traffic and variables illustrating the course of the pandemic in Poland are superimposed on the city’s road network, no significant drop in traffic density is observed, even in light of catastrophic pandemic statistics during the second and third wave (Figure 16). Most fluctuations stem from restrictions imposed by the government, rather than residents’ volitional reduction in mobility. In general, the imposed restrictions usually caused a substantial limitation of mobility [89], which could also be noticed in the initial period of the pandemic in Poland. Even though the first wave was relatively mild, the restrictions introduced at that stage (lockdown) resulted in a substantial decrease in traffic density (extremely low volumes were recorded for the period). With the first wave over and most restrictions lifted, the traffic volume stabilised at a relatively high level. The next, considerably more severe, waves never resulted in traffic reductions comparable to the dramatic drop of spring 2020, even though the government reimplemented the most severe restrictions and imposed another lockdown at the turn of 2020 and 2021. This may indicate that Łódź residents became far less disciplined and more reluctant to limit their mobility. Possibly, they ‘grew tried’ of pandemic restrictions and were less willing to obey them, while numerous controversies over the official pandemic statistics issued by the Ministry of Health only deepened the problem. Interestingly, the issue of the accuracy of the pandemic data has been a common problem not only in Poland [117].
Detailed analyses of the chronology of short-term (pandemic-related) retail restrictions and traffic volumes reveals interesting correlations. Throughout the whole period of the pandemic restrictions, traffic in Łódź was lower than during the corresponding pre-pandemic period, which is also reflected in the results of other studies [122]. Regardless of the day of the week, the lowest traffic was recorded in the initial period of pandemic restrictions (mid-March until after Easter). Even though the restrictions were not loosened after Easter, traffic volumes in Łódź began to grow systematically and stabilised at a relatively high level when shopping malls were reopened (Figure 17). The volume of Sunday traffic remained steady and low, with slightly higher values recorded only for a few Sundays (the trading Sundays before Christmas and two trading Sundays during the summer holiday). When compared to Sunday traffic, Saturday volumes were higher, but still lower than in the pre-pandemic period. As for working days, the authors also observed a difference between pandemic and pre-pandemic volumes of traffic, but it was smaller than for weekends. Interestingly, on Fridays during the pandemic when the majority of restrictions were loosened for the summer holiday, the traffic was slightly denser than in the corresponding pre-pandemic period.
Even though subsequent nationwide restrictions (introduced during the second and third wave) lowered traffic density, their impact was never as significant as those implemented during the first wave. Traffic was lower, but grocery sales remained unaffected (Table 2), which may prove that consumers redefined their shopping behaviour and began to shop online [77] or in local stores near home. However, this is still to be confirmed by more profound studies.
During the period of pandemic restrictions, traffic recorded in the city centre decreased when compared to the corresponding period before, which was particularly noticeable once customer limits were introduced. Zones around the centre which house major arteries and thoroughfares (parts of the framework layout of the transport network—the inner ring road in Łódź), recorded higher traffic loads in almost all periods of pandemic restrictions when compared period to period. In the peripheral areas of the city, traffic became lower during the initial stage of pandemic restrictions (the first wave), but successive waves and the resultant restrictions did not bring about a substantial drop in traffic density, and, in one case, even higher traffic volumes than a year before were observed (Figure 18).
A substantial limitation of mobility in Poland, especially in the early stage of the pandemic, has also been confirmed by other studies. Tarkowski et al. [122] stressed the significantly lower popularity of retail and recreational facilities. Analysing car travel times for the agglomeration of Tricity (Gdansk, Gdynia and Sopot), they indicated that the high capacity and efficiency of the local road network (no congestion in rush hours) was the result of a considerably lower load of the transport system [122]. Borkowski et al. [90] show that the travel time was shortened not only for people who had to change their transport behaviour in the pandemic, but also for those whose profession did not require them to modify their necessary daily mobility. Obviously, the lowered traffic density observed in the study presented herein is not the effect of retail restrictions only, since the pandemic changed many other, previously ‘regular’ motivations for everyday trips. The proof of this can be seen in mobile localisation data, which show where Poles spent their time [122], including obligatory motivators related to work and studying. Polish employers rose to the challenge of the pandemic and smoothly introduced the possibility to work remotely, which—together with online teaching—resulted in a record-breaking consumption of electricity [124]. When it comes to modes of transport, numerous studies show that there was a change from shared means and mass transit to private transport during the pandemic [69,125,126,127]. Regardless of these phenomena, the overall drop in mobility leads the authors to conclude that the aforementioned modal shift does not lead to an increase in absolute volumes of vehicle traffic.

7. Conclusions

The main advantage of this work is showing the variability of mobility. Using extensive databases and comparing the results of measurements derived from them with the observations in a changing transport environment (in terms of changes in trade and pan-demic constraints), the studied phenomenon was presented in a descriptive manner.
The main aim of this study was to identify the changeability of the load of the urban system of road transport against permanent and short-term legal and administrative retail restrictions and to determine its spatial and temporal nature. The authors analysed the impact of permanent restrictions related to statutory retail ban on Sundays and short-term restrictions introduced due to the COVID-19 pandemic.
Research results allowed to state that governmental restrictions to curb mobility combined with social anxiety over the COVID-19 virus led to a substantial limitation of daily mobility, particularly noticeable during the first wave of the pandemic (March–April 2020). It can be concluded that, during its initial stage, the governmental policy to limit the spread of the SARS-CoV-2 virus returned the hoped-for effects, i.e., limited mobility facilitated social distancing. However, during the ensuing waves, the impact of restrictions on mobility was not as powerful. The results of the study herein may be useful when political decisions on limiting daily mobility are made, especially when they affect shopping-related mobility.
Another result of the research is the indication that long-term observations prove that, after the initial implementation of Sunday retail restrictions, people began to plan their weekends differently. Imposition of pandemic restrictions on top of the previously implemented statutory retail restrictions clearly shaped the weekly distribution of traffic. In weeks with a non-trading Sunday, the percentage of vehicle traffic on weekdays was greater at the expense of weekend volumes, which was particularly noticeable during the first pandemic year (2020).
Comprehension of the factors impacting people’s perception of the SARS-CoV-2 virus during the pandemic, especially in the context of daily mobility, may become a starting point for further studies. Transport behaviour analyses that focus on city dwellers facing a global threat (here: a pandemic) would be exceptionally beneficial to authorities responsible for urban transport policies, particularly with regard to the strategic changes that are being introduced for the sake of sustainable urban mobility. Another issue to be scrutinised in the future is a new type of transport exclusion. A pandemic and the associated restrictions to limit its spread may evoke in some people an authentic and subjective feeling of being deprived of the possibility to fulfil certain needs related to spatial mobility, which, in consequence, may lead to exclusion from other social and economic activities. In addition, the extraordinary pandemic circumstances also allow researchers to prognosticate on the changes necessary to urban transport systems due to the ongoing processes of depopulation in big cities (especially in highly developed countries) and to the continuous relocation of certain activities (e.g., working, management and administration, services, etc.) online. Transport behaviour analyses play a crucial role in planning and shaping transport systems. Not only do they provide an unbiased picture of the current condition, but they also facilitate the development of more advanced analytical tools, e.g., traffic models. These studies are vital as they help determine basic data for traffic forecasting and residents’ expectations of transport systems. Application of advanced software for traffic macro- and microsimulation would help determine tangible (time and financial) changes in urban transport systems.

Author Contributions

Conceptualization, S.W.; methodology, S.W.; software, S.W.; validation, S.W.; formal analysis, M.B.-S.; investigation, M.B.-S.; resources, M.K. and S.W.; data curation, S.W.; writing—original draft preparation, M.B.-S., M.K., P.K., A.S. and S.W.; writing—review and editing, M.B.-S., M.K., A.S. and S.W.; visualization, S.W.; supervision, M.B.-S. and S.W.; project administration, M.B.-S., M.K. and S.W.; funding acquisition, M.B.-S., M.K. and S.W. All authors have read and agreed to the published version of the manuscript.

Funding

This paper was produced under the research projects no. 2019/33/N/HS4/01733 and 2019/35/D/HS4/00697, financed from the funds of the National Science Centre in Poland. The project is co-financed by the Polish National Agency for Academic Exchange and under the framework of the subsidy for tertiary education, aimed at academies and universities which participated in the IDUB Contest (‘Inicjatywa Doskonałości–Uczelnia Badawcza’).

Conflicts of Interest

The authors declare no conflict of interest.

References

  1. Żochowska, R.; Karoń, G. Przegląd literatury na temat zjawiska kongestii i zakłóceń. Zesz. Nauk. Stowarzyszenia Inżynierów i Tech. Komun. w Krakowie. Ser. Mater. Konf. 2012, 2, 252–276. [Google Scholar]
  2. Borowska-Stefańska, M.; Kowalski, M.; Wiśniewski, S. Changes in urban transport behaviours and spatial mobility resulting from the introduction of statutory Sunday retail restrictions: A case study of Lodz, Poland. Morav. Geogr. Rep. 2020, 28, 29–47. [Google Scholar] [CrossRef]
  3. Borowska-Stefańska, M.; Kowalski, M.; Wiśniewski, S.; Szustowski, B.; Maczuga, M. The impact of statutory sunday trading restrictions… on the choices of residents of a large polish city with regard to transport behaviours and mobility. Stud. Reg. i Lokal. 2020, 82, 33–59. [Google Scholar] [CrossRef]
  4. Macioszek, E.; Kurek, A. Extracting road traffic volume in the city before and during COVID-19 through video remote sensing. Remote Sens. 2021, 13, 2329. [Google Scholar] [CrossRef]
  5. Budd, L.; Ison, S. Responsible Transport: A post-COVID agenda for transport policy and practice. Transp. Res. Interdiscip. Perspect. 2020, 6, 100151. [Google Scholar] [CrossRef] [PubMed]
  6. Schönfelder, S.; Axhausen, K.W. Urban Rhythms and Travel Behaviour Spatial and Temporal Phenomena of Daily Travel, 1st ed.; Routledge: London, UK, 2010; ISBN 9781315548715. [Google Scholar]
  7. Li, M.; Zou, M.; Li, H. Urban Travel Behavior Study Based on Data Fusion Model. In Data-Driven Solutions to Transportation Problems; Elsevier Science: Amsterdam, The Netherlands, 2019; pp. 111–135. [Google Scholar] [CrossRef]
  8. Wen, C.; Koppelman, F.S. A conceptual and methdological framework for the generation of activity-travel patterns. Transportation 2000, 27, 5–23. [Google Scholar] [CrossRef]
  9. Torsten, H. What about people in regional science? Reg. Sci. Assoc. 1970, 24, 6–21. [Google Scholar]
  10. Schönfelder, S.; Axhausen, K.W. Activity spaces: Measures of social exclusion ? Transp. Policy 2003, 10, 273–286. [Google Scholar] [CrossRef] [Green Version]
  11. Ben-Aakiva, M.; Lerman, S. Discrete Choice Analysis: Theory and Application to Travel Demand; MIT Press: Cambridge, MA, USA, 1985. [Google Scholar]
  12. McFadden, D. Conditional logit analysis of qualitative choice behavior. In The Econometric Society; Zaremba, P., Ed.; Academic Press: New York, NY, USA, 1974; pp. 105–142. [Google Scholar]
  13. Rasouli, S.; Timmermans, H. Applications of theories and models of choice and decision-making under conditions of uncertainty in travel behavior research. Travel Behav. Soc. 2014, 1, 79–90. [Google Scholar] [CrossRef]
  14. Ajzen, I. From intentions to actions: A theory of planned behavior. In Action Control; Kuhl, J., Beckmann, J., Eds.; Springer: Berlin/Heidelberg, Germany, 1985; pp. 11–39. ISBN 9783642697487. [Google Scholar]
  15. Vafeiadis, E.; Naess, P. An Interdisciplinary Study of Transport Mode Choice. Diploma Thesis, Aalborg University, Aalborg, Denmark, 2012. [Google Scholar]
  16. Cervero, R.; Kockelman, K. Travel Demand and the3D: Density, Design, Diversity. Transp. Res. Part D Transp. Environ. 1997, 2, 199–219. [Google Scholar] [CrossRef]
  17. Ewing, R.; Cervero, R. Travel and the Built Environment: A Synthesis. Transp. Res. Rec. 2001, 1780, 87–114. [Google Scholar] [CrossRef] [Green Version]
  18. Ewing, R.; Greenwald, M.J.; Zhang, M.; Walters, J.; Feldman, M.; Cervero, R.; Thomas, J. Measuring the Impact of Urban Form and Transit Access on Mixed Use Site Trip Generation Rates—Portland Pilot Study; US Environmental Protection Agency: Washington, DC, USA, 2009. [Google Scholar]
  19. Ewing, R.; Cervero, R. Travel and the built environment. J. Am. Plan. Assoc. 2010, 76, 265–294. [Google Scholar] [CrossRef]
  20. Lanzendorf, M. Mobility Styles and Travel Behavior: Application of a Lifestyle Approach to Leisure Travel. Transp. Res. Rec. J. Transp. Res. Board 2002, 1807, 163–173. [Google Scholar] [CrossRef]
  21. Cao, X.; Mokhtarian, P.L.; Handy, S.L. Examining the Impacts of Residential Self-Selection on Travel Behaviour: A Focus on Empirical Findings; Routledge Taylor and Francis Group: London, UK, 2009; Volume 29, ISBN 0144164080253. [Google Scholar]
  22. Hiscock, R.; Macintyre, S.; Kearns, A.; Ellaway, A. Means of transport and ontological security: Do cars provide psycho-social benefits to their users? Transp. Res. Part D Transp. Environ. 2002, 7, 119–135. [Google Scholar] [CrossRef]
  23. Steg, L. Car use: Lust and must. Instrumental, symbolic and affective motives for car use. Transp. Res. Part A Policy Pract. 2005, 39, 147–162. [Google Scholar] [CrossRef]
  24. Mars, L.; Arroyo, R.; Ruiz, T. Qualitative Research in Travel Behavior Studies. Transp. Res. Procedia 2016, 18, 434–445. [Google Scholar] [CrossRef]
  25. Bhatia, R. Land use: A key to livable transportation. In Proceedings of the 40th International Making Cities Livable Conference, London, UK, 13–17 June 2004. [Google Scholar]
  26. Cervero, R.; Duncan, M. Walking, Bicycling, and Urban Landscapes: Evidence from the San Francisco Bay Area. Am. J. Public Health 2003, 93, 1478–1483. [Google Scholar] [CrossRef]
  27. Handy, S.; Cao, X.; Mokhtarian, P.L. Self-Selection in the Relationship between the Built Environment and Walking: Empirical Evidence from Northern California. J. Am. Plan. Assoc. 2006, 72, 55–74. [Google Scholar] [CrossRef]
  28. Targa, F.; Bank, W.; Clifton, K.J. Built environment and trip generation for non-motorized travel. In Proceedings of the National Household Travel Survey Conference: Data for Understanding Our Nation’s Travel, Washington, DC, USA, 1–2 November 2004. [Google Scholar]
  29. Boarnet, M.G.; Greenwald, M.; McMillan, T.E. Walking, urban design, and health: Toward a cost-benefit analysis framework. J. Plan. Educ. Res. 2008, 27, 341–358. [Google Scholar] [CrossRef]
  30. Van Acker, V.; Mokhtarian, P.L.; Witlox, F. Car availability explained by the structural relationships between lifestyles, residential location, and underlying residential and travel attitudes. Transp. Policy 2014, 35, 88–99. [Google Scholar] [CrossRef]
  31. Beirão, G.; Sarsfield Cabral, J.A. Understanding attitudes towards public transport and private car: A qualitative study. Transp. Policy 2007, 14, 478–489. [Google Scholar] [CrossRef]
  32. Thomas, G.O.; Walker, I.; Musselwhite, C. Grounded Theory analysis of commuters discussing a workplace carbon-reduction target: Autonomy, satisfaction, and willingness to change behaviour in drivers, pedestrians, bicyclists, motorcyclists, and bus users. Transp. Res. Part F Traffic Psychol. Behav. 2014, 26, 72–81. [Google Scholar] [CrossRef]
  33. Lovejoy, K.; Handy, S. Social networks as a source of private-vehicle transportation: The practice of getting rides and borrowing vehicles among Mexican immigrants in California. Transp. Res. Part A Policy Pract. 2011, 45, 248–257. [Google Scholar] [CrossRef]
  34. Bartle, C.; Avineri, E.; Chatterjee, K. Online information-sharing: A qualitative analysis of community, trust and social influence amongst commuter cyclists in the UK. Transp. Res. Part F Traffic Psychol. Behav. 2013, 16, 60–72. [Google Scholar] [CrossRef]
  35. Hannes, E.; Janssens, D.; Wets, G. Does space matter?: Travel mode scripts in daily activity travel. Environ. Behav. 2009, 41, 75–100. [Google Scholar] [CrossRef]
  36. Aldred, R.; Woodcock, J. Reframing safety: An analysis of perceptions of cycle safety clothing. Transp. Policy 2015, 42, 103–112. [Google Scholar] [CrossRef] [Green Version]
  37. Baslington, H. School Travel Plans: Overcoming Barriers to Implementation. Transp. Rev. 2008, 28, 239–258. [Google Scholar] [CrossRef]
  38. Skippon, S.M. How consumer drivers construe vehicle performance: Implications for electric vehicles. Transp. Res. Part F Traffic Psychol. Behav. 2014, 23, 15–31. [Google Scholar] [CrossRef]
  39. Marra, A.D.; Becker, H.; Axhausen, K.W.; Corman, F. Developing a passive GPS tracking system to study long-term travel behavior. Transp. Res. Part C Emerg. Technol. 2019, 104, 348–368. [Google Scholar] [CrossRef] [Green Version]
  40. Thakur, A.; Pinjari, A.R.; Zanjani, A.B.; Short, J.; Mysore, V.; Tabatabaee, S.F. Development of algorithms to convert large streams of truck GPS data into truck trips. Transp. Res. Rec. 2015, 2529, 66–73. [Google Scholar] [CrossRef]
  41. Tawfik, A.M.; Rakha, H.A. Network route-choice evolution in a real-world experiment: Necessary shift from network- to driver-oriented modeling. Transp. Res. Rec. 2012, 2322, 70–81. [Google Scholar] [CrossRef]
  42. Schönfelder, S.; Samaga, U. Where do you want to go today? More observations on daily mobility. In Proceedings of the STRC 03 Conference Paper Updated Session Mobility, Ascona, Switzerland, 19–21 March 2003. [Google Scholar]
  43. Zhang, W.; Song, Y.; Qi, Y.; Li, Q.; Shen, M. Traveler Behavior Analysis Based on Car2Go Sharing Operation Data. In Proceedings of the International Conference on Transportation and Development, Pittsburgh, PA, USA, 15–18 July 2018; American Society of Civil Engineers: Reston, VA, USA, 2018; pp. 126–137. [Google Scholar]
  44. Mauch, M.; Taylor, B.D. Gender, Race, and Travel Behavior: Analysis of Household-Serving Travel and Commuting in San Francisco Bay Area. Transp. Res. Rec. J. Transp. Res. Board 1997, 1607, 147–153. [Google Scholar] [CrossRef]
  45. Elias, W.; Benjamin, J.; Shiftan, Y. Gender differences in activity and travel behavior in the Arab world. Transp. Policy 2015, 44, 19–27. [Google Scholar] [CrossRef]
  46. Bardazzi, R.; Pazienza, M.G. Ageing and private transport fuel expenditure: Do generations matter? Energy Policy 2018, 117, 396–405. [Google Scholar] [CrossRef]
  47. Barnes, R.; Winters, M.; Ste-Marie, N.; McKay, H.; Ashe, M.C. Age and retirement status differences in associations between the built environment and active travel behaviour. J. Transp. Health 2016, 3, 513–522. [Google Scholar] [CrossRef]
  48. Lizana, M.; Carrasco, J.A.; Tudela, A. Studying the relationship between activity participation, social networks, expenditures and travel behavior on leisure activities. Transportation 2020, 47, 1765–1786. [Google Scholar] [CrossRef]
  49. Lin, T.; Wang, D.; Zhou, M. Residential relocation and changes in travel behavior: What is the role of social context change? Transp. Res. Part A Policy Pract. 2018, 111, 360–374. [Google Scholar] [CrossRef]
  50. Srinivasan, S.; Ferreira, J. Travel behavior at the household level: Understanding linkages with residential choice. Transp. Res. Part D Transp. Environ. 2002, 7, 225–242. [Google Scholar] [CrossRef]
  51. Bajracharya, A.R.; Shrestha, S.; Skotte, H. Linking Travel Behavior and Urban Form with Travel Energy Consumption for Kathmandu Valley, Nepal. J. Urban Plan. Dev. 2020, 146, 05020008. [Google Scholar] [CrossRef]
  52. Girod, B.; van Vuuren, D.P.; de Vries, B. Influence of travel behavior on global CO2 emissions. Transp. Res. Part A Policy Pract. 2013, 50, 183–197. [Google Scholar] [CrossRef] [Green Version]
  53. Kamruzzaman, M.; De Vos, J.; Currie, G.; Giles-Corti, B.; Turrell, G. Spatial biases in residential mobility: Implications for travel behaviour research. Travel Behav. Soc. 2020, 18, 15–28. [Google Scholar] [CrossRef]
  54. Stelina, J. Legal restrictions on work on Sundays and festive days in Poland. Istor. Cult. Cetatenie Un. Eur. 2018, 11, 105–114. [Google Scholar]
  55. Cheng, X.; Huang, K.; Qu, L.; Zhang, T.; Li, L. Effects of Vehicle Restriction Policies on Urban Travel Demand Change from a Built Environment Perspective. J. Adv. Transp. 2020, 2020, 9848095. [Google Scholar] [CrossRef]
  56. Gu, Y.; Deakin, E.; Long, Y. The effects of driving restrictions on travel behavior evidence from Beijing. J. Urban Econ. 2017, 102, 106–122. [Google Scholar] [CrossRef]
  57. Yang, J.; Liu, A.A.; Qin, P.; Linn, J. The effect of vehicle ownership restrictions on travel behavior: Evidence from the Beijing license plate lottery. J. Environ. Econ. Manag. 2020, 99, 102269. [Google Scholar] [CrossRef]
  58. Arroyo, R.; Ruiz, T.; Casquero, D.; Mars, L. Trip Characteristics Analysis of the Effects of a Travel Behavior Change Program. Transp. Res. Rec. 2018, 2672, 146–158. [Google Scholar] [CrossRef]
  59. García-Garcés, P.; Ruiz, T.; Habib, K.M.N. Effect of travel behaviour change programmes on time allocated to driving. Transp. A Transp. Sci. 2016, 12, 1–19. [Google Scholar] [CrossRef]
  60. Shires, J.; Marsden, G.; Docherty, I.; Anable, J. Forth Road Bridge Closure Survey: Analysis of Commuter Behaviour. Transp. A Transp. Sci. 2016, 12, 1–19. [Google Scholar]
  61. Walsh, C.L.; Glendinning, S.; Castán-Broto, V.; Dewberry, E.; Powell, M. Are wildcard events on infrastructure systems opportunities for transformational change? Futures 2015, 67, 1–10. [Google Scholar] [CrossRef] [Green Version]
  62. Parkes, S.D.; Jopson, A.; Marsden, G. Understanding travel behaviour change during mega-events: Lessons from the London 2012 Games. Transp. Res. Part A Policy Pract. 2016, 92, 104–119. [Google Scholar] [CrossRef]
  63. Li, R.; Guo, M. Effects of odd—Even traffic restriction on travel speed and traffic volume: Evidence from Beijing Olympic Games. J. Traffic Transp. Eng. 2016, 3, 71–81. [Google Scholar] [CrossRef] [Green Version]
  64. Han, Y.; Zhang, T.; Wang, M. Holiday travel behavior analysis and empirical study with Integrated Travel Reservation Information usage. Transp. Res. Part A Policy Pract. 2020, 134, 130–151. [Google Scholar] [CrossRef]
  65. Wang, B.; Shao, C.; Li, J.; Weng, J.; Ji, X. Holiday travel behavior analysis and empirical study under integrated multimodal travel information service. Transp. Policy 2015, 39, 21–36. [Google Scholar] [CrossRef]
  66. Ren, X.; Chen, Z.; Wang, F.; Wang, J.; Wang, C.; Dan, T.; Du, Z. Impact of high-speed rail on intercity travel behavior change: The evidence from the Chengdu-Chongqing Passenger Dedicated Line. J. Transp. Land Use 2019, 12, 265–285. [Google Scholar] [CrossRef] [Green Version]
  67. Nouvellet, P.; Bhatia, S.; Cori, A.; Ainslie, K.E.C.; Baguelin, M.; Bhatt, S.; Boonyasiri, A.; Brazeau, N.F.; Cattarino, L.; Cooper, L.V.; et al. Reduction in mobility and COVID-19 transmission. Nat. Commun. 2021, 12, 1090. [Google Scholar] [CrossRef]
  68. Baig, A.M.; Khaleeq, A.; Ali, U.; Syeda, H. Evidence of the COVID-19 Virus Targeting the CNS: Tissue Distribution, Host-Virus Interaction, and Proposed Neurotropic Mechanisms. ACS Chem. Neurosci. 2020, 11, 995–998. [Google Scholar] [CrossRef] [Green Version]
  69. Przybylowski, A.; Stelmak, S.; Suchanek, M. Mobility behaviour in view of the impact of the COVID-19 pandemic-public transport users in gdansk case study. Sustainability 2021, 13, 364. [Google Scholar] [CrossRef]
  70. Smolarski, M. Restrictions on regional passenger transport during epidemiological threat (COVID-19)—An example of the Lower Silesian Voivodship in Poland. Pr. Kom. Geogr. Komun. PTG 2020, 23, 56–61. [Google Scholar] [CrossRef]
  71. Van Paassen, J.; Vos, J.S.; Hoekstra, E.M.; Neumann, K.M.I.; Boot, P.C.; Arbous, S.M. Corticosteroid use in COVID-19 patients: A systematic review and meta-analysis on clinical outcomes. Crit. Care 2020, 24, 696. [Google Scholar] [CrossRef]
  72. Goniewicz, K.; Khorram-Manesh, A.; Hertelendy, A.J.; Goniewicz, M.; Naylor, K.; Burkle, F.M. Current response and management decisions of the European Union to the COVID-19 outbreak: A review. Sustainability 2020, 12, 3838. [Google Scholar] [CrossRef]
  73. Basu, R.; Ferreira, J. Sustainable mobility in auto-dominated Metro Boston: Challenges and opportunities post-COVID-19. Transp. Policy 2021, 103, 197–210. [Google Scholar] [CrossRef]
  74. Sarkady, D.; Neuburger, L.; Egger, R. Virtual Reality as a Travel Substitution Tool during COVID-19. In Information and Communication Technologies in Tourism 2021; Wörndl, W., Koo, C., Stienmetz, J.L., Eds.; Springer International Publishing: Cham, Switzerland, 2021; pp. 452–463. [Google Scholar] [CrossRef]
  75. Combs, T.S.; Pardo, C.F. Shifting streets COVID-19 mobility data: Findings from a global dataset and a research agenda for transport planning and policy. Transp. Res. Interdiscip. Perspect. 2021, 9, 100322. [Google Scholar] [CrossRef]
  76. Gössling, S.; Scott, D.; Hall, C.M. Pandemics, tourism and global change: A rapid assessment of COVID-19. J. Sustain. Tour. 2020, 29, 1–20. [Google Scholar] [CrossRef]
  77. Shamshiripour, A.; Rahimi, E.; Shabanpour, R.; Mohammadian, A. (Kouros) How is COVID-19 reshaping activity-travel behavior? Evidence from a comprehensive survey in Chicago. Transp. Res. Interdiscip. Perspect. 2020, 7, 100216. [Google Scholar] [CrossRef]
  78. Browne, H.P.; Forster, S.C.; Anonye, B.O.; Kumar, N.; Neville, B.A.; Stares, M.D.; Goulding, D.; Lawley, T.D. Culturing of “unculturable” human microbiota reveals novel taxa and extensive sporulation. Nature 2016, 533, 543–546. [Google Scholar] [CrossRef] [PubMed] [Green Version]
  79. Goscé, L.; Johansson, A. Analysing the link between public transport use and airborne transmission: Mobility and contagion in the London underground. Environ. Health 2018, 17, 84. [Google Scholar] [CrossRef] [PubMed] [Green Version]
  80. Morawska, L.; Tang, J.W.; Bahnfleth, W.; Bluyssen, P.M.; Boerstra, A.; Buonanno, G.; Cao, J.; Dancer, S.; Floto, A.; Franchimon, F.; et al. How can airborne transmission of COVID-19 indoors be minimised? Environ. Int. 2020, 142, 105832. [Google Scholar] [CrossRef] [PubMed]
  81. Marston, H.R.; Musselwhite, C.; Hadley, R. COVID-19 vs Social Isolation: The Impact Technology can have on Communities, Social Connections and Citizens. Ageing Issues 2020, 1–6. Available online: https://ageingissues.wordpress.com/2020/03/18/COVID-19-vs-socialisolation-the-impact-technology-can-have-on-communities-social-connections-and-citizens/?fbclid=IwAR1sUsffKNd_G5u6d_oc0Z56u4Es7HyoCJYKr0qSnqFxX68pD3PY5JaSl7g (accessed on 4 March 2022).
  82. Troko, J.; Myles, P.; Gibson, J.; Hashim, A.; Enstone, J.; Kingdon, S.; Packham, C.; Amin, S.; Hayward, A.; Van-Tam, J.N. Is public transport a risk factor for acute respiratory infection? BMC Infect. Dis. 2011, 11, 16. [Google Scholar] [CrossRef] [Green Version]
  83. Chinazzi, M.; Davis, J.T.; Ajelli, M.; Gioannini, C.; Litvinova, M.; Merler, S.; Pastore y Piontti, A.; Mu, K.; Rossi, L.; Sun, K.; et al. The effect of travel restrictions on the spread of the 2019 novel coronavirus (COVID-19) outbreak. Science 2020, 368, 395–400. [Google Scholar] [CrossRef] [Green Version]
  84. Irawan, M.Z.; Belgiawan, P.F.; Joewono, T.B.; Bastarianto, F.F.; Rizki, M.; Ilahi, A. Exploring activity-travel behavior changes during the beginning of COVID-19 pandemic in Indonesia. Transportation 2021, 49, 529–553. [Google Scholar] [CrossRef] [PubMed]
  85. Abdullah, M.; Ali, N.; Hussain, S.A.; Aslam, A.B.; Javid, M.A. Measuring changes in travel behavior pattern due to COVID-19 in a developing country: A case study of Pakistan. Transp. Policy 2021, 108, 21–33. [Google Scholar] [CrossRef]
  86. Grenfell, B.; Dye, C.; Wang, Q.; Pybus, O.; Bjornstad, O.N.; Cui, Y.; Yang, R.; Song, Y.; Zheng, P.; Tian, H.; et al. Early evaluation of transmission control measures in response to the 2019 novel coronavirus outbreak in China. medRxiv 2020. [Google Scholar] [CrossRef] [Green Version]
  87. Linka, K.; Peirlinck, M.; Sahli Costabal, F.; Kuhl, E. Outbreak dynamics of COVID-19 in Europe and the effect of travel restrictions. Comput. Methods Biomech. Biomed. Engin. 2020, 23, 710–717. [Google Scholar] [CrossRef] [PubMed]
  88. Müller, S.A.; Balmer, M.; Neumann, A.; Nagel, K. Mobility traces and spreading of COVID-19. medRxiv 2020, 1–22. [Google Scholar] [CrossRef] [Green Version]
  89. Vannoni, M.; McKee, M.; Semenza, J.C.; Bonell, C.; Stuckler, D. Using volunteered geographic information to assess mobility in the early phases of the COVID-19 pandemic: A cross-city time series analysis of 41 cities in 22 countries from March 2nd to 26th 2020. Glob. Health 2020, 16, 85. [Google Scholar] [CrossRef]
  90. Borkowski, P.; Jażdżewska-Gutta, M.; Szmelter-Jarosz, A. Lockdowned: Everyday mobility changes in response to COVID-19. J. Transp. Geogr. 2021, 90, 102906. [Google Scholar] [CrossRef]
  91. Pawar, D.S.; Yadav, A.K.; Akolekar, N.; Velaga, N.R. Impact of physical distancing due to novel coronavirus (SARS-CoV-2) on daily travel for work during transition to lockdown. Transp. Res. Interdiscip. Perspect. 2020, 7, 100203. [Google Scholar] [CrossRef]
  92. Tardivo, A.; Sánchez Martín, C.; Carrillo Zanuy, A. COVID-19 impact in Transport, an essay from the Railways’ system research perspective. Transp. Res. Rec. J. Transp. Res. Board. 2020, 2675, 367–378. [Google Scholar] [CrossRef]
  93. Wiese, A.; Zielke, S.; Toporowski, W. Shopping travel behaviour: Influencing factors, shopper types and environmental consequences. Int. J. Retail Distrib. Manag. 2015, 43, 469–484. [Google Scholar] [CrossRef]
  94. Zhang, Y.; Zhao, P.; Lin, J.-J. Exploring shopping travel behavior of millennials in Beijing: Impacts of built environment, life stages, and subjective preferences. Transp. Res. Part A Policy Pract. 2021, 147, 49–60. [Google Scholar] [CrossRef]
  95. Farag, S.; Dijst, M.; Lanzendorf, M. Exploring the Use of E-Shopping and Its Impact on Personal Travel Behavior in the Netherlands. Transp. Res. Rec. 2003, 3058, 47–54. [Google Scholar] [CrossRef] [Green Version]
  96. Zhou, Y.; Wang, X. (Cara) Explore the relationship between online shopping and shopping trips: An analysis with the 2009 NHTS data. Transp. Res. Part A Policy Pract. 2014, 70, 1–9. [Google Scholar] [CrossRef]
  97. Chmielewski, J. Impact of Sunday Trade Ban on Traffic Volumes. In Scientific and Technical Conference Transport Systems Theory and Practice; Springer: Cham, Switzerland, 2019; pp. 231–241. [Google Scholar]
  98. Macioszek, E.; Lach, D. Analysis of the Results of General Traffic Measurements in the West Pomeranian Voivodeship from 2005 to 2015. Sci. J. Silesian Univ. Technol. Ser. Transp. 2017, 97, 93–104. [Google Scholar] [CrossRef]
  99. Macioszek, E.; Lach, D. Comparative analysis of the results of general traffic measurements for the Silesian Voivodeship and Poland. Sci. J. Silesian Univ. Technol. Ser. Transp. 2018, 100, 105–113. [Google Scholar] [CrossRef]
  100. Macioszek, E.; Lach, D. Analysis of Traffic Conditions at the Brzezinska and Nowochrzanowska Intersection in Myslowice (Silesian Province, Poland). Sci. J. Silesian Univ. Technol. Ser. Transp. 2018, 98, 81–88. [Google Scholar] [CrossRef]
  101. Parady, G.; Taniguchi, A.; Takami, K. Travel behavior changes during the COVID-19 pandemic in Japan: Analyzing the effects of risk perception and social influence on going-out self-restriction. Transp. Res. Interdiscip. Perspect. 2020, 7, 100181. [Google Scholar] [CrossRef]
  102. Beck, M.J.; Hensher, D.A. Insights into the impact of COVID-19 on household travel and activities in Australia—The early days under restrictions. Transp. Policy 2020, 96, 76–93. [Google Scholar] [CrossRef]
  103. Hannam, K.; Sheller, M.; Urry, J. Editorial: Mobilities, Immobilities and Moorings. Mobilities 2006, 1, 1–22. [Google Scholar] [CrossRef]
  104. Kovács, A.; Sikos, T.T. The Impact of Sunday Closure on Consumer Behavior. Rom. Rev. Reg. Stud. J. Cent. Reg. Geogr. 2016, 12, 39–50. [Google Scholar]
  105. Freathy, P.; Sparks, L. Sunday working in the retail trade. Int. J. Retail Distrib. Manag. 1993, 21, 3. [Google Scholar] [CrossRef]
  106. Skuterud, M. The impact of Sunday shopping on employment and hours of work in the retail industry: Evidence from Canada. Eur. Econ. Rev. 2005, 49, 1953–1978. [Google Scholar] [CrossRef]
  107. Genakos, C.; Danchev, S. Evaluating the Impact of Sunday Trading Deregulation; Centre for Economic Performance (CEP): London, UK, 2015. [Google Scholar]
  108. Khan, H. Sunday is the new Saturday: Sunday trading reforms and its effects on family-run SMEs, employees and consumers. J. Small Bus. Enterp. Dev. 2018, 25, 960–984. [Google Scholar] [CrossRef] [Green Version]
  109. Kim, W.; Lee, H. The Effects of Trading-Hour Regulations on Large Stores in Korea. J. Distrib. Sci. 2017, 15, 5–14. [Google Scholar]
  110. Atserias, A.; Ochremiak, J. Definable ellipsoid method, sums-of-squares proofs, and the isomorphism problem. In Proceedings of the 33rd Annual ACM/IEEE Symposium on Logic in Computer Science, Oxford, UK, 9–12 July 2018; pp. 66–75. [Google Scholar] [CrossRef] [Green Version]
  111. Gurazda, P. Ograniczenie handlu a konstytucyjne prawa i wolności przedsiębiorców. Zesz. Stud. Kół Nauk. Wydz. Prawa i Adm. UAM 2020, 10, 67–81. [Google Scholar]
  112. Končar, J.; Marić, R.; Vukmirović, G.; Vučenović, S. Sustainability of food placement in retailing during the COVID-19 pandemic. Sustainability 2021, 13, 5956. [Google Scholar] [CrossRef]
  113. Wójcik, M. Rozwój osadnictwa wiejskiego w województwie łódzkim. Acta Univ. Lodz. Folia Geogr. Socio-Oeconomica 2008, 9, 115–122. [Google Scholar]
  114. Liszewski, S. Zarys Monografii Województwa Łódzkiego; Funkcja Regionalna Łodzi i Jej Rola w Kształtowaniu Województwa; Łódzkie Towarzystwo Naukowe: Łódź, Poland, 2001; p. 456. ISBN 8387749478. [Google Scholar]
  115. Kowalski, M.; Wiśniewski, S. Centrum handlowe jako czynnik ruchotwórczy w transporcie samochodowym—Przykład Portu Łódź. Prz. Geogr. 2017, 89, 617–639. [Google Scholar] [CrossRef] [Green Version]
  116. GUS Badanie pilotażowe zachowań komunikacyjnych ludności w Polsce; Jachranka. 2015. Available online: https://stat.gov.pl/files/gfx/portalinformacyjny/pl/defaultaktualnosci/6334/14/1/1/badanie_pilotazowe_zachowan_komunikacyjnych_ludnosci_w_polsce.pdf (accessed on 4 March 2022).
  117. Ioannidis, J.P.A. A fiasco in the making? As the coronavirus pandemic takes hold, we are making decisions without reliable data. Stat 2020, 17, 1–6. [Google Scholar]
  118. Kowalski, M.; Wiśniewski, S. Natężenie ruchu a zagospodarowanie Łodzi—Zarys problematyki w świetle danych z Obszarowego Systemu Sterowania Ruchem. Pr. Kom. Geogr. Komun. PTG 2017, 20, 20–36. [Google Scholar] [CrossRef] [Green Version]
  119. Li, S.; Dragicevic, S.; Castro, F.A.; Sester, M.; Winter, S.; Coltekin, A.; Pettit, C.; Jiang, B.; Haworth, J.; Stein, A.; et al. Geospatial big data handling theory and methods: A review and research challenges. ISPRS J. Photogramm. Remote Sens. 2016, 115, 119–133. [Google Scholar] [CrossRef] [Green Version]
  120. Po, L.; Rollo, F.; Bachechi, C.; Corni, A. From sensors data to urban traffic flow analysis. In Proceedings of the 5th IEEE International Smart Cities Conference ISC2, Casablanca, Morocco, 14–17 October 2019; pp. 478–485. [Google Scholar] [CrossRef] [Green Version]
  121. Twardzik, M. Typologia i znaczenie centrów handlowych dla miast województwa śląskiego. Stud. Miej. 2014, 16, 129–145. [Google Scholar] [CrossRef]
  122. Tarkowski, M.; Puzdrakiewicz, K.; Jaczewska, J.; Połom, M. COVID-19 lockdown in Poland—Changes in regional and local mobility patterns based on Google Maps data. Pr. Kom. Geogr. Komun. PTG 2020, 23, 46–55. [Google Scholar] [CrossRef]
  123. GUS Główny Urząd Statystyczny w Polsce. Available online: https://stat.gov.pl/ (accessed on 10 March 2021).
  124. Śliż, P. Remote work during the COVID-19 epidemic in Poland—Results of an empirical study. E-Mentor 2020, 85, 50–85. [Google Scholar] [CrossRef]
  125. Abdullah, M.; Dias, C.; Muley, D.; Shahin, M. Exploring the impacts of COVID-19 on travel behavior and mode preferences. Transp. Res. Interdiscip. Perspect. 2020, 8, 100255. [Google Scholar] [CrossRef] [PubMed]
  126. Aloi, A.; Alonso, B.; Benavente, J.; Cordera, R.; Echániz, E.; González, F.; Ladisa, C.; Lezama-Romanelli, R.; López-Parra, Á.; Mazzei, V.; et al. Effects of the COVID-19 lockdown on urban mobility: Empirical evidence from the city of Santander (Spain). Sustainability 2020, 12, 3870. [Google Scholar] [CrossRef]
  127. Tirachini, A.; Cats, O. COVID-19 and public transportation: Current assessment, prospects, and research needs. J. Public Transp. 2020, 22. [Google Scholar] [CrossRef]
Figure 1. Population density against the retail network in Łódź.
Sustainability 14 05137 g001
Figure 2. Distribution of intersections with induction loop sensors against the network of road infrastructure and types of built-up development in Łódź.
Sustainability 14 05137 g002
Figure 3. The annual number of trips arranged by the capitals of the provinces in Poland. Source: own elaboration based on Pilot Survey… [116].
Sustainability 14 05137 g003
Figure 4. The percentage of trips arranged by selected destinations in Łódź. Source: own elaboration based on Pilot Survey… [116].
Sustainability 14 05137 g004
Figure 5. The average distance of shopping trip per person arranged by the capitals of the provinces in Poland. Source: own elaboration based on Pilot Survey… [116].
Sustainability 14 05137 g005
Figure 6. The structure of annual car mileage arranged by trip length in Łódź. Source: own elaboration based on Pilot Survey… [116].
Sustainability 14 05137 g006
Figure 7. The diagram of datasets used in the study.
Sustainability 14 05137 g007
Figure 8. The diagram presents the procedure of building a dataset from the ITS data to be used in further analyses.
Sustainability 14 05137 g008
Figure 9. Temporal differentiation of the average number of vehicles on the road network in Łódź for weeks with a trading (A) and non-trading (B) Sunday in 2018. Source: own elaboration based on the ITS in Łódź.
Sustainability 14 05137 g009
Figure 10. Temporal differentiation of the average number of vehicles on the road network in Łódź for weeks with a trading (A) and non-trading (B) Sunday in 2019. Source: own elaboration based on the ITS in Łódź.
Sustainability 14 05137 g010
Figure 11. Temporal differentiation of the average number of vehicles on the road network in Łódź in 2017. Source: own elaboration based on the ITS in Łódź.
Sustainability 14 05137 g011
Figure 12. Temporal differentiation of the average number of vehicles on the road network in Łódź for weeks with a trading (A) and non-trading (B) Sunday in 2020. Source: own elaboration based on the ITS in Łódź.
Sustainability 14 05137 g012
Figure 13. Temporal differentiation of the average number of vehicles on the road network in Łódź for weeks with a trading (A) and non-trading (B) Sunday in 2021. Source: own elaboration based on the ITS in Łódź.
Sustainability 14 05137 g013
Figure 14. Spatial differentiation of the average number of vehicles on the road network in Łódź on Saturdays preceding trading Sundays (A) and its change on Saturdays preceding non-trading Sundays (B) between 2016 and 2021. Source: own elaboration based on the ITS in Łódź.
Sustainability 14 05137 g014
Figure 15. Spatial differentiation of the average number of vehicles on the road network in Łódź on trading Sundays (A) and its change on non-trading Sundays (B) between 2016 and 2021. Source: own elaboration based on the ITS in Łódź.
Sustainability 14 05137 g015
Figure 16. Temporal differentiation of the number of vehicles recorded by the ITS in Łódź against the number of new infections (A), deaths (B), and people who were quarantined (C) and hospitalised (D) due to the COVID-19 pandemic. Blue zone—number of vehicles; blue line—the trendline for the number of vehicles; red zone—variables related to COVID-19; red line—the trendline for variables related to COVID-19. Source: own elaboration based on the data from ITS in Łódź and the Ministry of Health.
Sustainability 14 05137 g016aSustainability 14 05137 g016b
Figure 17. Temporal changeability of the number of vehicles recorded by the ITS in Łódź on Sundays (A), Saturdays (B), Mondays (C), Fridays (D), and Tuesdays, Wednesdays, and Thursdays (E) during the COVID-19 pandemic against the background of effective retail restrictions. Green point—public and religious holidays (days off work); T—days of the week with a trading Sunday; red line—the period when a restriction remained in force (e.g., #1); blue line—the number of vehicles between 2020 and 2021; intermittent grey line—the number of vehicles in the corresponding period a year before. Source: own elaboration based on the data from the ITS in Łódź.
Sustainability 14 05137 g017aSustainability 14 05137 g017b
Figure 18. Changes in the percentages of vehicle traffic recorded for different parts of the city during the various retail restrictions imposed under the pandemic when compared to the corresponding period a year before. Source: own elaboration based on the data from the ITS in Łódź.
Sustainability 14 05137 g018
Table 1. Weekly distribution of road traffic in Łódź between 2016 and 2021.
MondayTuesdayWednesdayThursdayFridaySaturdaySunday
201614.9%15.3%15.6%15.8%15.8%12.4%10.2%
201715.3%15.6%16.1%13.0%11.2%14.5%14.3%
2018week with trading Sunday15.1%15.4%15.5%15.5%15.9%12.4%10.1%
week with non-trading Sunday15.7%15.8%16.1%16.2%16.1%11.6%8.5%
2019week with trading Sunday14.9%15.3%15.1%15.2%16.1%12.8%10.7%
week with non-trading Sunday15.4%15.8%15.8%15.6%15.9%12.5%9.1%
2020week with trading Sunday15.2%15.7%15.5%15.7%16.2%12.0%9.8%
week with non-trading Sunday16.5%17.0%17.0%16.4%13.5%11.0%8.6%
2021week with trading Sunday15.6%15.9%15.8%15.7%16.3%11.5%9.2%
week with non-trading Sunday15.5%15.7%15.9%16.0%16.6%12.5%7.9%
Source: own elaboration based on the data from the ITS in Łódź.
Table 2. Retail sales of goods in Poland during the COVID-19 pandemic (March 2020–March 2021).
PeriodsFood, Beverages and Tobacco ProductsTextiles, Clothing, FootwearFurniture, Radio, TV and Household Appliances
Corresponding period of previous year = 100
2020 III109.949.583.5
2020 IV90.935.483.4
2020 V97.788.3114.6
2020 VI100.293.5116.8
2020 VII103.0103.4116.8
2020 VIII99.999.5110.9
2020 IX104.896.5109.7
2020 X100.988.3113.0
2020 XI99.475.6100.7
2020 XII102.385.7105.1
2021 I100.557.2108.8
2021 II95.6109.9111.1
2021 III103.7190.7141.3
Source: own elaboration based on the data from the Polish Central Statistical Office [123].
Publisher’s Note: MDPI stays neutral with regard to jurisdictional claims in published maps and institutional affiliations.

