Article

Grade Prediction Modeling in Hybrid Learning Environments for Sustainable Engineering Education

by
Zoe Kanetaki
1,
Constantinos Stergiou
1,
Georgios Bekas
1,
Sébastien Jacques
2,*,
Christos Troussas
3,
Cleo Sgouropoulou
3 and
Abdeldjalil Ouahabi
4
1
Laboratory of Mechanical Design, Department of Mechanical Engineering, University of West Attica, 12241 Athens, Greece
2
Research Group on Materials, Microelectronics, Acoustics and Nanotechnology (GREMAN), University of Tours, UMR 7347, CNRS, INSA Centre Val-de-Loire, 37100 Tours, France
3
Educational Technology and eLearning Systems Laboratory, Department of Informatics and Computer Engineering, University of West Attica, 12243 Athens, Greece
4
UMR 1253, iBrain, Université de Tours, INSERM, 37000 Tours, France
*
Author to whom correspondence should be addressed.
Sustainability 2022, 14(9), 5205; https://0-doi-org.brum.beds.ac.uk/10.3390/su14095205
Submission received: 8 March 2022 / Revised: 19 April 2022 / Accepted: 21 April 2022 / Published: 26 April 2022

Abstract

:
Since mid-March 2020, due to the COVID-19 pandemic, higher education has been facing a very uncertain situation, despite the hasty implementation of information and communication technologies for distance and online learning. Hybrid learning, i.e., the mixing of distance and face-to-face learning, seems to be the rule in most universities today. In order to build a post-COVID-19 university education, i.e., one that is increasingly digital and sustainable, it is essential to learn from these years of health crisis. In this context, this paper aims to identify and quantify the main factors affecting mechanical engineering student performance in order to build a generalized linear autoregressive (GLAR) model. This model, which is distinguished by its simplicity and ease of implementation, is responsible for predicting student grades in online learning situations in hybrid environments. The thirty or so variables identified by a previously tested model in 2020–2021, in which distance learning was the exclusive mode of learning, were evaluated in blended learning spaces. Given the low predictive power of the original model, about ten new factors, specific to blended learning, were then identified and tested. The refined version of the GLAR model predicts student grades to within ±1 with a success rate of 63.70%, making it 28.08% more accurate than the model originally created in 2020–2021. Special attention was also given to students whose grade predictions were underestimated and who failed. The methodology presented is applicable to all aspects of the academic process, including students, instructors, and decisionmakers.

1. Introduction

Traditional university education systems have been totally disrupted due to the COVID-19 health crisis that has been affecting the world since mid-March 2020. The immediate and often precipitous transformation of face-to-face learning environments into virtual online spaces has prompted trainers, instructors, and teachers to integrate numerous technology tools and platforms into the educational process [1,2]. Learning management systems (LMS) and learning platforms have been combined with social networking sites (SNS) to transmit as many synchronized courses as possible, share new knowledge, and facilitate academic communication on task support [3,4,5,6].
In the first year of this health crisis, when online education became the exclusive mode of learning, researchers became aware of an unexpected challenge: the transformation of the educational schema through the incorporation of technological tools that previously remained inert or undiscovered by students and instructors. Several aspects of these new learning environments have been investigated, revealing new parameters that affect the academic performance of students in exclusively distance learning environments, while demonstrating the effectiveness of the technological tools used, as well as their sustainability [6,7,8,9]. Virtual learning environments (VLE) could also make a contribution in this still uncertain global health context, especially since distance learning and asynchronous support for knowledge transmission have already been tested in strictly distance learning environments [7]. Blended learning environments could also benefit from the above findings.
Although the COVID-19 pandemic was neither predictable nor completely controllable at the beginning of the 2021–2022 academic year [8], policymakers decided to reopen universities so that students would lose as little of the close connection with faculty as possible. The educational models that were used prior to this reopening of the universities’ doors were able to expand their use, but this time there was no “exclusivity” in the modes of instruction. Indeed, at some universities, instructors were teaching lab modules and theory courses in physical learning spaces, but at the same time, they were delivering their courses synchronously, using the learning platforms applied during the first phase of the pandemic. Once again, new learning environments were created, mixed or virtual, with technological features being the headliners of the educational procedure.
The first semester of the 2021–2022 academic year ushered in a new period of exciting opportunity: the era of technological and sustainable transformation of the learning process. Blended learning environments have been created to meet the needs of all learners, regardless of their background. First-year students can take courses in face-to-face learning environments on university campuses, working students can take online modules, and instructors can deliver courses synchronously from their university laboratories.
The objective of this work is to study in depth the factors affecting the academic performance of students in hybrid learning environments, i.e., coupling face-to-face and distance learning. Obviously, we will use the results already obtained in situations exclusively carried out at a distance, especially those imposed during the most critical period of the health crisis. This work aims to contribute to the construction of sustainable higher education in an era of digital transformation of educational systems [9], which we refer to here as meta-COVID-19. The term “meta”, which is used as a prefix, means “beyond” in ancient Greek. It implies that, although much remains to be done to achieve a transformation of both pedagogical tools and practices accepted by all actors in the academic world, this is part of a promising future ahead.
Like any crisis situation, the still unstabilized global health context continues to push all actors in the academic world to review their ways of doing things, and in particular to analyze in detail the impact of information and communication technologies in blended learning situations. This is the topic of this article, which aims especially at identifying the most important factors that contribute to effective knowledge sharing through hybrid and sustainable teaching processes.
The three research questions that led to this study are:
  • What factors are common, and what factors might emerge, that affect student performance in online and blended learning environments?
  • Which factors that were significant in online learning environments carry less weight in blended learning sessions?
  • Can a grade prediction model performed in online circumstances have the same success rate in hybrid environments?
Answers to the above research questions should contribute to the creation of sustainable learning environments, linked or not to physical, distance, and blended learning workspaces.
The outline of this article is as follows. A literature review is provided in Section 2 to highlight the contributions of this article in relation to what is already available to the educational community. In Section 3, the proposed methodology includes data collection from surveys, communication platform reports, and student attendance reports. In Section 4, the analysis of the obtained results relies on a statistical analysis (Spearman correlation) to filter the most significant predictors. A thorough revision of a GLAR-type (generalized linear auto-regression) statistical model, which has already proven successful in distance-only learning modes, tests the performance of embedded predictors during the online spaces of blended learning situations. Section 5 finally proposes a discussion based on the presented results.

2. Related Works

The notion of sustainable learning [10,11] has been structured around a wide variety of motivations, targets, and goals for finding solutions to the problems faced, based on the challenges presented.
The renewed agenda for higher education policy development in the European Union (EU) countries [12,13] has identified four key objectives. These include the contribution to innovation of higher education institutions, as well as support for effective learning systems. Blended or mixed learning environments with similar online and hybrid learning frameworks could be incorporated into the learning process, as they have been tested and found to be adequate to benefit the university community.
From the beginning of the health crisis, a plethora of digital tools were implemented to support synchronous and asynchronous learning [2,14,15]. Learning management systems, learning platforms, social media channels, and mobile learning platforms were applied and evaluated by performing statistical analysis using electronic data obtained from online surveys and learning platform activity reports [14,15,16].
Blended learning can be defined as a combination of practices applied in face-to-face and online learning environments [17,18]. Colleges and universities around the world are the leading knowledge-sharing institutions that aim to provide scalable information in a modern, lifelong educational system [19]. Comparing physical learning environments to online ones has always been a challenge for researchers [20]; it has been shown that online enrolments have increased drastically during the period 2002–2007, due to the introduction of information and communication technologies (ICT), inviting students to participate in module instruction from the comfort of their own homes. The authors of [21] defined hybrid learning as a learning mode where parts of the physical educational procedures have been replaced by online modes of knowledge transmission. The hybrid learning model is an Internet-based technology model that can be considered a “sustainable” model [22]. It can offer alternative possibilities for user-learners and create flexible online learning environments [23,24].
In [25], the development of critical thinking and problem solving skills has always attracted educational societies, and examples can be found in mechanical engineering. For example, the authors of [2] developed an innovative methodology for teaching computer-aided design in a first-year mechanical engineering module. The learning objectives were to design the meaning of drawings in object views, as well as the ability of students to establish the relationships of tasks assigned to their future work as mechanical engineers. In [26], the authors evaluated the design of geometric object projection in vertical and horizontal planes. In [27], the authors used a survey to obtain the feedback needed to redesign the teaching process of a computer-aided design module. All of these examples show that policymakers need to accelerate reforms in higher education whilst taking into account that skills and knowledge are interrelated [25].
As the limitations of social distance have become less restrictive, institutions around the world have returned to face-to-face learning environments, and instructors have been faced with a dilemma regarding which existing components of emergency remote teaching environments (ERTE) [28,29] will be maintained during this early period of meta-COVID-19 and which will be discontinued [30].
A recent study on students’ perception of the educational challenges induced by the COVID-19 pandemic [31] showed that learners prefer combined modes of instruction. In [32], the authors created a multiple linear regression model for grade prediction in a first-year mechanical engineering CAD module in exclusively distance learning environments. A total of 146 first-year students participated in this research and 35 variables were filtered from several sources (surveys, learning platform attendance reports, and university registration files). This model predicted students’ grades on their final exams at a threshold of ±1 with a pass rate of 67%. A generalized linear auto-regression model (GLAR) [32,33] was constructed and its variances were used as an additional predictor for an artificial neural network. This hybrid model was trained and yielded a coefficient of determination equal to 1. In [34], the authors used machine learning and feature analysis methods to assess student behaviors. In [35], the authors processed behavioral log data of blended learning modes from multiple learning platforms and introduced a multiple classification model to predict learners’ educational performance. In [36], the authors investigated the importance of predicting the next term’s grades to ensure students’ retention in college until graduation.
Given this comprehensive review of the literature in response to the research questions listed above, a GLAR model was constructed to predict grades in blended learning environments. This GLAR model was preferred over a multiple regression model due to the fact that the variables implemented are nominal, ordinal, and continuous. This model must be simple enough to be easily implemented and used, while ensuring a satisfactory level of prediction.
The main contributions of this work can be communicated to all members of the academic community:
  • Students can be warned in advance of a potential risk of failure and take appropriate steps to overcome their deficiencies and better prepare for their final exams [36].
  • Instructors can more appropriately manage course flow and provide individualized support to students at high risk of failure.
  • Decisionmakers can reevaluate the teaching strategies applied in the first meta-COVID-19 period after the end of each semester, reshape them, and develop new viable learning modes for continuous and sustainable graduate engineering education.

3. Materials and Methods

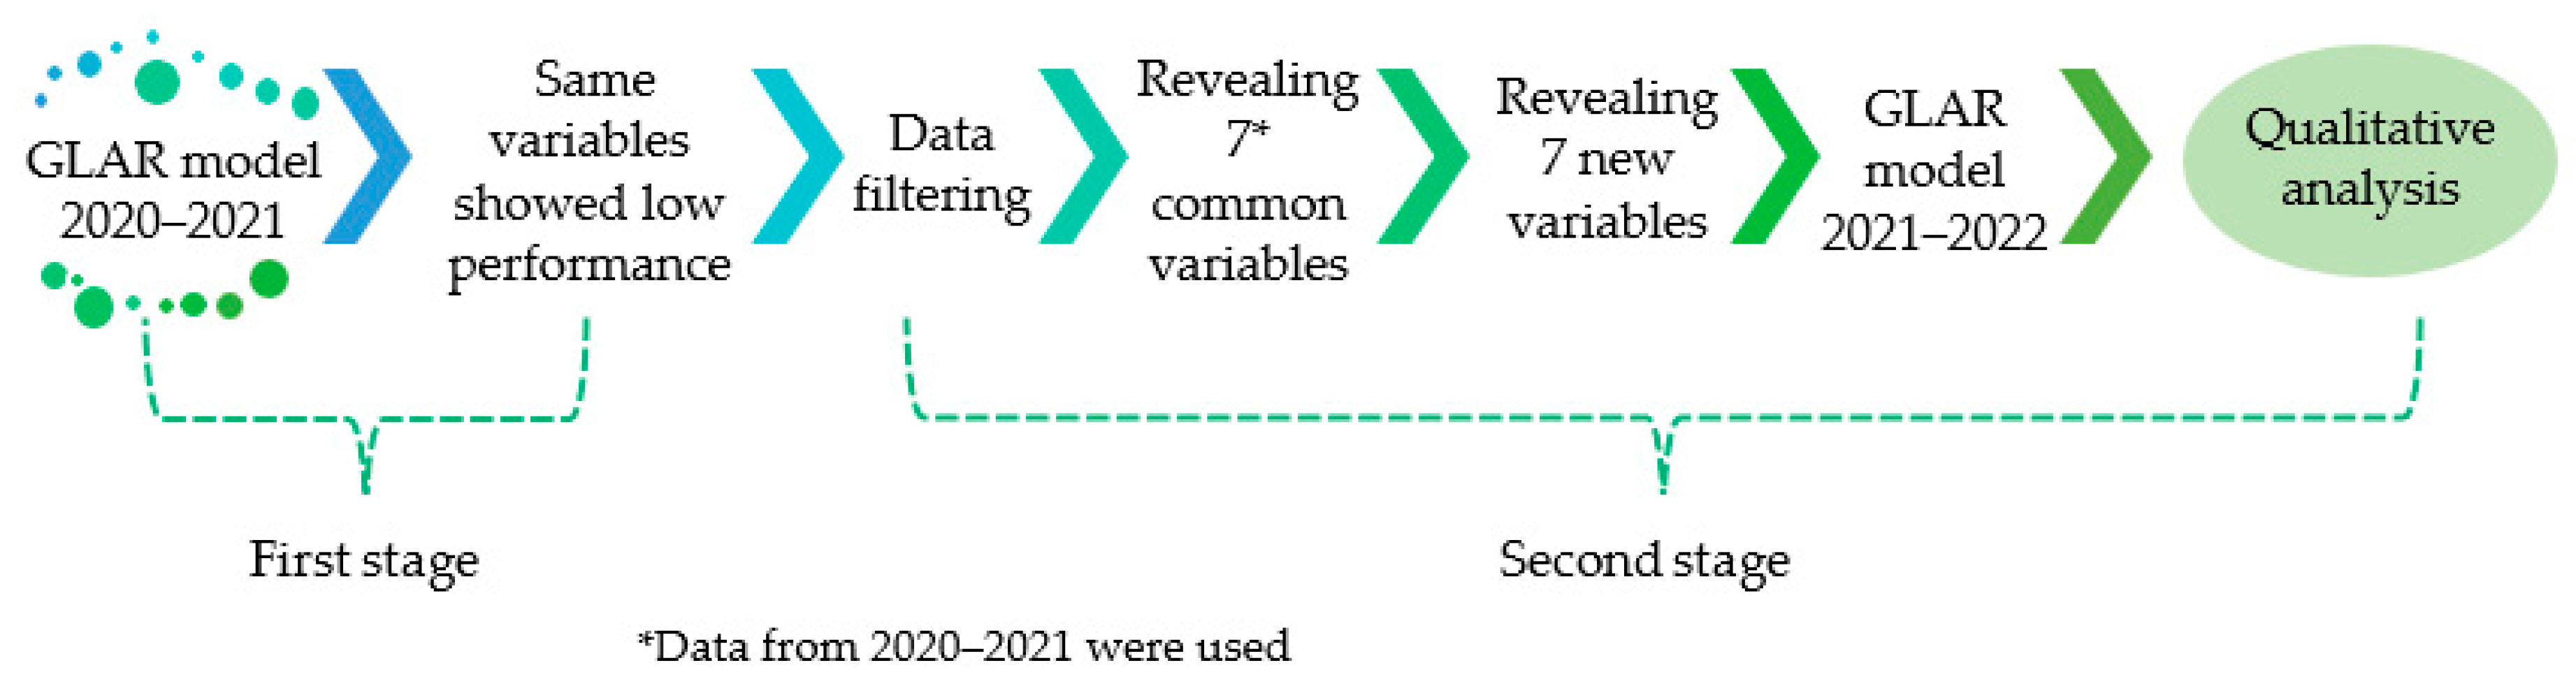
3.1. General Presentation of the Proposed Approach

The work presented here took place at the Department of Mechanical Engineering, School of Engineering, University of West Attica, Greece. Two periods were selected: the first during the first semester of the 2020–2021 academic year and the second during the first semester of the 2021–2022 academic year. During the first period, students worked exclusively in distance learning environments. In the second period, mixed modes of instruction were used. Regardless of the period and in order to ensure the relevance of the proposed analysis, the investigations focused on a computer-based mechanical design module entitled “Mechanical Design CAD I”. This is a first semester laboratory module aimed at introducing students to the concepts of 3-Dimensional drawings as well as their representation using computer-aided design tools. The main results obtained have already been analyzed in the literature [32,37].
As health conditions gradually improved around the world, the same learning approach used previously was applied in a hybrid learning environment as a parallel asynchronous support mechanism.
As shown in Figure 1, the study itself was structured around the following two stages.

3.1.1. First Stage

The first stage (see Figure 1) implements and tests the relevance of a linear model dedicated to grade prediction in exclusively distance learning environments. For this, we rely on data from 2020–2021. To go further and test the robustness of the model, we enriched the current database with a new population of students, namely that of the first semester of the 2021–2022 academic year. Thus, the GLAR model—having learned from the 2021–2021 data—would be able to predict students’ grades in a face-to-face, online, blended, virtual, and combined learning environment.
It should be noted that, for this first test stage, we made the assumption that the significant statistical variables used on the model created during online spaces would keep their significance in hybrid learning spaces. It turned out that was not the case; however, this step was imperative in order to proceed to the following stage.

3.1.2. Second Stage

The second stage (see Figure 1) evaluates the success rate of the previous model and proposes new methods for predicting grades in current blended learning modes. The goal is to adapt the existing model to determine the percentage of prediction in the current blended learning spaces. Thus, a second entirely new GLAR model is proposed to fit the newly acquired data, i.e., 2021–2022 students who benefited from a blended learning environment.
The construction procedure of the GLAR model is currently being published by the authors of [32]. Nevertheless, we recall here its main foundations. As shown in (1), the variables selected by the filtering process are isolated to construct a function to relate student grades ( y ) to the most significant dependent variables in the database. More specifically, x 1 , x 2 ,   x 3 ,   ,   x n are the predictors that relate to the variables that were found to have no statistical association with the students’ grades.
y = f ( x 1 , x 2 , x 3 ,   , x n )
The objective of the GLAR model is to generalize the characteristics of a linear regression model. Using parameters such as the mean response, the response variable can follow a regular, binomial, Poisson, gamma, or inverse Gaussian distribution. Thus, as shown in (2), the relationship between a dependent variable and the linear combination of altered predictors is defined by a set of link functions that transform each independent variable into a generalized linear regression model. In (2), y is the response variable; x 1 , x 2 ,   ,   x n are the predictor variables; β 0 is the y -intercept, β 1 , β 2 ,   ,   β n are the regression coefficients; and the intercept represents the residual error.
y = β 0 + β 1 x 1 + β 2 x 2 + + β n x n + intercept
The results of the work presented in [32], which s conducted in the first semester of the 2020–2021 academic year, identified several factors that had a significant impact on students’ academic performance during the pandemic. As the identified factors do not all have the same weight, the presented methodology was applied to the first semester of the 2021–2022 academic year in order to test the impact of each variable and thereby reach more accurate conclusions. The general diagram of the research methodology is schematized in Figure 2.

3.2. Data Sources

The data used in the modeling comes from online surveys conducted in 2020–2021 to detect failing students. Compared to the work already available in [32], new questions, mathematically corresponding to new variables for statistical analysis, were incorporated into the existing survey. The objective was to interpret the behavior of students, especially in terms of how they attend laboratory activities. Attendance lists were analyzed to distinguish between students who were physically present at the lab activities and those who took the course online. For each group of students in the course module, we identified the total number of courses taught during the semester (over 12 weeks), the number of courses taken face-to-face, and the number of courses taken online.
The pedagogical approach initiated by the authors of [2,5] was applied to students in the first semester of the 2021–2022 academic year, i.e., in a face-to-face, blended, or virtual learning environment. The objective is to evaluate the sustainability of the methodology suggested by previous experiments in an early meta-COVID-19 period or in future blended learning environments. To do so, the evaluation methods used exactly the same tools and in particular the same communication platform, while taking into account the changing guidelines imposed by the health situation [38].
In addition to the different categories of data sources, ex-final test results were added to make a comparison between the predicted and actual score. The threshold of success for the model was set to ±1. Finally, the difference between the predicted and the actual grade induces a new statistical variable that we call the error. When the value of the error is greater than +1, the student’s grade is overestimated by the model. When this error is less than −1, the model underestimates the student’s grade [32]. The grade considered for analysis is 70% of the final grade obtained after taking into account the students’ average grades on the assignments. Students with grades above 4.5 are considered to have passed their exams.

3.3. Applied Blended Learning Modes and Assessment of Student Performance

The “Mechanical Design CAD I” module in the first semester of the 2021–2022 academic year was conducted in a blended/combined teaching mode. The module was delivered over 12 weeks, in accordance with the university’s academic calendar. As shown in Figure 3, for the first four weeks, the educational process took place in a laboratory at the University of West Attica, without the possibility of online participation. This specific strategy was implemented to facilitate the familiarization of the first semester students with the facilities and equipment of the university [36,39].
In order to achieve similar conditions for instructors and students, the same scoring rubric was applied. Each instructor was asked to evaluate each student’s work based on the following criteria: completeness and accuracy of the three CAD views of the object, including a front view, a top view, and a cross-sectional view; correct use of layers and line types; grading; and regular student participation during the semester. The same rubric was applied in the online learning environments. The final exams took place during the 12th class in the university lab, face-to-face for all students.

3.4. Participant Demographics

The “Mechanical Design CAD I” module was delivered to 212 students from all levels of education (first year, second, third, and final semester students). In total 82.7% were male and the remaining 17.3% were female. Their average age range was 18–21 years (87.2%). Among the information from the forms used to collect the responses to the online survey was information about the students’ family status: 65.5% lived with their families and only 16.2% lived alone. The remaining 18.3% lived with siblings or friends.
The sample was processed and—once the survey responses of the final year students had been eliminated in order to be as close as possible to the population that participated in the 2020–2021 academic year—culminated in 146 valid responses.
Beginning in the fifth lab session, students were given the option to choose the mode of participation, i.e., face-to-face or online, with lessons delivered synchronously via the MS Teams platform. Instructors encouraged virtual learning modes as a health precaution, given the increase in pandemic cases at the time, to avoid concentration and close social contact among students. Students were asked to express their reasons for choosing their mode of participation. A total of 185 of 212 students responded to this survey and the main results are presented in Figure 4 and Figure 5. As shown in Figure 4, the top two reasons for taking the module remotely were distance from home (about 49% of the responses obtained) and comfort taking the course (about 38% of the responses obtained). Restrictions imposed by the health crisis came in third place with 20% of the responses obtained. As shown in Figure 4, the reasons for choosing to take the course face-to-face are more disparate. Students feel that they are better able to assimilate the course being taught (about 55% of the responses obtained). The reasons are also social, to keep in touch with the teachers (about 49% of the responses obtained), but also other students (about 30% of the responses obtained). Students also chose this face-to-face course because they had other face-to-face courses during the same period (about 43% of the responses obtained). Finally, the motivations were also of a practical nature, with the possibility of asking questions directly when certain points of the course needed clarification (about 32% of the responses obtained).

4. Main Results

In this article, strictly based on the approach implemented in 2020–2021, we chose to evaluate the relevance of the GLAR model applied when teaching the 2021–2022 “Mechanical Design CAD I” module, which was delivered online in hybrid learning environments. The main results obtained are analyzed in this section.

4.1. Relevance of Grade Prediction Modeling for Online Learning Spaces in Hybrid Systems

Before applying the GLAR model to the 2021–2022 data, it is worth recalling its relevance to the 2020–2021 data, i.e., in exclusively online teaching environments. Under these conditions, the prediction reached 67% success [32] and the fitting errors of the GLAR model were used as additional predictors. A hybrid model was thus created, leading to a coefficient of determination ( R 2 ) equal to unity. It should be noted that the technique used was chosen taking into account that at the time the experiment took place, there was no prior population that could be included in the sample. Therefore, the dataset was divided into three subsets, where 70% of the population represented the training set, 15% the test set and the remaining 15% the validation set [32,33]. The data fitting process was applied to the training set, and the prediction success rate depended on the prediction of student scores in the other subsets with minimum mean square error.
If we now apply this GLAR model as-is to predict student grades in 2021–2022 in blended learning environments, the results are 70.65% pass, 44.44% fail, and 35.62% correct prediction in the range of ±1. The model underestimated 54.79% of students’ actual final grades and overestimated 45.21%. Figure 6 shows the error in grade estimation and it can be seen that the majority of the errors are in the range of −0.47 to +2.33.
The results we obtained are not fully satisfactory, and adjustments to the existing GLAR model are therefore required to achieve the same levels of accuracy as those displayed in terms of the 2020–2021 population.

4.2. Statistical Analysis Applied to the 2021–2022 Population

The 2021–2022 sample consisted of 146 students. In order to identify the variables that have a significant relationship with the students’ final exam grade, a Spearman correlation analysis was performed. The purpose of this analysis is to establish some degree of quantification of the correlation of all independent variables with the dependent variable (grade). The statistical analysis proposed here was performed in MATLAB R2020a.
All categorical variables were transformed into a series of dummy variables, corresponding to the categories contained in a categorical variable. Each dummy variable was assigned the value 1, if an observation satisfied the following criterion “Is the i -category true?” and the value 0, otherwise. This was done for all observations.
If there are L categories related to a categorical variable, then L 1 dummy variables are created. The dummy variables that were transformed using this method are “class group”, “instructor ID”, and “gender”. Specifically, the “class group” variable expresses the number of 11 three-hour lab groups taught by one of the four instructors. After transformation, ten dummy variables were created (11 −1 = 10). The remaining variables did not need to be transformed, as they were ordinal or continuous variables.

4.2.1. Analysis of the Spearman Correlation Coefficient (Rho)

In order to analyze the significant correlations between 68 variables, a correlation matrix was created, aiming to measure the Spearman correlation coefficients (Rho), where values close to 1 imply a positive correlation and close to −1, a negative correlation [40]. Values near zero are considered negligible. Students’ ability to complete their tasks after completing three months of laboratory instruction, compared to their final grade, is presented in Table 1. We recall that in statistics, the Spearman correlation is an interesting non-parametric alternative to the Pearson correlation. The Spearman’s Rho parameter is a very good asset here, especially when the data to be processed are ordinal, as is the case here. In Table 1, the prefix * distinguishes variables that were statistically significant in 2020–2021 [32], i.e., in exclusively online environments.
As shown in Figure 6, of the 68 variables that were tested by correlation analysis, calculation of Spearman’s coefficient (Rho) indicated significant new positive and negative correlations when these variables were correlated with students’ final exam score.
In a Spearman correlation analysis, looking only at the values of Rho between −1 and 1 is not enough. When Rho is positive, when one variable increases, the other also seems to increase. When Rho is negative, either the variables are seemingly inversely related, or when one variable seemingly increases, the other decreases. In what follows, we will examine another variable called the p-value, which represents the statistical significance of a Rho coefficient resulting from the comparison of two variables. In particular, we will take the 5% threshold value classically used in statistics. In particular, when the p-value is less than or equal to 5%, the result is statistically significant, allowing us to affirm that the difference is not only the result of chance. The significant variables with p-values ≤ 5% are shown in Figure 7.

4.2.2. Analysis of Spearman’s Correlation p-Values

The objective here is to determine which variables have the lowest p-values (i.e., less than or equal to 5%), when compared to the students’ academic results; results expressed by their final exam grade. Specifically, variables with p-values less than or equal to 5% [41] reject the null hypothesis [40], which in our case is “the variables are not related to the final exam score”. Table 2 shows the variables in favor of the alternative hypothesis.
As shown in Table 2, fourteen variables were selected as predictors with the value of less than or equal to 5% as a criterion for filtering the data. Of these fourteen selected variables, seven of them contributed to the development and implementation of the GLAR model used in 2020–2021 to predict student grades in exclusively online learning environments.

4.3. Validity of the Data Collected

In this section, we propose to perform a statistical test to verify the validity of the students’ responses to the surveys. Cronbach’s alpha is an excellent tool to determine the consistency of the set of survey responses. This coefficient, ranging from 0 to 1, is used to determine the degree of reliability of the variables from the correlation analysis [42]. For this test, ordinal variables were considered. These variables were expressed on a 5-Likert scale, referring to the survey questions that were ordinally formed and applying the same scale to measure the objective. Although the questionnaire was originally designed to study several constructs involving module teaching and student behaviors, the test presented below focuses specifically on the teaching methodology construct [43]. According to a relatively broad consensus, the minimum acceptable value for Cronbach’s alpha is 0.70. A lower value means that the test questions do not measure what they are supposed to measure. The maximum expected value is 0.90. However, a score above this value does not necessarily mean that internal consistency is high, but rather that there is redundancy or duplication of items. In concrete terms, this means that several questions measure exactly the same element of a construct.
Initially, all 146 participant responses were included in the test, with no exclusions. A total of 23 ordinal variables related to the success of the methodology in hybrid learning environments were more specifically isolated from the questionnaire, and the Cronbach’s alpha statistics of each of these 23 variables is presented in Table 3. In the end, the Cronbach’s alpha test revealed a coefficient in the range of 0.831, proving that these 23 questionnaire variables are statistically consistent.
Different ranges of qualitative descriptions of Cronbach’s alpha can be found in the related literature, but the value of 0.831 is considered good, or “robust” [44]. Some specific variables did not discriminate understanding of deep structure as expected, decreasing the reliability statistic of the test. They were therefore discarded, as suggested in [45].

4.4. GLAR Modeling for Grade Prediction in Hybrid Learning Environments

To refine the existing GLAR model, predictors were selected to exclude all variables whose Spearman correlation coefficients (using student grade as the dependent variable) had p-values less than or equal to 5%. Based on this criterion, 14 variables were finally selected as statistically significant.
The refined GLAR model thus obtained has the following main metrics: a mean absolute error (MAE) equal to 0.79 and a mean absolute error percentage (MAP) equal to 18.50%. Figure 8 shows the histogram of errors. The majority of errors (61 of 146 cases) are in the range of scores from 0.37 to + 0.63. Thirty-four cases are in the range of 1.37 to 0.37, thirty cases are in the range of + 0.63 to + 1.63, and, finally, fifteen cases are in the range of 2.37 to 1.37.

4.5. Comparative Analysis between the Two Models

As can be seen in Table 4, the participation of the seven new variables and the reduction of the previous 35 to 14 increased the success rate of grade prediction in hybrid learning conditions.
For grade prediction to be relevant, it is important to detect learners who are on the verge of failure early enough to provide appropriate instructional support [34,35,36]. As shown in Figure 9, all of the 26 students who were overestimated and failed were present at the final exam.

5. Discussion

5.1. Statistical Analysis of Factors Affecting Students’ Grades

The results analyzed above show that some variables, from a statistical point of view, have little or no impact on student performance. In particular, when comparing the significant parameters affecting students’ final grades following their participation in exclusively online learning (2020–2021) and blended learning (2021–2022), we find, for example, student engagement as expressed in communication platform usage reports. In the exclusively online learning mode, this variable is highly correlated with the final grade [26]. In blended learning modes, its statistical significance is reduced, because unlike online learning where student activities can be assessed via reports from communication platforms, student engagement could not be measured in face-to-face learning environments. The number of lectures each student attended online or onsite were also other examples of variables that did not show statistical significance.
From Figure 7, seven variables have a prefix * indicating that they are the same variables identified in 2020–2021, when the learning modes were exclusively online and virtual [32]. Student activity on MS Teams, identifiable from the report downloadable via this communication platform, has a low correlation in 2021–2022 (Rho parameter equal to +0.12) with student grades, unlike in 2020–2021. In addition, further analysis of Figure 7 shows that the following six variables with the prefix * have a significant positive relationship with student grades:
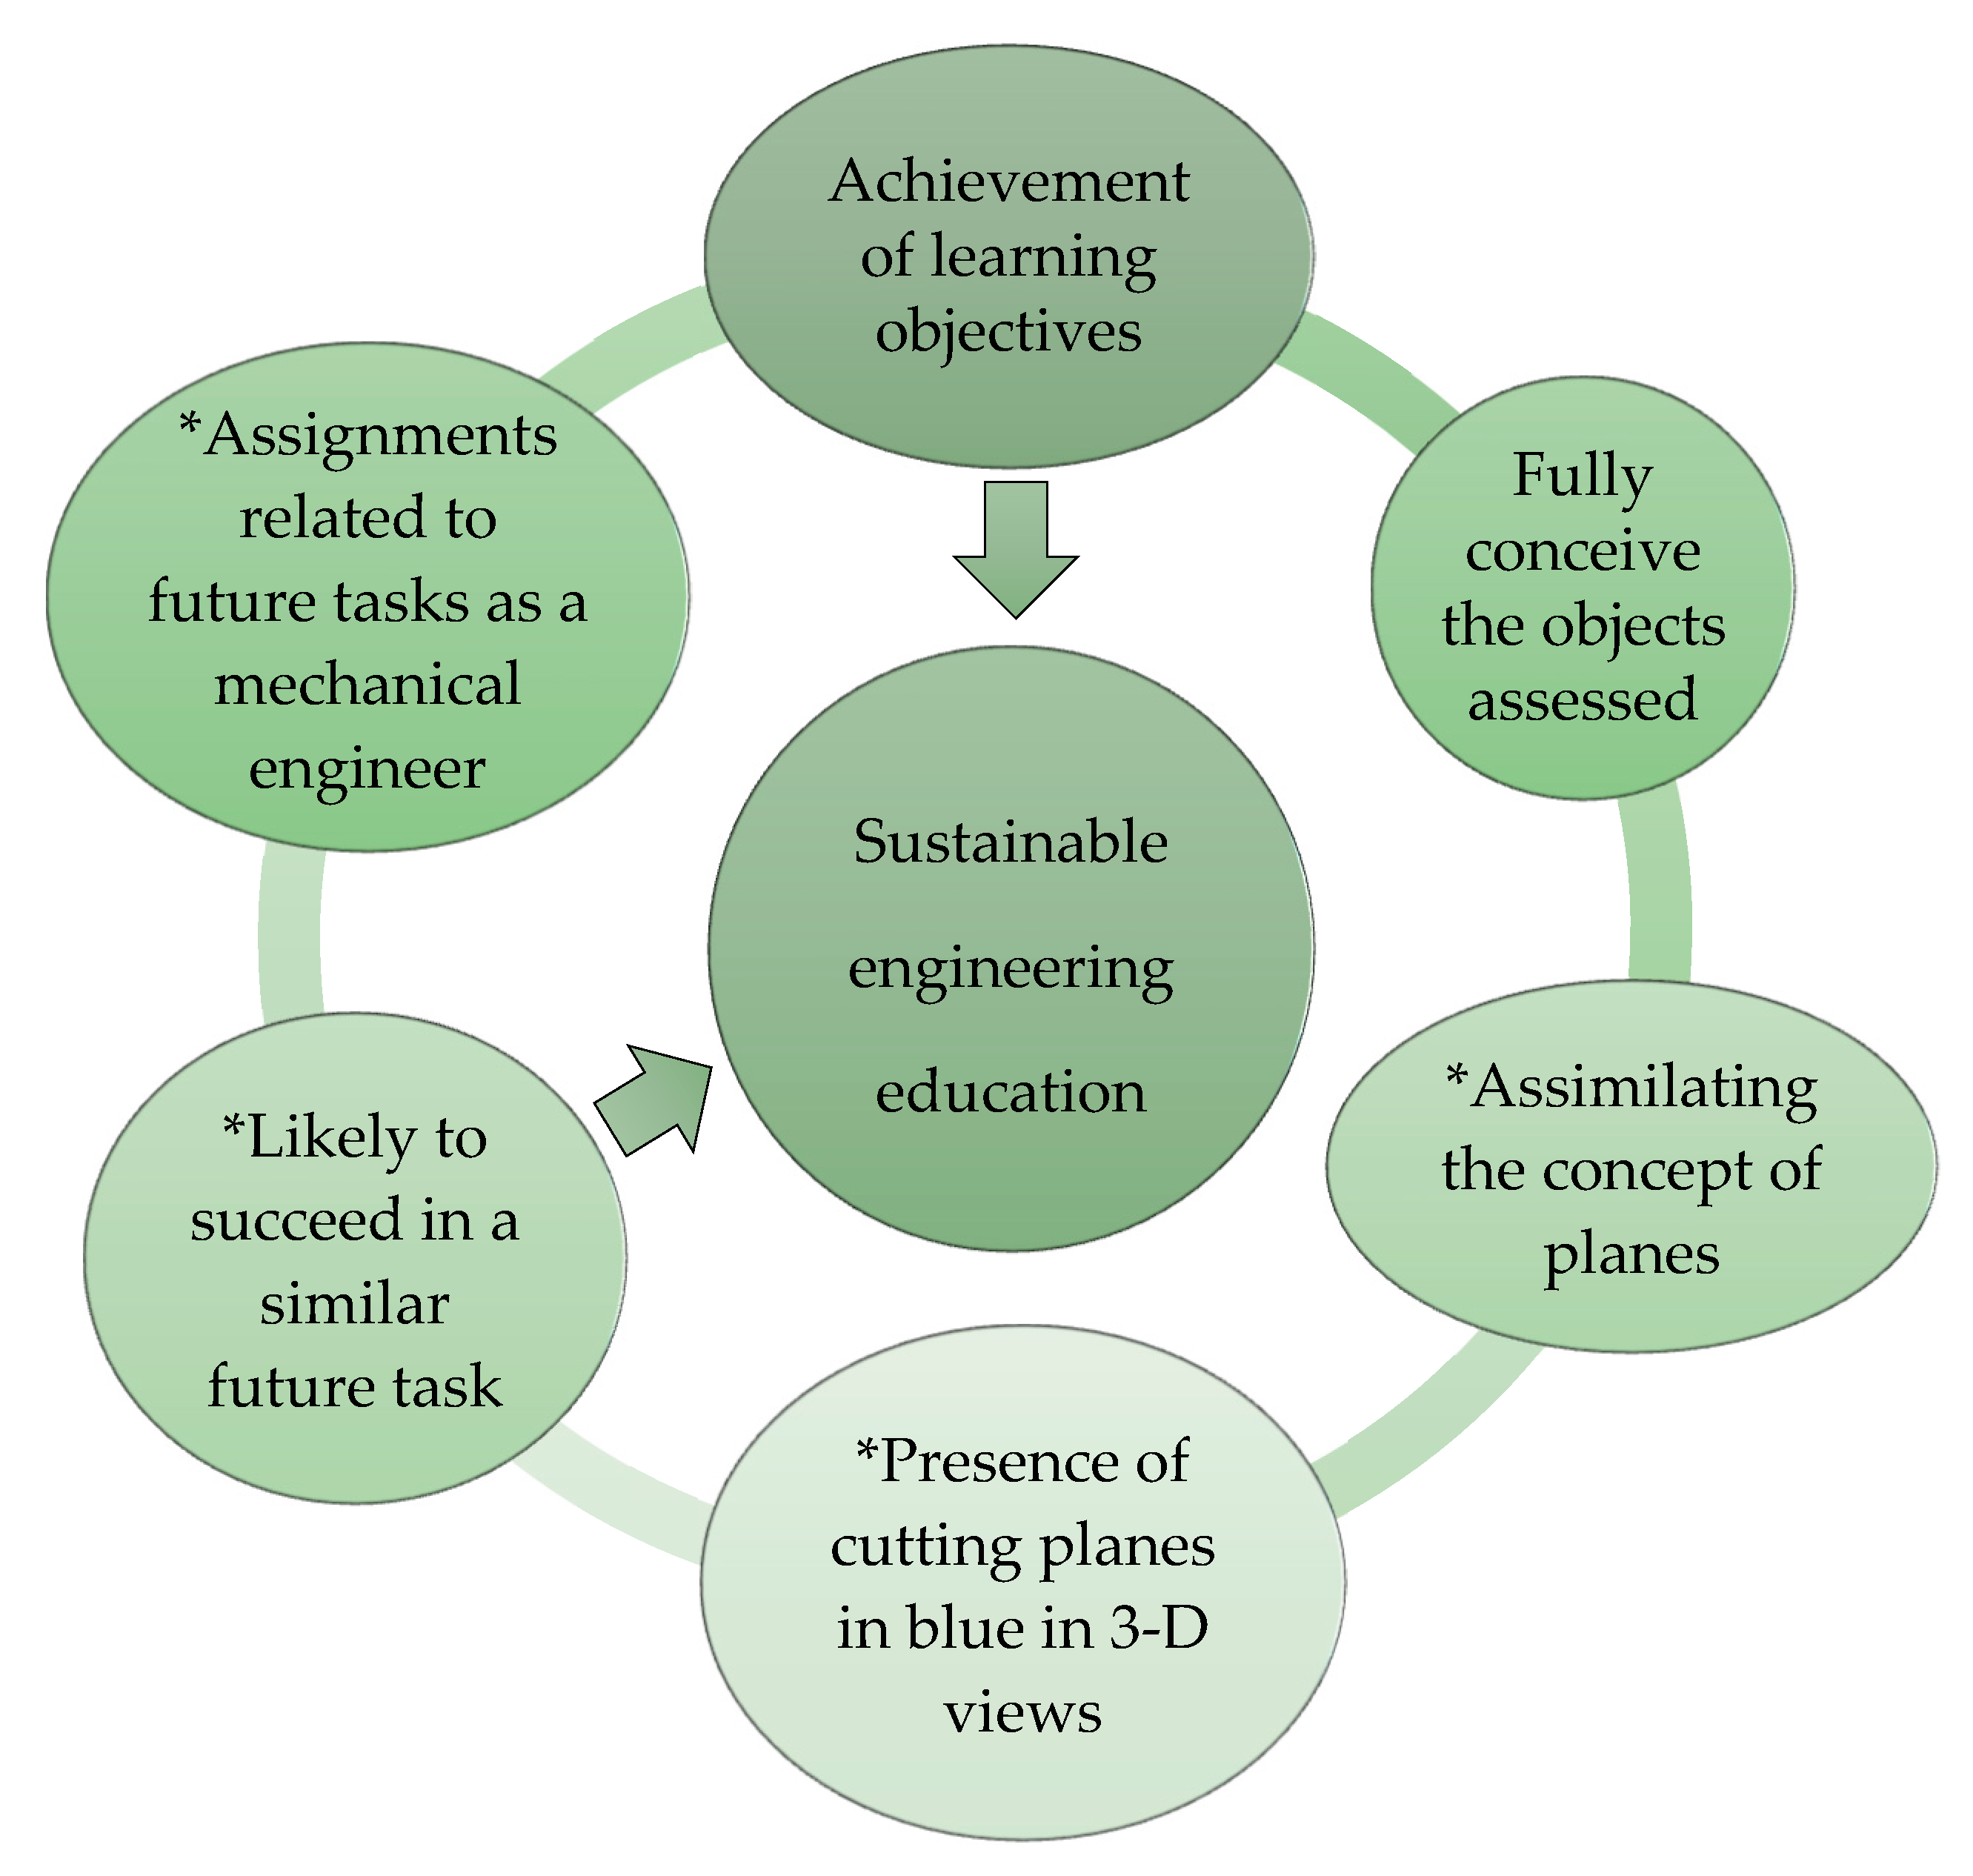
  • The feeling that students are comfortable taking final exams (Rho parameter of +0.25);
  • Ability of students to perform assignments related to their future duties as mechanical engineers (Rho parameter of +0.23);
  • Their sense of being able to cope with knowledge deficits (Rho parameter of +0.20);
  • The probability of success in a similar future task (Rho parameter of +0.19);
  • The enjoyment felt by the students compared to other more theoretical courses (Rho parameter of +0.19);
  • Relevant assignments to learners for future work (Rho parameter of +0.19).
New variables identified in 2021–2022 include the ability to perform assignments after the last three months of teaching (Rho parameter of +0.27) and the direct impact of the instructors. On this last point, instructor 03 was positively correlated (Rho parameter of +0.27) with the dependent variable (grade). The same instructor taught the module in class group 09 (Rho parameter of +0.39), which had the highest correlation with student grades.
A close analysis of Figure 6 also shows that three variables have a significant negative relationship with students’ grades:
  • The first is the course group, particularly groups 3 and 5. Course groups 03 (Rho parameter of −0.28) and 05 (Rho parameter of −0.26) seem to have a negative correlation with students’ final grades. Of the 11 class groups, 3 were morning classes (09:00–12:00), 6 were lunch classes (12:00–18:00), and the remaining 2 were evening classes (18:00–21:00). Class group 3 is a lunch class, while class group 5 is an evening class.
  • The second is the age of the students (Rho parameter of −0.21), which is negatively related, which is explained by the fact that younger students are always more familiar with the technological features.
  • The third is the instructor themself. The two groups of classes listed above were taught by the same instructor (number 4) and the number of students enrolled was the highest (24).
The variables that were originally included in the 2020–2021 prediction model (i.e., in exclusively online environments), and that in the new 2021–2022 model do not meet the criterion of a p-value of 5% or less, are:
  • Technical difficulties (p-value of 94%) do not appear to be an issue in blended learning spaces. This is likely due to the fact that, after a year and a half of exclusively online learning, students have taken steps to obtain new electronic devices and faster Internet connections.
  • Student activity on MS Teams, obtained from the communication platform reports (p-value of 13%), is no longer a representative indicator of learner engagement.
In hybrid learning environments, learners have the option to attend classes either face-to-face or remotely [11,14,16]. Since each student’s attendance was categorized by mode of presence (i.e., physical or remote), this characteristic deserved to be studied to assess its importance. Unexpectedly, the new metrics related to hybrid learning modes (not included in Table 2) did not meet the criterion of p-value less than or equal to 5%. Indeed, for the number of courses taught online and face-to-face in the first semester of 2021–2022, the p-values (on the order of 24%) were greater than 5%. The same is true for distance from home (p-value of 13%), the distinction between morning, mid-day, and evening classes (p-value of 10%), and online attendance due to the health crisis (p-value of 94%).
In the error histogram for the GLAR model created in hybrid learning environments (see Figure 7), the majority of errors (i.e., about 42%) fall in the score range of −0.37 to +0.63; about 23% of the cases fall in the range of −1.37 to −0.37; about 21% of the errors fall in the range of +0.63 to +1.63; and finally, slightly more than 10% of the errors fall above the range of ±2.
As shown in Table 4, the prediction of failing students increased from 44.44% to 50.00%. The prediction of grades in the ±1 range also increased from 35.62% to 63.70%. The number of students whose grades were underestimated and who ultimately passed was limited to 6.85% instead of 17.81%. The number of students whose grades were overestimated compared to the prediction and who failed the exam was 26 instead of 30. The percentage of students predicted to pass increased from 70.65% to 89.13%.

5.2. Qualitative Analysis of the Failing Class

As shown in Table 4, 26 students (17.80%) failed the exams and the model overestimated their scores. It is essential to explain the reasons for this overestimation here. To do this, all student records for the period in question had to be analyzed in depth, including information that was not initially considered. We carefully accessed each of the 10 students’ archives, retrieving weekly homework scores that were previously been discarded because they would have confirmed the obvious assumption that students who scored well on weekly homework tasks will be well-prepared and pass the final exam. Despite this, the initial matrix of 68 variables was refined by adding the variable representing students’ weekly homework grades. Special attention should be paid to students who were diligent and performed well during the semester but failed the final exam, despite the positive predictions of the model.
In the end, out of the 26 students, 16 showed poor performance during the semester, either by receiving very low grades or by not uploading their work at all. These 16 cases were therefore eliminated for non-diligence. The remaining 10 cases are studied here (6.85% of the population), corresponding to diligent students, i.e., those who received more than 75% of the grade through their weekly assignments.
Because all 146 participants provided their student numbers when they completed the questionnaire, their responses allowed us to diagnose the reasons for their failure. The fact that each participant’s ID number is known individually allows us to validate each student’s response based on actual results and not simulated experiments.
After reviewing the initial data matrix, it became apparent that several important aspects of the learning method were not designed by the specific group of students. Other parameters were revealed, but most of them were related to validating the significance of the 14 variables listed in Table 2. Analysis of the students’ survey responses revealed that the performance of 2 students’ was affected by learning disabilities. It should be noted that of the 146 participants, 22 were formally diagnosed with learning disabilities; 13 of these students passed and 9 failed, and 2 are considered part of the study group.
In particular, Figure 10 shows the model validation and external factors applied to failing students.
In Figure 10, the lowest values, i.e., those close to 1 on the 5-Likert scale and represented by a shorter bar on the histogram, are considered to have negatively affected students’ performance. Three students reported having high computer skills, while three others felt they had average skills. In terms of basic software skills, only two students felt they were highly proficient. On the other hand, all of them reported having high skills in social media applications. Nevertheless, the vast majority did not feel capable of succeeding at similar tasks in the future, and did not feel comfortable taking final exams. Three students were honest enough to admit that they had never studied the theory notes attached to each course. These three students had an average prediction error of −1.50, which is considered the highest error.
All participants in the group studied in this section were supervised by different instructors, implying that the variable “instructor ID” had no impact on their failure.
Table 5 shows that student non-shows (regular attendance, non-shows on exams) are higher in classes supervised by instructor 4. Although larger classes do not have an effect on absences, the “instructor” variable appears to be related. Instructor 1 (author team member and module organizer) is more severe with promising students who do not perform well on the final exam.
After personally interviewing the 10 participants about determining other causes of failure, student XX392068 introduced a new parameter: software version. It seems that different versions of software with alternative workspaces can lead to student confusion, and thus failure.

5.3. Contribution on the Learning Methodology

Finally, regarding more operational aspects of the teaching team, Figure 11 illustrates the steps of the learning process and their contribution to making teaching more sustainable. These steps were initiated by one of the co-authors of this article and coordinator of the 11 class groups. After twenty years of experience in teaching computer-aided mechanical design in higher education, and based on the empirical data collected in this study, the instructor observed over the years that students who have difficulties in conceiving geometric properties of objects and layout of planes (vertical, horizontal, front, back) have the greatest difficulties in drawing cross-sectional views starting from the seventh class. Eventually, some of them dropped out of the module and others failed the final exam. Students’ attitudes and preferences, as expressed by the surveys, are related to the achievement of the learning objectives of the CAD module itself. In particular, Figure 11 shows that from the level of achievement of the learning objectives, students are expected to design the shape of the evaluated object and the meaning of the planes in the top and side views of the studied objects. It is assumed that the students work on Autodesks Inventor Pro 2020, educational version. Since the view representations become more complicated with the introduction of sectional views, the sectional planes were highlighted in blue in order to facilitate the design of the cut-out volumes and projected edges. Finally, the students consider that they can succeed in a similar task in the future, and are able to relate their assignments to future tasks as mechanical engineers, which proves the sustainability of the teaching strategy.
To conclude, by creating innovative and transformative hybrid learning structures and combining physical and virtual learning spaces, the authors have responded to one of UNESCO’s recommendations on open educational resources (OER). Indeed, the development of methods, such as those described here, facilitates the use and adaptation of OER while supporting quality, inclusion, and equitable access in higher education and lifelong learning [12,46].

6. Conclusions

Traditional educational systems have been completely challenged by the COVID-19 pandemic that began in mid-March 2020. University education has had to undergo major transformations from a face-to-face environment to an online learning space. Despite a still unpredictable global health situation, the doors of universities around the world were able to reopen. Since a return to normalcy has not yet been possible, new learning environments, both blended and virtual, have been created by massively integrating information and communication technology platforms into the educational process.
The purpose of this research was to better understand the factors affecting students’ early meta-COVID-19 performance in blended learning environments when sustainable learning modes were imposed due to health crisis restrictions. Specifically, the study was conducted in a first-year university mechanical engineering course. The module selected for this experiment was a “minds on” lab designed to teach computer-aided mechanical design.
A generalized linear autoregressive (GLAR) model for grade prediction—created in 2020–2021 during the early phases of the pandemic, i.e., when online learning was exclusive—was implemented, and we recalled here its key metrics, including a success rate of 67% [32]. This model was used as-is to predict student grades in online learning included in hybrid educational systems. To do this, the existing model was augmented with data from 146 students in the 2021–2022 academic year. The 35 variables in the model were used to predict student grades within a ±1 range. Under these conditions, the pass rate (35.62%) was found to be inadequate.
In order to refine the existing GLAR model further for full utilization of online education included in hybrid educational systems, new factors affecting student academic outcomes were identified. A Spearman statistical analysis was conducted on the 2021–2022 data. Fourteen variables were thus filtered: seven of them were from the 2020–2021 period and the other seven emerged as a result of the hybrid learning environments implemented in 2021–2022.
Paradoxically, whether students had the opportunity to take the courses online or face-to-face, the number of courses each learner attended in both learning modes, distance from home and pandemic conditions were not significantly correlated with the students’ final grade. However, the sense of enjoyment from participating in the module, as well as variables related to 3-Dimensional drawing design, engineering education skills, and students’ ability to relate assigned tasks to their future professional lives as mechanical engineers exhibited the lowest Spearman’s correlation coefficient p values.
The refined version of the GLAR model predicts student grades to within ±1 with a pass rate of 63.70%, making it 28.08% more accurate than the model originally created in 2020–2021. The percentage of students predicting success increased from 70.65% to 89.13%, an improvement of 18.48%. Underestimated scores that were borderline passing the module were limited to 6.85% instead of 17.81%, a reduction of 10.96%. Finally, the R 2 coefficient of the GLAR model was 44.32%, its mean absolute error equal to 0.78, and the mean absolute percentage error equal to 18.38%. Special attention was given to students whose grade predictions were underestimated and who failed. Not having studied the theoretical part of the module accentuated their lack of knowledge, increasing their sense of insecurity and discomfort in the final exam.
Synthesizing the above, in order to achieve the goals of sustainable engineering education environments, new parameters must be revealed depending on the mode of learning, i.e., distance or hybrid.
Overall, the advantages of the model are its simplicity and its speed of creation through the use of essential statistical filtering tools (correlation analysis), while maintaining an appropriate level of accuracy. The contributions of this work may therefore be of major interest to all members of the academic community:
  • Measuring students’ academic performance through grade prediction modeling can serve as an “alarm” for learners likely to fail final exams, as well as a self-assessment of the level of knowledge acquired.
  • As for the variables validated by the GLAR model in the context of online and hybrid learning spaces, they respond to current needs in terms of skills acquisition; they are closely linked to the professional requirements of tomorrow.
  • In terms of policy incentives, university administrations could consider the results of this work as a good way to reevaluate the teaching strategies applied in higher engineering education [47] and thus contribute to the sustainability of university systems.
The work presented here is the result of a transnational collaboration between two European universities, the University of West Attica in Greece and the University of Tours in France. As mentioned in the recent European Commission proposal on building bridges for effective cooperation in European higher education [46], the higher education sector can benefit from such cooperation while promoting the quality and diversity of academic learning and teaching through digital transformation and ultimately build a sustainable future for European universities.
Although the simplicity and ease of use of the model is undeniable, there were practical limitations in applying the methodology described in this article. Indeed, because the data processing took time (collecting survey responses, identifying and excluding invalid responses, as well as those of students in higher semesters), only 10 days were left to alert students who were predicted to fail. In future experiments, the survey will be launched a week earlier so that the instructor team has more time to generate new results and alert potentially failing students. Moreover, there were other limitations due to the health situation itself. Although all participants (i.e., students and instructors) had prior experience with online teaching spaces, the application of hybrid environments quickly gained momentum, with no real consensus on the methods and tools to be used.
The methodology defined and deployed in this work is therefore related to the social parameters and restrictions that were applied throughout the research period. It is important to note that this study is directly related to society [48]: the participants were real students, all “teaching experiments” were conducted in real learning environments, based on trust between learners and their instructors. All students who participated declared their consent to take part in the research. Student identities were used to qualify the results for statistical analysis. In this paper, all student identification records and personal data were properly anonymized to avoid any potential misconduct between science and society.
Currently, online learning environments are no longer allowed in higher education in Greece. Hybrid learning spaces were initially created in response to the increase in pandemic cases among students, but have been welcomed by the majority of participants, as they offer a high level of freedom in terms of physical presence. The question is, will future first-year engineering students who take mixed-mode modules, without having previously experienced online modes, be as proficient as the participants in this study? Or can we hope that future generations, unaffected by the pandemic, will be more competent than the current population? These questions can be answered in future studies that validate or adjust the variables involved.
Some research perspectives can be drawn from this work. First, the variables involved in hybrid learning environments should be further examined, with the aim of adding more variables to improve the robustness of the modeling and thus further strengthen the conclusions presented above. The proposed model can also be optimized, especially by inserting the fitting errors as an additional predictor in an artificial neural network [49,50,51]. This could allow the creation of a hybrid model to improve the coefficient of determination. This research work can therefore be extended by testing other prediction models, such as deep learning [52], hybrid neural networks, decision trees, support vector machines. Finally, it should be noted that the use of holograms and artificial intelligence will soon be possible via 5G and the future 6G. Faced with the big data—including sounds, words, images, and video—that will have to be taken into account, it will be essential to use efficient methods of data compression, at the level of the acquisition itself, of the compressed sensing type [53,54].

Author Contributions

Conceptualization, Z.K. and C.S. (Constantinos Stergiou); methodology, Z.K., C.S. (Constantinos Stergiou), G.B. and S.J.; software, G.B.; validation, G.B.; formal analysis, Z.K. and G.B.; investigation, Z.K. and C.T.; resources, Z.K. and C.S. (Constantinos Stergiou); data curation: Z.K.; Writing–original draft preparation: Z.K.; Writing—review and editing: Z.K., C.S. (Constantinos Stergiou), G.B., S.J. and A.O.; visualization: Z.K., C.S. (Constantinos Stergiou), G.B. and S.J.; supervision, C.S. (Constantinos Stergiou) and C.S. (Cleo Sgouropoulou); project administration, C.S and S.J.; funding acquisition, S.J. and A.O. All authors have read and agreed to the published version of the manuscript.

Funding

This research received no external funding.

Institutional Review Board Statement

This study involves the analysis of data sets obtained from previous research based on voluntary participation, where all data were properly anonymized. Therefore, the work presented here is without risk of harm to all participants.

Informed Consent Statement

Informed consent was obtained from all study participants at the time of initial data collection.

Data Availability Statement

Not applicable.

Acknowledgments

These research activities are currently supported by the University of West Attica and more particularly by its Department of Mechanical Engineering, as well as by the University of Tours. The authors of this article would like to thank their colleagues at the following institutions, as well as the students, who contributed greatly to the success of this work.

Conflicts of Interest

The authors declare no conflict of interest.

References

  1. Rana, U.; Govender, J. Exploring the Consequences of the COVID-19 Pandemic: Social, Cultural, Economic, and Psychological Insights and Perspectives; Apple Academic Press: New York, NY, USA, 2022; ISBN 978-1-00-327728-6. [Google Scholar]
  2. Kanetaki, Z.; Stergiou, C.; Troussas, C.; Sgouropoulou, C. Development of an Innovative Learning Methodology Aiming to Optimise Learners’ Spatial Conception in an Online Mechanical CAD Module During COVID-19 Pandemic. Nov. Intell. Digit. Syst. 2021, 338, 31–39. [Google Scholar] [CrossRef]
  3. Hsieh, M.Y. The Most Sustainable Niche Principles of Social Media Education in A Higher Education Contracting Era. Sustainability 2020, 12, 399. [Google Scholar] [CrossRef] [Green Version]
  4. Jacques, S.; Ouahabi, A.; Lequeu, T. Synchronous E-Learning in Higher Education during the COVID-19 Pandemic. In Proceedings of the 2021 IEEE Global Engineering Education Conference (EDUCON), Vienna, Austria, 21–23 April 2021; pp. 1102–1109. [Google Scholar]
  5. Kanetaki, Z.; Stergiou, C.; Bekas, G.; Troussas, C.; Sgouropoulou, C. The Impact of Different Learning Approaches Based on MS Teams and Moodle on Students’ Performance in an on-Line Mechanical CAD Module. Glob. J. Eng. Educ. 2021, 23, 185–190. [Google Scholar] [CrossRef]
  6. Almaiah, M.A.; Al-lozi, E.M.; Al-Khasawneh, A.; Shishakly, R.; Nachouki, M. Factors Affecting Students’ Acceptance of Mobile Learning Application in Higher Education during COVID-19 Using ANN-SEM Modelling Technique. Electronics 2021, 10, 3121. [Google Scholar] [CrossRef]
  7. Torres-Díaz, J.C.; Rivera-Rogel, D.; Beltrán-Flandoli, A.M.; Andrade-Vargas, L. Effects of COVID-19 on the Perception of Virtual Education in University Students in Ecuador; Technical and Methodological Principles at the Universidad Técnica Particular de Loja. Sustainability 2022, 14, 3204. [Google Scholar] [CrossRef]
  8. Steere-Williams, J. Endemic Fatalism and Why It Will Not Resolve COVID-19. Public Health 2022, 206, 29–30. [Google Scholar] [CrossRef]
  9. Lutfi, A.; Alsyouf, A.; Almaiah, M.A.; Alrawad, M.; Abdo, A.A.K.; Al-Khasawneh, A.L.; Ibrahim, N.; Saad, M. Factors Influencing the Adoption of Big Data Analytics in the Digital Transformation Era: Case Study of Jordanian SMEs. Sustainability 2022, 14, 1802. [Google Scholar] [CrossRef]
  10. Chen, F.-H.; Tsai, C.-C.; Chung, P.-Y.; Lo, W.-S. Sustainability Learning in Education for Sustainable Development for 2030: An Observational Study Regarding Environmental Psychology and Responsible Behavior through Rural Community Travel. Sustainability 2022, 14, 2779. [Google Scholar] [CrossRef]
  11. Greenhow, C.; Chapman, A. Social Distancing Meet Social Media: Digital Tools for Connecting Students, Teachers, and Citizens in an Emergency. Inf. Learn. Sci. 2020, 121, 341–352. [Google Scholar] [CrossRef]
  12. United Nations Educational, Scientific and Cultural Organization. Recommendation on Open Educational Resources (OER). Available online: http://portal.unesco.org/en/ev.php-URL_ID=49556&URL_DO=DO_TOPIC&URL_SECTION=201.html (accessed on 10 January 2022).
  13. Tight, M. Internationalization of Higher Education beyond the West: Challenges and Opportunities—The Research Evidence. Educ. Res. Eval. 2022, 27, 239–259. [Google Scholar] [CrossRef]
  14. Shim, T.E.; Lee, S.Y. College Students’ Experience of Emergency Remote Teaching Due to COVID-19. Child. Youth Serv. Rev. 2020, 119, 105578. [Google Scholar] [CrossRef] [PubMed]
  15. Whittle, C.; Tiwari, S.; Yan, S.; Williams, J. Emergency Remote Teaching Environment: A Conceptual Framework for Responsive Online Teaching in Crises. Inf. Learn. Sci. 2020, 121, 311–319. [Google Scholar] [CrossRef]
  16. Almaiah, M.A.; Al-Khasawneh, A.; Althunibat, A.; Almomani, O. Exploring the Main Determinants of Mobile Learning Application Usage During COVID-19 Pandemic in Jordanian Universities. In Emerging Technologies During the Era of COVID-19 Pandemic; Arpaci, I., Al-Emran, M., A. Al-Sharafi, M., Marques, G., Eds.; Studies in Systems, Decision and Control; Springer International Publishing: Cham, Switzerland, 2021; pp. 275–290. ISBN 978-3-030-67716-9. [Google Scholar]
  17. Chen, R.H. Effects of Deliberate Practice on Blended Learning Sustainability: A Community of Inquiry Perspective. Sustainability 2022, 14, 1785. [Google Scholar] [CrossRef]
  18. Crawford, J.; Cifuentes-Faura, J. Sustainability in Higher Education during the COVID-19 Pandemic: A Systematic Review. Sustainability 2022, 14, 1879. [Google Scholar] [CrossRef]
  19. Kwan, R.; Fong, J.; Kwok, L.-F.; Lam, J. Hybrid Learning: 4th International Conference, ICHL 2011, Hong Kong, China, August 10–12, 2011, Proceedings; Springer Science & Business Media: Berlin/Heidelberg, Germany, 2011; ISBN 978-3-642-22762-2. [Google Scholar]
  20. Behzad, M.; Adnan, N.; Malik, A.N.; Merchant, S.A. Technology-Embedded Hybrid Learning. Preprints 2022, 1–12. [Google Scholar] [CrossRef]
  21. Al-Ataby, A. Hybrid Learning Using Canvas LMS. Eur. J. Educ. Pedagogy 2021, 2, 27–33. [Google Scholar] [CrossRef]
  22. Handayani, T.; Kalengkongan, J.; Marini, A.; Sumantri, M.S. Developing Hybrid Learning Models Platform Based on User Experience. IOP Conf. Ser. Mater. Sci. Eng. 2021, 1098, 32018. [Google Scholar] [CrossRef]
  23. Cook, J.; Holley, D. COVID-19 Lock-Down: Hybrid Learning Cases Using the Lens of the Zone of Possibility. In Hybrid Learning Spaces; Gil, E., Mor, Y., Dimitriadis, Y., Köppe, C., Eds.; Understanding Teaching-Learning Practice; Springer International Publishing: Cham, Switzerland, 2022; pp. 77–94. ISBN 978-3-030-88520-5. [Google Scholar]
  24. Young, W.; Allen, L.; Warfield, K. Developing Online/Hybrid Learning Models for Higher Education Programs. Ala. J. Educ. Leadersh. 2016, 3, 47–56. [Google Scholar]
  25. Rotherham, A.J.; Willingham, D.T. ERIC—EJ889143—“21st-Century” Skills: Not New, but a Worthy Challenge, American Educator, 201. Am. Educ. 2010, 34, 17–20. [Google Scholar]
  26. Zaranis, N.; Exarchakos, G.M. The Use of ICT and the Realistic Mathematics Education for Understanding Simple and Advanced Stereometry Shapes Among University Students. In Research on e-Learning and ICT in Education: Technological, Pedagogical and Instructional Perspectives; Mikropoulos, T.A., Ed.; Springer International Publishing: Cham, Switzerland, 2018; pp. 135–152. ISBN 978-3-319-95059-4. [Google Scholar]
  27. Dagman, A.; Wärmefjord, K. An Evidence-Based Study on Teaching Computer Aided Design in Higher Education during the COVID-19 Pandemic. Educ. Sci. 2022, 12, 29. [Google Scholar] [CrossRef]
  28. Hodges, C.; Moore, S.; Lockee, B.; Trust, T.; Bond, A. The Difference between Emergency Remote Teaching and Online Learning. Available online: https://er.educause.edu/articles/2020/3/the-difference-between-emergency-remote-teaching-and-online-learning (accessed on 21 November 2021).
  29. Jacques, S.; Ouahabi, A.; Lequeu, T. Remote Knowledge Acquisition and Assessment During the COVID-19 Pandemic. Int. J. Eng. Pedagogy IJEP 2020, 10, 120–138. [Google Scholar] [CrossRef]
  30. Hodges, C.; McCullough, H. The Adjacent Possible for Higher Education: The Digital Transformation of Faculty. Available online: https://er.educause.edu/articles/2021/9/the-adjacent-possible-for-higher-education-the-digital-transformation-of-faculty (accessed on 21 November 2021).
  31. Khan, M.A.; Kamal, T.; Illiyan, A.; Asif, M. School Students’ Perception and Challenges towards Online Classes during COVID-19 Pandemic in India: An Econometric Analysis. Sustainability 2021, 13, 4786. [Google Scholar] [CrossRef]
  32. Kanetaki, Z.; Stergiou, C.; Bekas, G.; Troussas, C.; Sgouropoulou, C. A Hybrid Machine Learning Model for Grade Prediction in Online Engineering Education. Int. J. Eng. Pedagogy IJEP 2022, in press. [Google Scholar]
  33. Yao, P. Integrating Generalized Linear Auto-Regression and Artificial Neural Networks for Coal Demand Forecasting. In Proceedings of the Advances in Neural Networks—ISNN 2009; Yu, W., He, H., Zhang, N., Eds.; Springer: Berlin, Heidelberg, 2009; pp. 993–1001. [Google Scholar]
  34. Cui, J.; Zhang, Y.; An, R.; Yun, Y.; Dai, H.; Shang, X. Identifying Key Features in Student Grade Prediction. In Proceedings of the 2021 IEEE International Conference on Progress in Informatics and Computing (PIC), Shanghai, China, 17–19 December 2021; pp. 519–523. [Google Scholar]
  35. Chen, L.; Wu, M.; Pan, L.; Zheng, R. Grade Prediction in Blended Learning Using Multisource Data. Sci. Program. 2021, 2021, 4513610. [Google Scholar] [CrossRef]
  36. Sweeney, M.; Lester, J.; Rangwala, H. Next-Term Student Grade Prediction. In Proceedings of the 2015 IEEE International Conference on Big Data (Big Data), Santa Clara, CA, USA, 29 October–1 November 2015; IEEE: Santa Clara, CA, USA, 2015; pp. 970–975. [Google Scholar]
  37. Kanetaki, Z.; Stergiou, C.; Bekas, G.; Troussas, C.; Sgouropoulou, C. Analysis of Engineering Student Data in Online Higher Education During the COVID-19 Pandemic. Int. J. Eng. Pedagogy IJEP 2021, 11, 27–49. [Google Scholar] [CrossRef]
  38. Baranova, S.; Nīmante, D.; Kalniņa, D.; Oļesika, A. Students’ Perspective on Remote On-Line Teaching and Learning at the University of Latvia in the First and Second COVID-19 Period. Sustainability 2021, 13, 11890. [Google Scholar] [CrossRef]
  39. Gil, P.D.; da Cruz Martins, S.; Moro, S.; Costa, J.M. A Data-Driven Approach to Predict First-Year Students’ Academic Success in Higher Education Institutions. Educ. Inf. Technol. 2021, 26, 2165–2190. [Google Scholar] [CrossRef]
  40. Greenland, S.; Senn, S.J.; Rothman, K.J.; Carlin, J.B.; Poole, C.; Goodman, S.N.; Altman, D.G. Statistical Tests, P Values, Confidence Intervals, and Power: A Guide to Misinterpretations. Eur. J. Epidemiol. 2016, 31, 337–350. [Google Scholar] [CrossRef] [Green Version]
  41. Lew, M.J. A Reckless Guide to P-Values. In Good Research Practice in Non-Clinical Pharmacology and Biomedicine; Bespalov, A., Michel, M.C., Steckler, T., Eds.; Handbook of Experimental Pharmacology; Springer International Publishing: Cham, Switzerland, 2020; pp. 223–256. ISBN 978-3-030-33656-1. [Google Scholar]
  42. Jamalova, M.; Bálint, C. Modelling Students’ Adoption of E-Learning During the COVID-19 Pandemic: Hungarian Perspective. Int. J. Emerg. Technol. Learn. IJET 2022, 17, 275–292. [Google Scholar] [CrossRef]
  43. Kanetaki, Z.; Stergiou, C.; Bekas, G.; Troussas, C.; Sgouropoulou, C. Evaluating Remote Task Assignment of an Online Engineering Module through Data Mining in a Virtual Communication Platform Environment. Electronics 2022, 11, 158. [Google Scholar] [CrossRef]
  44. Taber, K.S. The Use of Cronbach’s Alpha When Developing and Reporting Research Instruments in Science Education. Res. Sci. Educ. 2018, 48, 1273–1296. [Google Scholar] [CrossRef]
  45. Shemwell, J.T.; Chase, C.C.; Schwartz, D.L. Seeking the General Explanation: A Test of Inductive Activities for Learning and Transfer. J. Res. Sci. Teach. 2015, 52, 58–83. [Google Scholar] [CrossRef]
  46. Commission Staff Working Document. Accompanying the Documents Communication from the Commission to the European Parliament, the Council, the European Economic and Social Committee and the Committee of the Regions on a European Strategy for Universities and the Commission Proposal for a Council Recommendation on Building Bridges for Effective European Higher Education Cooperation. 2022. Available online: https://op.europa.eu/en/publication-detail/-/publication/1ac1499e-791d-11ec-9136-01aa75ed71a1/language-en/format-PDF (accessed on 16 April 2022).
  47. Althunibat, A.; Almaiah, M.A.; Altarawneh, F. Examining the Factors Influencing the Mobile Learning Applications Usage in Higher Education during the COVID-19 Pandemic. Electronics 2021, 10, 2676. [Google Scholar] [CrossRef]
  48. Petousi, V.; Sifaki, E. Contextualising Harm in the Framework of Research Misconduct. Findings from Discourse Analysis of Scientific Publications. Int. J. Sustain. Dev. 2020, 23, 149. [Google Scholar] [CrossRef]
  49. Adjabi, I.; Ouahabi, A.; Benzaoui, A.; Taleb-Ahmed, A. Past, Present, and Future of Face Recognition: A Review. Electronics 2020, 9, 1188. [Google Scholar] [CrossRef]
  50. Adjabi, I.; Ouahabi, A.; Benzaoui, A.; Jacques, S. Multi-Block Color-Binarized Statistical Images for Single-Sample Face Recognition. Sensors 2021, 21, 728. [Google Scholar] [CrossRef] [PubMed]
  51. Khaldi, Y.; Benzaoui, A.; Ouahabi, A.; Jacques, S.; Taleb-Ahmed, A. Ear Recognition Based on Deep Unsupervised Active Learning. IEEE Sens. J. 2021, 21, 20704–20713. [Google Scholar] [CrossRef]
  52. El Morabit, S.; Rivenq, A.; Zighem, M.-E.; Hadid, A.; Ouahabi, A.; Taleb-Ahmed, A. Automatic Pain Estimation from Facial Expressions: A Comparative Analysis Using Off-the-Shelf CNN Architectures. Electronics 2021, 10, 1926. [Google Scholar] [CrossRef]
  53. Haneche, H.; Boudraa, B.; Ouahabi, A. A New Way to Enhance Speech Signal Based on Compressed Sensing. Measurement 2020, 151, 107117. [Google Scholar] [CrossRef]
  54. Mahdaoui, A.E.; Ouahabi, A.; Moulay, M.S. Image Denoising Using a Compressive Sensing Approach Based on Regularization Constraints. Sensors 2022, 22, 2199. [Google Scholar] [CrossRef]
Figure 1. The two main parts of the experimental procedure implemented.
Sustainability 14 05205 g001
Figure 2. General diagram illustrating the methodology used in this study.
Sustainability 14 05205 g002
Figure 3. Organization of the 12-week course for the different teaching modes.
Sustainability 14 05205 g003
Figure 4. Reasons why students took the module online.
Sustainability 14 05205 g004
Figure 5. Reasons why students took the module face-to-face.
Sustainability 14 05205 g005
Figure 6. Histogram of grade estimation errors.
Sustainability 14 05205 g006
Figure 7. Spearman correlation coefficient including statistically significant variables. * Variables that were statistically significant in 2020–2021 [32], i.e., in exclusively online environments.
Sustainability 14 05205 g007
Figure 8. Error histogram of the refined GLAR model, i.e., dedicated to hybrid learning spaces.
Sustainability 14 05205 g008
Figure 9. Comparative analysis of the two GLAR models.
Sustainability 14 05205 g009
Figure 10. Model validation and external factors applied to failing students [32].
Sustainability 14 05205 g010
Figure 11. Key steps in the learning process for computer-aided mechanical design to make the course more sustainable. * Variables that were statistically significant in 2020–2021 [32], i.e., in exclusively online environments.
Sustainability 14 05205 g011
Table 1. Variables positively and negatively correlated with students’ ability to complete assignments (Spearman’s Rho correlation coefficients).
Correlated VariableRhoCorrelated VariableRho
Usefulness of videos demonstrating the sketching methodology−0.24Did you fully conceive the objects assessed?0.30
Study time per week for CAD I *−0.22Enjoyable versus other Labs *0.32
Sustainability of the learning process *0.18Enjoyable CAD I compared to other theories0.34
Assignments related to future tasks as a Mechanical Engineer *0.19Attend the four first lectures face-to-face0.35
Comfortable for final exams of all modules0.21Have you noticed any weaknesses during CAD I Lectures? *0.37
Theory contributes on understanding the topics0.23Number of lectures performed0.38
CAD I preferred to other modules0.24Did you understand the concept of planes? *0.38
Helpful the presence of Cutting planes in Blue in 3-D views *0.27Classroom fatigue *0.39
Are your questions answered during lectures?0.27Rate CAD I out of 10 *0.44
Receive help on assignments?0.27Insecurity *0.52
Computer skills0.28Managing knowledge gaps *0.55
Evaluation versus other modules *0.28Comfortable for CAD I final exams *0.58
Evaluate workload0.28Likely to succeed in a similar future task *0.59
* Variables that were statistically significant in 2020–2021 [32], i.e., in exclusively online environments.
Table 2. Variables with p-values less than or equal to 5%.
Variablep-ValueVariablep-ValueVariablep-ValueVariablep-Value
Class group 030.05%Class group 050.13%Class group 090.00%Age1.00%
Able to complete assignments after 3 months0.08%Assignments related to future tasks *0.40%Enjoyable versus other Labs *0.20%Comfortable for final exams *0.19%
Assimilation of the concept of planes *3.50%Pleasant compared to other theories0.03%Likely to sucked in a similar future task *0.30%Assignments relevant to future work *1.90%
Managing knowledge gaps *1.50%Instructor number 30.09%
* Variables that were statistically significant in 2020–2021 [32], i.e., in exclusively online environments.
Table 3. Cronbach’s alpha statistics of the 23 ordinal variables isolated from the questionnaires.
VariablesScale Mean If Item DeletedScale Variance If Item DeletedCorrected Item-Total CorrelationSquared Multiple CorrelationCronbach’s Alpha If Item Deleted
1Comfortable for final exams of all modules *90.3462.5560.360.350.826
2Able to perform assignments after 3 months89.0560.0320.610.560.815
3Assessing the workload *89.2165.4890.270.200.829
4Theory contributes to the understanding of subjects *89.3263.0200.300.210.829
5Clarity of image and sound in videos *89.0365.3020.200.190.832
6Answers to the questions asked during the lectures *88.5464.9400.290.170.828
7Computer skills *89.0860.7050.450.500.821
8Social media application skills *88.5464.5400.300.370.828
9Assignments related to future tasks as a mechanical engineer *89.2162.9680.360.320.825
10User-friendly compared to other laboratory modules *88.5863.0860.500.510.821
11Familiarization with MS Teams *89.0764.5750.220.210.832
12Insecurity *89.2960.6230.480.450.820
13Comfortable for CAD I module final exams *89.5059.8380.590.570.815
14Quality of task evaluation on MS Teams *88.9565.6250.250.350.829
15Quizzes help to assimilate the theory *88.8063.7880.300.270.828
16Assimilation of the conception of planes *88.8760.8590.560.420.817
17Usefulness of the presence of cutting planes in blue *88.7463.1320.380.240.825
18User-friendly compared to other theoretical modules *88.5364.0580.410.540.824
19Identify weaknesses *88.5561.9730.350.350.827
20Basic software skills *89.8460.7310.380.420.826
21Likely to succeed at a similar task in the future *89.3160.2420.610.590.815
22Sustainability of the learning process *89.5563.8070.280.260.829
23CAD I preferred to the other modules *88.6663.7140.440.510.823
* Variables that were statistically significant in 2020–2021 [32], i.e., in exclusively online environments.
Table 4. Success criteria for the prediction of the two models.
GLAR Model—
2020–2021 Release
GLAR Model—
2021–2022 Release
Number of Students%Number of Students%
Actual pass9263.01%9263.01%
Actual fail5436.99%5436.99%
Prediction “pass” correct6570.65%8289.13%
Prediction “fail” correct2444.44%2750.00%
Prediction ±1 correct5235.62%9363.70%
Overestimated6645.21%7148.63%
Underestimated8054.79%7551.37%
Overestimated and failed 3020.55%2617.80%
Underestimated and passed2617.81%106.85%
Table 5. Non-show cases in relation to the size of the class.
Class SizeNON-SHOWErrorInstructor’s IDStudent’s ID
231−1.393XX392057
231−1.123XX392071
213 *−1.481XX392093
213 *−1.701XX392110
213 *−1.581XX392117
215 *−0.852XX392141
185 *−1.574XX392068
185 *−1.014XX392195
185 *−1.882XX392177
206 *−0.764XX392003
* Non-diligent students not included.
Publisher’s Note: MDPI stays neutral with regard to jurisdictional claims in published maps and institutional affiliations.

