Article

Crop-Suitability Analysis Using the Analytic Hierarchy Process and Geospatial Techniques for Cereal Production in North India

1
ICAR-Indian Agricultural Research Institute, New Delhi 110012, India
2
Department of Computer Science and Engineering, Guru Jambheshwar University of Science & Technology, Hisar 125001, India
3
ICAR-National Institute of Agricultural Economics and Policy Research, New Delhi 110012, India
4
ICAR-Indian Agricultural Statistics Research Institute, New Delhi 110012, India
5
Thapar Institute of Engineering and Technology, Patiala 147004, India
6
ICAR-National Institute of Plant Biotechnology, New Delhi 110012, India
7
ICAR-Research Complex for Eastern Region, Patna 800014, India
8
School of Forestry and Environment Science, Sam Higginbottom University of Agriculture, Technology & Sciences, Allahabad 211003, India
*
Authors to whom correspondence should be addressed.
Sustainability 2022, 14(9), 5246; https://0-doi-org.brum.beds.ac.uk/10.3390/su14095246
Submission received: 25 February 2022 / Revised: 18 April 2022 / Accepted: 19 April 2022 / Published: 26 April 2022

Abstract

:
Identification of cropland suitability is obligatory to adapting to the increased food needs driven by population expansion, environmental contamination, and climate change. Given this, the present study was conducted to assess cereal crops’ suitability in India’s Haryana state by integrating Analytic Hierarchy Process (AHP) and geographic information system (GIS) technique. Multiple factors were considered for this study, such as rainfall, temperature, soil texture, drainage density, pH, organic carbon, electrical conductivity, and slope. The AHP technique was utilized to decide the weights of each individual parameter using experts’ opinions. The crop-suitability model was developed using the model builder module in ArcGIS 10.8, and each input parameter was reclassified as per the optimum crop-growth requirement and overlaid utilizing the reclassify tool and weighted overlay analysis. The crop suitability classes were estimated as highly suitable, S1 (6%); moderately suitable, S2 (71%); and marginally suitable, S3 (23%) for the calculated arable land for the wheat crop. Similarly, the crop suitability class of rice S2 (28%); S3 (72%), for sorghum S1 (28%); S2 (71%); S3 (1%), for maize S2 (85%); S3 (15%) and for pearl millet S1 (60%); S2 (40%) were also estimated. The study has observed that, as per the soil physico-chemical characteristics and climate, the area is moderately fertile. Therefore, agricultural production can be improved by cultivating the crop in highly and moderately suitable zones. Diversification of marginally suitable regions for crops other than that for which it is not suitable can be taken up, which will also ensure the income security of marginal farmers.

1. Introduction

Cropland-suitability assessment plays a vital role in agricultural development and planning. Climate change has emerged as a global challenge that impacts agricultural production and food security across the world [1]. Due to the increasing population in developing countries such as India, natural resources such as land, water, minerals, and biomass are currently underexploited. Crop production without considering a land suitability analysis would lead to land degradation [2]. In the present scenario, where land is a limiting aspect, it is unattainable to expand the area being farmed. Therefore, land suitability classes should be identified to increase cereal production with available land. The crops have to be cultivated in their best-suited areas. Hence, land-suitability analysis is required for sustainable crop production [3,4].
Many researchers have used GIS and remote-sensing techniques to assess land suitability, to increase crop production and reduce environmental footprints and the cost for the input material [5,6,7,8]. As a multicriterion decision-analysis (MCDA) technique, AHP is widely adopted and known to be one of the most efficient methods in defining the weights of factors [9], and to solve different problems based on complex factors at distinct stages. Some researchers have used either the GIS technique [5,10,11] or the AHP method [12,13] alone in land-suitability assessment and observed that either managing the weights of each individual parameter is indigent or insufficient in determining a suitability index. Furthermore, the integration of AHP and GIS-based techniques in assessing land suitability has excellent prospects to enhance the efficiency and accuracy of findings [14,15,16,17,18]. Using the AHP method of the MCDA technique with GIS is a valuable method for diversifying the crops and cropping systems for obtaining better output from agriculture-food systems [
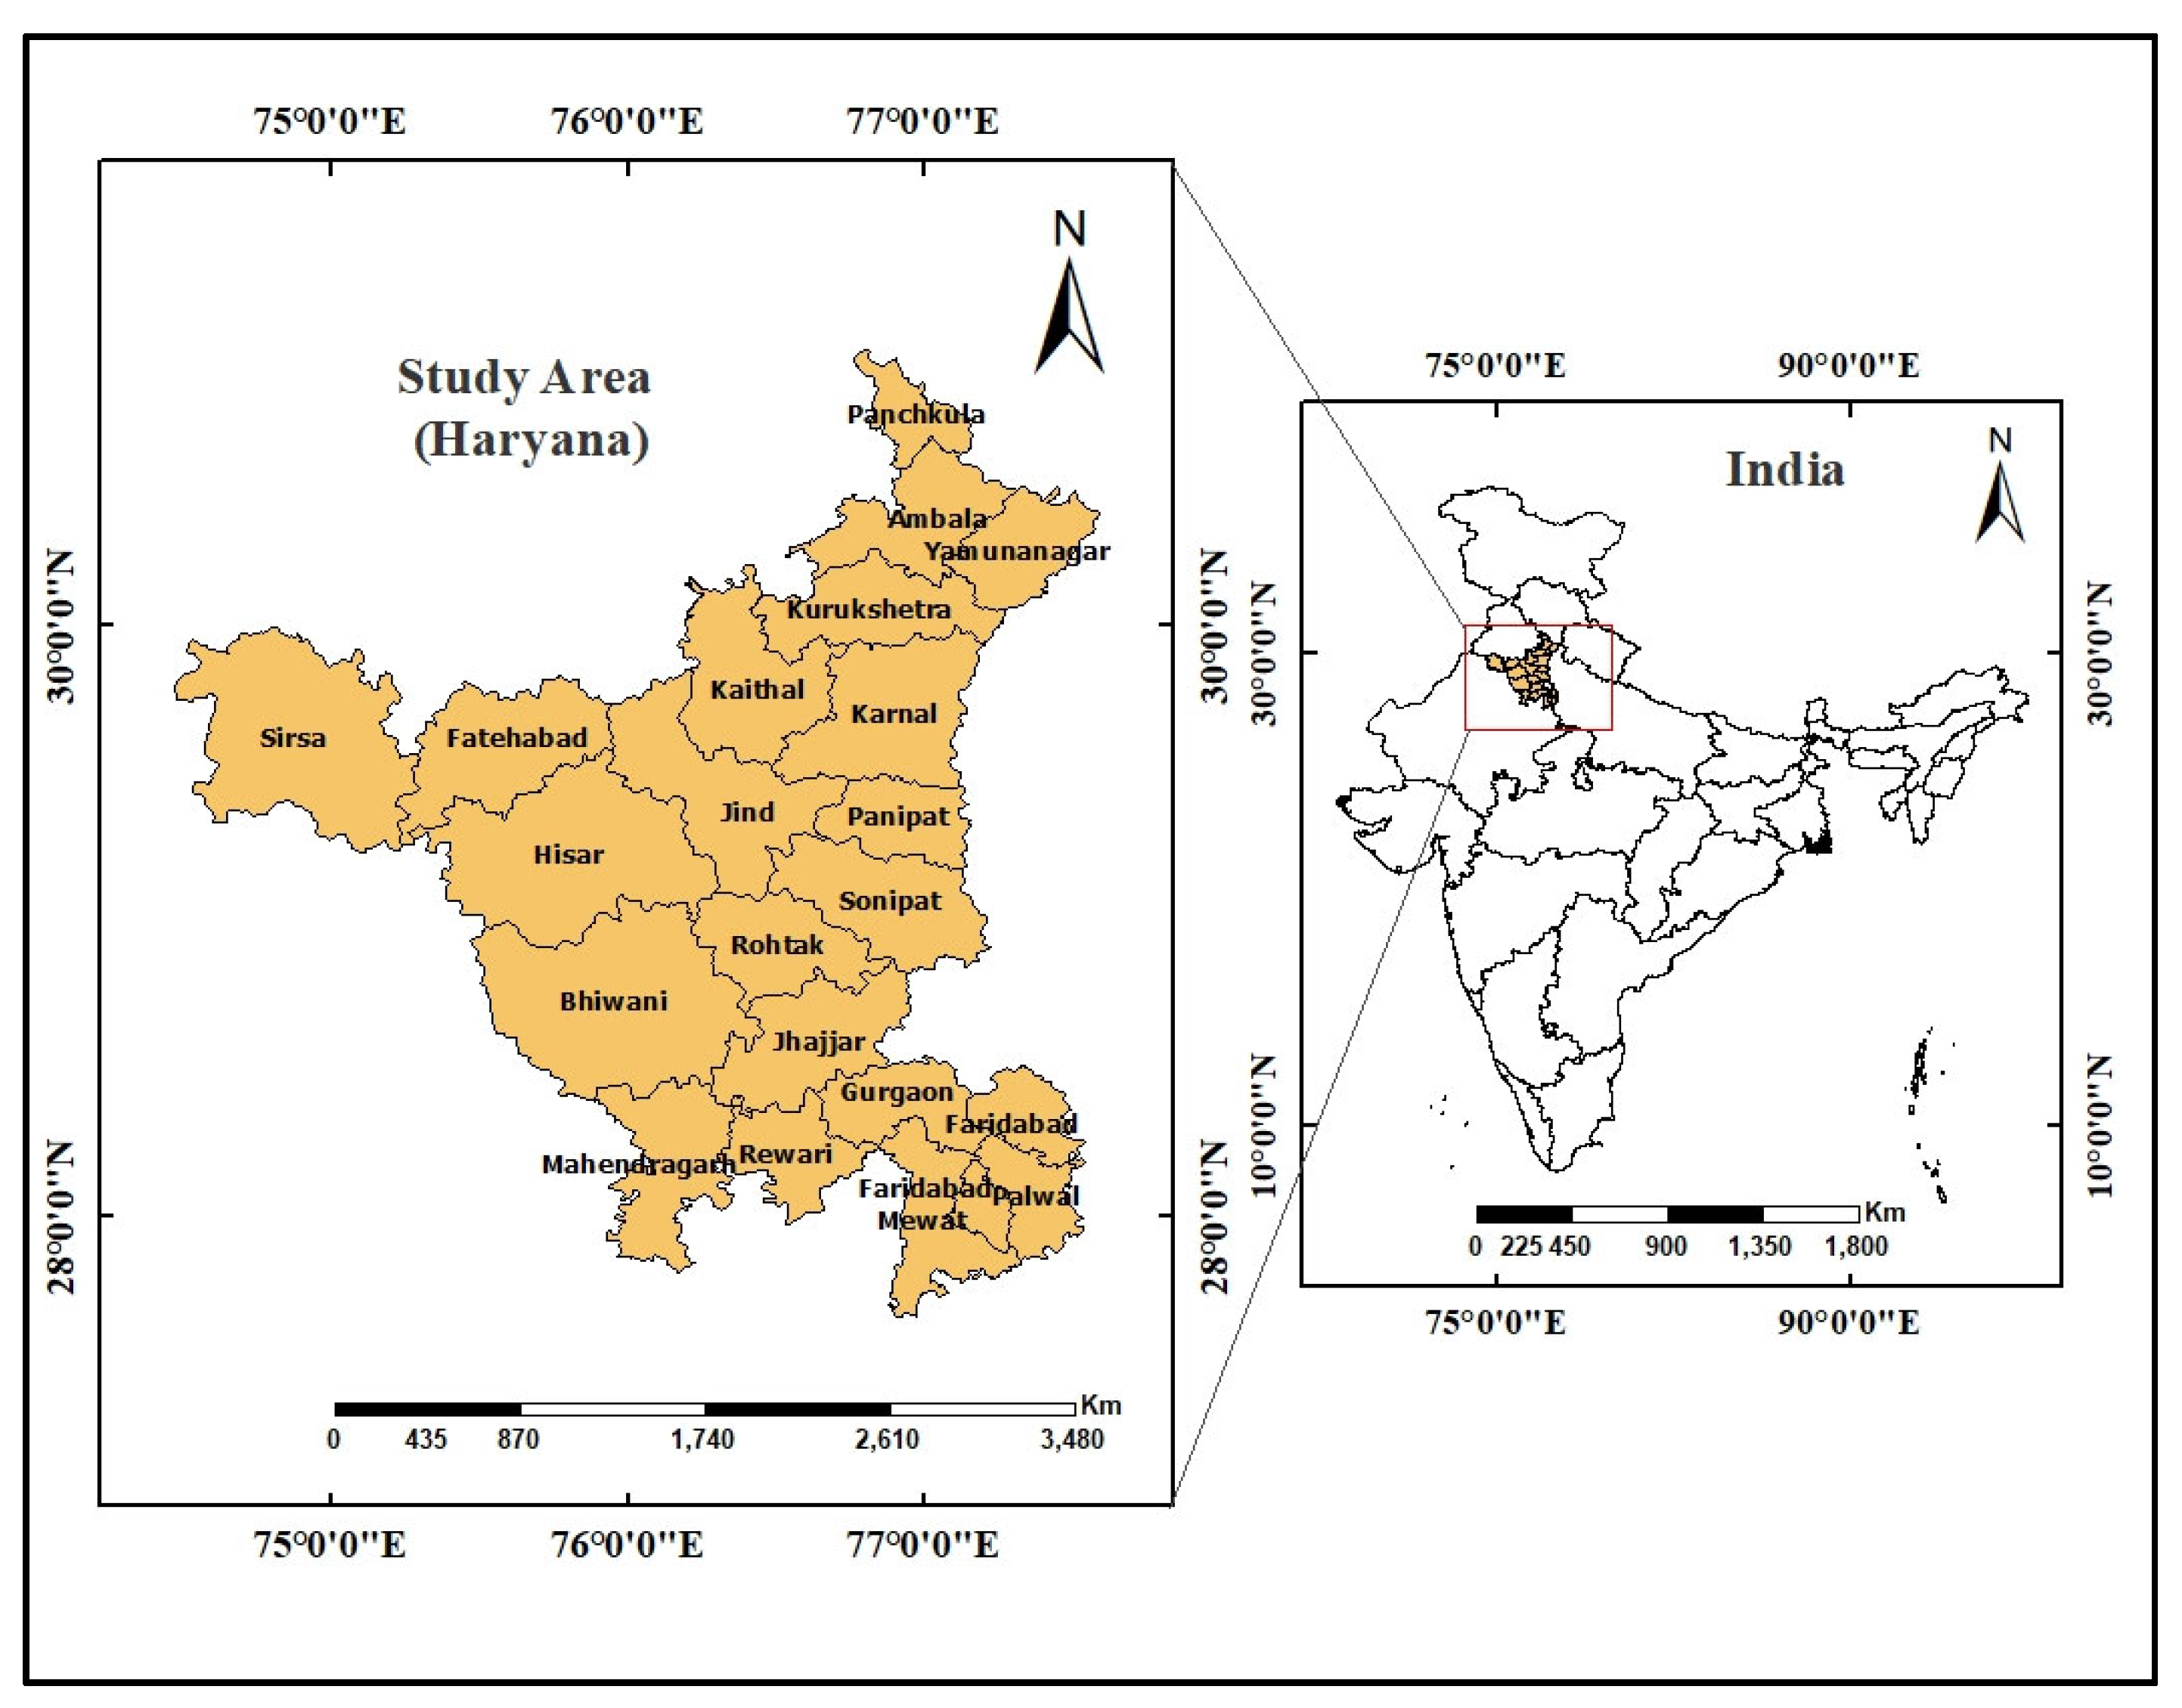
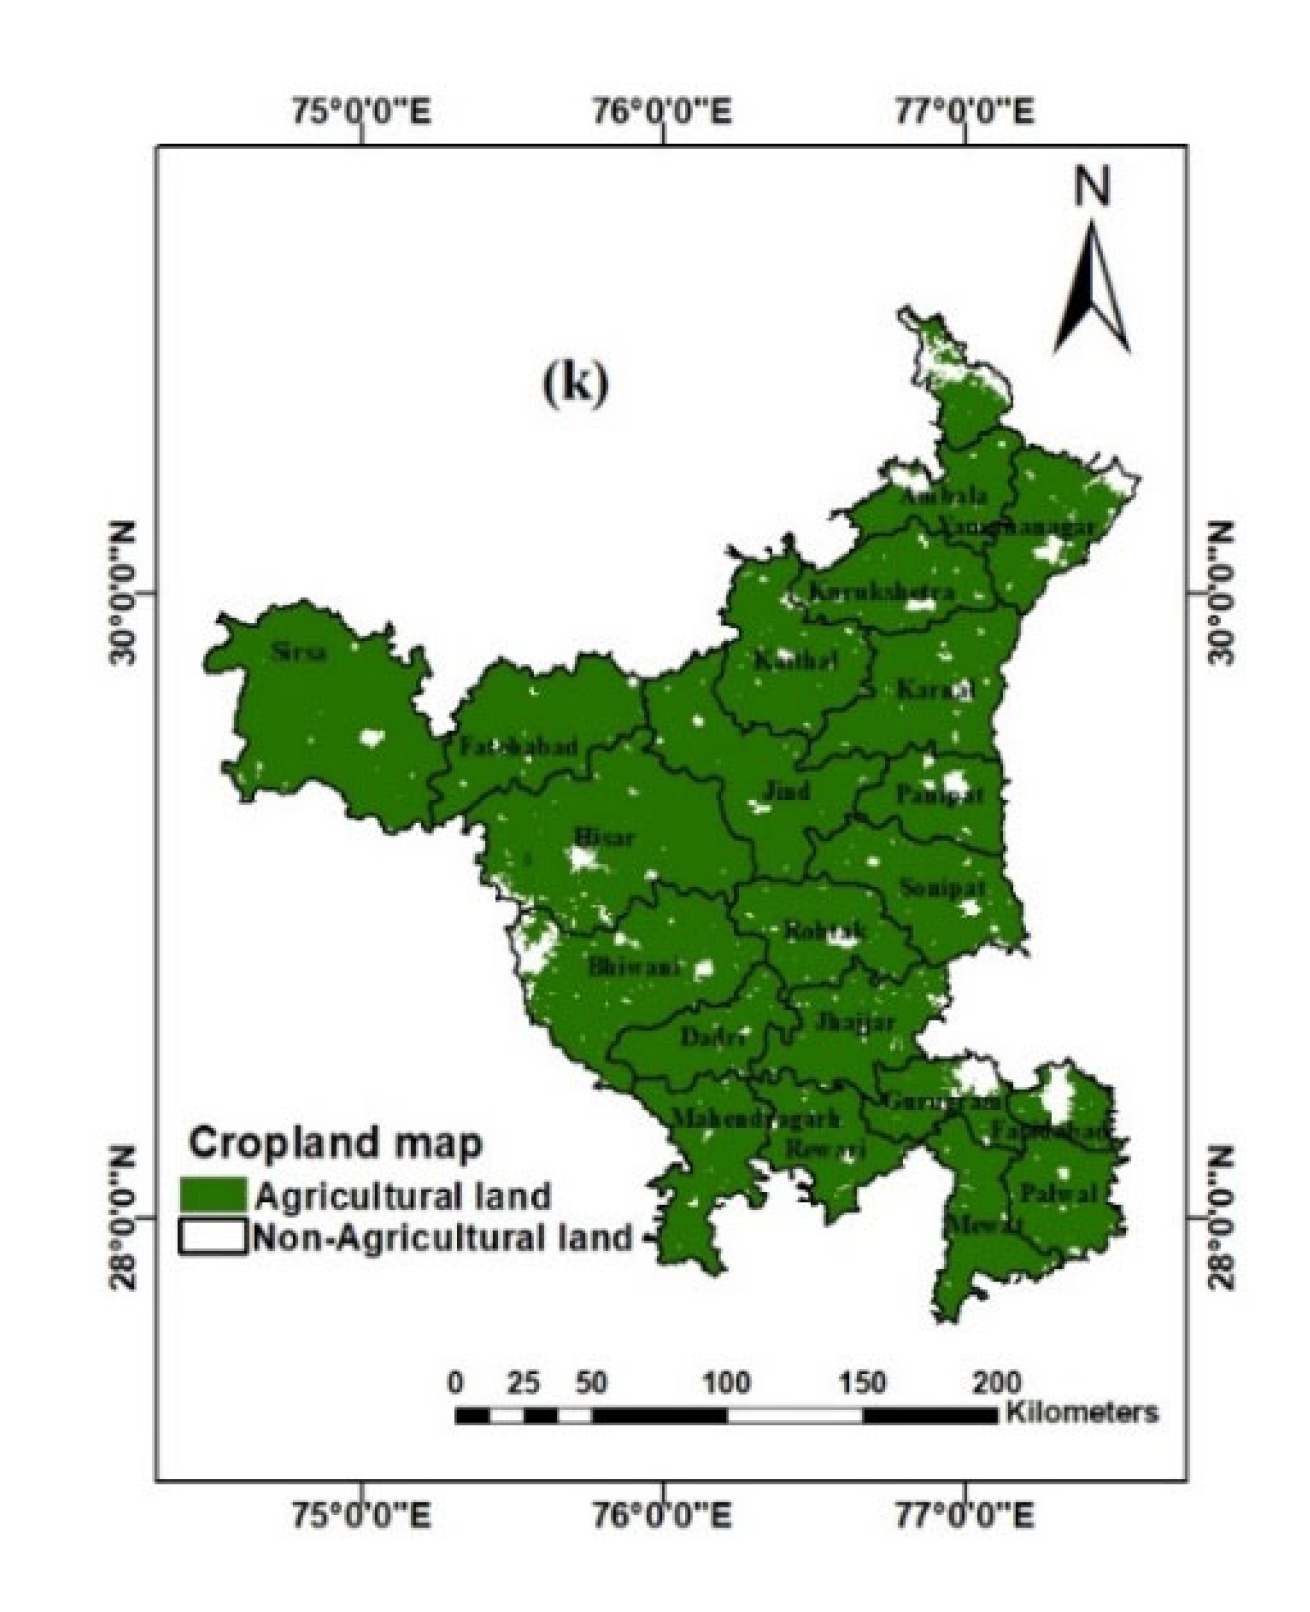
19]. Hence, GIS permits the build-up of models utilizing a new thematic map (e.g., a land-suitability map) that can be developed from a set of thematic maps (viz., climatic map, soil map, etc.). Identification of suitable crops will further facilitate environmentally friendly sustainable agriculture by developing optimum crop plans. Most of the farmers of Haryana—one of the leading food producer provinces of India—are practicing similar cropping patterns in their land due to a lack of awareness of land-suitability-based crop production.
Table 1 shows the trends pertaining to acreage and per cent share of major crops over the period of the last 50 years in Haryana. More than 50 per cent of the gross cropped area (GCA) is under wheat and rice cultivation in Haryana. The share of both the crops has been increasing over the time. Rice has occupied around 22 per cent of the area of the total cropped area of the state in triennium ending (TE) 2020, which was only 5.7% during TE 1973. Wheat has shown an increase of 15% share during the last 50 years. On the other hand, the share of sorghum, pearl millet and maize decreased considerably in the same period. Favorable government policies and assured prices of rice and wheat have also converted Haryana to a monocrop state, leading to the problem of water scarcity. Therefore, there is need to find the crops that are bio-physically suitable, so as to overcome the problem of water scarcity.
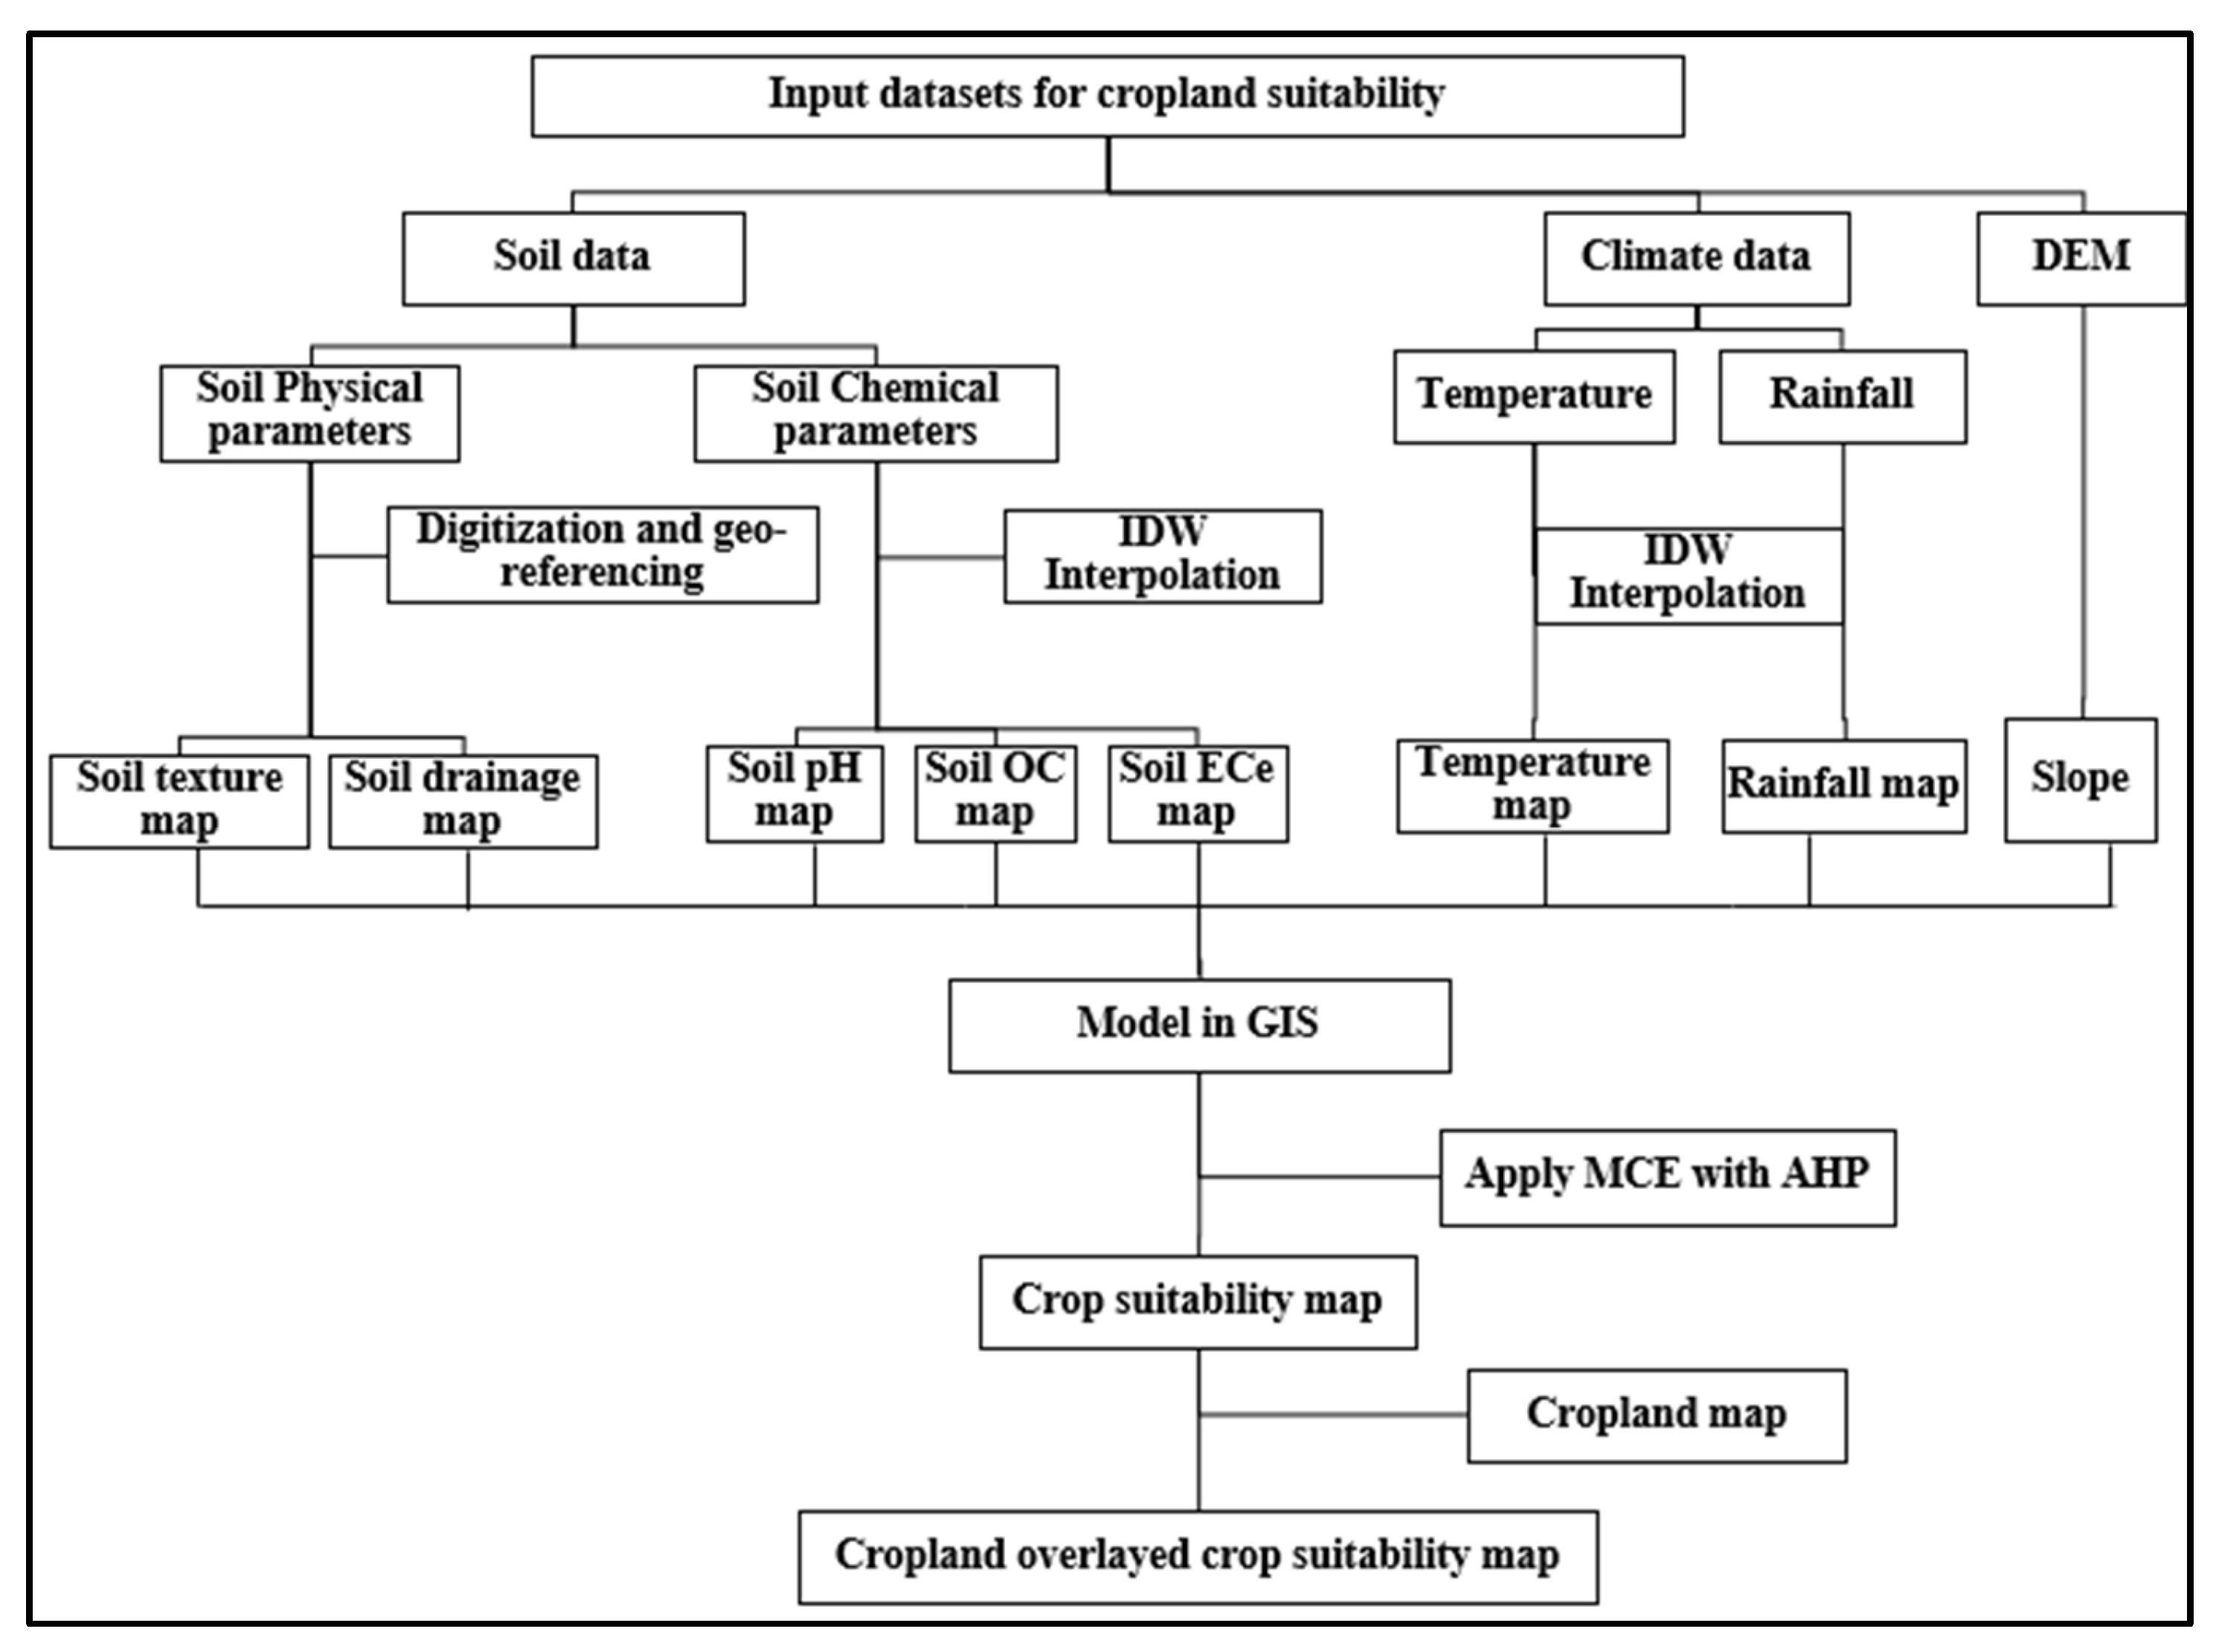
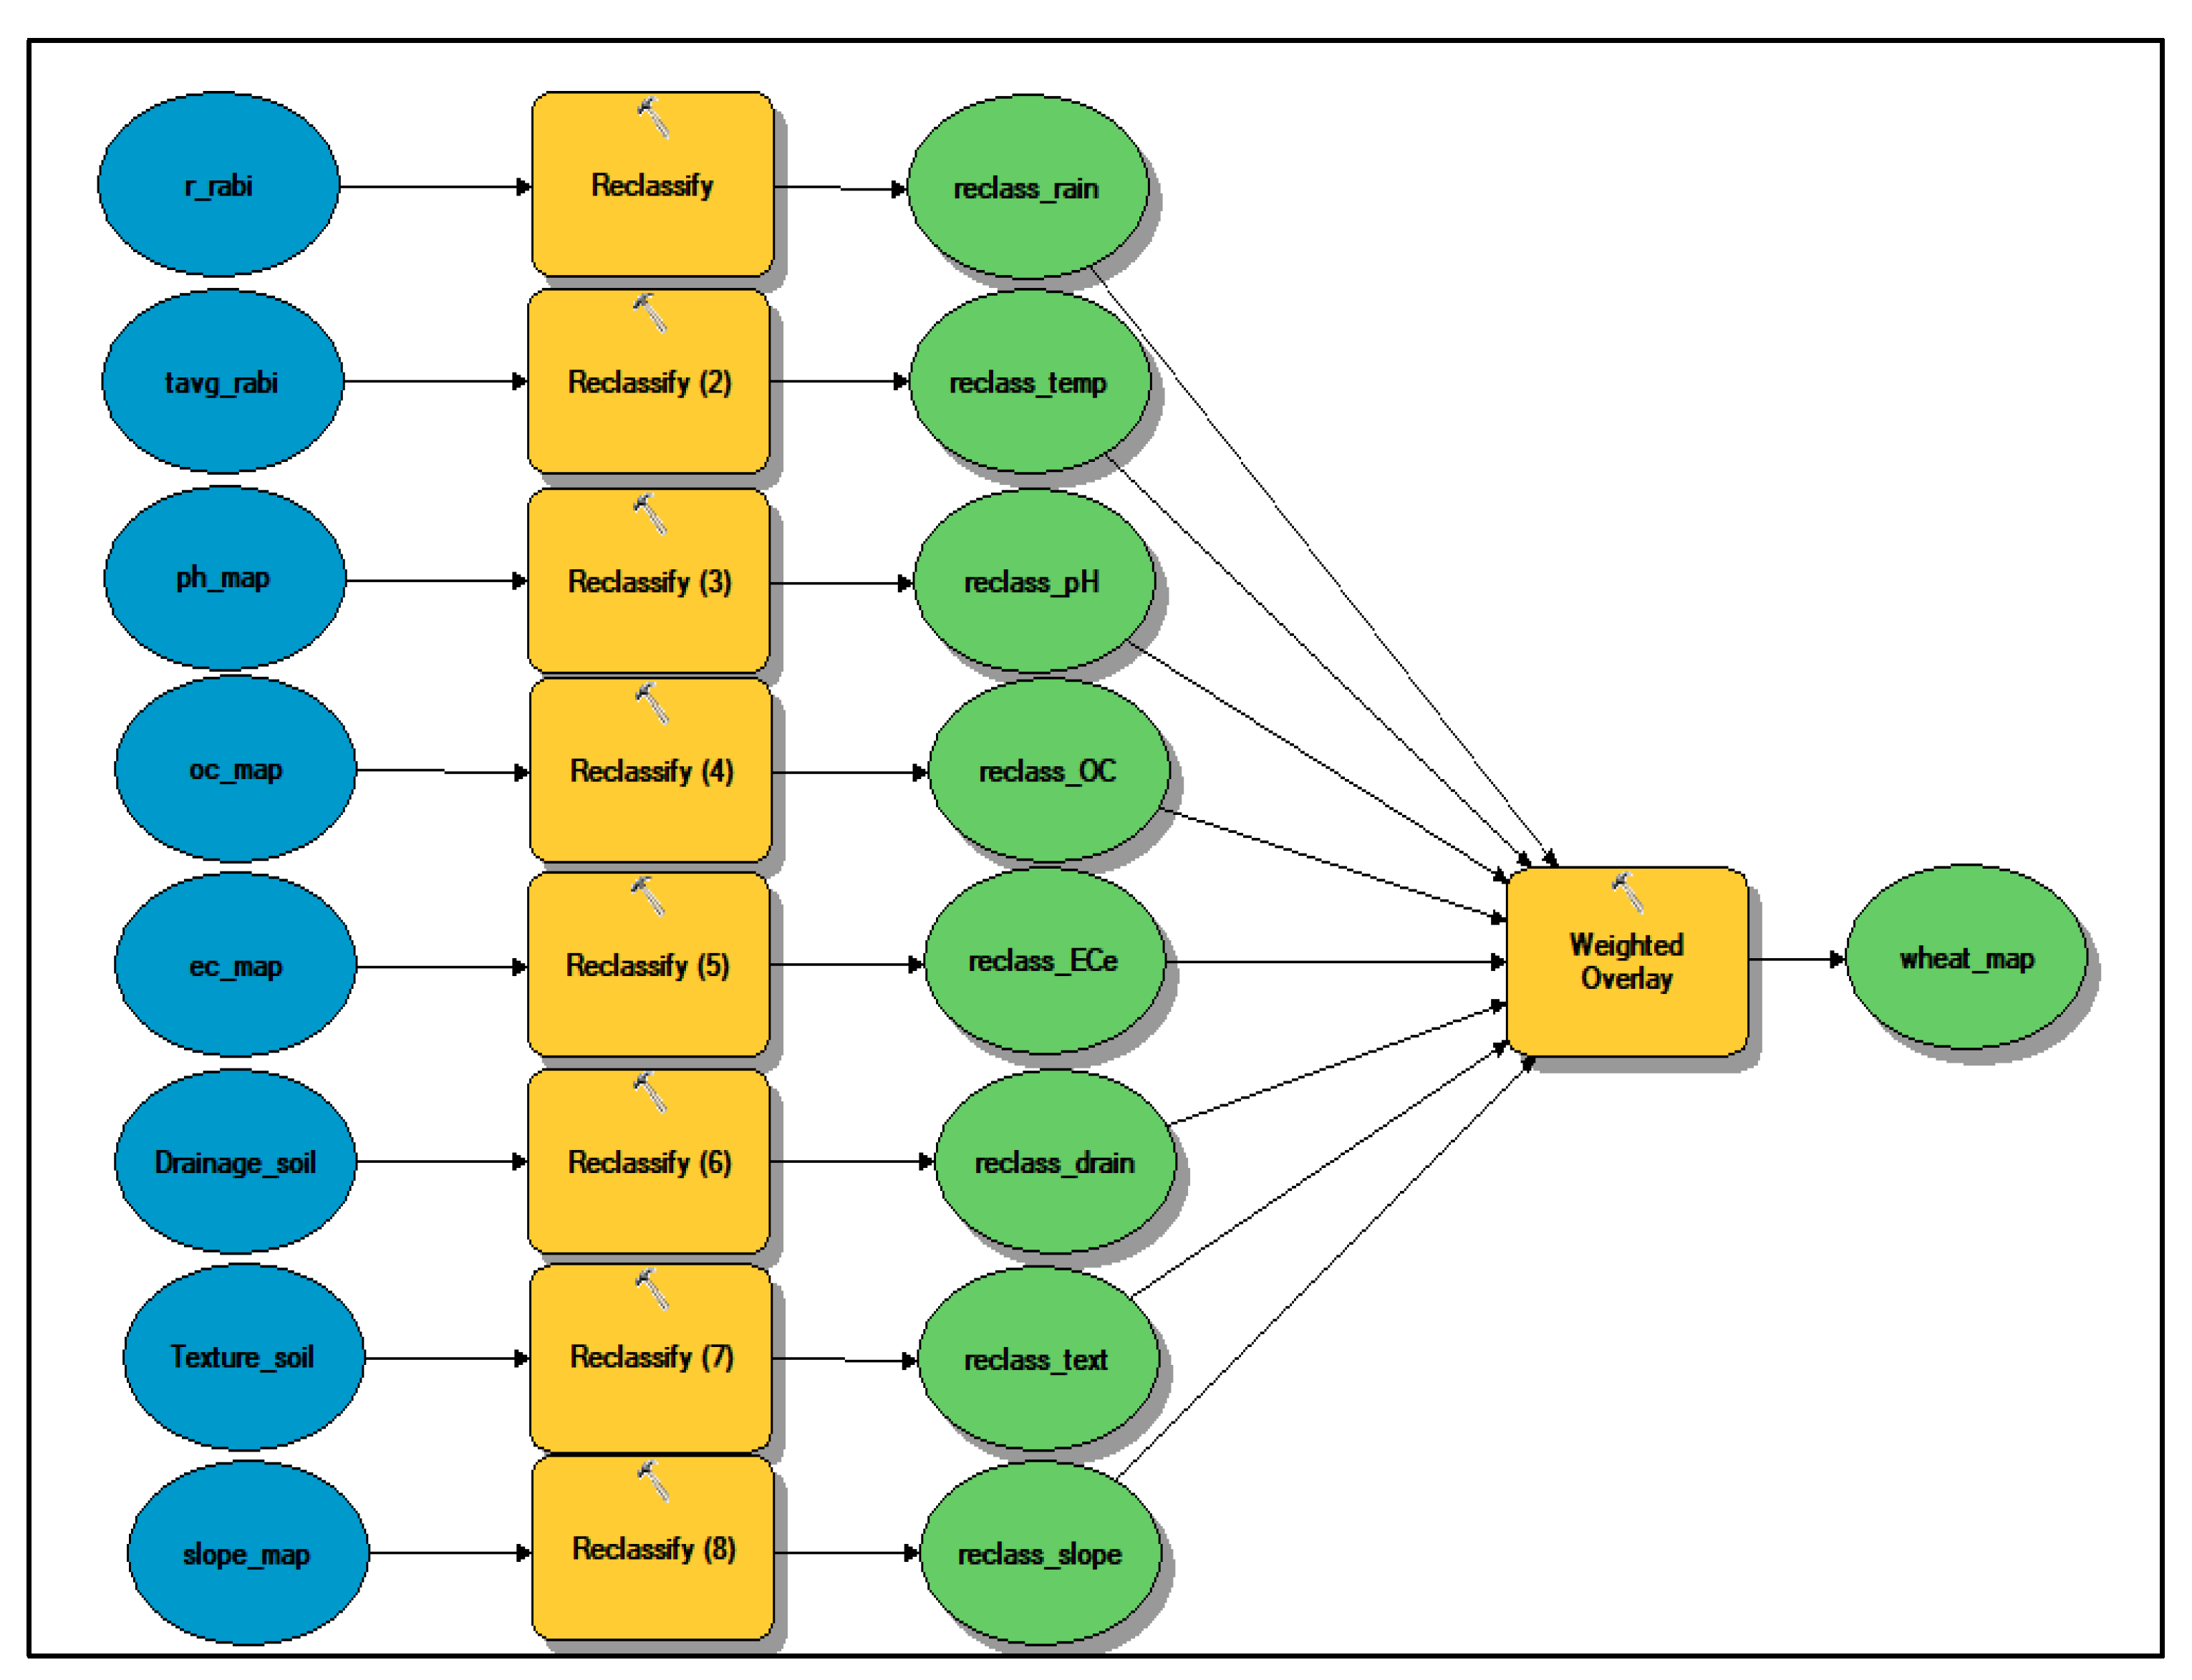
In the present study, the AHP technique coupled with GIS were used to systematically assess the cropland suitability of the target ecology for different cereal crops, such as wheat, rice, maize, sorghum and pearl millet, utilizing soil, climatic and topographical parameters.
Furthermore, the novel research contributions of the presented study are: a) there exists only a handful scientific studies that identify the best-suitable area for cereals production [20,21,22,23] and these exist mostly for particular districts and not for a whole state, whereas the present work considers the whole state as its study area using the GIS–AHP approach, and b) the study provides an effective approach for the selection of a possible cropping pattern based on agro-ecological suitability, while most of the existing works are based on conventional methods for the same objective [6,21,24,25,26].
The remainder of the article is organized as follows: Section 2 elaborates on the methodology and dataset used in the presented study, Section 3 describes the results and experiments conducted in the work along with a sensitivity analysis. Section 4 gives a brief discussion of the obtained results using the proposed methodology, and a compact summary is given in Section 5 of the article.

2. Materials and Methods

2.1. Study Area

The study was executed for Haryana state of India, located between 27°39’ to 30°55.5’ N latitude and 74°27.8’ to 77°36.5’ E longitude and at the altitude of 200 m to 300 m above mean sea level (Figure 1). The state’s total area is 4.42 m ha, which is about 1.35% of the country’s geographical area. The daily temperature in the state fluctuates between 5 °C and 15 °C in winter and 15 °C and 45 °C during summer season. There are two main agro-climatic zones in Haryana, namely, the southwestern zone and the northeastern zone.
As per the report of the Ground Water Cell, Agriculture and Farmer Welfare Department, Haryana, the state’s water table has fallen from 10.44 (1970) to 20.71 (2019) meters (www.tribuneindia.com (accessed on 2 April 2022)). Furthermore, increasing fertilizer usage and decreasing soil fertility over the past few decades in the state [27] calls for the need for crop suitability management in this region.
Figure 1. Map of the present study region.
Sustainability 14 05246 g001

2.2. Data Used

The parameters undertaken to evaluate the land suitability for crop production includes soil reaction (pH), electrical conductivity (ECe), organic carbon (OC), soil texture, soil drainage, temperature, rainfall, slope and land use/land cover (Table 2) based on a relevant literature review [28,29,30,31,32,33].

2.3. Generation of Thematic Maps

Thematic maps of climatic and soil chemical parameters were created using the inverse distance weighted (IDW) interpolation technique in ArcMap10.8 software. The soil map acquired from NBSS&LUP was scanned, georeferenced and digitized in ArcMap10.8 software to create soil texture and drainage maps. The DEM images downloaded from Bhuvan website were used to prepare the slope map. The land use/land cover (cropland) map was created by images acquired from the USGS earth explorer website www.earthexplorer.usgs.gov (accessed on 4 July 2019) in GIS environment.

2.4. Weight Determination Using the AHP Method of MCDA

The AHP method is considered among the best available approaches of MCDA, which was used for assessing and analyzing land-use suitability for different crops [12,34,35,36,37]. The pairwise comparison matrix was created on the basis of the relative importance of one criterion over another for determining the parameter weights, as per the AHP preference scale (Table 3).
A scale of 9 indicates that one factor is more important than the other, while 1 means equal importance. The reciprocals of 1 to 9 (1/1 and 1/9) show that one is less important than the other [24,39]. For example, in the case of wheat crop (Table 4), when comparing slope and soil texture parameters, a value of 1 is equally essential while a value of 1/3 means that slope is less important than texture. Reciprocal values 1/3, 1/5, 1/7, 1/9 were used in cases where the row factor was found to be less important than the column factor.
The PWCM with the parameters’ weights for each crop were generated (Table 4, Table 5, Table 6, Table 7 and Table 8). In the PWCM, the importance of parameters was decided by considering the opinion of a group of experts. The expert panel consisted of senior-level professors and scientists from diverse domains, including plant experts, soil experts, agronomists, economists, and agro-meteorologist from national-level research and teaching institutes.
Table 4. Pairwise comparison matrix and parameters’ weights in AHP for wheat crop.
CriteriaSlopeTemperatureRainfallpHOCECeDrainageTexture
Pairwise comparison matrix
Slope11/71/51/51/51/51/51/3
Temperature71315332
Rainfall51/3113111
pH51111/3111
OC51/51/331313
ECe51/3111/3113
Drainage51/3111111
Texture31/2111/31/311
Column total36.003.848.539.2011.2010.539.2012.33
Normalized pairwise comparison matrix
Slope0.030.040.020.020.020.020.020.03
Temperature0.190.260.350.110.450.280.330.16
Rainfall0.140.090.120.110.270.090.110.08
pH0.140.260.120.110.030.090.110.08
OC0.140.050.040.330.090.280.110.24
ECe0.140.090.120.110.030.090.110.24
Drainage0.140.090.120.110.090.090.110.08
Texture0.080.130.120.110.030.030.110.08
Normalized sum of rowsNormalized average rowsEigenvector
Eigenvector
Slope0.200.20/80.024
Temperature2.132.13/80.266
Rainfall1.001.00/80.125
pH0.940.94/80.117
OC1.281.28/80.160
ECe0.930.93/80.116
Drainage0.830.83/80.103
Texture0.690.69/80.086
λmax = 8.95, n = 8, CI (consistency index) = 0.136, RI (random index) = 1.41, CR = 0.096, ∑ = 1.
Priorities were specified by standardizing the PWCM. For this standardization, a normalized pairwise comparison matrix was constructed by dividing the column values of the matrix by the respective column sum [40]. The row values in the created matrix were added, and the resultant value was divided by the total number of factors in the particular row. In such a way, a priority vector was acquired. The pairwise matrix can be mathematically described as:
A = a 11 a 12 a 1 n a 21 a 22 a 2 n . . . .   . . . . a n 1 a n 2 . a n n
In the pairwise matrix, the sum of each column was represented as follows:
a i j = i = 1 n a i j
Then, each value in the matrix was divided by the respective column sum to create a standardized pairwise matrix:
b i j = a i j i = 1 n a i j = b 11 b 12 b 1 n b 21 b 22 b 2 n . . . .   . . . . b n 1 b n 2 . b n n
Lastly, the sum of the standardized matrix column was divided by the total number of criteria considered (n) to create the weighted matrix of the priority criteria:
w i j = j = 1 n b i j n = w 11 w 12 . . w 1 n
The original consistency vectors were obtained by multiplication of the pairwise matrix by the weight vectors:
a 11 a 12 a 1 n a 21 a 22 a 2 n . . . .   . . . . a n 1 a n 2 . a n n × w 11 w 12 . . w 1 n = a 11 w 11 a 12 w 12 a 1 n w 1 n a 21 w 12 a 22 w 22 a 2 n w 1 n . . . .   . . . . a n 1 w 1 n a n 2 w n 2 . a n n w 1 n = v 11 v 12 . . v 1 n
Furthermore, the principal eigenvector (λmax) was computed by averaging the elements of the consistency vector:
λ max = i = 1 n avij
Eigenvalues were computed by averaging the respective rows of each matrix, these values were also mentioned to as relative weights.
In the AHP method, while executing the pairwise comparisons of criteria, a certain level of variation may follow. To tackle this problem, consistency ratio (CR) was used for preventing bias through criteria weighting. As a solution, eigenvectors and the largest eigenvalue of the respective matrix were computed, and the consistency index (CI) was examined using the following equation:
CI =   ( λ max n ) / n 1
Here, λmax represents the maximum eigenvalue of the pairwise comparison matrix and n is the number of criteria in each PWCM.
Finally, the uniformity of the PWCM was examined using the random consistency index (RI) value, as shown in Table 9. CR was computed by using the method given below.
CR = CI / RI
To be valid, its consistency ratio should be ≤0.10 [41]. If the acquired value is larger than 0.10, it is essential to develop the PWCM.
Table 9. Random index (RI) value for varying “n” in the AHP [40,42].
n12345678 *910
RI000.580.901.121.241.321.411.451.49
* The RI value for 8 criteria is 1.41.

2.5. Suitability Analysis

After computing the weight of each criterion relative to the crops and the generation of thematic layers of input parameters, the suitability models were developed for each crop by using the model builder module of ArcGIS 10.8 software (Figure 2). The crop-wise thresholds for input parameters were prepared based on the NBSS&LUP crop-suitability manual [43]. Each criterion was reclassified into four groups, namely, S1 represents land that is highly appropriate for crops with no limiting factors, S2 denotes land that is moderately suitable with some limiting factors, S3 denotes land that is marginally ideal for crops with severe limiting factors, and N indicates land unsuitable for agriculture. After that, suitability maps for each crop were obtained by integrating all the reclassified thematic layers, including LU/LC map (Figure 3k) with corresponding weights derived from AHP using weighted overlay analysis (WOA) technique, as follow:
S = j = 1 n w j x j   where , j = 1 n w j = 1
where wj is the weight of criterion j, xj is the obtained score of criterion j, n is the total number of criteria, and S is the suitability score corresponding to each crop, from the complete target region. The flow chart of the methodology used in this study is illustrated in Figure 2.
Figure 2. Flowchart of the complete methodology for delineating the crop suitability.
Sustainability 14 05246 g002
Figure 3. Spatial variability map for: (a) soil texture; (b) drainage; (c) pH; (d) OC; (e) ECe; (f) rainfall rabi; (g) rainfall kharif; (h) temperature rabi; (i) temperature kharif; (j) slope; (k) cropland.
Sustainability 14 05246 g003aSustainability 14 05246 g003bSustainability 14 05246 g003c

2.6. Sensitivity Analysis

The main purpose of conducting sensitivity analysis is to investigate the influence on overall outcome by changing the weights of parameters [41,44]. There are three ways of performing parameter sensitivity analysis: changing the relative importance of parameters, changing the value of the parameters, and changing the weights of the parameters. In this study, the sensitivity analysis has been carried out based on changing weights of the parameters following the “what-if” approach. Sensitivity analysis provides a potential decision-making procedure to identify the key factor that influences the initial decision the most. In this study, each parameter was assigned equal weights through weighted overlay analysis and final maps were generated for each crop, which depict the extent of spatial variability of suitability classification.

3. Results

3.1. Spatial Variability of Soil and Climatic Parameters

The results indicated that the soil pH in the target area fluctuated between 7.0 and 8.3 with a mean value of 7.65 (Figure 3c). The maximum area was found to be slightly alkaline (55.8%) followed by moderately alkaline (43.8%). The soils were non-saline to slightly saline as the ECe value ranged between 0.16 to 1.36 dSm−1. About 98% of the total area was found to be non-saline (<0.8 dSm−1) (Figure 3e). In the case of OC, only 2.9% of the total area was characterized by high availability (>0.75%), whereas 53.3% of the area was medium availability (0.4–0.75%) and 43.7% of the region in low availability (<0.4%) (Figure 3d). In the case of soil texture, a total of five texture classes, namely, sandy (25.95%), sandy loam (32.47%), clay loam (19.03%), sandy clay loam (20.04%) and clayey (0.27%), were found in the study area (Figure 3a). While, in case of drainage, four classes, namely, moderately well drained (42.39%), well drained (30.95%), excessively drained (26.37%) and imperfectly drained (0.27%), were identified (Figure 3b).
The average rainfall varied between 37 mm to 96 mm in the rabi season (Figure 3f) and 244 mm to 660 mm in the Kharif season (Figure 3g). During rabi season, the highest rainfall (80 mm to 96 mm) was observed in Panchkula, Ambala and Yamunanagar and the lowest rainfall (37 mm to 52 mm) was observed in the southwestern zone, including some districts of the northeastern area, namely, Rohtak, Jhajjar, Gurugram, Faridabad, Palwal and Mewat; while, during kharif season the highest rainfall (500 mm to 660 mm) was observed in the Panchkula, Ambala and Yamunanagar districts whereas the lowest rainfall ranges between (244 mm to 337 mm) was observed in the Sirsa, Hisar and Fatehabad districts. During both seasons, a gradual decrease in rainfall was also noticed from the northeastern zone to the southwestern zone. In the case of average seasonal temperature, minimal spatial variability was seen during rabi and kharif. During the rabi and kharif seasons, the average seasonal temperature varied from 17 to 19 °C (Figure 3h) and 30 to 32 °C (Figure 3i), respectively.

3.2. Slope Map

The slope represents the topography of the region or indicators of the geomorphological characteristics of the soil. A DEM was used to construct the slope map of the target region. A lower slope denotes a flatter terrain, and a higher slope indicates a steeper topography.
The slope of the study area varied between less than 3.4% to greater than 40 per cent. The reclassified slope map reveals that most of the study area has a slope of less than or equal to 3.4%, as shown in Figure 3j; practically all the target regions are appropriate for the cultivation of all the crops from the perspective of the slope.

3.3. AHP Analysis

The weight of eight parameters was calculated cropwise in the AHP analysis, to define the priority of the criteria in comparison to each other, which effects the final suitability map of each crop. The results of AHP showed that temperature was the most important criterion, with a weightage of 26.6% in the case of the wheat crop. In contrast, rainfall was the important criterion for rice, with a weightage of 23.9%. The slope was noted as least significant for wheat and rice, with weightages of 2% and 6%, respectively (Table 4 and Table 5). For sorghum, maize and pearl millet, OC was observed as the most important criterion with weightages of 24.4%, 23.6%, and 24.8%, respectively. At the same time, temperature was the least important for sorghum and pearl millet with weightages of 6% and 8%, respectively; while, for maize, slope was found to be the least essential criterion with a weightage of 3.4% (Table 6, Table 7 and Table 8). These preferences are mathematically accurate and intuitively understandable, as the estimated score was obtained through the ratio scale.

3.4. Suitability Analysis for Different Crops

A land-suitability study was executed to evaluate the extent and degree of the capability of the land for the production of various crops (wheat, sorghum, rice, pearl millet, and maize). The integration of the AHP and the geospatial technique was carried out to assess the suitability of the target area for different crops considering specific climatic parameters, and topographical and physico-chemical land characteristics. This study illustrates that higher crop production can be achieved by the proper utilization of similar characteristics of soil in a specific agroclimatic region under deliberate management practices.
The suitability maps were obtained for each crop after running the model. For example, the model developed for wheat-cropland suitability is presented in Figure 4, and the dissemination of suitability classes (by percentage area coverage) for different crops is presented in Figure 5. The suitability map for each crop is shown in Figure 6.

3.4.1. Wheat (Triticum aestivum)

Figure 6a illustrates the analysis results of the suitability of the wheat crop using MCE-AHP. The results indicated that only 6.3% of the arable land is fit for the wheat crop, found mainly in Kaithal and some parts of the Kurukshetra, Ambala, Yamunanagar, Jind, and Sirsa districts. A moderately suitable region constitutes the most substantial fraction (70.4%) of the calculated arable region, mainly found in the eastern zone, including some parts of the Hisar, Fatehabad, Bhiwani Sirsa, Rewari and Dadri districts of the western zone. In contrast, marginally suitable constitutes 23.2% of the calculated arable land covering most of the area of Mahendragarh and some parts of the Rewari, Bhiwani, Dadri, Gurugram, Mewat, Fatehabad, Hisar and Sirsa districts.
Figure 5. The distribution of crop-suitability classes.
Sustainability 14 05246 g005

3.4.2. Rice (Oryza sativa)

The results showed that the 28.29% of the land that is moderately suitable for rice production is found in some districts under the northeastern zone. In comparison, marginally suitable includes the most substantial proportion, with 71.71% of the calculated arable land, and is found mainly in the southwestern and some parts of the northeastern zone (Figure 6b). The significant limitations faced by rice cultivation in the area under study are the low availability of organic carbon, well drained to somewhat excessively drained soil drainage conditions, and low rainfall intensity in this region.
Figure 6. Suitability map for (a) wheat; (b) rice; (c) sorghum; (d) maize; (e) pearl millet.
Sustainability 14 05246 g006aSustainability 14 05246 g006b

3.4.3. Sorghum (Sorghum bicolor)

The result indicated that moderately suitable includes the most substantial proportion with 71.16% of the calculated arable region for sorghum production to be found mainly in the Ambala, Yamunanagar, Panchkula, Kurukshetra, Kaithal, Jind, Karnal districts and some parts of Panipat, Sonipat, Jhajjar, Faridabad and Palwal. Highly suitable constitutes about 27.85% of the land found in almost all the districts, due to favorable conditions, while marginally suitable constitutes only 0.99% of the calculated arable land, found only in some parts of the Sirsa district (Figure 6c).

3.4.4. Maize (Zea mays)

The result for the maize-suitability assessment indicated that moderately suitable constitutes the most substantial proportion, with 84.96% of the calculated arable region for maize production found in most Haryana state districts. Conversely, only 15.04% of the calculated arable land was marginally suitable, and found in the districts of Mahendragarh, Dadri, Gurugram, Bhiwani, Mewat, Sirsa and Hisar, due to sandy soil and somewhat excessively drained soil conditions (Figure 6d).

3.4.5. Pearl Millet (Pennisetum glaucum)

The land-suitability analysis showed that Pear millet is a highly suitable crop across the state. The result showed that highly suitable constitutes the most substantial proportion, with 60.14% of the calculated arable region, found in almost all the districts of Haryana except Mahendragarh, Rewari and Gurugram. While moderately suitable constitutes 39.86% of the calculated arable land, located in the Mahendragarh, Rewari, Gurugram, and some parts of the Sirsa, Fatehabad, Kaithal, Bhiwani, Hisar, Faridabad, Palwal and Panchkula, districts. A large area falls under the highly suitable group in the target area because of prevailing conditions (Figure 6e).

3.5. Sensitivity Analysis

The sensitivity analysis that was performed using the same weights for all the criteria generated different result at different levels in the suitability analysis. The results showed that, in case of wheat, 4.99% of the arable land is highly suitable (S1), 85.44% of the area was observed to be the moderately suitable (S2) class, while 9.57% of the area was marginally suitable (S3). In the case of rice, it was observed that 47.25% of the area was found to be moderately suitable (S2) and 52.75% of the area was found to be marginally suitable (S3). For sorghum crop, 68.38% of the area was found to be moderately suitable, followed by highly suitable with 31.5% and 0.12% of the marginally suitable class (S3). In the case of maize, the majority of the area (96.99%) was found to be the moderately suitable class (S2) followed by 2.60% marginally suitable (S3) and 0.41% of the highly suitable class (S1). In the case of pearl millet, 54.79% of the area was found to be highly suitable and 45.21% of the area moderately suitable(S2) (Table 10).

4. Discussion

This study integrated climatic, soil, and topography factors to estimate the cropland-suitability classes of cereal crops, namely, wheat, maize, rice, sorghum and pearl millet, which synchronize with several recent study reports. As GIS offers elasticity and accuracy in land-use organization, some researchers [45,46,47,48,49] have highlighted the approach of GIS integrated with AHP for incorporating expert opinion in pairwise comparison among criteria at each hierarchy level, which is similar with this study. The precision of the weights utilized is subjective, as it is determined by the experts; however, relative weights results were utilized in the cropland-suitability assessment because the consistency ratios were within the predefined acceptable limits (0.1) [38]. The consistency ratio for wheat, sorghum, rice, maize and pearl millet was calculated as 0.096, 0.10, 0.096, 0.099 and 0.065, respectively, and is considered acceptable [40]. Our findings reveal that combining the AHP method with GIS can improve policymakers and planners’ decision-making capability.
Evaluating the extent and classes of cropland suitability in the state for cereal crops is essential to select the right crop for the target region. In performing this evaluation, the crops’ specific necessities were compared with the land features and, based on the extent of matching, the area’s suitability for the crops were determined. The classification was based on the inherent soil properties, external land features and climatic factors that bound the usage of the land for several uses.
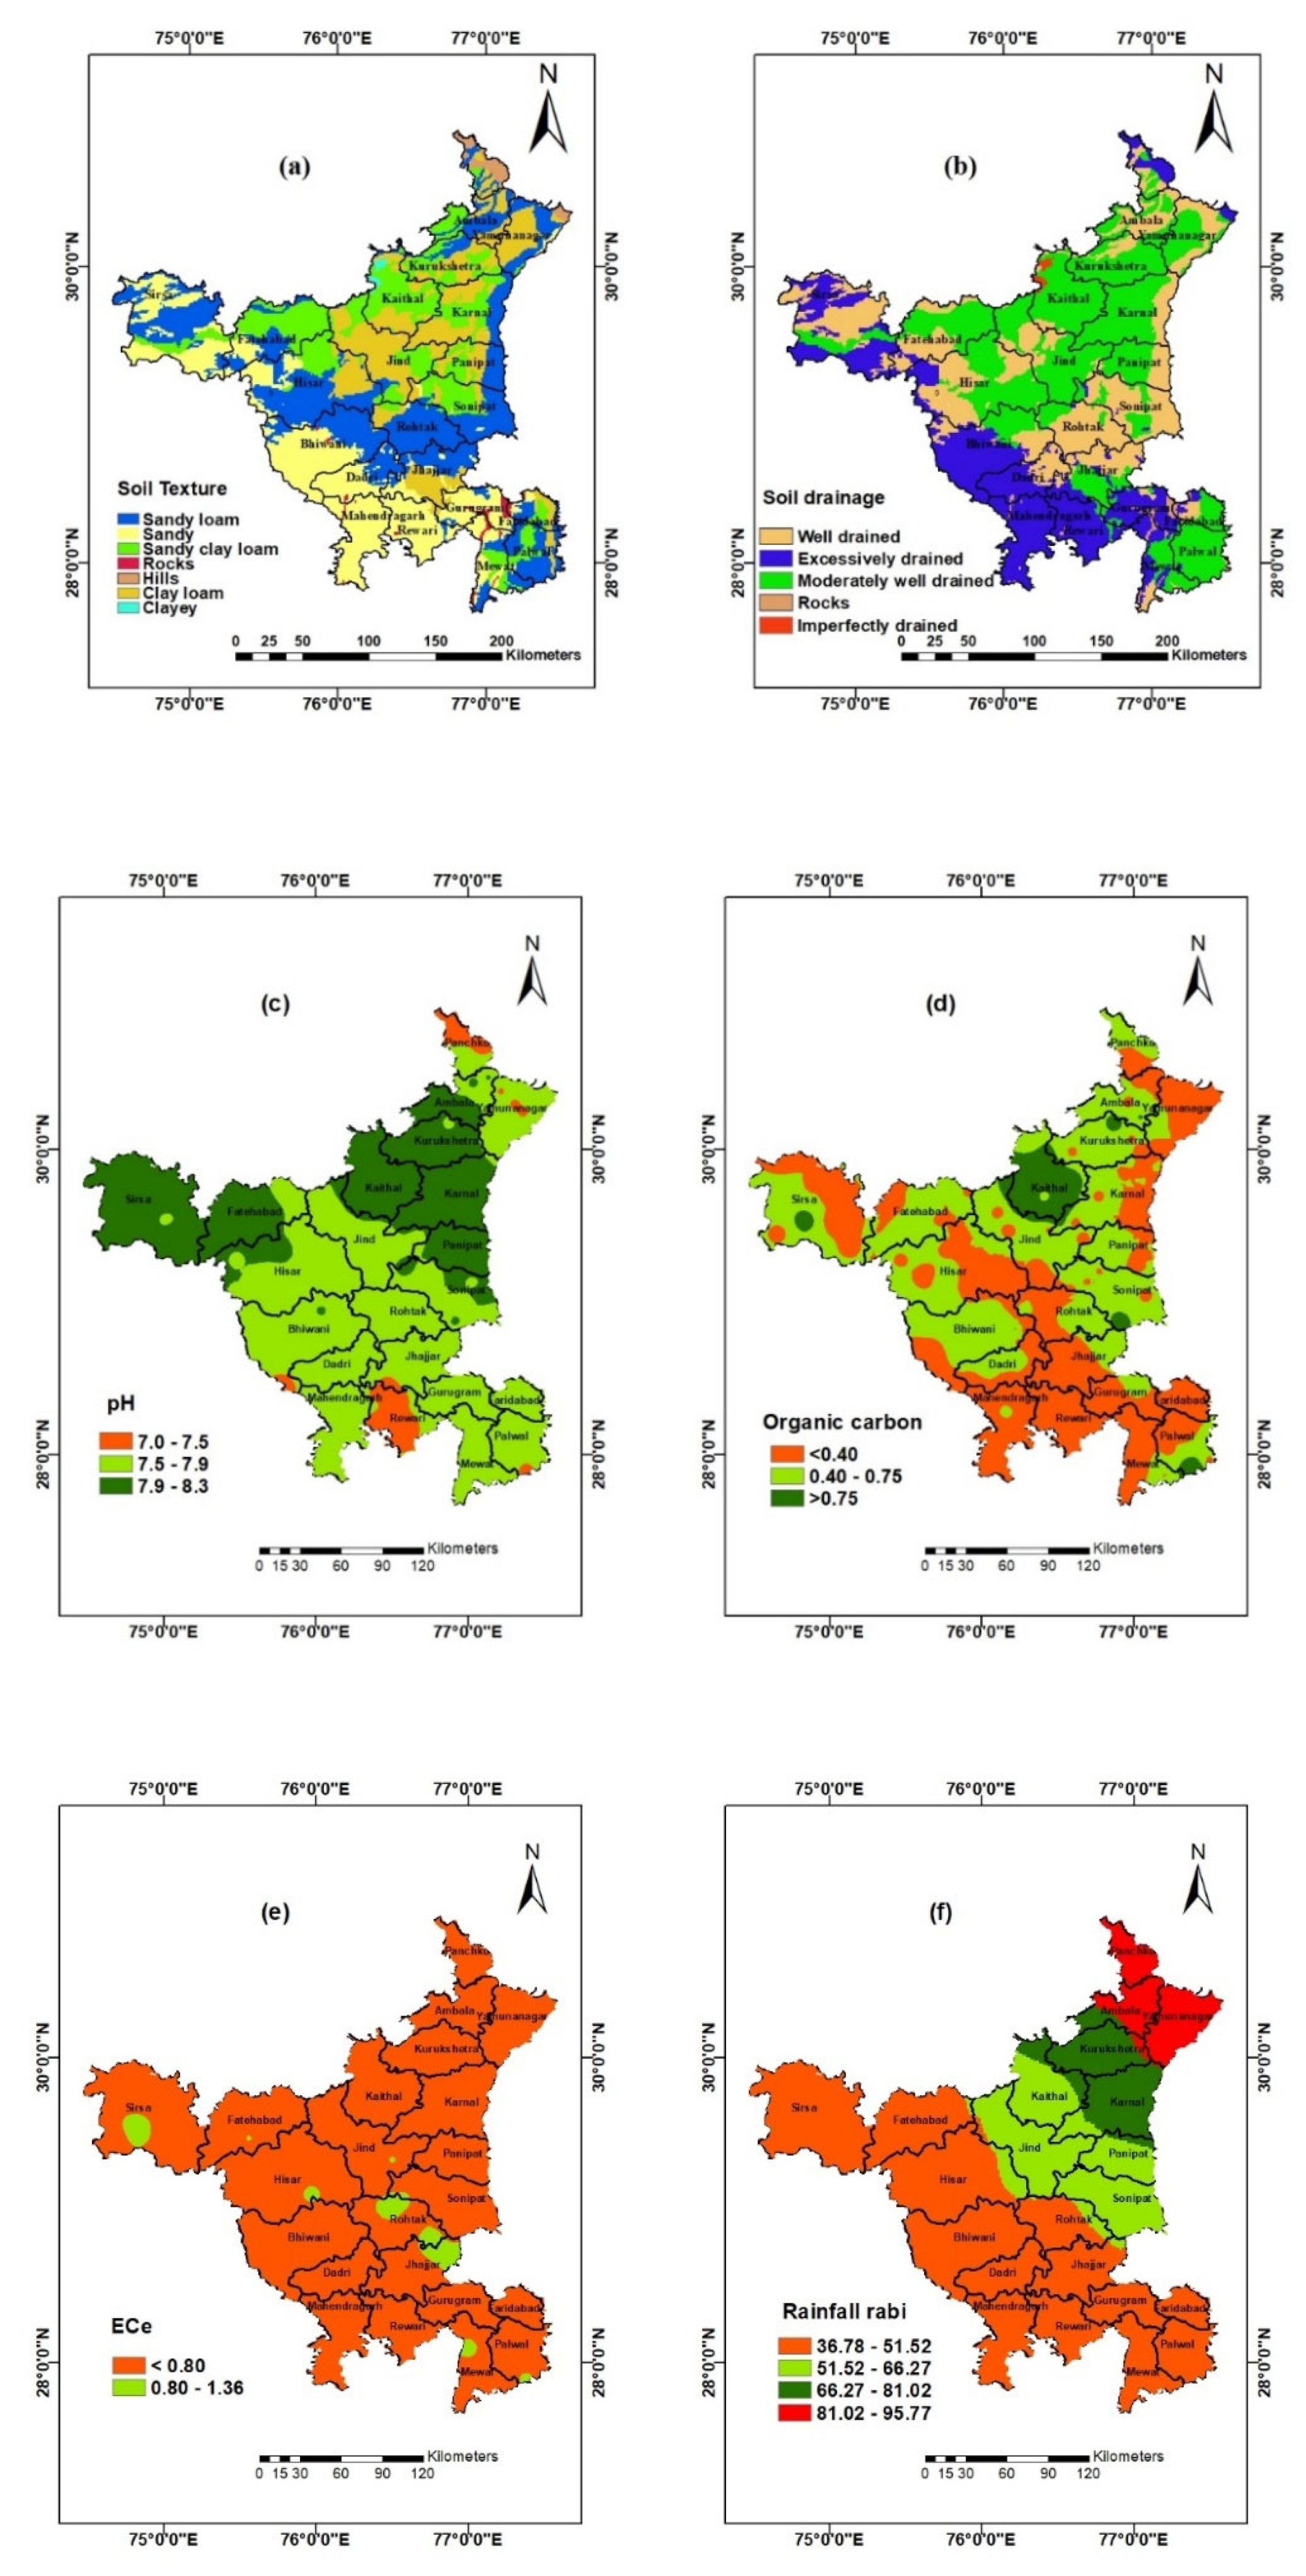
Wheat is a vital winter season cereal, which contributes nearly 32% to India’s total foodgrain production. For its growth, fertile, well-drained, loam to clay loam and sandy clay loam soils are considered the best, whereas sandy or poorly drained soils are unsuitable [50]. As per our study for wheat cultivation in Haryana, temperature was the most important factor, followed by OC, rainfall, pH, ECe, drainage density and texture; while slope was the least important, according to experts’ opinions (
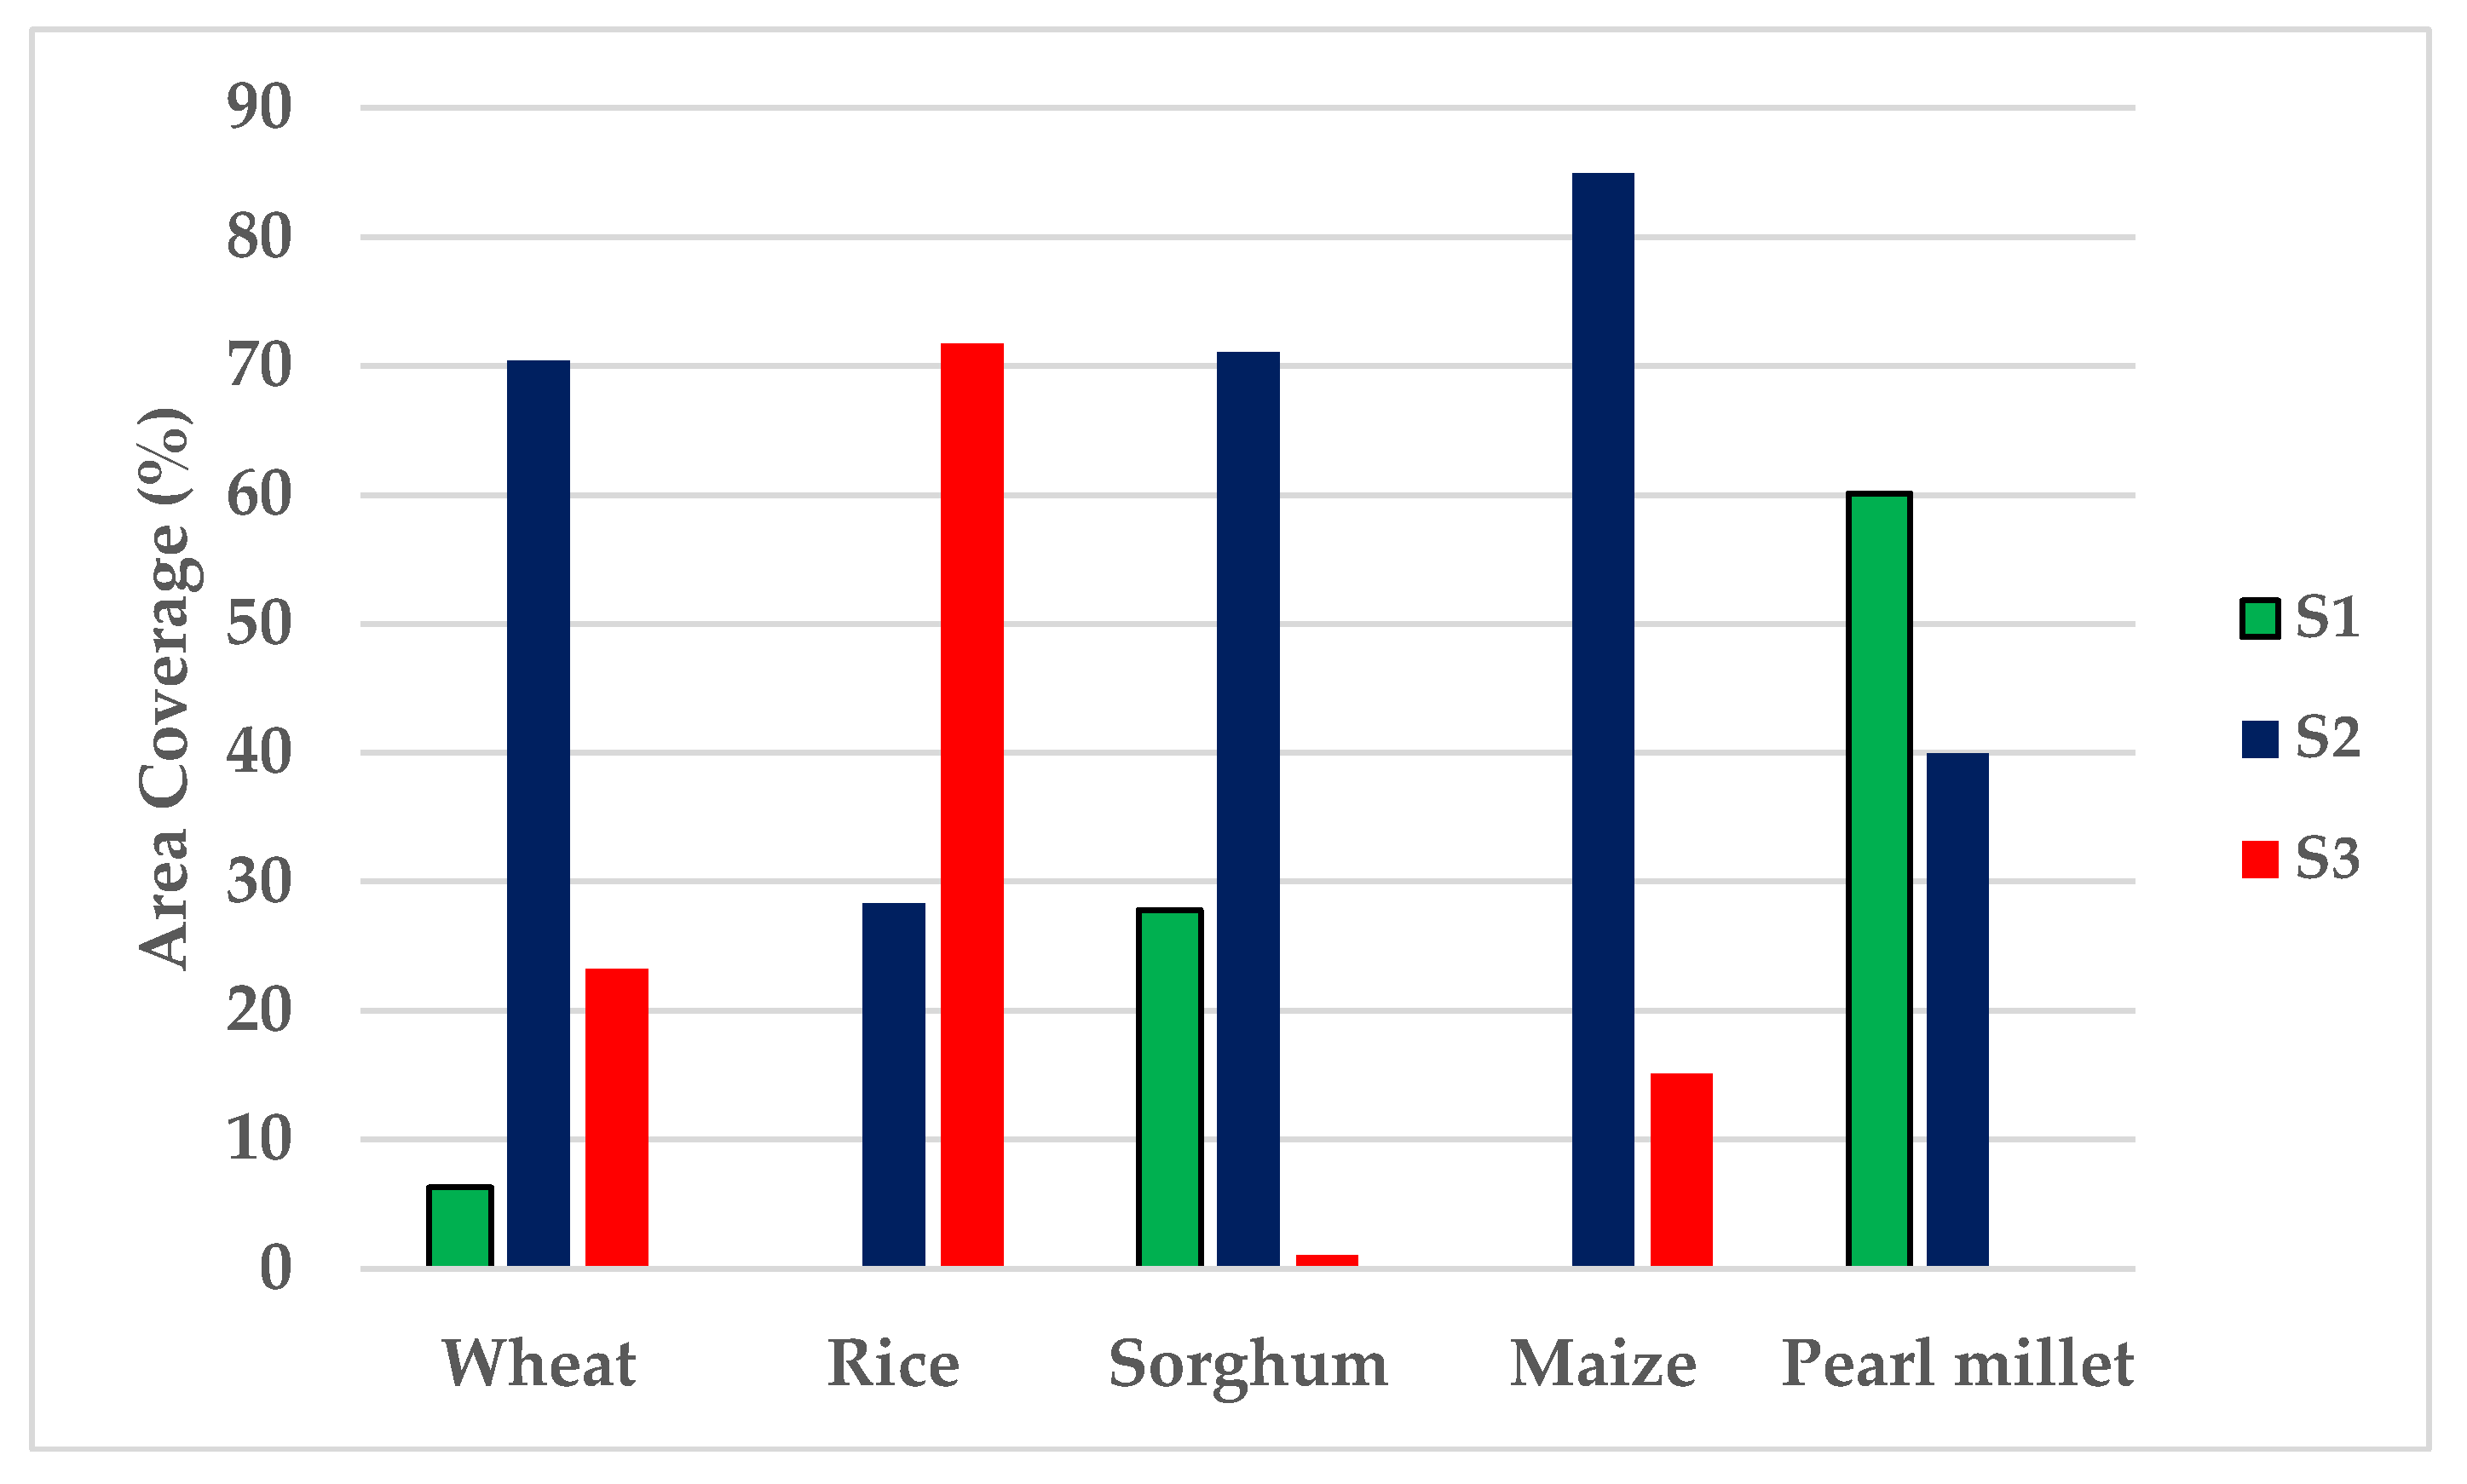
Table 4). The suitability assessment for wheat showed that 71% of the calculated arable land was moderately suitable, and only 6% area was highly suitable (Figure 5, 
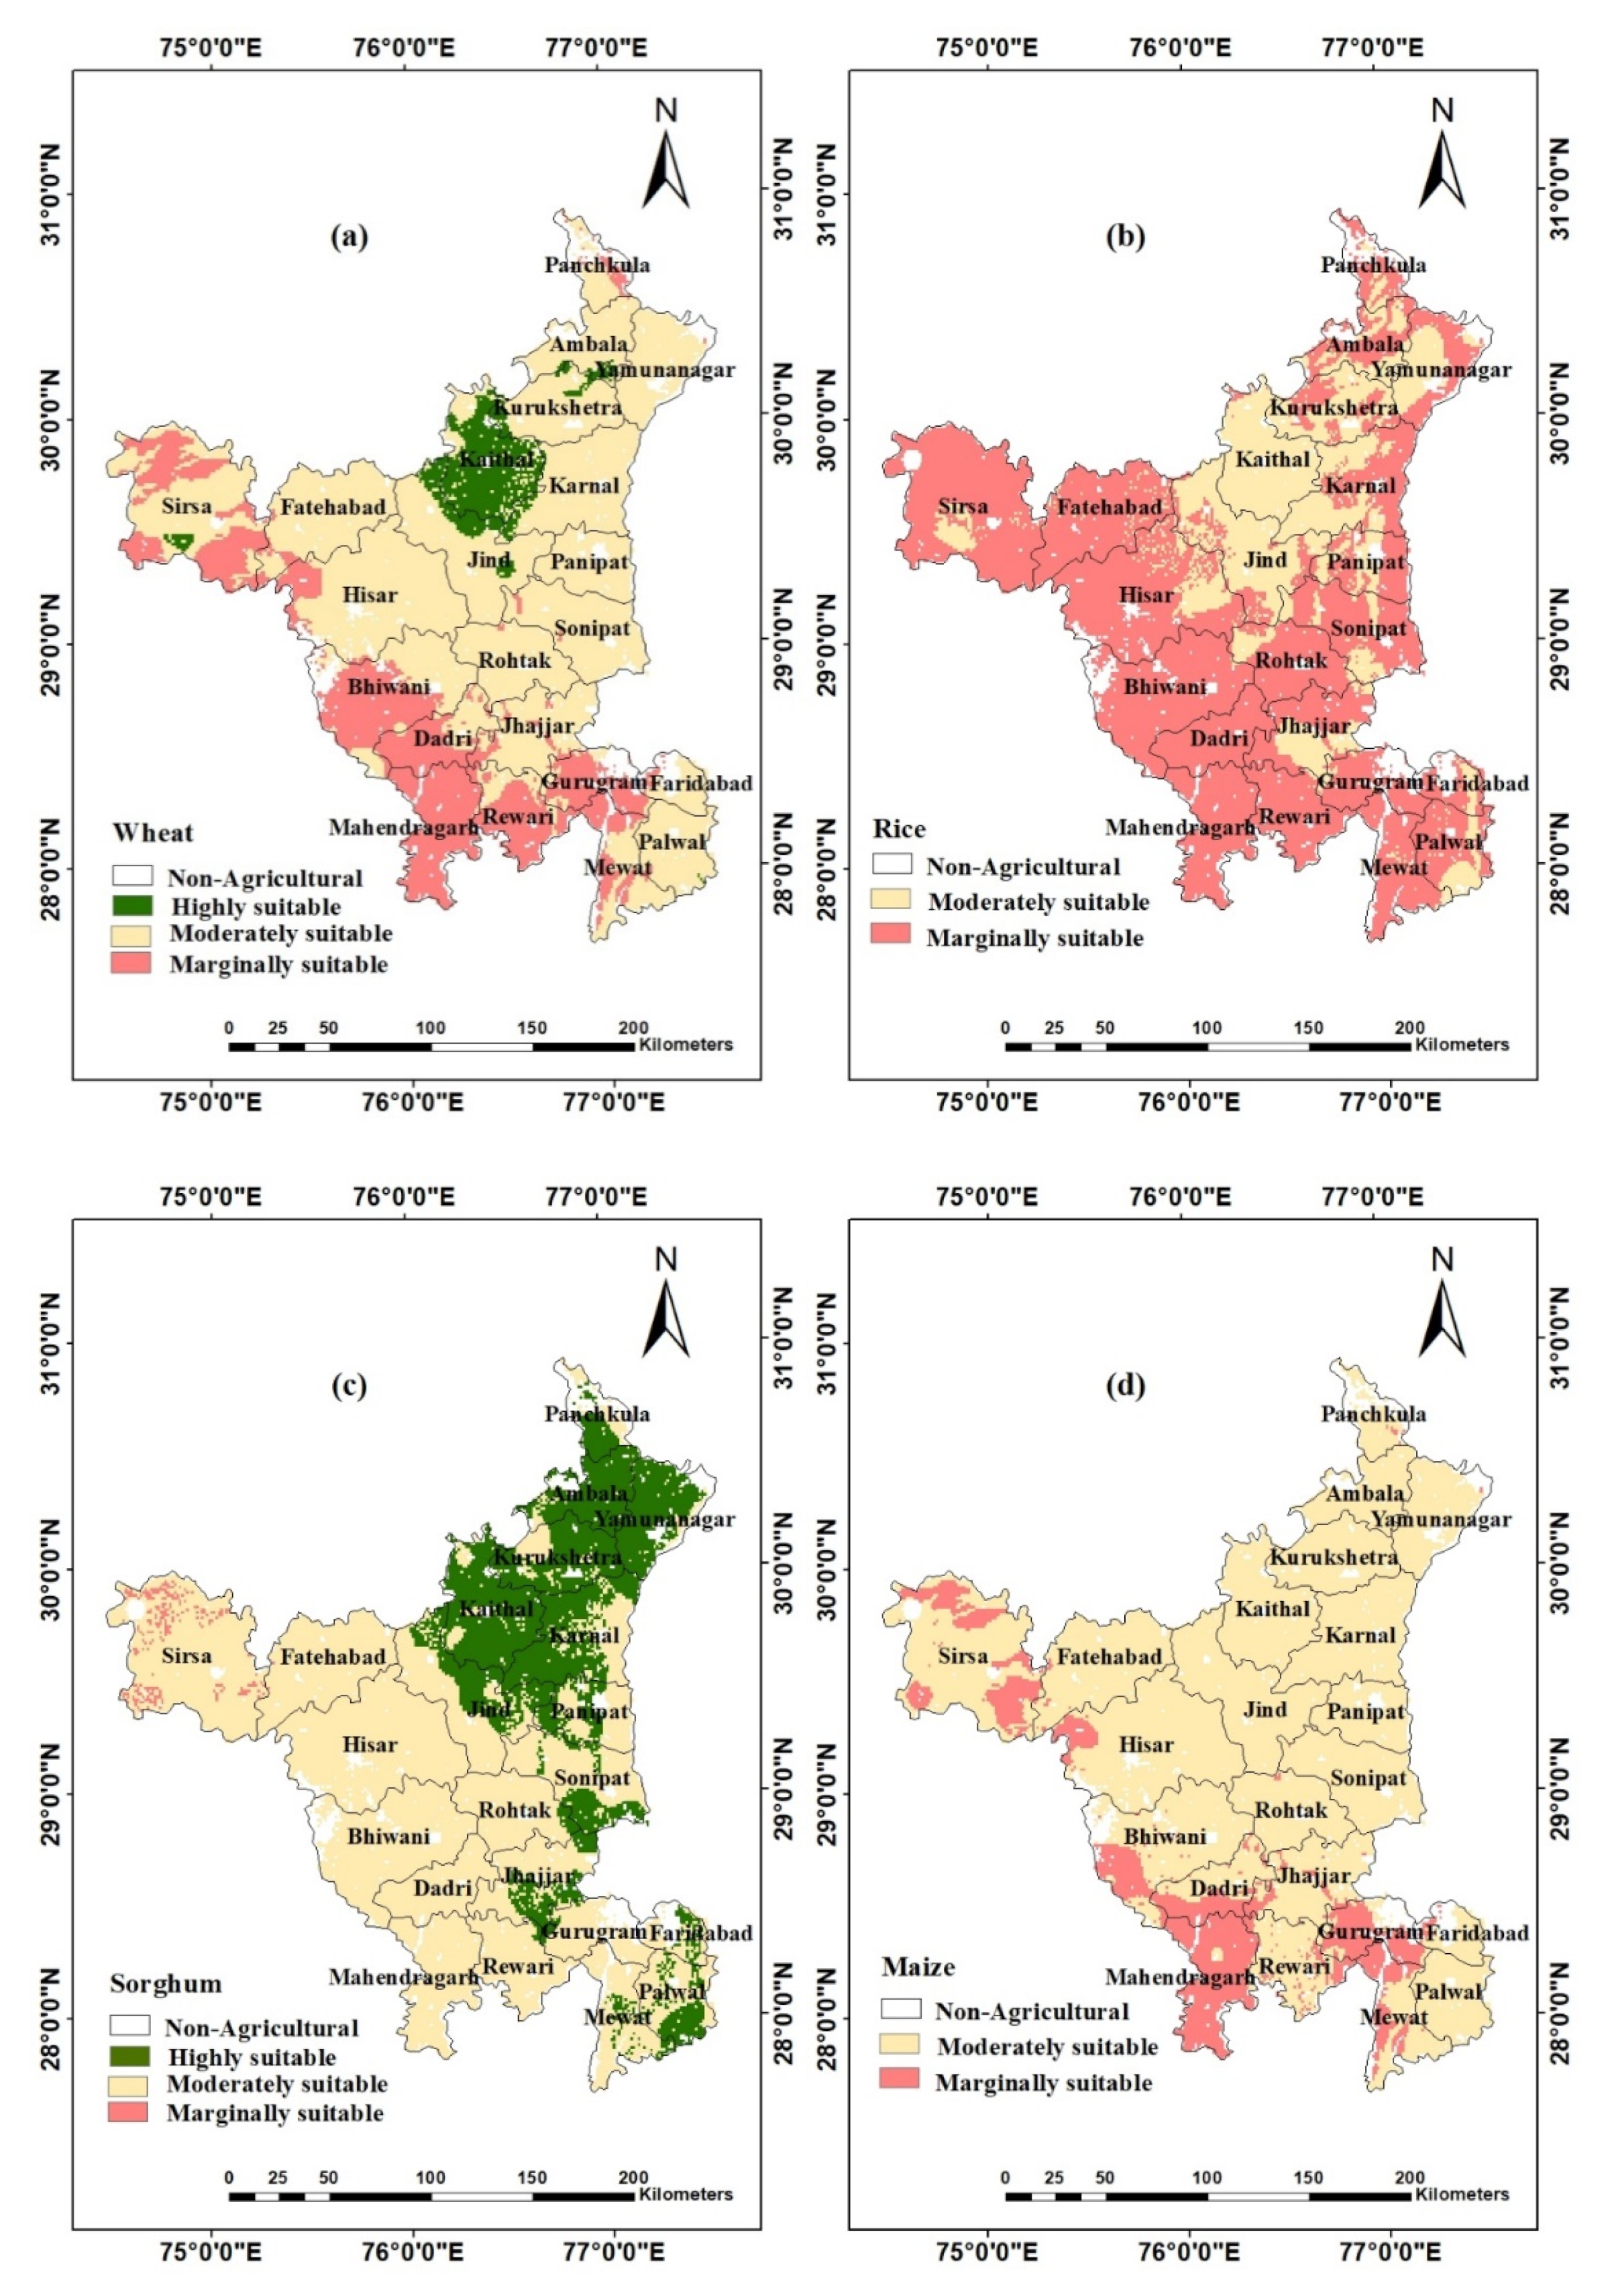
Table 10). Most of the districts were found to be moderately suitable due to moderate limitations such as OC (0.4–0.75) and pH (7.5–8.3). Land was found to be highly suitable in the Kaithal district, due to the most favorable temperature, organic carbon (>0.75%) and soil texture. Marginally suitable constitutes only 23% of the arable land, found mainly in Bhiwani, Dadri, Mahendragarh, Rewari, Gurugram and some parts of Sirsa and Mewat (Figure 6a). The primary constraints for marginal suitable areas are sandy soil (excessively drained) with a low availability of OC and inadequate rainfall to meet the high crop-water demand for wheat [51]. Based on these findings, it can be suggested that economic levels of food production could be attained by growing the wheat crop in highly (S1) and moderately (S2) suitable regions, and diversification of marginally (S3) suitable regions with other crops and cropping system.
Rice is mainly a tropical and subtropical crop, which can be cultivated in variety of climate–soil–hydrological regimes. The typical temperature needed throughout the life span of the crop ranges from 21 to 35 °C and a total optimum water requirement is 1110–1250 mm. The most suitable soil is heavy soil (clay or clay loam and loam soils) with a broad pH range of soil (4.5 to 8.0) [43]. For the rice crop, the most critical variable was found to be rainfall, followed by OC, texture, ECe, pH, drainage, and temperature, while slope was the least important, according to the experts’ judgment (Table 5). Figure 6b illustrated that a large fraction of the state was observed to be marginally fit for rice cultivation, which covered 72% of the total arable land, found mainly in the southwestern and some parts of the northeastern zone. Rainfall is the dominant limiting factor for rice cultivation, due to its vital importance in the high crop-water demand of rice, which was estimated at more than 1000 mm in Haryana [51]. Other limiting factors for rice cultivation are low organic carbon availability and pH (7.6 to 8.3). The moderately suitable area was 28% of the arable land, found mainly in Kaithal, Jind, Kurukshetra, Yamunanagar and some parts of Ambala, Panchkula, Jhajjar, Palwal, Sonipat, Panipat and Sirsa, as the rainfall in these regions is more as compared to marginally suitable areas. Thus, rice could be cultivated in the study region with supplementary irrigation only. From the foregoing discussions, it can be stated that the target area holds an extensive coverage of farm land, but the majority of the regions are marginally suitable for rice paddies and come under the S3 suitability class.
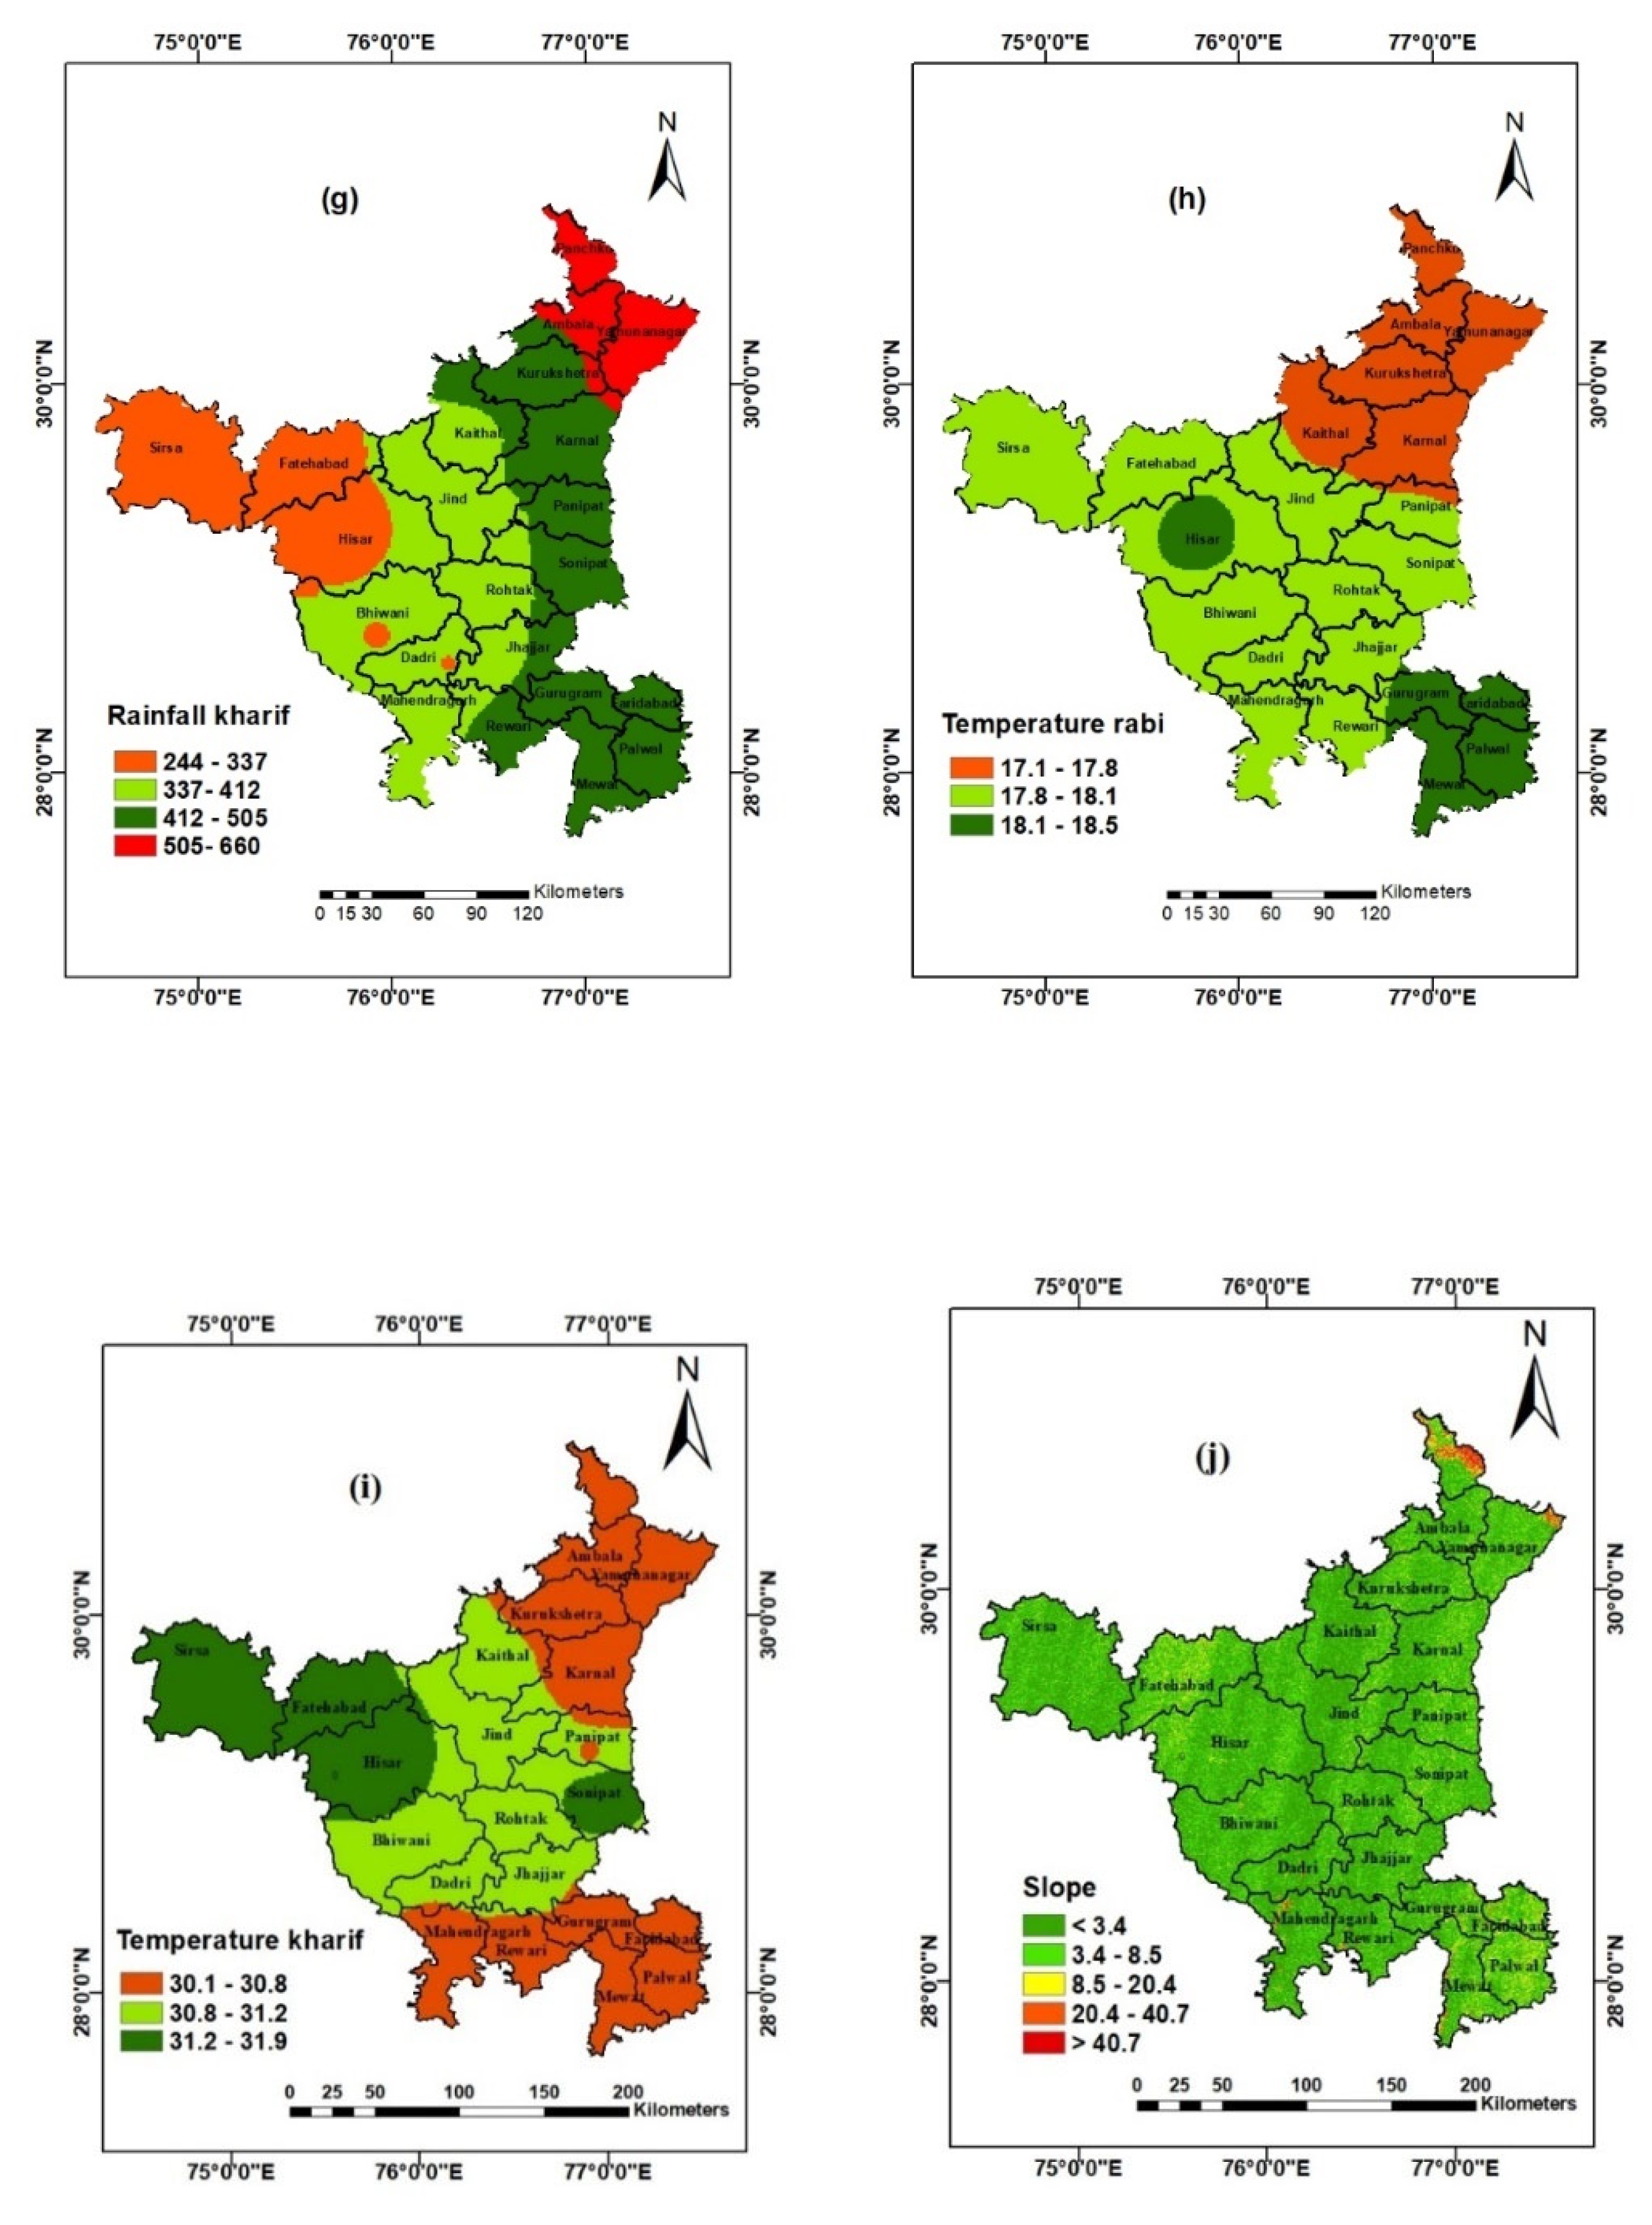
In the study area, sorghum is a kharif crop. The optimal temperature and rainfall suitability for its growth and development are 25–30 °C and 500–700 mm, respectively, and organic-matter enriched soils with a heavy texture and having pH 6.0–8.0 are the best fit for its cultivation [43]. OC was the most critical variable, while temperature was the least important variable for sorghum (Table 6). For this crop, it was observed that 28% of the arable land area was highly suitable and 71% was found to be moderately suitable (Figure 5, Table 10). The highly suitable areas were the Ambala, Kurukshetra, Karnal, Yamunanagar, Panchkula, and the some parts of Sonipat, Panipat, Jhajjar, Jind, Palwal and Mewat, districts (Figure 6c). These highly suitable areas are characterized by OC (0.5–0.75), rainfall (500–660), drainage density (well drained to moderately well drained) and pH (7.0–8.0).
Maize is a kharif season crop in Haryana that requires well-distributed rainfall of 500–750 mm, and a sandy loam to silt loam texture with good drainage for optimum growth [43]. Organic carbon was the most important factor for the maize crop, followed by rainfall, temperature, pH, texture, drainage density and ECe and slope (Table 7). Figure 5 showed that 85% of the arable land was moderately fit for raising maize, and only 15% of the area of the calculated arable land was observed to be the marginally suitable class (S3). The areas under the marginally suitable class were the Mahendragarh, Rewari and Bhiwani districts, due to the semi-arid and arid climate and slightly undulating topography owing to shifting small sand dunes [20]. Interestingly, the similar results of the crop of sorghum and maize were noted in an existing study on the nearby state of Uttar Pradesh [30].
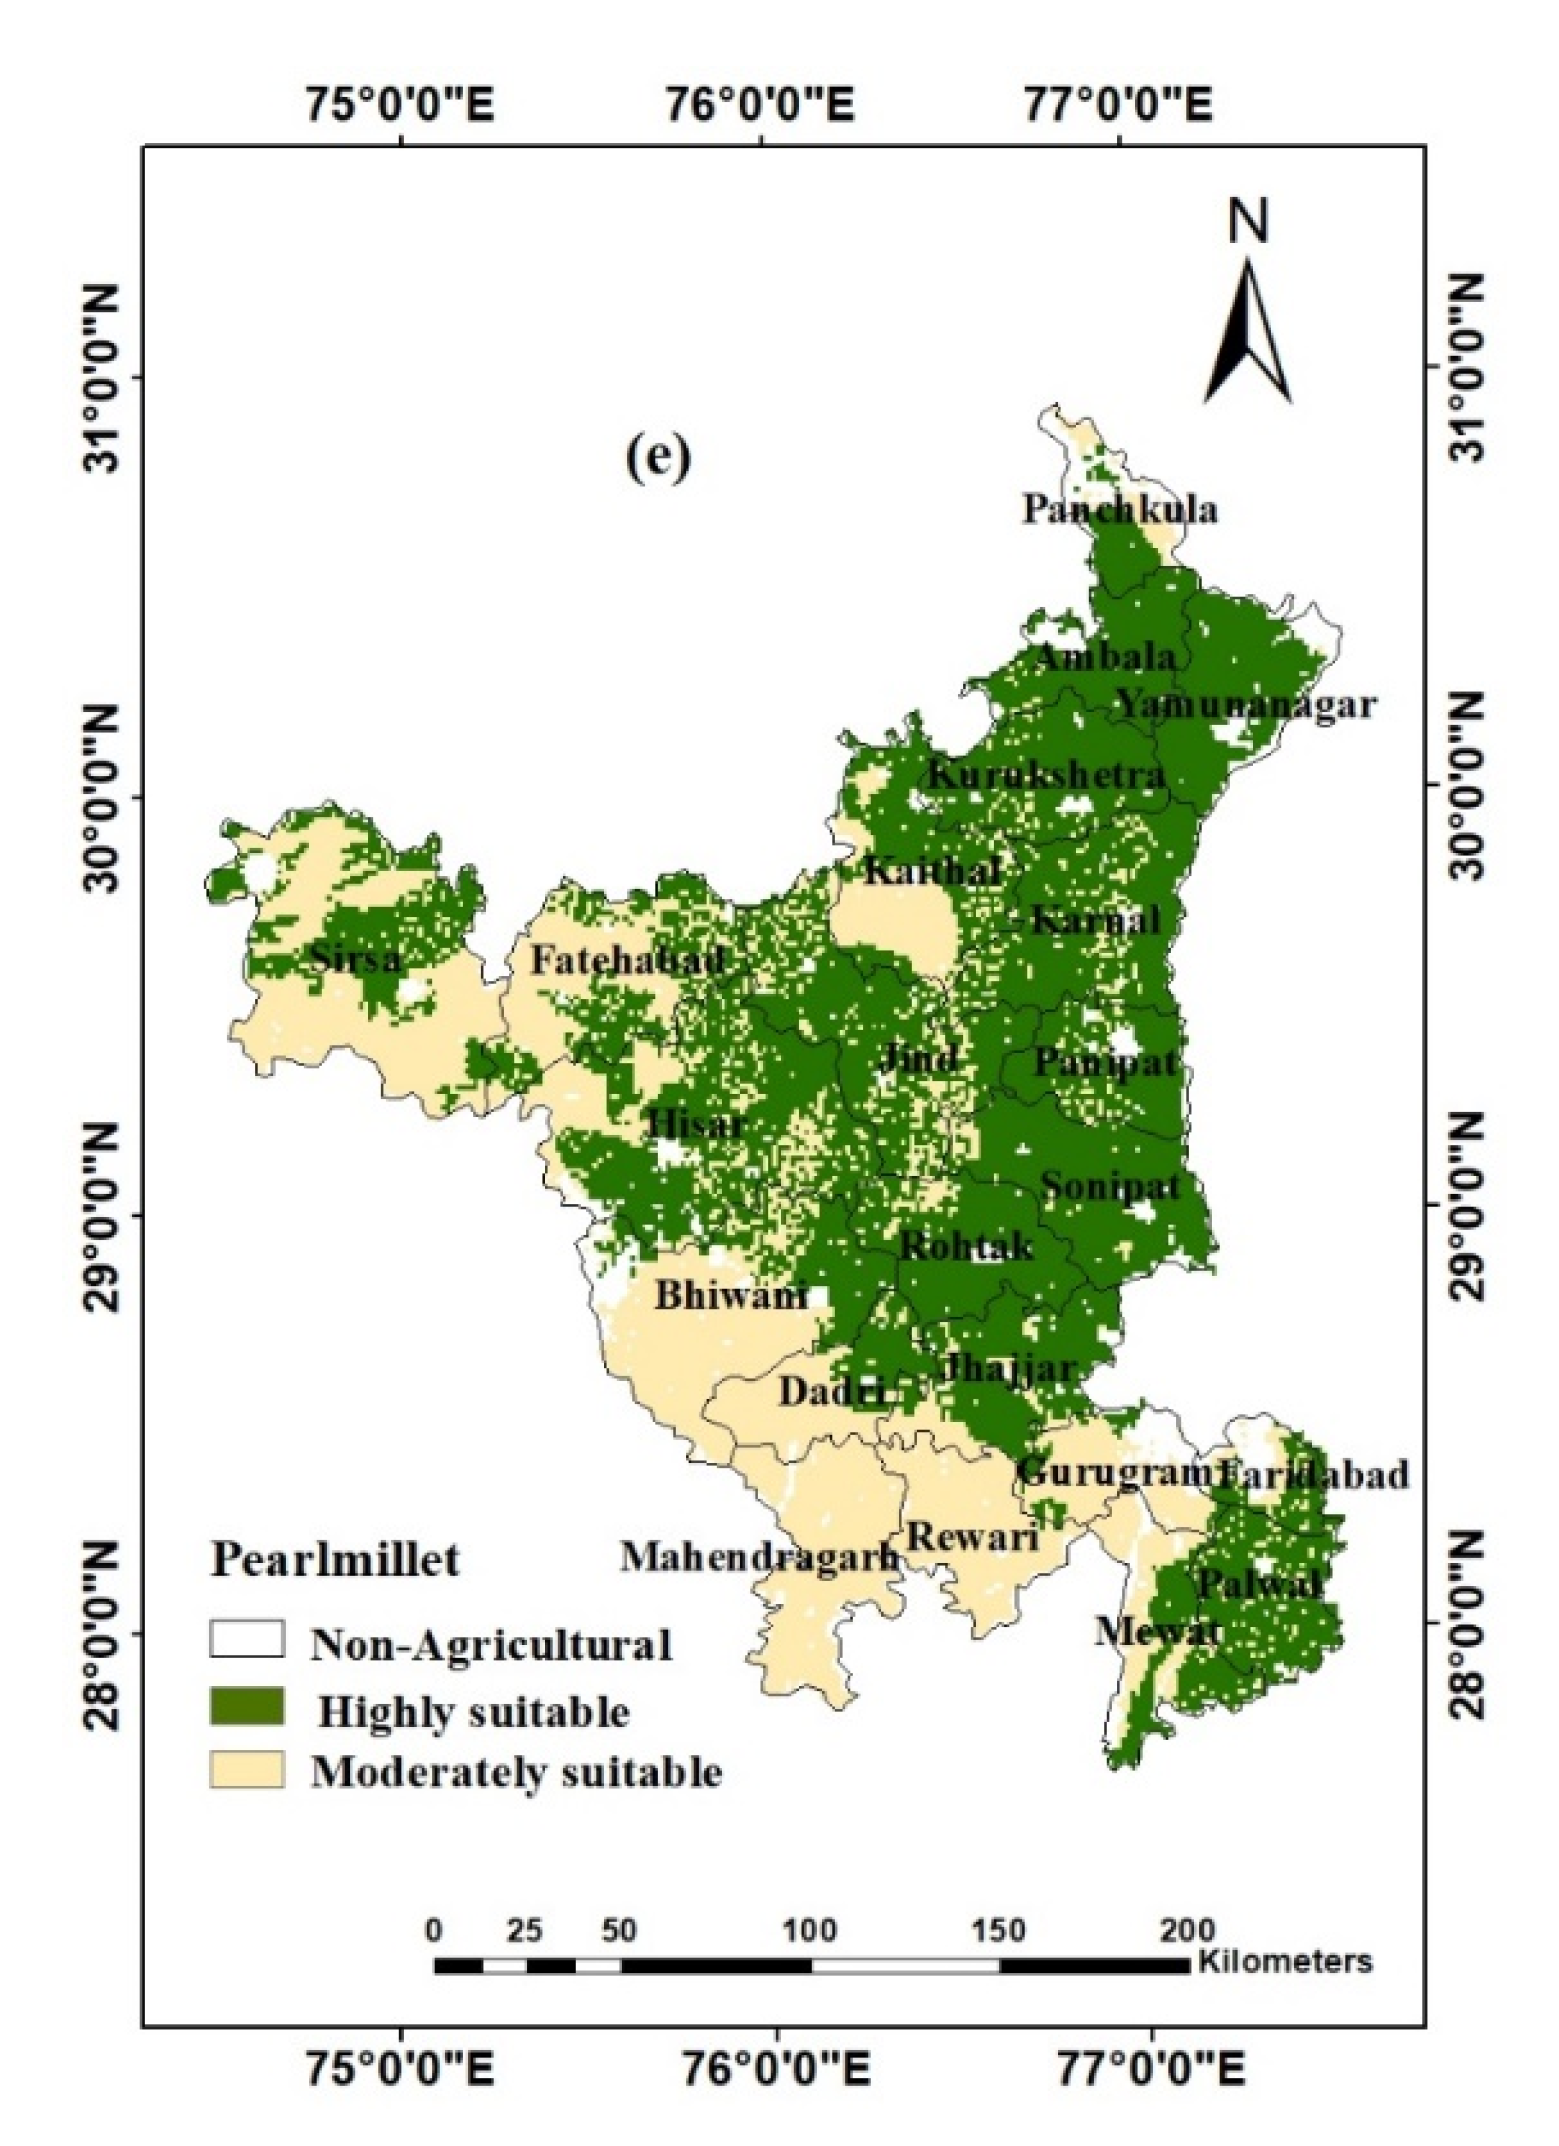
Pearl millet is considered as one of the best drought-tolerant crops, and is primarily grown in semi-arid and arid ecologies where average annual precipitation ranges between 400 and 650 mm. It can be grown in almost all types of soil, but the ideal soil is well-drained sandy loam to loam [43]. Similar to sorghum, OC was the most critical variable for pearl millet, while the temperature was the least important (Table 8). The finding indicated that 60 % of the area of the arable land was highly suitable because of prevailing conditions such as rainfall (400–660 mm), neutral pH, and salinity-free sandy loam to loamy soils with good drainage. Meanwhile, 40% of the area was observed under the moderately suitable class, which comprised of mainly the Mahendragarh, Rewari, Bhiwani, Dadri, and some parts of the Gurugram, Fatehabad and Sirsa, districts (Figure 6e).
Such findings play an important role in crop-suitability-policy designing, as from the above discussion it can be established that pearl millet had the maximum acreage under the highly suitable category, whereas maize, sorghum and wheat had the highest area under the moderately suitable category as farmlands in the class had fewer constraints. Meanwhile, rice constitutes most of the area under the marginally suitable category with major limitations. Introducing more area dedicated to maize, peal millet and sorghum crops into regions could increase the crop choices available during the kharif season. Therefore, the study suggests that rice should be replaced by other more suitable crops, such as maize, sorghum and pearl millet, with less water requirements than rice, which can help in the sustainable crop production of the land.

5. Conclusions

This study assessed the cropland suitability for rice, wheat, maize, sorghum and pearl millet crops utilizing the FAO framework, RS-GIS and MCDA technique. Soil, climate and topography factors were considered for this assessment. The present work indicated that the AHP methodology is an efficient multi-criterion technique to define the weights of multiple parameters logically. GIS assisted in analyzing geographical information, map processing and weighted raster’s incorporation in defining the land suitability map for different crops. The integrated approach of GIS and AHP could deliver a premium database and guide map for decision-makers assessing cropland substitution to acquire adequate agrarian production. The presented analysis reveals that the target zone has substantial potential for endurable cereal-crop production. Therefore, improved food production can be attained by growing the crop in highly and moderately fit regions; and diversifying marginally fit regions to crops other than that for which it is unsuitable. It is believed that the presented maps will deliver better knowledge to the agriculturalists, to pick their cropping patterns according to the high, moderate, low, and unsuitable regions. The mapping exercise identifies land units with suitable crops and suggests alternative practices where the current land use is sub-optimal. The analysis results indicate that the pearl millet and sorghum are the most suitable crops for the Haryana state, maize and wheat are moderately suitable crops for the target region; whereas, rice is found to be the least suitable for the region. These results can be used for areas having similar soil and climatic conditions for future crop planning and decision making in cereal production. In the future, we offer to consider more parameters such as socio-economic situations, irrigation structures, and infrastructure that affect the endurable use of land. Additionally, the changing climate can considerably affect agrarian productivity in India and the current target area. Considering this, forthcoming studies must include the effect of climate change on major crops.

Author Contributions

Conceptualization, S., R.P.S.,Y.S.S. and R.J.; Data curation, S., S.G.(Samarth Godara) and S.G.(Shweta Gautam); Formal analysis, S., H.B., J.B., N.S. and R.S.B.; Investigation, S., R.P.S., R.J. and T.S.; Methodology, R.J., S., S.G.(Samarth Godara) and M.T.; Project administration, Y.S.S., S.B., R.J. and R.P.S.; Resources, R.J. and R.P.S.; Software, R.S.B., J.B., N.S., S., H.B. and M.T.; Supervision, R.J. and R.P.S.; Validation, R.S.B. and S.; Writing—original draft, S., H.B. and T.S.; Writing—review & editing, R.S.B., R.J., Y.S.S., J.B., N.S., S.B. and R.P.S. All authors have read and agreed to the published version of the manuscript.

Funding

This research received no external funding.

Institutional Review Board Statement

Not applicable.

Informed Consent Statement

Not applicable.

Data Availability Statement

Not applicable.

Acknowledgments

The authors are thankful to Guru Jambheshwar University of Science & Technology, Hisar and ICAR–Indian Agricultural Research Institute, New Delhi for providing necessary facilities during the conduct of the study and preparation of this manuscript.

Conflicts of Interest

The authors declare no conflict of interest.

References

  1. IPCC. Climate Change 2007: Impacts, Adaptation and Vulnerability; Contribution of Working Group II to the Fourth Assessment Report of the Intergovernmental Panel on Climate Change; Cambridge University Press: Cambridge, UK, 2007; pp. 273–313. [Google Scholar]
  2. Food and Agriculture Organization (FAO). Land Evaluation, Towards a Revised Framework; Land and Water Discussion Paper 6; Food and Agriculture Organization: Rome, Italy, 2007. [Google Scholar]
  3. Pan, G.; Pan, J. Research in crop land suitability analysis based on GIS. Comput. Comput. Technol. Agric. 2012, 365, 314–325. [Google Scholar]
  4. Sharma, R.; Kamble, S.S.; Gunasekaran, A. Big GIS analytics framework for agriculture supply chains: A literature review identifying the current trends and future perspectives. Comput. Electron. Agric. 2018, 155, 103–120. [Google Scholar] [CrossRef]
  5. Dhami, J.; Roy, S.; Nain, A.S.; Panwar, R. Suitability analysis of apple and pear using remote sensing and GIS in Uttarakhand. J. Agrometeorol. 2012, 14, 464–474. [Google Scholar]
  6. Mendas, A.; Delali, A. Integration of multi-criteria decision analysis in GIS to develop land suitability for agriculture: Application to durum wheat cultivation in the region of Mleta in Algeria. Comput. Electron. Agric. 2012, 83, 117–126. [Google Scholar] [CrossRef]
  7. Zolekar, R.B.; Bhagat, V.S. Multi-criteria land suitability analysis for agriculture in hilly zone: Remote sensing and GIS approach. Comput. Electron. Agric. 2015, 118, 300–321. [Google Scholar] [CrossRef]
  8. Rodcha, R.; Tripathi, N.K.; Shrestha, R.P. Comparison of Cash Crop Suitability Assessment Using Parametric, AHP, and FAHP Methods. Land 2019, 8, 79. [Google Scholar] [CrossRef] [Green Version]
  9. Zhang, J.; Su, Y.; Wu, J.; Liang, H. GIS based land suitability assessment for tobacco production using AHP and fuzzy set in Shandong province of China. Comput. Electron. Agric. 2015, 114, 202–221. [Google Scholar] [CrossRef]
  10. Yalew, S.G.; Griensven, A.V.; Zaag, P.V.D. AgriSuit: A web-based GIS-MCDA framework for agricultural land suitability assessment. Comput. Electron. Agric. 2016, 128, 1–8. [Google Scholar] [CrossRef]
  11. Ranjan, R.; Nain, A.S.; Jha, A. Assessment of land suitability potentials of Willow for enhancing green cover under wastelands of Haryana using geospatial technology. J. Agrometeorol. 2018, 20, 44–48. [Google Scholar]
  12. Jain, R.; Chand, P.; Rao, S.C.; Agarwal, P. Crop and soil suitability analysis using multi-criteria decision making in drought-prone semi-arid tropics in India. J. Soil Water Conserv. 2020, 19, 271–283. [Google Scholar] [CrossRef]
  13. Chavez, M.D.; Berentsen, P.; Lansink, A.O. Assessment of criteria and farming activities for tobacco diversification using the Analytical Hierarchical Process (AHP) technique. Agric. Syst. 2012, 111, 53–62. [Google Scholar] [CrossRef]
  14. Akinci, H.; Ozalp, A.Y.; Turgut, B. Agricultural land suitability analysis using GIS and AHP technique. Comput. Electron. Agric. 2013, 97, 71–82. [Google Scholar] [CrossRef]
  15. Houshyar, E.; SheikhDavoodi, M.J.; Almassi, M.; Bahrami, H.; Azadi, H.; Omidi, M.; Sayyad, G.; Witlox, F. Silage corn production in conventional and conservation tillage systems. Part I: Sustainability analysis using combination of GIS/AHP and multi-fuzzy modeling. Ecol. Indic. 2014, 39, 102–114. [Google Scholar] [CrossRef]
  16. Romano, G.; Sasso, D.P.; Liuzzi, T.G.; Gentile, F. Multi-criteria decision analysis for land suitability mapping in a rural area of Southern Italy. Land Use Policy 2015, 48, 131–143. [Google Scholar] [CrossRef]
  17. Chivasa, W.; Mutangab, O.; Biradar, C.M. Mapping land suitability for maize (Zea mays L.) production using GIS and AHP technique in Zimbabwe. S. Afr. J. Geomat. 2019, 8, 265–281. [Google Scholar]
  18. Ramamurthy, V.; Reddy, G.P.O.; Kumar, N. Assessment of land suitability for maize (Zea mays L.) in semi-arid ecosystem of southern India using integrated AHP and GIS approach. Comput. Electron. Agric. 2020, 179, 105806. [Google Scholar] [CrossRef]
  19. Kihoro, J.; Bosco, N.J.; Murage, H. Suitability analysis for rice growing sites using a multi-criteria evaluation and GIS approach in great Mwearegion, Kenya. SpringerPlus 2013, 2, 265. [Google Scholar] [CrossRef] [Green Version]
  20. Ohlan, R. Performance and Suitability of Growing Crops in Haryana: District-Level Analysis. SSRN Electron. J. 2012, 59, 27–32. [Google Scholar] [CrossRef]
  21. Praveen, A.; Singh, R.; Niwas, R.; Kumar, A.; Khichar, M.L.; Kumar, M. Climatic Suitability of the Distribution of the Rice Cultivation Zone in Haryana, India. Environ. Ecol. 2017, 35, 3040–3045. [Google Scholar]
  22. Mehra, G.; Rajeshwari. Crop land suitability and sustainability of agriculture in Mahendragarh district, Haryana. Ann. Nagi 2018, 38, 281–300. [Google Scholar] [CrossRef]
  23. Kumar, A.; Singh, D.; Mahapatra, S.K. Current and Potential Soil Suitability of Pearl Millet, Wheat and Mustard for Sustainable Production in Aravalli Foothills of Mewat Region of Haryana, India. Int. J. Curr. Microbiol. Appl. Sci. 2020, 9, 3566–3583. [Google Scholar] [CrossRef]
  24. Mustafa, A.A.; Singh, M.; Sahoo, R.N.; Ahmed, N.; Khanna, M.; Sarangi, A.; Mishra, A.K. Land suitability analysis for diferent crops: A multi criteria decision making approach using remote sensing and GIS. Researcher 2011, 3, 61–84. [Google Scholar]
  25. Halder, J.C. Land Suitability Assessment for Crop Cultivation by Using Remote Sensing and GIS. J. Geogr. Geol. 2013, 5, 65–74. [Google Scholar] [CrossRef]
  26. Dengiz, O.; Ozyazici, M.A.; Saglam, M. Multi-criteria assessment and geostatistical approach for determination of rice growing suitability sites in Gokirmak catchment. Paddy Water Environ. 2013, 13, 1–10. [Google Scholar] [CrossRef]
  27. Chauhan, A.K.; Rani, J. Land Degradation and the Extent of Soil Degradation in Haryana. Int. J. Res. Anal. Rev. 2019, 6, 64–69. [Google Scholar]
  28. Elsheikh, R.; Shariff, A.R.B.M.; Amiri, F.; Ahmad, N.B.; Balasundram, S.K.; Soom, M.A.M. Agriculture Land Suitability Evaluator (ALSE): A decision and planning support tool for tropical and subtropical crops. Comput. Electron. Agric. 2013, 93, 98–110. [Google Scholar] [CrossRef] [Green Version]
  29. Raza, S.M.H.; Mahmood, A.S.; Khan, A.A.; Liesenberg, V. Delineation of Potential Sites for Rice Cultivation Through Multi-Criteria Evaluation (MCE) Using Remote Sensing and GIS. Int. J. Plant Prod. 2017, 12, 1–11. [Google Scholar] [CrossRef] [Green Version]
  30. Singh, P.; Upadhyay, R.K.; Bhatt, H.P.; Oza, M.P.; Vyas, S.P. Crop suitability analysis for cereal crops of Uttar Pradesh, India, The International Archives of the Photogrammetry, Remote Sensing and Spatial Information Sciences, Volume XLII-5. In Proceedings of the ISPRS TC V Mid-term Symposium “Geospatial Technology—Pixel to People”, Dehradun, India, 20–23 November 2018. [Google Scholar]
  31. Seyedmohammadi, J.; Sarmadian, F.; Jafarzadeh, A.A.; Ghorbani, M.A.; Shahbazi, F. Application of SAW, TOPSIS and fuzzy TOPSIS models in cultivation priority planning for maize, rapeseed and soybean crops. Geoderma 2018, 310, 178–190. [Google Scholar] [CrossRef]
  32. Peter, I. Determination of Soil-Crop Suitability for Enugu State using Geographic Information System (GIS) & Multi-Criteria Evaluation (MCE). Int. J. Eng. Res. Technol. 2020, 9, 274–281. [Google Scholar]
  33. Seif-Ennasr, M.; Bouchaou, L.; El Morjani, Z.E.A.; Hirich, A.; Beraaouz, E.H.; Choukr-Allah, R. GIS-Based Land Suitability and Crop Vulnerability Assessment under Climate Change in Chtouka Ait Baha, Morocco. Atmosphere 2020, 11, 1167. [Google Scholar] [CrossRef]
  34. Maddahi, Z.; Jalalian, A.; Zarkesh, M.M.K.; Honarjo, N. Land suitability analysis for rice cultivation using a GIS-based fuzzy multi-criteria decision making approach: Central part of Amol district, Iran. Soil Water Res. 2016, 12, 29–38. [Google Scholar] [CrossRef] [Green Version]
  35. Dadhich, G.; Patel, P.R. Agriculture land suitability evaluation for wheat cultivation using geomatics for Patan District, India, International Journal of Agricultural Resources. Gov. Ecol. 2017, 13, 91–108. [Google Scholar]
  36. Singha, C.; Swain, K.C. Land Suitability Assessment for Potato Crop using Analytic Hierarchy Process Technique and Geographic Information System. J. Agric. Eng. 2019, 5, 77–87. [Google Scholar]
  37. Mugiyo, H.; Chimonyo, V.G.P.; Sibanda, M.; Kunz, R.; Nhamo, L.; Masemola, C.R.; Dalin, C.; Modi, A.T.; Mabhaudhi, T. Multi-criteria suitability analysis for neglected and underutilised crop species in South Africa. PLoS ONE 2021, 16, e0244734. [Google Scholar] [CrossRef]
  38. Saaty, T.L. Decision Making with the Analytic Hierarchy Process. Int. J. Serv. Sci. 2008, 1, 83–98. [Google Scholar] [CrossRef] [Green Version]
  39. Rukhsana; Molla, S.H. Investigating the Suitability for Rice Cultivation Using Multi-Criteria Land Evaluation in the Sundarban Region of South 24 Parganas District, West Bengal, India. J. Indian Soc. Remote Sens. 2021, 50, 359–372. [Google Scholar] [CrossRef]
  40. Saaty, T.L. The Analytic Hierarchy Process: Planning, Priority Setting, Resource Allocation; McGraw-Hill International: New York, NY, USA, 1980. [Google Scholar]
  41. Chen, Y.; Yu, J.; Khan, S. Spatial sensitivity analysis of multi-criteria weights in GIS-based land suitability evaluation. Environ. Model. Softw. 2010, 25, 1582–1591. [Google Scholar] [CrossRef]
  42. Chang, C.W.; Wu, C.R.; Lin, G.T.; Lin, H.L. Evaluating digital video recorder using analytic hierarchy and analytic network processes. Inf. Sci. 2007, 177, 3383–3396. [Google Scholar] [CrossRef]
  43. Naidu, L.G.K.; Ramamurthy, V.; Challa, O.; Hegde, R.; Krishnan, P. Manual of Soil-Site Suitability Criteria for Major Crops; Published by National Bureau of Soil Survey and Land Use Planning 2006; ICAR: Nagpur, India, 2016.
  44. Hossen, B.; Yabar, H.; Mizunoya, T. Land Suitability Assessment for Pulse (Green Gram) Production through Remote Sensing, GIS and Multicriteria Analysis in the Coastal Region of Bangladesh. Sustainability 2021, 13, 12360. [Google Scholar] [CrossRef]
  45. Memarbashi, E.; Azadi, H.; Barati, A.A.; Mohajeri, F.; Passel, S.V.; Witlox, F. Land-Use Suitability in Northeast Iran: Application of AHP-GIS Hybrid Model. ISPRS Int. J. Geo-Inf. 2017, 6, 396. [Google Scholar] [CrossRef] [Green Version]
  46. Roy, J.; Saha, S. Assessment of land suitability for the paddy cultivation using analytical hierarchical process (AHP): A study on Hinglo river basin, Eastern India. Modeling Earth Syst. Environ. 2018, 4, 601–618. [Google Scholar] [CrossRef]
  47. Islam, M.M.; Ahamed, T.; Noguchi, R. Land Suitability and Insurance Premiums: A GIS-based Multicriteria Analysis Approach for Sustainable Rice Production. Sustainability 2018, 10, 1759. [Google Scholar] [CrossRef]
  48. Iliquin Trigoso, D.; Salas López, R.; Rojas Briceño, N.B.; Silva López, J.O.; Gómez Fernández, D.; Oliva, M.; Quiñones Huatangari, L.; Terrones Murga, R.E.; Barboza Castillo, E.; Barrena Gurbillón, M.Á. Land Suitability Analysis for Potato Crop in the Jucusbamba and Tincas Microwatersheds (Amazonas, NW Peru): AHP and RS–GIS Approach. Agronomy 2020, 10, 1898. [Google Scholar] [CrossRef]
  49. Thapa, D.M.; Shrivastav, C.P.; Shah, S.C.; Sah, K. Land suitability evaluation using gis for vegetable crops at Sharadanagar, Chitwan, Nepal. Trop. Agrobiodiversity 2020, 1, 42–46. [Google Scholar] [CrossRef]
  50. ICAR. Wheat in Handbook of Agriculture; Indian Council of Agricultural Research; Government of India: New Delhi, India, 1997; pp. 744–759.
  51. Shaloo; Bisht, H.; Sarangi, A.; Prajapati, V.K.; Mishra, A.K.; Singh, M. Water Requirement and its Trend for Rice and Wheat Crops in Haryana State, India. Int. J. Curr. Microbiol. Appl. Sci. 2021, 10, 203–209. [Google Scholar]
Figure 4. GIS logical model for suitability of wheat (Triticum aestivum).
Sustainability 14 05246 g004
Table 1. Acreage and % share of major crops of Haryana over different periods of time.
TE 1973TE 1993TE 2013TE 2020TE 1973TE 1993TE 2013TE 2020
CropsArea (‘000 Ha)Share in GCA (%)
Rice284668123214395.711.61922
Sorghum1971176439.44211
Pearl Millet88860355045617.910.48.57
Maize11331962.30.50.10.1
Wheat11921871251125092432.438.739
Source: estimated by authors.
Table 2. List of the data sets used in the present study.
Data/MapsDescriptionSource
Soil physical parameters Texture and drainage on 1:500,000 ScaleNational Bureau of Soil Survey and Land Use Planning (NBSS&LUP)
Soil chemical parameters pH, ECe, OCSoil health card (SHC) website https://www.soilhealth.dac.gov.in (accessed on 15 June 2019)
Climatic parameters Daily temperature and rainfall (from 1985 to 2017)India Meteorological Department (IMD) and Water Resources Information System (WRIS) website https://indiawris.gov.in (accessed on 15 June 2019)
Digital Elevation Model (DEM)SlopeBhuvan (http://bhuvan.nrsc.gov.in/ (accessed on 4 July 2019)
Cropland mapMODIS 500 m resolutionUSGS Earth Explorer
https://earthexplorer.usgs.gov/ (accessed on 4 July 2019)
Table 3. Preference scale between two parameters in AHP [38].
Relative ImportanceDefinitionDescription
1Equally importantTwo factors contributing uniformly to the predefined goal.
3Moderately important Experience and judgment are negligibly in favor of one as compared to the another.
5Strongly importantExperience and judgement strongly in favor of one in comparison to the other.
7Very strong importantExperience and judgments very strongly favor one over the another. Its necessity is revealed in practice.
9Extremely importantThe sign favoring one as compared to the other parameter is of the maximum possible validity.
2, 4, 6, 8IntermediateWhen compromise is needed
ReciprocalsLess importance
Sustainability 14 05246 i001
Table 5. Pairwise comparison matrix and weights of the parameters in AHP for rice crop.
CriteriaSlopeTemperatureRainfallpHOCECeDrainageTexture
Pairwise comparison matrix
Slope111/511/3111/3
Temperature111/511/31/311
Rainfall55131331
pH111/311/3131/3
OC33131311
ECe131/311/3113
Drainage111/31/31111
Texture311311/311
Column total16.0016.004.4013.335.3310.6712.008.66
Normalized pairwise comparison matrix
Slope0.060.060.050.080.060.090.080.04
Temperature0.060.060.050.080.060.030.080.12
Rainfall0.310.310.230.230.190.280.250.12
pH0.060.060.080.080.060.090.250.04
OC0.190.190.230.230.190.280.080.12
ECe0.060.190.080.080.060.090.080.35
Drainage0.060.060.080.030.190.090.080.12
Texture0.190.060.230.230.190.030.080.12
Normalized sum of rowsNormalized average rowsEigenvector
Eigenvector
Slope0.520.52/80.065
Temperature0.540.54/80.067
Rainfall1.911.91/80.239
pH0.720.71/80.090
OC1.491.49/80.187
ECe0.990.99/80.123
Drainage0.710.71/80.088
Texture1.121.12/80.140
λmax = 8.95, n = 8, CI (consistency index) = 0.136, RI (random index) = 1.41, CR = 0.096, ∑ = 1.
Table 6. Pairwise comparison matrix and weights of the parameters in AHP for sorghum crop.
CriteriaSlopeTemperatureRainfallpHOCECeDrainageTexture
Pairwise comparison matrix
Slope111/331/31/31/31
Temperature111/311/31/31/31
Rainfall3311/31113
pH1/31311/311/31
OC33131333
ECe33111/3111
Drainage33131/3111
Texture111/311/3111
Column total15.3316.008.0013.334.008.678.0012.00
Standardized pairwise comparison matrix
Slope0.070.060.040.230.080.040.040.08
Temperature0.070.060.040.080.080.040.040.08
Rainfall0.200.190.130.030.250.120.130.25
pH0.020.060.380.080.080.120.040.08
OC0.200.190.130.230.250.350.380.25
ECe0.200.190.130.080.080.120.130.08
Drainage0.200.190.130.230.080.120.130.08
Texture0.070.060.040.080.080.120.130.08
Normalized sum of rowsNormalized average rowsEigenvector
Eigenvector
Slope0.640.64/80.080
Temperature0.490.49/80.061
Rainfall1.271.27/80.159
pH0.860.86/80.107
OC1.951.95/80.244
ECe0.990.99/80.124
Drainage1.141.14/80.143
Texture0.650.65/80.081
λmax = 9.12, n = 8, CI (consistency index) = 0.160, RI (random index) = 1.41, CR = 0.1, ∑ = 1.
Table 7. Pairwise comparison matrix and weights of the parameters in AHP for maize crop.
CriteriaSlopeTemperatureRainfallpHOCECeDrainageTexture
Pairwise comparison matrix
Slope11/61/51/31/71/611/7
Temperature6112½221
Rainfall511½1322
pH3½21¼113
OC72141512
ECe6½1/311/5111
Drainage1½½11111
Texture711/21/31/2111
Column total36.006.676.5310.174.5914.1710.0011.14
Normalized pairwise comparison matrix
Slope0.030.030.030.030.030.010.100.01
Temperature0.170.150.150.200.110.140.200.09
Rainfall0.140.150.150.050.220.210.200.18
pH0.080.080.310.100.050.070.100.27
OC0.190.300.150.390.220.350.100.18
ECe0.170.080.050.100.040.070.100.09
Drainage0.030.080.080.100.220.070.100.09
Texture0.190.150.080.030.110.070.100.09
Normalized sum of rowsNormalized average rowsEigenvector
Eigenvector
Slope0.270.27/80.034
Temperature1.211.21/80.151
Rainfall1.301.30/80.163
pH1.061.06/80.132
OC1.891.89/80.236
ECe0.690.69/80.087
Drainage0.760.76/80.094
Texture0.820.82/80.103
λmax = 8.97, n = 8, CI (consistency index) = 0.139, RI (random index) = 1.41, CR = 0.099, ∑ = 1.
Table 8. Pairwise comparison matrix and weights of the parameters in AHP for pearl millet crop.
CriteriaSlopeTemperatureRainfallpHOCECeDrainageTexture
Pairwise comparison matrix
Slope111/331/31/31/31
Temperature111/311/31/31/31
Rainfall33111113
pH1/31111/311/31
OC33131333
ECe33111/3111
Drainage33131/3111
Texture111/311/3111
Column total15.3316.006.0014.004.008.678.0012
Normalized pairwise comparison matrix
Slope0.070.060.060.210.080.040.040.08
Temperature0.070.060.060.070.080.040.040.08
Rainfall0.200.190.170.070.250.120.130.25
pH0.020.060.170.070.080.120.040.08
OC0.200.190.170.210.250.350.380.25
ECe0.200.190.170.070.080.120.130.08
Drainage0.200.190.170.210.080.120.130.08
Texture0.070.060.060.070.080.120.130.08
Normalized sum of rowsNormalized average rowsEigenvector
Eigenvector
Slope0.640.64/80.081
Temperature0.500.50/80.063
Rainfall1.361.36/80.170
pH0.650.65/80.081
OC1.991.99/80.248
ECe1.031.03/80.129
Drainage1.171.17/80.146
Texture0.660.66/80.083
λmax = 8.64, n = 8, CI (consistency index) = 0.092, RI (random index) = 1.41, CR = 0.065, ∑ = 1.
Table 10. The distribution of crop-suitability classes with AHP and with equal weight in percentage of area (%).
WheatRiceSorghumMaizePearl Millet
Suitability ClassificationAHPEqual WeightsAHPEqual WeightsAHPEqual WeightsAHPEqual WeightsAHPEqual Weights
Highly
Suitable (S1)
6.314.990027.8531.5000.4160.1454.79
Moderately Suitable (S2)70.4285.4428.2947.2571.1668.3884.9696.9939.8645.21
Marginally Suitable (S3)23.279.5771.7152.750.990.1215.042.6000
Publisher’s Note: MDPI stays neutral with regard to jurisdictional claims in published maps and institutional affiliations.

